Abstract
The use of information technology in the field of cultural heritage makes it possible to involve more and more people in the promotion of cultural heritage, fostering social, cultural, economic and community growth. This work stems from the interest in using Virtual Reality (VR) in the field of cultural heritage, creating a tour of the city of Bari that tells its evolution over the years. To this end, a low-cost VR360 application has been developed which, by means of a cardboard, allows the user to experience a virtual journey through time. It tells the story of the city, focusing on its urban expansion and the evolution of its architectural styles, influenced by various dominations over the centuries, up to the current state. The virtual environment was created from spherical images of the city, captured through 360° cameras and enriched with various types of information content. The user experience was assessed by means of a questionnaire derived from previous work that was generalised and adapted to the considered scenario: the results showed a very good level of satisfaction, usability, engagement, immersion and sense of presence; the highest score was obtained for the visual quality of the images of the virtual environment.
1. Introduction
In recent years, information technologies have become more and more widespread in cultural tourism in the form of virtual reality applications offering increasingly engaging experiences that bring places closer together and make visitors an active part of their journey [1]. Virtual tours have become increasingly attractive due to their ability to provide immersive and personalised experiences to an increasingly wide and diverse audience. As an alternative to the more expensive virtual reality headsets, cardboards are becoming increasingly popular: they are low-cost devices equipped with lenses that allow a smartphone placed inside them to be transformed into a VR visor.
According to the definition adopted by the United Nations World Tourism Organisation (UNWTO), cultural tourism implies a type of tourism activity in which the visitor’s essential motivation is to learn, discover, experience and consume the cultural attractions/products, tangible and intangible, in a tourist destination. These attractions/products include art and architecture, historical and cultural heritage, culinary heritage, literature, music, creative industries and living cultures with their lifestyles, value systems, beliefs and traditions [2].
Daniel Guttentag [3] identifies six areas where the combination of cultural tourism and digital technologies is successful: planning and management, marketing, entertainment, education and learning, accessibility and heritage preservation. In this work, it was observed and analysed how the use of technologies defined as immersive, specifically virtual reality, is an excellent means of conveying tourism, in the preliminary choice of places to visit. A particular type of virtual reality application is based on 360° photos and videos: such applications also offer an immersive first-person experience but with a physical limitation that prevents moving in the surrounding space, allowing the user only to look around. Virtual tours originated from this technology in the field of cultural tourism. They are more effective than traditional methods of promoting tourism, based on the use of simple brochures, as they offer more direct and engaging experiences, capable of capturing the attention of future tourists. A direct visual experience is among the most efficient means to promote and disseminate a given place as it gives the user and future tourist the possibility to assess the whole spatiality of the place, unlike partial tours provided by simple catalogue photographs [4]. In addition, virtual tours provided cultural tourism with valuable alternatives, especially during the Covid-19 pandemic.
Virtual tours can provide experiences based on 360° high-definition and fully explorable images and videos, which may contain multimedia elements such as audio, text or three-dimensional models.
This paper presents a low cost virtual reality application based on cardboards and was developed to promote Bari, a city in the Apulia region of southern Italy. A virtual tour has been created in which the user can move around freely and discover how the city was born, how it has evolved up to the present day and what the causes of certain changes were. The virtual tour has been designed as a means of disseminating the city’s heritage to its citizens, especially to the younger generations, and as an inclusive tool, capable of making it possible to visit those places that are usually inaccessible, either because they are dangerous for the public or because they are logistically unreachable for people with mobility problems.
Furthermore, this paper attempts to generalise and adapt a user experience questionnaire previously designed for the evaluation of a 360° virtual tour of Dinghu Mountain (China) [5]: in particular, it attempts to make the questionnaire suitable for the evaluation of a VR360 application dealing with cultural heritage context in a town. The results showed that users were almost in agreement in expressing overall positive ratings on various factors of the user experience (general satisfaction, usability, engagement, immersion, visual quality and sense of presence).
The paper is structured as follows: Section 2 presents a brief survey on the state of the art; Section 3 introduces the case study that deals with the historical-artistic evolution of Bari and the main monuments of the city; Section 4 describes the conceptualization, design and development of the VR application and introduces the methodology adopted for user experience evaluation; Section 5 presents the results of user experience tests; Section 6 discusses the main findings of the experimental results; Section 7 proposes possible future developments and concludes the paper.
2. Related Work
Over the years, the development of low-cost, easy-to-use and easy-to-implement software and hardware tools has enabled the increasing popularity of virtual exploration. Pappa et al. [6] provides an in-depth review of digital technologies applied in the field of cultural heritage, in which they identify several new approaches for improved cultural heritage preservation in the back-office and dissemination in the front-end. The challenge is not only to communicate scientific information, but also to develop audience-centred experiences achieving narrative and emotional engagement. In [7], the authors show that the improvement of cultural heritage services focuses not only on technological aspects, but also on the interpretation and presentation of cultural heritage sites. Immersive on-site, online and onlife experiences were analysed, also addressing the changes in the use of cultural heritage due to the Covid-19 pandemic. To this end, a theoretical framework was established to analyze the effectiveness of OVRWCHT (online 360° virtual reality world cultural heritage tourism), during COVID-19, based on the seven principles of the ICOMOS Charter for the Interpretation and Presentation of Cultural Heritage Sites [8].
Several virtual and augmented reality applications developed in recent years for the promotion of cultural heritage provide various personalised tourist itineraries [9]. Usually, these digital environments exhibit a certain level of interactivity, such as allowing the user to choose a particular location within the place or changing the angle of view, looking around as if they were physically there [10]. Many of these applications exploit gamification [11] to improve the level of attention and engagement in learning processes. This has led to the emergence of the concept of edutainment [12,13], which derives from the combination of the words education and entertainment.
The study in [14] has proved how technology converts the traditional learning and museum visit can become an enjoyable platform of learning, increasing the motivation and making it easier to understand building structures and unique architectural details [10]. Moreover, virtual tours increase users’ desire to visit the real place [15] and improve the learning outcomes and knowledge retention [16], but, as evidenced in [17], a great result for site or destination managers is that virtual tours do not replace the experience of a real visit.
Cirulis et al. [18] described virtual and augmented reality enhancements for gamification scenarios aimed at the promotion of sustainability of the national identity through cultural heritage.
Checa et al. [19] proposed a framework for immersive applications based on Unreal engine that allows developers to focus on the design of the educational or training experience and frees them from the task of addressing virtual reality technical issues.
Hu et al. [20] presented a hybrid three-dimensional virtual museum based on panoramic images and three-dimensional models. The aim of the virtual museum is to help students and visitors to move freely in the virtual museum space and to generate a satisfying experience of cultural heritage enjoyment anytime, anywhere and from any device. The scene, consisting of a sequence of georeferenced panoramic images and three-dimensional models, was created in real time using Unity and a web service in the mobile Internet environment.
Nemtinov et al. [21] created a virtual museum of historical sites in the Tambov region associated with representatives of the Chicherin family, famous figures of the Russian diplomatic service. The museum is a collection of virtual three-dimensional reconstructions of objects from the family estate in the village of Karaul, as well as spherical panoramic images and videos taken in the Chicherin house-museum in Tambov.
In [22], a virtual companion guides the user through an exploration of the submerged archaeological sites, developed with a high degree of realism. This is complemented with a general and historical–cultural context, as well as with information regarding the flora and fauna of the underwater site.
Iacovino et al. [23] developed an application that allows Erasmus students to play the role of ambassadors for the promotion of the destination by providing tourists with a real immersive virtual reality experience.
An advantage offered by virtual tours is the overcoming of accessibility problems. They provide access to sites considered inhospitable or too far away and can be used as a tool to break down architectural barriers that prevent people with disabilities from accessing tourist sites. Skola et al. [22] developed a VR application of underwater archaeological sites for an audience not prepared for underwater diving. This application mixes the experience of interactive virtual reality with 360° narration, using an HTC Vive visor. In the HMD, the user experiences a real immersion session: when in the immediate vicinity of a point of interest, they can activate it with the controller to start playing a 360° video. De Paolis et al. [24] employed virtual and mixed reality technologies to address accessibility problems and promote an underground oil mill.
Virtual portals [25] enabled on-site exploration of a virtually reconstructed past reality of sites or monuments that the user can visualise on his/her smartphone by walking through portals placed at specific points of interest.
An interactive virtual tour of the historical centre of Rethymno (Greece) [26], was developed based on 360° videos using the Oculus Rift VR headset.
Fabola et al. [27] investigated the use of virtual reality (VR) as a tool for learning about heritage, specifically St Andrews Cathedral. First year pupils from a secondary school in the city of St Andrews took part in virtual tours of the Cathedral as it was in the 14th century using Samsung Gear VR, Google Cardboard, Oculus Rift, computer screens and Xbox controllers and then answered questions about their experiences with the various systems.
Nor Zalina Harun et al. [14] focused not on historical sites, but on construction, by conducting a 360° tour of a traditional Malaysian house dating back more than 100 years with the aim of preserving and protecting local architecture and cultural history.
Kang, Byoung-Gil, et al. [28] proposed a VR tourism experience on the UNESCO heritage site of Baekje using a simple and inexpensive Google Cardboard and the user’s smartphone.
Wu et al. [5] developed a 360° virtual tour of Dinghu Mountain (China) and designed a user experience evaluation questionnaire specifically for this type of application.
Cisternino et al. [29] demonstrated the use of augmented reality technologies for the promotion of the Basilica of Saint Catherine of Alexandria in Galatina.
3. Case Study and Historical Background
In a preliminary phase of the work, it was necessary to conduct an in-depth study aimed at identifying the most interesting and relevant monuments in order to understand the evolution of the city. The collection of data required an intensive bibliographic survey aimed at investigating the history of the monument, including the various foreign dominations that modified the urban layout. In particular, various Italian and local sources published in the form of books or websites were consulted [30,31,32,33,34,35,36].
The city of Bari has a long history stretching back thousands of years, characterised by the succession of numerous dominations which, with their culture, have influenced and left their mark on the conformation of the current city and the buildings it contains. Four historical macro-periods have been considered: ancient, Byzantine, modern and contemporary Bari. According to historical research, these are the most significant periods from a historical and artistic point of view.
An accurate study of the sources allowed to identify the monuments most involved in the historical events: this information was inserted and explained within the tour so that the user is guided within the virtual space and not left to a simple exploration around them.
Historical Background
Bari was founded on the eastern tip of the peninsula, still known as the San Pietro peninsula due to its natural acropolis shape. Here, and in the nearby complex of Santa Scolastica, evidence of the earliest settlement has been found: remains of a Bronze Age capannicolous village and continuity of settlement until around the 9th century B.C. From this period until the 7th century B.C.; however, there is an interruption in the evidence, probably due to the abandonment of the site at the time of the arrival of the Japigi, Illyrian peoples who incorporated and transformed the previous capannicolous settlements into more urbanised models. However, there are few traces of this historical period.
The Middle Ages were undoubtedly the richest period in terms of history and art, characterised by a succession of foreign dominations. With the arrival of the Byzantines, Bari was elevated to Catapanate, the highest expression and political representation of the Empire. The Catapano was in fact a high-ranking official who had jurisdiction over all the Byzantine possessions in the Italian peninsula and established his residence in a large fortified building on the site where the Basilica of San Nicola now stands. From this historical period, the tour covered the following monuments:
- The Cathedral of San Sabino, whose sub-body houses an early medieval basilica and a small Byzantine church;
- The Basilica of San Nicola was built with the arrival of the Saint’s relics in the city;
- The church of San Michele Arcangelo, which housed the relics before the Basilica was built;
- The Norman-Swabian castle, emblematic of the period of militarisation and hierarchisation of the lands at that time.
The city’s modern era is characterised by the Aragonese-Sforza lineage. With Isabella of Aragon and her daughter Bona Sforza, the Renaissance taste of the great Italian courts arrived in Bari. From this period, the virtual tour presents Piazza Mercantile and Piazza del Ferrarese, the meeting points of city life in the old town.
The contemporary era is mainly characterised by urban expansion outside the city and the construction of the New Town. From this period, the tour presents a portion of the waterfront and the two arteries of the new town: Corso Vittorio Emanuele and Corso Cavour.
4. Materials and Methods
4.1. Application Conceptualization
In the field of Cultural Heritage, virtual tours essentially play two roles: they are used as a museum ’product’ and as a means of promoting tourism. In the first case, the possibility of creating virtual museum tours allows the visitor to enjoy the museum offer even in places far away from the exhibition itself. In the second case, tours become tools for conveying tourism, supporting the prior choice of places to visit and explore. A direct visual experience, based on virtual tours, is among the most effective means to promote a place, as it provides the user with the possibility to assess its entire spatiality, as opposed to the partial view offered by simple catalogue photographs [4].
The sixteenth General Assembly of ICOMOS on 4 October 2008 published the Charter for the Interpretation and Presentation of Cultural Heritage Sites, which outlines the basic principles of interpretation and presentation as essential components of heritage conservation efforts [8]:
- 1.
- Access and understanding;
- 2.
- Information sources;
- 3.
- Attention to setting and context;
- 4.
- Preservation of authenticity;
- 5.
- Planning for sustainability;
- 6.
- Concern for inclusiveness;
- 7.
- Importance of research, training, and evaluation.
The application described in this paper seeks to satisfy the first five of the above-mentioned principles. By exploiting the practicality of cards, which are a low-cost and affordable tool for everyone, it aims to enable easy use and promote rapid understanding of the content. The panoramic photos allow for a reconstruction and enhancement of the environments of various zones of the city, highlighting the evolution of its architectural styles, influenced by the different dominations over the centuries, up to its current state. The use of virtual reconstruction makes it possible to reduce the pressure of cultural tourism in line with sustainable development objectives, by promoting site protection, education, and cultural services.
4.2. Application Design
In order to offer a virtual tour of the city with low-cost tools, it was decided to create a virtual reality application based on the use of a smartphone and a Google Cardboard. The aim is to create a tour that focuses on those architectural monuments involved in the historical events that have characterised the city over the course of time in order to reconstruct the history of the city and help to understand how it came to be as it is today. In order to add more interactivity and a distinctive feature compared to the virtual tours on the market, it was decided to add a gamification component, which consists of making the user guess which historical postcard, among those provided, is suitable for the place where the user is at that moment: this allows the user to understand, through a before/after comparison, the changes of the city over the years.
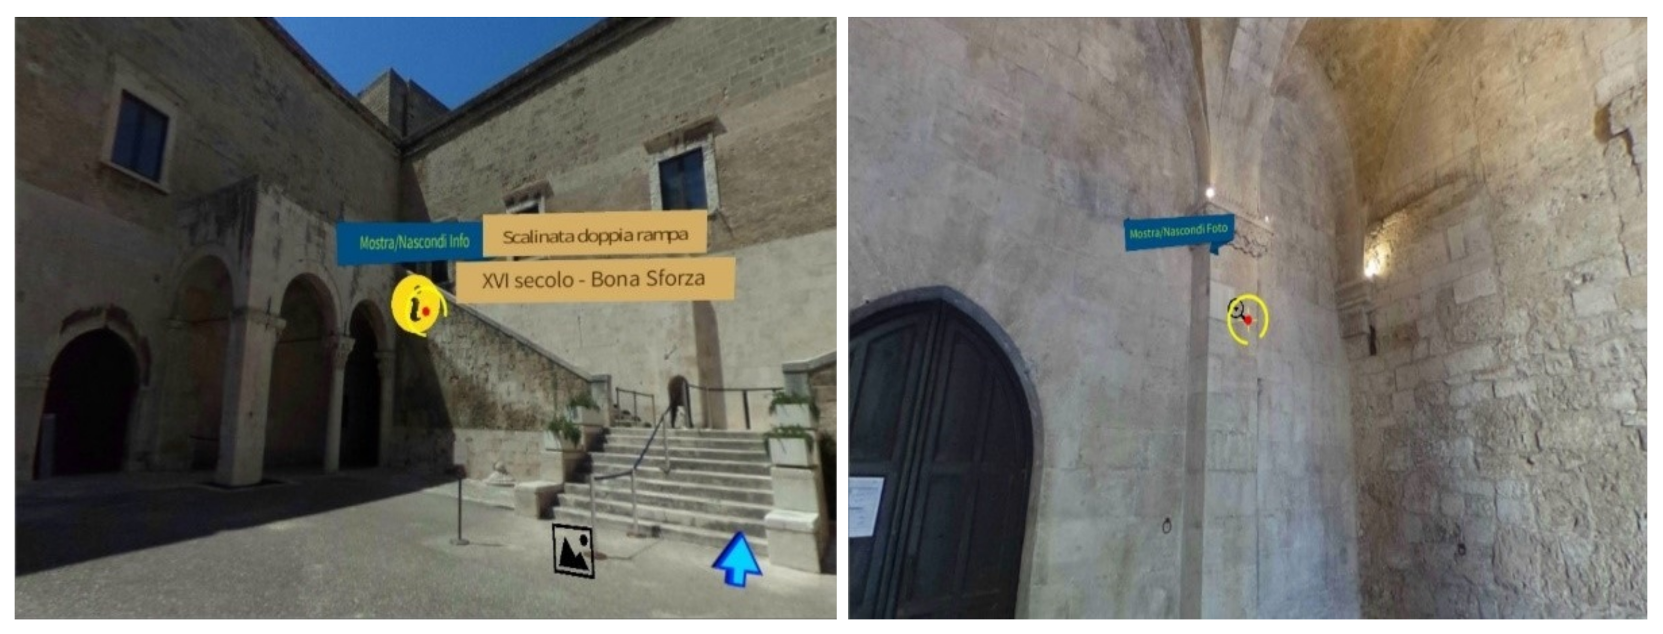
In the virtual tour, the user takes the role of a tourist around the city of Bari. Starting from the initial scene, he makes a choice between visiting the old town or the new town. Interactions have been made possible through a red pointer that appears in front of the user’s eyes: as soon as interaction with any object takes place, the pointer changes appearance, becoming a yellow crosshair with a circle indicating the loading of event data (Figure 1). In addition to looking around and admiring the surrounding landscape, the user can:

Figure 1.
Different types of interaction buttons.
- Move to another point, using arrows, and interact with the objects present; for example, he can obtain information on the monument by means of buttons with a yellow ‘i’ that stands for ’information’;
- Observe the details of some relevant points of the building by means of buttons with a magnifying glass icon, which allow you to zoom in;
- Watch additional videos or photos by means of special buttons.
A hidden menu has been added for further interaction, visible only when the user looks down. This choice is due to the presence of possible artefacts of 360° photography.
Four buttons have been included in the menu:
- Home, which allows you to go back to the previous scene;
- An audio guide button, which activates and deactivates the narrator’s voice present at various points in the scene;
- The music button, which allows you to activate and deactivate the background music;
- The game button, which activates, where present, the game with the historical postcards of the city.
4.3. Content Choice, Creation and Implementation
After a thorough analysis of historical sources and the acquisition of photographic material, the virtual scenes and their navigation were designed. In the initial scene of the application, the map of the city was modelled, which allows the user to choose whether to start from old Bari and move forward in time in chronological order or to start from Borgo nuovo and go backwards in time.
Each scene allows only one monument to be explored. Using the Home button, the user can return to the initial scene and make a new choice. The scenes have been divided as follows:
- 1.
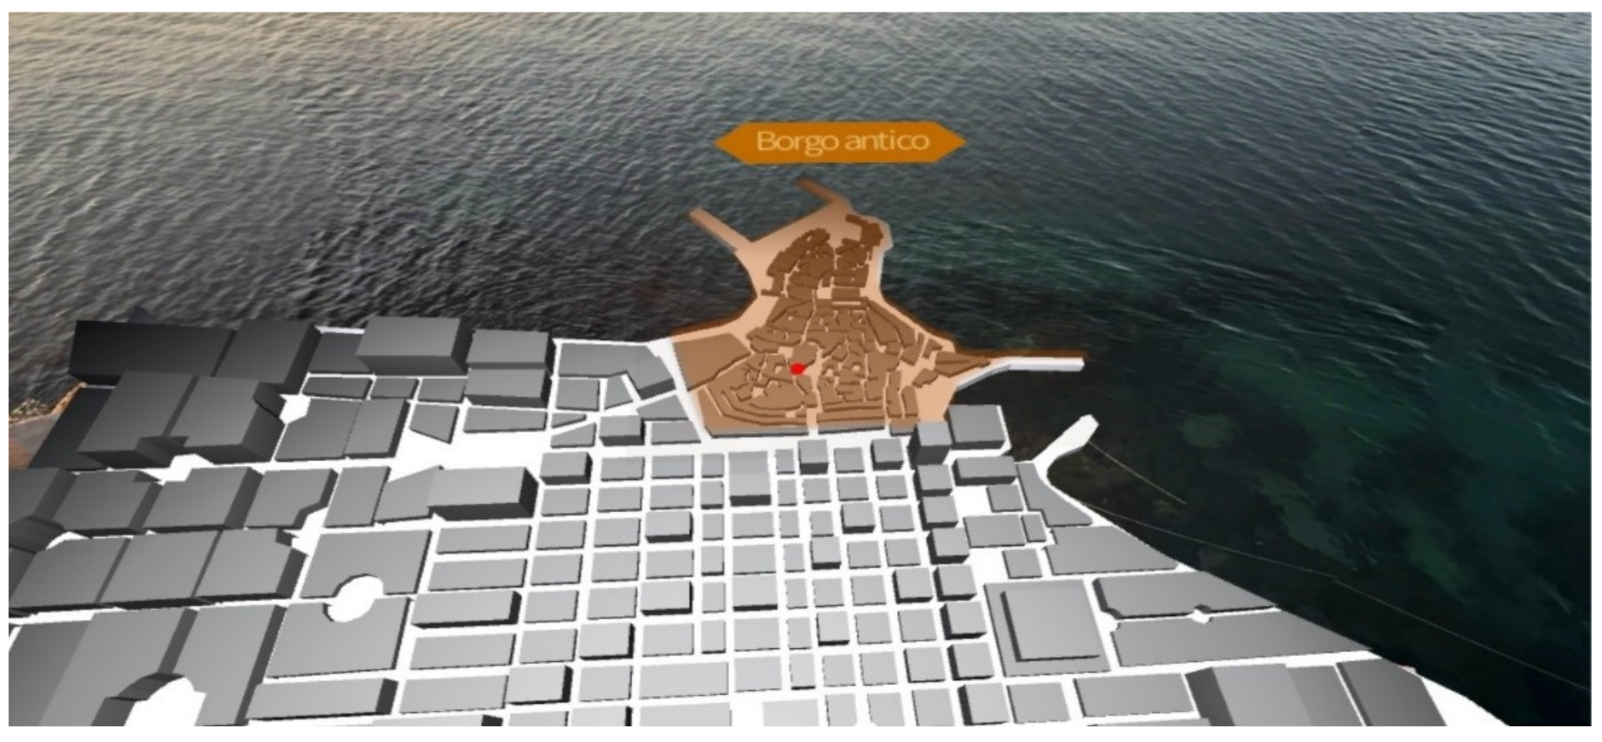
- MenuBari_Scene is the initial scene (Figure 2), in which a 3D model of the city of Bari has been inserted and the user can choose between Bari vecchia and Borgo nuovo. The distinction has been emphasised by associating different colours to the two boroughs and inserting a label above them, made clickable, through which the user is transported to the selected scene. A 360° photo of the city, seen from the sea, was inserted as material in the Skybox as a background for the scene;
 Figure 2. Opening scene of the tour.
 - 2.
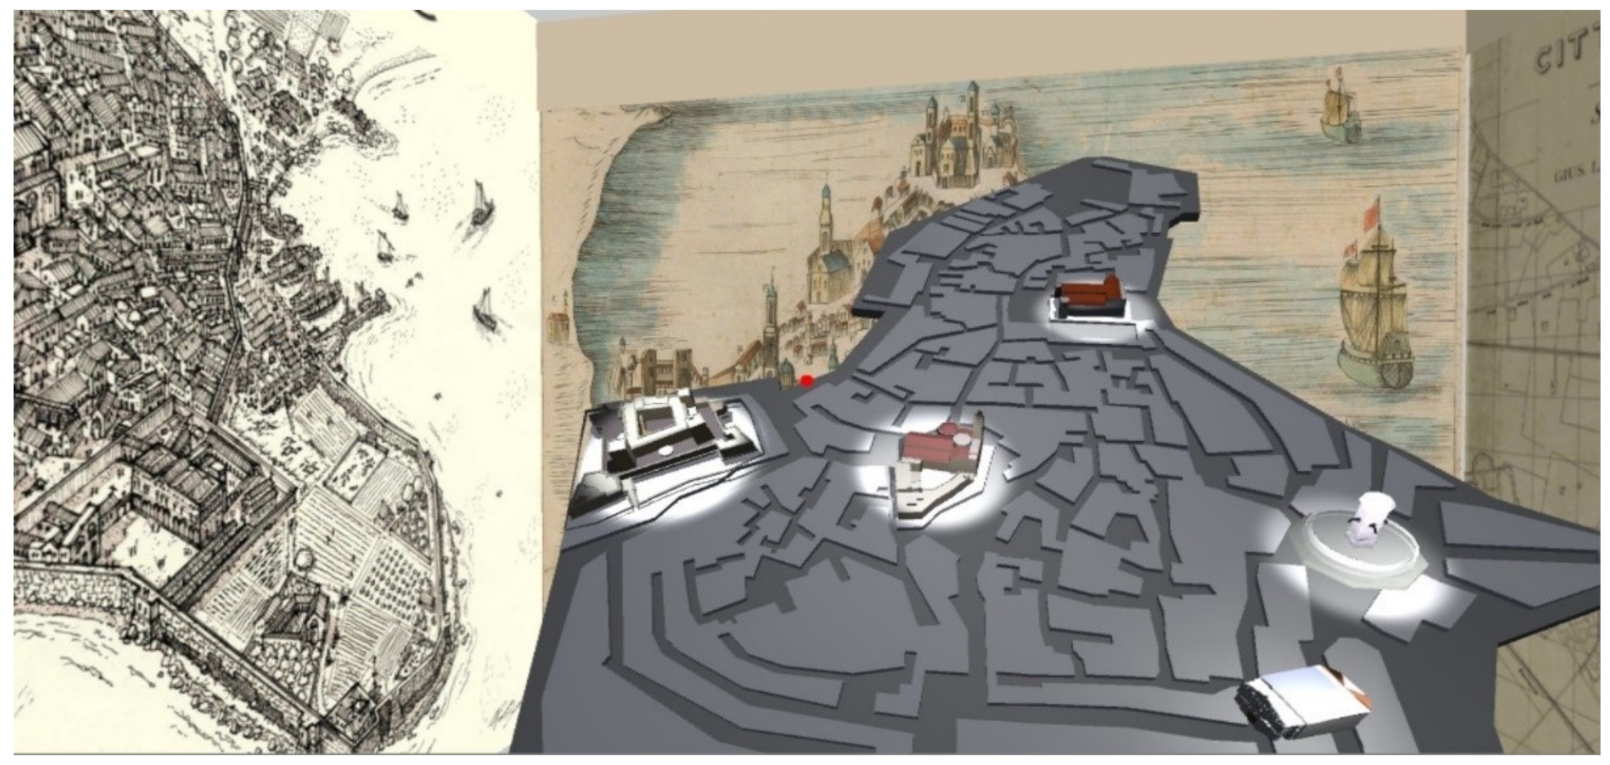
- BariVecchia_Scene (Figure 3) shows a three-dimensional representation of the old town and its most important monuments that can be visited within the tour (the Basilica of San Nicola, the Norman-Swabian Castle, the Cathedral of San Sabino, the Church of San Michele Arcangelo, Piazza Mercantile and the adjoining Piazza del Ferrarese);
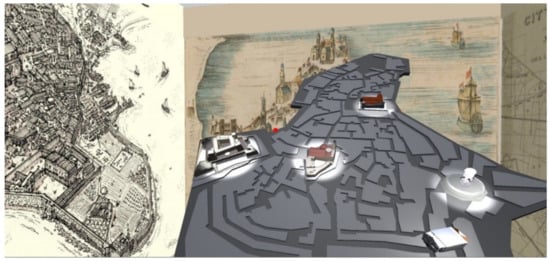 Figure 3. Scene of Bari Vecchia (the old town).
 - 3.
- BorgoNuovo_Scene (Figure 4) represents the point where the first stone was laid to create the new town; this scene is characterised by a more pronounced gamification component and makes use of the numerous photos from the years when the Borgo was built, offering a stronger visual impact.
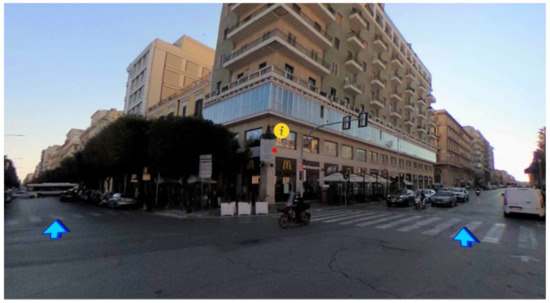 Figure 4. Scene of Borgo Nuovo (the new town).
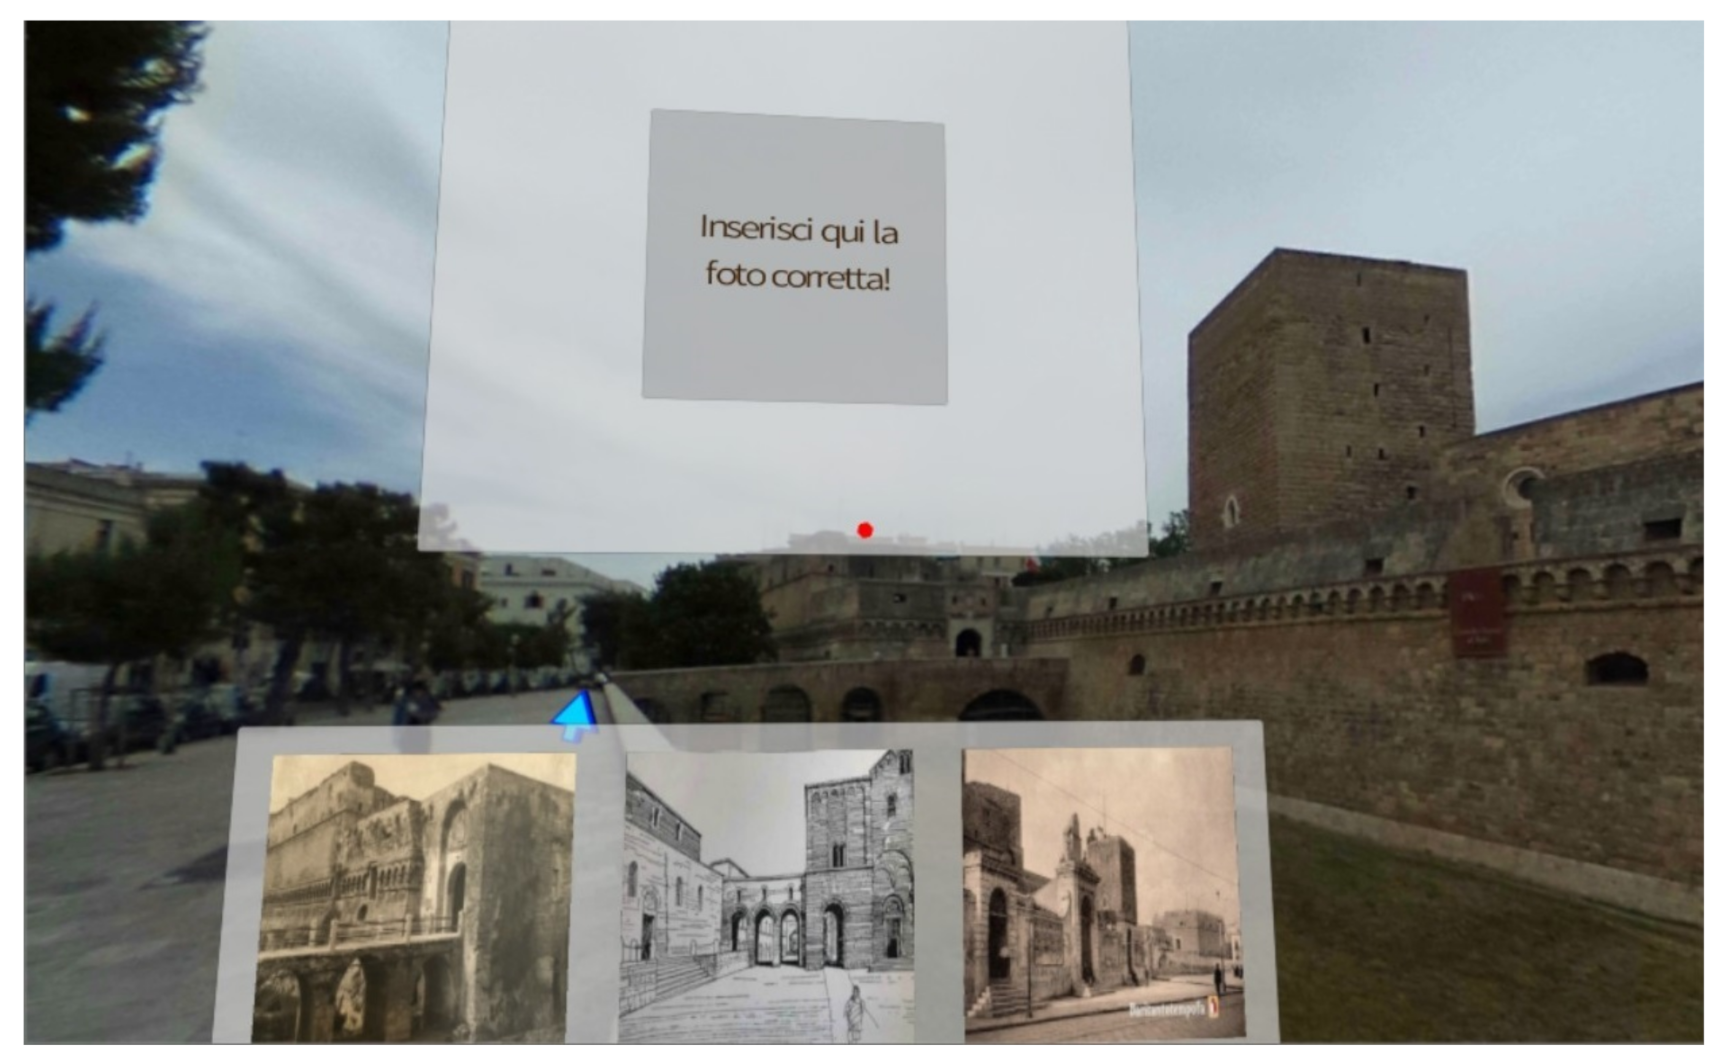
The interface of the game (Figure 5) consists of a lower panel containing the historical postcards and an upper panel on which the correct photo is placed. If the selection made by the user is wrong, a message is displayed inviting him to try again, otherwise, if the answer is correct, the photo is placed in the panel and a panel appears providing information about that subject.
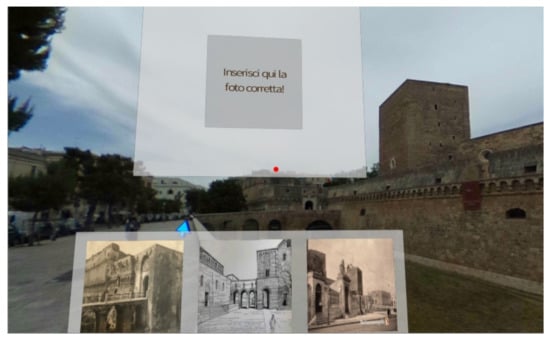
Figure 5.
Initial screen of the postcard game.
4.4. Implementation and Technological Details
The 360° photos were captured with a Rico Theta S camera and modified with PhotoShop editing software.
The virtual tour was implemented using Unity (version 2017.3.0f3), a cross-platform game engine used for the creation of 3D, 2D and other real-time interactive content. Unity offers the possibility of importing various assets, i.e., items that can be used in the game development, and specific Software Development Kits (SDKs) provided by various hardware vendors in the form of plugins. 3D models were created with the free cross-platform software Blender and imported into Unity scenes to make the application more attractive and appealing.
Within the Unity project, it was necessary to import the package provided with Google Cardboard [37] and the SDK compatible with iOS and Android operating systems.
4.5. User Experience Evaluation
The testing of the application involved 30 users (7 males and 23 females) aged between 7 and 66 years distributed as illustrated by the density plot in Figure 6. They had no experience in virtual reality and no particular technological background.
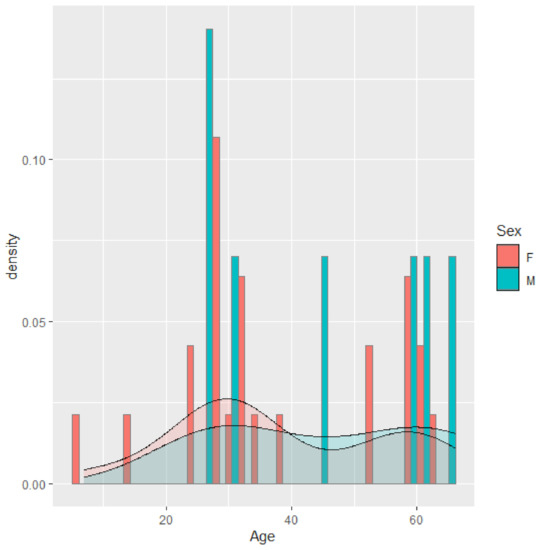
Figure 6.
Density plot of the ages of the users involved in the test.
A questionnaire was prepared to collect users’ opinions about their experience with the application. The main objective of the analysis of the questionnaire data was to see how the ease of use of the application, the ability to learn to use it quickly and the general level of satisfaction related to the factors that had been identified for the specific case of a VR360 system. The most significant items were selected from the questionnaire proposed in [5] for the evaluation of a 360° virtual tour of Dinghu Mountain in southern China, discarding items related to the representation of that specific landscape.
The considered items were grouped into the same factors described in [5], namely engagement, immersion, mental imagery and presence, as shown in Table 1. In addition to these factors, which are characteristic of a VR360 experience, some typical generic factors that determine the quality of a software were also considered as defined in the ISO/IEC 25010:2011 standard [38]: satisfaction and ease of use items were taken from the UMUX-lite questionnaire [39], while learnability was taken from item 10 of the SUS questionnaire [40] and represents the ability to learn quickly how to use the application [41].

Table 1.
Questionnaire for the evaluation of the user experience.
5. Data Analysis and Results
In addition to the mean values of the scores for the various factors, standard deviations and coefficients of variation (calculated as the ratio of standard deviations to mean values) were evaluated in order to assess how much the users were in agreement in their opinions. The distributions of the scores were then evaluated in order to identify the presence of any clusters of scores for each user experience factor. Finally, a Principal Component Analysis (PCA) was performed in order to identify any clustering between these factors.
Table 2 shows the mean values, standard deviations and coefficients of variation of the scores obtained for each component of the user experience. Almost all of the user experience factors are characterised by a high average value and a low coefficient of variation. The highest average score is for mental imagery, which concerns the perceived visual quality of the images. On the other hand, the lowest average score is for learnability, which represents the ability to become quickly familiar with the application. However, this factor also has the highest coefficient of variation, which suggests users have quite different opinions about this aspect. On the other hand, users largely agreed on the other user experience factors covered by the questionnaire, as highlighted by the low coefficients of variation.
Table 2.
Mean values, standard deviation and coefficient of variations of the scores of the user experience factors.
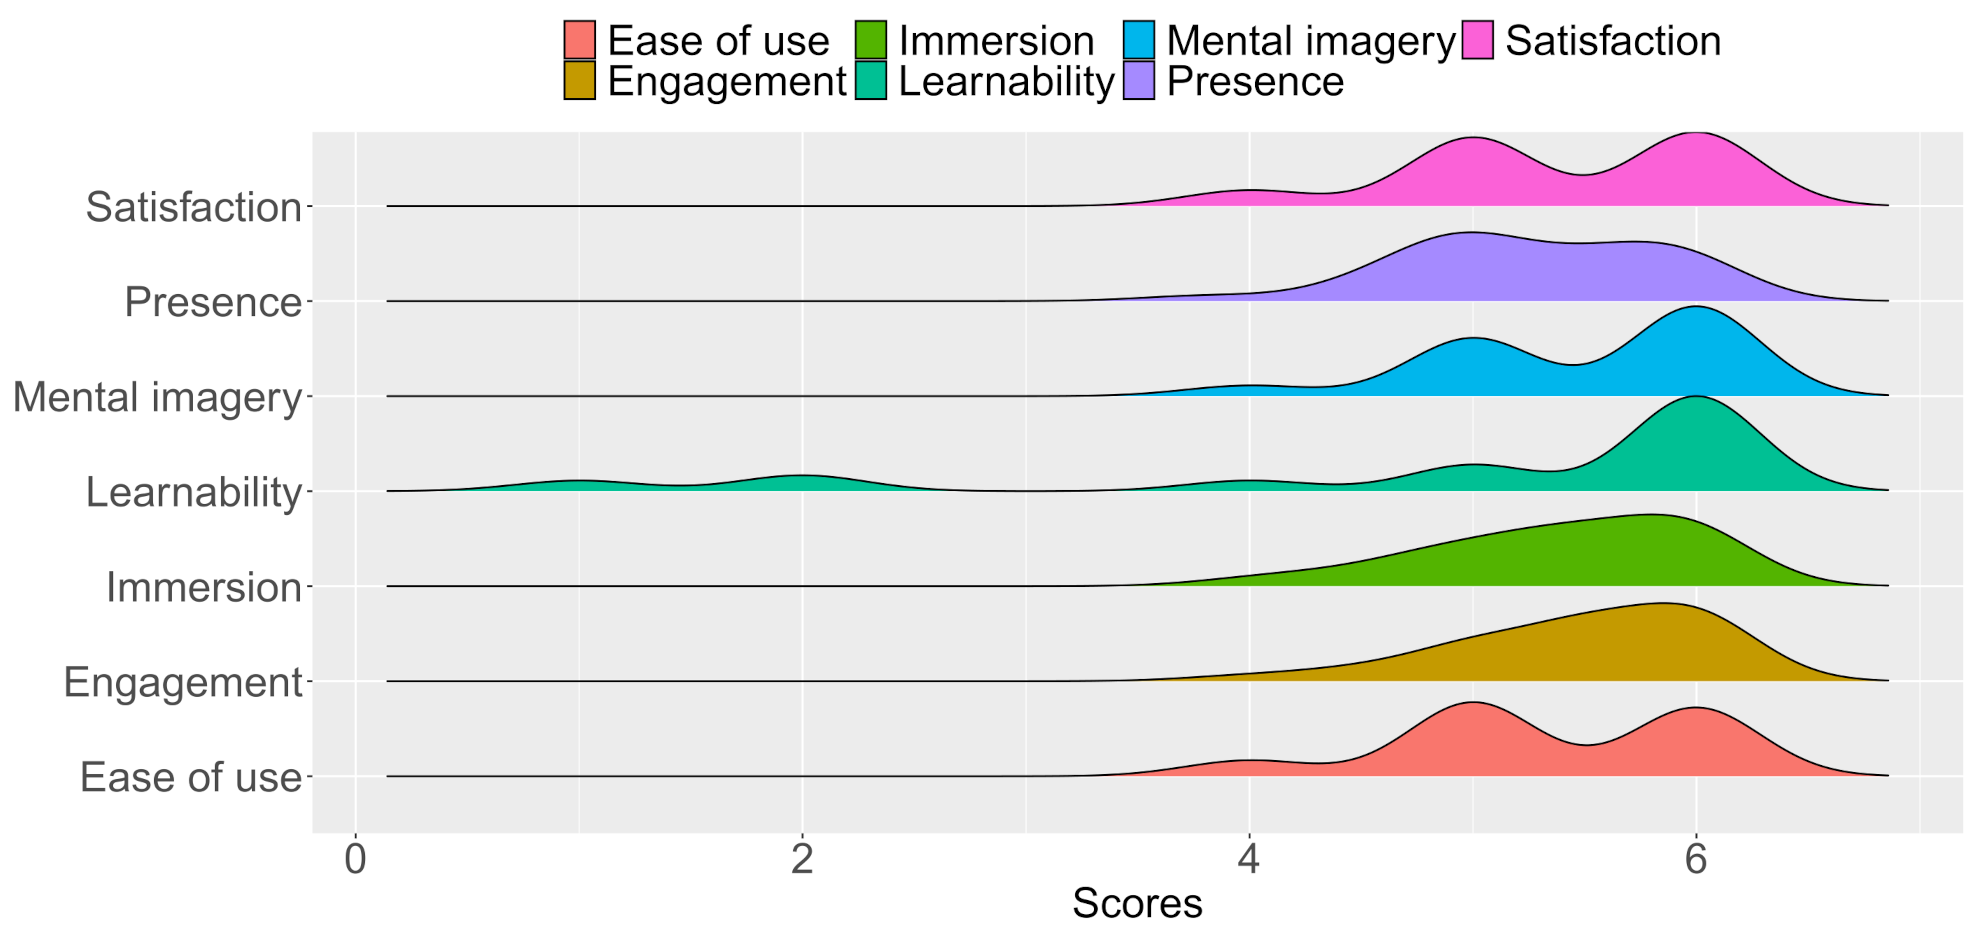
The density ridgeline plot in Figure 7 compares the distributions of the scores based on the density estimates obtained from the questionnaire data.
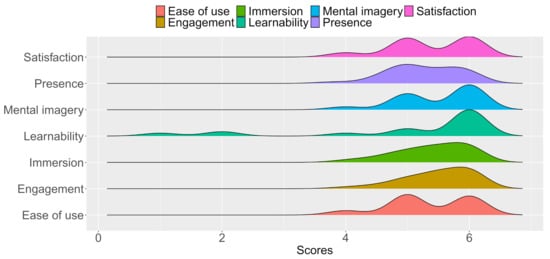
Figure 7.
Distributions of the scores of the user experience factors.
The density graph seems to suggest a certain influence of immersion on involvement, as the two factors show similar waveforms. Similarly, there seems to be a correspondence between ease of use and level of satisfaction. Another factor determining the level of satisfaction is mental imagery. All these three factors have a ridgeline with a double hump, suggesting the presence of two main clusters in the responses given by users. Learnability has a peak near the maximum score, but also a tail on the left indicating the presence of scattered and highly variable lower scores, which are the cause of the higher coefficient of variation than the other factors: although some small isolated groups had some difficulty in becoming familiar with the application, most users learned to use it very quickly.
Principal Component Analysis
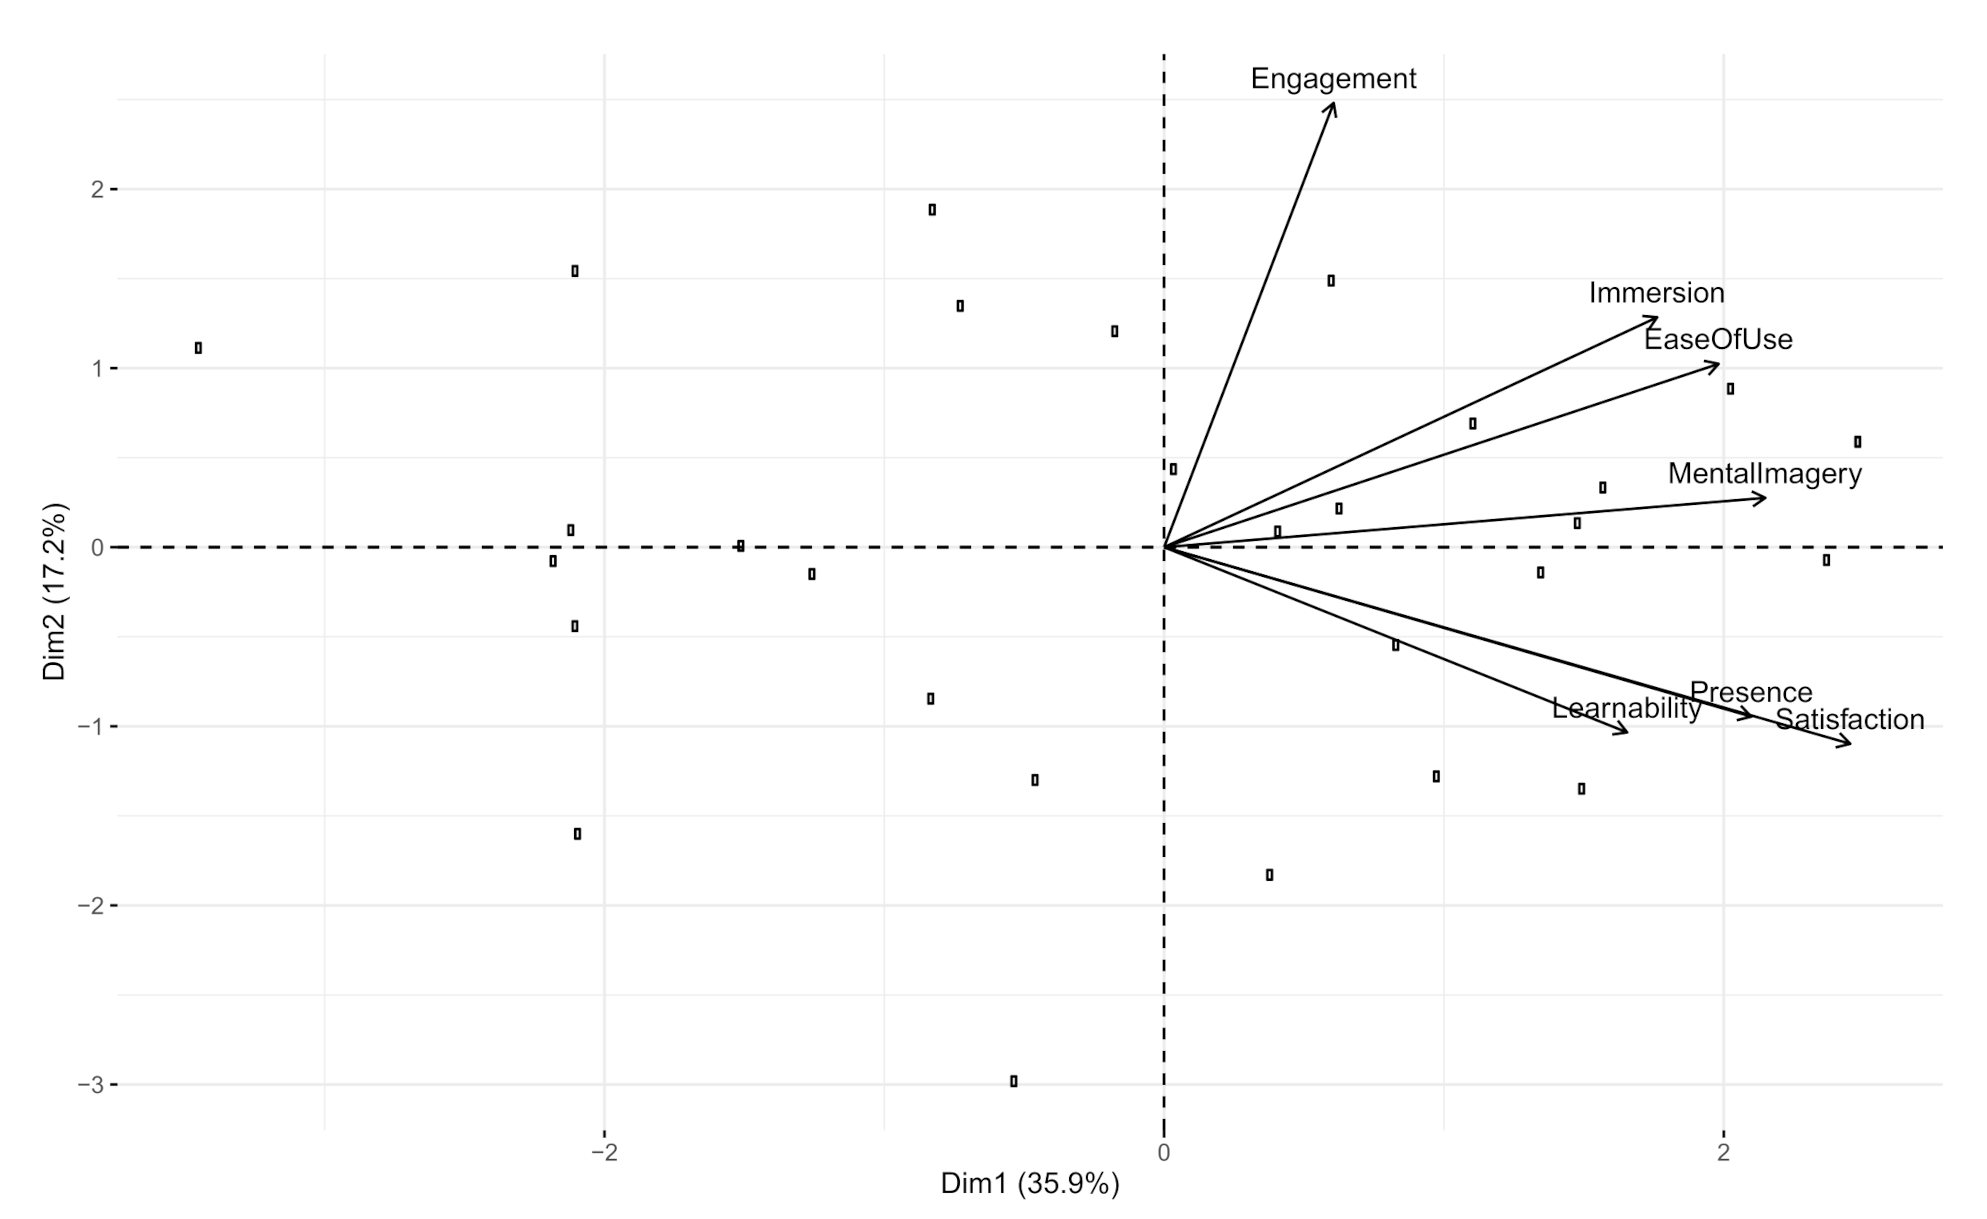
Principal Component Analysis (PCA) aims to group variables according to their variability to reduce the dimensionality of the data set: in the specific scenario under consideration, the aim is to identify any clusters among the factors in Table 2 that might suggest correlations between them. The plot in Figure 8 represents the relationships among the user experience factors in a space made up of the first two dimensions, which are the most important to explain the variability in the data set: longer arrows correspond to better represented variables in the factor map.
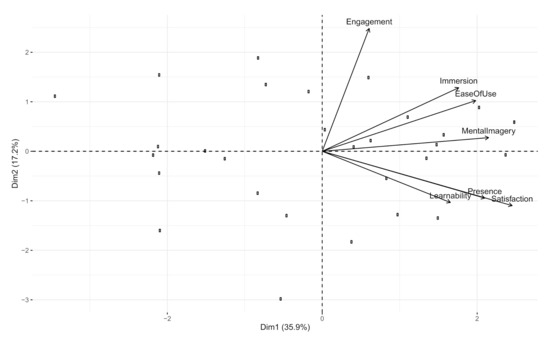
Figure 8.
Variable correlation plot for the user experience factors.
Figure 9 depicts a scree plot, which is the plot of eigenvalues ordered from largest to the smallest. The optimal number of components to be chosen for the PCA corresponds to the point beyond which the remaining eigenvalues are relatively small and of comparable size.
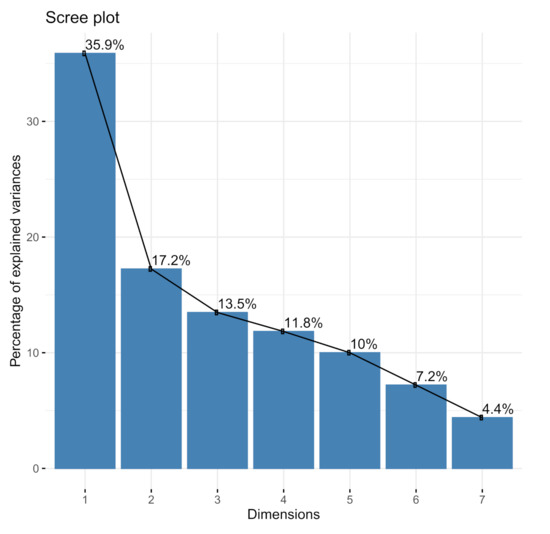
Figure 9.
Scree plot of user experience factors.
Of the seven identified principal components (PC1, ..., PC7 in Table 3), the first four account for more than 78% of the total variability.
Table 3.
Principal component analysis of the user experience factors. Bold represents cumulative proportion that is considered significant.
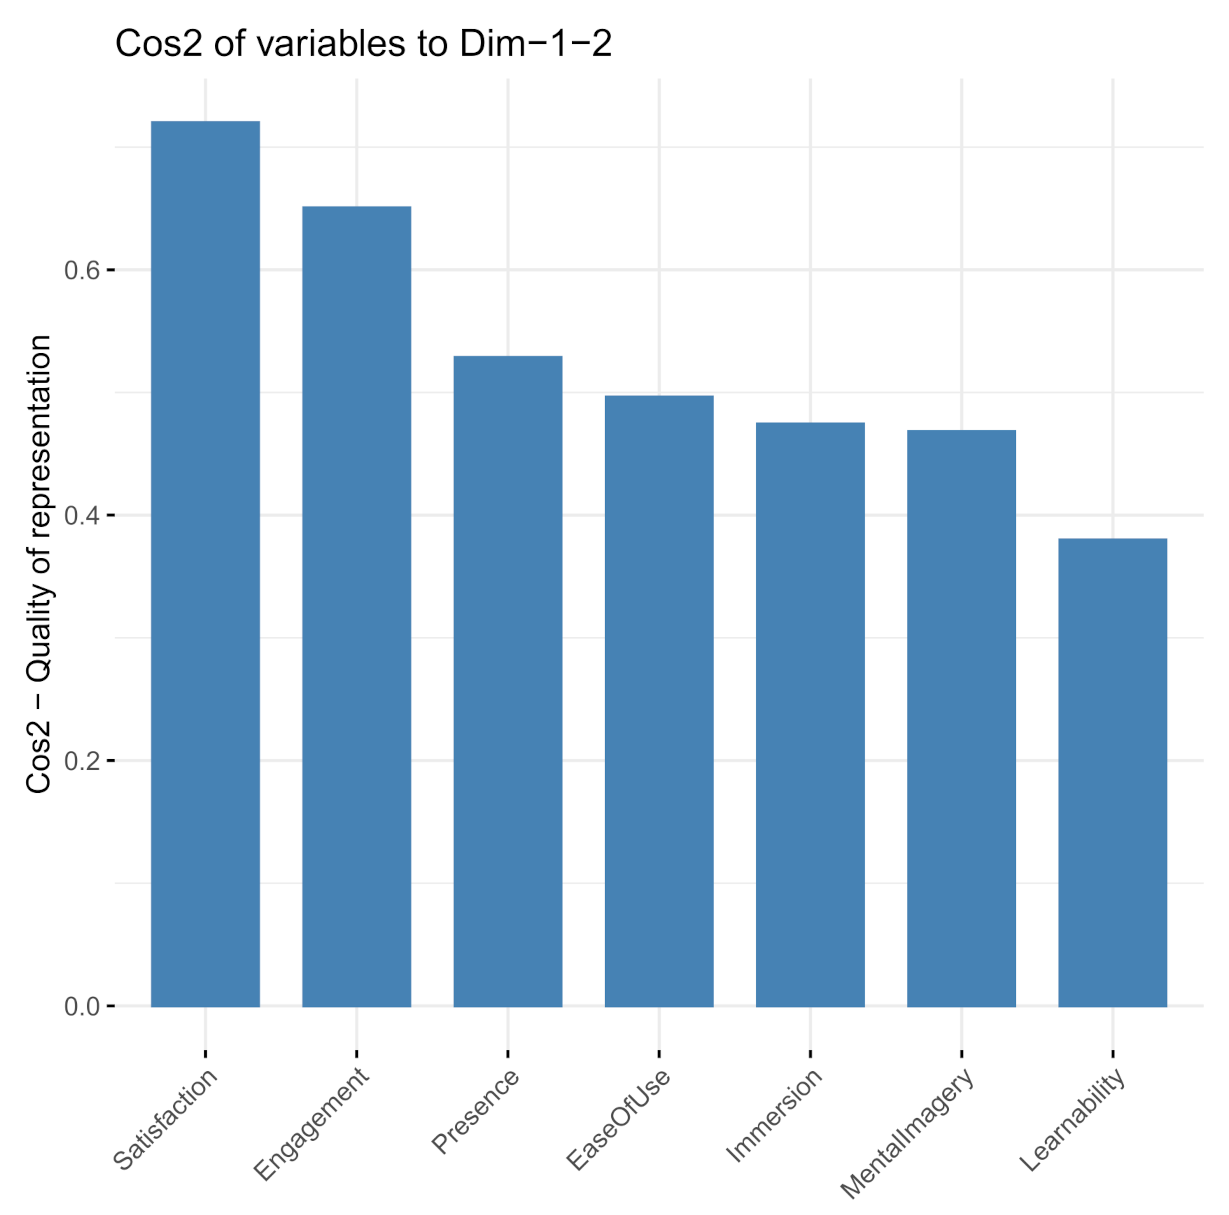
The bar plot in Figure 10 depicts the square cosine (cos2) of the user experience variables on the first two dimensions: satisfaction and engagement, which are the variables with the highest values, are best represented by the first two principal components.

Figure 10.
Quality of representation of user experience factors.
In principal component analysis, an attempt is usually made to obtain the so-called ‘simple structure’ in which, according to Kline [42], “each component should have a few high loadings with the rest of the loadings being zero or close to zero”. To this end, varimax orthogonal rotation is employed, which aims to maximise variance among the squared values of loadings of each component [43]. An oblique enhancement of varimax, called promax rotation, aims to achieve the “simple structure” at a higher degree [44].
Table 4 reports the loadings obtained by performing varimax and promax rotations on the first four components: loadings with an absolute value higher than 0.4, highlighted in bold, were considered as significant; the signs of loadings indicate whether the corresponding variables and principal components are positively or negatively correlated. The first and most relevant component can be expressed as a combination of Presence, satisfaction and ease of use: the concordant positive sign indicates that all these three factors are positively correlated with the first component and that as one component increases, the others also increase. The second component can be expressed as a combination of engagement and ease of use. The third component can be expressed as a combination of immersion and mental imagery. The last component depends only on learnability.
Table 4.
Loadings obtained through varimax and promax rotations on the first three principal components for the user experience factors. Bold represents loadings that are considered significant.
6. Discussion
The analysis of the results highlighted the importance of the sense of presence for user satisfaction. Presence refers to the feeling perceived by the user of being in a place that is different from where he/she actually is [45,46]. For application developed in the context of tourism, the research on presence typically focuses on its consequences and the research of its antecedents is limited to vividness and interactivity [47].
Interestingly, ease of use correlates on the one hand with the level of satisfaction and sense of presence and on the other hand with engagement, but does not influence immersion.
Engagement refers to the quality of user experience in terms of cognitive, temporal, affective and behavioural investment [48]. In this sense, it is generally seen as a wider and stronger concept than involvement, as it also encloses an interactive relationship and the perception of an experiential value [49].
Immersion, defined as the constant psychological state of users feeling surrounded in an interactive virtual environment [50], in the considered scenario is correlated only with the visual impact of the scenes (mental imagery) and not with ease of use. Interaction in a 360° virtual environment is expected to be reduced and occur less continuously than in a traditional 6-DoF virtual environment based on a VR headset. For these reasons, it is very likely that visual quality will take precedence over ease of use (referring mainly to the forms of interaction available to the user) becoming in fact almost the only factor on which immersion depends.
The ability to learn how to use the application quickly (learnability) is the factor that reported the lowest average score and the highest variability, but seems to have no influence on other factors of the user experience. The gaze controller of a cardboard-based VR360 system should offer a more intuitive and natural interaction than the handheld controllers of a traditional VR system, but the distribution of the scores revealed the presence of groups of users who showed some difficulty in learning to use the system. Nevertheless, the ease of use, while showing the presence of two possible clusters in the distribution of scores, is characterised by a higher average score and also less variability, as both clusters are still around fairly high scores. Probably the initial learning curve presents difficulties for some users who paradoxically find themselves displaced by having to interact by means of their eyes instead of more traditional pointing devices (such as a mouse or handheld controller) that have been ingrained longer in the collective imagination.
7. Conclusions
This paper presents an application in the field of cultural tourism, which exploits the potential of virtual reality to make the cultural heritage of the city of Bari known in a more engaging and interactive way.
The development of the virtual reality application takes advantage of the fact that, nowadays, everyone has a smartphone capable of supporting this type of application. The Google Cardboard visor turned out to be an excellent device in terms of performance, availability and, above all, cost. This has facilitated the fruition of the application for a larger number of users, without the need to resort to expensive visors or to be constrained to certain installation locations.
A tour of the historical buildings was created, through which the history and evolution of the city was reconstructed up to the current urban layout. Compared to the virtual tours available on the market, a gamification component was added, which consists of making the user guess which of the proposed historical postcards corresponds to the place where the user is currently located, in order to understand, through a before/after comparison, the changes in the city over the years.
The application is in the prototype stage, but will be enriched with new content and functionality. It will then probably be proposed to possible stakeholders willing to finance the project. In particular, it will be enriched with new points of interest and information sheets to provide the user with a more complete and structured cultural experience. Further test campaigns will be planned involving tourists, as well as locals, in order to evaluate possible changes or improvements. Finally, the possibility of conducting experiments in a school context will also be evaluated in order to assess the educational effectiveness of the application.
Author Contributions
Conceptualization: V.D.L., G.M., M.C.B. and L.T.D.P.; Methodology: V.D.L., G.M., M.C.B. and L.T.D.P.; Software: V.D.L., G.M. and M.C.B.; Validation: V.D.L., M.C.B. and L.T.D.P.; Historical investigation: G.M.; Technological investigation: V.D.L., G.M. and M.C.B.; Data curation: G.M.; Writing—original draft preparation: V.D.L., G.M. and M.C.B.; Writing—review and editing: L.T.D.P. and V.D.L.; Supervision: L.T.D.P., V.D.L. and M.C.B. All authors have read and agreed to the published version of the manuscript.
Funding
This research received no external funding.
Informed Consent Statement
Not applicable.
Data Availability Statement
Not applicable.
Conflicts of Interest
The authors declare no conflict of interest.
References
- Olietti, A.; Musso, P. Turismo Digitale: In Viaggio Tra i Click; FrancoAngeli s.r.l.: Milano, Italy, 2018. [Google Scholar]
- UNWTO World Tourism Organization. Turismo e Cultura. Available online: https://www.unwto.org/tourism-and-culture (accessed on 10 July 2022).
- Guttentag, D. Virtual reality: Applications and implications for tourism. Tour. Manag. 2010, 31, 637–651. [Google Scholar] [CrossRef]
- Orlandi, M.; Zambruno, S.; Vazzana, A. Tecnologia, Beni Culturali e Turismo: I Tour Virtuali (Virtual Tours) come strumento per una corretta comunicazione dei Beni Culturali. Storia e Futuro Rivista di Storia e Storiografia Contemporanea Online 2014, 34. Available online: http://storiaefuturo.eu/tecnologia-beni-culturali-e-turismo-tour-virtuali-virtual-tours-come-strumento-per-una-corretta-comunicazione-dei-beni-culturali/ (accessed on 10 July 2022).
- Wu, X.; Lai, I. Identifying the response factors in the formation of a sense of presence and a destination image from a 360-degree virtual tour. J. Destin. Mark. Manag. 2021, 21, 100640. [Google Scholar] [CrossRef]
- Pappa, D.; Makropoulos, C. Novel Ways of Discovering, Capturing and Experiencing Cultural Heritage: A Review of Current State-of-the-Art, Challenges and Future Directions. In Heritage—New Paradigm; Turcanu-Carutiu, P.D., Ed.; IntechOpen: Rijeka, Croatia, 2021; Chapter 36. [Google Scholar] [CrossRef]
- Ren, W.; Chen, X. Evaluation of an Online 360∘ Virtual Reality World Heritage Site during COVID-19. Open Archaeol. 2021, 7, 1192–1215. [Google Scholar] [CrossRef]
- Silberman, N.A. ICOMOS Charter for the Interpretation and Presentation of Cultural Heritage Sites. Int. J. Cult. Prop. 2008, 15, 377–383. [Google Scholar] [CrossRef] [Green Version]
- Bekele, M.; Pierdicca, R.; Frontoni, E.; Malinverni, E.; Gain, J. A survey of augmented, virtual, and mixed reality for cultural heritage. J. Comput. Cult. Herit. 2018, 11, 1–36. [Google Scholar] [CrossRef]
- Shikhri, R.; Lanir, J.; Poretski, L. Evaluation framework for improving 360 virtual tours user experience. In Proceedings of the WebTour@ WSDM, CEUR-WS, Jerusalem, Israel, 12 March 2021; Volume 2855, pp. 16–18. [Google Scholar]
- De Paolis, L.T.; Aloisio, G.; Celentano, M.G.; Oliva, L.; Vecchio, P. A game-based 3D simulation of Otranto in the Middle Ages. In Proceedings of the 3rd International Conference on Advances in Computer-Human Interactions, ACHI 2010, Saint Maarten, Netherlands Antilles, 10–15 February 2010; pp. 130–133. [Google Scholar] [CrossRef]
- De Paolis, L.T.; Aloisio, G.; Celentano, M.G.; Oliva, L.; Vecchio, P. Experiencing a town of the Middle Ages: An application for the edutainment in cultural heritage. In Proceedings of the IEEE 3rd International Conference on Communication Software and Networks, Xi’an, China, 27–29 May 2011; pp. 169–174. [Google Scholar] [CrossRef]
- De Paolis, L.T.; Aloisio, G.; Celentano, M.G.; Oliva, L.; Vecchio, P. MediaEvo project: A serious game for the edutainment. In Proceedings of the 3rd International Conference on Computer Research and Development, Shanghai, China, 11–13 March 2011; Volume 4, pp. 524–529. [Google Scholar] [CrossRef]
- Harun, N.; Yanti Mahadzir, S. 360° Virtual Tour of the Traditional Malay House as an Effort for Cultural Heritage Preservation; IOP Publishing Ltd.: Bristol, UK, 2021; Volume 764. [Google Scholar] [CrossRef]
- De Canio, F.; Martinelli, E.; Peruzzini, M.; Cavallaro, S. Experiencing a Food Production Site Using Wearable Devices: The Indirect Impact of Immersion and Presence in VR Tours. Sustainability 2022, 14, 64. [Google Scholar] [CrossRef]
- Abidin, R.; Suryani, N.; Sariyatun. Students’ Perceptions of 360 Degree Virtual Tour-Based Historical Learning About The Cultural Heritage Area of The Kapitan and Al-Munawar Villages in Palembang City. Int. J. Soc. Sci. Manag. 2020, 7, 105–112. [Google Scholar] [CrossRef]
- El-Said, O.; Aziz, H. Virtual Tours a Means to an End: An Analysis of Virtual Tours’ Role in Tourism Recovery Post COVID-19. J. Travel Res. 2022, 61, 528–548. [Google Scholar] [CrossRef]
- Cirulis, A.; De Paolis, L.; Tutberidze, M. Virtualization of Digitalized Cultural Heritage and Use Case Scenario Modeling for Sustainability Promotion of National Identity; Elsevier B.V.: Amsterdam, The Netherlands, 2015; Volume 77, pp. 199–206. [Google Scholar] [CrossRef]
- Checa, D.; Gatto, C.; Cisternino, D.; De Paolis, L.; Bustillo, A. A Framework for Educational and Training Immersive Virtual Reality Experiences. Lect. Notes Comput. Sci. 2020, 12243, 220–228. [Google Scholar] [CrossRef]
- Hu, Q.; Yu, D.; Wang, S.; Fu, C.; Ai, M.; Wang, W. Hybrid three-dimensional representation based on panoramic images and three-dimensional models for a virtual museum: Data collection, model, and visualization. Inf. Vis. 2017, 16, 126–138. [Google Scholar] [CrossRef]
- Nemtinov, V.; Gorelov, A.; Nemtinova, Y.; Borisenko, A. Virtual immersion into timeframes of residency of the representatives of chicherin family - Famous figures of the russian diplomatic service in the Tambov Region. Bylye Gody 2020, 58, 2305–2314. [Google Scholar] [CrossRef]
- Škola, F.; Rizvić, S.; Cozza, M.; Barbieri, L.; Bruno, F.; Skarlatos, D.; Liarokapis, F. Virtual reality with 360-video storytelling in cultural heritage: Study of presence, engagement, and immersion. Sensors 2020, 20, 5851. [Google Scholar] [CrossRef]
- Iacovino, A.; De Paolis, L.; Ndou, V. Technologies to Support Tourism Innovation and Cultural Heritage: Development of an Immersive Virtual Reality Application. Lect. Notes Comput. Sci. 2020, 12243, 3–14. [Google Scholar] [CrossRef]
- De Paolis, L.T.; Chiarello, S.; D’Errico, G.; Gatto, C.; Nuzzo, B.L.; Sumerano, G. Mobile Extended Reality for the Enhancement of an Underground Oil Mill: A Preliminary Discussion. Lect. Notes Comput. Sci. 2021, 12980, 326–335. [Google Scholar] [CrossRef]
- Cisternino, D.; Gatto, C.; D’Errico, G.; De Luca, V.; Barba, M.; Paladini, G.; De Paolis, L. Virtual Portals for a Smart Fruition of Historical and Archaeological Contexts. Lect. Notes Comput. Sci. 2019, 11614, 264–273. [Google Scholar] [CrossRef]
- Argyriou, L.; Economou, D.; Bouki, V. Design methodology for 360 immersive video applications: The case study of a cultural heritage virtual tour. Pers. Ubiquitous Comput. 2020, 24, 843–859. [Google Scholar] [CrossRef] [Green Version]
- Fabola, A.; Miller, A. Virtual reality for early education: A study. Commun. Comput. Inf. Sci. 2016, 621, 59–72. [Google Scholar] [CrossRef] [Green Version]
- Kang, B.G.; Lee, W.B.; Ryu, S.H. Development of Baekje cultural tourism contents by utilizing portable VR glasses. J. Korea Converg. Soc. 2018, 9, 317–323. [Google Scholar]
- Cisternino, D.; Corchia, L.; De Luca, V.; Gatto, C.; Liaci, S.; Scrivano, L.; Trono, A.; De Paolis, L. Augmented Reality Applications to Support the Promotion of Cultural Heritage. J. Comput. Cult. Herit. 2021, 14, 1–30. [Google Scholar] [CrossRef]
- Conoscendo. Gli JAPIGI. Available online: http://conoscendo.altervista.org/gli-japigi/ (accessed on 10 July 2022).
- Petrignani, M.; Porsia, F. Le Città nella Storia d’Italia—Bari; Editori Laterza: Bari, Italy, 1988. [Google Scholar]
- Melchiorre, V. Bari nella Storia; Adda: Bari, Italy, 2002. [Google Scholar]
- Depalo, M.R.; Disantarosa, G.; Nuzzo, D. CITTADELLA NICOLAIANA—1 Archeologia urbana a Bari nell’Area della Basilica di San Nicola; Editori Laterza: Bari, Italy, 2015. [Google Scholar]
- Fondazione Petruzzelli. La Storia del Teatro Petruzzelli. Available online: https://www.fondazionepetruzzelli.it/il-teatro/ (accessed on 10 July 2022).
- Colaninno, A. Il Liberty a Bari. Available online: http://www.italialiberty.it/liberty-bari/ (accessed on 10 July 2022).
- Lattanzio, F. Il Quartiere Umbertino: Fra Teatri e Palazzi Liberty, lì Dove Bari si Fa Elegante. 2016. Available online: https://www.barinedita.it/storie-e-curiosita/n2305-il—quartiere-umbertino—-fra-teatri-e-palazzi-liberty-li-dove-bari-si-fa-elegante (accessed on 10 July 2022).
- Quickstart for Google Cardboard for Unity. 2022. Available online: https://developers.google.com/cardboard/develop/unity/quickstart (accessed on 10 July 2022).
- International Organization For Standardization (ISO). ISO/IEC 25010:2011; Systems and Software Engineering—Systems and Software Quality Requirements and Evaluation (SQuaRE)—System and Software Quality Models; ISO: Geneva, Switzerland, 2011. [Google Scholar]
- Lewis, J.; Utesch, B.; Maher, D. UMUX-LITE—When there’s no time for the SUS. In Proceedings of the SIGCHI Conference on Human Factors in Computing Systems, Paris, France, 27 April–2 May 2013; pp. 2099–2102. [Google Scholar] [CrossRef]
- Brooke, J. SUS—A quick and dirty usability scale. Usability Eval. Ind. 1996, 189, 4–7. [Google Scholar]
- Lewis, J.R.; Sauro, J. The factor structure of the system usability scale. In Human Centered Design, Lecture Notes in Computer Science; Kurosu, M., Ed.; Springer: Berlin/Heidelberg, Germany, 2009; pp. 94–103. [Google Scholar] [CrossRef]
- Kline, P. An Easy Guide to Factor Analysis; Routledge: London, UK, 2002. [Google Scholar]
- Kaiser, H. The varimax criterion for analytic rotation in factor analysis. Psychometrika 1958, 23, 187–200. [Google Scholar] [CrossRef]
- Hendrickson, A.; White, P. PROMAX: A quick method for rotation to oblique simple structure. Br. J. Stat. Psychol. 1964, 17, 65–70. [Google Scholar] [CrossRef]
- Slater, M.; Usoh, M.; Steed, A. Depth of Presence in Virtual Environments. Presence Teleoperators Virtual Environ. 1994, 3, 130–144. [Google Scholar] [CrossRef]
- Slater, M.; Wilbur, S. A framework for immersive virtual environments (FIVE): Speculations on the role of presence in virtual environments. Presence Teleoperators Virtual Environ. 1997, 6, 603–616. [Google Scholar] [CrossRef]
- Khalifa, M.; Shen, N. System Design Effects on Social Presence and Telepresence in Virtual Communities. In Proceedings of the 25th International Conference on Information Systems ICIS’04, Washington, DC, USA, 12–15 December 2004; pp. 547–558. [Google Scholar]
- O’Brien, H.; Cairns, P.; Hall, M. A practical approach to measuring user engagement with the refined user engagement scale (UES) and new UES short form. Int. J. Hum. Comput. Stud. 2018, 112, 28–39. [Google Scholar] [CrossRef]
- Brodie, R.; Ilic, A.; Juric, B.; Hollebeek, L. Consumer engagement in a virtual brand community: An exploratory analysis. J. Bus. Res. 2013, 66, 105–114. [Google Scholar] [CrossRef]
- Witmer, B.G.; Singer, M.J. Measuring presence in virtual environments: A presence questionnaire. Presence Teleoperators Virtual Environ. 1998, 7, 225–240. [Google Scholar] [CrossRef]


Publisher’s Note: MDPI stays neutral with regard to jurisdictional claims in published maps and institutional affiliations. |
© 2022 by the authors. Licensee MDPI, Basel, Switzerland. This article is an open access article distributed under the terms and conditions of the Creative Commons Attribution (CC BY) license (https://creativecommons.org/licenses/by/4.0/).