Estimating the Annual Exceedance Probability of Water Levels and Wave Heights from High Resolution Coupled Wave-Circulation Models in Long Island Sound

 , , , ,
Abstract
1. Introduction
2. Background
2.1. Study Area and In-Situ Data
2.2. Wind Data
3. Methodology
3.1. Circulation and Wave Model
3.2. Extreme Value Analysis
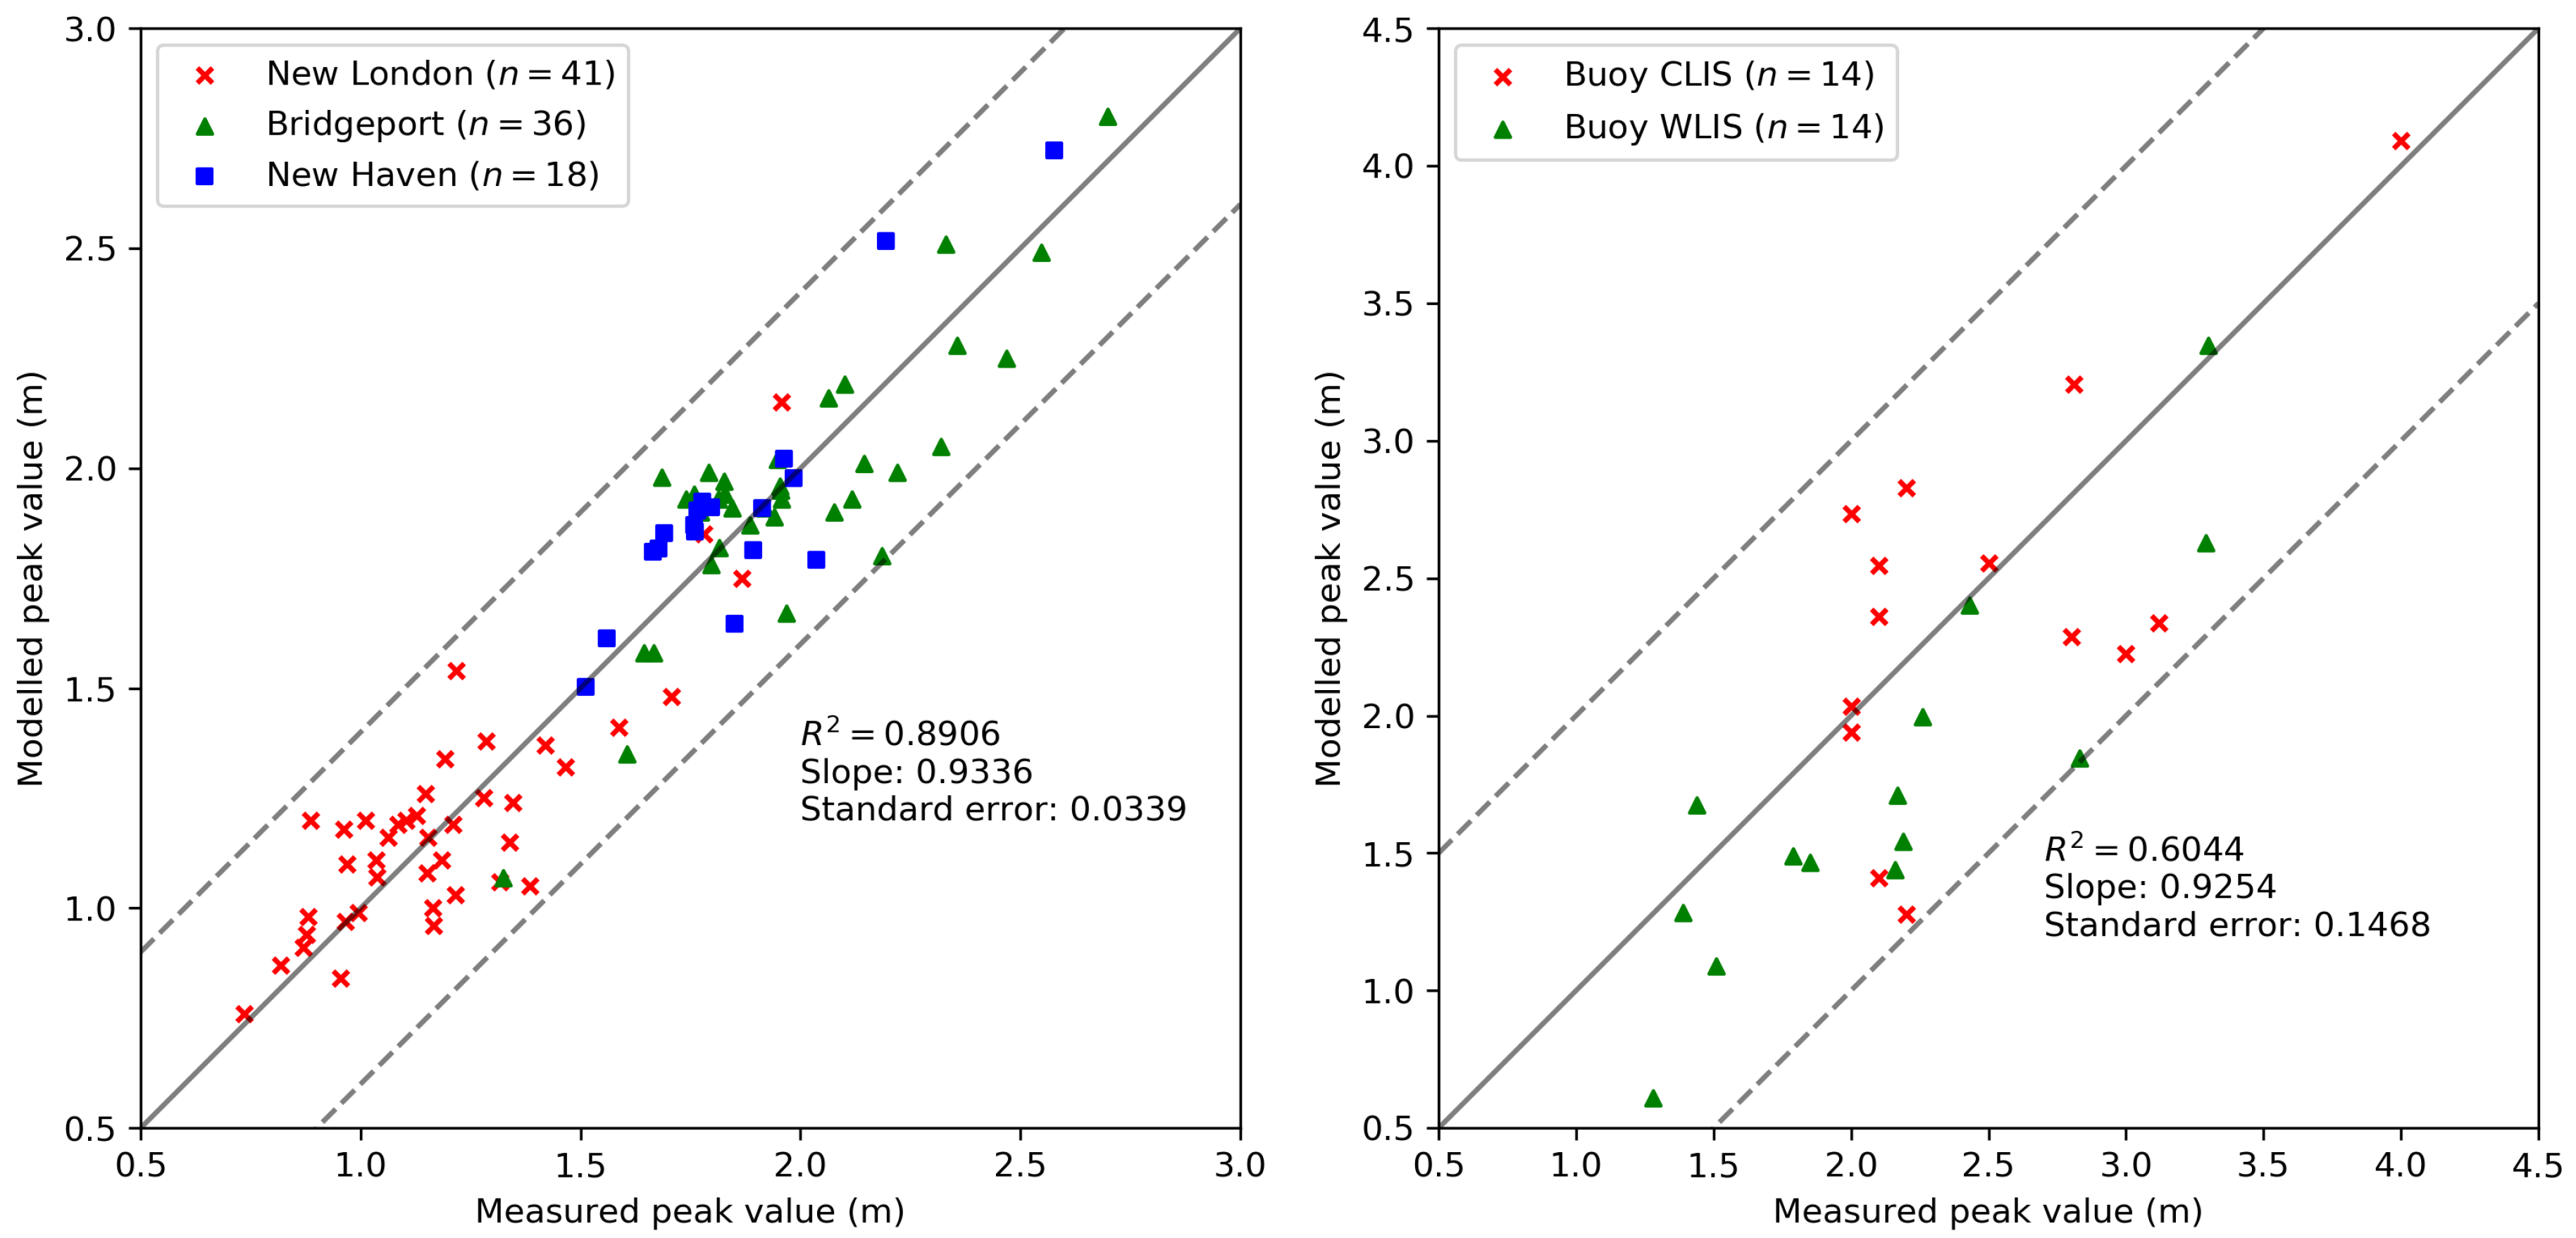
3.3. Error Analysis
4. Results and Discussion
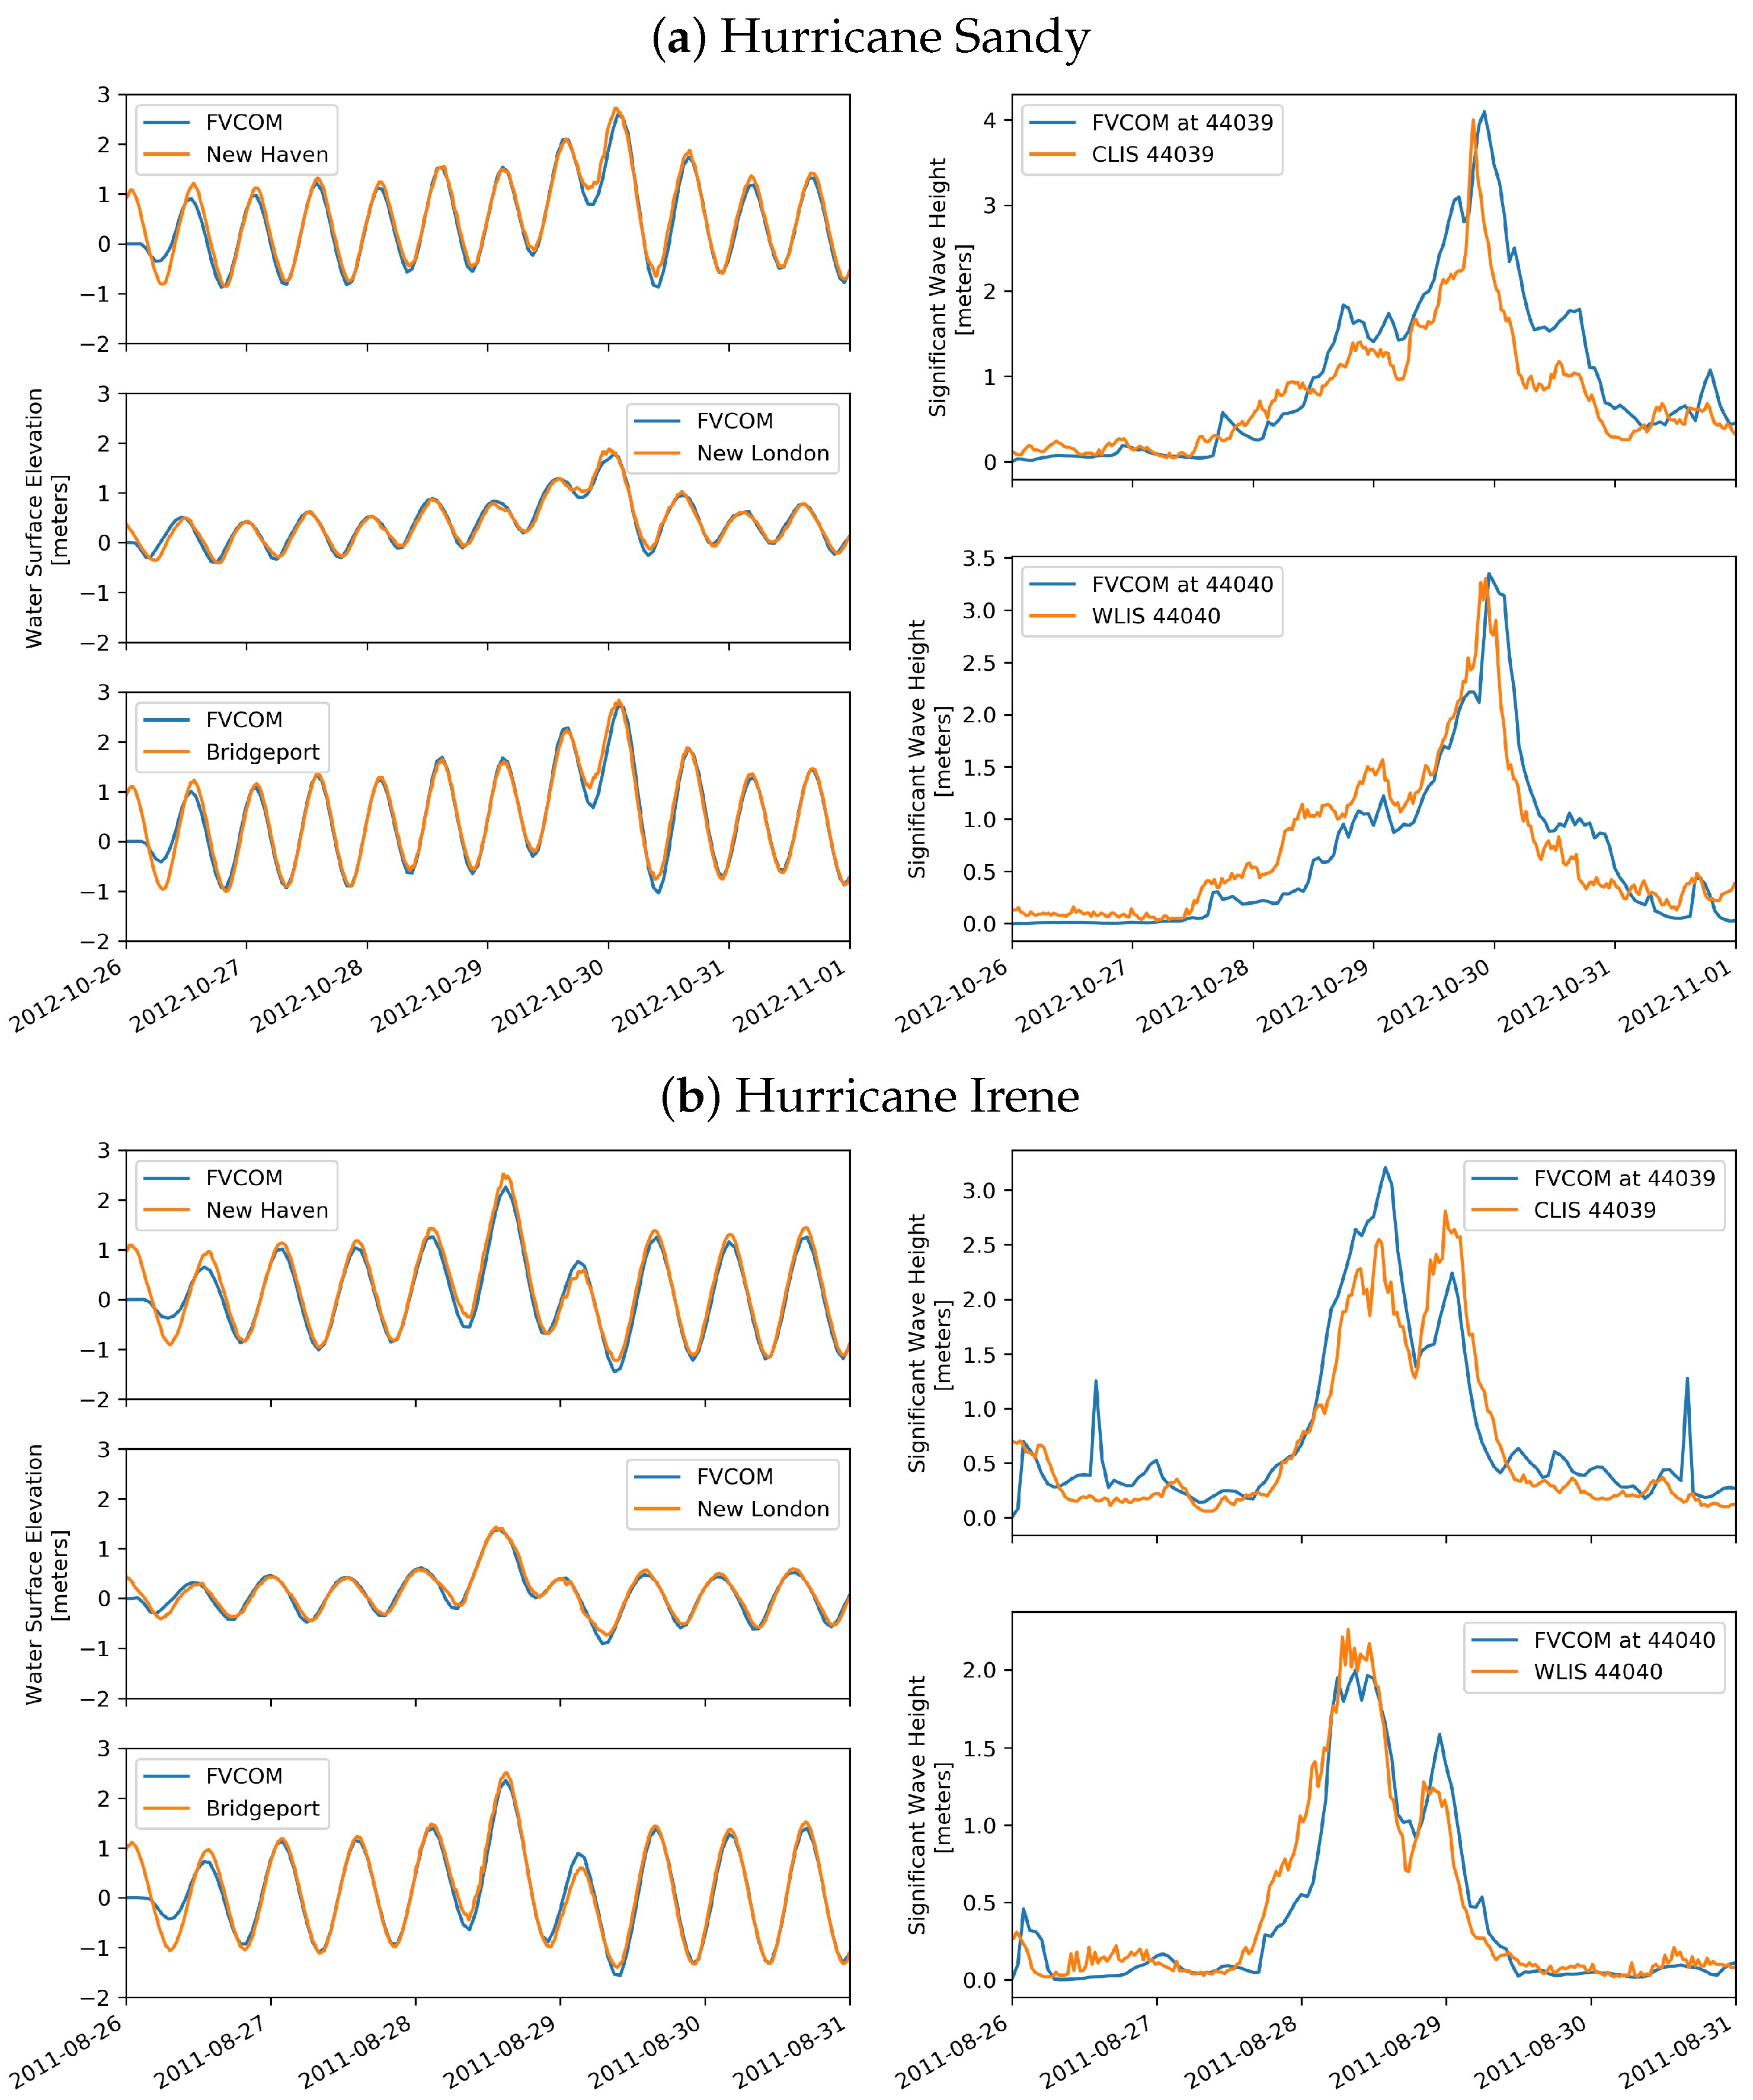
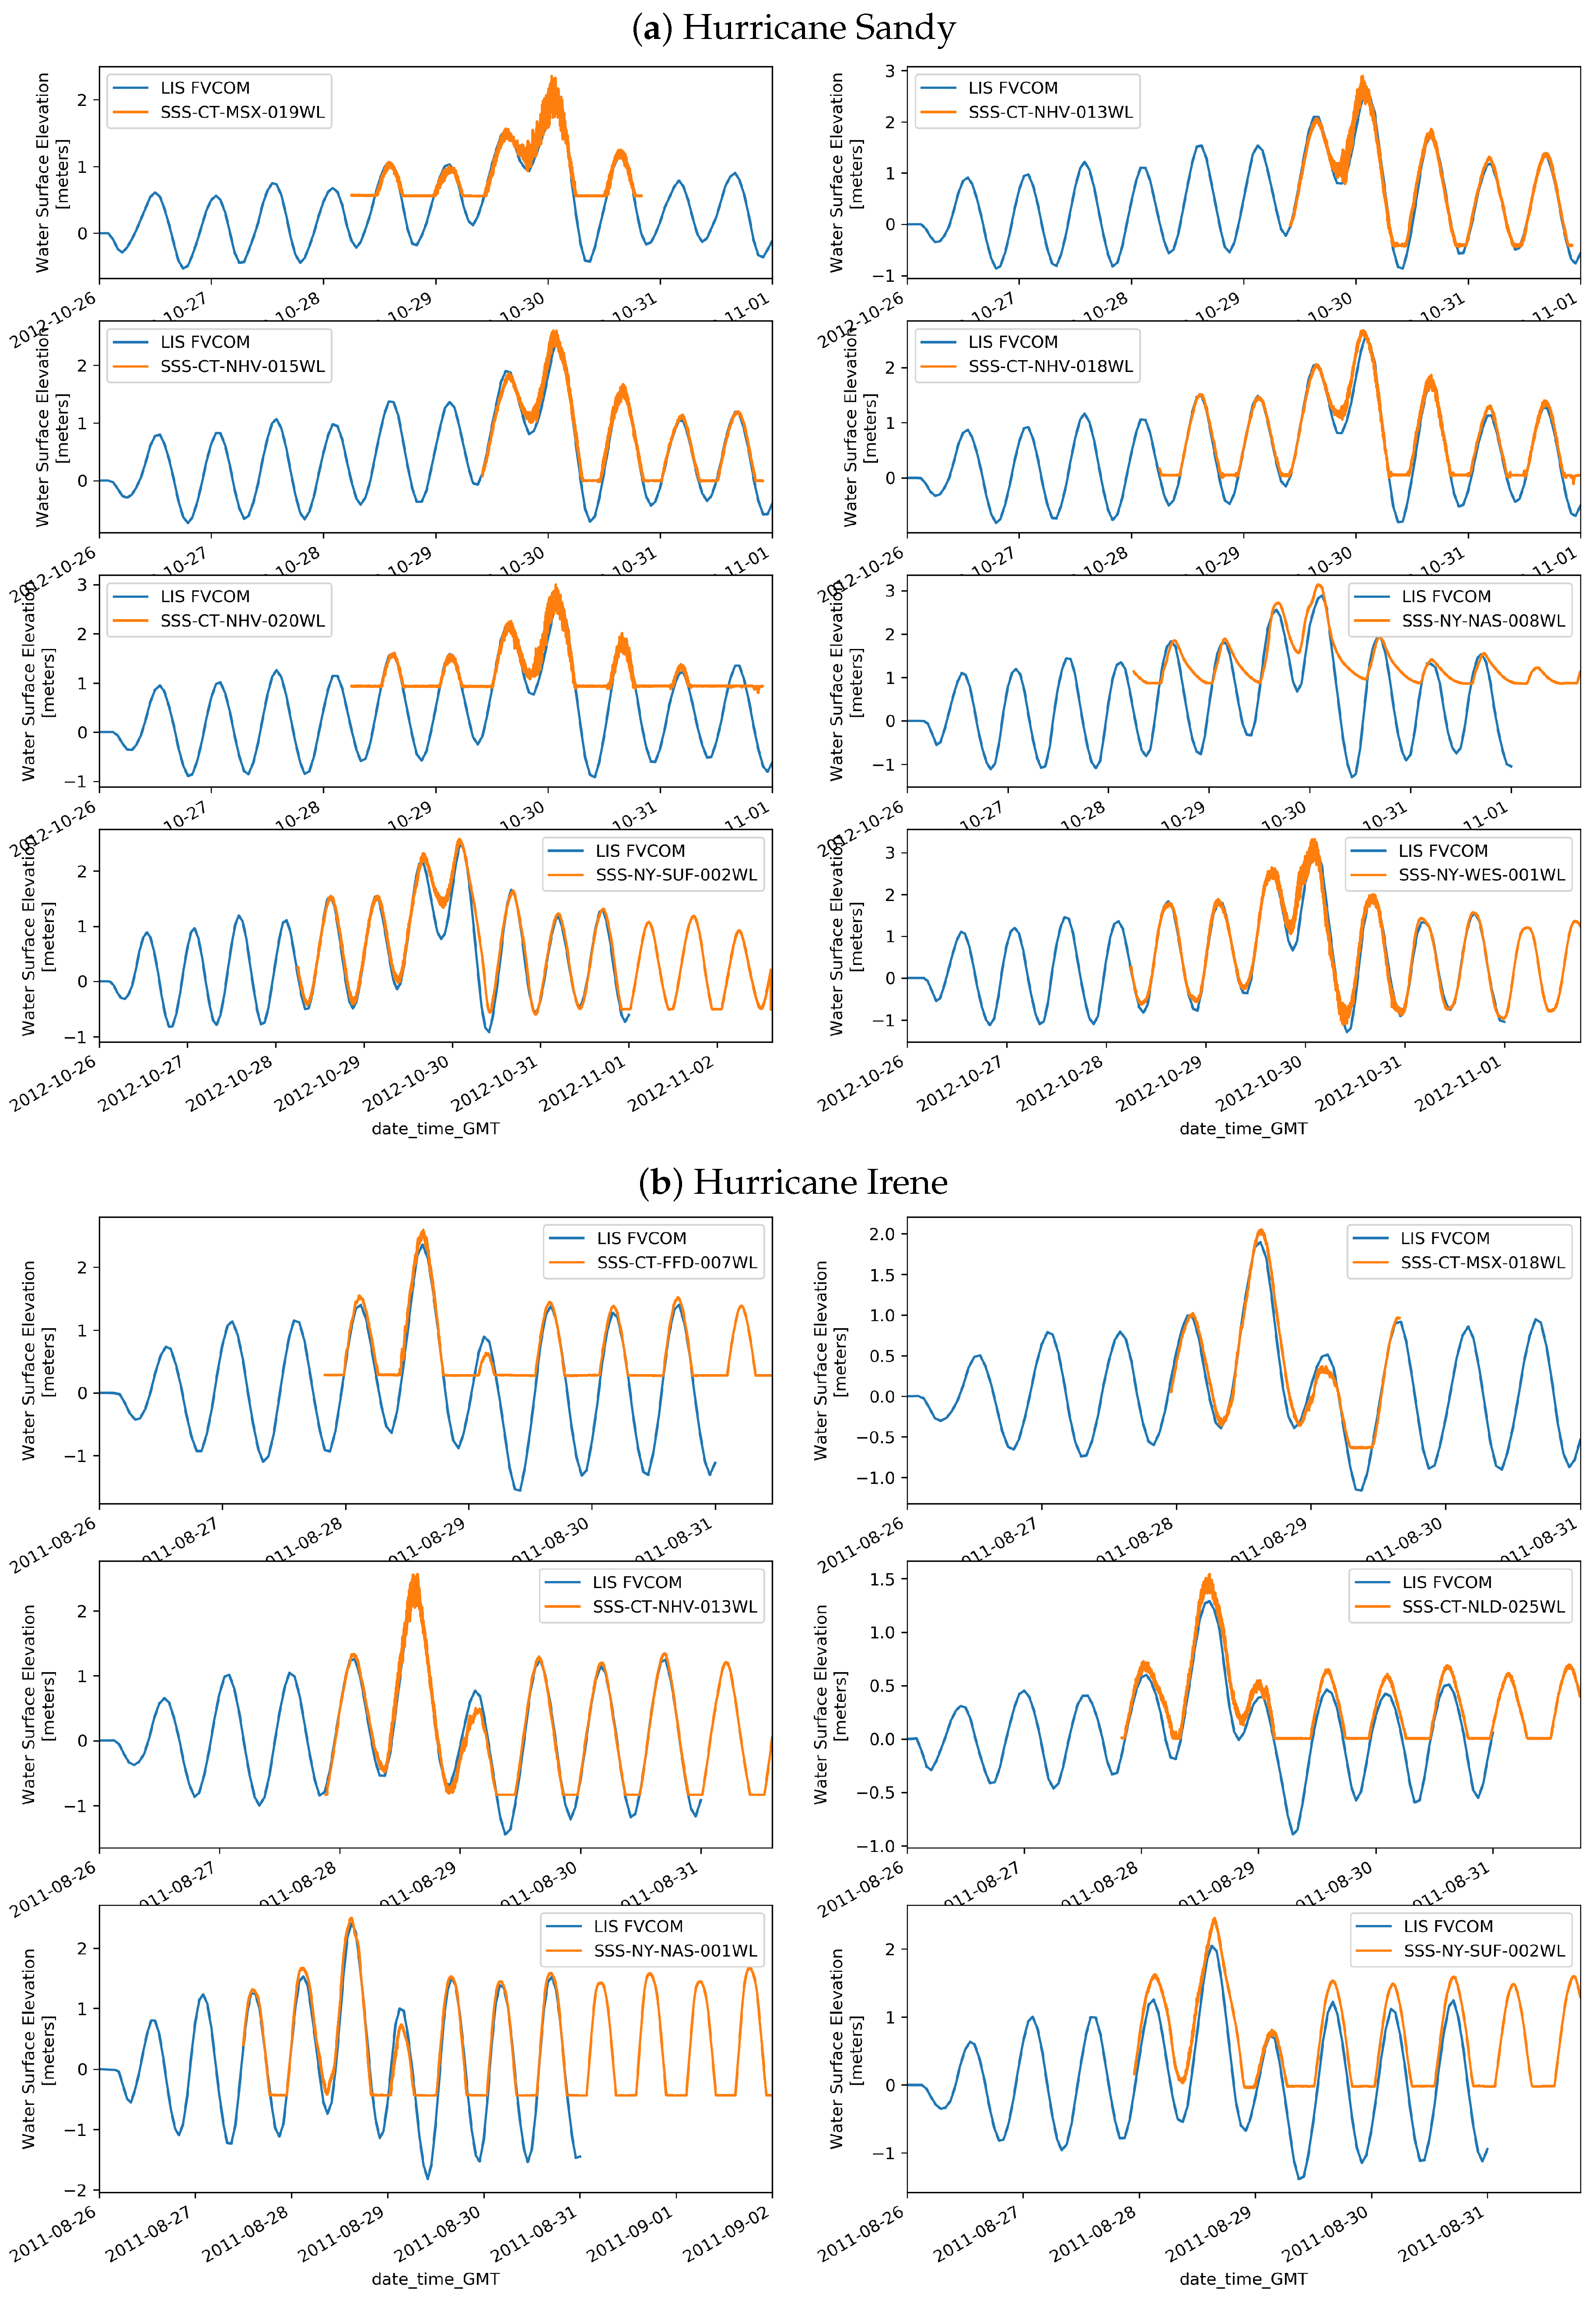
4.1. Validation of the Model
4.2. Selection of GPD Threshold
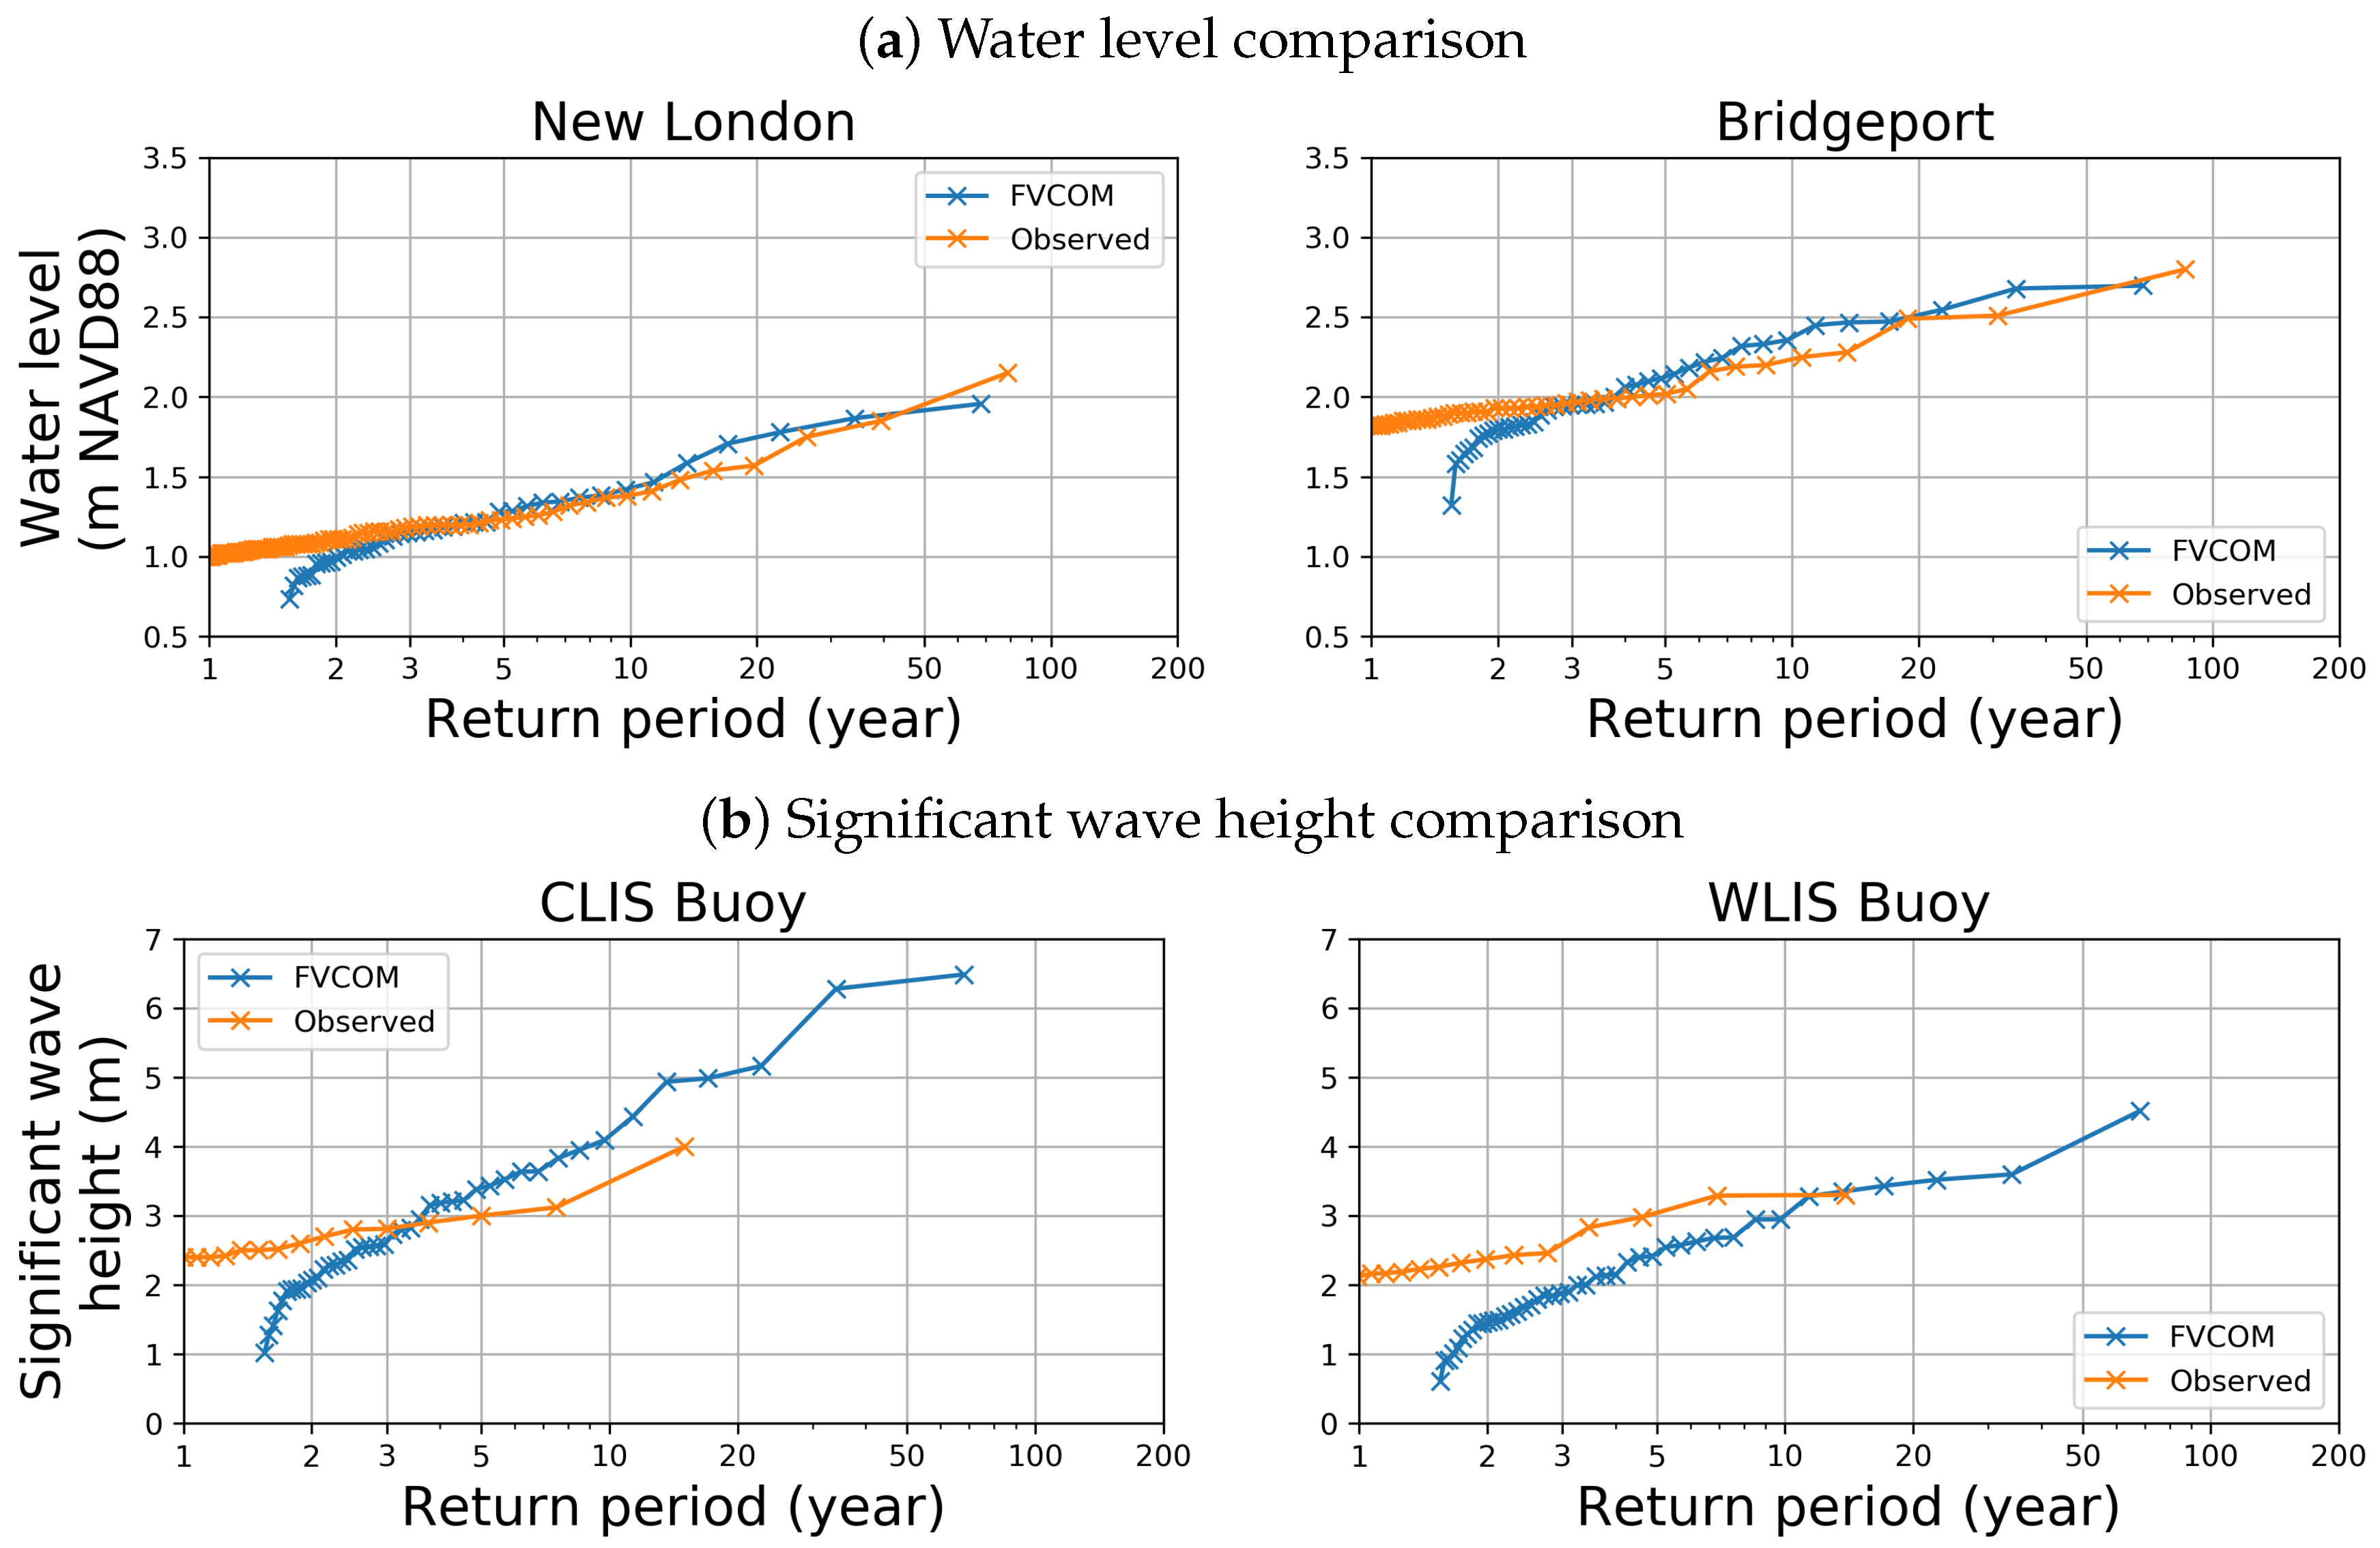
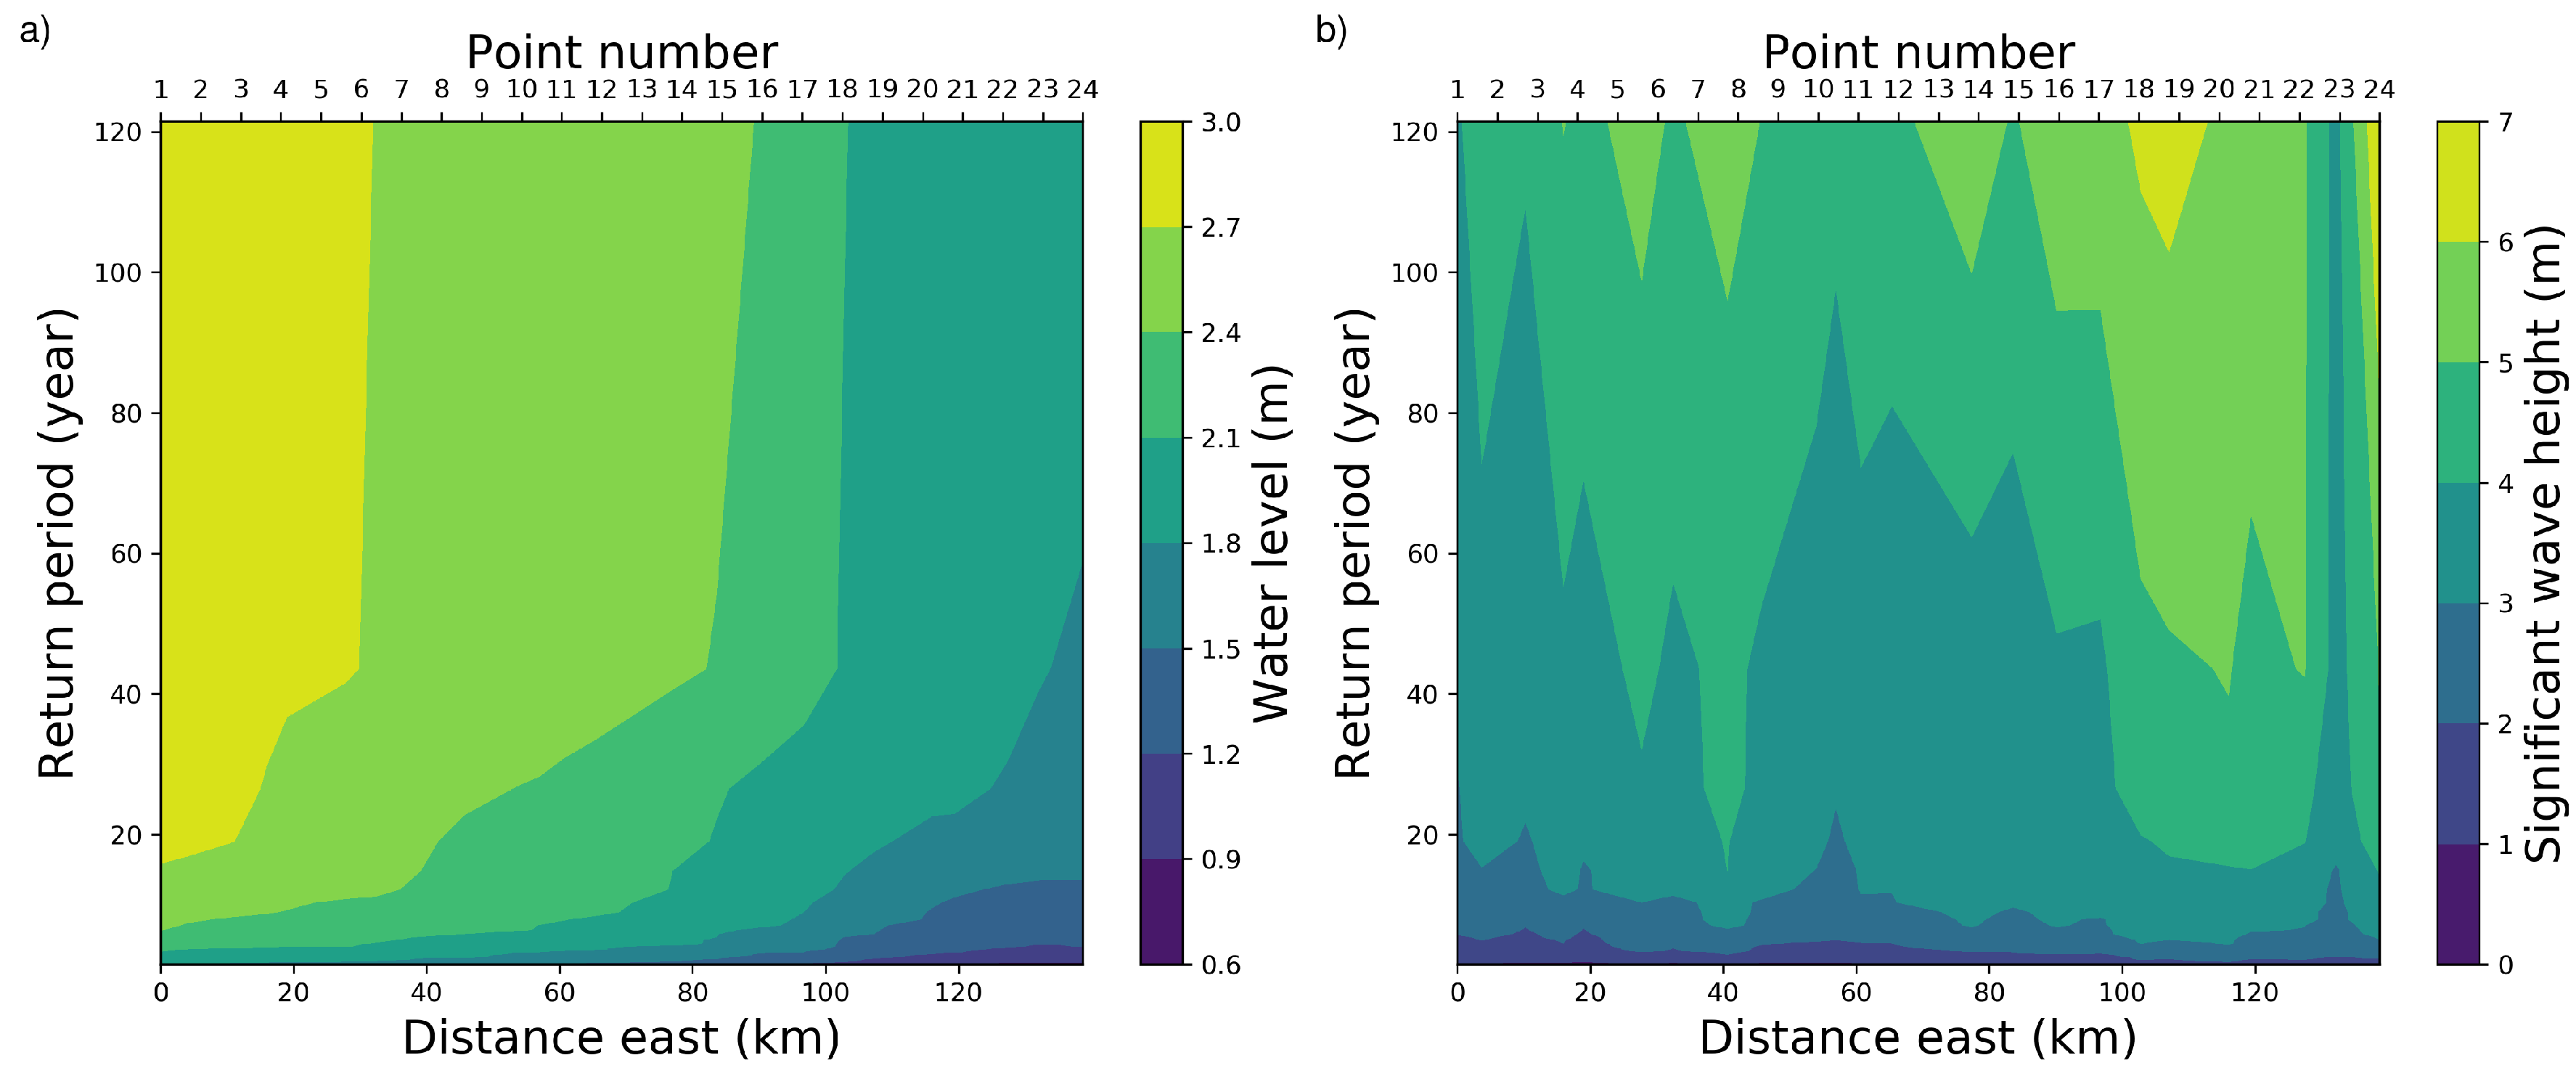
4.3. Annual Exceedance Probability Distributions
4.4. Wind Accuracy and Sensitivity
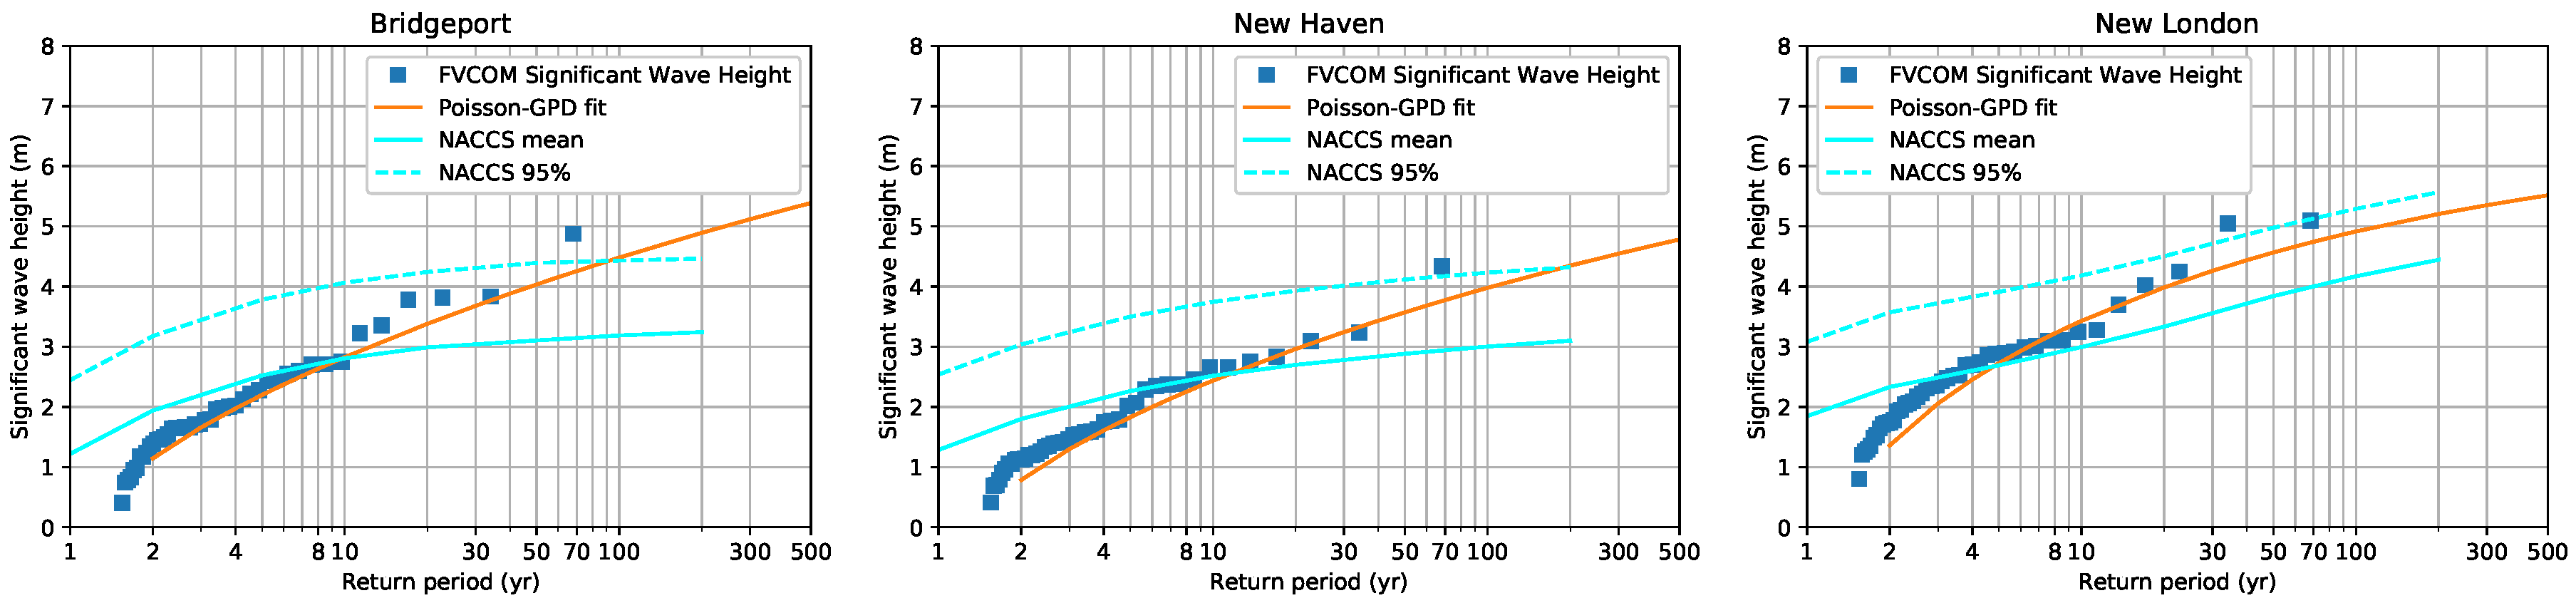
4.5. The Model Results Compared with NACCS and FEMA
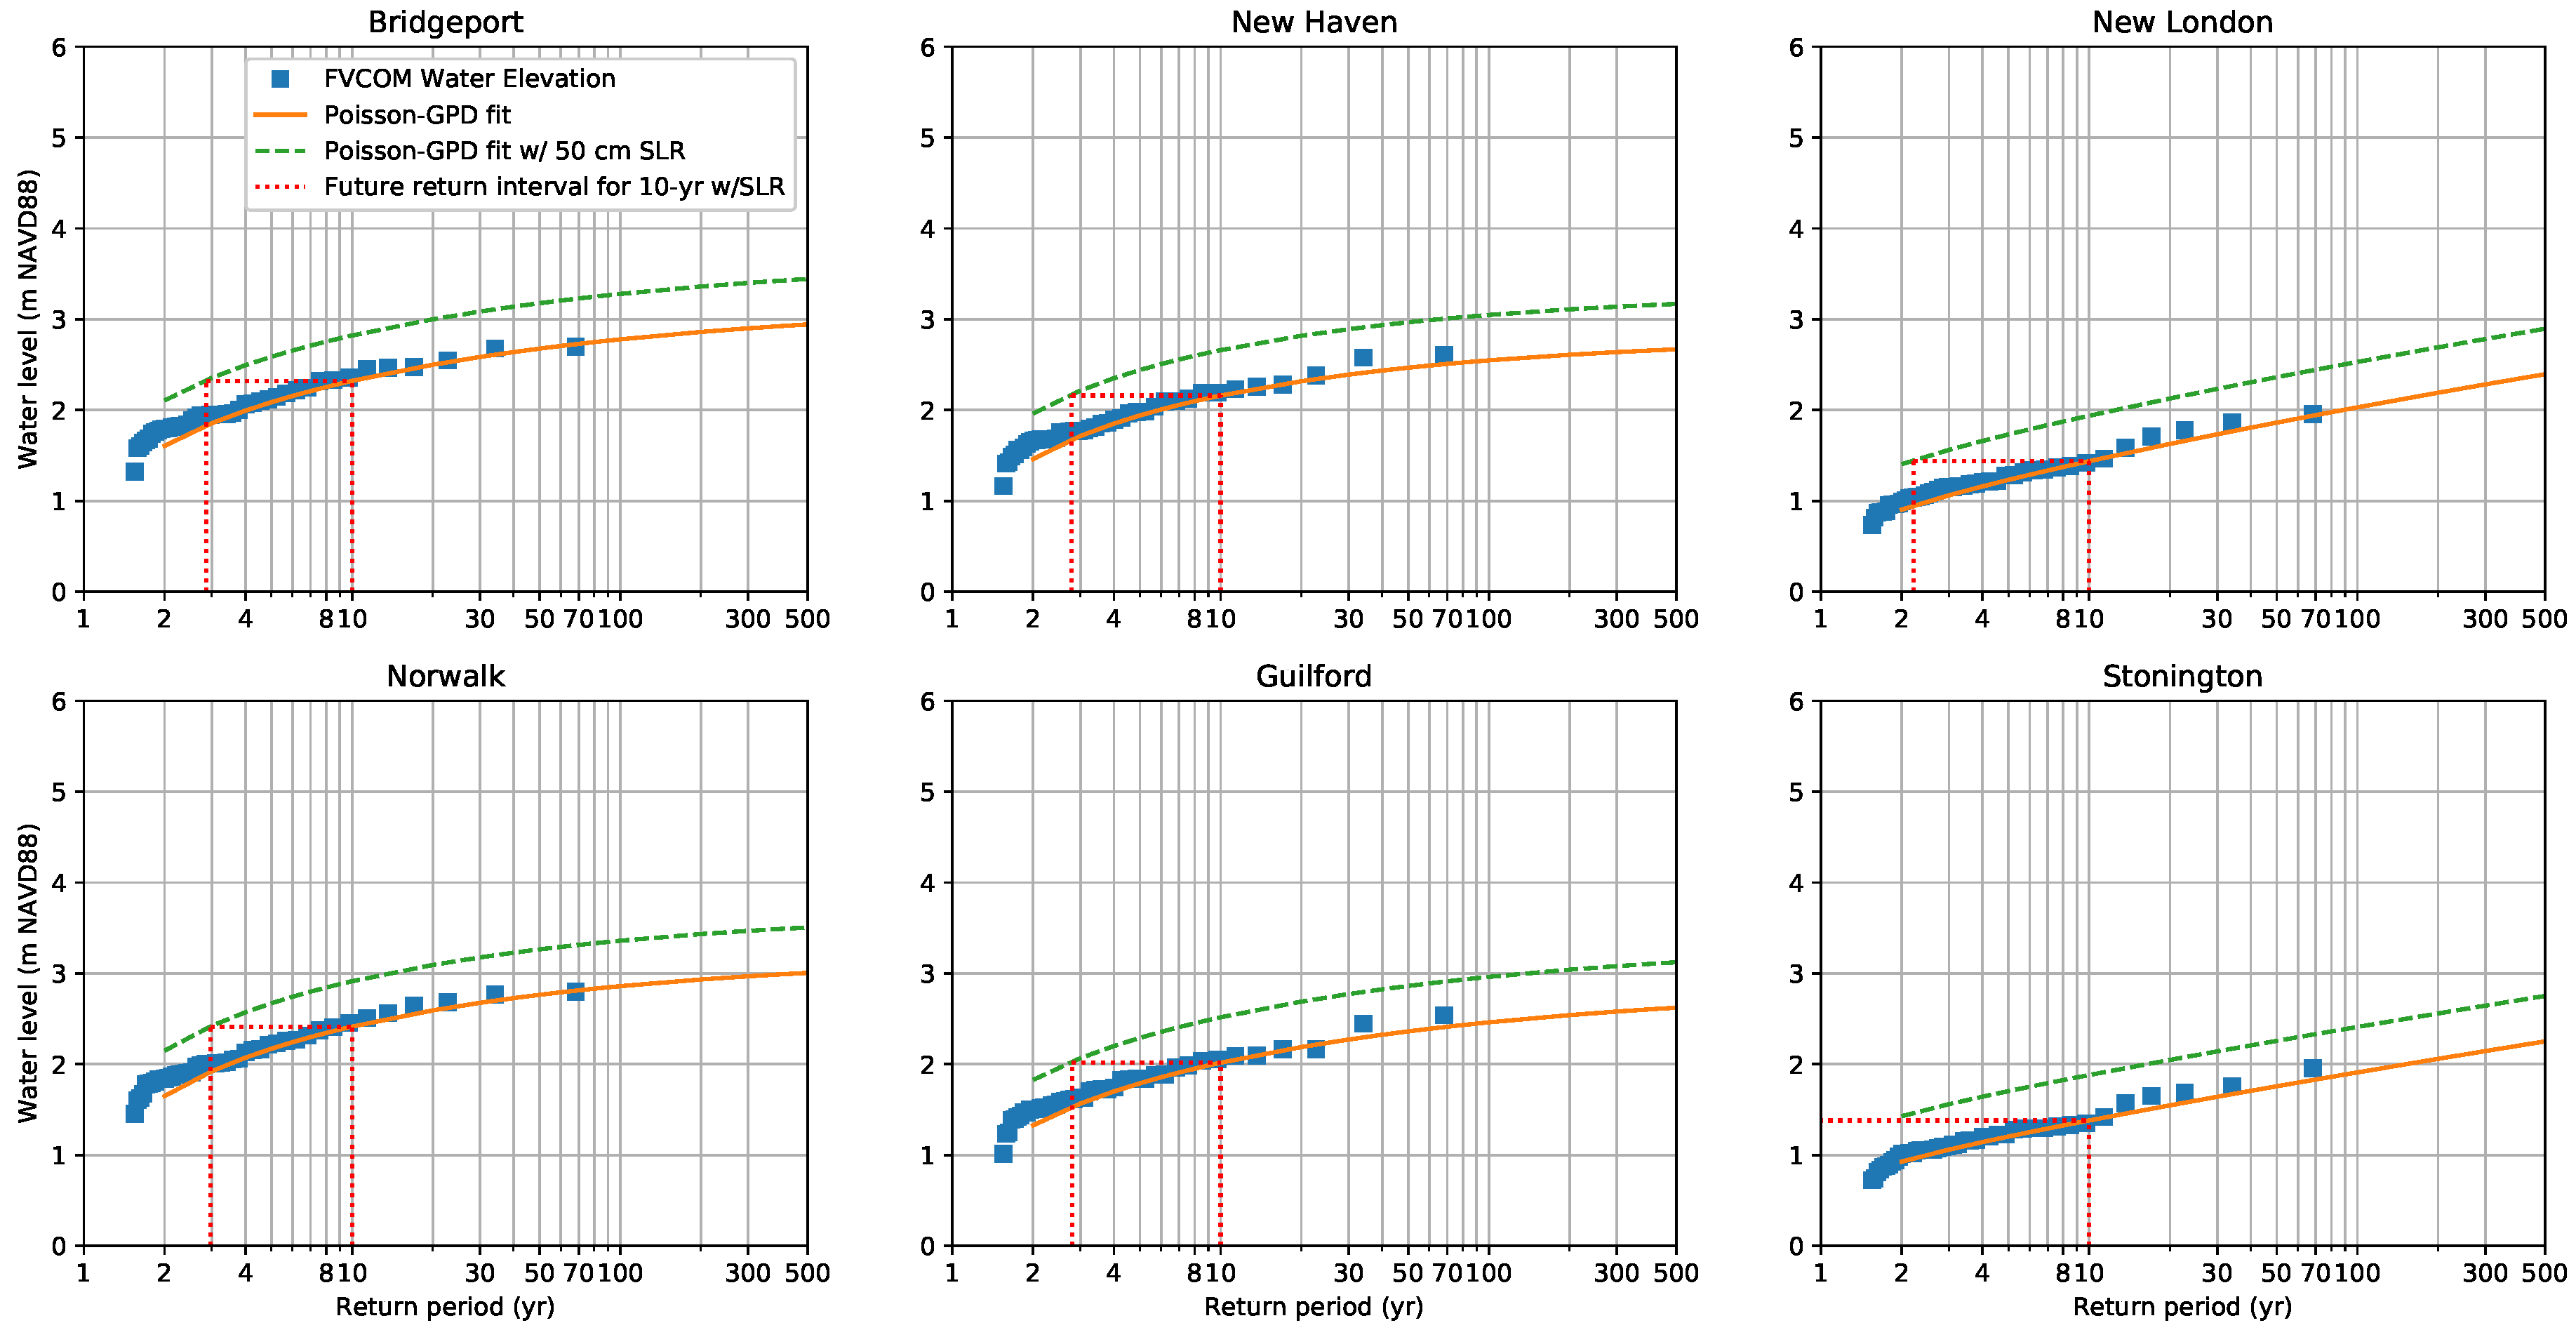
4.6. Sea Level Rise Projections
5. Conclusions
Supplementary Materials
Author Contributions
Funding
Acknowledgments
Conflicts of Interest
Appendix A. Water Level and Return Period Distribution Plots for All Connecticut Coastal Towns


Appendix B. Significant Wave Height and Return Period Distribution Plots for All Connecticut Coastal Towns


References
- Dixon, K. Sandy Storm Damage Tops $360M in State. Connecticut Post, 14 November 2012. Available online: https://www.ctpost.com/news/article/Sandy-storm-damage-tops-360M-in-state-4037538.php (accessed on 26 June 2020).
- Cooper, M.J.; Beevers, M.D.; Oppenheimer, M. The potential impacts of sea level rise on the coastal region of New Jersey, USA. Clim. Chang. 2008, 90, 475–492. [Google Scholar] [CrossRef]
- Kirshen, P.; Knee, K.; Ruth, M. Climate change and coastal flooding in Metro Boston: Impacts and adaptation strategies. Clim. Chang. 2008, 90, 453–473. [Google Scholar] [CrossRef]
- Hunter, J. A simple technique for estimating an allowance for uncertain sea-level rise. Clim. Chang. 2012, 113, 239–252. [Google Scholar] [CrossRef]
- Tebaldi, C.; Strauss, B.H.; Zervas, C.E. Modelling sea level rise impacts on storm surges along US coasts. Environ. Res. Lett. 2012, 7, 014032. [Google Scholar] [CrossRef]
- O’Donnell, J. Sea Level Rise in Connecticut; Technical Report; Connecticut Institute for Resilience & Climate Adaptation: Groton, CT, USA, 2013. [Google Scholar]
- Cialone, M.; Massey, T.; Anderson, M.; Grzegorzewski, A.; Jensen, R.; Cialone, A.; Mark, D.; Pevey, K.; Gunkel, B.; McAlpin, T. North Atlantic Coast Comprehensive Study (NACCS) Coastal Storm Model Simulations: Waves and Water Levels; Technical Report; Engineer Research and Development Center: Vicksburg, MS, USA, 2015. [Google Scholar]
- FEMA. Wave Height Analysis for Flood Insurance Studies; Technical Documentation for WHAFIS Program Version 3.0; Federal Emergency Management Agency: Washington, DC, USA, 1988.
- Nadal-Caraballo, N.C.; Melby, J.A. North Atlantic Coast Comprehensive Study Phase I: Statistical Analysis of Historical Extreme Water Levels with Sea Level Change. J. Coast. Res. 2015, 32, 35–45. [Google Scholar]
- Ho, F.P.; Myers, V.A. Joint Probability Method of Tide Frequency Analysis Applied to Apalachicola Bay and St. George Sound, Florida; Technical Report; National Weather Service: Washington, DC, USA, 1975. [Google Scholar]
- Resio, D.T.; Boc, S.J.; Borgman, L.; Cardone, V.; Cox, A.T.; Dally, W.R.; Dean, R.G.; Divoky, D.; Hirsh, E.; Irish, J.L.; et al. White Paper on Estimating Hurricane Inundation Probabilities; US Army Corps of Engineers: Vicksburg, MI, USA, 2007. [Google Scholar]
- Toro, G.R.; Resio, D.T.; Divoky, D.; Niedoroda, A.W.; Reed, C. Efficient joint-probability methods for hurricane surge frequency analysis. Ocean Eng. 2010, 37, 125–134. [Google Scholar] [CrossRef]
- Komen, G.J.; Cavaleri, L.; Donelan, M.; Hasselmann, K.; Hasselmann, S.; Janssen, P.A.E.M. Dynamics and Modelling of Ocean Waves; Cambridge University Press: Cambridge, UK, 1994; p. 532. [Google Scholar]
- Massey, T.C.; Anderson, M.E.; Smith, J.M.; Gomez, J.; Jones, R. STWAVE: Steady-State Spectral Wave Model User’s Manual for STWAVE, Version 6.0; Technical Report; US Army Engineer Research and Development Center: Vicksburg, MS, USA, September 2011. [Google Scholar]
- Luettich, R.A.; Westerink, J.J.; Scheffner, N.W. ADCIRC: An Advanced Three-Dimensional Circulation Model for Shelves, Coasts, and Estuaries; Technical Report; U.S. Army Engineer Research and Development Center: Vicksburg, MS, USA, 1992. [Google Scholar]
- Bilskie, M.V.; Hagen, S.C.; Medeiros, S.C.; Passeri, D.L. Dynamics of sea level rise and coastal flooding. Geophys. Res. Lett. 2014, 41, 927–934. [Google Scholar] [CrossRef]
- Lin, Y.; Fissel, D.B. High resolution 3-d finite-volume coastal ocean modeling in lower campbell river and discovery passage, British Columbia, Canada. J. Mar. Sci. Eng. 2014, 2, 209–225. [Google Scholar] [CrossRef]
- Kopp, R.E.; Horton, R.M.; Little, C.M.; Mitrovica, J.X.; Oppenheimer, M.; Rasmussen, D.J.; Strauss, B.H.; Tebaldi, C. Probabilistic 21st and 22nd century sea-level projections at a global network of tide-gauge sites. Earth’s Future 2014, 2, 383–406. [Google Scholar] [CrossRef]
- Pullen, T.; Allsop, N.W.H.; Bruce, T.; Kortenhaus, A.; Schüttrumpf, H.; van der Meer, J.W. EurOtop Wave Overtopping of Sea Defences and Related Structures: Assessment Manual; Technical Report 73; 2007. Available online: http://www.overtopping-manual.com/eurotop/downloads/ (accessed on 26 June 2020).
- O’Donnell, J.; Wilson, R.E.; Lwiza, K.; Whitney, M.; Bohlen, W.F.; Codiga, D.; Fribance, D.B.; Fake, T.; Bowman, M.; Varekamp, J. The Physical Oceanography of Long Island Sound. In Long Island Sound; Springer: New York, NY, USA, 2014; pp. 79–158. [Google Scholar] [CrossRef]
- O’Donnell, J.; O’Donnell, J.E. Coastal vulnerability in Long Island Sound: The spatial structure of extreme sea level statistics. In Proceedings of the OCEANS 2012 MTS/IEEE: Harnessing the Power of the Ocean, Hampton Roads, VA, USA, 14–19 October 2012; pp. 1–4. [Google Scholar] [CrossRef]
- Fribance, D.B.; Donnell, J.O.; Bohlen, W.F.; Houk, A. Tides and Overtides in Long Island Sound. J. Mar. Res. 2010, 68, 1–35. [Google Scholar] [CrossRef]
- NOAA. Tides and Currents. Available online: https://tidesandcurrents.noaa.gov/ (accessed on 26 June 2020).
- NOAA. National Data Buoy Center. Available online: https://www.ndbc.noaa.gov/ (accessed on 26 June 2020).
- NOAA National Center for Environmental Information. Local Climatological Data (LCD) Dataset. Available online: https://www.ncdc.noaa.gov/cdo-web/datatools/lcd (accessed on 26 June 2020).
- Northeastern Regional Association of Coastal Ocean Observing Systems. Long Island Sound Coastal Observatory. 1999. Available online: https://mysound.uconn.edu/ (accessed on 26 June 2020).
- Chen, C.; Beardsley, R.; Cowles, G. An Unstructured Grid, Finite-Volume Coastal Ocean Model (FVCOM) System. Oceanography 2006, 19, 78–89. [Google Scholar] [CrossRef]
- Qi, J.; Chen, C.; Beardsley, R.C.; Perrie, W.; Cowles, G.W.; Lai, Z. An unstructured-grid finite-volume surface wave model (FVCOM-SWAVE): Implementation, validations and applications. Ocean Model. 2009, 28, 153–166. [Google Scholar] [CrossRef]
- Booij, N.; Ris, R.C.; Holthuijsen, L.H. A third-generation wave model for coastal regions: 1. Model description and validation. J. Geophys. Res. Ocean. 1999, 104, 7649–7666. [Google Scholar] [CrossRef]
- Wu, L.; Chen, C.; Guo, P.; Shi, M.; Qi, J.; Ge, J. A FVCOM-based unstructured grid wave, current, sediment transport model, I. Model description and validation. J. Ocean Univ. China 2011, 10, 1–8. [Google Scholar] [CrossRef]
- O’Donnell, J.; McCardell, G.; Berger, L. Physical Oceanography of Eastern Long Island Sound Region: Modeling; Appendix C-2; Technical Report, Supplemental Environmental Impact Statement for the Designation of Dredged Material Disposal Sites in Eastern Long Island Sound, Connecticut and New York; University of Connecticut: Groron, CT, USA, 2016. [Google Scholar] [CrossRef]
- Cowles, G.W.; Lentz, S.J.; Chen, C.; Xu, Q.; Beardsley, R.C. Comparison of observed and model-computed low frequency circulation and hydrography on the New England Shelf. J. Geophys. Res. Ocean. 2008, 113. [Google Scholar] [CrossRef]
- Chen, C.; Huang, H.; Beardsley, R.C.; Xu, Q.; Limeburner, R.; Cowles, G.W.; Sun, Y.; Qi, J.; Lin, H. Tidal dynamics in the Gulf of Maine and New England Shelf: An application of FVCOM. J. Geophys. Res. Ocean. 2011, 116. [Google Scholar] [CrossRef]
- Chawla, A.; Spindler, D.; Tolman, H. WAVEWATCH III Hindcasts with Re-Analysis Winds. Initial Report on Model Setup; Technical Report, NOAA/NWS/NCEP/MMAB Tech. Note 291; U. S. Department of Commerce: Camp Springs, MD, USA, 2011.
- Spindler, D.; Chawla, A.; Tolman, H.L. An Initial Look at the CFSR Reanalysis Winds for Wave Modeling; Technical Report, NOAA/NWS/NCEP/MMAB Tech. Note 290; U. S. Department of Commerce: Camp Springs, MD, USA, 2011.
- Weibull, W. A Statistical Theory of the Strength of Materials; Handlingar/Ingeniörsvetenskapsakademien, Generalstabens Litografiska Anstalts Förlag: Stockholm, Sweden, 1939. [Google Scholar]
- Davison, A.C.; Smith, R.L. Models for Exceedances Over High Thresholds. J. R. Stat. Soc. Ser. B (Methodol.) 1990, 52, 393–425. [Google Scholar] [CrossRef]
- Brodtkorb, P.A.; Johannesson, P.; Lindgren, G.; Rychlik, I.; Ryden, J.; Sjo, E. WAFO—A Matlab toolbox for analysis of random waves and loads. In Proceedings of the International Offshore and Polar Engineering Conference, Seattle, WA, USA, 28 May–2 June 2000; Volume 3, pp. 343–350. [Google Scholar]
- Finkenstadt, B.; Rootzen, H. Extreme Values in Finance, Telecommunications, and the Environment; Chapman & Hall/CRC Monographs on Statistics & Applied Probability; Taylor & Francis: Oxford, UK, 2003. [Google Scholar]
- Silva, A.T.; Naghettini, M.; Portela, M.M. On some aspects of peaks-over-threshold modeling of floods under nonstationarity using climate covariates. Stoch. Environ. Res. Risk Assess. 2015, 30, 207–224. [Google Scholar] [CrossRef]
- Makkonen, L. Plotting Positions in Extreme Value Analysis. J. Appl. Meteorol. Climatol. 2006, 45, 334–340. [Google Scholar] [CrossRef]
- Hanna, S.R.; Heinold, D.W. Development and Application of a Simple Method for Evaluating Air Quality Models; Number 4409; American Petroleum Institute: Washington, DC, USA, 1985. [Google Scholar]
- Willmott, C.J. On the validation of models. Phys. Geogr. 1981, 2, 184–194. [Google Scholar] [CrossRef]
- Cunnane, C. A note on the Poisson assumption in partial duration series models. Water Resour. Res. 1979, 15, 489–494. [Google Scholar] [CrossRef]
- Northeast Regional Ocean Council. NACCS Coastal Storm and Flood Risk Data. Available online: https://cdm16021.contentdm.oclc.org/digital/collection/p16021coll10/id/9411 (accessed on 26 June 2020).
- Kalnay, E.; Kanamitsu, M.; Kistler, R.; Collins, W.; Deaven, D.; Gandin, L.; Iredell, M.; Saha, S.; White, G.; Woollen, J.; et al. The NCEP/NCAR 40-Year Reanalysis Project. Bull. Am. Meteorol. Soc. 1996, 77, 437–471. [Google Scholar] [CrossRef]
- Mesinger, F.; DiMego, G.; Kalnay, E.; Mitchell, K.; Shafran, P.C.; Ebisuzaki, W.; Jović, D.; Woollen, J.; Rogers, E.; Berbery, E.H.; et al. North American Regional Reanalysis. Bull. Am. Meteorol. Soc. 2006, 87, 343–360. [Google Scholar] [CrossRef]
- Garvine, R.W. A simple model of estuarine subtidal fluctuations forced by local and remote wind stress. J. Geophys. Res. 1985, 90, 11945. [Google Scholar] [CrossRef]
- Wong, K.C. Sea Level Variability in Long Island Sound. Estuaries 1990, 13, 362. [Google Scholar] [CrossRef]
- Whitney, M.M.; Codiga, D.L. Response of a Large Stratified Estuary to Wind Events: Observations, Simulations, and Theory for Long Island Sound. J. Phys. Oceanogr. 2011, 41, 1308–1327. [Google Scholar] [CrossRef]
- IPCC. IPCC Climate Change 2014: Synthesis Report. Contribution of Working Groups I, II and III to the Fifth Assessment Report of the Intergovernmental Panel on Climate Change; Technical Report; Pachauri, R.K., Meyer, L.A., Eds.; IPCC: Geneva, Switzerland, 2014. [Google Scholar] [CrossRef]


| Station Name | Agency | Station Number | Latitude ( N) | Longitude ( W) | Record Starting Year |
|---|---|---|---|---|---|
| Kings Point | NOAA | 8516945 | 40.81 | 73.765 | 1998 |
| Bridgeport | NOAA | 8467150 | 41.173 | 73.182 | 1970 |
| New Haven | NOAA | 8465705 | 41.283 | 72.908 | 1999 |
| New London | NOAA | 8461490 | 41.355 | 72.087 | 1938 |
| Montauk | NOAA | 8510560 | 41.048 | 71.765 | 1947 |
| Execution Rocks (EXRX) | UConn | 44022 | 40.956 | 73.580 | 2004 |
| Western LIS (WLIS) | UConn | 44040 | 40.956 | 73.580 | 2004 |
| Central LIS (CLIS) | UConn | 44039 | 41.138 | 72.655 | 2004 |
| Ledge Light | UConn | LDLC3 | 41.306 | 72.077 | 2004 |
| No. | Date | Storm Type and Name | No. | Date | Storm Type and Name |
|---|---|---|---|---|---|
| 1 | 25 Nov 1950 | Extratropical | 23 | 4 Feb 1995 | Extratropical |
| 2 | 7 Nov 1953 | Extratropical | 24 | 20 Mar 1996 | Extratropical |
| 3 | 31 Aug 1954 | Tropical (Hurricane Carol) | 25 | 19 Oct 1996 | Extratropical |
| 4 | 16 Feb 1958 | Extratropical | 26 | 21 Aug 1997 | Extratropical |
| 5 | 19 Feb 1960 | Extratropical | 27 | 6 Nov 2002 | Extratropical |
| 6 | 12 Sep 1960 | Tropical (Hurricane Donna) | 28 | 16 Dec 2005 | Extratropical |
| 7 | 12 Nov 1968 | Extratropical | 29 | 28 Oct 2006 | Extratropical |
| 8 | 5 Apr 1973 | Extratropical | 30 | 16 Apr 2007 | Extratropical |
| 9 | 10 Jan 1977 | Extratropical | 31 | 12 Dec 2008 | Extratropical |
| 10 | 9 Jan 1978 | Extratropical | 32 | 14 Mar 2010 | Extratropical |
| 11 | 7 Feb 1978 | Extratropical | 33 | 27 Dec 2010 | Extratropical |
| 12 | 25 Dec 1978 | Extratropical | 34 | 17 Apr 2011 | Extratropical |
| 13 | 25 Oct 1980 | Extratropical | 35 | 28 Aug 2011 | Tropical (Hurricane Irene) |
| 14 | 29 Mar 1984 | Extratropical | 36 | 12 Jan 2012 | Extratropical |
| 15 | 27 Sep 1985 | Tropical (Hurricane Gloria) | 37 | 5 Jun 2012 | Extratropical |
| 16 | 23 Jan 1987 | Extratropical | 38 | 30 Oct 2012 | Tropical (Hurricane Sandy) |
| 17 | 22 Oct 1988 | Extratropical | 39 | 27 Dec 2012 | Extratropical |
| 18 | 19 Aug 1991 | Tropical (Hurricane Bob) | 40 | 14 Mar 2017 | Extratropical |
| 19 | 31 Oct 1991 | Extratropical | 41 | 30 Oct 2017 | Extratropical |
| 20 | 11 Dec 1992 | Extratropical | 42 | 2 Mar 2018 | Extratropical |
| 21 | 13 Mar 1993 | Extratropical | 43 | 27 Oct 2018 | Extratropical |
| 22 | 24 Dec 1994 | Extratropical | 44 | 16 Nov 2018 | Extratropical |
| Direction bins | 24 |
| Frequency bins | 24 |
| Minimum frequency (Hz) | 0.05 |
| Maximum frequency (Hz) | 0.5 |
| Wind input | Komen formulation |
| Cavaleri and Malanottee’s wave growth term | Activated, a = 0.0015 |
| Quadruplet nonlinear interactions | Activated |
| Triad nonlinear interactions | Deactivated |
| White capping dissipation | Komen formulation |
| Bottom friction | JONSWAP |
| Station Name | Absolute Error | RMSE | R | Scatter Index | Standard Error | HH Index | Willmott Score |
|---|---|---|---|---|---|---|---|
| Bridgeport | 0.133 | 0.165 | 0.713 | 0.0826 | 0.086 | 0.083 | 0.915 |
| New Haven | 0.146 | 0.146 | 0.777 | 0.0685 | 0.101 | 0.077 | 0.919 |
| New London | 0.123 | 0.150 | 0.721 | 0.1225 | 0.088 | 0.123 | 0.920 |
| Total | 0.127 | 0.155 | 0.891 | 0.0920 | 0.034 | 0.092 | 0.971 |
| Return Period | Bridgeport | New Haven | New London | |||
|---|---|---|---|---|---|---|
| Year | h (m) | Hs (m) | h (m) | Hs (m) | h (m) | Hs (m) |
| 10 | 2.32 | 2.83 | 2.16 | 2.44 | 1.44 | 3.43 |
| 30 | 2.58 | 3.68 | 2.39 | 2.24 | 1.73 | 4.26 |
| 50 | 2.68 | 4.03 | 2.47 | 3.57 | 1.86 | 4.56 |
| 100 | 2.78 | 4.48 | 2.55 | 3.98 | 2.03 | 4.91 |
| Town | Water Level of Current 10-Year Storm (M) | Return Period with 50 Cm Sea Level Rise (Years) |
|---|---|---|
| Bridgeport | 2.32 | 2.86 |
| New Haven | 2.16 | 2.78 |
| New London | 1.44 | 2.21 |
| Norwalk | 2.41 | 2.97 |
| Guilford | 2.02 | 2.79 |
| Stonington | 1.38 | <2 |
© 2020 by the authors. Licensee MDPI, Basel, Switzerland. This article is an open access article distributed under the terms and conditions of the Creative Commons Attribution (CC BY) license (http://creativecommons.org/licenses/by/4.0/).
Share and Cite
Liu, C.; Jia, Y.; Onat, Y.; Cifuentes-Lorenzen, A.; Ilia, A.; McCardell, G.; Fake, T.; O’Donnell, J. Estimating the Annual Exceedance Probability of Water Levels and Wave Heights from High Resolution Coupled Wave-Circulation Models in Long Island Sound. J. Mar. Sci. Eng. 2020, 8, 475. https://doi.org/10.3390/jmse8070475
Liu C, Jia Y, Onat Y, Cifuentes-Lorenzen A, Ilia A, McCardell G, Fake T, O’Donnell J. Estimating the Annual Exceedance Probability of Water Levels and Wave Heights from High Resolution Coupled Wave-Circulation Models in Long Island Sound. Journal of Marine Science and Engineering. 2020; 8(7):475. https://doi.org/10.3390/jmse8070475
Chicago/Turabian StyleLiu, Chang, Yan Jia, Yaprak Onat, Alejandro Cifuentes-Lorenzen, Amin Ilia, Grant McCardell, Todd Fake, and James O’Donnell. 2020. "Estimating the Annual Exceedance Probability of Water Levels and Wave Heights from High Resolution Coupled Wave-Circulation Models in Long Island Sound" Journal of Marine Science and Engineering 8, no. 7: 475. https://doi.org/10.3390/jmse8070475
APA StyleLiu, C., Jia, Y., Onat, Y., Cifuentes-Lorenzen, A., Ilia, A., McCardell, G., Fake, T., & O’Donnell, J. (2020). Estimating the Annual Exceedance Probability of Water Levels and Wave Heights from High Resolution Coupled Wave-Circulation Models in Long Island Sound. Journal of Marine Science and Engineering, 8(7), 475. https://doi.org/10.3390/jmse8070475