1. Introduction
Submerged breakwaters generally refer to breakwaters immersed in water. Broadly speaking, a half-tide breakwater whose crest elevation falls between high and low tidal levels can also be called a submerged breakwater [
1]. The submerged breakwaters perform a series of roles, such as wave dissipation, current regulation, and sediment retaining, and are extensively applied in port and coastal engineering [
2]. To prevent shoreline erosion, they are generally arranged parallel to the shore within or just seaward of the surf zone for weakening waves, which are also widely perceived to be capable of preventing loss of beach amenity or negative aesthetic impact [
3]. In coastal reclamation, they must meet the demand of sedimentation acceleration. It is an alternative way that the two ends of the parallel-shoreline breakwater are connected to the shore by oblique submerged groynes, creating a quadrilateral enclosed area adjacent to the shoreline [
4]. In harbor channel engineering, they mainly play the role of maintaining calm waves and preventing sediment siltation. At the harbor entrance, they are often adopted to regulate flow and optimize flow pattern [
5,
6].
So far, several studies have explored the effects of submerged breakwaters on hydrodynamics. These studies mainly focused on wave-related contents, such as wave transformation, wave overtopping rate, reflection-transmission coefficient, interactions between waves and submerged breakwater structures, and complex flow fields [
7,
8,
9,
10,
11,
12]. Studies on sediments mainly focus on three aspects: beach nourishment, sedimentation promotion, and breakwater-front erosion and sedimentation [
4,
13,
14]. However, sedimentation prevention and reduction for harbor channels have not been widely studied. A review of existing literature related to this topic is given in the following.
Kadib [
5] assumed that the submerged breakwaters can completely retain the sediments in water bodies below the breakwater crest, and proposed a formula for calculating sedimentation reduction caused by the submerged breakwaters and an economic evaluation method for determining the heights of submerged breakwaters. Based on analyzing the Suez Canal data over several years, Kadib found that the submerged breakwaters could significantly reduce channel sedimentation. According to Pan [
2], “The sediment-retaining effect of submerged breakwaters applies to bed load sediments,” but, “In the case of suspended load sediments, they have little sediment control effect.” Cao [
15] analyzed the sediment siltation data collected in the trial excavation of Kumamoto Port in Japan. The authors evaluated the sedimentation prevention benefits of submerged breakwaters along silty-muddy coasts, and claimed that the breakwaters could result in satisfactory benefits in the presence of fluid mud and bottom mud. After analyzing the protective effect of the submerged breakwaters of Semen Tuban Port in Indonesia, Irie [
16] pointed out that building submerged breakwaters along silty coasts could effectively block sediment transport under strong winds, and suggested in-depth research in this field. In recent years, submerged breakwaters have been adopted to overcome channel sediment siltation problems of several coastal ports in Bohai Bay, Laizhou Bay, and North Jiangsu Province of China. For example, breakwaters in Weifang Port in Laizhou Bay have significant channel protection effects; they are composed of half-tide breakwaters and fully submerged breakwaters [
17]. The protected inner channels and unprotected outer channels have annual average sedimentation thickness values of 0.28 and 0.62 m, respectively. It is evident that most existing studies and engineering practices have confirmed that a rational layout of submerged breakwaters can achieve satisfactory sedimentation prevention and reduction.
At first, submerged breakwaters were adopted for sediment control because they could lower engineering costs. Recently, with the increasing importance attached to environmental protection, submerged breakwaters have received significant attention because they are capable of maximally maintaining the original hydrodynamic environment characteristics of sea areas. However, lowering engineering costs and alleviating environmental impacts, and reducing sedimentation at the same time, are conflicting requirements. Generally, lower submerged breakwaters, while capable of reducing engineering costs and alleviating environmental impacts, have limited sedimentation reduction performance. Thus, an appropriate height of submerged breakwaters is the first and most important problem to be solved. Based on the flume experiment, Pang et al. [
18] explored the retaining effects of submerged breakwaters with different heights against fluid mud under currents. The authors concluded that satisfactory sedimentation reduction could be achieved under a submerged breakwater height/natural water depth ratio of 0.2–0.5 on muddy coasts.
To further deal with the aforementioned conflicting requirements, a few researchers have turned their attention to the section shapes of submerged breakwaters, envisaging selecting the shapes that have better sediment-retention for submerged breakwaters at the same height. Using physical models, Irie et al. [
19] studied the retaining performances of submerged breakwaters with three different section shapes, vertical, trapezoid, and droplet, against fluid mud under the independent actions of waves and currents. The authors discovered that the trapezoid-shaped and droplet-shaped breakwaters performed better than the vertical submerged breakwaters.
Huanghua Port is located on a silty coast in Bohai Bay of China. Its channels suffer from sudden siltation in windy days. Two half-tide breakwaters up to −6 m isobath were built to prevent suspended sediment deposition in the channel. According to Yang [
20], the siltation of the protected channel is 56%–68% less than that without submerged breakwaters under the action of 10 year return period wind. The breakwaters need to been extended to −8m isobath for the port development. In this study, we investigate the effectiveness of the design scheme with fully submerged breakwaters under the combined action of waves and currents by flume experiments, and further discuss another question from the designer: what is the difference between the sediment-retaining performances of breakwaters with different armor layers.
2. Sedimentation Reduction Mechanism of Submerged Breakwaters and Experimental Principles
Due to diffusive effects of turbulent currents, both momentum and sediment particles are exchanged between different flow layers. When the upward fluctuating velocity of currents is stronger than the settling rate of particles, the sediments may move in suspended mode [
20]. Turbulences mainly come from the bed surface either under the independent or combined actions of waves and tidal currents. Given that the suspended sediments also come from the bed surface, the sediment concentration is usually low at the top and high at the bottom. In coast and estuary regions, strong waves often cause active sediment movement, and near-bottom water bodies usually have high-concentration sediment layers, which have a special name, fluid mud, on muddy coasts [
21,
22]. Submerged breakwaters can prevent the high-concentration sediments from entering channels to play the role of reducing sediment deposition in channels.
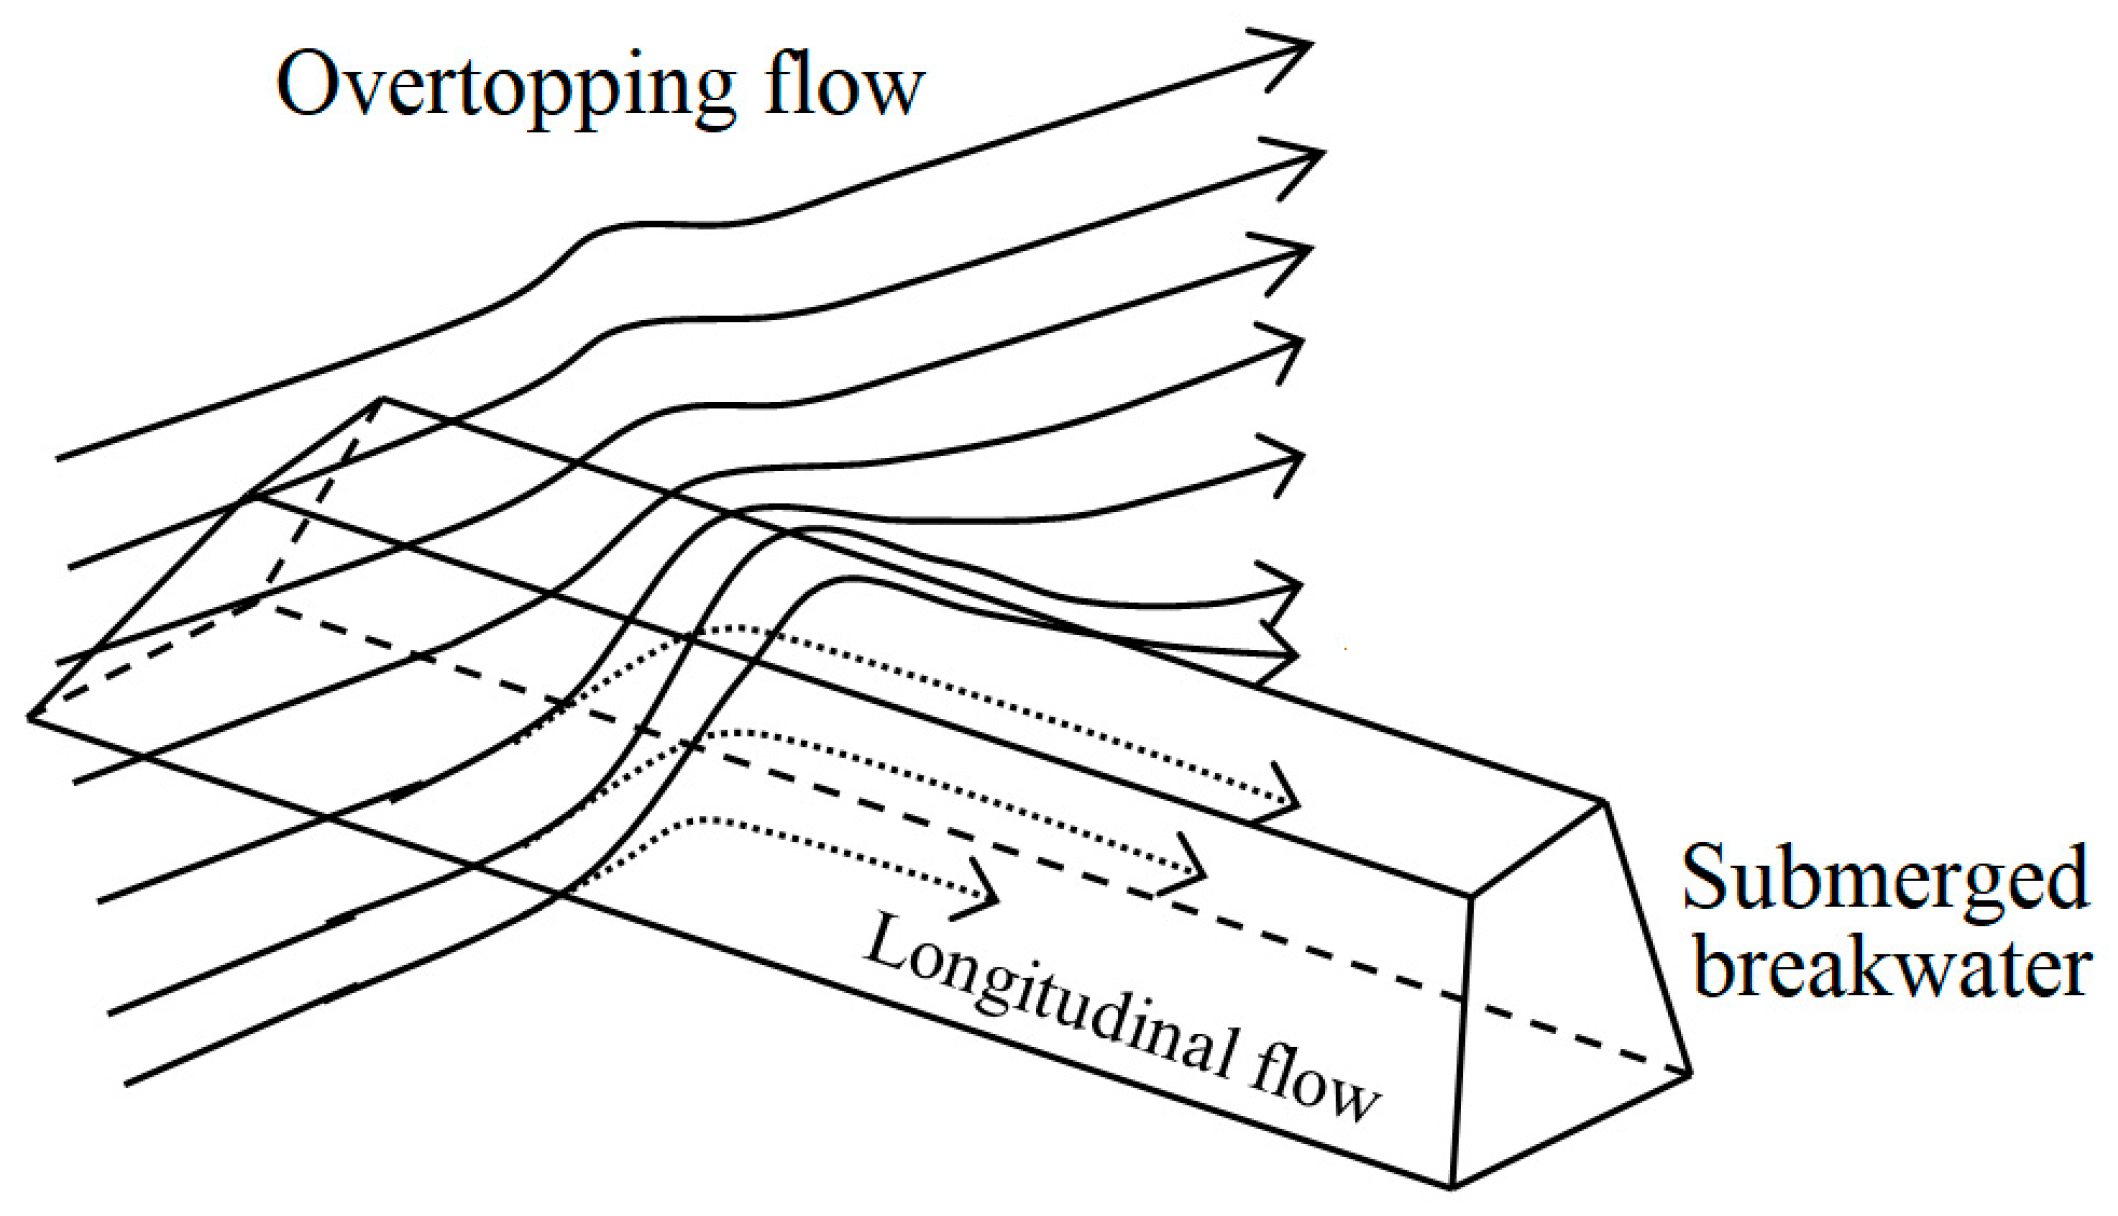
The submerged breakwaters can “retain” moving sediments by two approaches: (1) to lower hydrodynamic intensity, promote deposition, and diminish sediment concentration; (2) to rely on the water-blocking effect to change the direction of current flow, as shown in
Figure 1. The second approach forms currents along the breakwater to modify the direction of sediment movement and reduce the total amount of crossing sediments. Thus, the sediment-retaining mechanism of submerged breakwaters is not only related to the vertical two-dimensional movement of sediment, but also involves a series of horizontal movement of sediment. Therefore, the sedimentation reduction performance of a submerged breakwater needs to be comprehensively evaluated from multiple aspects. It is necessary to consider both the reduction effect for protected channels and the sedimentation changes in unprotected channels. The layout of breakwater should be coordinated with the overall layout of the port and hydrodynamic environment. These issues are macroscopic issues that do not fall within the scope of this study, mainly due to limitations of the flume experiment.
The worst situation is considered, that the direction of current movement is orthogonal to the trending of submerged breakwaters. The presence of submerged breakwaters reduces the overflow area, accompanied by a rise in water level and an increase in current velocity. Currents change their original flow patterns, interact with the submerged breakwater structures, and easily form vertical and three-dimensional vortices, or other complicated flow patterns. Furthermore, changes occur in the sediment-carrying capacities of currents. The ability to effectively retain sediments and the amounts of sediments retained are closely related to current flow pattern, sediment characteristics, submerged breakwater height, section shape, water depth, and many other factors, and consequently, problems of this kind should be solved on a case-by-case basis.
The overlying action of waves complicates this issue. First, hydrodynamics is affected by dual factors instead of a single factor, and involves both the interactions between waves and currents. These factors jointly influence the sediment transport. Second, the wave dissipation caused by submerged breakwaters creates a more favorable dynamic environment for the breakwater-back water areas through promoting the deposition of overtopping sediments and weakening the re-suspension and transport of sediments. Third, there is a two-sided influence of interactions between the submerged breakwaters and waves on overtopping sediments. On the one hand, the reduction of waves is accompanied by the generation of high turbulent kinetic energy, which promotes the suspension of sediments, and breaks the original distribution trend of high near-bottom and low surface sediment concentration. As a result, the sediment concentration is more uniform in a vertical distribution, which facilitates the inward transport of sediments by currents and thus negatively influences the sediment-retaining effect. On the other hand, the dissipation of kinetic energy weakens wave intensity, lowers wave height, reduces the overall sediment-carrying capacity of waves, and decreases the total sediment concentration in water. These factors positively influence the sediment-retaining effect. Due to the presence of both positive and negative factors, we must consider the characteristics of local hydrodynamic sediment environment in practical engineering to study whether the submerged breakwaters can have a sound sedimentation reduction performance under the combined action of waves and currents.
The diversity of submerged breakwater structure makes this issue more complicated. The armor layer is one of the important aspects. Given that different armor layers have different wave dissipation effects, the tradeoff between the reduction of total mass and uniform vertical distribution of suspended sediments differs as well. In order to make a favorable choice, this study also investigates the effects of two kinds of armor layers on sediment retention.
3. Experimental Design
3.1. Dynamic Conditions and Sediment Selection
The sea area where Huanghua Port is a typical silty coast. The sediment movement present there follows the basic mechanism of “sediment lifting by waves, sediment transport by tidal currents” [
21]. Due to easy incipient motion, easy settlement, fast compaction, and other features of the silty sediments, large storm waves can produce near-bed, high-density suspensions. Thus, the channels often suffer from sudden siltation in strong windy days. A principle of channel regulation was gradually established to solve this sudden siltation problem; that is, “integrat[ing] protection with dredging” [
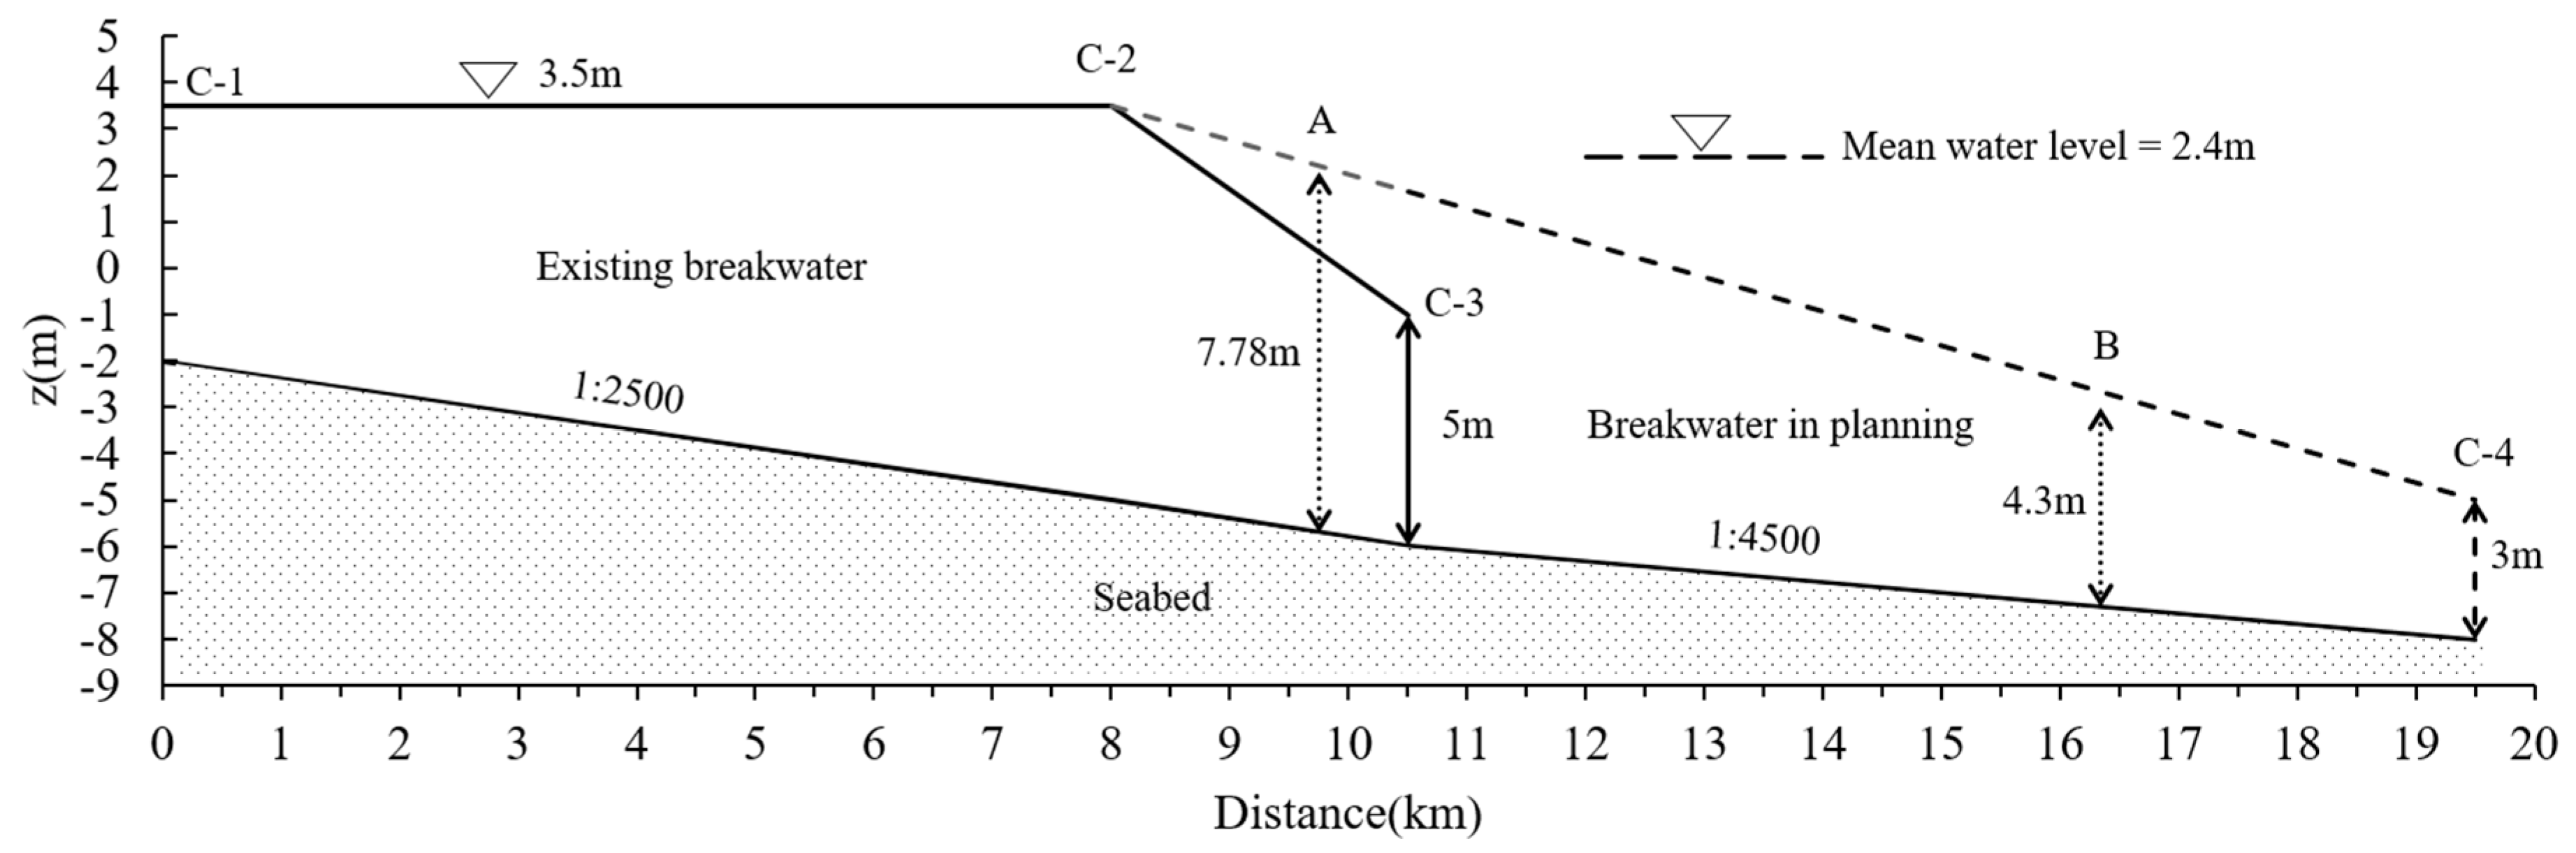
20]. Two half-tide breakwaters from −2 to −6 m isobath were built to protect the channel, as shown in
Figure 2. Each one was 10.5 km long. Its crest elevation from 0 to 8 km is 3.5 m, the water datum being the local theoretically lowest tide level. The crest elevation from 8 to 10.5 km reduced linearly from 3.5 to −1 m. The two breakwaters have achieved the goal of ensuring 35,000 DWT vessels could navigate in the presence of a sudden siltation return period of 10 years. It was planned to extend the breakwater to −8m isobaths, as shown in
Figure 2. The crest elevation from 8 to 19.5 km reduces linearly from 3.5 to −5 m. Thus, the existing 8 to 10.5 km breakwater needs to be raised.
The multi-year averaged water level of 2.4 m was adopted as the representative water level. The 10 year waves were as the representative waves. According to the field observations [
20,
22], the currents were set as in
Table 1. An undistorted model (horizontal scale is equal to vertical scale) was used. According to the flume scale, the geometric scale λ was set as 21. The Froude similarity law was adopted to simulate the hydrodynamic. Thus, the relationship between model and prototype for various parameters was established. Scales of time and fluid velocity are equal to λ
1/2. Scales of wave height, wave length, press, and stress are equal to λ.
As we know, settling velocity is very important in determining when a sediment particle will remain at rest or how far it will travel once lifted into the flow. Sediments on both sides of channels mostly have a median particle size of 0.02−0.04 mm [
23]. Their settling velocities are related to the particle size composition, concentration, hydrodynamic environment, etc. According to Zhang et al. [
24], 0.1 cm/s can be as the representative settling velocity in field. According to geometric scaling, the model of prototype sediment 0.03 mm in diameter would use sediment 0.0014 mm in diameter. However, the settling velocity would then be less than 0.001 cm/s, when it should be 0.0218 cm/s, according to Froude scaling (settlement velocity scale λ
ωs = λ
1/2). The critical velocity for initiation motion of 0.0014 mm sediment is higher than that of prototype sediment. Thus, geometric similitude could not be used in sediment. It is a way to choose a low density material as model sediment to satisfy simultaneously the settling velocity and initiation motion scaling. Through the still settling experiment and initiation motion experiment, a kind of fly ash was adopted, which has a settling velocity of 0.022 cm/s and a dry bulk density of 1.45 kg/L. Based on λ
s = λ
ρs /λ
(ρs-ρ), where λ
ρs denotes the sediment density scale and λ
ρs-ρ is a relative density scale (difference between sediment density and fluid density) [
25], the sediment concentration scale λ
s was calculated as 0.5.
3.2. Forms of Submerged Breakwaters
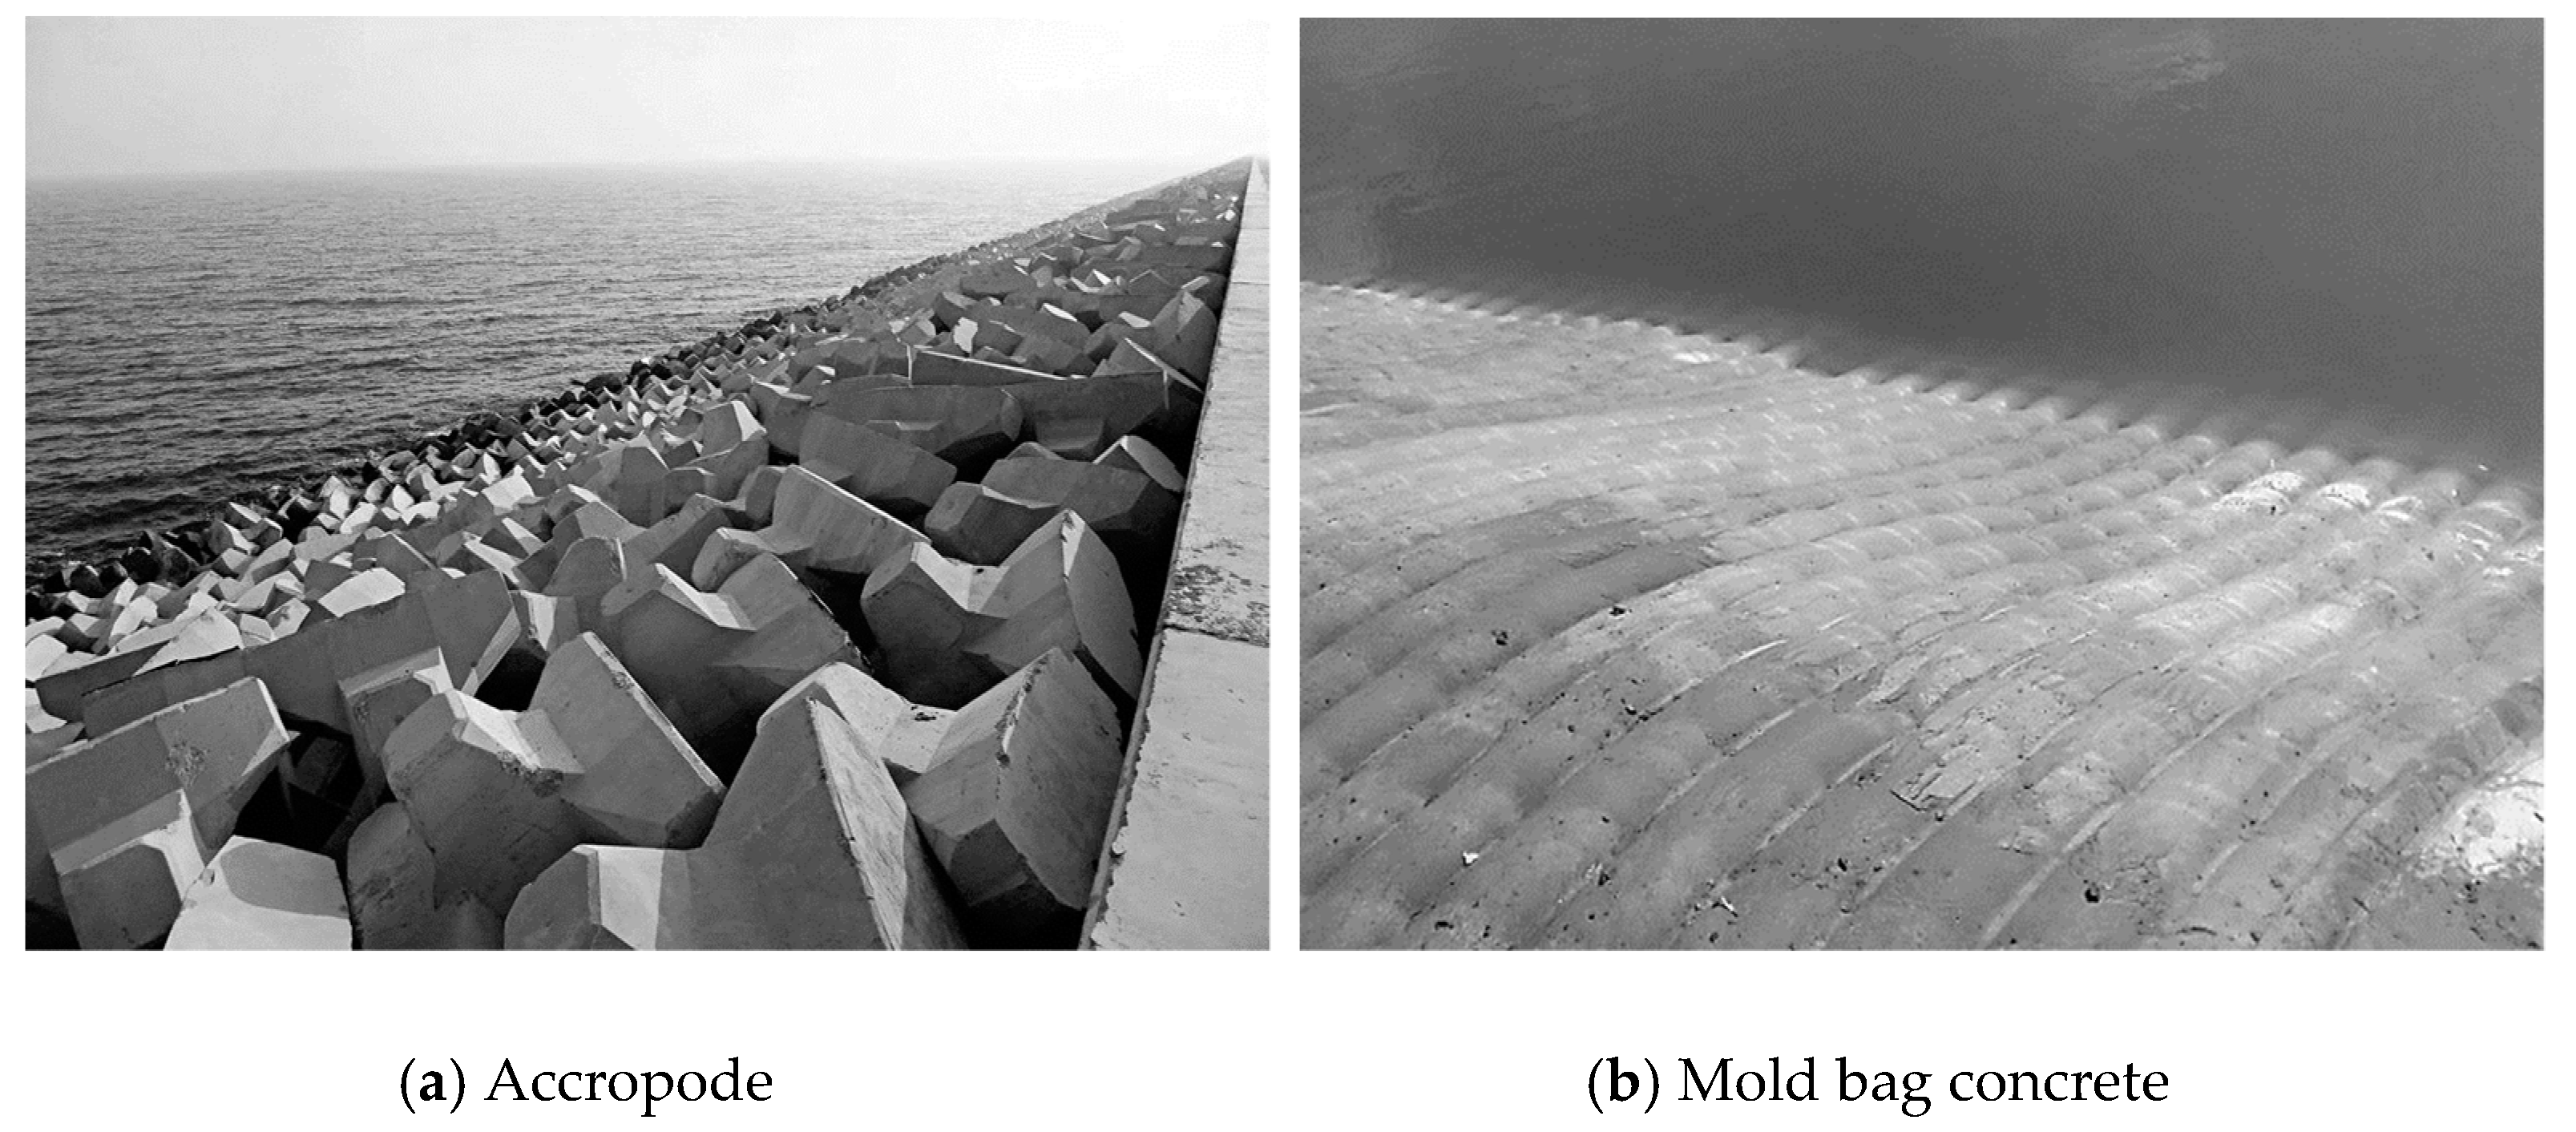
In the experiment, trapezoid-shaped riprap sloping breakwaters were used. Two kinds of armor layers were suggested by the designer; i.e., Accropode and mold bag concrete, as shown in
Figure 3. Mold bag concrete is a kind of fabric-formed concrete. Submerged breakwaters at A and B two positions, i.e., −5.7 and −7.3 m isobaths, shown in
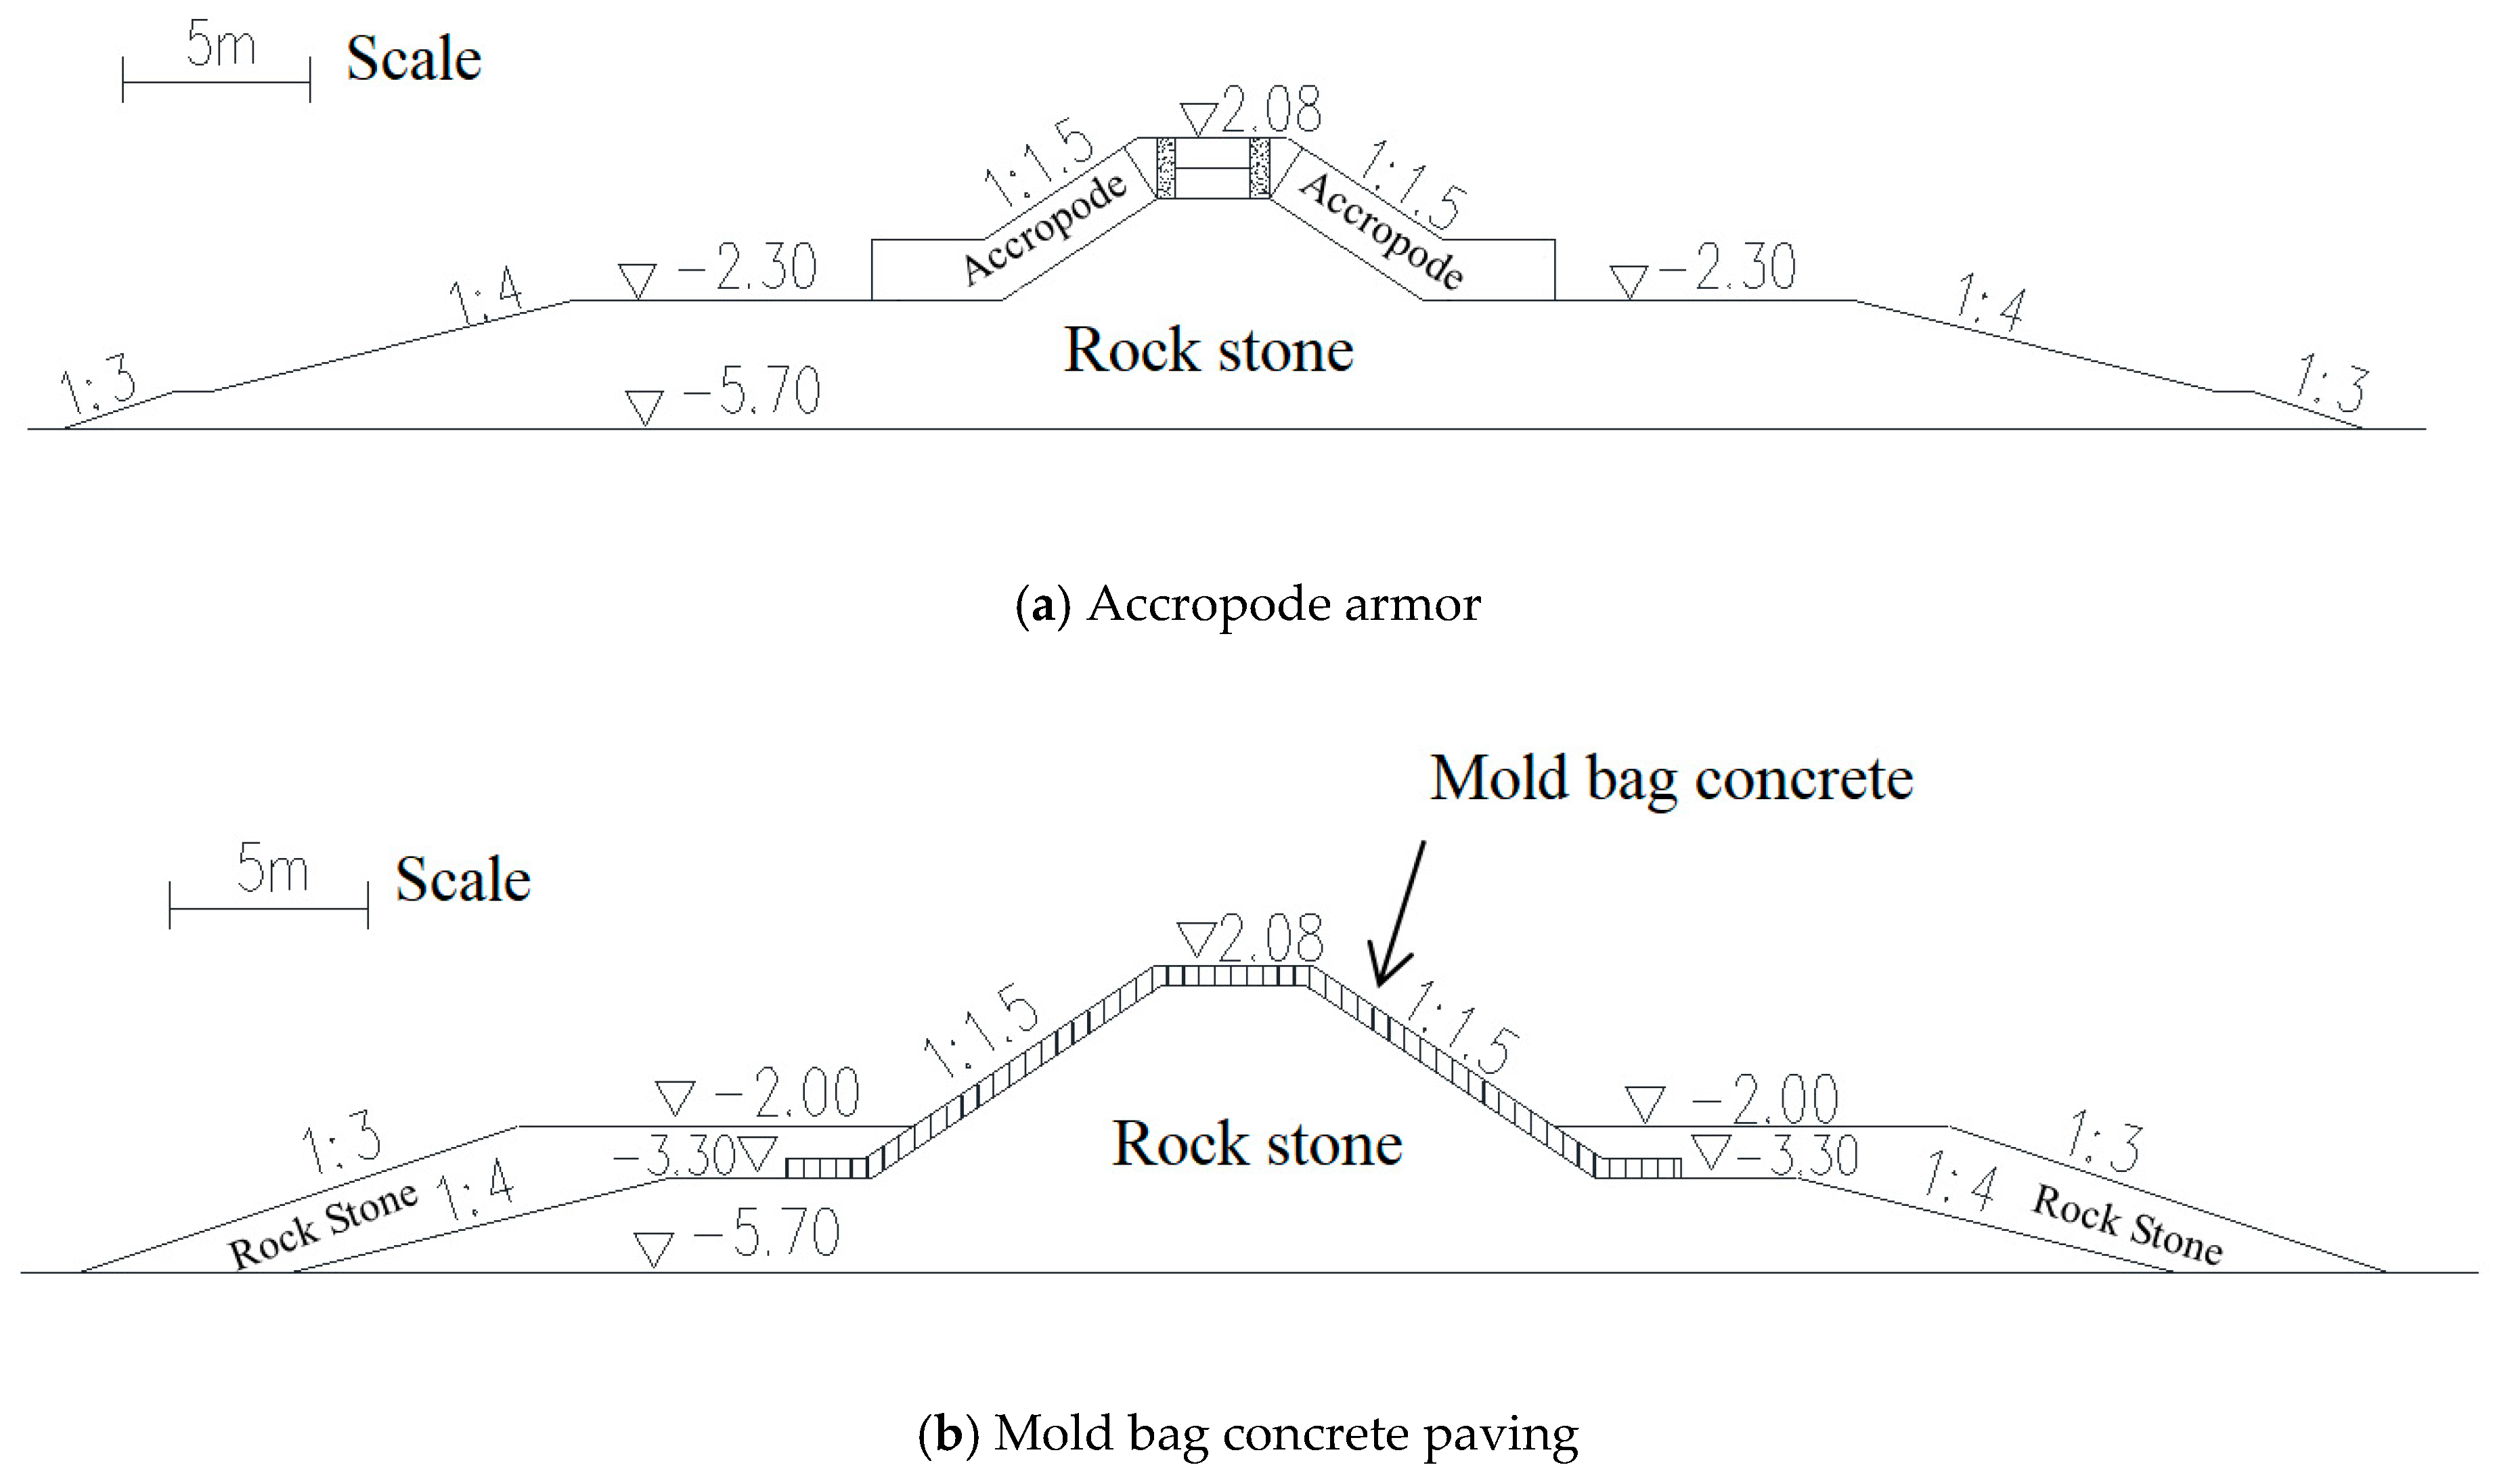
Figure 2, were investigated. Thus, there were four kinds of cross-section. At −5.7 m, the submerged breakwaters had a crest elevation of 2.08 m, breakwater height of 7.78 m, and crest width of 4.0 m. The two armor layers had the same gradient of 1:1.5. The breakwater-bottom widths were 61.42 and 58.44 m, respectively. At −7.3 m, the submerged breakwaters had a crest elevation of −3.0 m, a breakwater height of 4.3 m, and a crest width of 4.0 m. They had the same gradient of 1:1.5. The breakwater-bottom widths were 37.88 and 40.8 m, respectively.
Figure 4 shows the section shapes of submerged breakwaters made of the two armor layers at −5.7 m.
3.3. Experimental Layout and Equipment
The experiment was carried out in a wave and current flume of size 68.0 m × 0.7 m × 1.0 m (length × width × height). The front end of the flume was configured with a push-type wave maker and its control system. It was an absorbing wave maker, which was based on the method by Schäffer and Jakobsen [
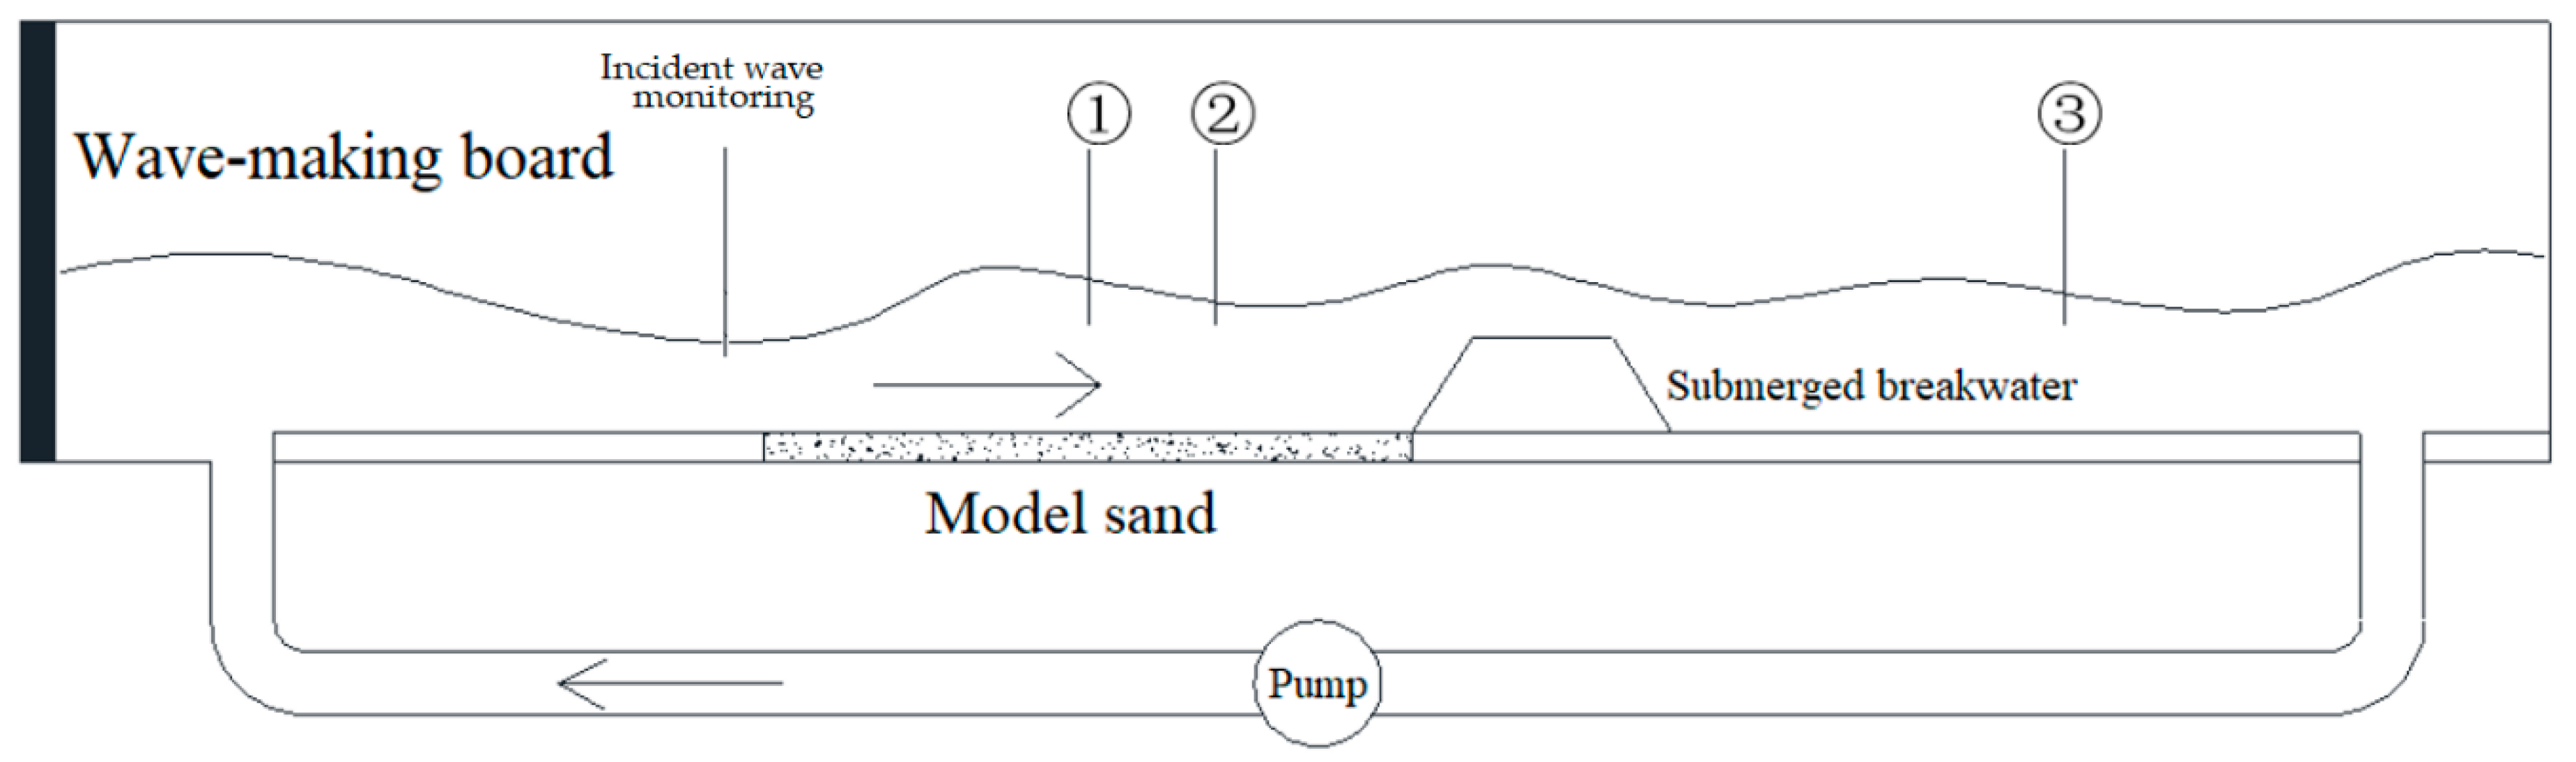
26]. Currents were controlled by a continuously variable electric reversible pump and a flow instrument. The back end of the flume was mounted with a wave absorption box, which has a reflection coefficient of about 0.05. The experimental segment was arranged in the middle of the flume, as illustrated in
Figure 5. In the experiment, a model sediment of total length and thickness of 5.6 m and 10 cm, respectively, was paved in front of the submerged breakwater. Before that, the model sediment was fully soaked, and the bed surface was troweled. The sediment concentration and wave height were measured at two positions, as shown in
Figure 5. One had a distance equal to 2.5 times the water depth in front of the submerged breakwater, shown by ②; another had a distance of five times the water depth in the back of the submerged breakwater, shown by ③. The flow velocity was measured by ADV (Acoustic Doppler Velocimetry) at the middle of the sand pavement segment, shown by ①. The incident wave height was also measured at the beginning of the model sediment.
The experimental parameters are shown in
Table 1 with the prototype values of current and wave. Wave conditions were calibrated using design wave elements having an average water level return period of ten years. Irregular waves and JONSWAP wave spectrum were adopted, and the wave train of each group of wave elements maintained a wave number of above 150, thereby guaranteeing the full suspension of sediments and the relative equilibrium status of water sediment concentration. The current flow velocity was controlled using the variable frequency value of a water pump motor and calibrated via an ADV. The time-averaged current velocities at −5.7 and −7.3 m were 0.12 m/s and 0.22 m/s in filed, respectively. The suspended sediment concentrations were determined from water samples collected by use of a siphon system at six vertical locations in positions 2 and 3. The sampling time was longer than 20 wave periods, and each experiment was repeated three times.
4. Experimental Results
4.1. Experimental Phenomena
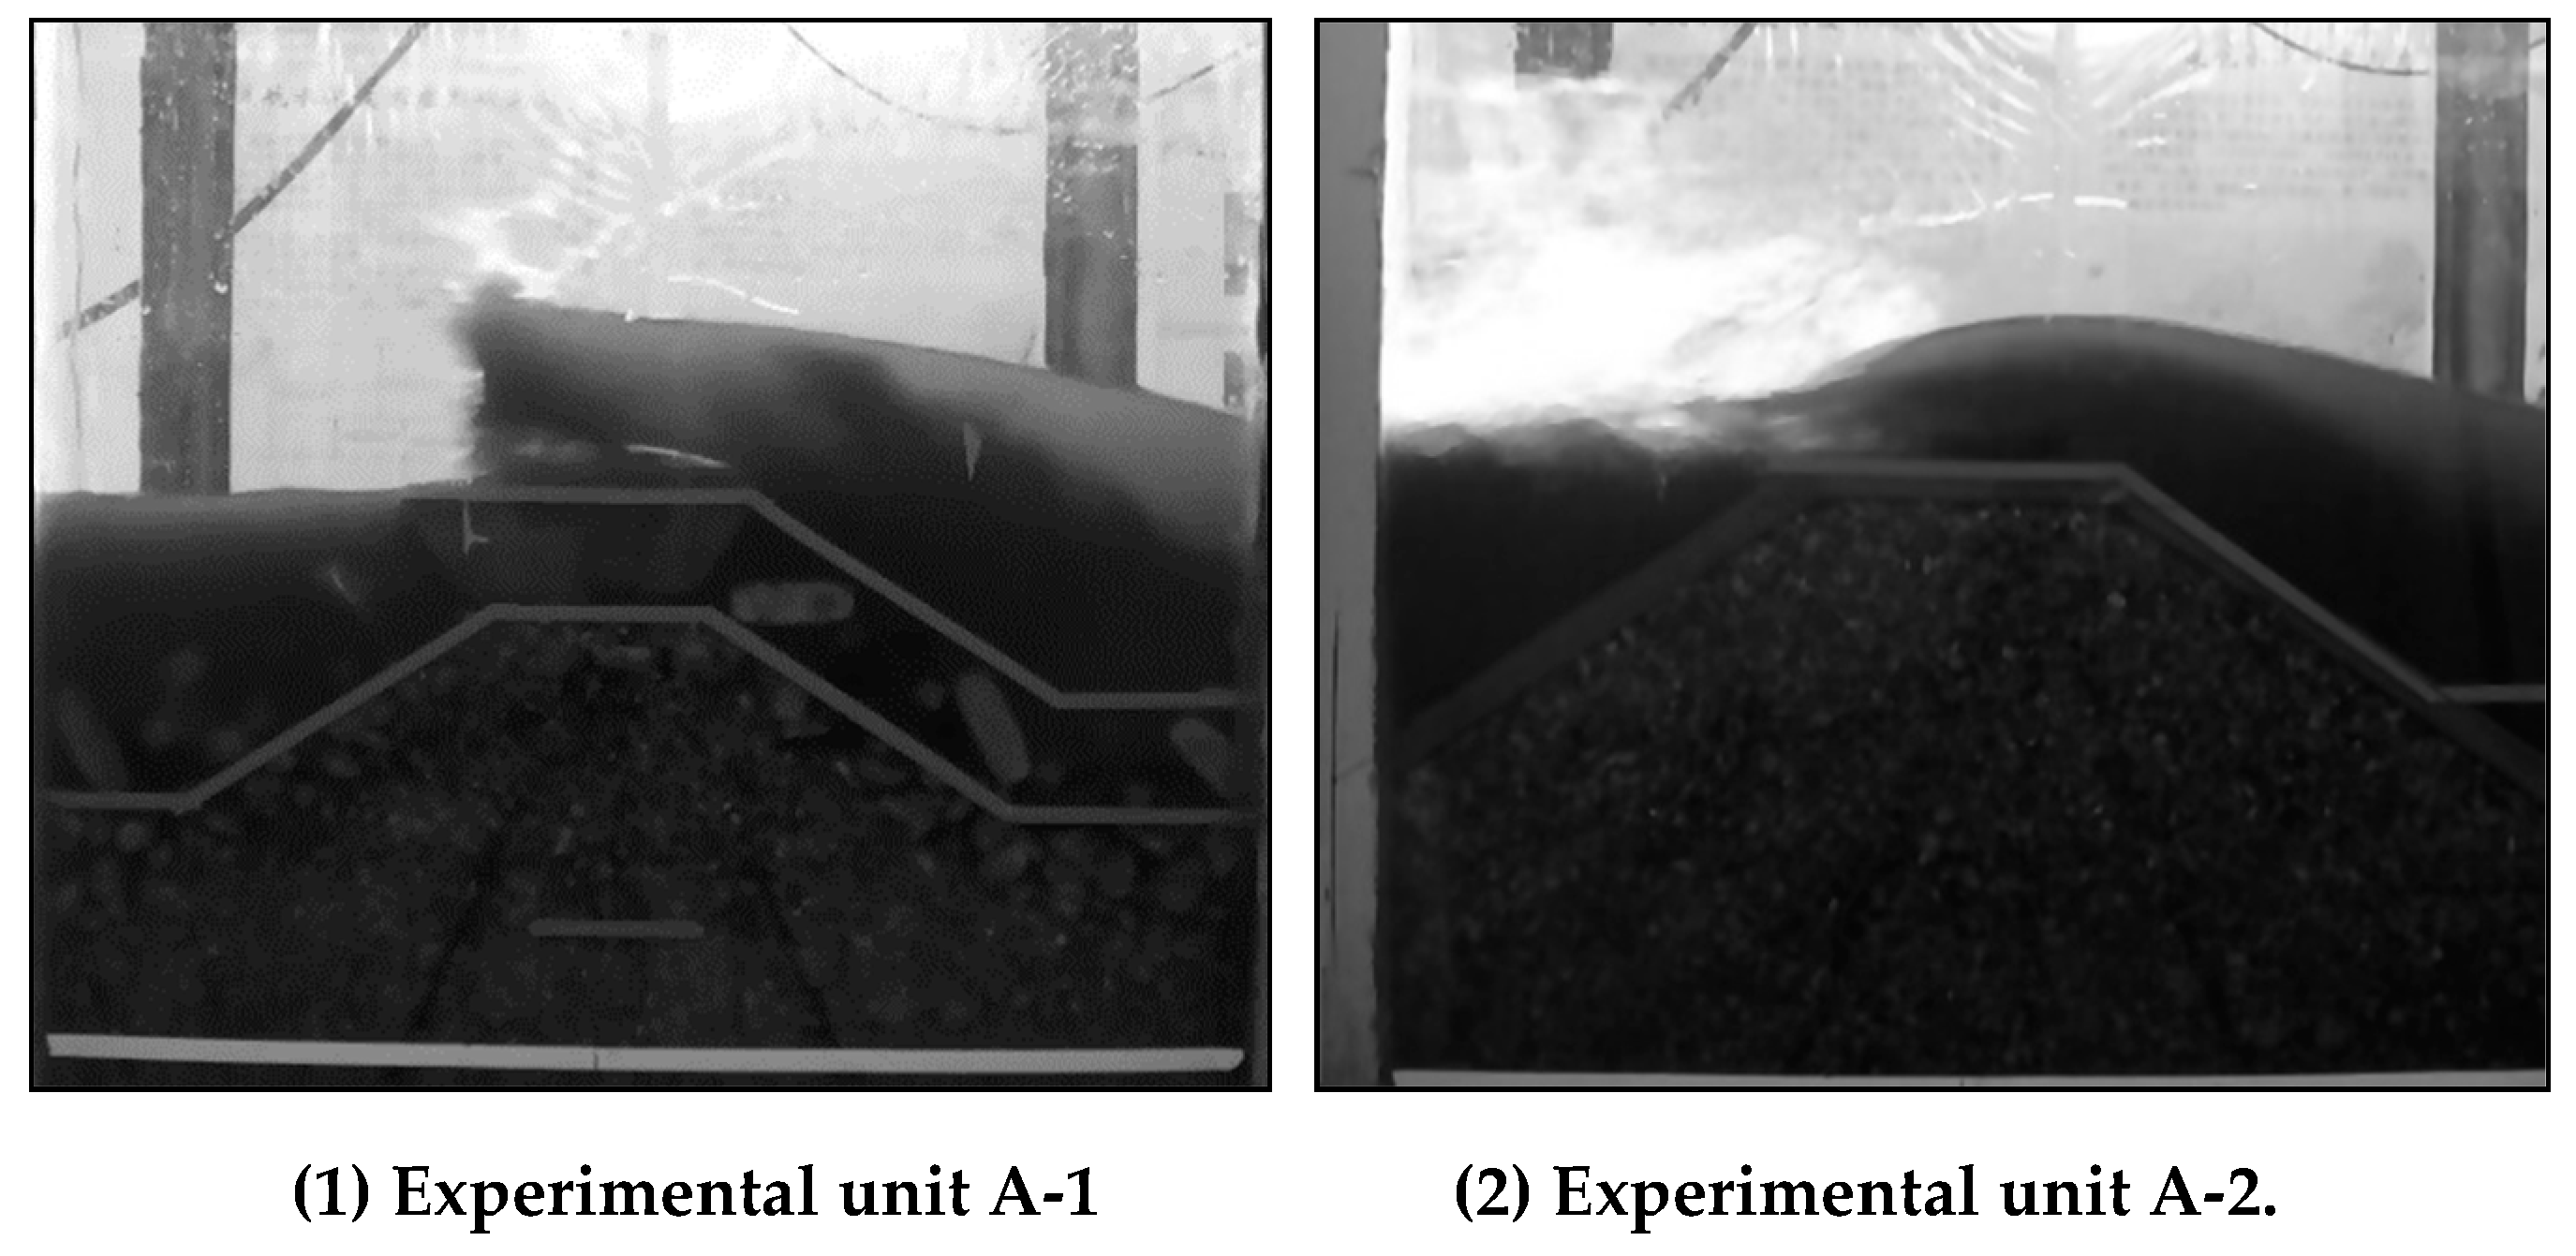
Group A experiments were conducted at the isobath position of −5.7 m. The breakwater-front water depth, submerged breakwater height, and breakwater height/water depth ratio of the model were 0.386 m, 0.37 m, and 0.96, respectively. The waves were susceptible to obvious breaking in the vicinity of breakwater crest, as shown in
Figure 6-(1). When large waves in a wave train passed by, plunging breakers and collapsing breakers were dominant, and when small waves passed by, only surging breakers played the dominant role. Group B experiments were conducted at the isobath position of −7.3 m. The breakwater-front water depth, submerged breakwater height, and breakwater height/water depth ratio of the model were 0.462 m, 0.2 m, and 0.44, respectively. Waves barely broke in the vicinity of breakwater crest, as shown in
Figure 6-(2).
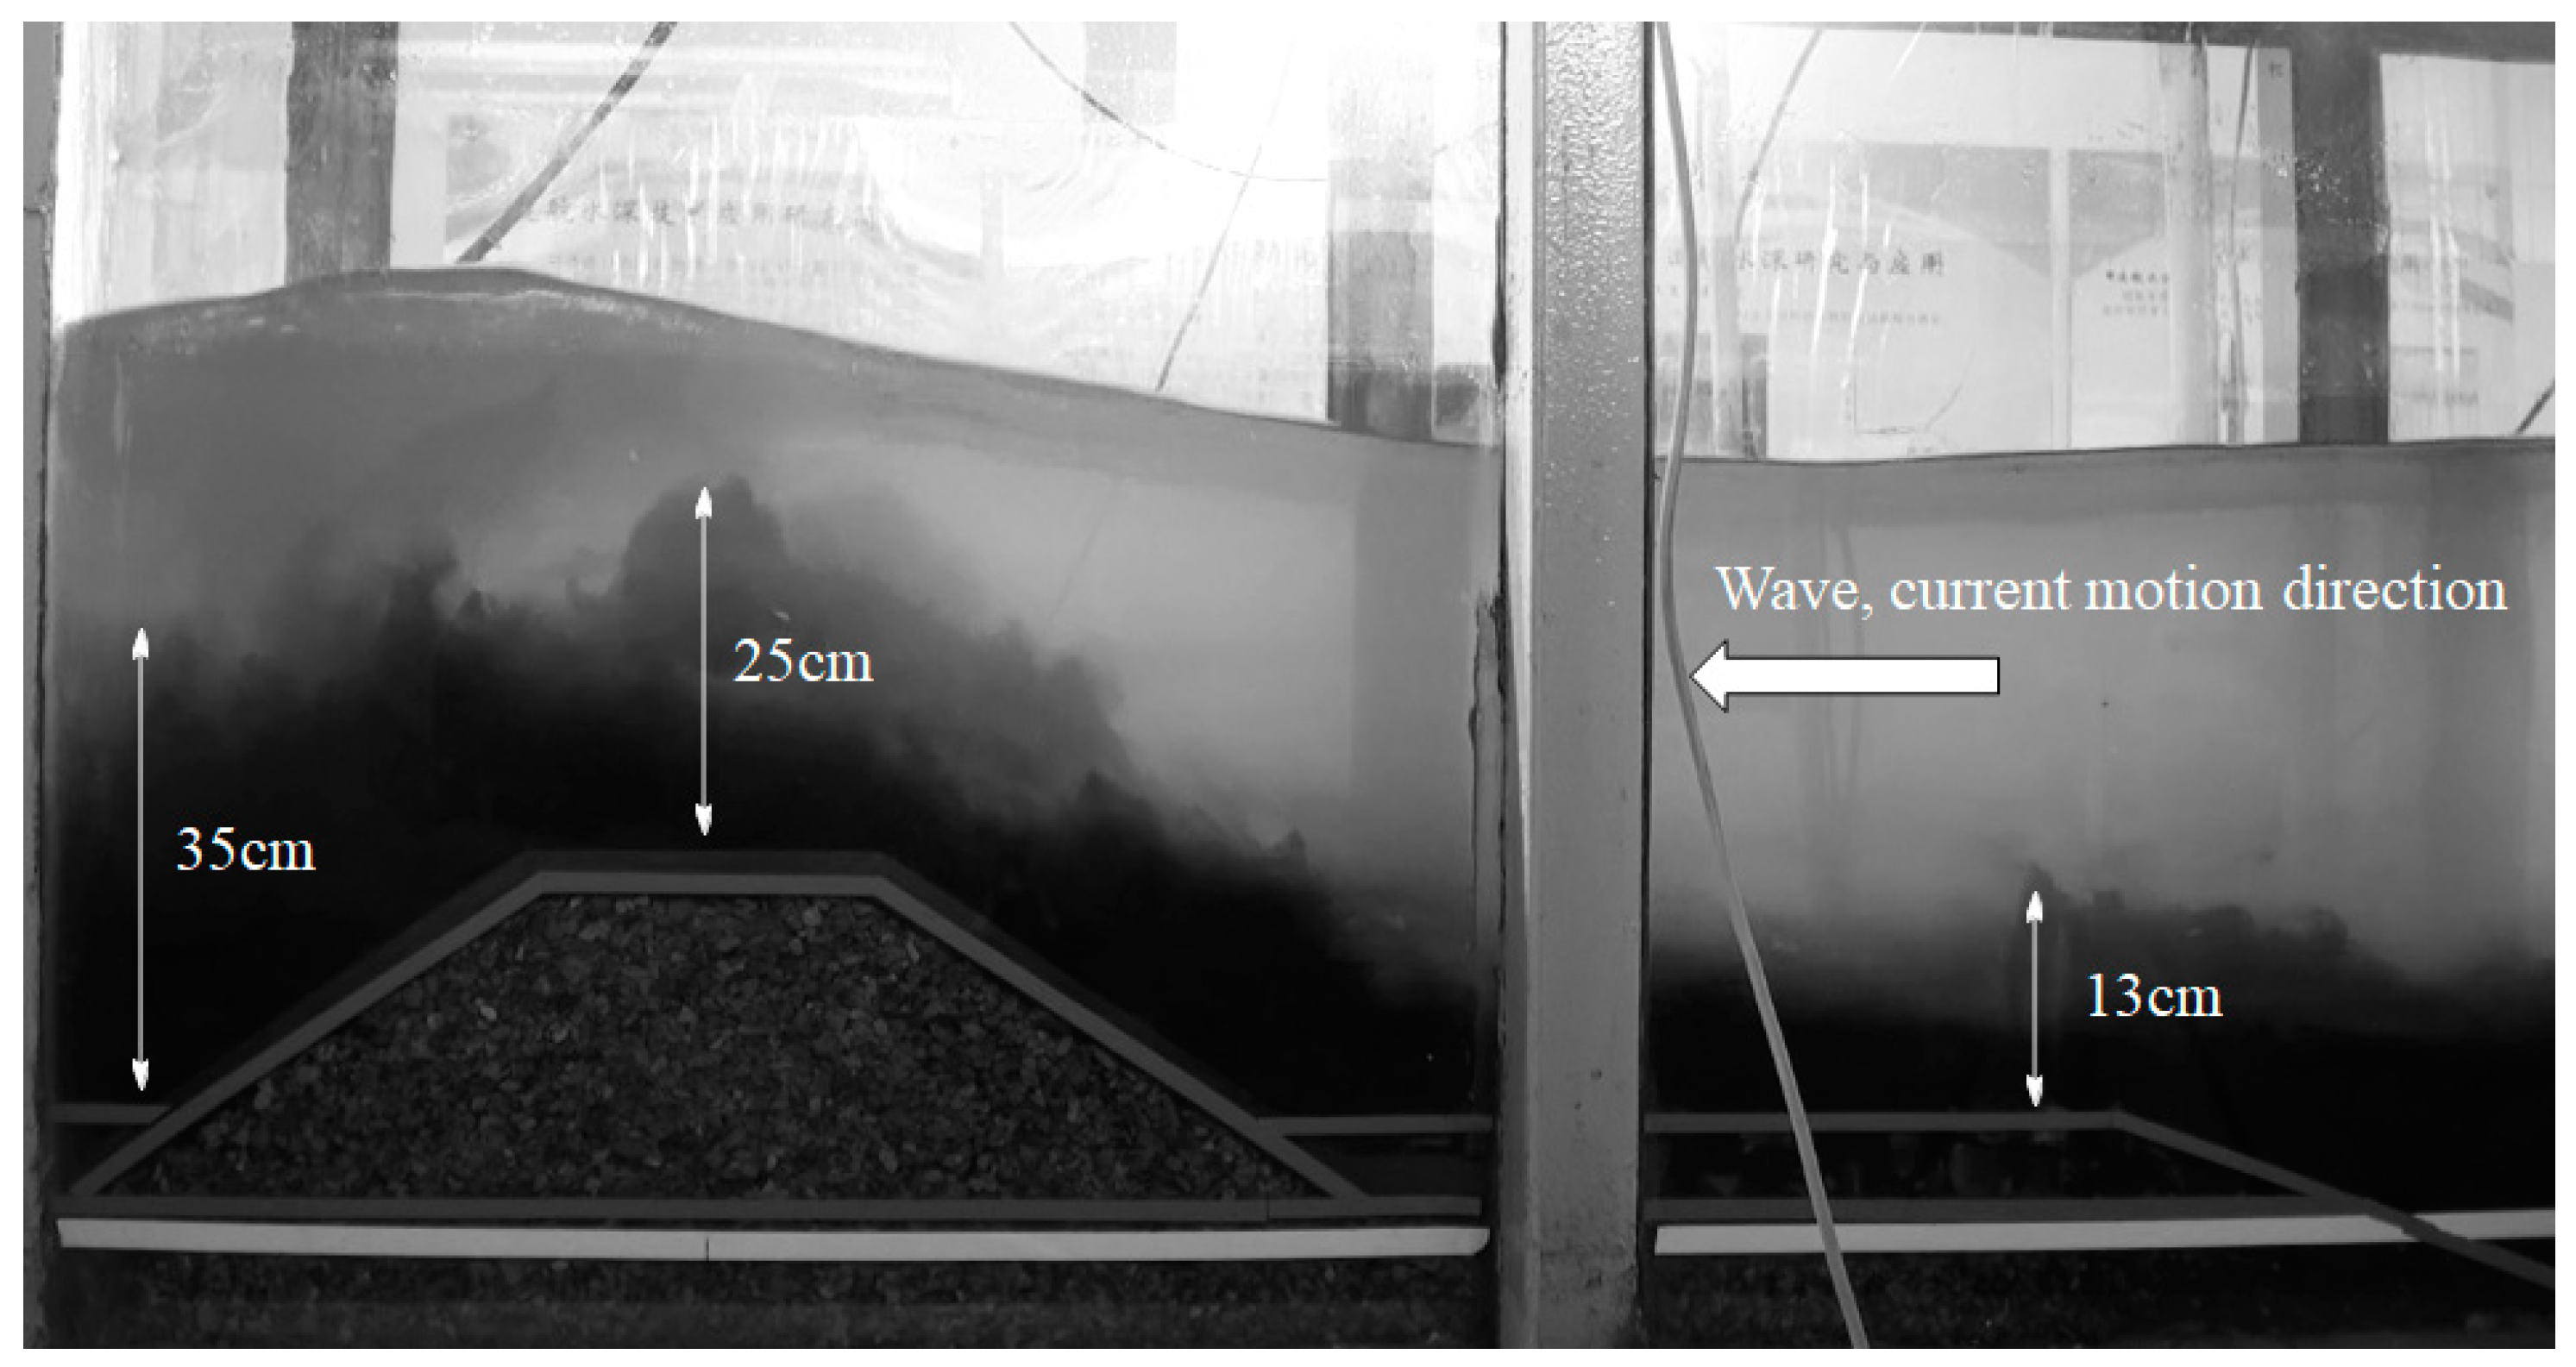
In each experimental group, the suspended sediments in the sand pavement segment in front of the submerged breakwater showed obvious stratification. The high suspended sediment concentrations exited in the near-bottom 30% water depth scope. There are often clear interfaces between the high-concentration and low-concentration sediments. A few flocci were also observed. They demonstrated reciprocating progressive movement in clusters under the combined action of waves and currents, as shown in
Figure 7.
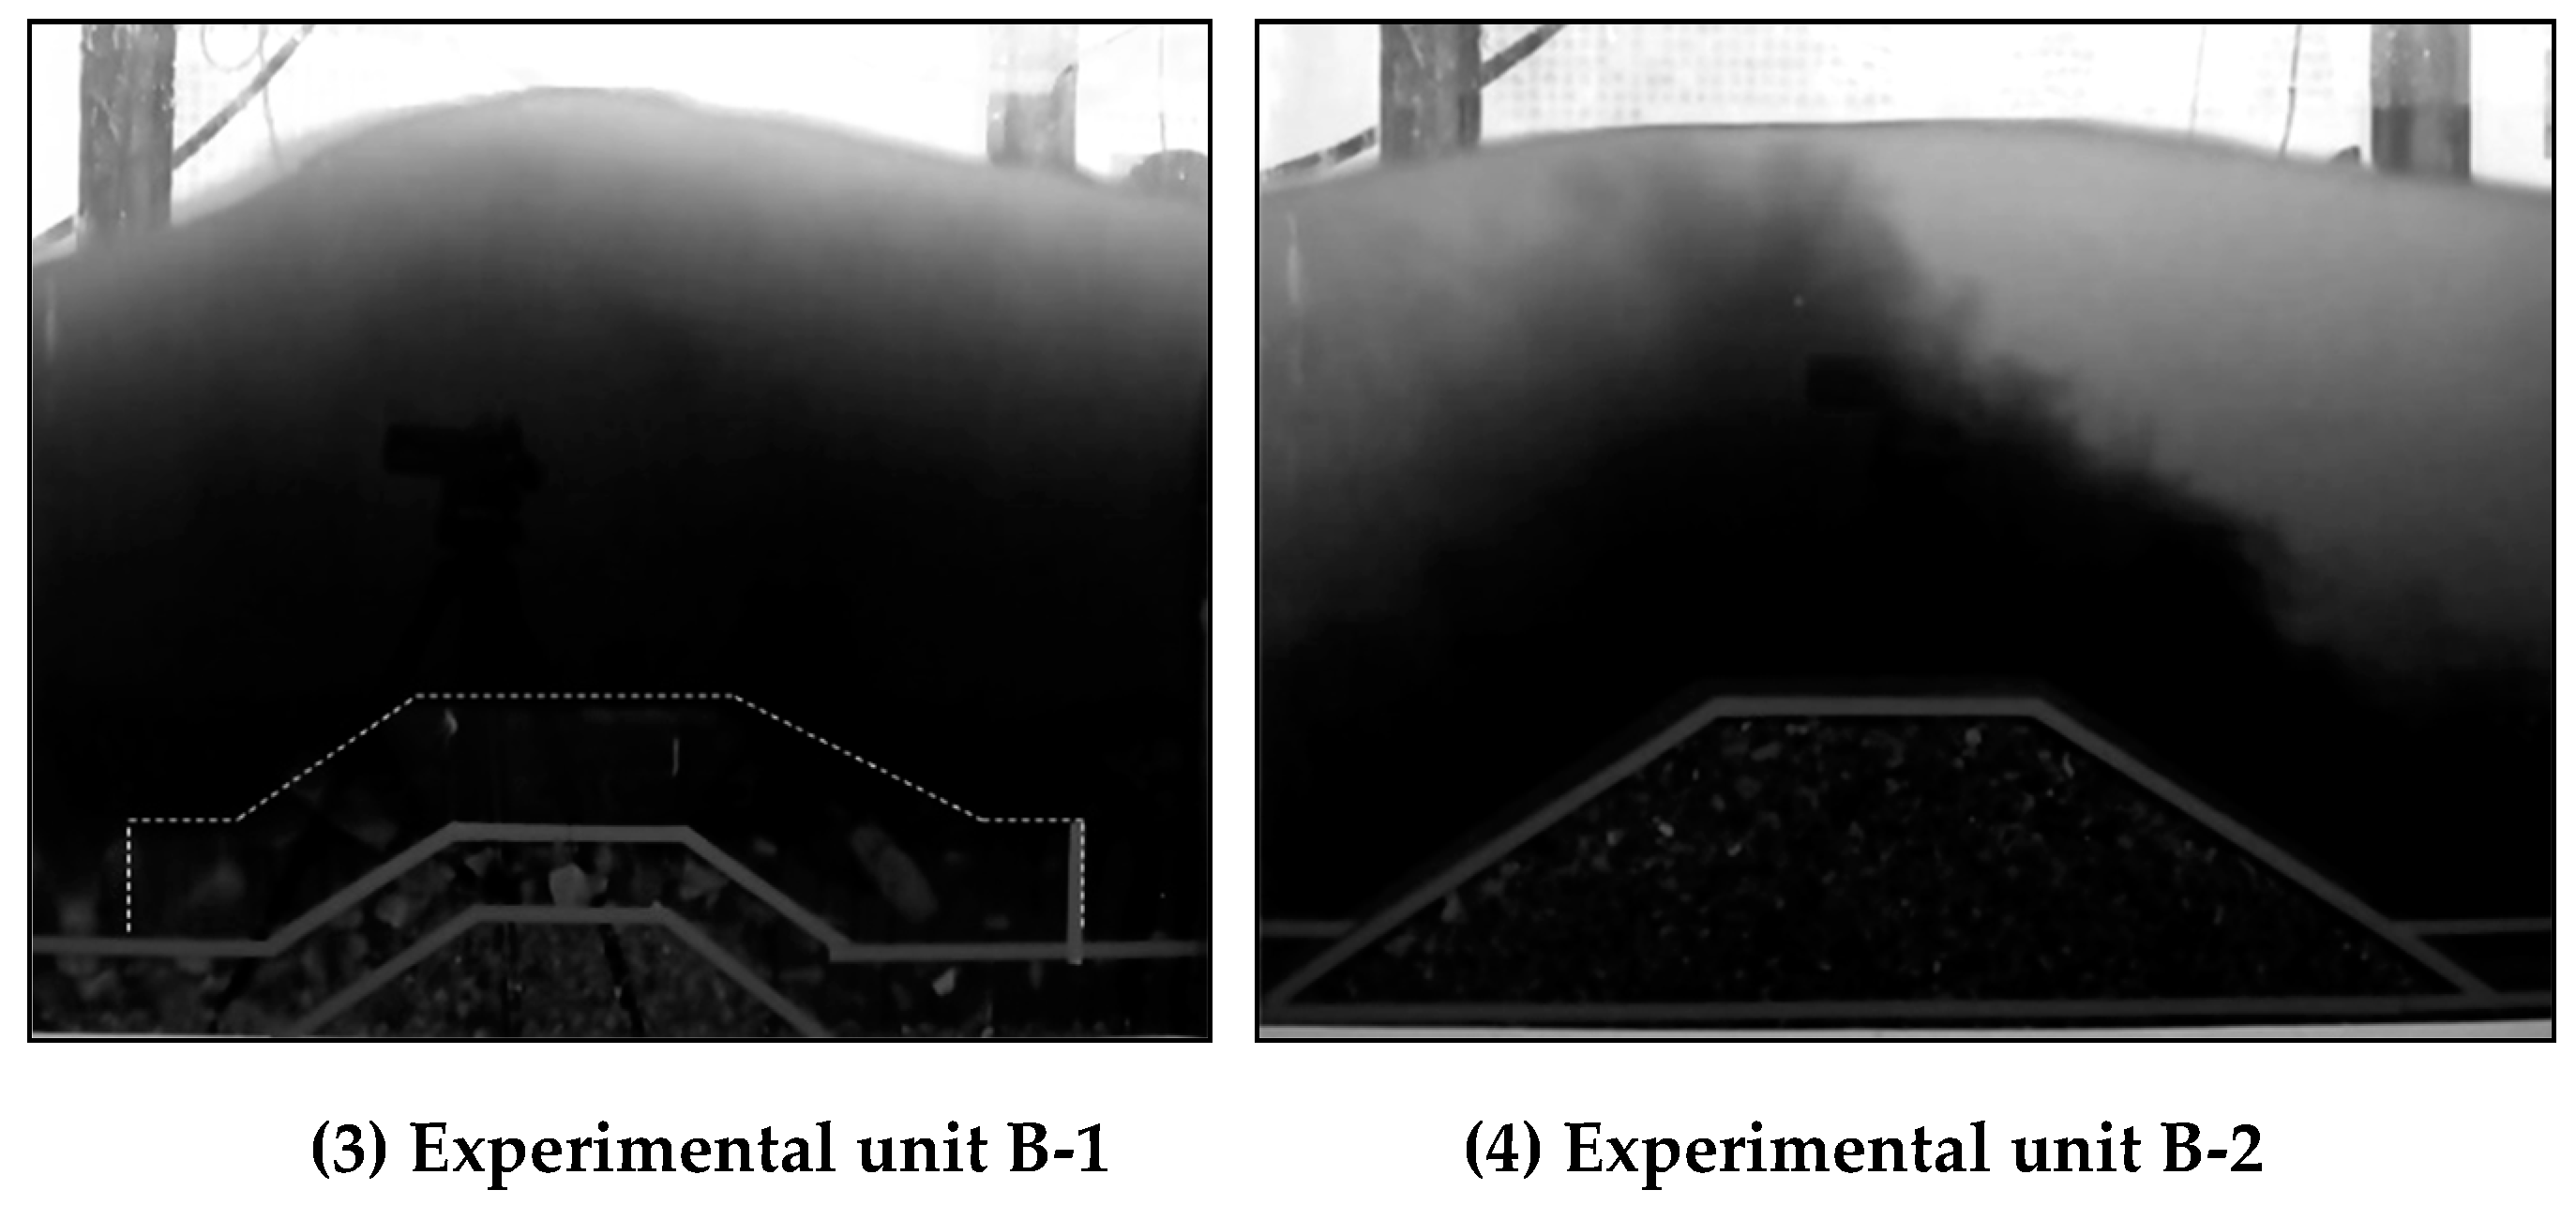
In the two experimental units of group A, the interfaces between high-concentration and low-concentration sediments disappeared at breakwater crest in
Figure 6-(1) and 6-(2). In the mold bag concrete facing the unit of group B (B-2), although the water body at breakwater crest still had clear interfaces, well-developed flocci on such interfaces can be seen in
Figure 6-(4). In the Accropode facing unit of group B (B-1), the interfaces were inconspicuous, as can be seen in
Figure 6-(3). The reason for interface weakening or even disappearing may be related to the change of water turbulence. A large amount of turbulent energy was produced by wave breaking in group A experiments, which made the sediment mixing vertically and strongly.
The vertical differences of sediment concentrations in the breakwater-back water of each experiments were further weakened, and it became difficult to visually distinguish between them.
Sediment concentration was measured using siphon sampling. According to measurement results, the bottom sediment concentration of the breakwater-front observation point, i.e., at a distance of 2.5 times the water depth away from breakwater foot, was higher than that of the breakwater-back observation point at a distance of five times the water depth away from breakwater foot. The sediment concentrations of breakwater-front middle and upper layers were uniformly lower than those of the breakwater-back middle and upper layers.
4.2. Breakwater-Front and Breakwater-Back Wave Changes
The sediments were sampled at the positions 2 and 3 in
Figure 5. The results provided in
Table 2 were converted into prototype values and analyzed. The following observations can be made based on the analysis results:
(1) The breakwater-front wave height was lower than the incident wave height, and the higher the breakwater height/water depth ratio, the lower the breakwater-front wave height. In the two experimental units of group A, the breakwater height/water depth ratio was 0.96, and the breakwater-front wave heights were 84% and 89% of the incident wave height, respectively. In the two experimental units of group B, the breakwater height/water depth ratio was 0.44, and the breakwater-front wave heights were 94% and 93% of the incident wave height, respectively.
(2) There was a relatively large difference in the breakwater-front wave height between A-1 and A-2, possibly because of the minor differences in facing form and section shape, such as shoulder height, shoulder length, and slope gradient.
(3) Due to the wave dissipation effect, the breakwater-back wave height was lower than the breakwater-front wave height, and the higher the breakwater height/water depth ratio, the stronger the wave dissipation effect. In group A, due to a higher breakwater height/water depth ratio compared to group B, the breakwater-back wave height was about 50%–53% of the breakwater-front wave height, whereas in group B, it was about 91%–93% of the breakwater-front wave height, as shown in
Figure 8 and
Table 2.
(4) The wave dissipation effect of Accropode facing was slightly stronger than that of the mold bag concrete, mainly because of the higher roughness of Accropode facing. In experiments A-1 and B-1 with Accropode facing, the breakwater-back wave heights were reduced to 50% and 91% of the breakwater-front wave heights, respectively. In experiments A-2 and B-2 with mold bag concrete facing, the breakwater-back wave heights were reduced to 53% and 93% of the breakwater-front wave heights, respectively.
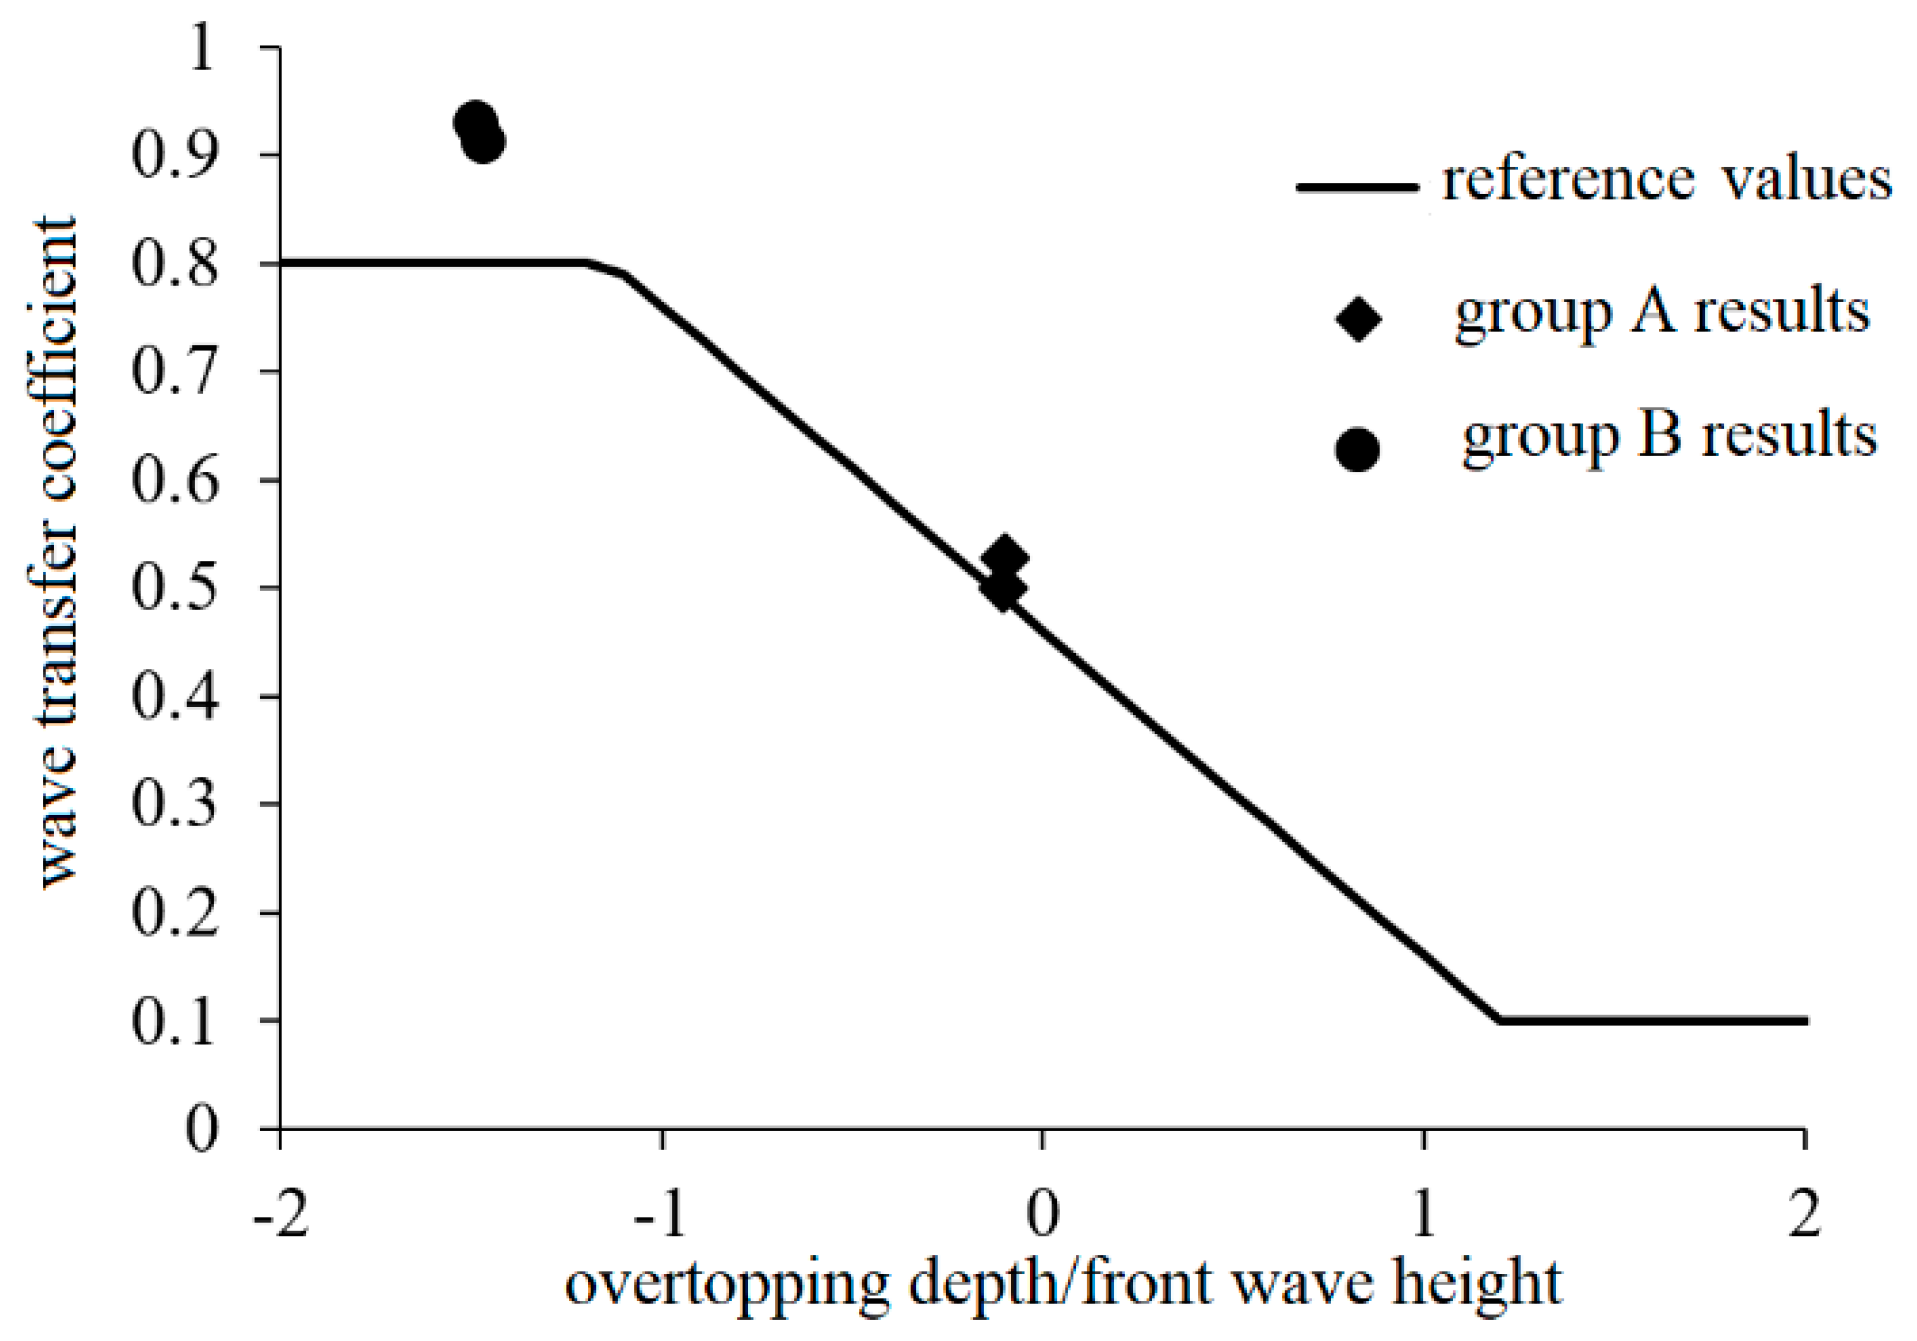
(5) The
Code of Design and Construction of Breakwaters (JTS 154-1-2011) in China defines the wave transfer coefficient of sloping submerged breakwaters as a function of parameter h
c/H, where h
c and H are the crest water depth and breakwater-front wave height, respectively. The references value of the coefficient is set as 0.8 when −2.0 < h
c/H < −1.13. When −1.13 < h
c/H < 1.2, it is set between 0.46 and 0.3, and when 1.2 < h
c/H < 2.0, it is set as 0.10, as shown in
Figure 8. In the two experimental units of group A, the measured wave transfer coefficients were 0.50 and 0.53, which were very close to the reference values of 0.492 and 0.490. In the two experimental units of group B, the measured wave transfer coefficients were 0.91 and 0.93, slightly greater than the reference value of 0.8. Thus, the standard reference values are basically suitable for the experiments.
4.3. Sediment-Retaining Effect
(1) Breakwater-front and breakwater-back sediment concentration differences and sediment-retaining effect.
In order to relate to the field situation, the prototype values of sediment concentrations are listed in
Table 3, which were obtained by dividing the measured concentrations by the scale λ
s. The breakwater-front depth-averaged sediment concentrations of group A at a distance of 2.5 times the water depth in front of the submerged breakwater were lower than those of group B on the whole, with a difference of about 36%. This behavior was mainly related to the differences in breakwater-front water depth and wave height, and possibly also related to the differences in sediment compaction on the bed surface. In contrast, the breakwater-back depth-averaged sediment concentration of group A was slightly higher than that of group B on the whole, with a difference of about 10%. The breakwater-front depth-averaged sediment concentration of A-1 (Accropode facing) was lower than that of A-2 (Mold bag concrete facing); however, the breakwater-back concentration of A-1 was higher than that of A-2. The breakwater-front depth-averaged sediment concentration of B-1 (Accropode facing) was higher than that of B-2 (Mold bag concrete facing); the breakwater-back concentration of B-1 was almost same with that of B-2.
The sediment retaining rate is a direct reflection of the sediment-retaining effect of submerged breakwater, which is the ratio of sediment concentration difference before and after breakwater to sediment concentration in front of breakwater. It was observed in
Table 3 that the sediment-retaining efficiencies of group B were significantly higher than those of group A. The sediment-retaining rates of the two experimental units in group A were 37% and 49%, and those of the two units in group B were 65% and 61%.
Next, we describe the differences in sediment-retaining effect caused by varying armor layers. In group A, the sediment-retaining effect of mold bag concrete facing was stronger than that of the Accropode facing, with a difference of 12% in the sediment-retaining rate. In group B, the sediment-retaining effect of Accropode facing was stronger than that of the mold bag concrete facing, with a difference of 4% in the sediment-retaining rate. This suggests that the facing forms should be selected based on the overall consideration of water depth, breakwater height, wave, overtopping wave form, and other relevant factors, and that a generalized approach cannot be applied in this case.
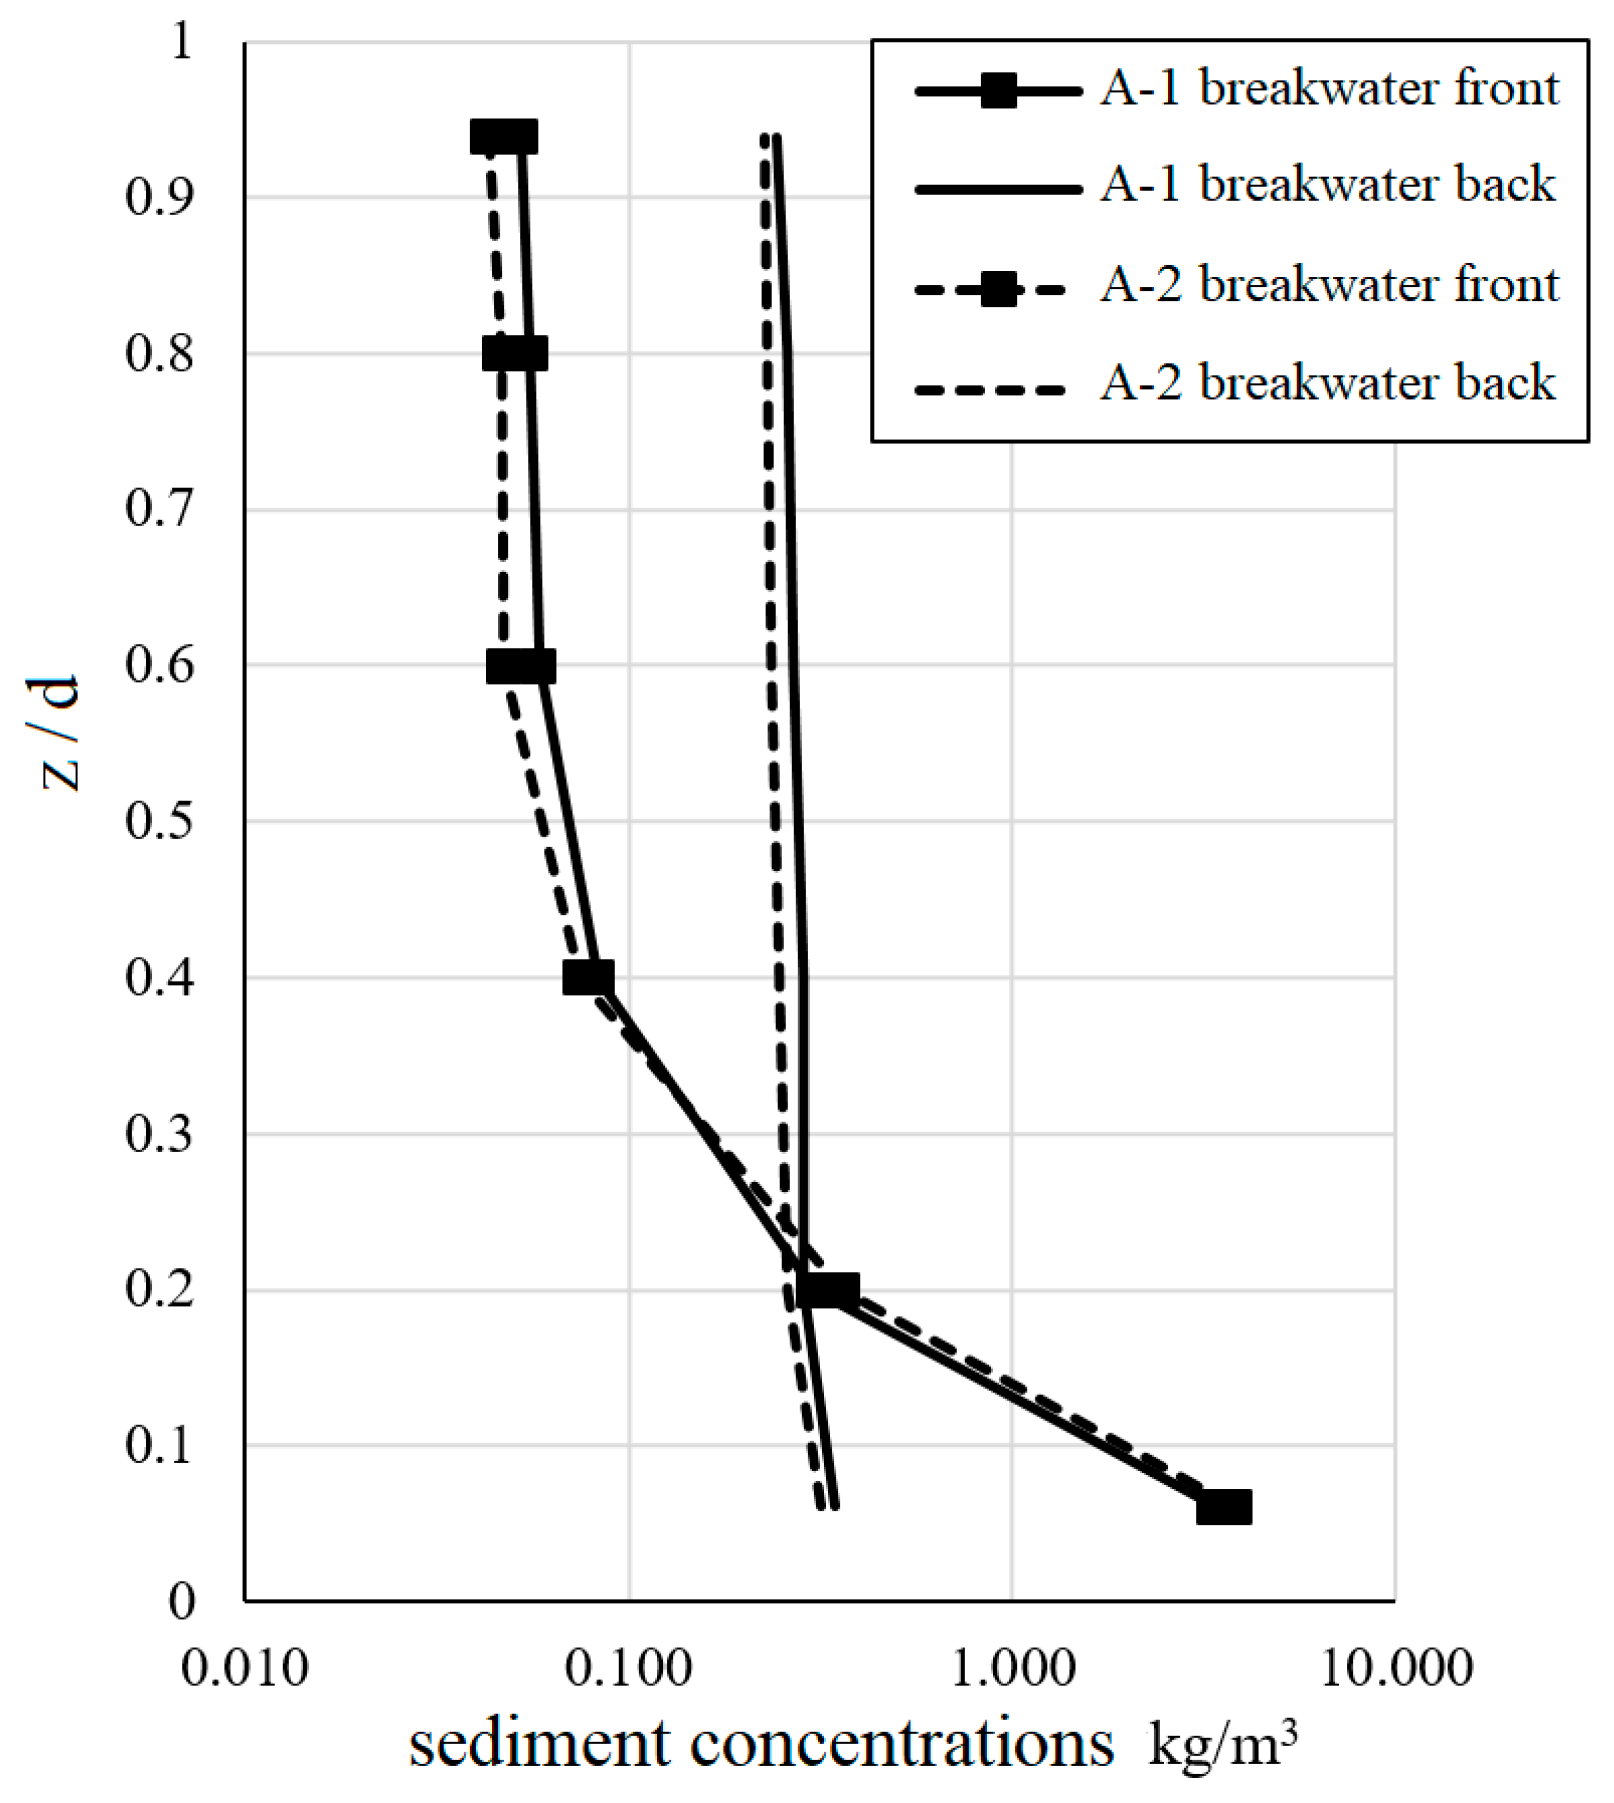
(2) Vertical distribution changes of breakwater-front and breakwater-back sediment concentration.
Figure 9 and
Figure 10 show the vertical distribution of breakwater-front and breakwater-back time-averaged sediment concentrations in groups A and B, respectively. In general, the two groups showed the same change trend: a high bottom sediment concentration and a large vertical gradient of sediment concentration in front of the breakwater, and a low bottom sediment concentration accompanied by a small vertical gradient of sediment concentration.
As can be seen in
Table 2 and
Table 3, the breakwater-front wave height of A-2 was 3.22 m, which was higher than that of A-1, which was equal to 3.03 m. The breakwater-front water sediment concentration of A-2 was 0.487 kg/m
3, higher than that of A-1, which was equal to 0.442kg/m
3. This reveals the law of, “The stronger the wave intensity, the higher the sediment concentration.”
Figure 9 shows that in the vertical direction, especially in the scope of 0.4 times the water depth near the bed, the sediment concentration gradient of A-2 was higher than that of A-1. This reflects that a higher sediment concentration has a stronger limitation effect against water turbulence, causes more sediments to aggregate in water bodies near the bed, and results in a higher vertical gradient of sediment concentration.
The breakwater-back wave height of 1.70 m in A-2 was higher than that in A-1, which was equal to 1.51 m. However, the breakwater-back water sediment concentration of 0.248 kg/m3 in A-2 was lower than that in A-1, which was equal to 0.279 kg/m3. This further explains the reason for A-2 having a higher sediment-retaining efficiency and resulting in less sediments overtopping the submerged breakwater. Thus, the breakwater-back sediment concentration of A-2 was lower than that of A-1. Seen from the angle of dynamics, this behavior was mainly caused by the different effects of the two experimental schemes on the waves. In the case of Accropode facing, waves in the vicinity of breakwater crest were more susceptible to breaking, accompanied by the conversion of wave potential energy into turbulent kinetic energy and intense mixing of sediments. In the overtopping process, the sediment concentration of Accropode facing was more uniform than that of the mold bag concrete facing. However, because of the same crest elevation, the differences in facing form had a low impact on the amount of overtopping water. In addition, the two schemes had basically the same overtopping currents; therefore, compared to the mold bag concrete facing, the Accropode facing resulted in higher quantities sediments overtopping the submerged breakwater, and a lower sediment-retaining rate.
In group B, although the breakwater-front wave difference between the two experimental units was extremely small, the sediment concentration difference between them was higher. Experimental units B-1 and B-2 had a breakwater-front wave height difference of about 1.1%, and a sediment concentration difference of about 10.7%, which may have been caused by the difference in the compactness of bed surface sediments. The vertical distribution of breakwater-back sediment concentration tended to be uniform. Compared to group A, group B had roughly similar sediment concentration, but a higher vertical gradient. This further suggests that the effect of submerged breakwaters on water turbulence was weaker in group B than in group A.
5. Discussion
Kadib [
5] considered that the submerged breakwaters could retain the sediments in water bodies below the breakwater crest, and proposed a formula for calculating sedimentation reduction caused by the submerged breakwaters. Based on Equations (7) and (12) given in [
5], the formula of sediment-retaining rate is given below:
where R denotes the sediment-retaining rate, c(z) the denotes vertical distribution function of the sediment concentration, z denotes the vertical coordinate, h denotes the breakwater height, a denotes the thickness of the boundary layer, and d denotes the water depth.
As an example, the breakwater height/water depth ratio (h/d) in group B was 0.44. A power function can be used to effectively fit the relationship between sediment concentration and relative water depth, with a correlation coefficient of above 0.95. Equation (1) and the fitting formula can be used to calculate the theoretical sediment-retaining rates of B-1 and B-2 as 86.4% and 88.0%, respectively, which are significantly higher than the measured values of 65% and 61%. The calculated sediment-retaining rate of B-2 was higher than that of B-1, while the measured sediment-retaining rate of B-2 in the experiment was lower than that of B-1.
When the same method was adopted to analyze group A, the breakwater height/water depth ratio (h/d) was 0.96. The theoretical sediment-retaining rates of A-1 and A-2 were both above 99%, significantly higher than the measured sediment-retaining rates of 37% and 49%. Therefore, the differences between the calculated and measured sediment-retaining rates were larger in group A.
These large differences are mainly caused by the assumption that the submerged breakwaters can retain the sediments in water bodies below the breakwater crest, as this assumption ignores the effects of structures on hydrodynamics and sediment movement. In particular, the dual action of waves and currents further complicated this issue in the experiment. On the one hand, the wave dissipation effect of submerged breakwaters created a more favorable dynamic environment for the breakwater-back water areas, lowered the wave height, reduced the sediment-carrying capacity of water bodies and weakened sediment movement in the protected areas. On the other hand, the reduction of waves was accompanied by the generation of high turbulent kinetic energy, which promoted the suspension of sediments, and broke the original distribution trend of high near-bottom sediment concentration and low surface sediment concentration. Consequently, the sediment concentration was more uniform in the vertical distribution, which facilitated the inward transport of sediments by currents and thus negatively influenced the sediment-retaining effect. As can be seen from the experimental results, the negative factor was the primary cause of the large differences between the calculated and measured values. In particular, in group A, wave breaking and overtopping in the vicinity of the breakwater caused the measured sediment-retaining rate to be at least 50% less than the calculated value. Facing forms also played a role in this process.
In channel regulation engineering design, when adopting the submerged breakwaters for sedimentation prevention and reduction, it is necessary to conduct in-depth research using different technical methods, make use of the results from similar projects, and rationally estimate the sedimentation reduction effect of submerged breakwaters.
6. Conclusions
Based on the flume experiment, this study investigated the sediment-retaining effects of the submerged breakwaters under the combined action of currents and ten year return period waves. It further discussed the sedimentation reduction mechanism of submerged breakwaters and the differences between the sediment-retaining performances of breakwaters with different facing layers. Its main conclusions are as follows:
(1) For submerged breakwaters, the breakwater-front wave height was lower than the incident wave height. This may be caused by the wave-current interactions. In two experimental units of group A, the ratio of breakwater height/water depth was 0.96, and the breakwater-front wave heights were 84% and 89% of the incident wave height respectively. In group B, the breakwater height/water depth ratio was 0.44, and breakwater-front wave heights were 94% and 93% of the incident wave height respectively.
(2) In groups A and B, the breakwater-back wave heights were about 50%–53% and 91%–93% of the breakwater-front wave heights, respectively. Compared with the mold bag concrete facing, the Accropode facing had a higher roughness, and consequently a slightly stronger wave dissipation effect.
(3) The suspended sediments in front of the submerged breakwater showed obvious stratification. The high suspended sediment concentrations exited in the near-bottom 30% water depth scope. High-concentration and low-concentration sediments had clear interfaces with a few flocci.
(4) The sediment-retaining ratios of the two experimental units in group A were 37% and 49%, and those of the two units in group B were 65% and 61%.
(5) When there is wave breaking in the vicinity of submerged breakwater crest, the facing layer has certain influence on sediment-retaining performances. In group A, the sediment-retaining effect of mold bag concrete facing was stronger than that of the Accropode facing, showing a difference of 12% in the sediment-retaining rate. In group B, the sediment-retaining effect of Accropode facing was stronger than that of the mold bag concrete facing, showing a difference of 4% in the sediment-retaining rate. This suggests that the selection of facing forms should be based on an overall consideration of water depth, breakwater height, wave size, overtopping wave form, and other relevant factors, and that a generalized approach cannot be used for making the selection.
(6) The submerged breakwaters can’t completely retain the suspended sediments in water bodies below the breakwater crest.
In brief, the sedimentation reduction effect of a submerged breakwater is a broad topic, involving both macroscopic and microscopic factors. The former factors include the local hydrodynamic environment, sediment transport characteristics, the plane layout of submerged breakwaters, etc. The latter factors include the submerged breakwater height and section shape, and interactions between the water, sediments, and structures. In channel regulation engineering design, it is necessary to conduct in-depth research using different technical methods, make use of the experience gained from similar projects, and rationally estimate the sedimentation reduction effect of submerged breakwaters.


