Article

Numerical Investigation of Unsteady Cavitation Dynamics over a NACA66 Hydrofoil near a Free Surface

1
School of Naval Architecture, Dalian University of Technology, Dalian 116024, China
2
State Key Laboratory of Structural Analysis for Industrial Equipment, Dalian 116024, China
3
Collaborative Innovation Center for Advanced Ship and Deep-Sea Exploration, Shanghai 200240, China
4
China Institute of Water Resources and Hydropower Research, Beijing 100038, China
5
Department of Ocean Engineering, Texas A&M University, College Station, TX 77843, USA
*
Author to whom correspondence should be addressed.
J. Mar. Sci. Eng. 2020, 8(5), 341; https://doi.org/10.3390/jmse8050341
Submission received: 21 April 2020 / Revised: 7 May 2020 / Accepted: 8 May 2020 / Published: 11 May 2020
(This article belongs to the Special Issue CFD Simulations of Marine Hydrodynamics)

Abstract

:
Cavitation is a typical and unavoidable phenomenon for small waterline ships and high-speed vehicles. It creates a highly complex multiphase flow near the free surface and is primarily represented by the free surface-cavitation interaction. In this paper, the large-eddy method and Schnerr-Sauer cavitation model are combined to address the effects of a free surface on the cavitation dynamics of a NACA66 hydrofoil. The numerical method is validated by comparing the cavitation morphology and pressure with available experimental data. The results show that the presence of a free surface affects the cavitation evolution and hydrodynamic load characteristics. Compared with the non-free surface case for the same cavitation number, the free surface suppresses the cavitation intensity and increases the frequency of cavitation shedding. Furthermore, an improved dynamic mode decomposition method is applied to investigate the unsteady cavitation flow features. The results show a correlation between the characteristic mode and the flow state. Meanwhile, the presence of a free surface is found to reduce the energy content in each order mode and results in smaller scale of the coherent structure in higher-order modes. Moreover, with increasing distance from the hydrofoil to the free surface, the cavitation intensity increases, as well as the average lift and drag coefficients. In particular, significant free-surface unsteady fluctuations are observed in the wake region.

1. Introduction

Cavitation is a complex phenomenon that occurs when the local pressure in a liquid drops below the local saturated vapor pressure. This pressure drop always occurs around a rapidly moving object and is generated at the internal or liquid-solid interface of the liquid [1,2]. Cavitation can cause performance degradation, corrosion, vibration, and noise in hydraulic machinery, and is a major factor in fluid instability [3,4,5]. Particularly for the underwater region of a high-speed vehicle located near a free surface, free surface-cavity interactions render the flow field more complicated [6].
Unsteady cavitation flows are an important problem for ocean engineering [7,8,9]. Knapp [10] observed and analyzed cloud-cavitation flows, demonstrating that the re-entrant flow starting from the closed position of the cavitation causes the cloud cavitation to break off. Kubota et al. [11] measured the flow structure of cloud cavitation using a laser Doppler anemometer (LDA) and compared it with the results obtained by a high-speed camera. The authors found a maximum of vorticity in the center of the cloud cavitation. Kawanami et al. [12] studied the nature of cavitation flow instability and found that cloud-like cavitations are closely related to retroreflective flows in a closed bubble. Reissman et al. [13] studied cloud-like cavitation around an oscillating hydrofoil using high-speed cameras and pressure sensors, and investigated the mechanism of transient pressure pulses near the detached cavitation. Arndt et al. [14] studied the flow of an NACA0015 hydrofoil from flaky cavitation to cloud cavitation by combining experimental and numerical methods. The authors observed two competing cavitation shedding induction mechanisms: re-entrant flow and a shock wave with the cavitating flow; moreover, they presented the dominant conditions for these two mechanisms. Gopalan et al. [15] proposed that the vortex generation and collapse are important characteristics of a cavitation flow. Leroux et al. [16,17] observed the cavitation flow of a NACA66 hydrofoil and proposed that the re-entrant flow is the primary cause of cavitation shedding. Passandideh-Fard and Roohi [18] used a modified VOF method to capture the gas-liquid interface of a two-dimensional cavitation flow field. The results show that the modified VOF method has higher calculation efficiency and calculation accuracy. Ganesh et al. [19] used wedges to study the transformation from sheet cavitation to cloud cavitation. Pendar and Roohi [20] used large eddy simulation to study cavitation around a sphere and compared with non-cavitation flow field. The result shows that cavitation suppresses instability near wake region and delays 3D decomposition of the vortex. Capurso et al. [21] simulated the hydrofoil with a passive control system. Their study indicated that passive control system suppress the cavitation effectively, which provides an effective solution to avoid the influence of cavity erosion on hydrofoil. Cheng et al. [22,23] used large-eddy simulations (LES) to capture an unstable tip leakage cavitation flow, and the spatial evolution of the tip leakage cavitation flow was divided into three stages. The results revealed how cavitation affects vorticity and turbulence. Researchers have performed numerous studies on cavitating flows at an infinite water depth; however, studies on cavity dynamics near free surface are limited.
Dawson [24] observed supercavitation near a free surface; however, the cavitating flow in the experiments was generated by ventilation under low-velocity restriction in a tunnel. Theoretical analysis and numerical simulations are the primary research methods used at present [25,26,27,28]. Faltinsen [29] proposed a theoretical model for free surface effects of hydrofoil cavitation. Kinzel et al. [30] simulated the supercavitation of the hydrofoil under a free surface and proved that using time accurate multiphase Navier-Stokes CFD method to simulate cavitation near the free surface is feasible. Wang et al. [31] performed experiments and simulations on the cavitation of a revolving body near a free surface. It has been proposed that the free surface will reduce the re-evaporation of the cavitation, and that the cavitation will become more stable as it approaches the free surface. Based on Wang’s result, a multiphase flow solver for simulating near-free-surface cavitation flows has been proposed and validated [32,33]. The numerical simulation has been proven to be capable of analyzing the effect of unsteady cavitation flows near a free surface. However, the cavitation flow field evolution and cavitation dynamics under near-free-surface condition remain unclear.
Due to the limitations of experimental measurement techniques, increasingly more scholars have begun to use numerical methods to study cavitation flow phenomena. Due to the strong instability of the flow near the cavitation, the simulation method plays an important role in the numerical calculation. Most previous simulations used the Reynolds average Navier-Stokes (RANS) method for cavitation calculations due to its low computational complexity and high computational efficiency [34,35]. However, this method overestimates the turbulent eddy viscosity and the peak pressure pulsation of the cavitation [36]. With recent advances in computational power, LESs have arisen as a superior choice for simulating cavitation flows [37]. Pendar and Roohi [38] studied the cavities length and diameter of hemispherical heads and cone cavitators under different cavitation numbers by using different turbulence models and cavitation models. As a result, the combination of different turbulence models and cavitation models on the surface has different predictions of cavitation shapes. Sedlar et al., [39] used an NACA2412 hydrofoil to simulate cavitation flows under different turbulence models. The results showed that the pressure pulsation and shedding cycle frequency obtained by the LES are similar to the experimental values. The LES model can predict the unstable nature of the flow, accurately capture small-scale vortices, forecast the flow field, and provides insight into the flow details [40,41,42]. Therefore, the cavitation-flow LES model has been used to predict multiscale turbulent vortex characteristics.
For complex cavitation-vortex interactions in cavitating flow, it is important to study the coherent structure of turbulence. In recent years, modal decomposition techniques have been gradually applied to computational fluid dynamics. These techniques are considered as important analytical tools for assessing nonlinear fluctuation data. Intrinsic mode decomposition (POD) and dynamic mode decomposition (DMD) are the two primary methods of modal decomposition. However, the POD method may contain multiple frequency components in single modality; thus, the frequency information of each coherent mode cannot be provided [43,44]. The DMD method sorts the components according to the frequency, with single-frequency modalities that show strong advantages in the analysis of flow characteristics. The standard DMD method is based on the Koopman analysis of nonlinear dynamical systems, which was originally proposed by Schmid et al. [45]. Vinha et al. [46] used the DMD method to analyze the jet pulsation behavior and cavitation flow caused by different jet shapes. Prothin et al. [47] and Liu et al. [5] combined POD with the DMD method to study the development of hydrofoil cavitation under a high Reynolds number. The cavitation flow field modes of two different positions of the hydrofoil were analyzed, and it was proposed that the DMD method can more accurately extract the frequency characteristics.
At present, most studies on unsteady cavitating flows over a hydrofoil have been performed for an infinite water depth. However, study on cavitation flows near the free surface is still limited, especially the mechanism of interaction between free surface and cavitation is unclear. This paper presents a numerical study of the unsteady cavitation dynamics over a NACA66 hydrofoil near the free surface. Section 2 introduces the numerical framework, including basic governing equations, cavitation models, turbulence models, numerical setup and validations. Section 3 presents the effects of the free surface on the unsteady cavitation. An improved DMD method is applied to investigate the unsteady cavitating flows fealtures. Finally, Section 4 summarizes the main conclusions.

2. Numerical Methods

2.1. Governing Equations

The volume fraction of phase n is:
α n = V n V
where Vn is the volume of phase n and V is the total volume.
The governing equations of the mixture model are:
ρ t + ( ρ u j ) x j = 0
( ρ u i ) t + ( ρ u i u j ) x j = p x i + x j ( μ u i x j )
where p is the pressure, and ui is the velocity along the i-th direction.
The mixture density ρ is:
ρ = α l ρ l + ( 1 α l ) ρ v
where α l is the liquid volume fraction, ρl is the liquid density and ρν is the vapor density.

2.2. Large-Eddy Simulation Model

The LES model can divide the vortices in a turbulent flow into large-scale vortices and small-scale vortices by using a filtering function. Direct numerical calculations are used to solve the large-scale vortices, and small-scale vortices are calculated via a connection with large-scale vortices. The LES governing equations are:
ρ t + ( ρ u ¯ j ) x j = 0
( ρ u ¯ i ) t + ( ρ u ¯ i u ¯ j ) x j = p ¯ x i + x j ( μ u ¯ i x j ) ( ρ τ i j ) x j
where τ i j is the nonlinear sub-grid scale (SGS) stress tensor, which is defined as:
τ i j = ρ u i u j ¯ u ¯ i u ¯ j
The product of the fluid strain rate, S ¯ i j and an assumed sub-grid viscosity υ S G S is used to describe the tensor, which is based on the Boussinesq hypothesis:
τ i j 1 3 τ k k δ i j = 2 υ S G S S ¯ i j
The SGS model used in this work is the WALE model [48], which is given as:
υ S G S = ρ L s 2 ( S i j d S i j d ) 3 / 2 ( S ¯ i j S ¯ i j ) 5 / 2 + ( S i j d S i j d ) 5 / 4
S ¯ i j = 1 2 ( u ¯ i x j + u ¯ j x i )
S i j d = 1 2 ( g ¯ i j 2 + g ¯ j i 2 ) 1 3 δ i j g ¯ k k 2 , g ¯ i j = u ¯ i x j
where Ls is the length or grid-filter width, which is given as:
L s = min ( k d , C w V 1 / 3 )
Here, k is von Karman’s constant, d is the distance to the closest wall, V is the cell volume, and Cw is a model coefficient which is set to 0.5.

2.3. Cavitation Model

Cavitation models generally consist of transport equations. These models are usually obtained by simplifying and improving the Rayleigh-Plesset cavity dynamics equation [49,50]. The processes of evaporation and condensation can be expressed by inserting a source term into the transport equation to describe the phase transition rate. The Schnerr-Sauer model is used as the cavitation model [49], and the transfer equation is:
( ρ v α v ) t + ( ρ v α v u j ) x j = m ˙ + m ˙
where aν is the vapor volume fraction. The source terms m ˙ +   and m ˙ describe the evaporation and condensation which can be solved as:
m ˙ + = ρ v ρ l ρ α v ( 1 α v ) 3 R b 2 3 max ( p v p , 0 ) ρ l
m ˙ = ρ v ρ l ρ α v ( 1 α v ) 3 R b 2 3 max ( p p v , 0 ) ρ l
where m ˙ +   is the evaporation term, m ˙ is the condensation term, and pν is the saturation vapor pressure at the local temperature. Rb is the cavity radius which can be solved as:
R b = ( α v 1 α v 3 4 π 1 N b ) 1 3
where N b is the density of cavity number. According to Schnerr and Sauer [51], Nb = 1013.

2.4. Numerical Setup and Validation

For all the numerical simulations in the present study the Star-CCM+ software was used. A NACA66 hydrofoil was used in this work, which has a chord length C = 0.15 m and a span of 0.192 m. The angle of attack of the hydrofoil is 8°. The computational domain is shown in Figure 1. The velocity inlet of the computational domain is approximately 4C from the leading edge of the hydrofoil and the inflow velocity is V = 5.33 m/s, with a Reynolds number of Re = 0.8 × 10⁶. The outlet pressure can control the reference pressure of the flow field to adjust the cavitation number. The cavitation number is defined as:
σ = ( p p v ) / ( 0.5 ρ l V 2 )
where p is the far field pressure, which is set by the outlet boundary conditions. In order to be consistent with the experimental conditions [16], σ is set to 1.25 in this work. The saturated vapor pressure of water is pv = 2367 Pa for a flow-field temperature of 20 °C. To capture the effect of cavitation on the tail of the free surface, the pressure outlet was set to 20C downstream of the leading edge.
Figure 2a shows the mesh of the computational domain. The mesh is generated by the Star-CCM+ auto trimmed mesher and prism layer mesher. Transition area between prism layer mesh and trimmed mesh is unstructured type, and structured mesh is generated in other regions. The total number of mesh elements is approximately 3 × 10⁶ and the y+ < 1 over the hydrofoil surface to meet quality criterion requirements for LES, as shown in Figure 2b.The time step for the calculation is set to Δ t = 2.5 × 10 5 to ensure stability in the numerical calculation.
Three pressure-monitoring points were set on the mid-section of the hydrofoil, as shown in Figure 3.
The middle section along the spanwise length of the flow field is shown in Figure 4. The zero point of the primary coordinate system, XOY, is located at the leading edge of the hydrofoil. To represent the shape of the free surface, a local coordinate system, X1OY1, is established at the free surface of the velocity inlet.
In this paper, six working conditions are set under different depth conditions including the absence of a free surface condition and h = 1.25C, 1C, 0.75C, 0.5C, and 0.25C. In addition to the difference in depth from the free surface, the reference pressure also changes with the depth of the hydrofoil to keep the cavitation number at a constant.
To validate the numerical model, results from the numerical simulation and a previous experiment [16] were compared. In this experiment, numerical videos were used to record the cavitating flow, numbers of piezo-resistive transducers were used to measured pressure. Figure 5 shows the cavitation shape for a single cavitation cycle. T represents the period of cavity shedding. The numerical simulation accurately captured the periodic characteristics of the hydrofoil cavitation, such as the growing, shedding and collapsing processes. The cavitation shape is also well predicted by the numerical simulation. It shows that the numerical cavitation shape matches well with the experimental cavitation shape.
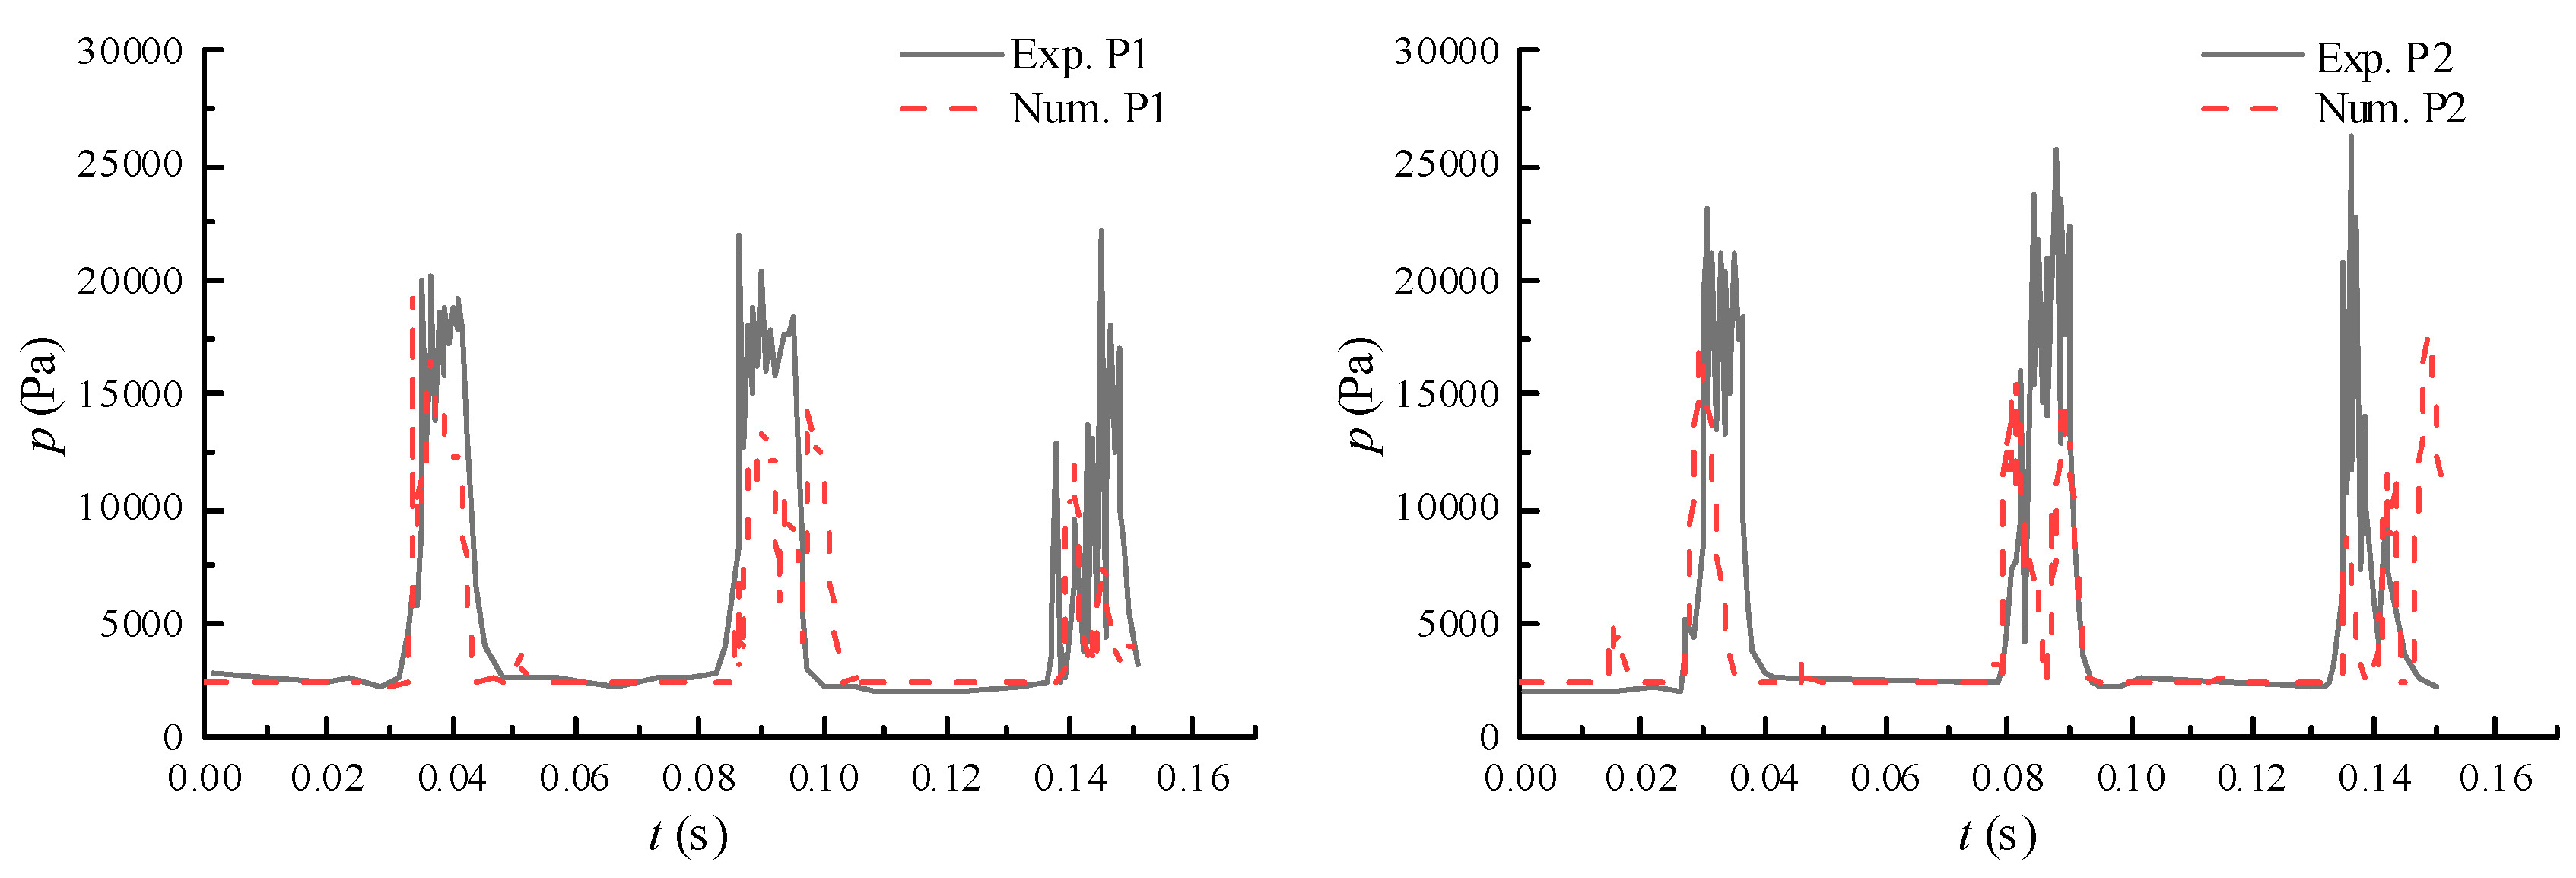
A collapse of the cavitation can lead to dramatic fluctuations in pressure. Thus, the dynamic pressure is difficult to predict. Numerical predictions of the pressure fluctuations at points P1 and P2 are plotted in Figure 6. As indicated by the experimental measurements, the pressure fluctuations caused by the cavitation collapse and the periodicity of the cloud cavitation flow are well predicted. The numerical prediction of cavitation shape and pressure results are highly consistent with experimental results indicating that the numerical method can effectively predict the unsteady cavitation dynamics.

3. Results and Discussion

3.1. Effect of a Free Surface on the Dynamic Cavity Evolution and Hydrodynamic Load

To evaluate the effect of a free surface on cavitating flows, Figure 7 shows the cavity shapes at eight typical times in one cycle for the cases of without free surface and near the free surface (h = 0.25C), where T0 and T1 represent the evolution cycles of without and with free surfaces, respectively.
It can be seen that the overall characteristics of cavitation evolution in a cycle in both cases are similar, including cavitation development (from t0 to t0 + 4T0/8), shedding (from t0 + 5T0/8 to t0 + 6T0/8) and collapsing (from t0 + 6T0/8 to t0 + 7T0/8). However, it is noted that the maximum length of the attached cavity for the near free surface condition is significantly shorter and the scale of cloud cavitation is smaller. Hence, the existence of free surfaces suppresses the cavitation intensity.
To explain the effect of free surface on the intensity of cavitation, we introduce the local cavitation numbers, which is defined as:
σ local = ( p local p v ) / ( 0.5 ρ l V 2 )
where σlocal is the local cavitation number and plocal is the local absolute pressure.
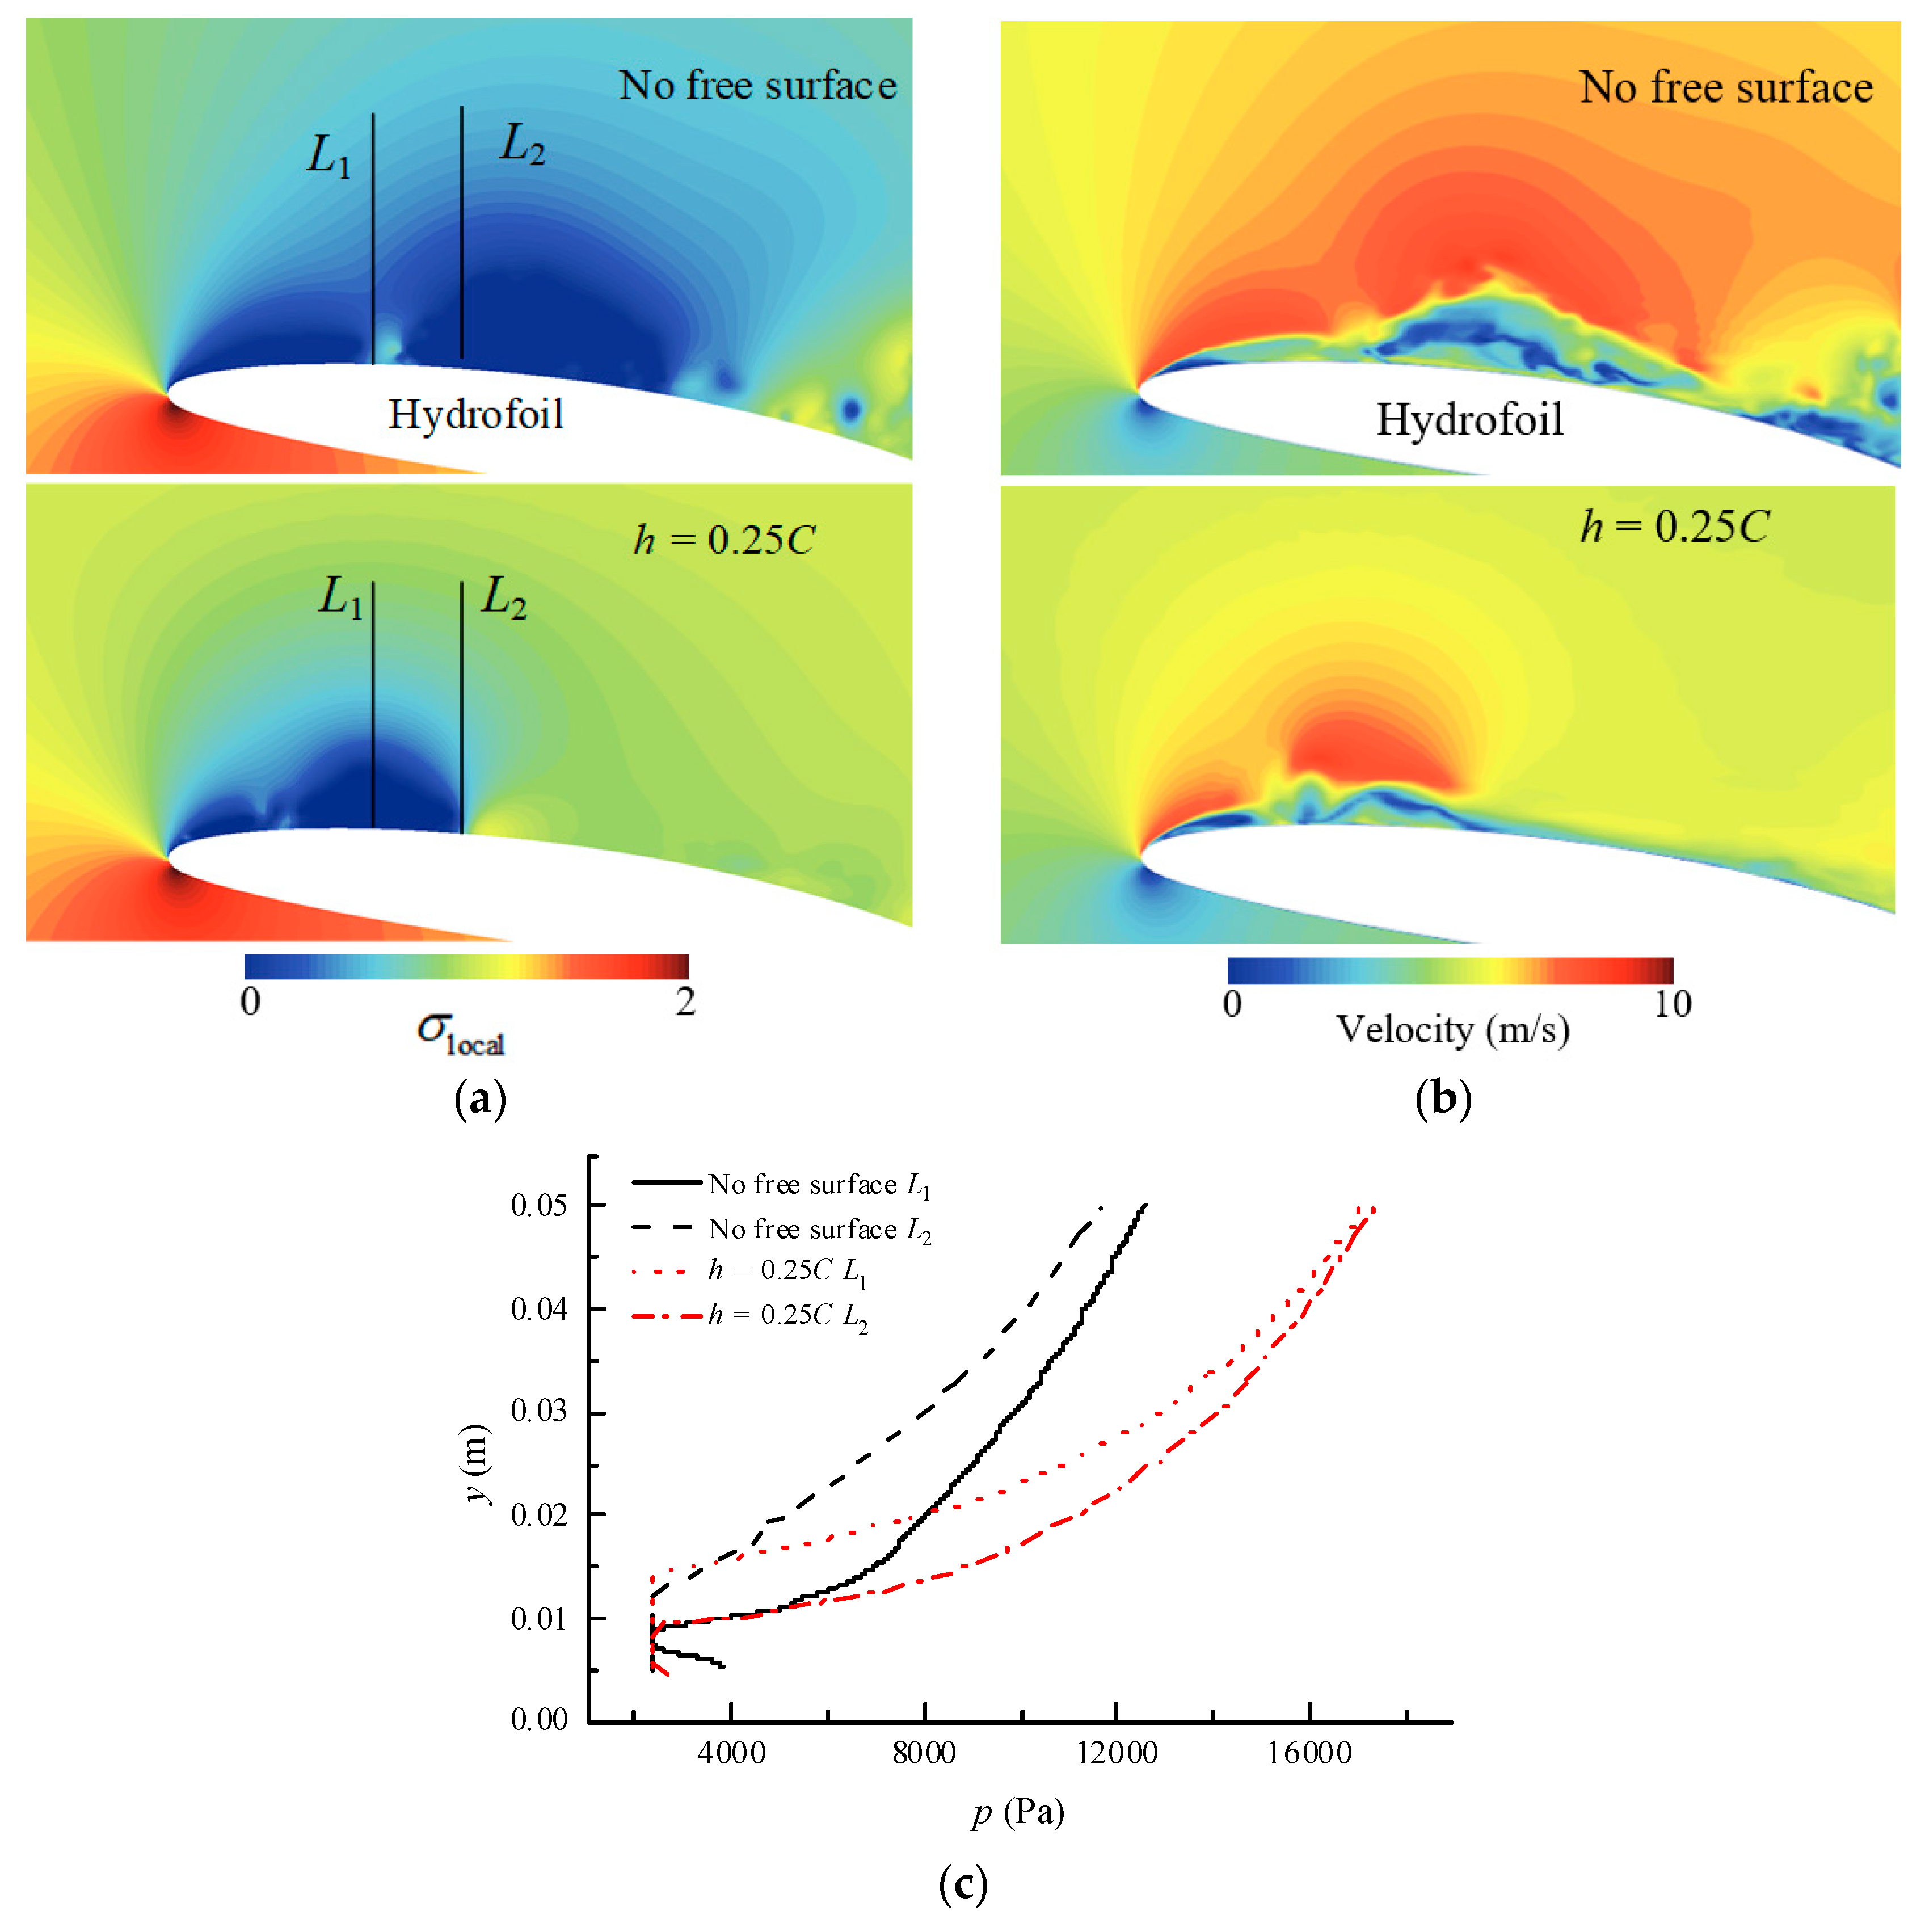
Figure 8a shows the local cavitation number and Figure 8b shows the local velocity field on the mid-section plane of the computational domain. The local cavitation number near the cavitation zone is close to zero. As the distance from cavitation increases, the local cavitation number increases, indicating that a cavitation is more difficult to produce. Changes in the cavitation number represent changes in absolute pressure. It can be seen from the corresponding local velocity field that the high speed area under no free surface condition is larger than near free surface condition. This indicates that the existence of the free surface reduces the velocity of the flow field around the hydrofoil and resulting in a weaker cavitation intensity. Two straight lines L1 and L2 are set along the y-direction at x/C = 0.2 and 0.3. The pressure value of L1 and L2 as the x coordinates, and the vertical distance from the hydrofoil head is the y coordinate, as shown in Figure 8b. When the value of y is small, the pressure is small due to the cavitation. The pressure increases as y increases. When y = 0.05 m, the pressure under the near-free surface condition is larger than no free surface condition. The results show that the pressure increases faster near free surface. Near the suction surface of the hydrofoil, the free surface makes the pressure change more drastic, which leads to a larger local cavitation number. Subsequently, it is difficult to generate a cavitation, and the cavity length is reduced.
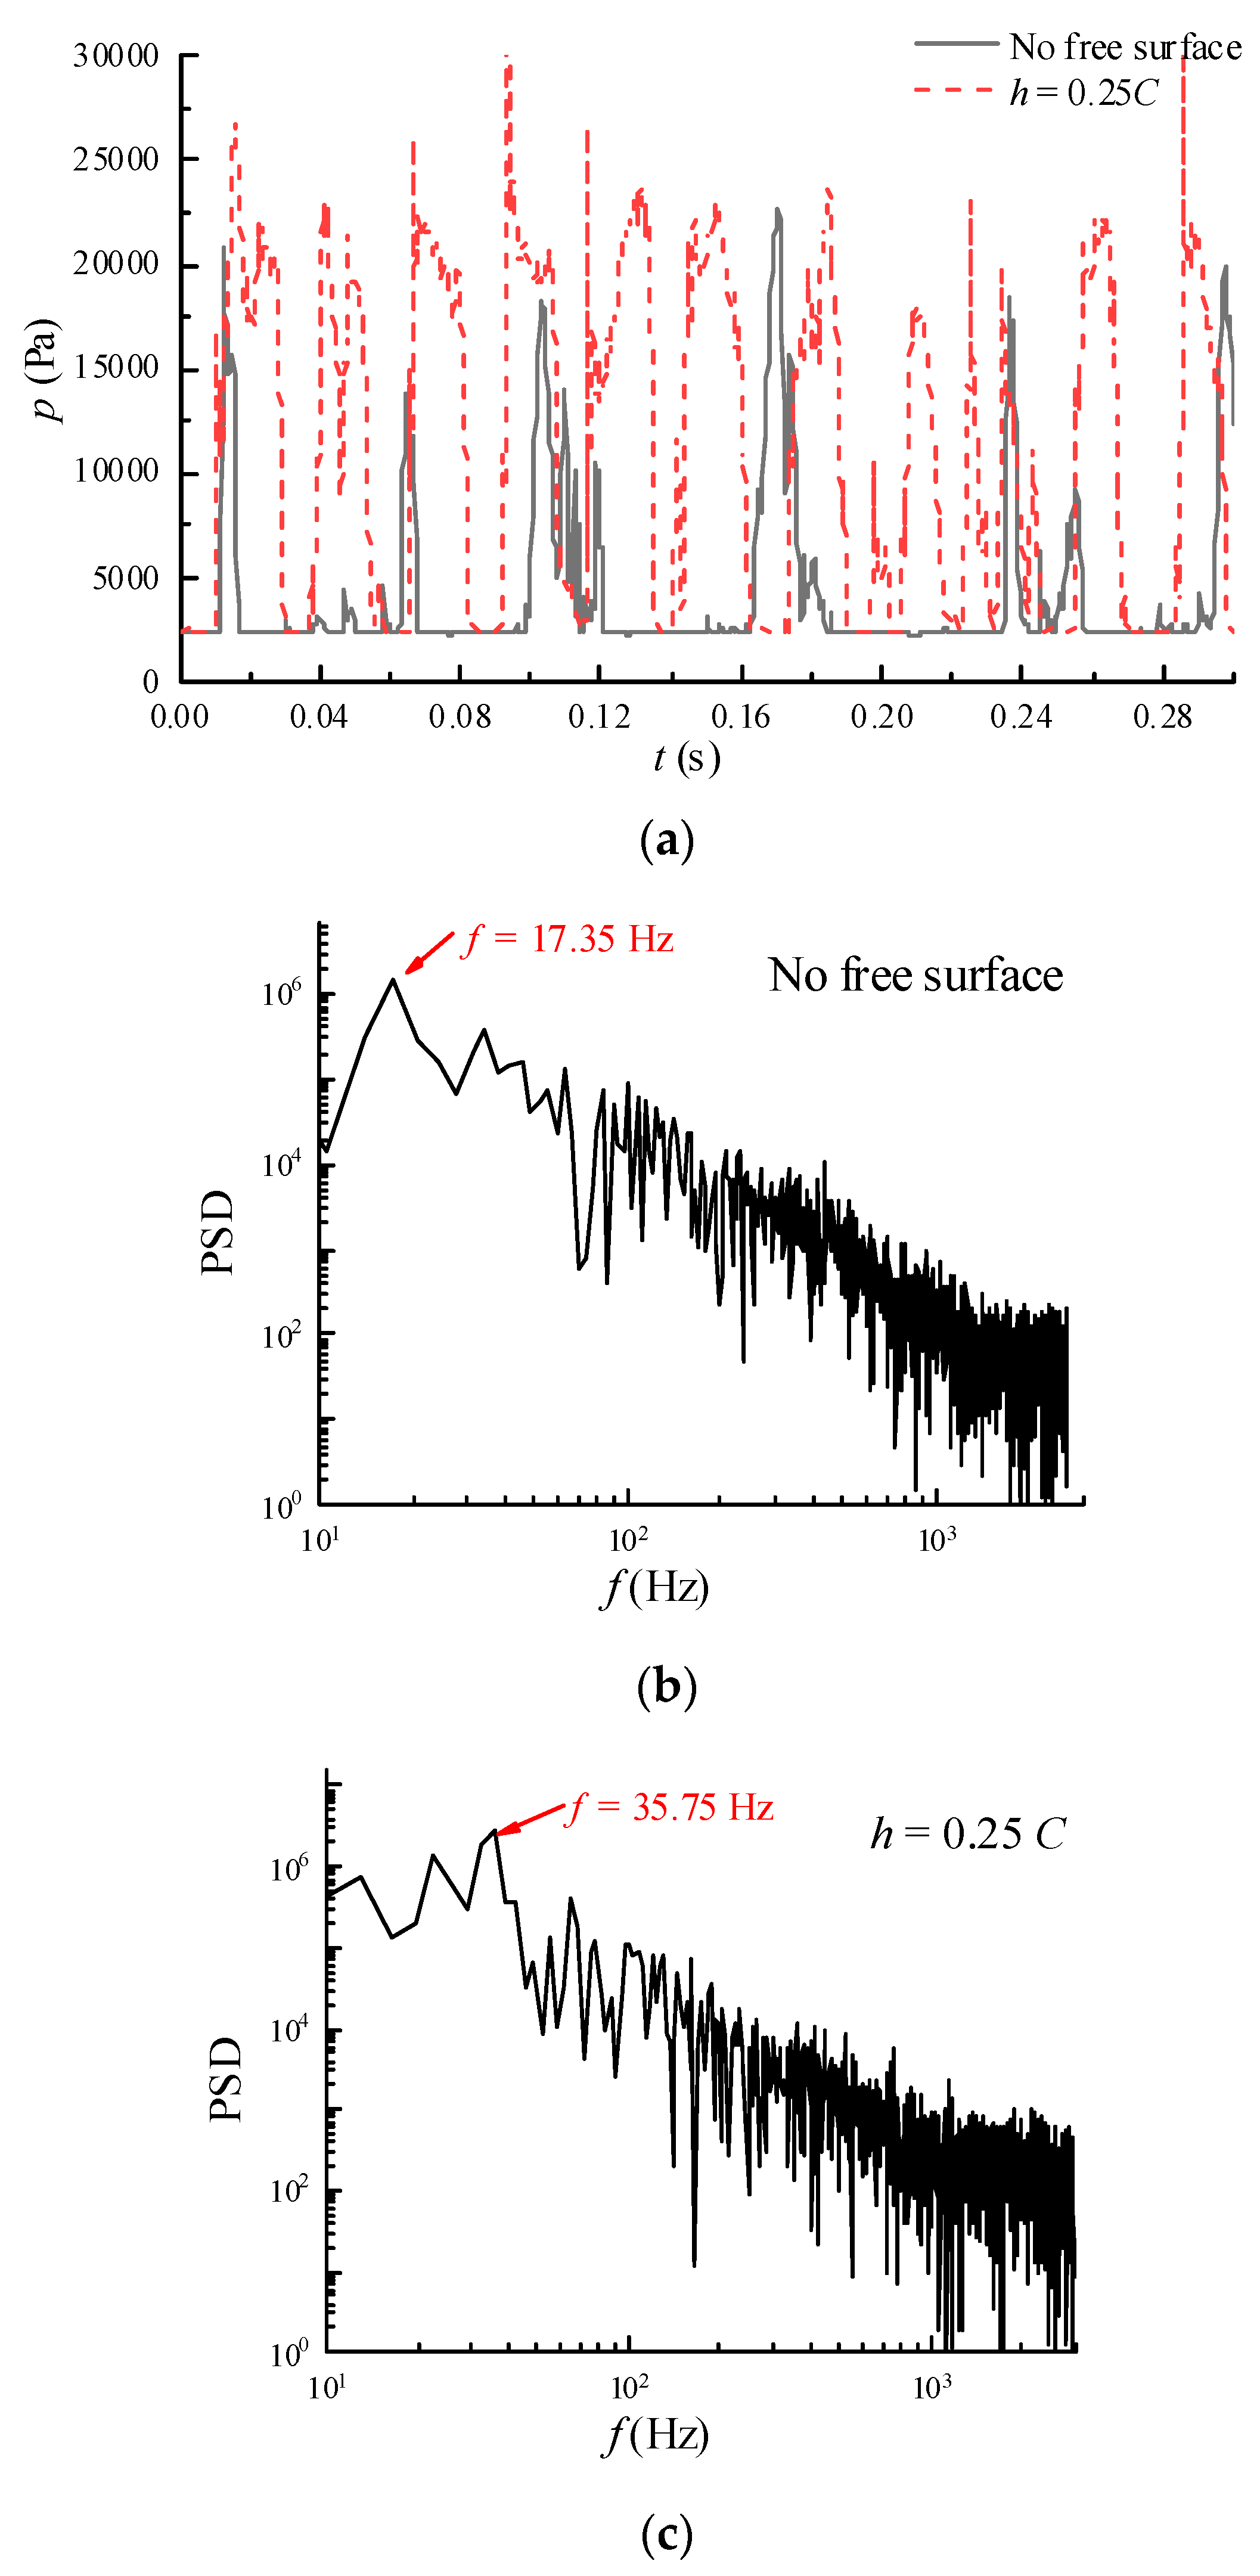
The effect of the free surface and the cavitation is also reflected in the pressure fluctuation on the hydrofoil surface, as shown in Figure 9a. As the cavitation develops, the pressure is equal to the saturated vapor pressure, and the pressure is stable. When the cavities begin to break off, the cloud cavitation produces a dramatic pressure fluctuation, which causes the pressure to increase.
This feature is reflected in the periodic fluctuations of the pressure curve. The cavitation shedding frequency for the near free surface condition is approximately twice that of the no free surface condition. Figure 9b,c show the power spectral density (PSD) of the pressure curve for the two cases. The PSD curve indicates that the dominant frequency of periodic cavitation shedding is approximately 17.35 Hz in the absence of a free surface and approximately 35.75 Hz near the free surface. This difference is due to the reduced cavity length that occurs near a free surface and the time required for the cavities to develop and collapse which leads to an increased cavitation cycle frequency.
Figure 10 shows fluctuations in the lift and drag coefficients, which are defined as:
C L = Lift 0.5 ρ × V 2 × C × Span
C D = Drag 0.5 ρ × V 2 × C × Span
Due to the periodic fluctuations in pressure, the fluctuations in the lift and drag coefficients over time also appear cyclical. However, due to the strong instability of the cavitation flow, the periodic fluctuations of the lift and drag coefficients are not obvious.
Comparison shows that both coefficients are smaller under the near free surface case than under the no free surface case, which indicates that the free surface weakens the lift and drag of the hydrofoil by reducing the cavity length. Both the lift and drag coefficients have the same influencing factors: free surface and cavitation. The lift and drag coefficients increase with the increase in submergence ratio h/C [29]. Another influencing factor is that the low-pressure region of the hydrofoil suction surface is also reduced due to the reduction in the length of the cavitation. As the length of the cavity decreases, the pressure difference between the suction and pressure plane of the hydrofoil decreases. Hence, the existence of free surfaces reduces the lift and drag coefficients compared with the case of no free surface.

3.2. Analysis of the Flow Structure Based on the DMD Method

When the cloud cavity breaks off, a strong vortex is generated. The analysis of vortex structures is an important component in studying cavitation flows. The DMD method can effectively extract the modal information of each order in the cavitation flow field, and can analyze the vortex structure of each mode. For details on the standard DMD method, we refer the reader to previous publications [45]. It is assumed that the total number of snapshots is N and the time-space flow field of an unsteady flow can be represented as a matrix V 1 N :
V 1 N = [ v 1 , v 2 , , v N ]
where the column vector v i represents the i-th snapshot of the flow field. Next, A is defined as an approximation of the nonlinear mapping, indicating the evolution of the matrix from one timepoint to the next, which is expressed by:
v i + 1 = A v i
Then, the dynamic flow system is represented by the mapping matrix A. Matrix V 1 N can be defined as:
V 1 N = [ v 1 , A v 1 , A 2 v 1 , , A N 1 v 1 ]
Assuming that a i are coefficients of A, the last snapshot v N can be formulated by the previous N 1 vectors:
v n = a 1 v 1 + a 2 v 2 + + a N 1 v N 1 + r
or:
A V 1 N 1 = V 1 N 1 S + r e N 1 T V 1 N 1 S
where r is the residual vector, e N 1 T is the ( N 1 )-th unit vector and matrix S is formed as:
S = [ 0 a 1 1 0 a 2 1 0 a N 2 1 a N 1 ]
when the residual r is small, the eigenvalue of S approximates the eigenvalue of A. The S matrix can be regarded as a low-dimensional form of matrix A; therefore, the eigenvalue of S can represent the main eigenvalues in matrix A. Eigenvalue decomposition is performed on matrix S:
S = P N P 1 , N = d i a g ( μ 1 , , μ N 1 )
where P is the matrix of the eigenvectors of matrix S.
The dynamic mode φ can be formed as follows:
φ = V 1 N 1 A
The first m flow field snapshots can represent the flow field snapshot at any time:
v i = j = 1 m μ j i 1 φ j
where m is the number of DMD modes and φ j is the column vector of the matrix φ .
The standard DMD method is not suitable for the convergence of strong unsteady flows such as cavitation [43]. Thus, in this paper, the raw velocity data are first processed, and then, DMD decomposition is performed.
The Hilbert-Huang transform is performed on the original velocity data [52]. For real-valued functions, f ( t ) , t ( ,   ) , the Hilbert transform is defined as a convolution of f ( t ) with 1 / t :
H [ f ( t ) ] = 1 π + f ( τ ) t τ d τ
H [ f ( t ) ] = | H [ f ( t ) ] | e j ϕ ( ω ) { j     ω > 0 + j     ω < 0
where:
ϕ ( ω ) = { π 2     ω > 0 + π 2     ω < 0
By performing a Hilbert transform on a real number function, the imaginary part of the function can be obtained, and the complex function can then be constructed.
Although the Hilbert transform can convert a real function into a complex function, its conditions are highly demanding, requiring the input signal to be linearly stable. In practical applications, it is difficult for most signals to meet such conditions; thus, the Hilbert transform cannot be directly used. Huang’s empirical mode decomposition (EMD) can be used to decompose the signal into several intrinsic mode functions (IMFs) and residual signals. When the residual signal is a monotonic function or lacks a maximum or minimum, the EMD ends. Here, we have:
ξ ( t ) = i = 1 K I M F i ( t ) + r K ( t )
where ξ(t) is the original signal, I M F i ( t ) is the eigenmode function, and r K is the residual. Now all IMFs meet the linear steady-state requirements and can be Hilbert transforms. Finally, the transformed IMF is superimposed with the residual, that is, the original signal is converted into a complex signal. The Hilbert Huang transform is applied to the velocity field data at each timepoint as the initial data of the DMD method, and then, the standard DMD is performed.
Generally, to select a suitable mode for analysis, the modes must be sorted according to the energy. The energy of a dynamic mode can be denoted by the norm, which is defined as follows:
φ i = i = 1 n | ϕ i | 2
where ϕ i is the velocity matrix of the i-th mode.
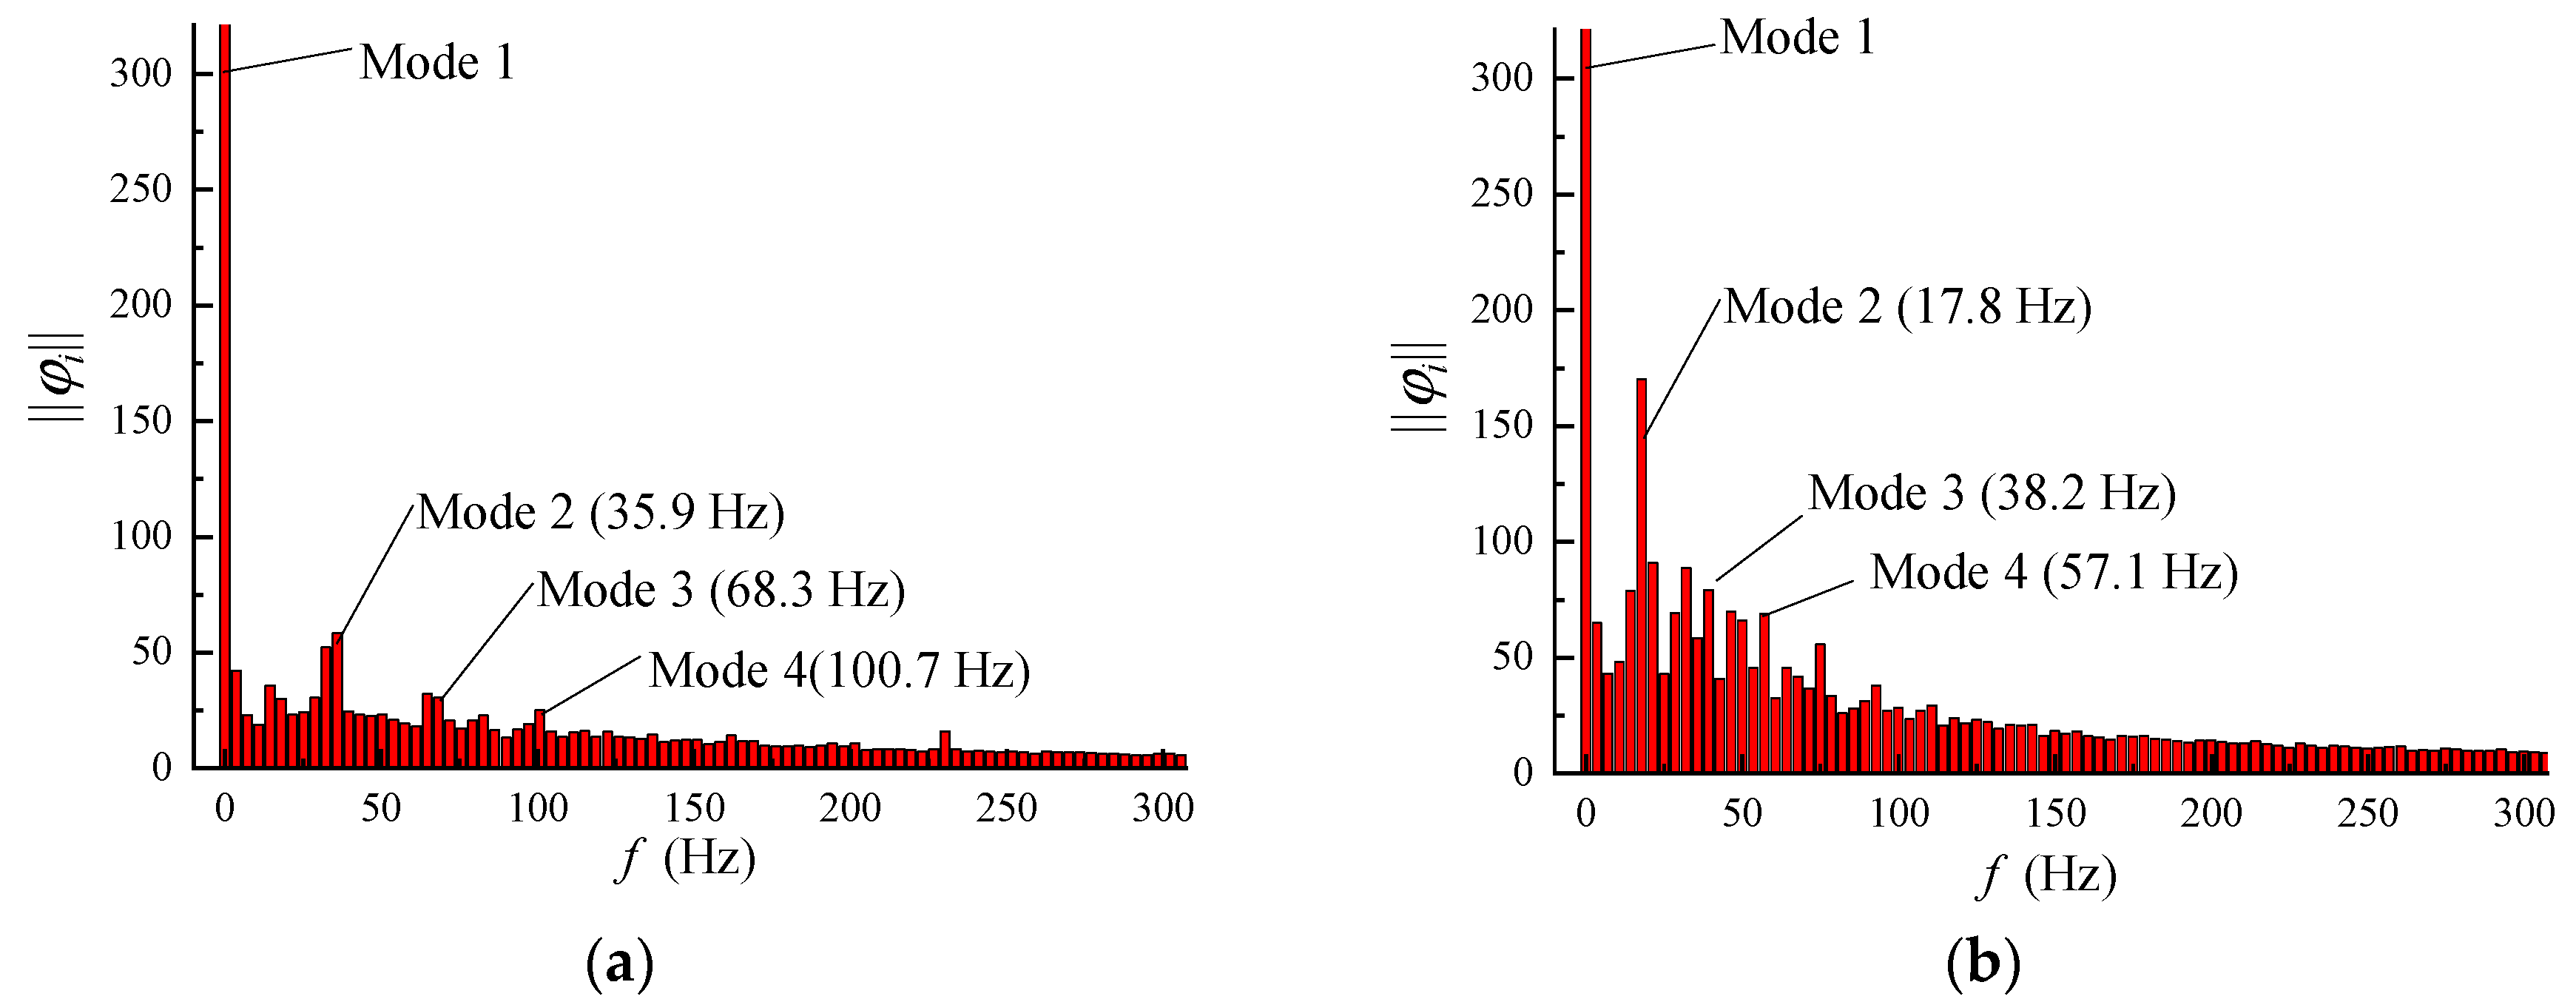
Figure 11 shows an energy spectrum of the dynamic modes. Mode 1 corresponding to a frequency of zero contains most of the energy of the flow field. Mode 2 contains the second greatest amount of energy in the flow field, and the corresponding frequency is close to the cavitation shedding frequency (35.75 Hz and 17.35 Hz) obtained in the previous section. The frequencies corresponding to mode 3 and mode 4 are close to two and three times of mode 2. Due to the strong instability of the cavitation flow field, the frequencies for mode 3 and 4 are not strictly two or three times the dominant frequency, which is acceptable. As shown in Figure 10a,b, for the near free surface case, the modes except for mode 1 contain significantly less energy than the no free surface case. This result indicates that the free surface inhibits the cavitation flow, which may explain why the length decreases for the near free surface cavitation case.
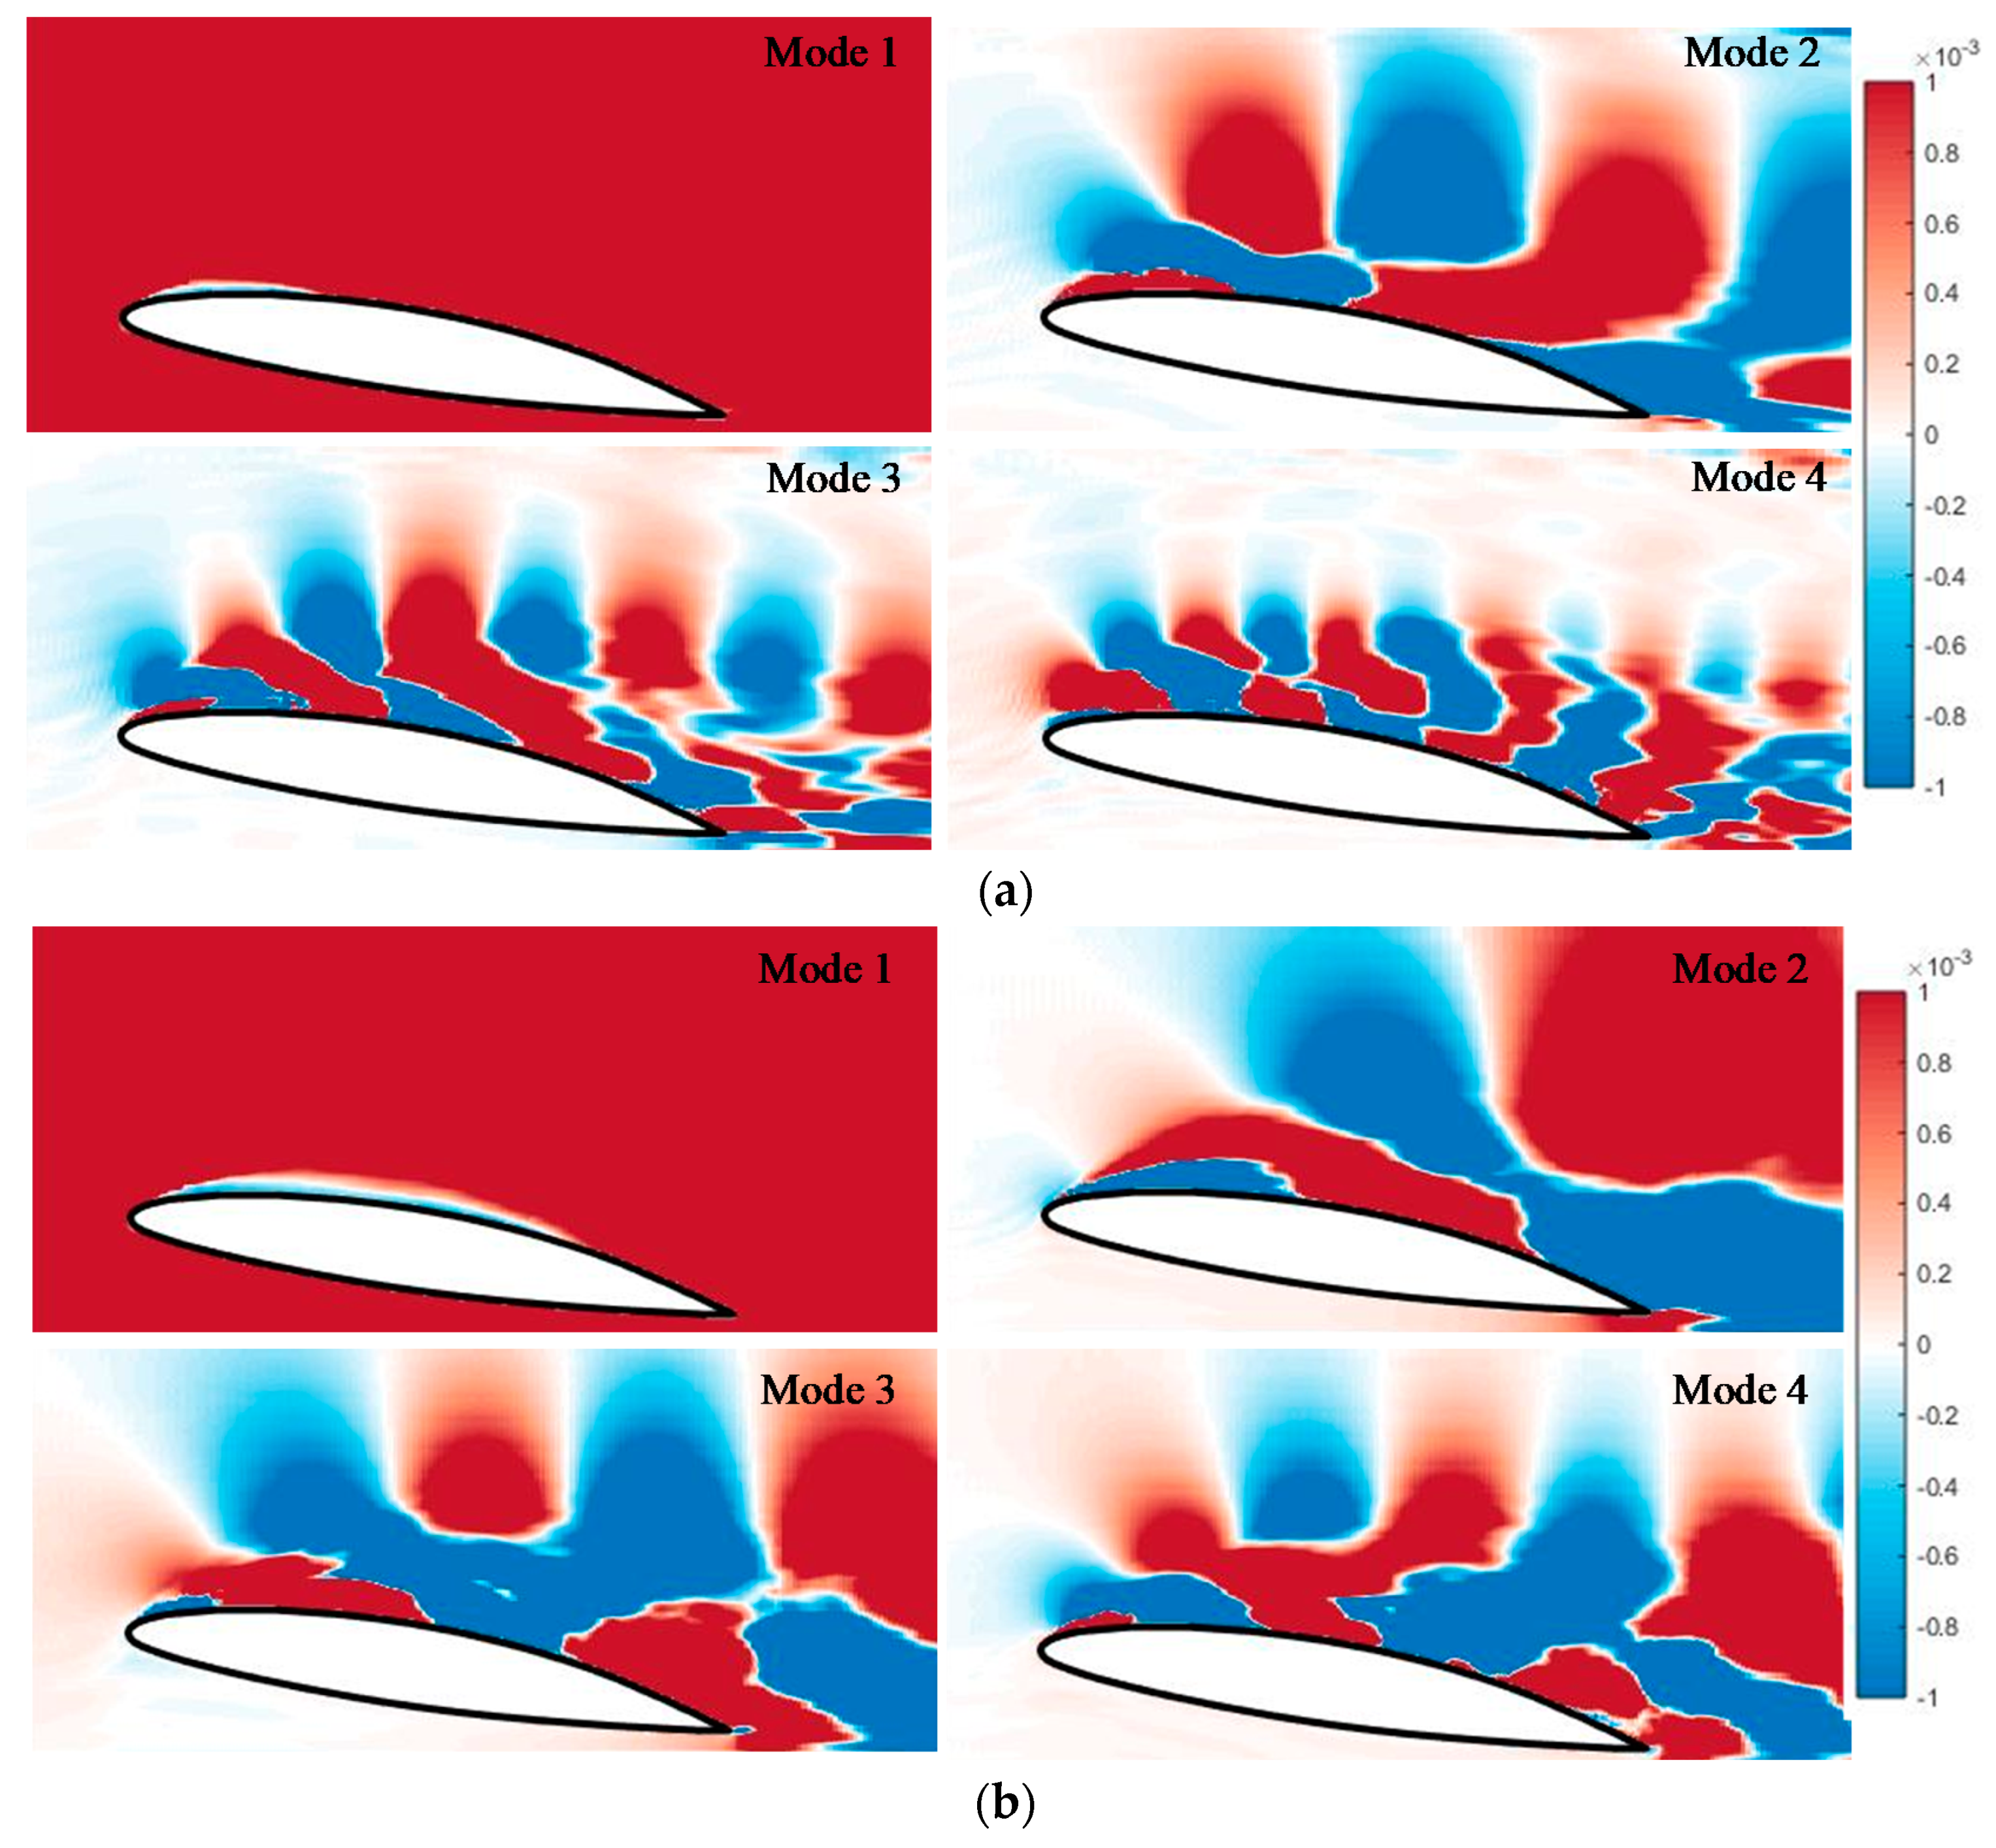
Figure 12a,b show the distributions of the real part of the dynamic modes on the mid-section plane. Mode 1 corresponds to an average flow field with a frequency of zero. The real part is negative only near the hydrofoil. The region of negative values is similar to the sheet cavitation region, and most other areas exhibit positive values. The positive and negative values alternately appear in couples for modes 2–4, reflecting the coherent structure of the turbulence. This phenomenon is due to the periodic development of the hydrofoil cavitation, which is caused as the vortex rolls up and sheds off. As the frequency increases, the scale of the coherent structure becomes smaller. Compared with the case shown in Figure 11a in the absence of a free surface, the dynamic mode scale is larger near the free surface, as shown in Figure 11b, and the coherent structure regions have a larger range. This phenomenon may arise because the turbulence generated by the hydrofoil near the free surface is not fully developed due to the influence of the free surface. Moreover, the energy contained in modes 2–4 is less when it is near the free surface.
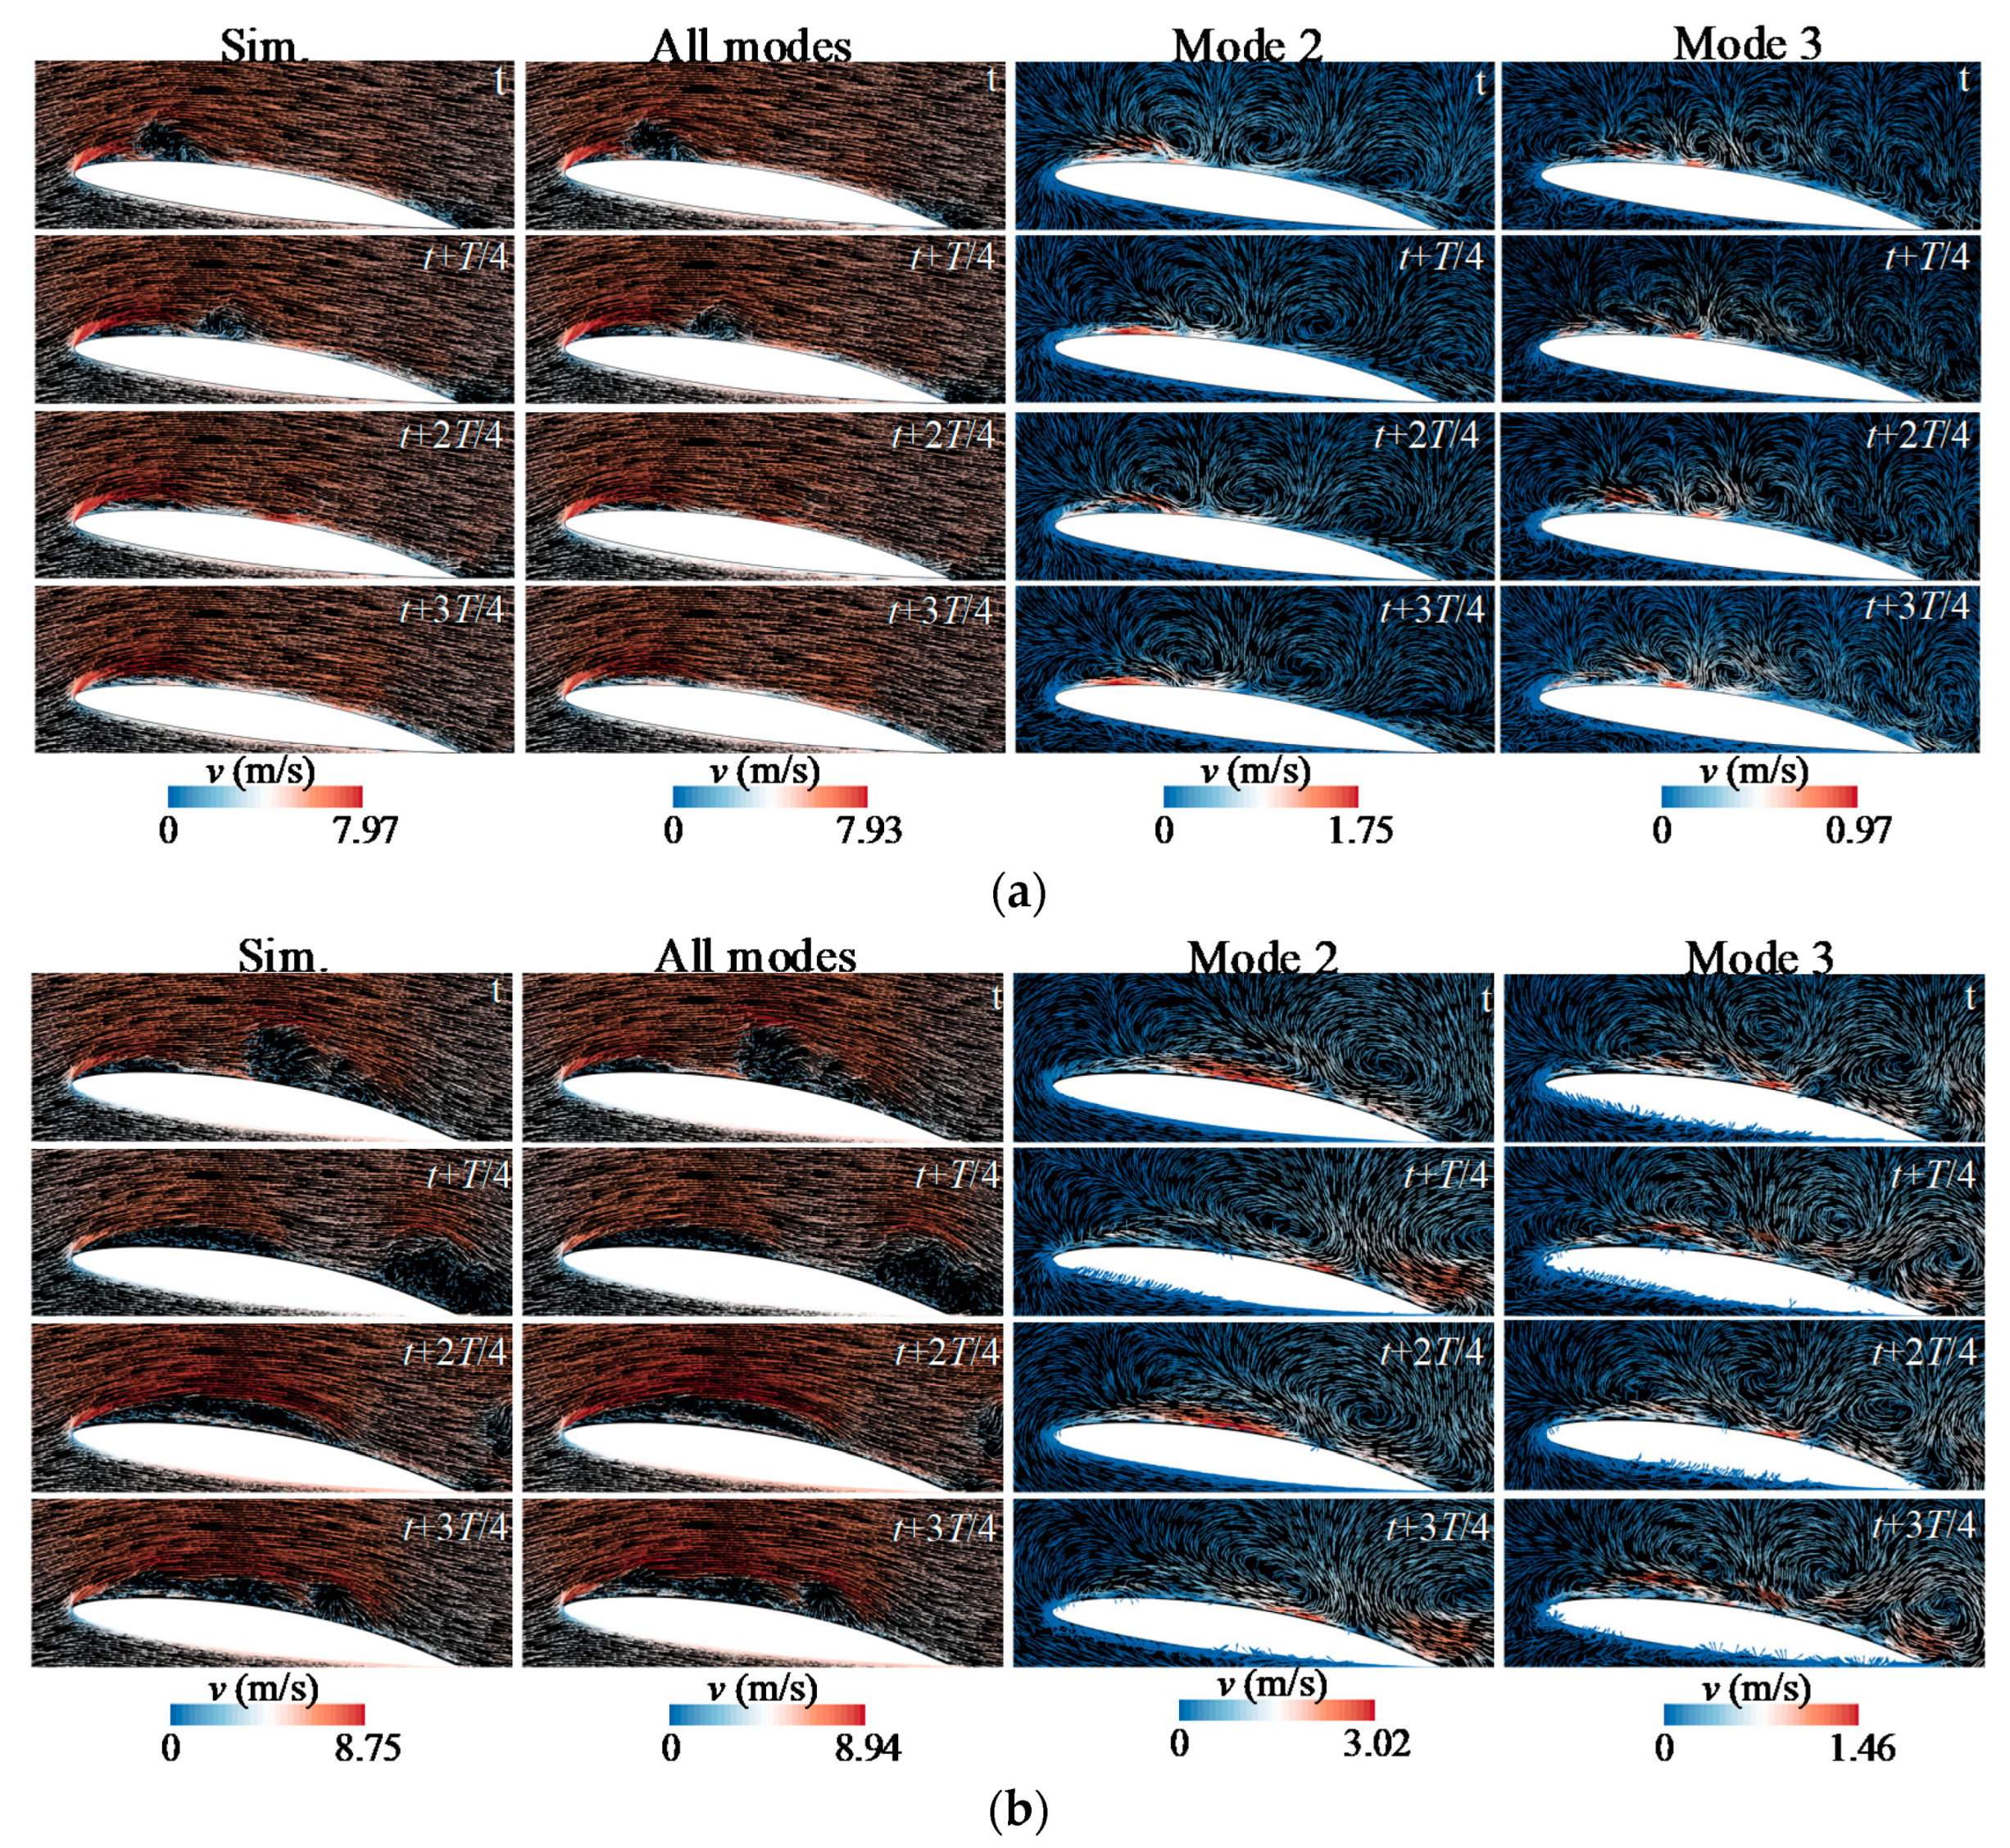
Reconstruction with different modes can result in flow patterns at different characteristic frequencies. In this way, the vortex motion characteristics of the flow field at different frequencies can be analyzed. Figure 13a shows the reconstructed flow field velocity vector over a single cavitation cycle near a free surface. The first column presents the numerical simulation results, and the second column displays the flow field reconstructed by all modes, which reflects the true state of the flow field. The flow field matches the numerical simulation results, demonstrating the effectiveness of the improved DMD method. Because mode 1 corresponds to a frequency of zero and it has no periodicity, it is not analyzed here. The third and fourth columns present the reconstructed flow fields for mode 2 and mode 3, respectively. It can be seen that in addition to mode 1, the coherent structure of the single-order mode is embodied as a vortex in the reconstructed flow field. Over a single period, a vortex structure is observed inside the sheet cavitation on the suction side of the hydrofoil. As the cavitation sheds off and transitions to cloud cavitation, the tails of the sheet cavitation form new vortices and move downstream. The scale of the vortex decreases as the dynamic mode increases, similar to the mode coherent structure. When there is no free surface, as shown in Figure 13b, the reconstructed flow fields of all modes are also similar to the numerical simulation results, which express the true state of the flow field. Compared with the near free surface case, in addition to the difference from the real flow field, the reconstructed flow fields for mode 2 and mode 3 exhibit significant deviations. In the absence of a free surface, the vortex formed by the shedding cavitation appears at a position further downstream, and the scale is larger than that near the free surface. This phenomenon indicates that the free surface has an inhibitory effect on the vortex generated by the cavitation, resulting in a reduced vortex scale.

3.3. Free Surface-Cavitation Interaction at Different Water Depths

In the previous section, the effect of a cavitation near a free surface was analyzed. For high-speed vehicles, the distance between the underwater component and the free surface is constantly changing during movement, and the effect of the free surface on the cavitation flow varies at different depths. To study the effect of depth on the cavitation, we carried out the cavitating flows over the hydrofoil at five different water depths.
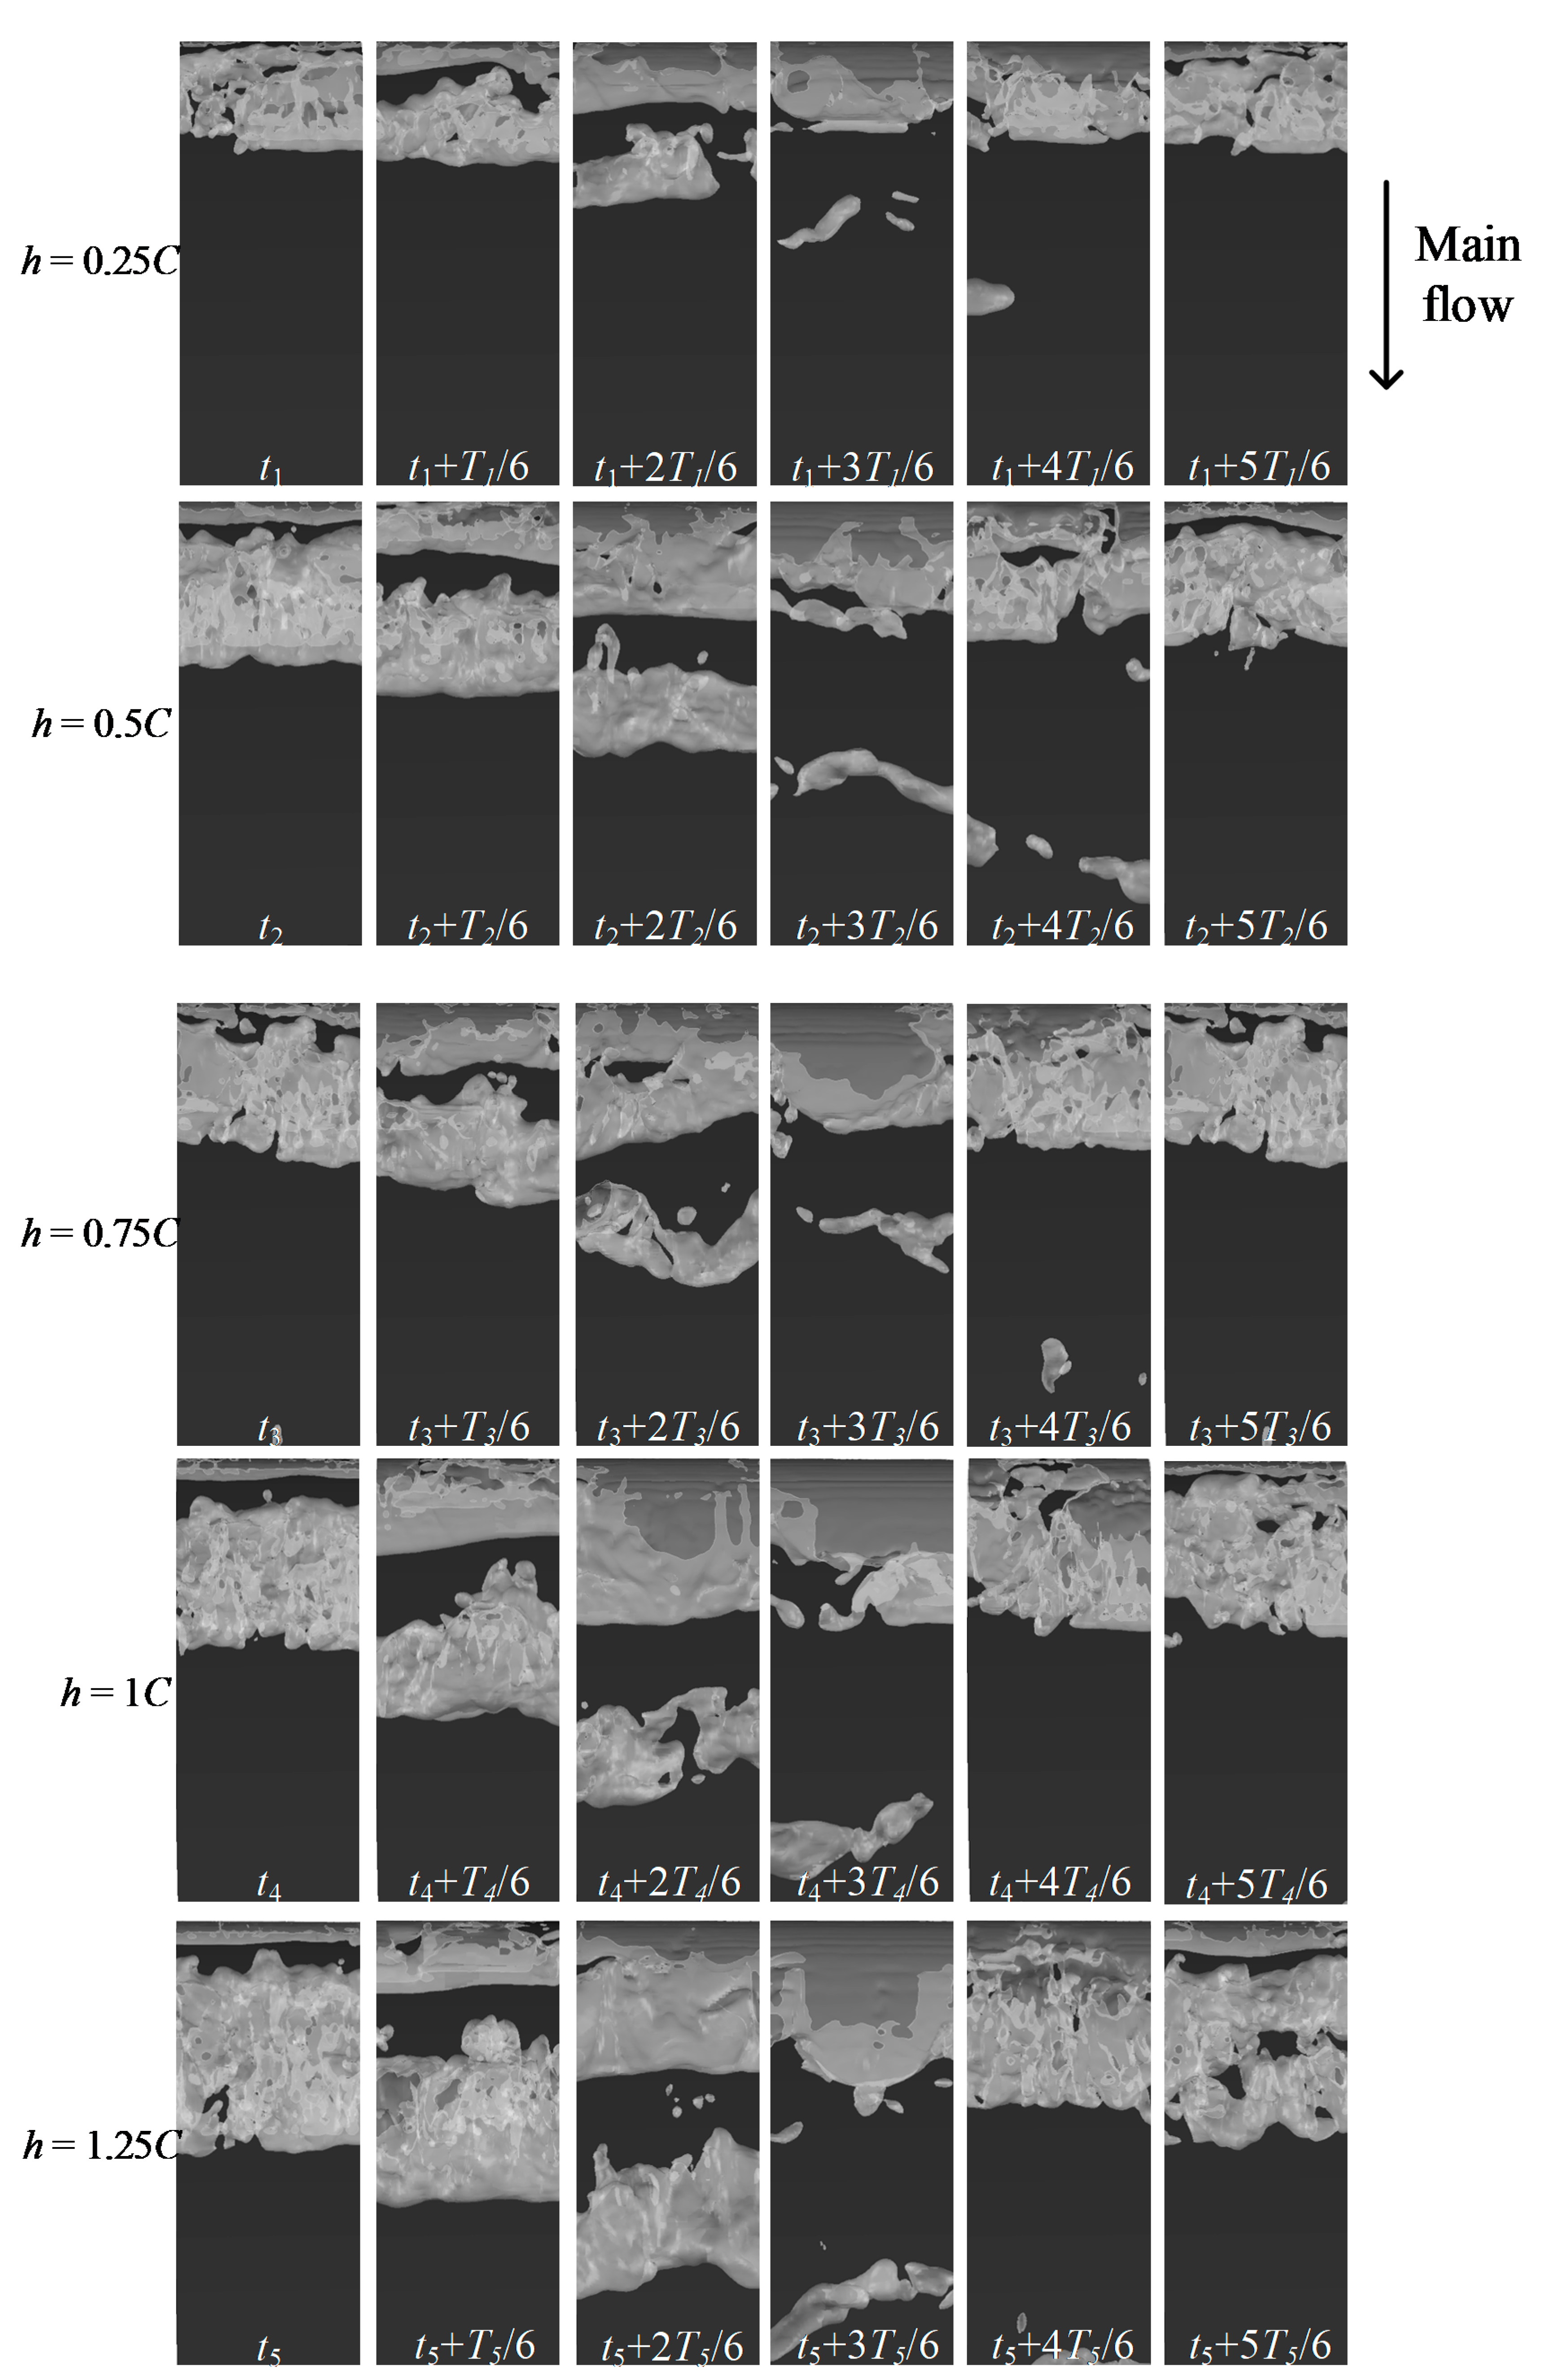
Figure 14 shows the cavity evolution for a typical cycle at five different depths. Similar typical cavitation characteristics can be observed in all cases: At t1, the sheet cavitation begins to develop downstream of the leading edge of the hydrofoil. Also, the cloud cavitation reaches its maximum. From t1 to t1 + 3T1/6, the sheet cavitation develops and reaches its maximum at t1 + 3T1/6. The cloud cavitation moves downstream and becomes smaller because of collapsing.
From t1 + 4T1/6 to t1 + 5T1/6, sheet cavitation begins shedding with the effect of the re-entrant flow, and then the next cycle begins. These characteristics are the same in the other four cases, where T2, T3, T4, and T5 represent different cycles for different cases.
The previous section described the influence on cavitation near a free surface, which shows a certain regularity at different depths. As the hydrofoil moves to greater depths, the cloud cavitation at the maximum size (ti) increases, and the sheet cavitation at the maximum size (ti + 3Ti/6) shows the same trend. Thus, the increase in water depth can promote the cavitation intensity at the same cavitation number.
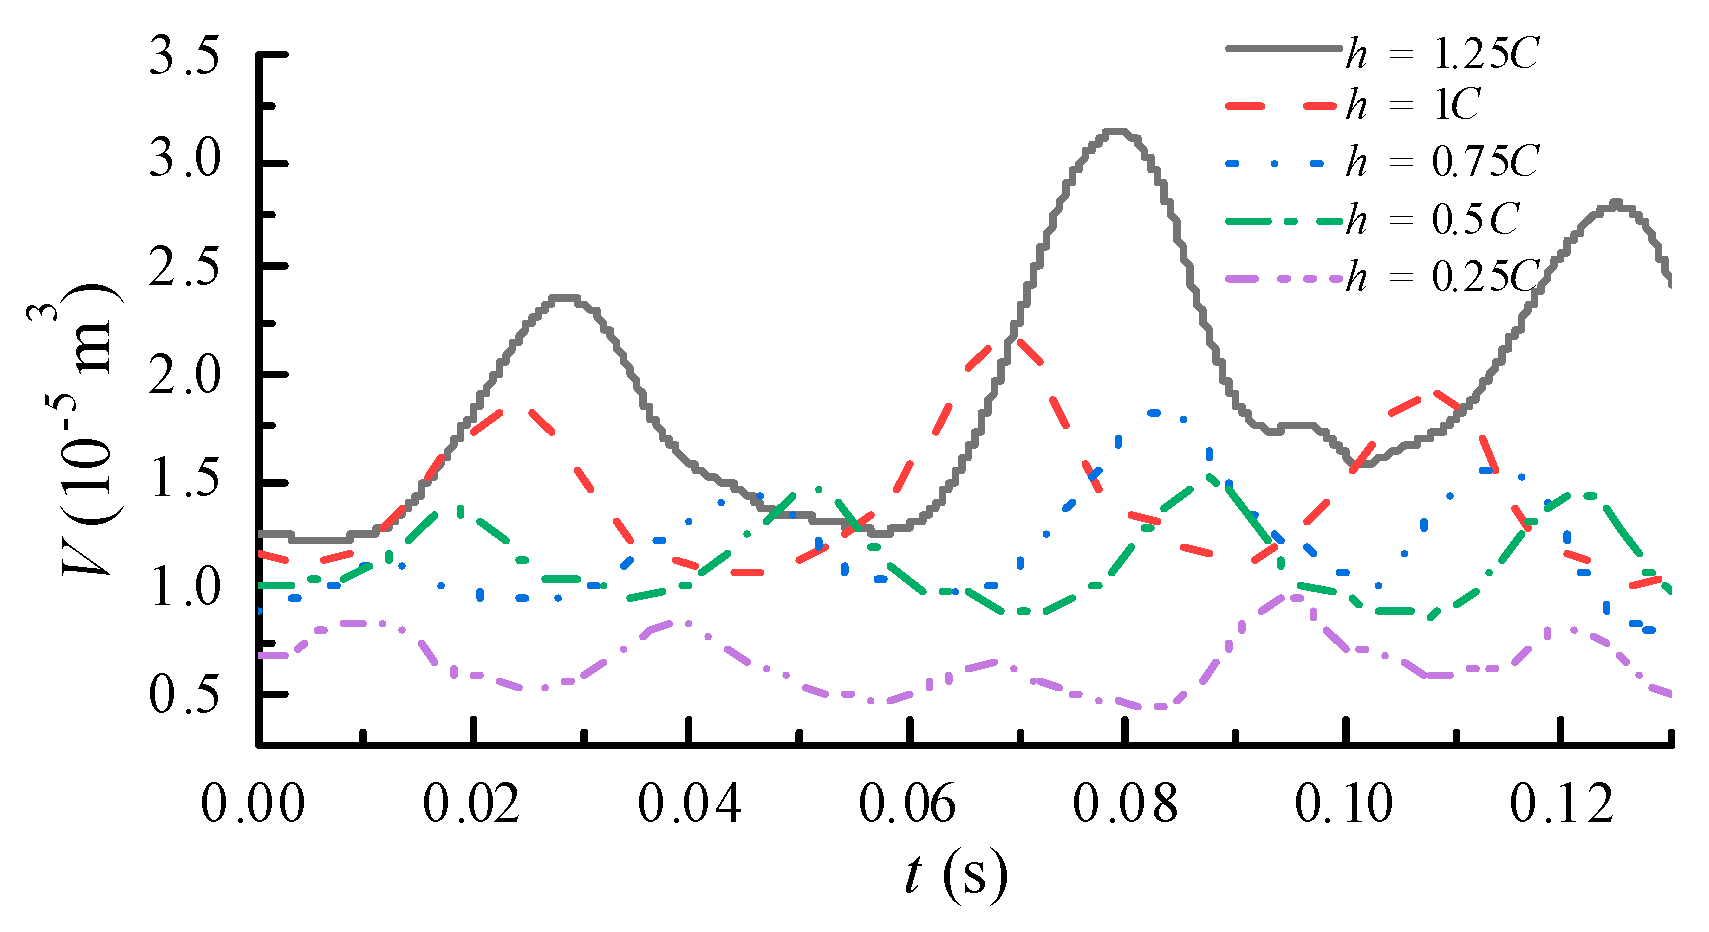
The cavity volume fluctuations proved the above conclusion, which is shown in Figure 15. Five complete cycles have passed before the results are recorded, and the results are convergent. The peaks of periodic fluctuations under the same working conditions are different, indicating that cavity evolution is a strong unsteady phenomenon. Although it exhibits a certain periodicity, the flow characteristics of each cycle are not exactly the same. The cavity volume increases with increasing depth from the free surface, indicating that the effect of the free surface on cavitation decreases as the depth from the free surface increases. As the depth from the free surface increases, the fluctuations of the cavity volume become more obvious. It indicates that the volume of the cavitation shedding is larger, which is consistent with the conclusion obtained in Figure 14. Hence, the free surface inhibits the development of cavitation, leading to a reduction in cavitation volume.
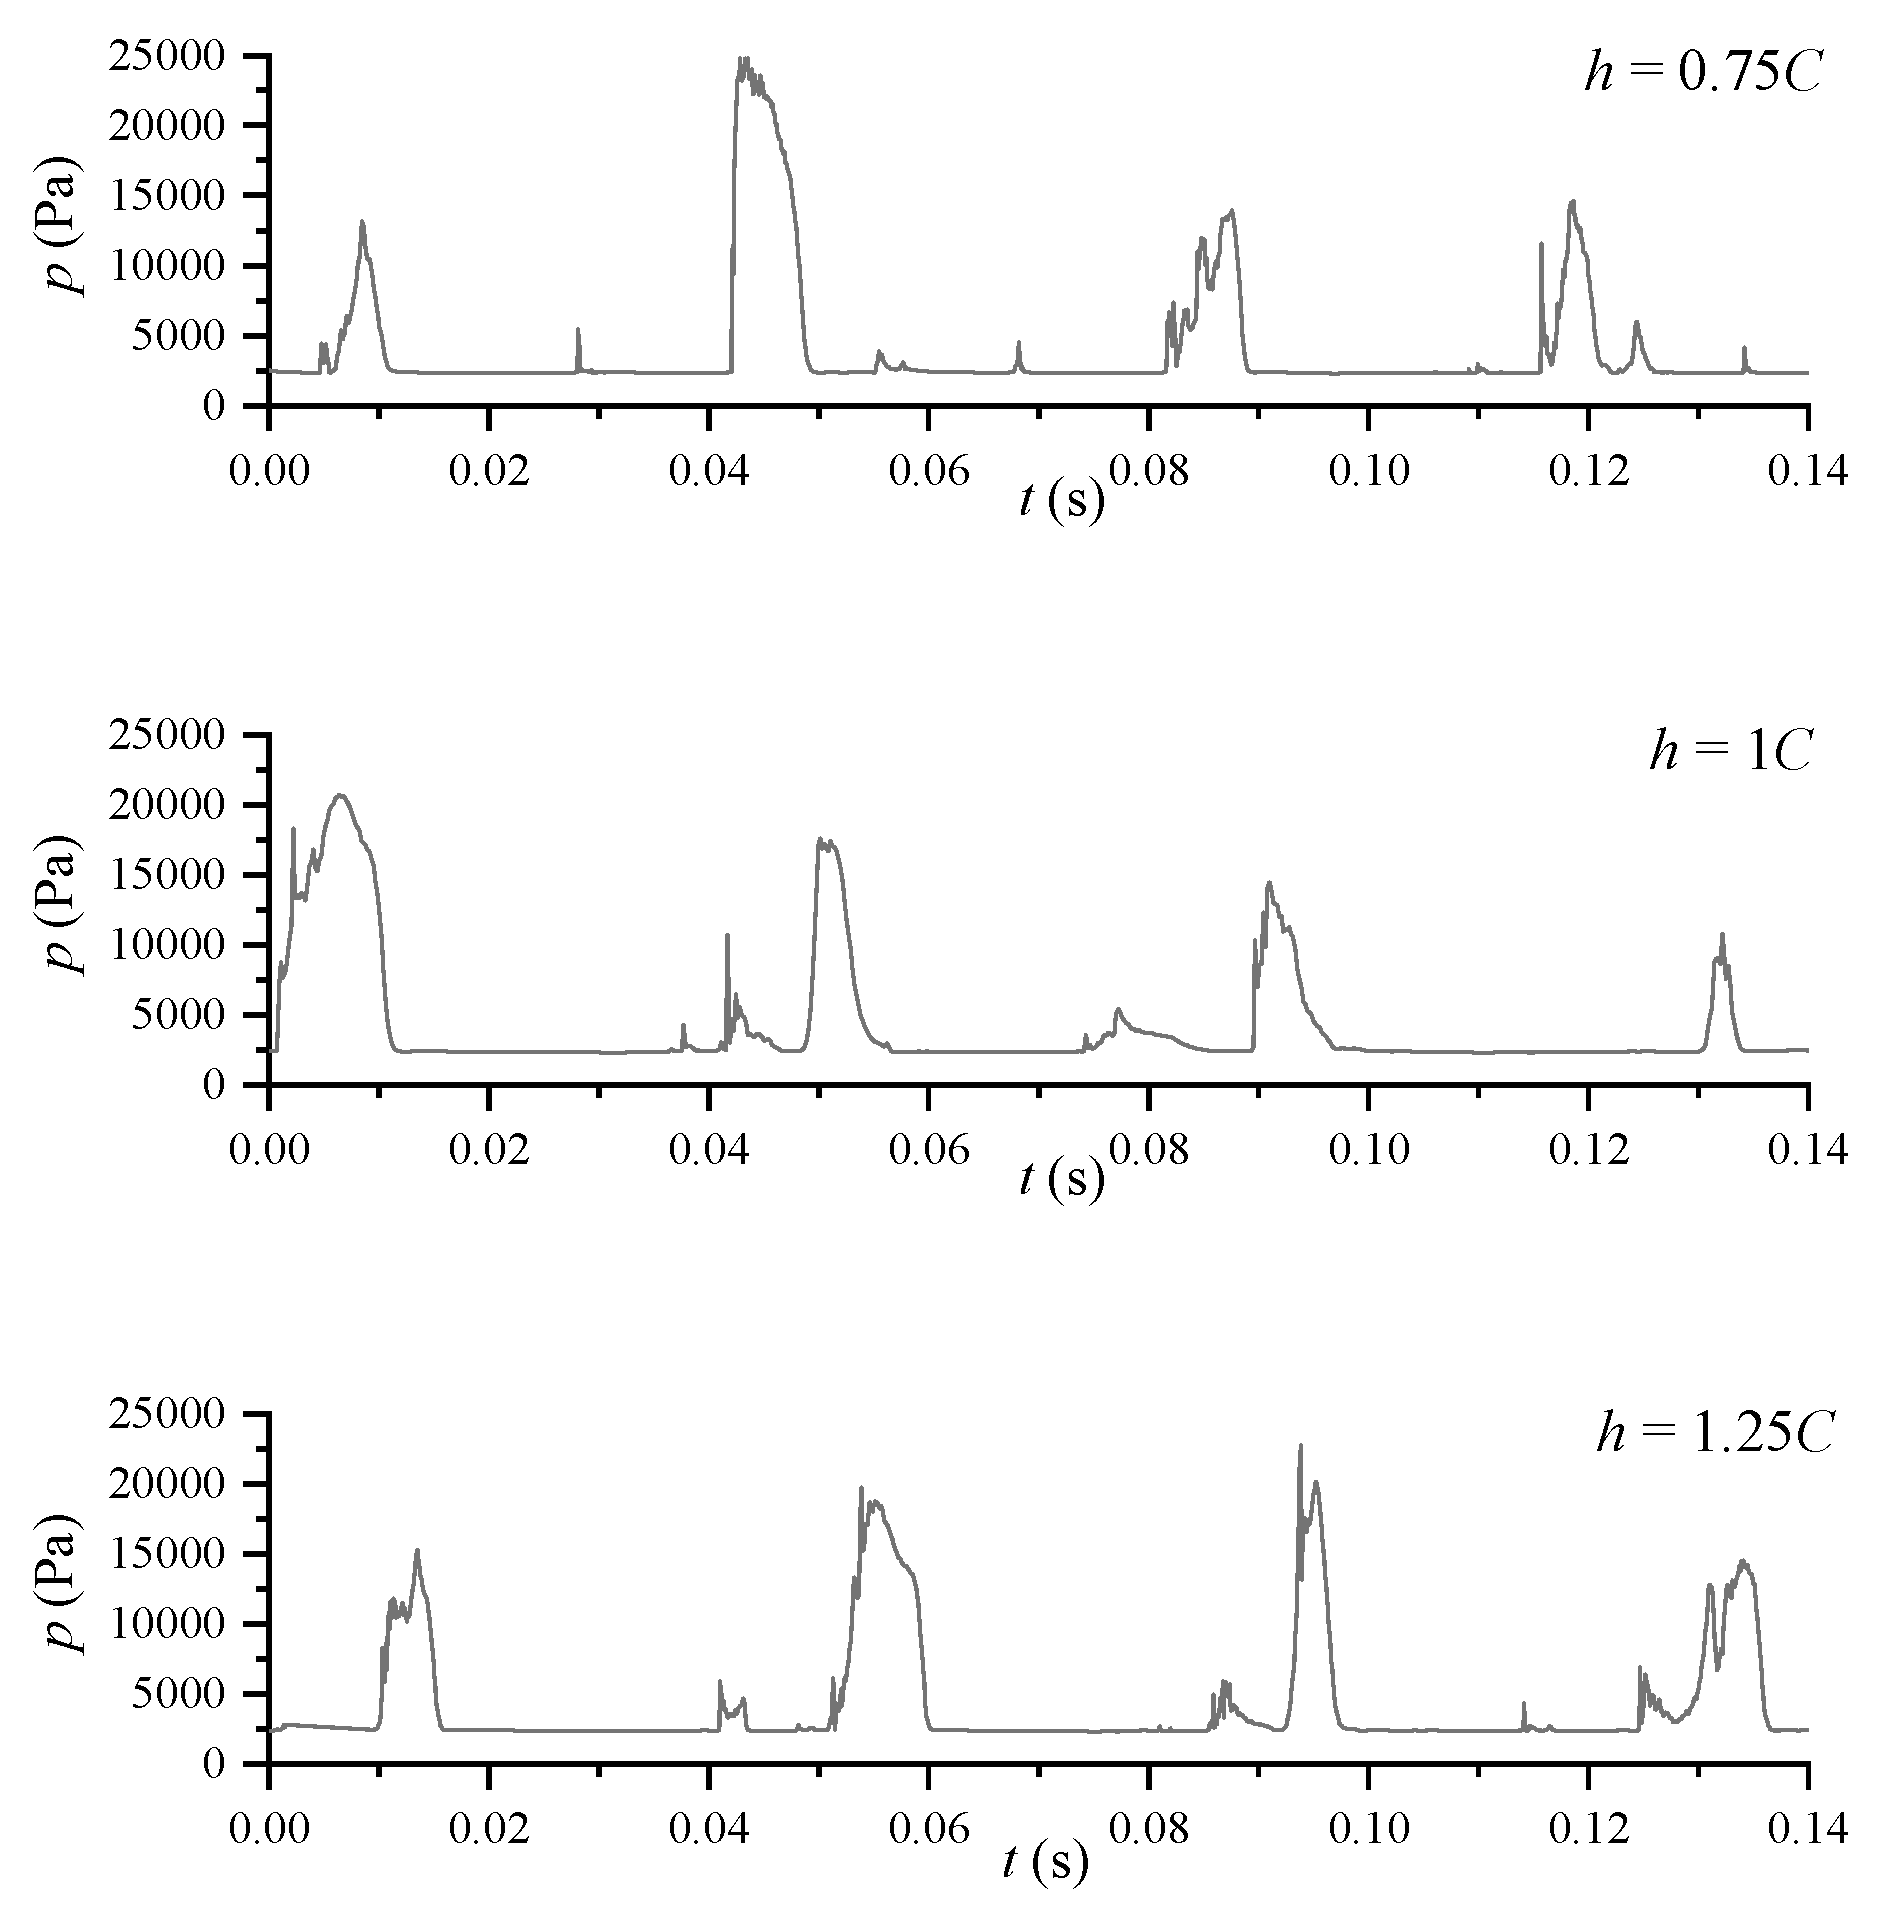
As mentioned above, the depth from the free surface affects the shape of the cavitation, and changes in cavitation shape alter the fluctuation characteristics of the pressure. Based on the pressure fluctuations of case 2 (h = 0.25C) shown above, Figure 16 presents the pressure fluctuation on the suction surface of hydrofoil at P3 with the other cases. Since the cavitation phenomenon is highly unstable, the pressure fluctuations obtained by numerical simulation are not stable at the peak. The fluctuation of the pressure is generated when the sheet cavitation is cut off by the re-entrant flow. When the sheet cavitation breaks off, and the cavitation again covers the monitoring point, the pressure value will be smooth close to the saturated vapor pressure. Moreover, the fluctuation of the pressure curves expresses the different frequencies of the cavitation cycle. It can be seen that as the depth of the hydrofoil increases, the frequency of the cavity shedding decreases, gradually approaching the frequency of the cavity shedding when there is no free surface. This result further demonstrates that the free surface inhibits the evolution of the cavity and increases the frequency of cavitation shedding.
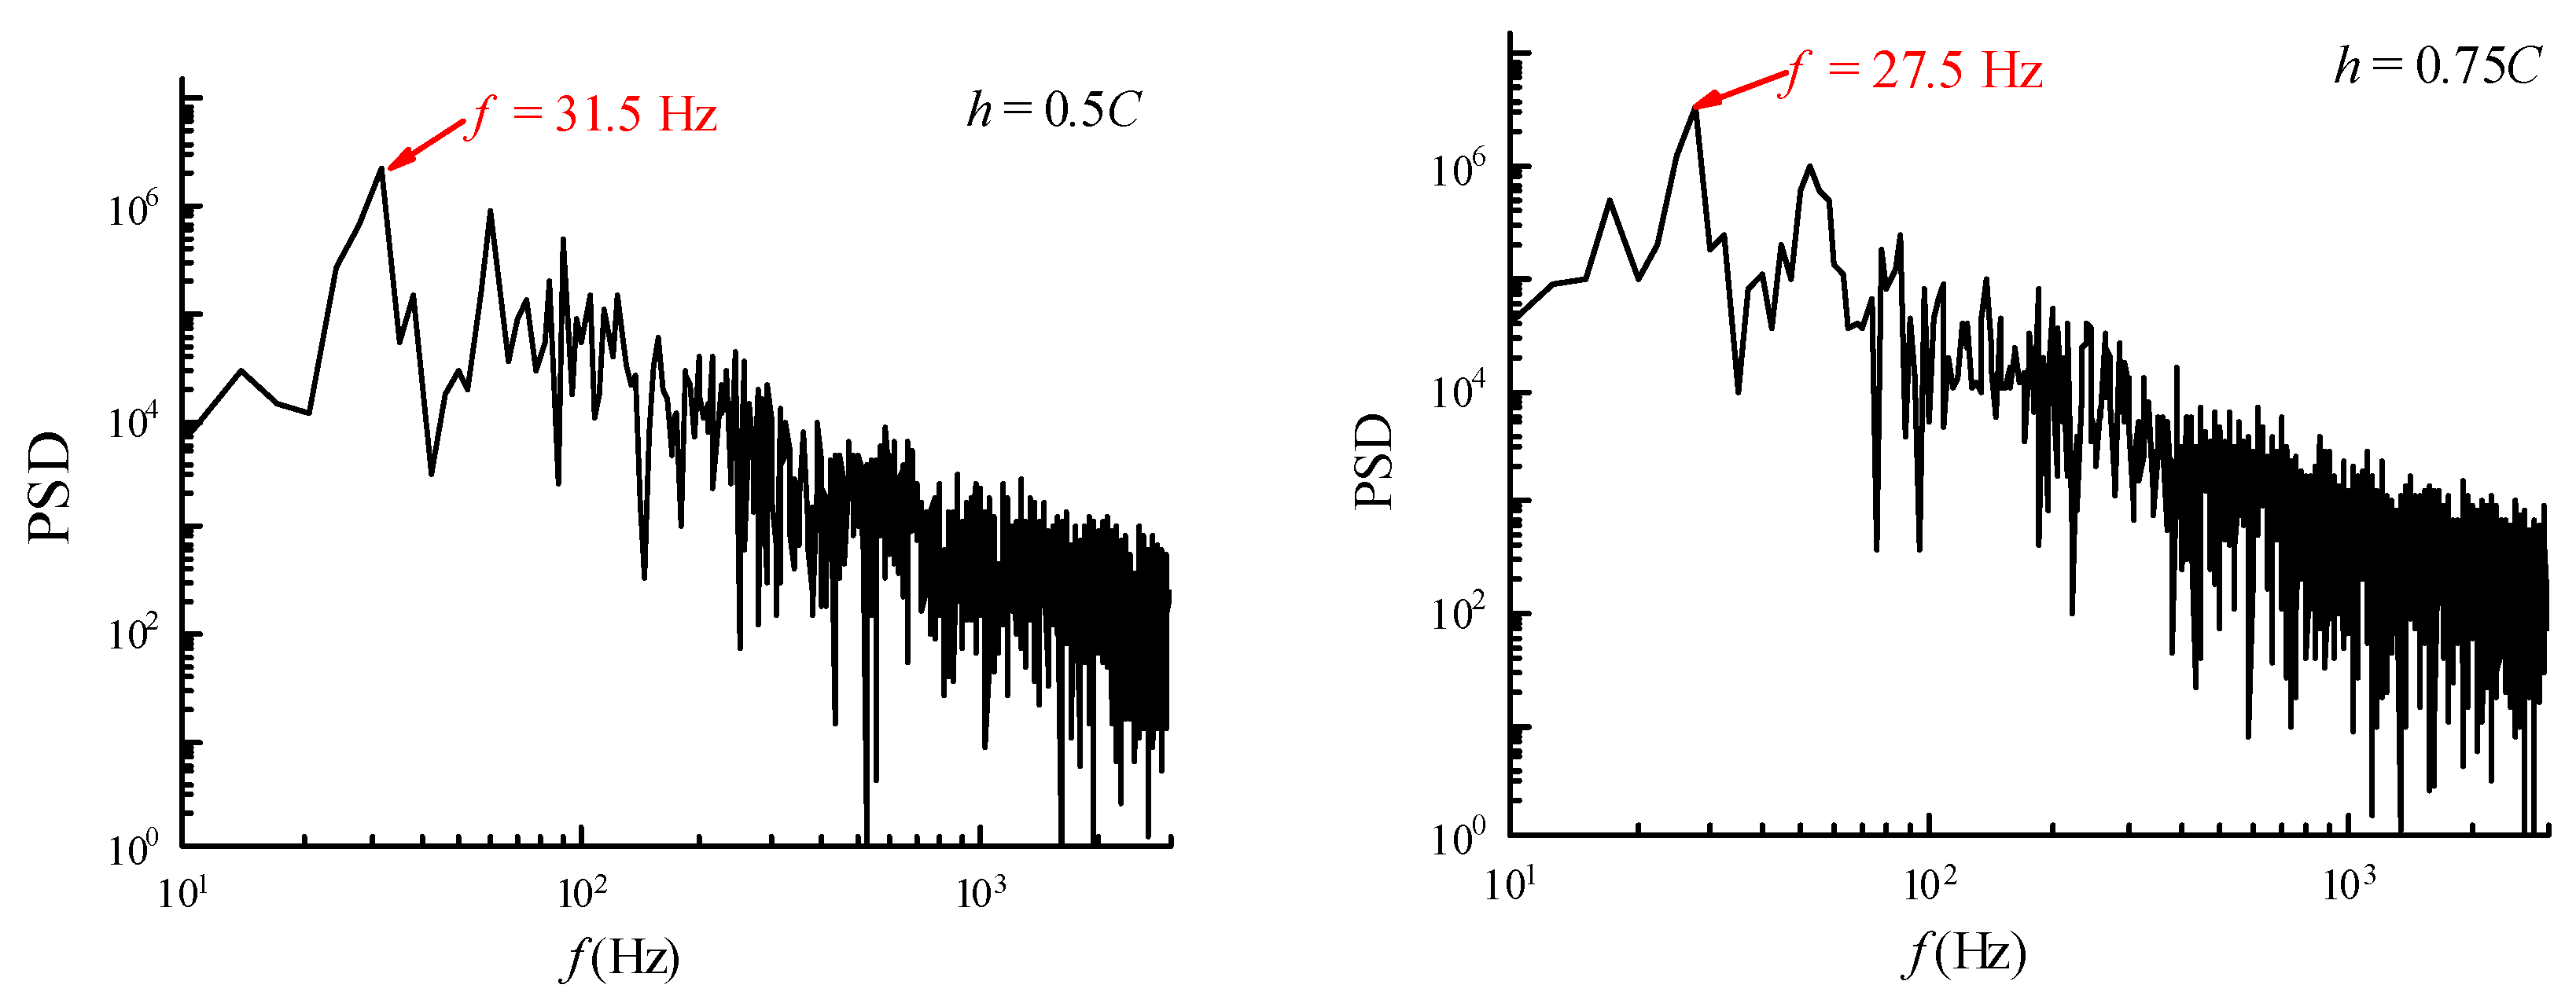
The corresponding PSD is shown in Figure 17. The maximum value of the curve represents the frequency of the cavity shedding. The pressure fluctuations in Figure 16 show that the duration of a cavitation period increases as the depth below the free surface increases, and thus, the frequency decreases, as verified by Figure 17. The frequency of the cavitation shedding period was extracted for each case. It can be seen that as the depth of the hydrofoil increases, the frequency of cavitation shedding decreases. This result may be attributed to the near free surface condition, the reduced cavitation length, and the reduced time required for development and shedding.
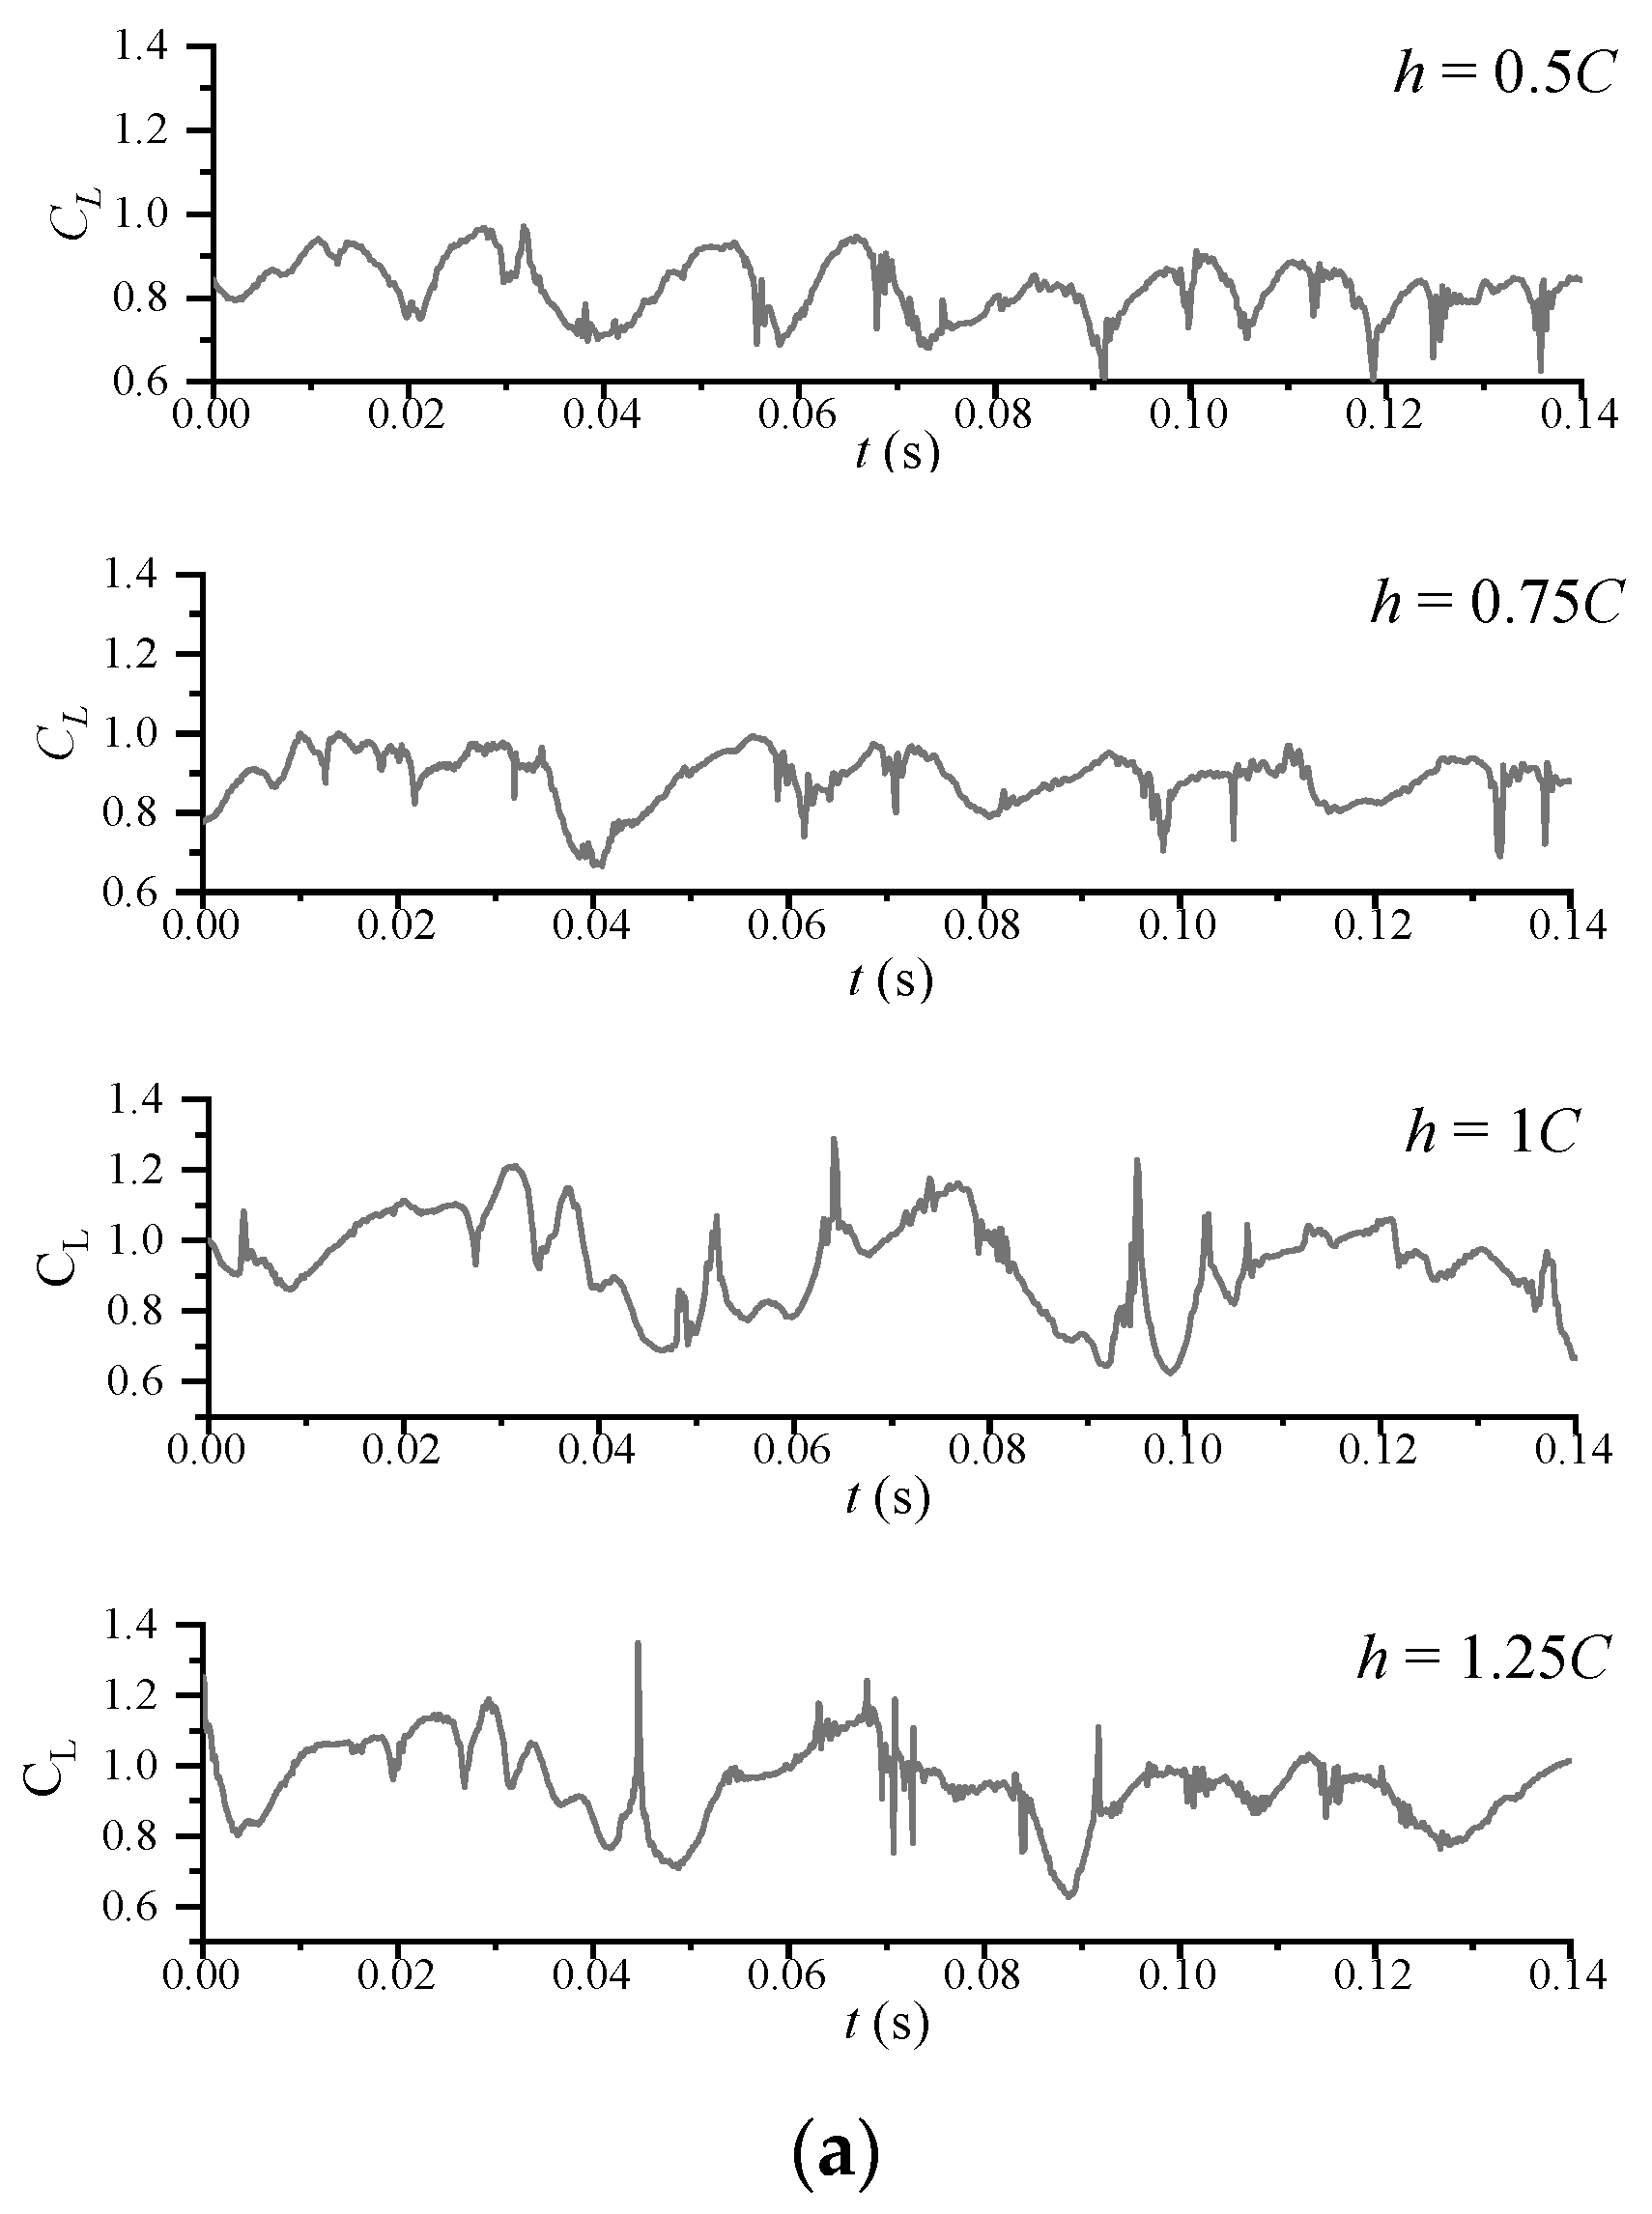
The effect of the free surface on the hydrofoil cavitation length also affects the lift resistance of the hydrofoil, which is an important factor for assessing the extent to how the free surface affects the cavitation and hydrofoil. Figure 18a shows the lift coefficient of the hydrofoil. It can be seen that the lift coefficient exhibits periodic fluctuations, consistent with the cavitation shedding period. The coefficient also shows strong instability, which is related to the unsteadiness of cavitation. To study the relationship between the different depth and the lift coefficient, the average lift coefficients for each operating condition is shown in Figure 18b. It can be seen that the average value of the lift coefficient decreases as the depth from the free surface decreases, which results that the relationship between lift coefficient and depth is linear.
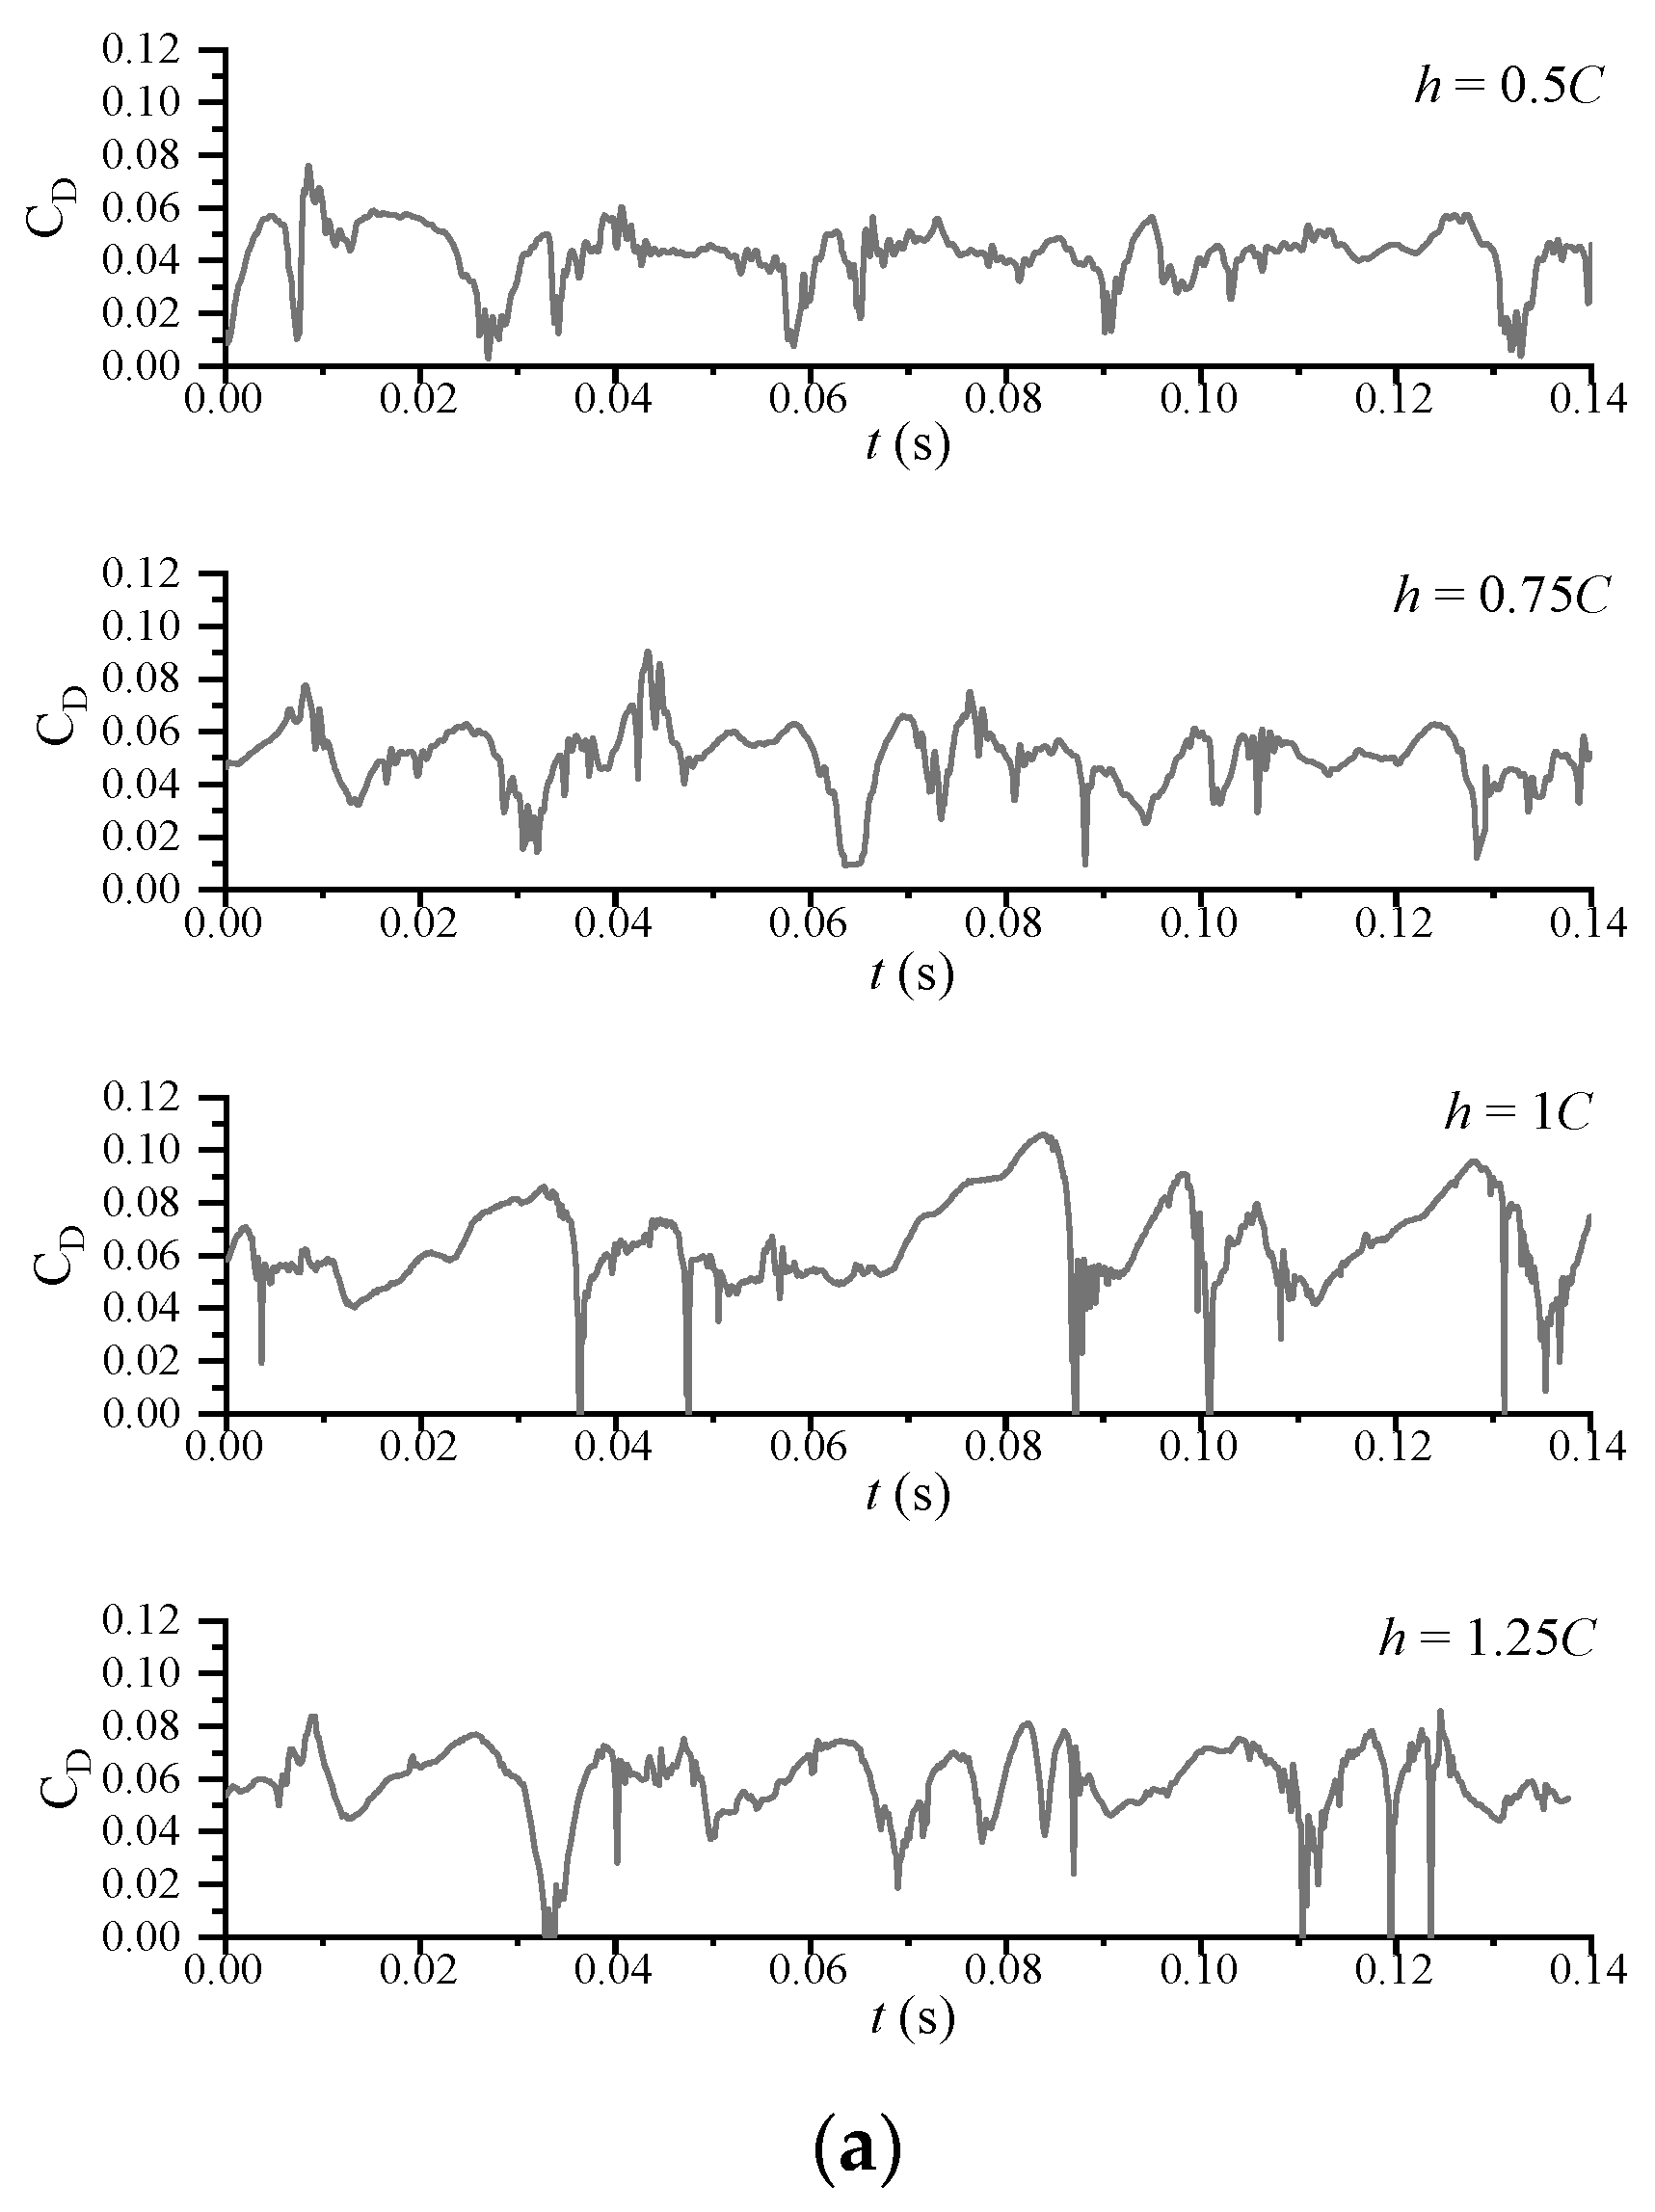
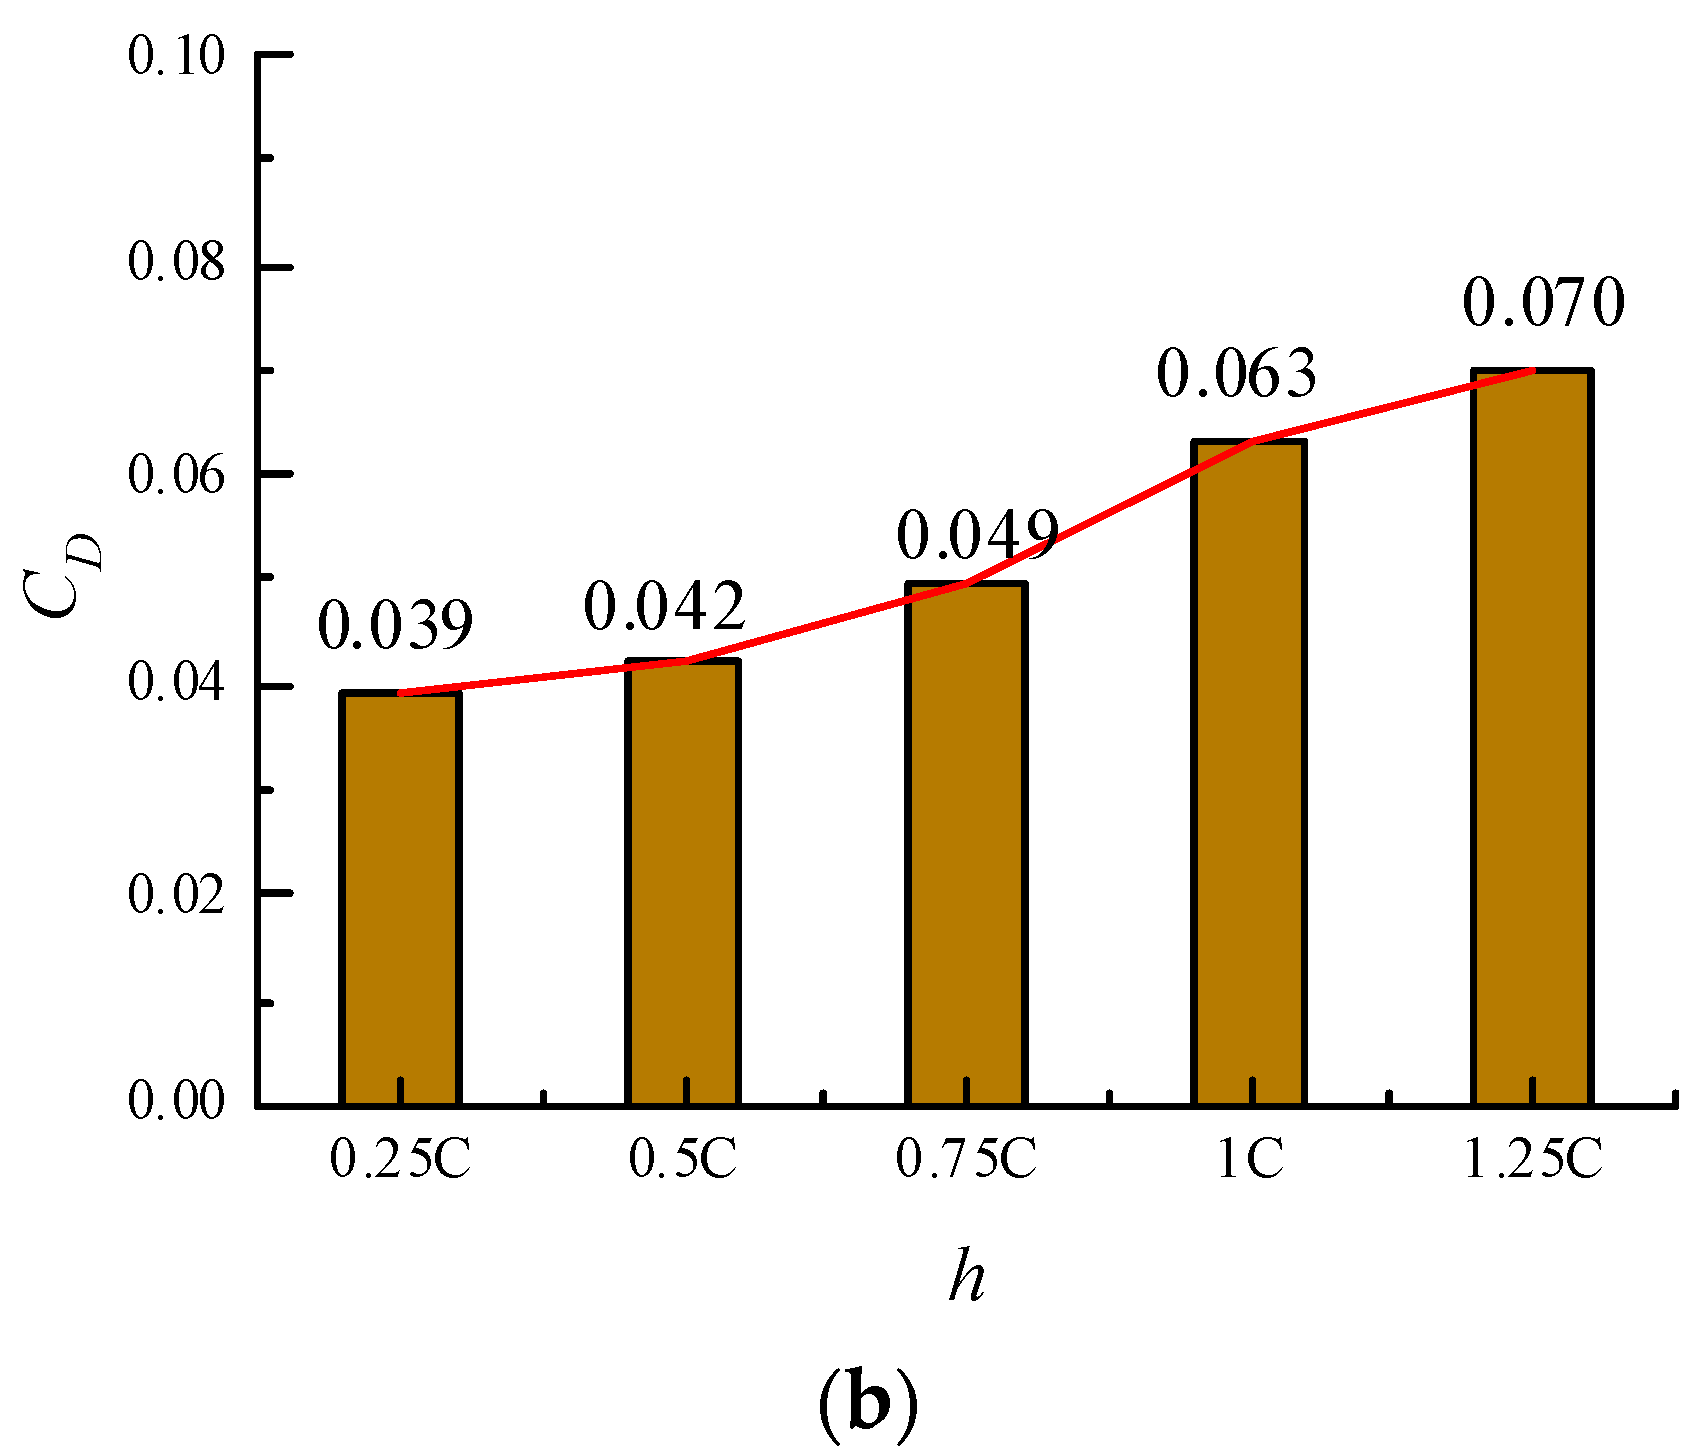
Figure 19a shows the drag coefficient of the hydrofoil at different water depths. The drag coefficient exhibits a cyclical trend similar to that of the lift coefficient curve, although the drag coefficient is much smaller than the lift coefficient. The average drag coefficient for different depths is shown in Figure 19b. As observed for the lift coefficient, the average drag coefficient increases with the increasing depth. Also the average drag coefficient has a linear development as the depth increasing.
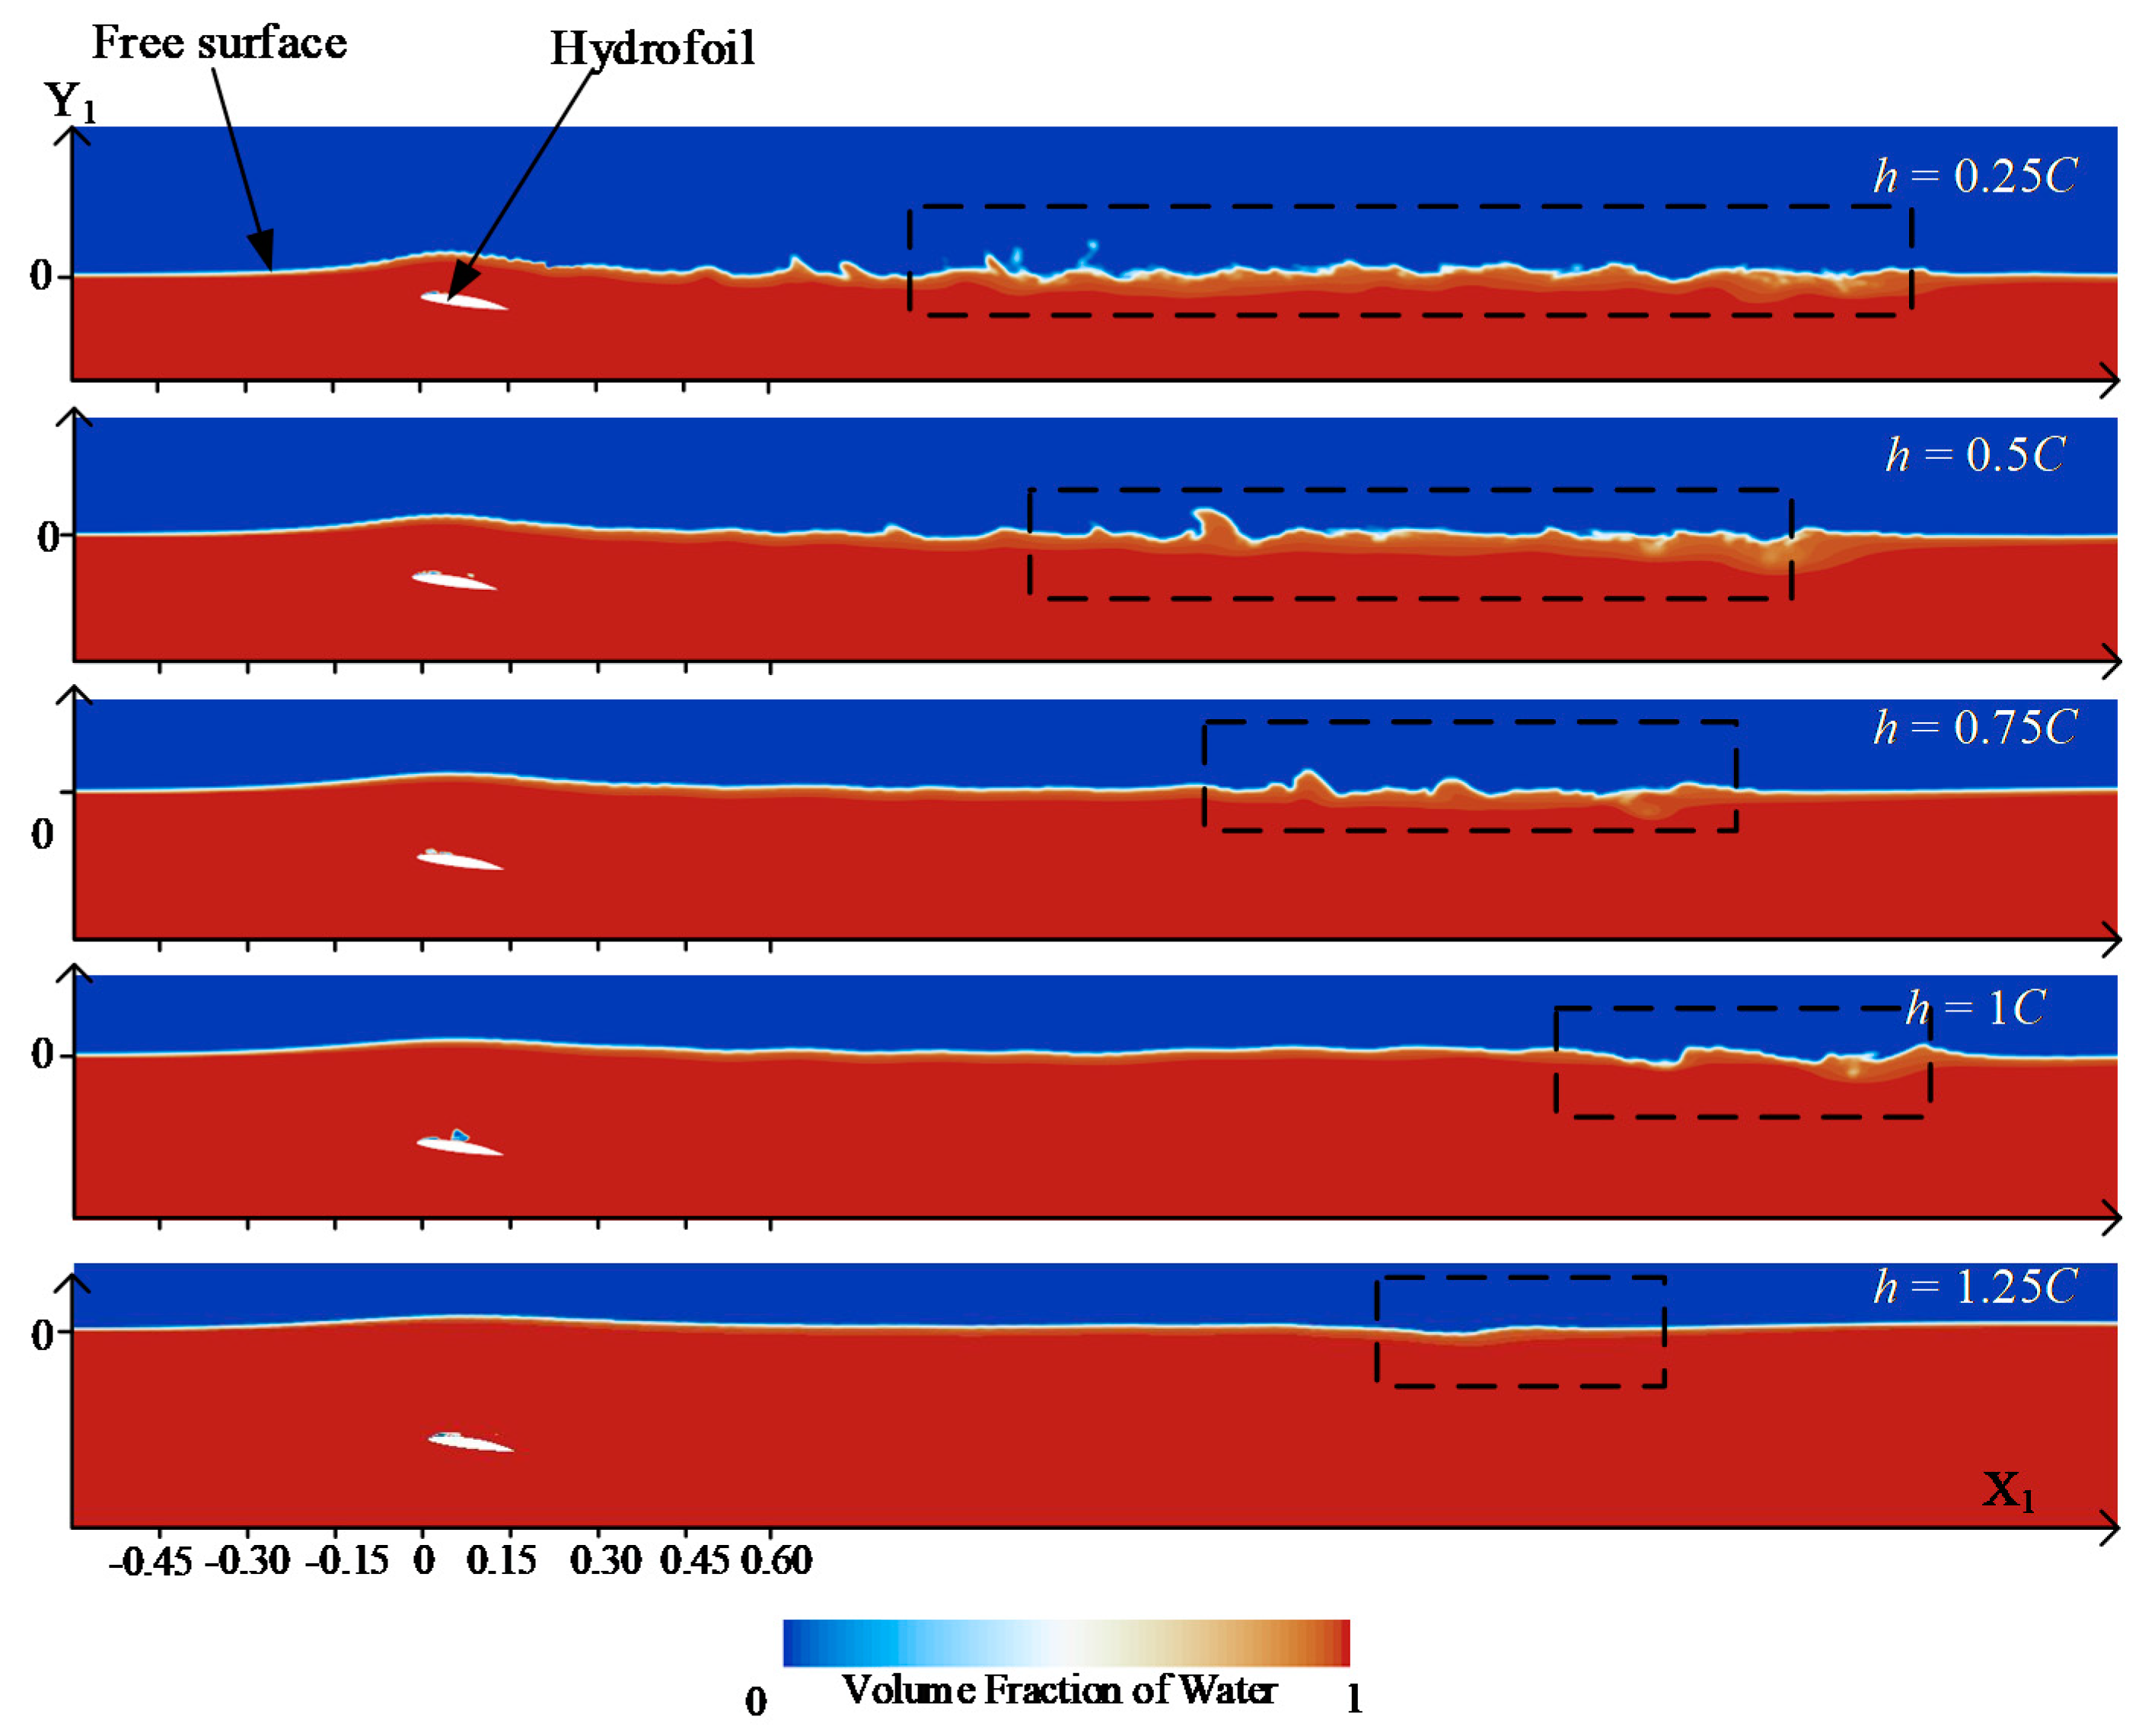
The effect of free surface on hydrofoil cavitation was analyzed above. Similarly, the cavitation of the hydrofoil near a free surface will also affect the free surface and form a wave. Figure 20 presents a water volume fraction scalar of the cross-section in the direction of the hydrofoil span of the hydrofoil at the same cavitation cycle stage. The shape of the free surface affected by the hydrofoil is shown in the figure. As the distance from the free surface increases, the influence of the hydrofoil on the free surface gradually decreases, and the liquid surface gradually becomes flat. In addition to the wave above the hydrofoil, the free surface behind the hydrofoil exhibits fluctuations, corresponding to the rectangular portion outside the dotted circle. As shown in Figure 20, as the depth of the hydrofoil increases, the turbulence at the hydrofoil tail also decreases. At the same time, the fluctuation of the free surface behind the hydrofoil is weakened. Hence, free surface evolution due to hydrofoil cavitation occurs not only above the hydrofoil, but also behind the hydrofoil.
Positional information for the free surface was extracted from Figure 19 and is shown in Figure 21. The hydrofoil in the figure indicates the relative position of the hydrofoil under various working conditions and does not reflect the true depth. It can be seen that the wave height of the free surface above the hydrofoil decreases as the depth from the free surface increases. For h = 0.25C, 0.5C, 0.75C and 1C, the wavelength increases with increasing depth. However, for h = 1.25C, the wavelength is shorter than that for h = 1C. We speculate that there may be a transition point of the wavelength between h = 1C and h = 1.25C. At this point, the wavelength reaches a maximum above the hydrofoil. As a result, the effects of hydrofoil cavitation on the wave height are uniformly changed and there is a maximum wave length between h = 1.25C and h = 1C cases. We will carry out more detailed work in the future to study the mechanism of this situation.

4. Conclusions

In this paper, the unsteady cavitation dynamics over a NACA66 hydrofoil near free surface is investigated using the LES method coupled with the Schnerr-Sauer cavitation model. The interaction between free surface and cavitation is evaluated by analyzing cavity evolution, pressure pulsation, hydrodynamic loads and dynamic mode. The main conclusions are as follows:
(1)
The existence of the free surface significantly affects the cavitation evolution and hydrodynamic load characteristics over the hydrofoil. Compared with non-free surface conditions, the free surface suppresses the cavitation intensity and accelerates the cavitation evolution. The specific feature is that the period of cavitation development, break-off, shedding and collapse becomes smaller. Meanwhile, both lift and drag are reduced due to the effects of the free surface.
(2)
A close relationship is found that between the characteristic mode and the flow field by an improved dynamic mode decomposition method. The existence of free surfaces reduces the energy content in each order mode and results in smaller scale of the coherent structure in higher-order modes. Moreover, compared with the free surface, the reconstructed higher-order flow field indicates that the cavitation flow field is accompanied by a smaller scale and a larger number of vortices for the free surface case.
(3)
The distance of the hydrofoil from the free surface has a significant effect on cavitation intensity, pressure pulsation, lift, drag and the wake region. For the same cavitation number, as the distance from the hydrofoil to the free surface increases, the cavitation intensity is promoted, the oscillating frequency of pulsating pressure decreases, the average lift and drag coefficients become larger. Furthermore, it is worth noting that the free surface in the wake region fluctuates more violently at small water depths cases.

Author Contributions

The manuscript was written by T.S. and Q.X.; all authors discussed the original idea; conceptualization, T.S. and L.Z.; methodology, T.S.; software, Q.X.; validation, T.S., Q.X. and L.Z.; formal analysis, T.S.; investigation, H.W.; resources, C.X.; data curation, Q.X.; writing—original draft preparation, T.S.; writing—review and editing, T.S.; visualization, C.X.; supervision, L.Z.; project administration, L.Z.; funding acquisition, L.Z. All authors have read and agreed to the published version of the manuscript.

Funding

This research was funded by the National Natural Science Foundation of China (grant number 51709042), the China Postdoctoral Science Foundation (2019T120211, 2018M631791), the Natural Science Foundation of Liaoning Province of China (20180550619), the Liao Ning Revitalization Talents Program (XLYC1908027).

Conflicts of Interest

The authors declare no conflict of interest.

References

  1. Sun, T.; Zhang, X.; Xu, C.; Zhang, G.; Jiang, S.; Zong, Z. Numerical modeling and simulation of the shedding mechanism and vortex structures at the development stage of ventilated partial cavitating flows. Eur. J Mech. B Fluids 2019, 76, 223–232. [Google Scholar] [CrossRef]
  2. Vahaji, S.; Han, J.; Cheung, S.C.; Yeoh, G.H.; Tu, J. Numerical investigation on the bubble size distribution around NACA0015 hydrofoil. Ocean Eng. 2019, 172, 59–71. [Google Scholar] [CrossRef]
  3. Sun, T.Z.; Zong, Z.; Zou, L.; Wei, Y.J.; Jiang, Y.C. Numerical investigation of unsteady sheet/cloud cavitation over a hydrofoil in thermo-sensitive fluid. J. Hydrodynam. B 2017, 29, 987–999. [Google Scholar] [CrossRef]
  4. Wu, Q.; Wang, Y.; Wang, G. Experimental investigation of cavitating flow-induced vibration of hydrofoils. Ocean Eng. 2017, 144, 50–60. [Google Scholar] [CrossRef]
  5. Liu, M.; Tan, L.; Cao, S. Dynamic mode decomposition of cavitating flow around ALE 15 hydrofoil. Renew. Energy 2019, 139, 214–227. [Google Scholar] [CrossRef]
  6. Faltinsen, O.M. Hydrodynamics of High-speed Marine Vehicles; Cambridge University Press: Cambridge, UK, 2005. [Google Scholar]
  7. Furness, R.A.; Hutton, S.P. Experimental and theoretical studies of two-dimensional fixed-type cavities. J. Fluids Eng. 1975, 97, 515–521. [Google Scholar] [CrossRef]
  8. Arndt, R.E. Cavitation in fluid machinery and hydraulic structures. Annu. Rev. Fluid Mech. 1981, 13, 273–326. [Google Scholar] [CrossRef]
  9. Sun, T.; Zhang, X.; Xu, C.; Zhang, G.; Wang, C.; Zong, Z. Experimental investigation on the cavity evolution and dynamics with special emphasis on the development stage of ventilated partial cavitating flow. Ocean Eng. 2019, 187, 106140. [Google Scholar] [CrossRef]
  10. Knapp, R.T. Recent investigations of the mechanics of cavitation and cavitation damage. Trans. ASME 1955, 77, 1045–1054. [Google Scholar]
  11. Kubota, A.; Kato, H.; Yamaguchi, H.; Maeda, M. Unsteady structure measurement of cloud cavitation on a foil section using conditional sampling technique. J. Fluids Eng. 1989, 111, 204–210. [Google Scholar] [CrossRef]
  12. Kawanami, Y.; Kato, H.; Yamaguchi, H.; Tanimura, M.; Tagaya, Y. Mechanism and control of cloud cavitation. J. Fluids Eng. 1997, 119, 788–794. [Google Scholar] [CrossRef]
  13. Reisman, G.E.; Wang, Y.C.; Brennen, C.E. Observations of shock waves in cloud cavitation. J. Fluid Mech. 1998, 355, 255–283. [Google Scholar] [CrossRef] [Green Version]
  14. Arndt, R.E.; Song, C.C.S.; Kjeldsen, M.; He, J.; Keller, A. Instability of partial cavitation: A numerical/experimental approach. In Proceedings of the Twenty-Third Symposium on Naval Hydrodynamics, Val de Reuil, France, 17–22 September 2000. [Google Scholar]
  15. Gopalan, S.; Katz, J. Flow structure and modeling issues in the closure region of attached cavitation. Phys. Fluids 2000, 12, 895–911. [Google Scholar] [CrossRef]
  16. Leroux, J.B.; Astolfi, J.A.; Billard, J.Y. An experimental study of unsteady partial cavitation. J. Fluids Eng. 2004, 126, 94–101. [Google Scholar] [CrossRef]
  17. Leroux, J.B.; Coutier-Delgosha, O.; Astolfi, J.A. A joint experimental and numerical study of mechanisms associated to instability of partial cavitation on two-dimensional hydrofoil. Phys. Fluids 2005, 17, 052101. [Google Scholar] [CrossRef] [Green Version]
  18. Passandideh-Fard, M.; Roohi, E. Transient simulations of cavitating flows using a modified volume-of-fluid (VOF) technique. Int. J. Comput. Fluid Dyn. 2008, 22, 97–114. [Google Scholar] [CrossRef]
  19. Ganesh, H.; Mäkiharju, S.A.; Ceccio, S.L. Bubbly shock propagation as a mechanism for sheet-to-cloud transition of partial cavities. J. Fluid Mech. 2016, 802, 37–78. [Google Scholar] [CrossRef] [Green Version]
  20. Pendar, M.R.; Roohi, E. Cavitation characteristics around a sphere: An LES investigation. Int. J. Multiph. Flow 2018, 98, 1–23. [Google Scholar] [CrossRef]
  21. Capurso, T.; Lorusso, M.; Camporeale, S.M.; Fortunato, B.; Torresi, M. Implementation of a passive control system for limiting cavitation around hydrofoils. In IOP Conference Series: Earth and Environmental Science; IOP Publishing: Bristol, UK, 2019; Volume 240, p. 032025. [Google Scholar]
  22. Cheng, H.; Long, X.; Ji, B.; Peng, X.; Farhat, M. LES investigation of the influence of cavitation on flow patterns in a confined tip-leakage flow. Ocean Eng. 2019, 186, 106115. [Google Scholar] [CrossRef]
  23. Cheng, H.Y.; Bai, X.R.; Long, X.P.; Ji, B.; Peng, X.X.; Farhat, M. Large eddy simulation of the tip-leakage cavitating flow with an insight on how cavitation influences vorticity and turbulence. Appl. Math. Model. 2020, 77, 788–809. [Google Scholar] [CrossRef]
  24. Dawson, T.E. An Experimental Investigation of a Fully Cavitating Two-dimensional Flat Plate Hydrofoil Near a Free Surface. Ph.D. Thesis, California Institute of Technology, Pasadena, CA, USA, 1959. [Google Scholar]
  25. Roohi, E.; Zahiri, A.P.; Passandideh-Fard, M. Numerical simulation of cavitation around a two-dimensional hydrofoil using VOF method and LES turbulence model. Appl. Math. Model. 2013, 37, 6469–6488. [Google Scholar] [CrossRef]
  26. Karim, M.M.; Prasad, B.; Rahman, N. Numerical simulation of free surface water wave for the flow around NACA 0015 hydrofoil using the volume of fluid (VOF) method. Ocean Eng. 2014, 78, 89–94. [Google Scholar] [CrossRef]
  27. Oguchi, K.; Enoki, M.; Hirata, N. Numerical simulation for cavitation bubble near free surface and rigid boundary. Mater. Trans. 2015, 56, 534–538. [Google Scholar] [CrossRef] [Green Version]
  28. Prasad, B.; Hino, T.; Suzuki, K. Numerical simulation of free surface flows around shallowly submerged hydrofoil by OpenFOAM. Ocean Eng. 2015, 102, 87–94. [Google Scholar] [CrossRef]
  29. Faltinsen, O.M.; Semenov, Y.A. The effect of gravity and cavitation on a hydrofoil near the free surface. J. Fluid Mech. 2008, 597, 371–394. [Google Scholar] [CrossRef]
  30. Kinzel, M.P.; Lindau, J.W.; Kunz, R.F. Free-surface proximity effects in developed and super-cavitation. In Proceedings of the 2008 DoD HPCMP Users Group Conference, Seattle, WA, USA, 14–17 July 2008; pp. 25–34. [Google Scholar]
  31. Wang, Y.; Wu, X.; Huang, C.; Wu, X. Unsteady characteristics of cloud cavitating flow near the free surface around an axisymmetric projectile. Int. J. Multiph. Flow 2016, 85, 48–56. [Google Scholar] [CrossRef] [Green Version]
  32. Ye, B.; Wang, Y.; Huang, C.; Huang, J. Numerical study of the pressure wave-induced shedding mechanism in the cavitating flow around an axisymmetric projectile via a compressible multiphase solver. Ocean Eng. 2019, 187, 106179. [Google Scholar] [CrossRef]
  33. Zhou, H.; Xiang, M.; Zhao, S.; Zhang, W. Development of a multiphase solver for cavitation flow near free surface. Ocean Eng. 2019, 188, 106236. [Google Scholar] [CrossRef]
  34. Sun, T.; Wei, Y.; Zou, L.; Jiang, Y.; Xu, C.; Zong, Z. Numerical investigation on the unsteady cavitation shedding dynamics over a hydrofoil in thermo-sensitive fluid. Int. J. Multiph. Flow 2019, 111, 82–100. [Google Scholar] [CrossRef]
  35. Capurso, T.; Lopez, M.; Lorusso, M.; Torresi, M.; Pascazio, G.; Camporeale, S.M.; Fortunato, B. Numerical investigation of cavitation on a NACA0015 hydrofoil by means of OpenFOAM. Energy Procedia 2017, 126, 794–801. [Google Scholar] [CrossRef]
  36. Huang, B.; Ducoin, A.; Young, Y.L. Physical and numerical investigation of cavitating flows around a pitching hydrofoil. Phys. Fluids 2013, 25, 102109. [Google Scholar] [CrossRef]
  37. Long, X.; Cheng, H.; Ji, B.; Arndt, R.E.; Peng, X. Large eddy simulation and Euler–Lagrangian coupling investigation of the transient cavitating turbulent flow around a twisted hydrofoil. Int. J. Multiph. Flow 2018, 100, 41–56. [Google Scholar] [CrossRef]
  38. Pendar, M.R.; Roohi, E. Investigation of cavitation around 3D hemispherical head-form body and conical cavitators using different turbulence and cavitation models. Ocean Eng. 2016, 112, 287–306. [Google Scholar] [CrossRef]
  39. Sedlar, M.; Ji, B.; Kratky, T.; Rebok, T.; Huzlik, R. Numerical and experimental investigation of three-dimensional cavitating flow around the straight NACA2412 hydrofoil. Ocean Eng. 2016, 123, 357–382. [Google Scholar] [CrossRef]
  40. Ji, B.; Luo, X.W.; Arndt, R.E.; Peng, X.; Wu, Y. Large eddy simulation and theoretical investigations of the transient cavitating vortical flow structure around a NACA66 hydrofoil. Int. J. Multiph. Flow 2015, 68, 121–134. [Google Scholar] [CrossRef] [Green Version]
  41. Lidtke, A.K.; Humphrey, V.F.; Turnock, S.R. Feasibility study into a computational approach for marine propeller noise and cavitation modelling. Ocean Eng. 2016, 120, 152–159. [Google Scholar] [CrossRef] [Green Version]
  42. Movahedian, A.; Pasandidehfard, M.; Roohi, E. LES investigation of sheet-cloud cavitation around a 3-D twisted wing with a NACA 16012 hydrofoil. Ocean Eng. 2019, 192, 106547. [Google Scholar] [CrossRef]
  43. De Giorgi, M.G.; Fontanarosa, D.; Ficarella, A. Characterization of cavitating flow regimes in an internal sharp-edged orifice by means of Proper Orthogonal Decomposition. Exp. Therm. Fluid Sci. 2018, 93, 242–256. [Google Scholar] [CrossRef]
  44. Prothin, S.; Djeridi, H.; Billard, J.Y. Coherent and turbulent process analysis of the effects of a longitudinal vortex on boundary layer detachment on a NACA0015 foil. J. Fluids Struct. 2014, 47, 2–20. [Google Scholar] [CrossRef] [Green Version]
  45. Schmid, P.J. Dynamic mode decomposition of numerical and experimental data. J. Fluid Mech. 2010, 656, 5–28. [Google Scholar] [CrossRef] [Green Version]
  46. Vinha, N.; Meseguer-Garrido, F.; De Vicente, J.; Valero, E. A dynamic mode decomposition of the saturation process in the open cavity flow. Aerosp. Sci. Technol. 2016, 52, 198–206. [Google Scholar] [CrossRef]
  47. Prothin, S.; Billard, J.Y.; Djeridi, H. Image processing using proper orthogonal and dynamic mode decompositions for the study of cavitation developing on a NACA0015 foil. Exp. Fluids 2016, 57, 157. [Google Scholar] [CrossRef]
  48. Nicoud, F.; Ducros, F. Subgrid-scale stress modelling based on the square of the velocity gradient tensor. Flow Turbul. Combust. 1999, 62, 183–200. [Google Scholar] [CrossRef]
  49. Rayleigh, L. VIII. On the pressure developed in a liquid during the collapse of a spherical cavity. Lond. Edinb. Dublin Philos. Mag. J. Sci. 1917, 34, 94–98. [Google Scholar] [CrossRef]
  50. Plesset, M.S. The dynamics of cavitation bubbles. J. Appl. Mech. 1949, 16, 277–282. [Google Scholar] [CrossRef]
  51. Schnerr, G.H.; Sauer, J. Physical and numerical modeling of unsteady cavitation dynamics. In Proceedings of the Fourth International Conference on Multiphase Flow, New Orleans, LA, USA, 27 May–1 June 2001. [Google Scholar]
  52. Huang, N.E.; Wu, M.L.; Qu, W.; Long, S.R.; Shen, S.S. Applications of Hilbert–Huang transform to non-stationary financial time series analysis. Appl. Stoch. Models Bus. Ind. 2003, 19, 245–268. [Google Scholar] [CrossRef]
Figure 1. Computational domain and boundary condition.
Jmse 08 00341 g001
Figure 2. Mesh generation and y+ at t = 0.566 s around the hydrofoil. (a) Mesh generation at Mid-section and a visualization close to the profile, (b) y+ at t = 0.566 s.
Jmse 08 00341 g002
Figure 3. Locations of monitoring points.
Jmse 08 00341 g003
Figure 4. Definition of the coordinate systems in the computational domain.
Jmse 08 00341 g004
Figure 5. Numerically predicted cavity evolution compared with experimental results [16].
Jmse 08 00341 g005
Figure 6. Pressure fluctuation on the suction surface of the hydrofoil at P1 and P2.
Jmse 08 00341 g006
Figure 7. Comparison of the cavity evolution for a typical cycle for no free surface case and near the free surface case (h = 0.25C). (a) Cavity evolution in a typical cycle for the no free surface case, (b) Cavity evolution in a typical cycle for the near free surface case (h = 0.25C).
Jmse 08 00341 g007aJmse 08 00341 g007b
Figure 8. Comparison of the local cavitation number (a) and local velocity field (b) on the mid-section plane without free surface and with the free surface, (c) vertical pressure distribution in hydrofoil cavitation region.
Jmse 08 00341 g008
Figure 9. Pressure fluctuations and the corresponding PSD at P3. (a) Pressure fluctuation on the suction surface of the hydrofoil at P3; (b) PSD of the pressure fluctuation at P3 for the no free surface case; (c) PSD of pressure fluctuation at P3 for the near free surface case.
Jmse 08 00341 g009
Figure 10. Comparison of the lift and drag coefficient fluctuations for the no free surface case and the near free surface case. (a) Lift coefficient; (b) Drag coefficient.
Jmse 08 00341 g010
Figure 11. Comparison of the energy spectrum of the dynamic modes with free surface and without free surface. (a) Near free surface (h = 0.25C); (b) No free surface.
Jmse 08 00341 g011
Figure 12. Comparison of the dynamic modes on mid-section plane with free surface and without free surface. (a) Dynamic mode near the free surface (h = 0.25C); (b) Dynamic mode without free surface.
Jmse 08 00341 g012
Figure 13. Comparison of the velocity vector of the reconstruction flow field for the near free surface case and no free surface case. (a) Velocity vector of the reconstruction flow field for the near free surface case (h = 0.25C); (b) The velocity vector of the reconstruction flow field for the no free surface case.
Jmse 08 00341 g013
Figure 14. Comparison of cavity evolution in one typical cycle compared at five different water depths.
Jmse 08 00341 g014
Figure 15. Comparison of the cavity volume fluctuations for five different water depths.
Jmse 08 00341 g015
Figure 16. Comparison of the pressure fluctuation on the suction surface of hydrofoil at P3 in different water depth condition.
Jmse 08 00341 g016aJmse 08 00341 g016b
Figure 17. Comparison of the power spectral density of pressure fluctuations in different water depths.
Jmse 08 00341 g017aJmse 08 00341 g017b
Figure 18. Comparison of the lift coefficient fluctuation and the average value at different water depth. (a) Lift coefficient fluctuations at different water depths; (b) Average lift coefficient at different water depths.
Jmse 08 00341 g018aJmse 08 00341 g018b
Figure 19. Comparison of the drag coefficient fluctuation and the average value at different water depths. (a) Drag coefficient fluctuations at different water depths; (b) Average drag coefficient at different water depths.
Jmse 08 00341 g019aJmse 08 00341 g019b
Figure 20. Volume fraction of water on the mid-section plane for different depths at the same cavitation cycle stage.
Jmse 08 00341 g020
Figure 21. Free surface change caused by hydrofoil cavitation near the free surface in different depth at the same cavitation cycle stage.
Jmse 08 00341 g021