A Method of Navigational Information Display Using Augmented Virtuality


Abstract
1. Introduction
2. Modern Spatial Decision Support Systems (SDSS): State-of-the-Art
3. Augmented Virtuality
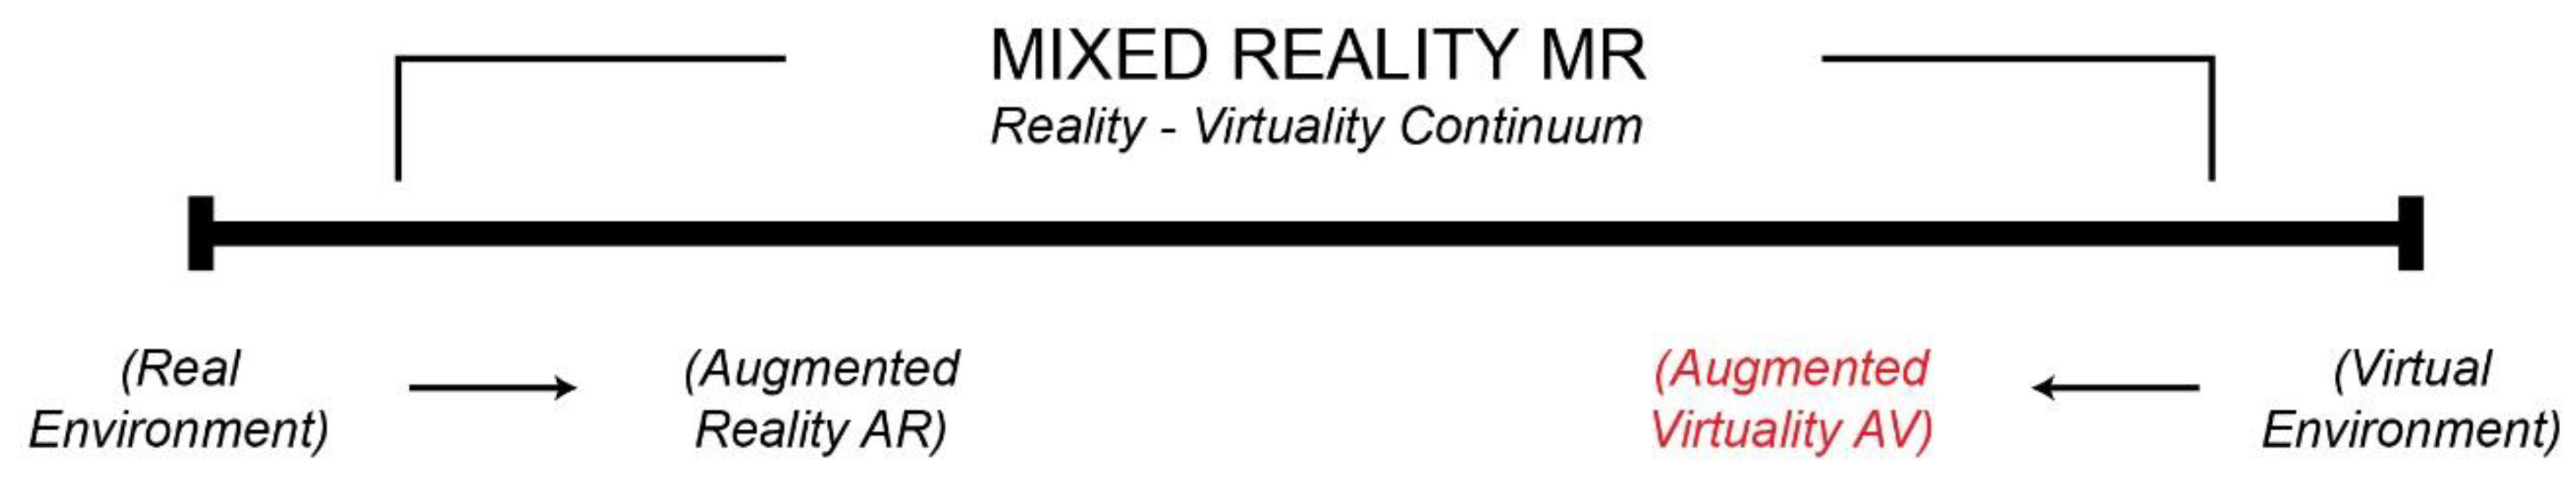
3.1. Reality-Virtuality Continuum
3.2. Definition
- (1)
- type of display; and
- (2)
- type of electronic display device.
- combines the real and virtual environments;
- is implemented in real time; and
- elements of the real and virtual world are correlated and presented in a reliable space.
- numerous signals indicating the presence of device(s) in the real world (e.g., use of a joystick or mouse to control the VE), haptic feedback gloves/VR treadmills are not applicable;
- accepts only one sensory modality (e.g., auditory, visual, motor/proprioceptive); and
- stimuli are not spatially oriented around the user (no VR/AR headset applied).
4. Development of an Augmented Virtuality (AV)-Based Display Method
4.1. Defining the Technology Used in the Method
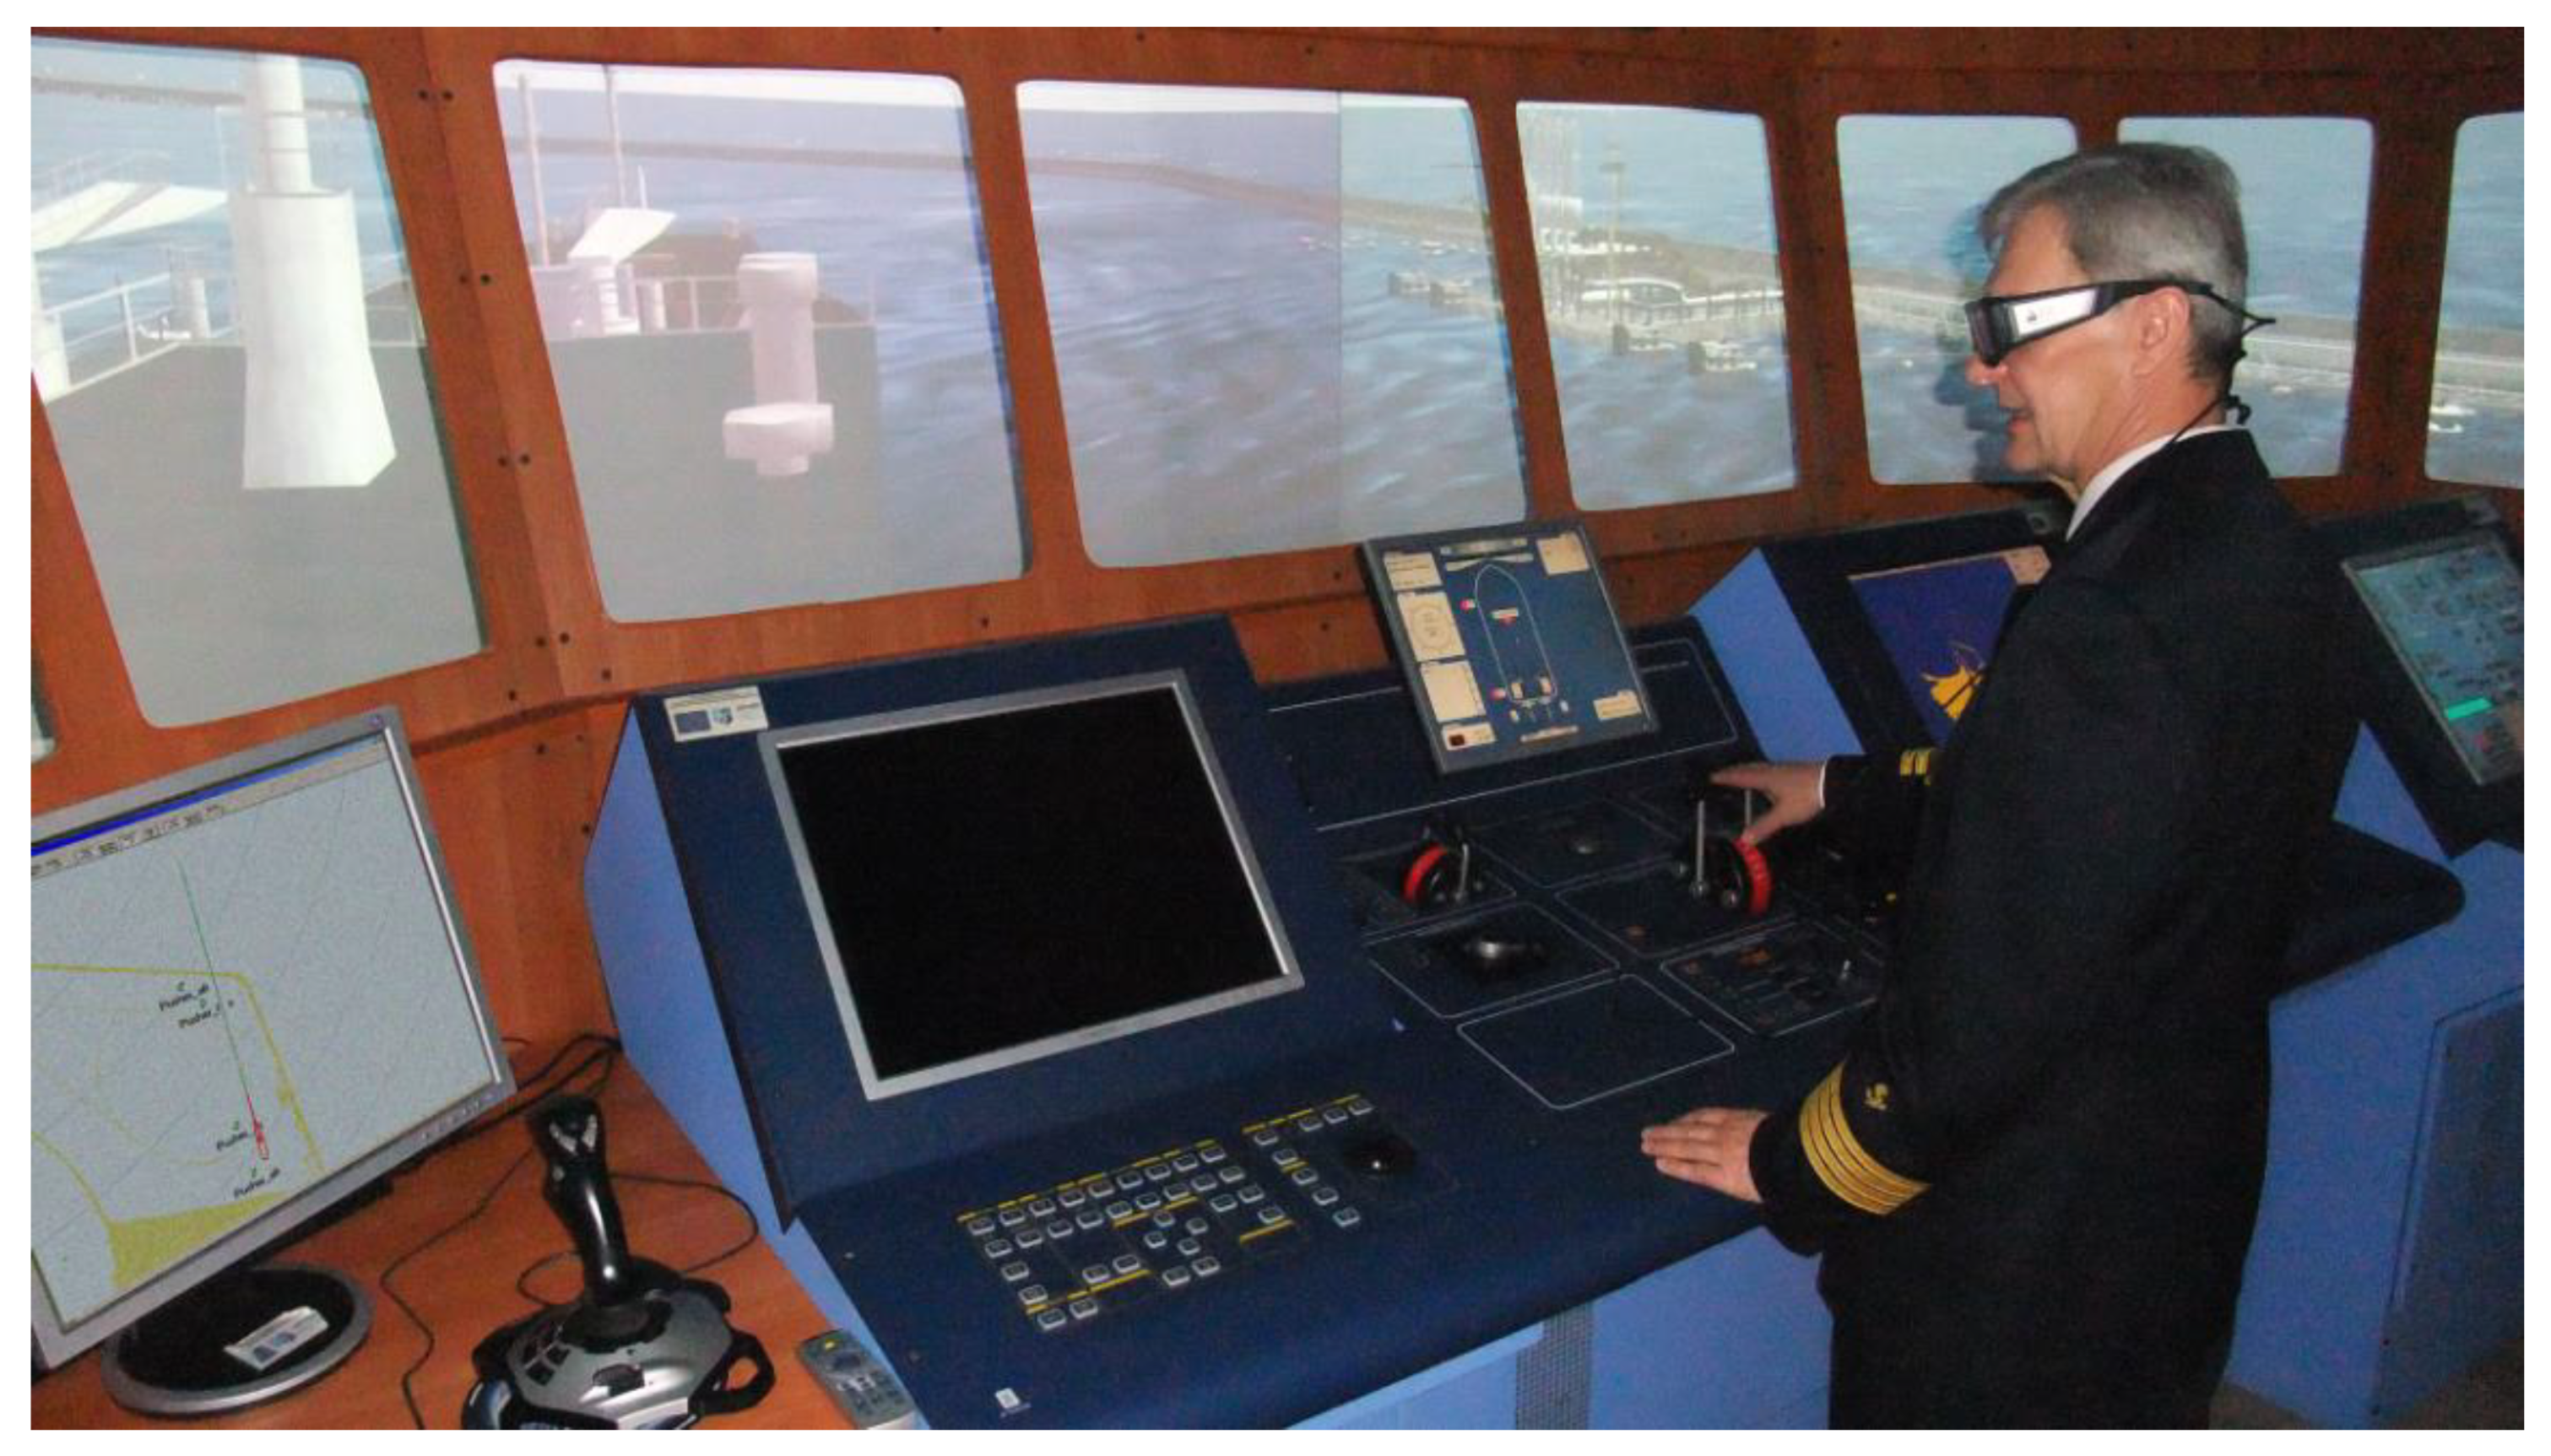
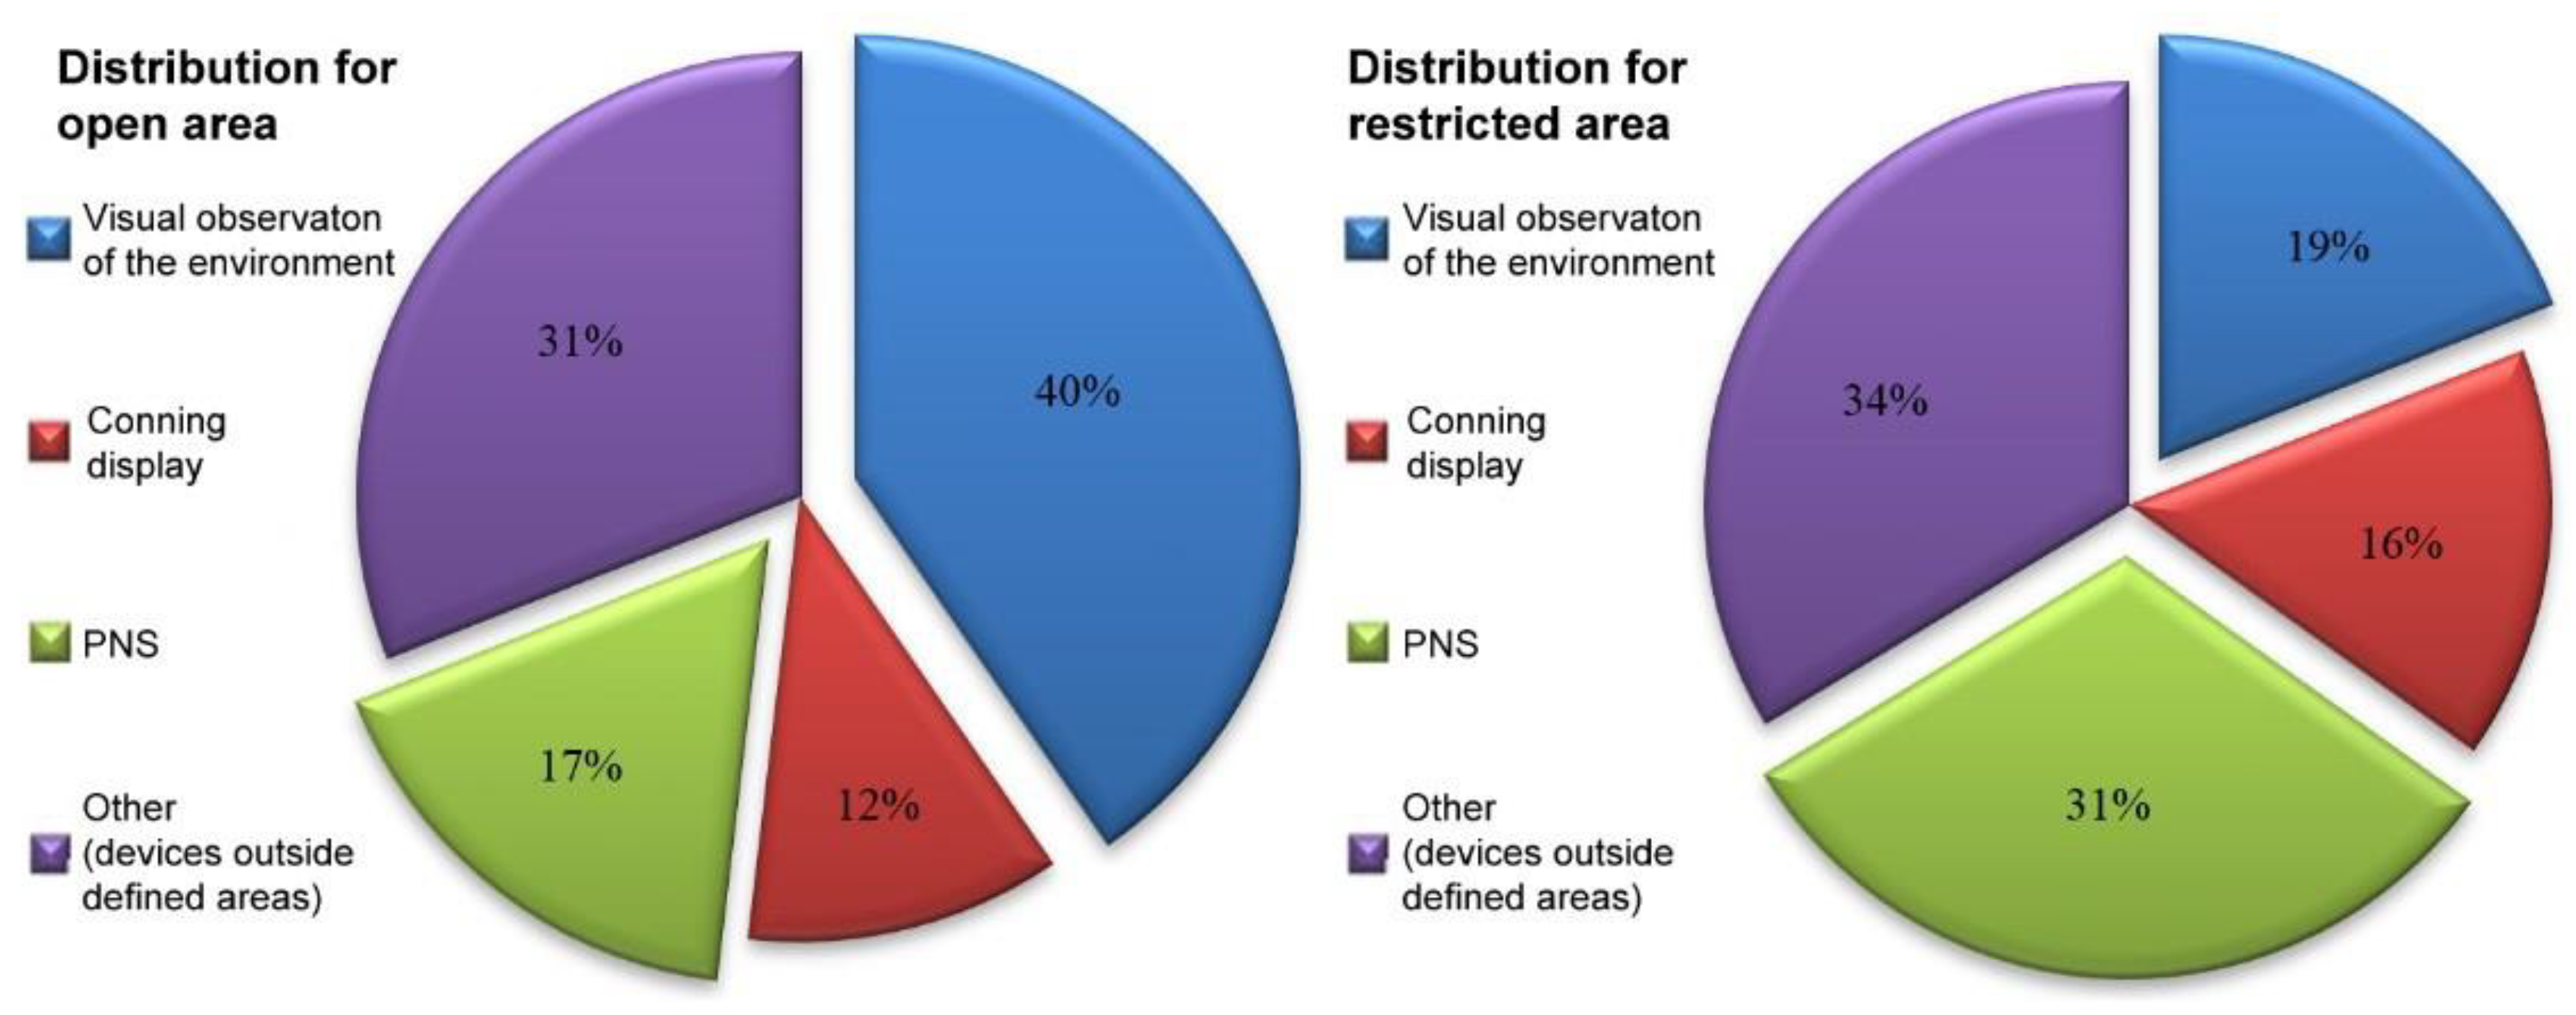
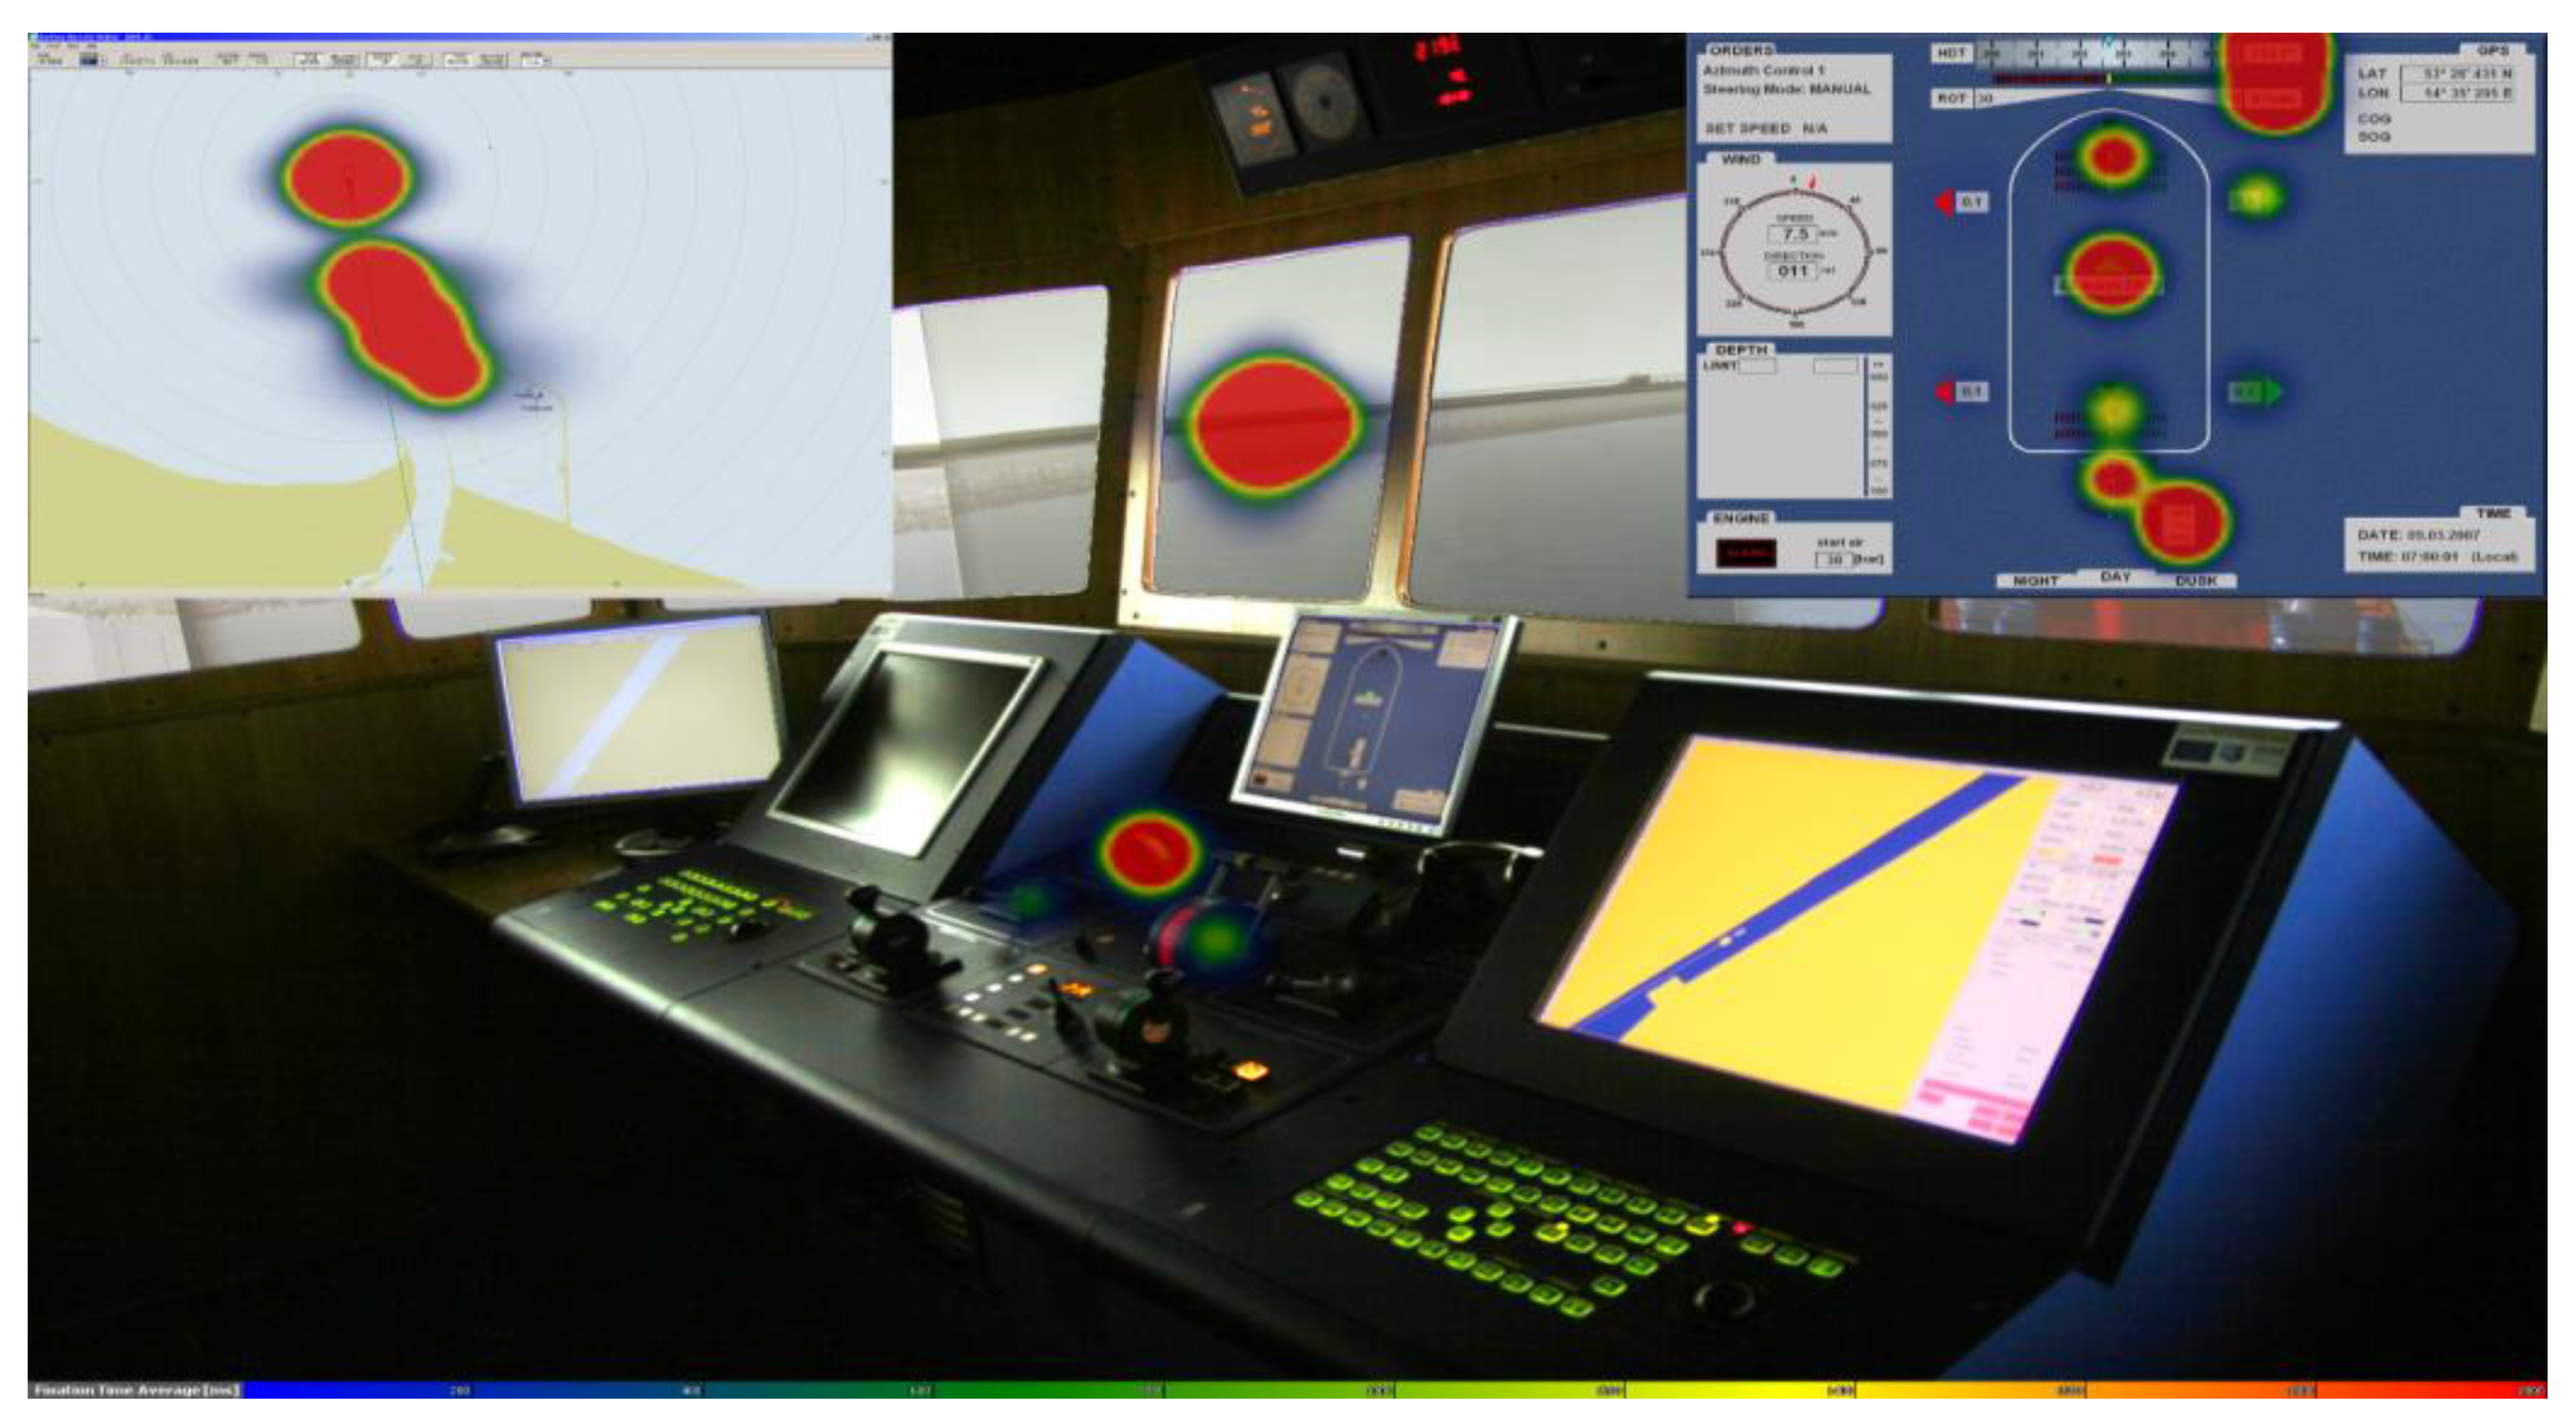
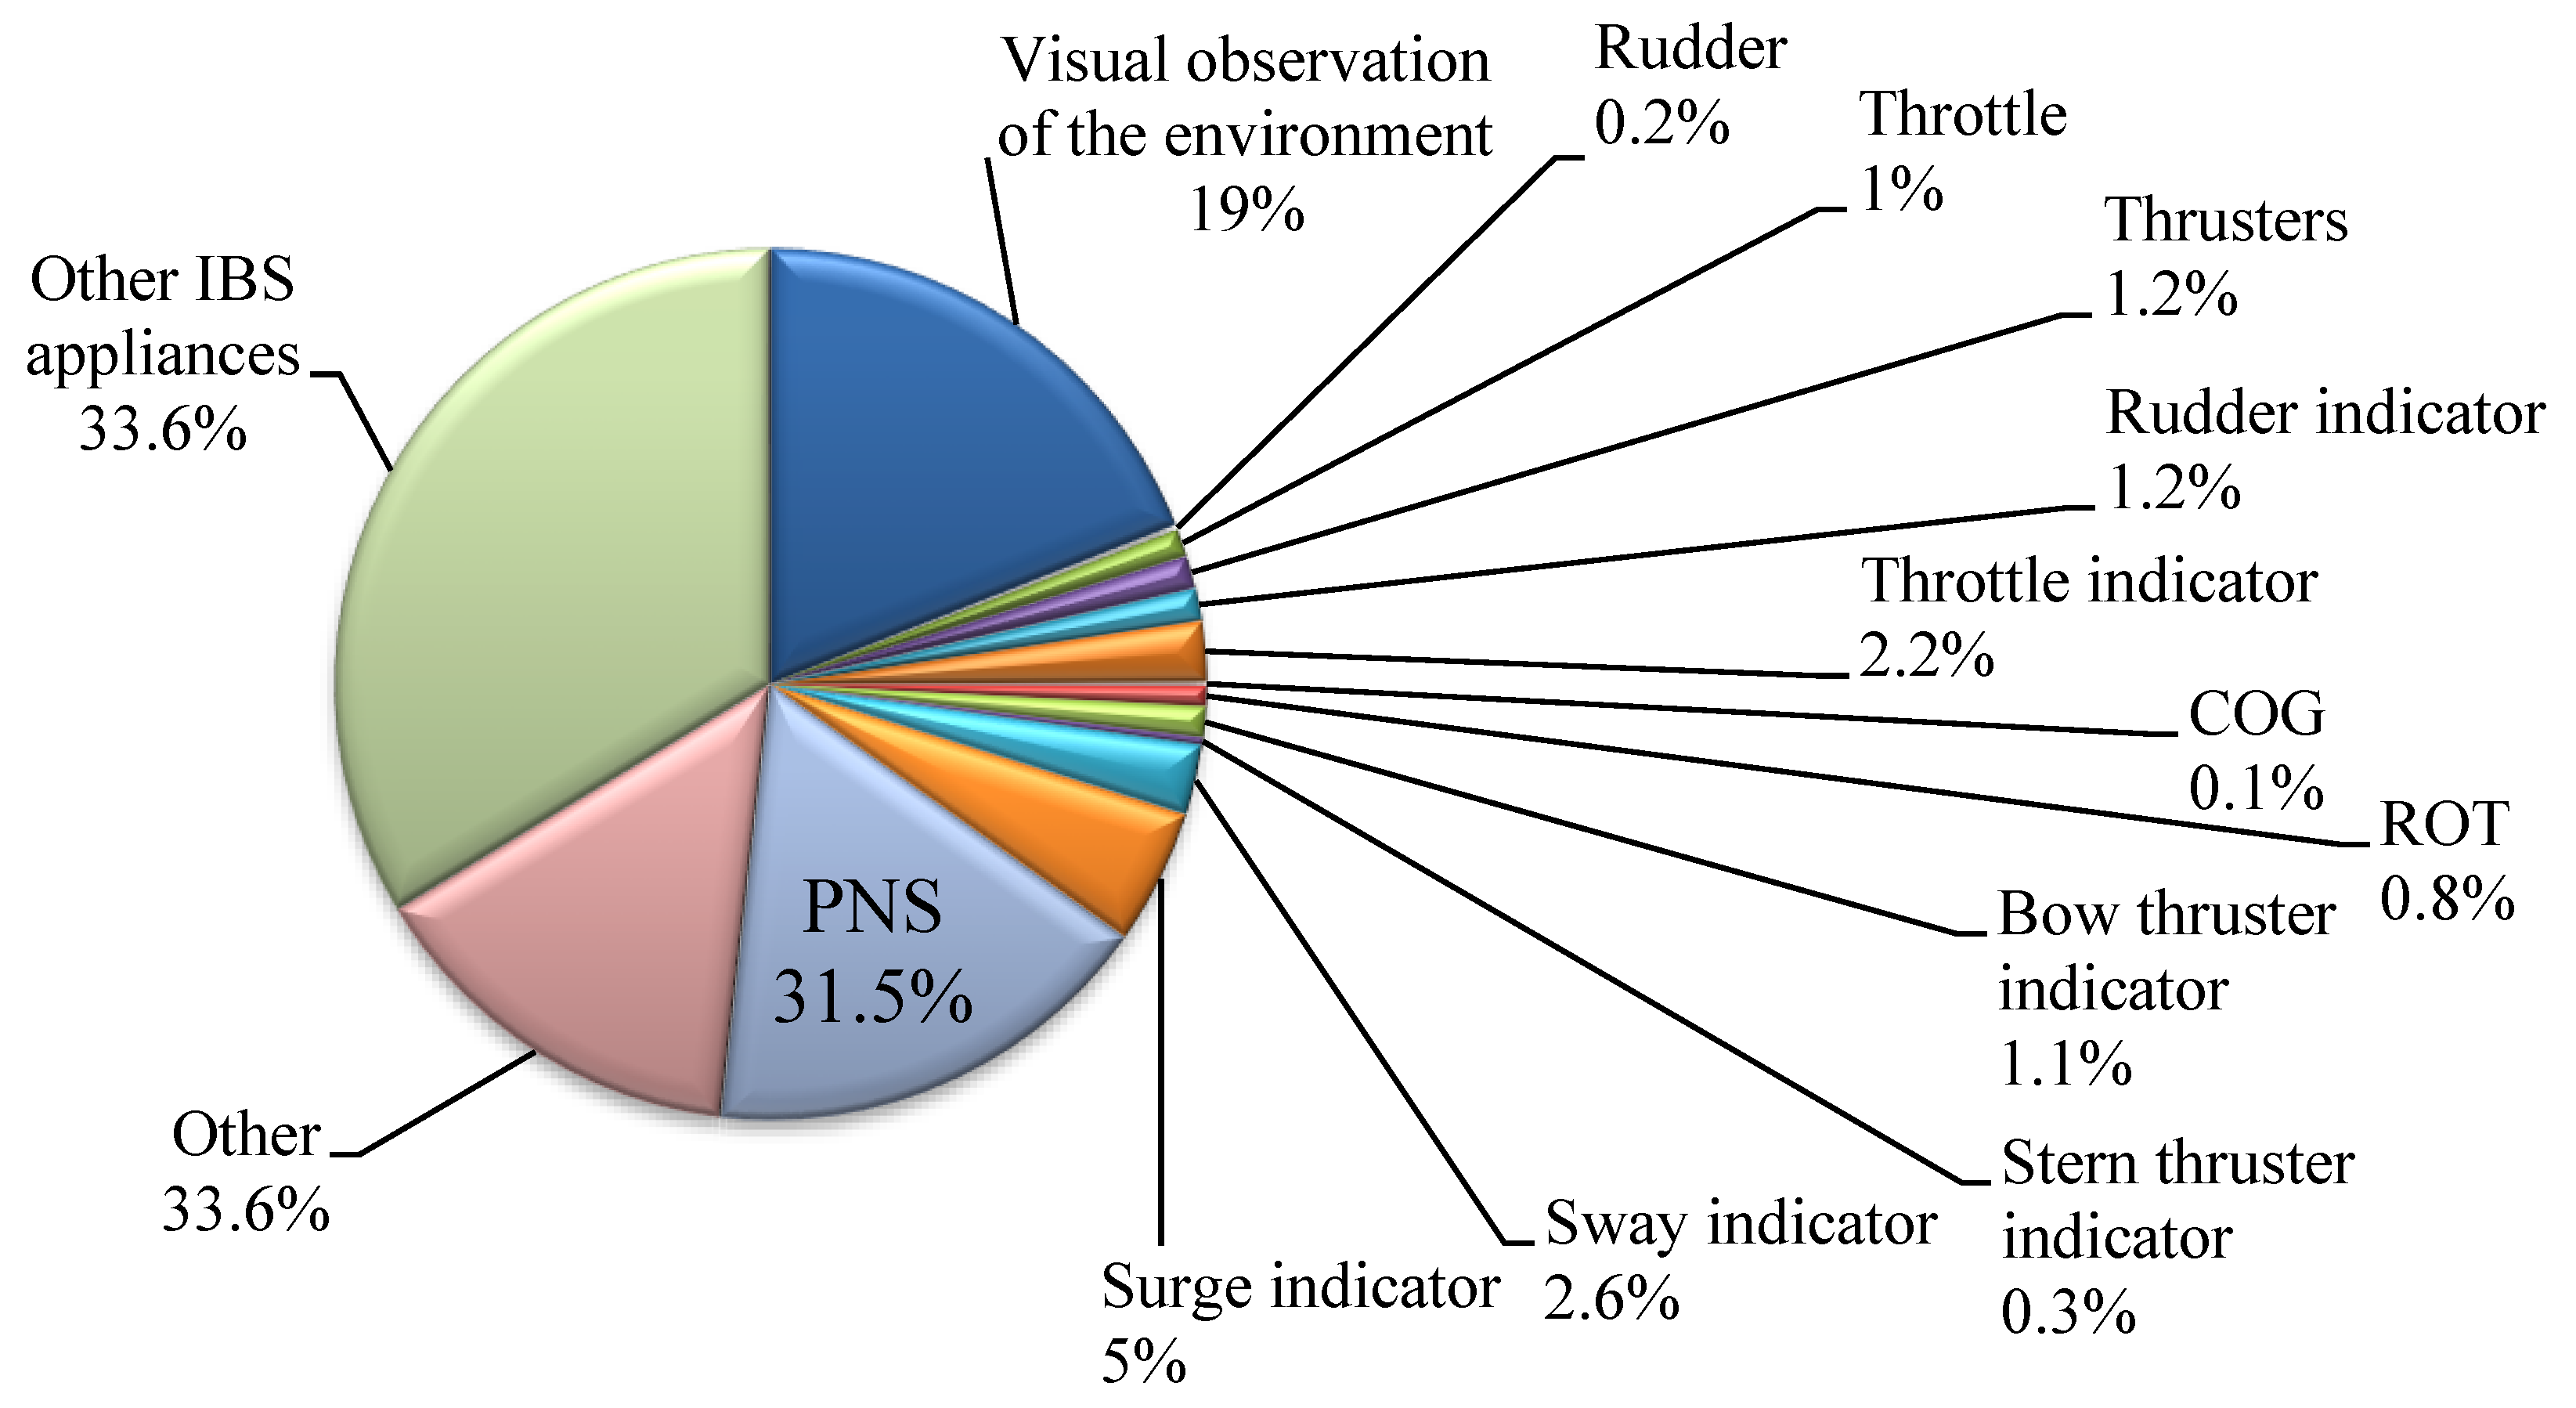
- time of navigator’s relevant visual observation of the environment and the observation of the DSS display; and
- field of view required by the observer (place toward which the eyes are directed).
- (1)
- The total time of observation in individual areas of interest was the sum of all the times of visual fixations registered in a given area during a series of 30 passages in the open sea and 30 in restricted waters.
- (2)
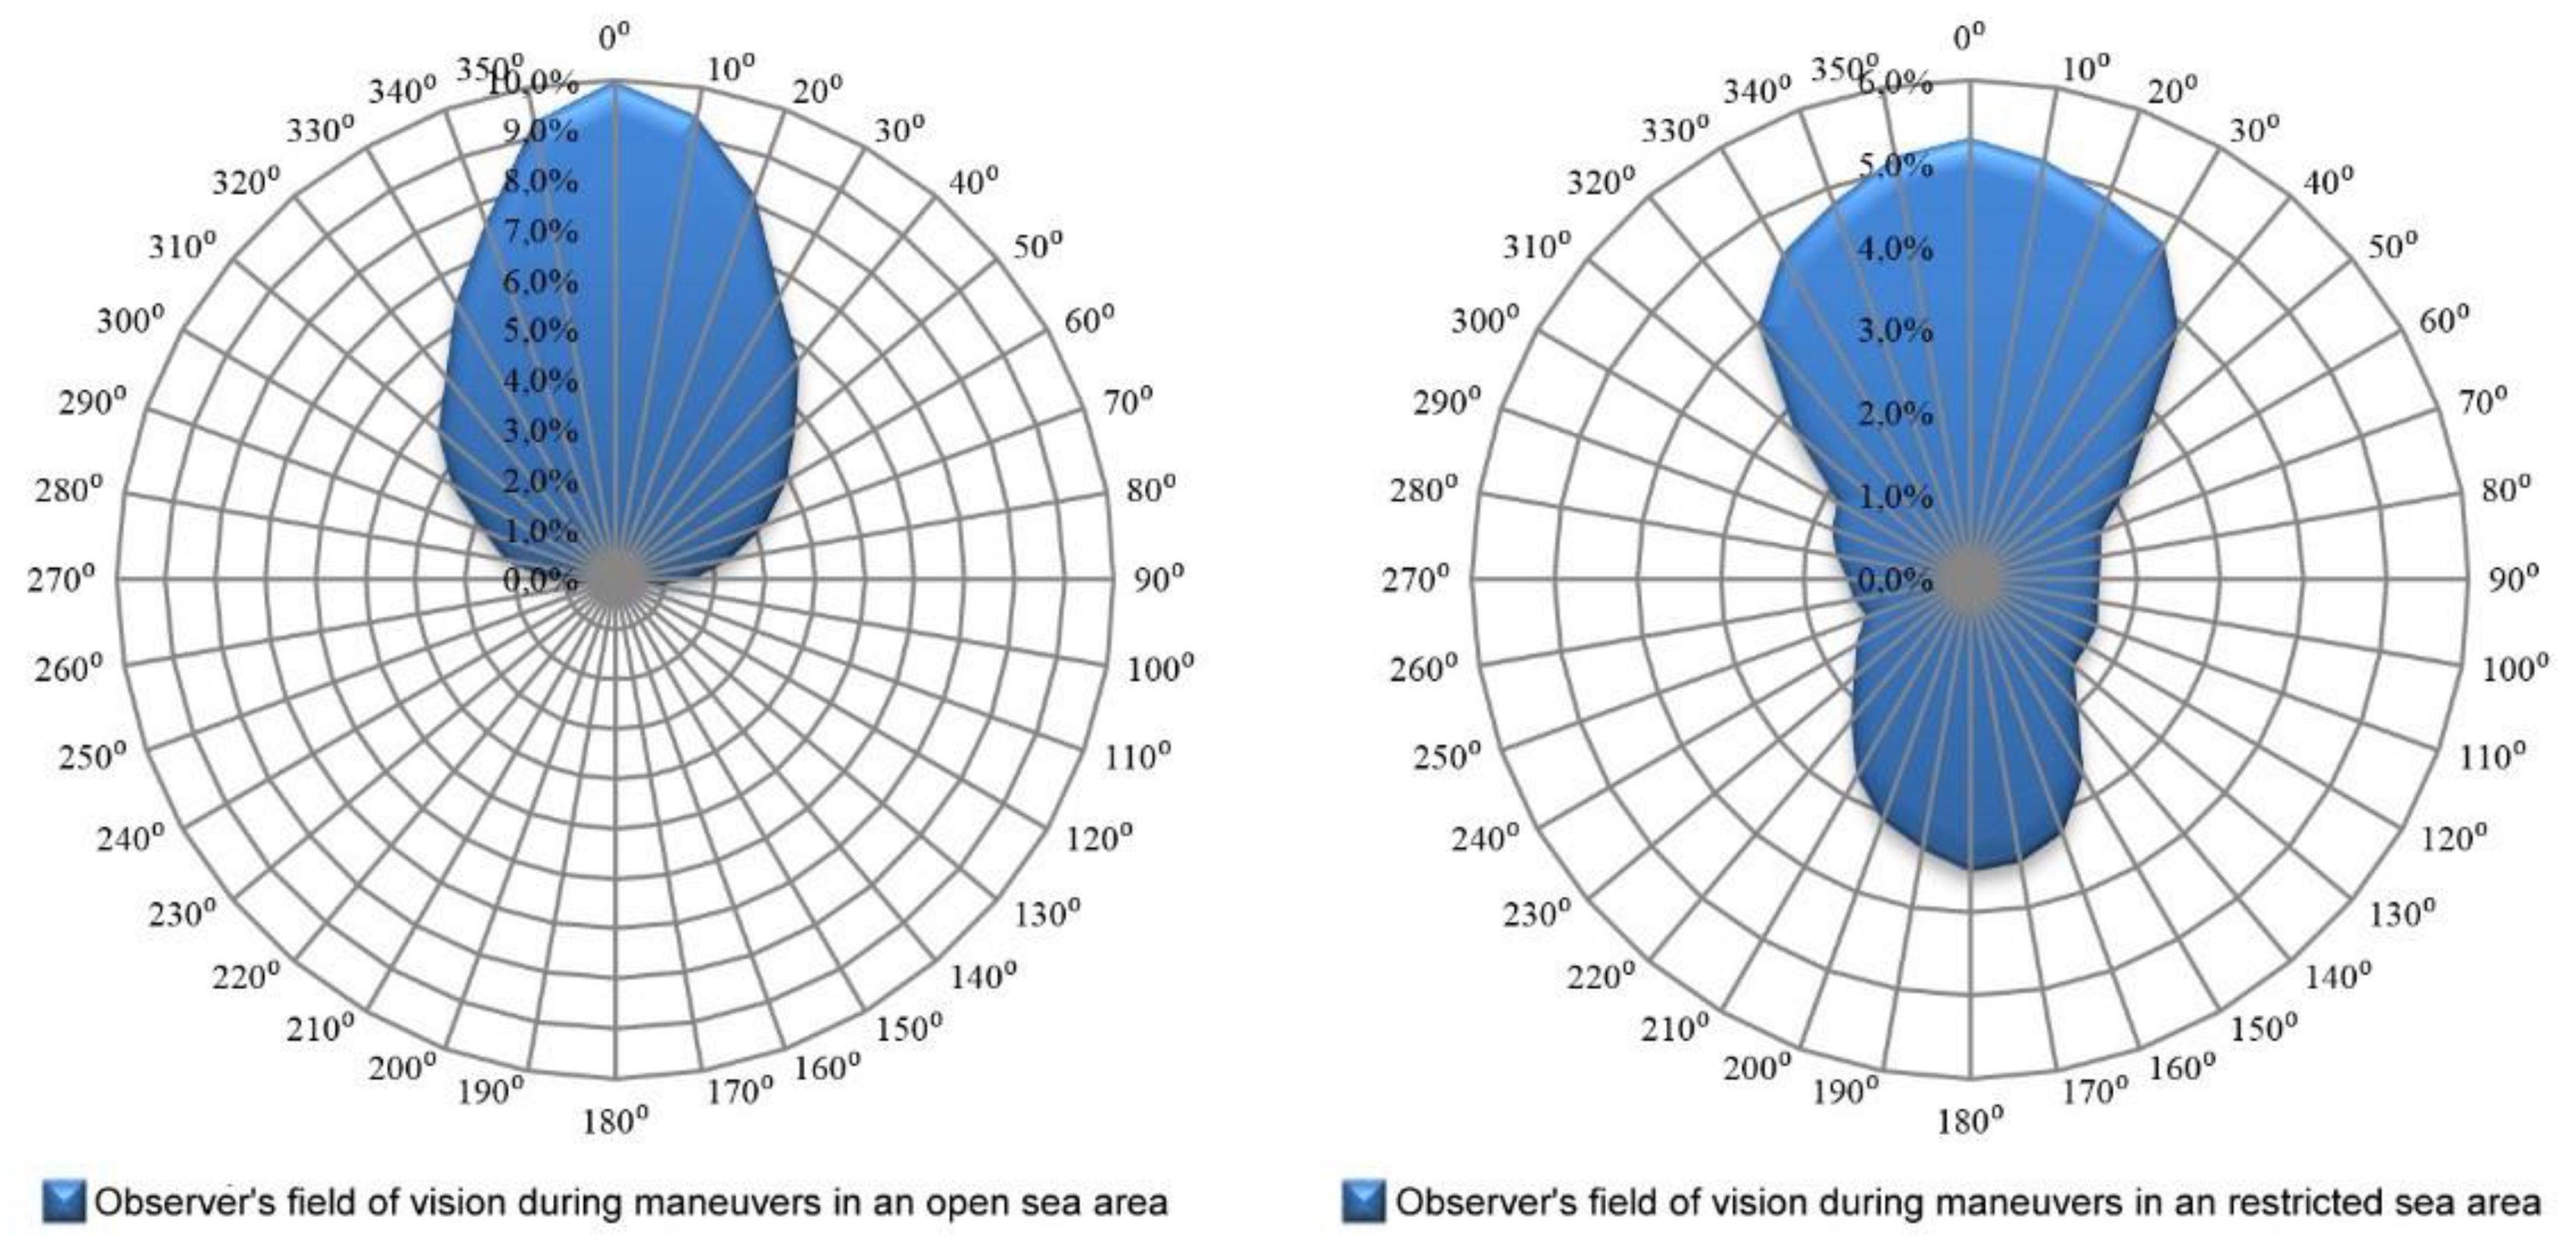
- The navigator’s field of vision for those passages were determined in the sector from 0° to 360°, with a 10° interval, as follows:
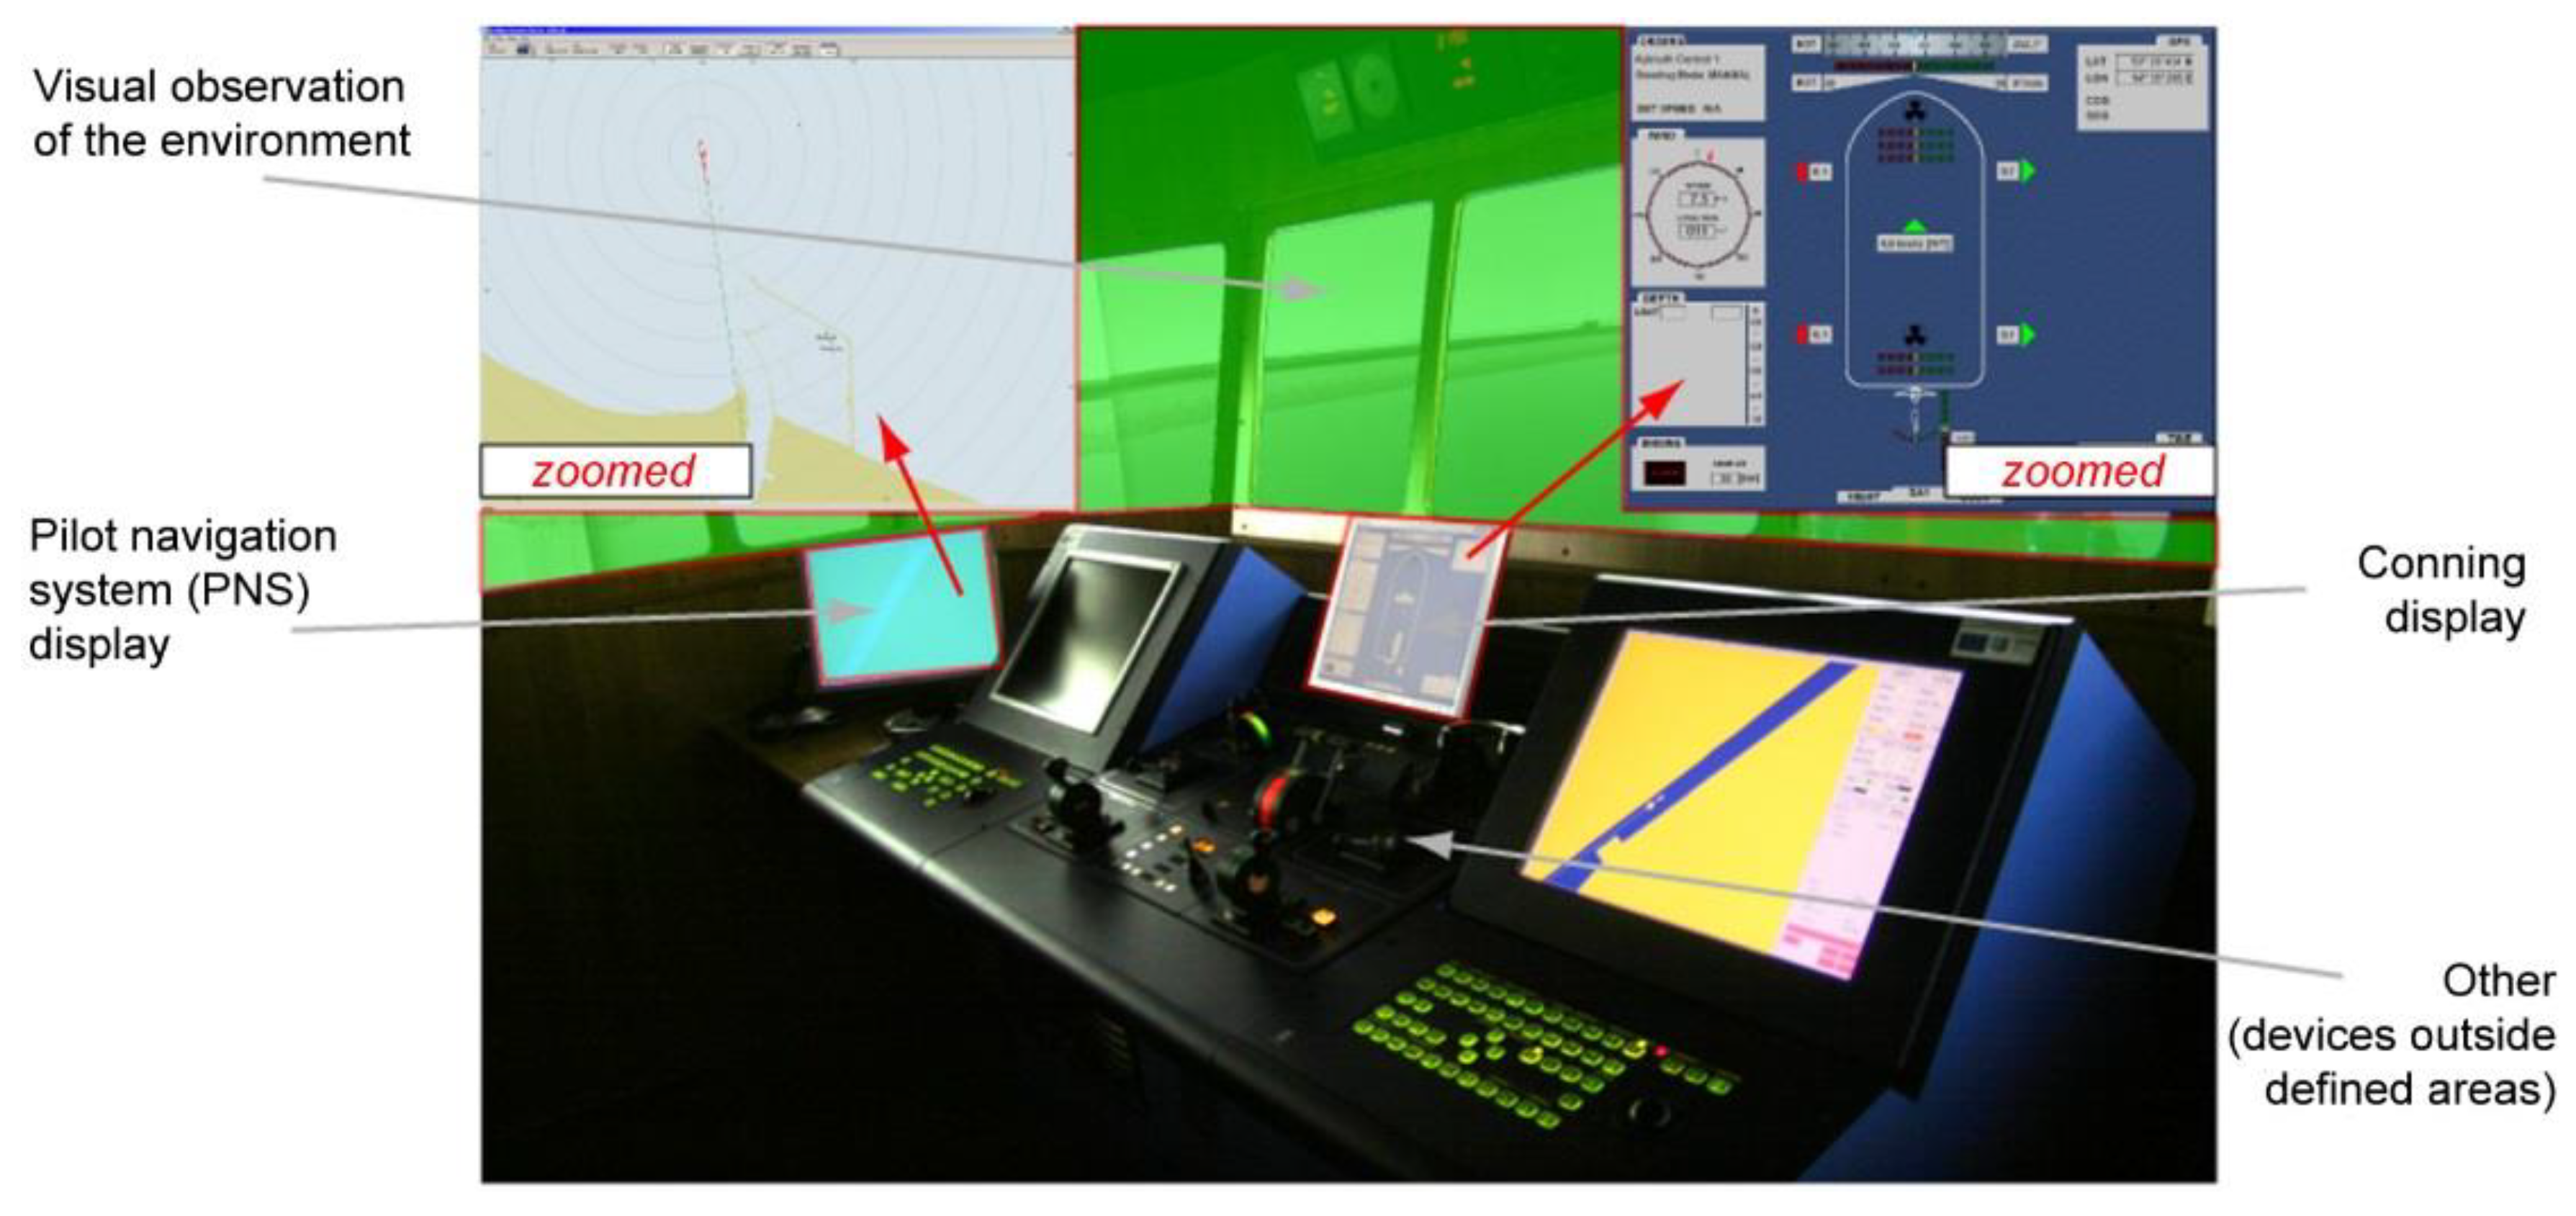
- when the navigator gazed at the area assigned to visual observation, his viewing angle relative to the ship’s center line was determined in reference to the windows, fixed elements of simulated bridge equipment; and
- when visual observation of the environment was not possible, which caused the navigator to gaze at an area assigned to the pilot system, the viewed site was determined in degrees from the shipboard radar lubber line.
- the navigator cannot move from place to place, and the image recorder (the base in AR technology), static or mobile, see-through or non-see-through, cannot be mounted in any place in the space. In this way, the navigator’s field of vision is decreased and so is the scope of supplied spatial information (e.g., outside the ship in berthing maneuvers); and
- limited field of observation or image registration in poor visibility necessitates the generation of a large number of virtual objects replacing real objects, which finally leads to the use of AV technology.
4.2. Principle of Operation of the Method
4.3. Construction of Additional Navigational Tools Module of Selective Information Presentation Model
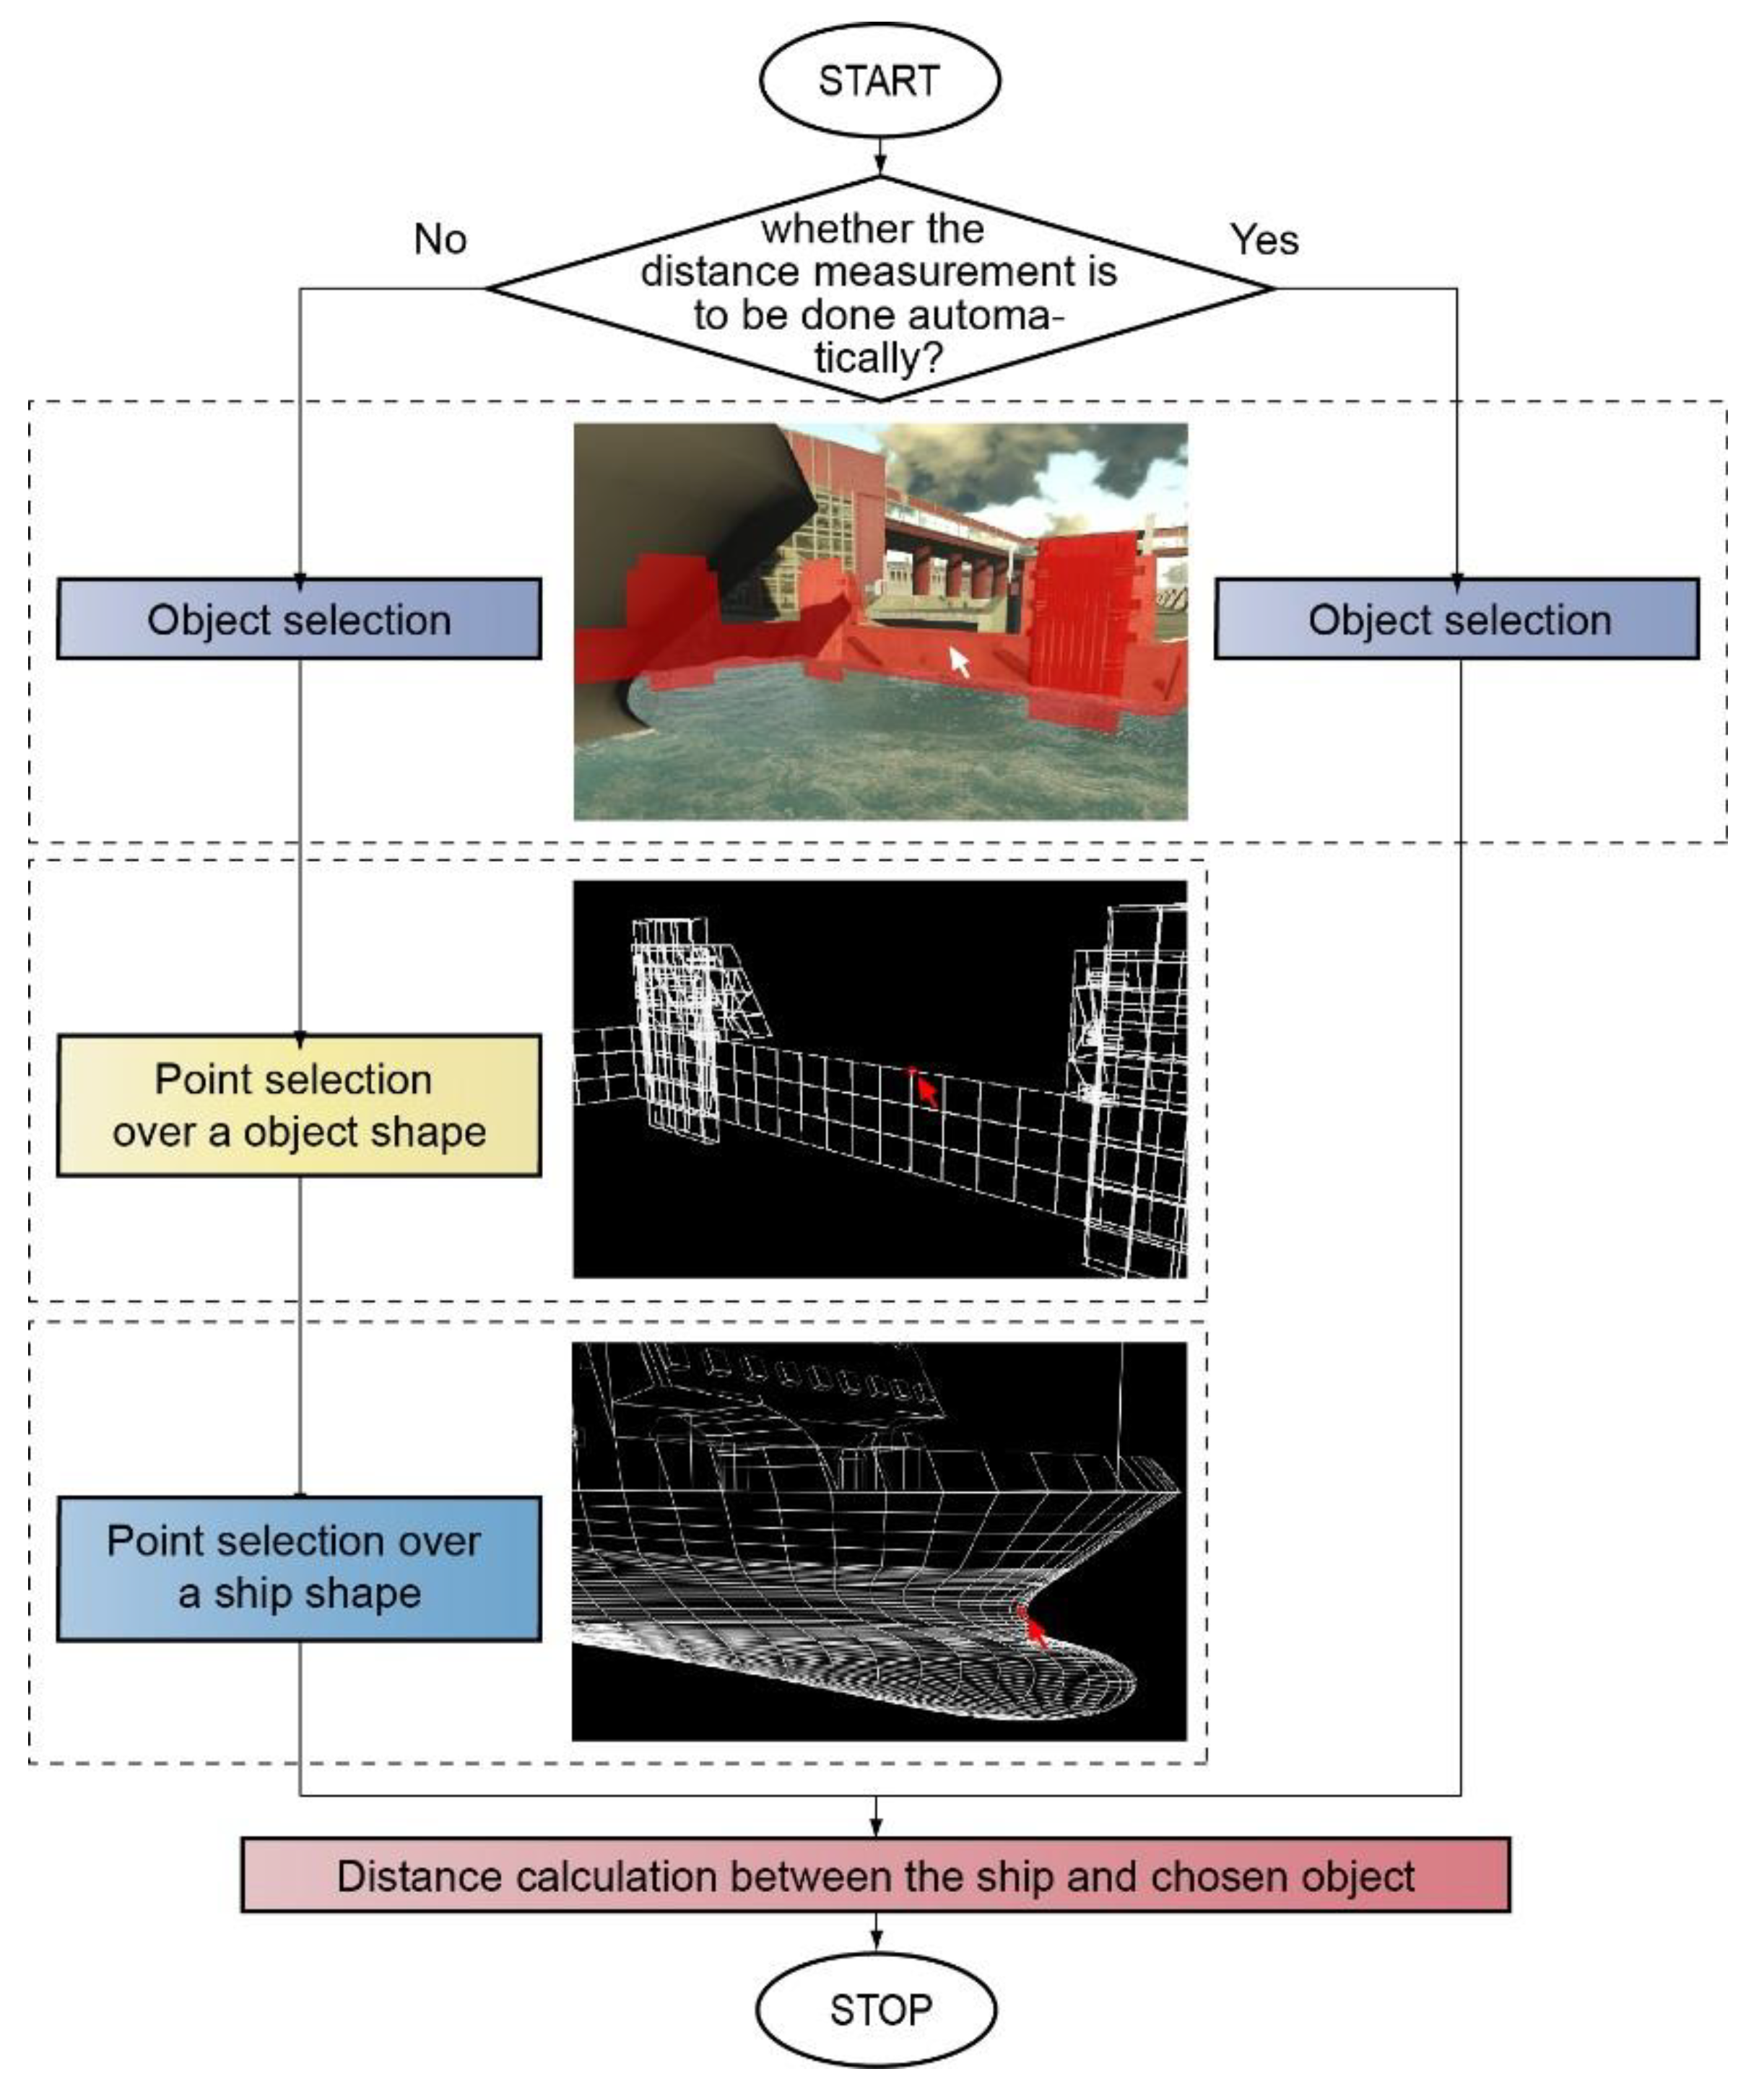
- (1)
- Distances between two points. The distance is calculated automatically in real time between two points defined by the observer. The points, with the use of an object camera, are indicated on a polygon mesh of 3D geometric model of their own ship and the selected object of the environment (left-hand loop of the algorithm in Figure 9).
- (2)
- The shortest distance. The distance calculated automatically in real time, between the nearest points of a polygon mesh of the ship’s model and the model of the restricted area object selected by the observer (right-hand loop of the algorithm in Figure 9).
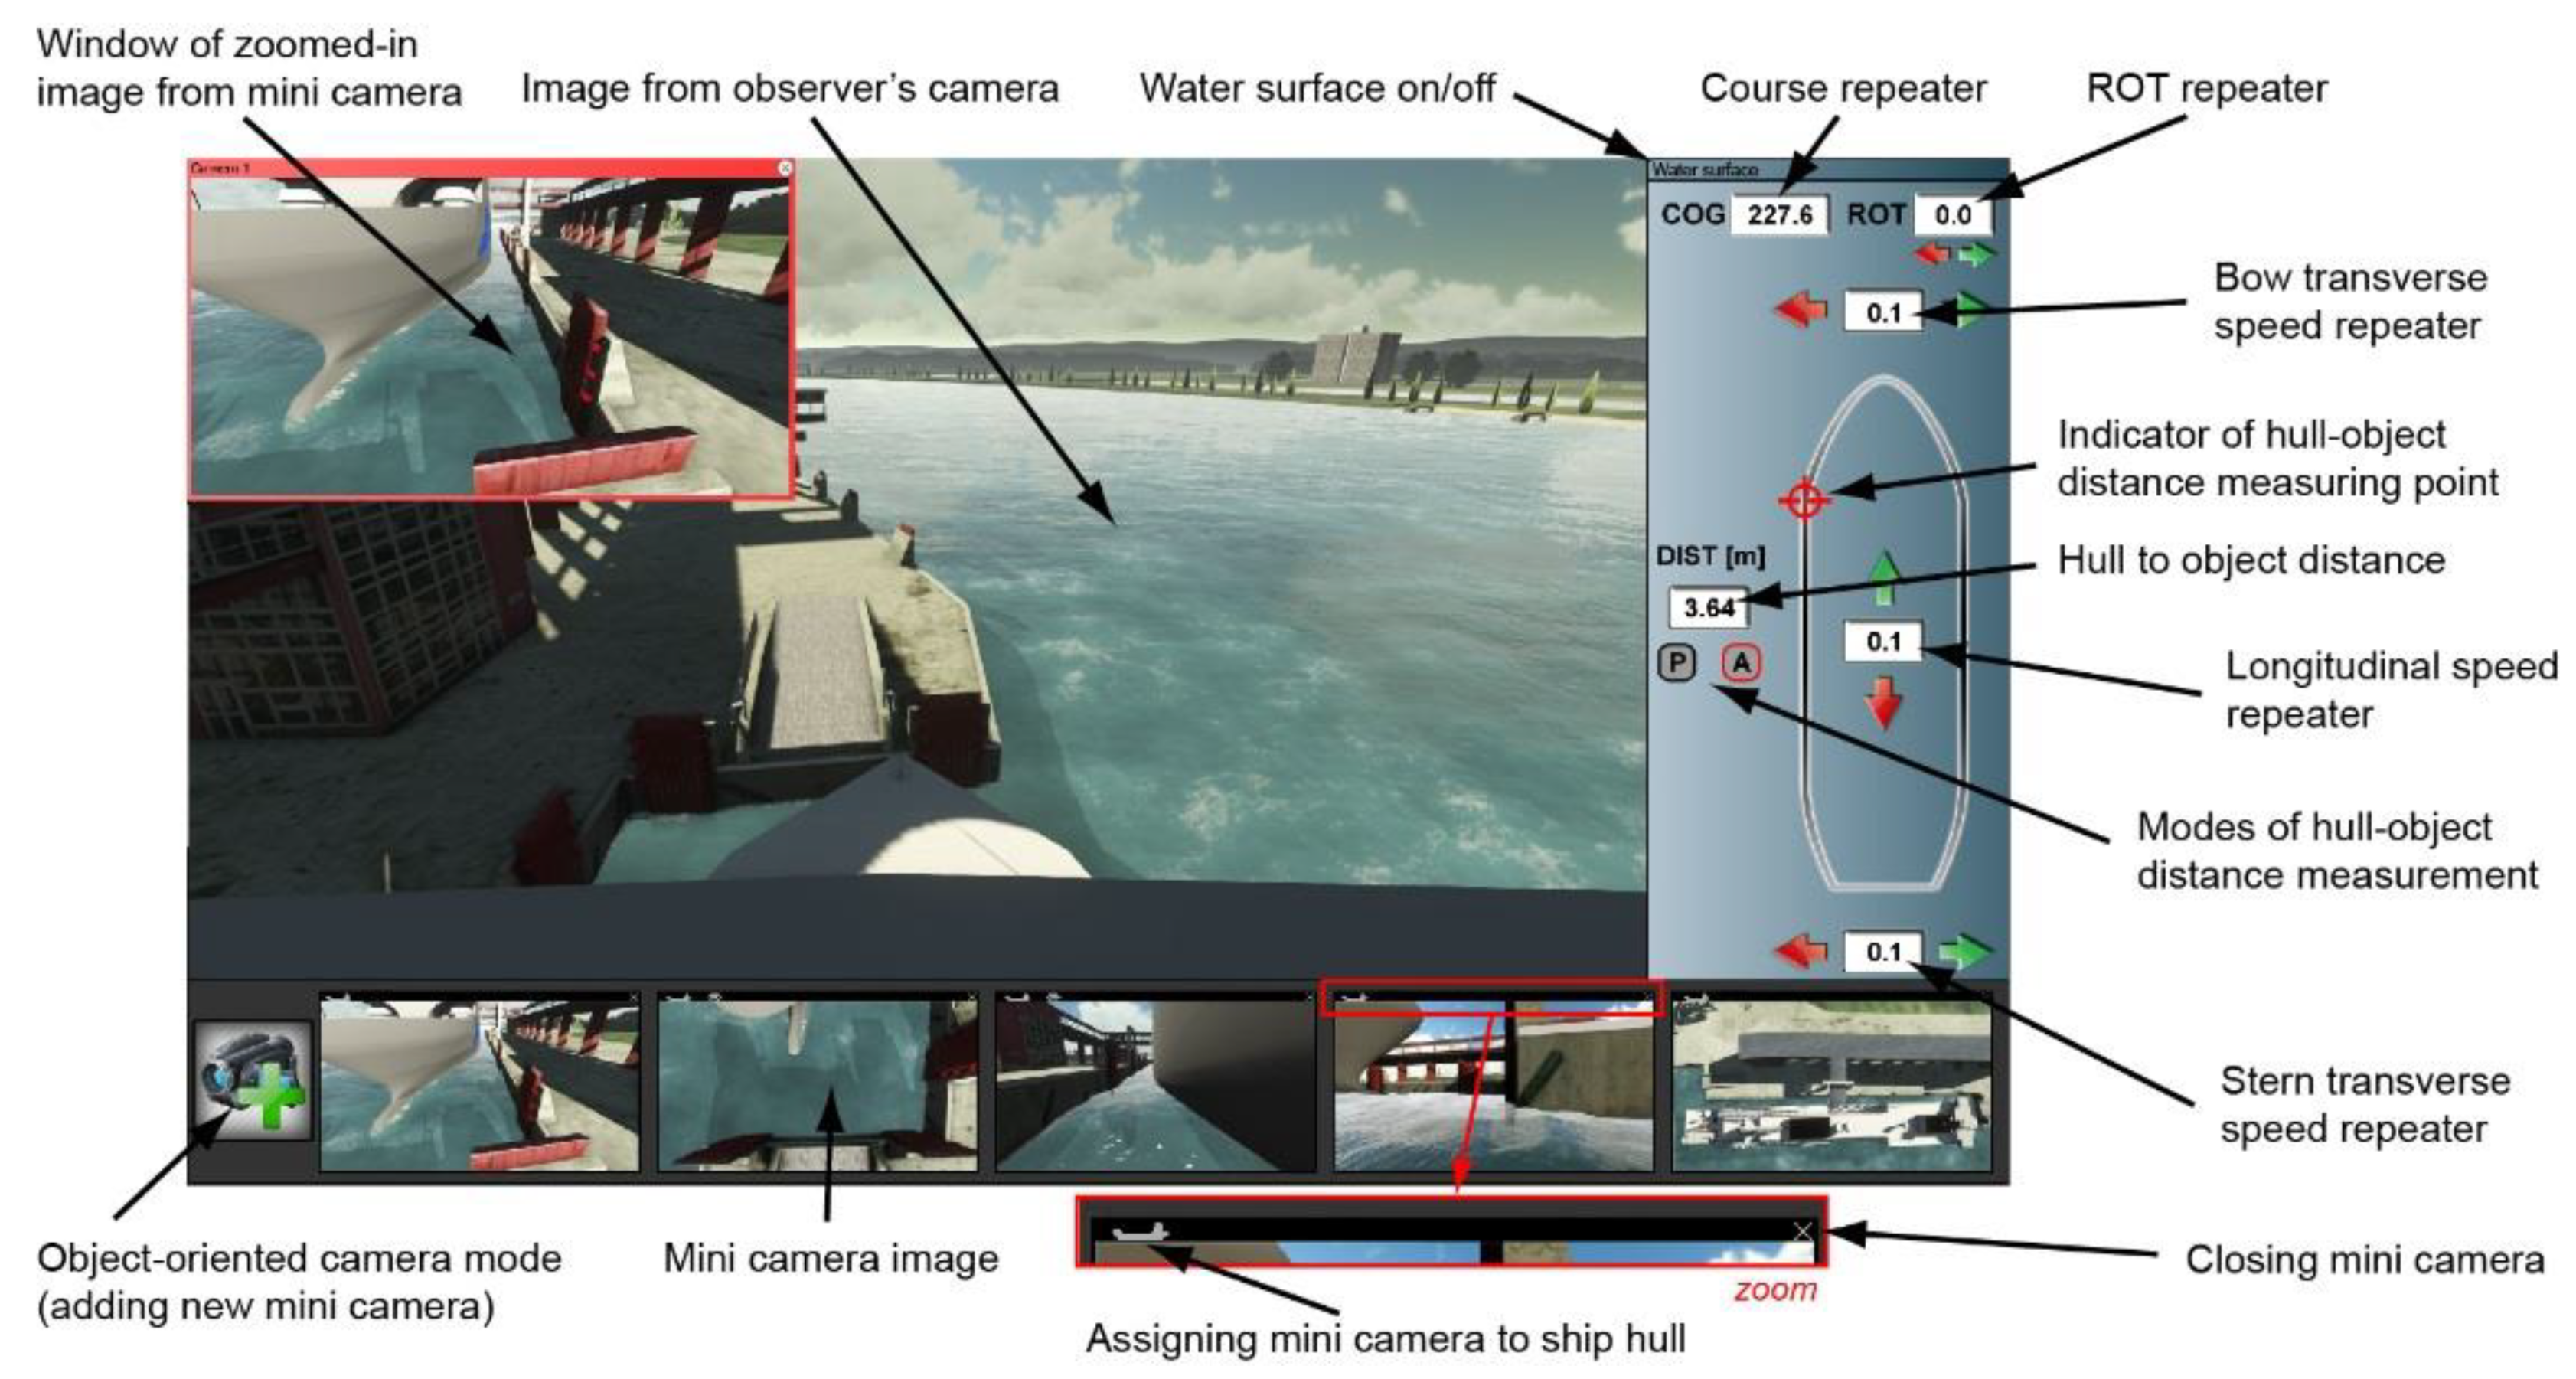
4.4. Construction of a Model of the SDSS Augmented Interface
- correct depth perception and distance estimation (appropriate size of images);
- easy handling by means of peripherals (pre-defined gestures, keyboard shortcuts, etc.);
- meeting the requirements of the graphics pipeline in computerizing the system algorithm (limitations in texturing, mapping, number of generated image frames); and
- possibility of displaying on a single screen (bridge work ergonomics).
5. Discussion
- the ECDIS decision support system in the form of electronic navigational chart (ENC);
- the system of decision support with navigational display realized in parallel top view projection, with a maximum contour of the vessel (analogue to the pilot systems); and
- the system of decision support with navigational display, realized in the parallel top view projection, with the contour of the vessel on the theoretical plane of contact with the shore–ship collision contour (analogue to the pilot and docking systems).
- the primary (superior) criteria for the assessment of navigational safety, i.e.,
- the average maneuvering area of the ship, estimated for the confidence coefficient 0.95;
- maximum maneuvering area of the ship;
- resultant value of vessel speed determined at the moment of ship’s hull contact with a fender (modified criterion of kinetic energy of first contact with the shore); and
- the value of the minimum distance of ship’s hull from the navigational obstacle.
- the auxiliary (subordinate) criterion for assessing the efficiency of maneuvering (i.e., maneuvering time length).
- the place of the ship’s hull contact with the collision object is not in the observer’s sight (is in an obscured or inaccessible place) or the prevailing conditions of reduced visibility exclude visual observation; and
- the lines of the cross- and longitudinal-sections of the hull and the collision object in the surroundings at the point of contact have a complex shape, different to the rectangle or where in the orthogonal top view the edge of the ship’s contact with the collision object is obscured by any sectional plane (of the ship or object).
6. Conclusions
Funding
Conflicts of Interest
References
- Rozkrut, D. Statistical Yearbook of Maritime Economy 2018; Główny Urząd Statystyczny: Warszawa, Poland, 2018. [Google Scholar]
- Flacke, J. Spatial Decision Support Systems—Introduction to Concepts and Requirements; Technical Skills Course: Web-GIS and Spatial Data Infrastructure CHANGES Project: Dortmund, Germany, 2012. [Google Scholar]
- Swanson, J. The Cartographic Possibilities of VRML, Multimedia Cartography; Springer: Berlin/Heidelberg, Germany, 1999; pp. 181–194. [Google Scholar]
- Porathe, T. Improved situation awareness in navigation using egocentric view 3-D nautical charts. In Proceedings of the 16th International Ergonomic Association’s World Congress, Maastricht, The Netherlands, 10–14 July 2006; Elsevier: Holland, The Netherlands, 2006. [Google Scholar]
- Ford, S.F. The first three-dimensional nautical chart. In Undersea with GIS; ESRI Press: Redlands, CA, USA, 2002; pp. 117–138. [Google Scholar]
- Łubczonek, J.; Trojanowski, J.; Włodarczyk-Sielicka, M. Zastosowanie trójwymiarowego zobrazowania informacji nawigacyjnej w mapach elektronicznych dla żeglugi śródlądowej. Archiwum Fotogrametrii Kartografii i Teledetekcji 2012, 23, 261–269. [Google Scholar]
- Gold, C.; Góralski, R. 3D Graphics applied to maritime safety. In Information Fusion and Geographic Information Systems; Springer: Berlin/Heidelberg, Germany, 2007; pp. 286–300. [Google Scholar]
- Blast Project. Bringing Land and Sea Together—Blast Project: State of the Art and Data Audit for North Sea Region; Danish National Survey and Cadastre: Copenhagen, Denmark, 2011. [Google Scholar]
- Carbajosa, J.; Lozano, J.J.; Velásquez, S.; Wittkuhn, D.; Zahharov, M.; Ehrke, K.C.; Abreu, J.; Marques, R. EPDIS: The electronic pilot book display system. Trans. Built Environ. 2005, 373–381. [Google Scholar] [CrossRef]
- Brennan, R.T.; Ware, C.; Alexander, L.; Armstrong, A.; Mayer, L.; Huff, L.; Calder, B.; Smith, S.; Plumlee, M.; Arsenault, R.; et al. The electronic chart of the future: The hampton roads demonstration project. In Proceedings US Hydro Conference; University of New Hampshire: Durham, NH, USA, 2003. [Google Scholar]
- Bentzen, M.; Borup, O.; Christensen, T. The efficiensea e-navigation approach–filling the gap. In Proceedings of the E-Navigation Underway: International Conference on E-Navigation, Copenhagen, Denmark, 31 January–2 February 2011; EMA: Amsterdam, The Netherlands, 2012; pp. 14–28. [Google Scholar]
- Ternes, A.; Knight, P.; Moore, A.; Regenbrecht, H. A user-defined virtual reality chart for track control navigation and hydrographic data acquisition. In Geospatial Vision; Springer: Berlin/Heidelberg, Germany, 2008; pp. 19–44. [Google Scholar]
- Arsenault, R.; Plumlee, M.; Smith, S.; Ware, C.; Brennan, R.; Mayer, L.A. Fusing Information in a 3D Chart-of-the-Future Display; US Hydro: Biloxi, MS, USA, 2003. [Google Scholar]
- Hugues, O.; Cieutat, J.-M.; Guitton, P. An experimental augmented reality platform for assisted maritime navigation. In Proceedings of the 1st Augmented Human International Conference, Megève, France, 2–3 April 2010; ACM Press: New York, NY, USA, 2010. [Google Scholar]
- Raymarine, Raymarine E-Series. 2019. Available online: http://www.raymarine.com/view/index-id=2966.html (accessed on 2 January 2020).
- Garmin, Garmin Mariner 3D. 2019. Available online: https://www.garmin.com/en-GB/maps/bluechart/ (accessed on 2 January 2020).
- C-Map, C-Map 4D. 2019. Available online: https://lightmarine.c-map.com/chart-plotters/c-map-4d (accessed on 2 January 2020).
- AAWA. Remote and Autonomous Ships—The Next Steps, Espoo: AAWA—Advanced Autonomous Waterborne Applications Initiative; Rolls-Royce plc: London, England, 2016. [Google Scholar]
- MUNIN. D9.3: Quantitative Assessment, s.l.: MUNIN—Maritime Unmanned Navigation through Intelligence in Networks; Fraunhofer-Gesellschaft: Munich, Germany, 2015. [Google Scholar]
- Batalden, B.M.; Leikanger, P.; Wide, P. Towards autonomous maritime operations. In Proceedings of the 2017 IEEE International Conference on Computational Intelligence and Virtual Environments for Measurement Systems and Applications (CIVEMSA), Annecy, France, 26–28 June 2017; IEEE; pp. 1–6. [Google Scholar]
- Kutsuna, K.; Ando, H.; Nakashima, T.; Kuwahara, S.; Nakamura, S. NYK’s approach for autonomous navigation–structure of action planning system and demonstration experiments. J. Phys. Conf. Ser. 2019, 1357, 12013. [Google Scholar] [CrossRef]
- Бoшкoв, И.И.; Крутикoва, А.А. Системы дoпoлненнoй реальнoсти для мoрскoй навигации. Int. Sci. J. Symb. Sci. 2018, 8, 1–8. [Google Scholar]
- Lurås, S. Systemic Design in Complex Contexts: An Enquiry through Designing a Ship’s Bridge; Oslo School of Architecture and Design: Oslo, Norway, 2016. [Google Scholar]
- Haase, K.; Koch, R. Extension of sea charts for 3D visualization. In ISPRS Proceedings, 3DGeoInfo Conference; ISPRS; Aachen, Germany, 2010. [Google Scholar]
- Benton, C. Augmented Reality for Maritime Navigation: The Next Generation of Electronic Navigational Aids. In Proceedings of the 7th Marine Transportation System Research & Technology Coordination Conference, Washington, DC, USA, 16–17 November 2004. [Google Scholar]
- Spears, T. 2012. Available online: https://www.designboom.com/technology/rolls-royce-ox-bridge-autonomous-vessel-12-15-2014/ (accessed on 2 January 2020).
- Raymarine, Raymarine ClearCruiseAR. 2019. Available online: http://www.raymarine.com/clearcruise.html (accessed on 2 January 2020).
- Ahuja, G.; Pacis, E.B.; Sights, B.; Fellars, D.; Everett, H.R. Layered Augmented Virtuality; Space and Naval Warfare Systems Command: San Diego, CA, USA, 2007. [Google Scholar]
- Rackliffe, N. An Augmented Virtuality Display for Improving UAV Usability; Brigham Young University: Brigham, MA, USA, 2005. [Google Scholar]
- Sanguino, T.J.M.; Márquez, J.M.A.; Carlson, T.; Millán, J.D.R. Improving skills and perception in robot navigation by an augmented virtuality assistance system. J. Intell. Robot. Syst. 2014, 76, 255–266. [Google Scholar] [CrossRef]
- Milgram, P.; Kishino, F. A taxonomy of mixed reality visual displays. IEICE Trans. Inf. Syst. 1994, 77, 1321–1329. [Google Scholar]
- Tamura, H.; Yamamoto, H.; Katayama, A. Mixed reality: Future dreams seen at the border between real and virtual worlds. IEEE Comput. Graph. Appl. 2001, 21, 64–70. [Google Scholar] [CrossRef]
- Milgram, P.; Takemura, H.; Utsumi, A.; Kishino, F. Augmented reality: A class of displays on the reality-virtuality continuum. Photonics Ind. Appl. 1995, 282–292. [Google Scholar] [CrossRef]
- Vasiljević, A.; Borović, B.; Vukić, Z. Augmented reality in marine applications. Brodogradnja 2011, 62, 136–142. [Google Scholar]
- Azuma, R.T. A survey of augmented reality. Presence 1997, 6, 355–385. [Google Scholar] [CrossRef]
- Miller, H.L.; Bugnariu, N.L. Level of immersion in virtual environments impacts the ability to assess and teach social skills in autism spectrum disorder. Cyberpsychol. Behav. Soc. Netw. 2016, 19, 246–256. [Google Scholar] [CrossRef] [PubMed]
- Holmqvist, K.; Nyström, M.; Andersson, R.; Dewhurst, R.; Jarodzka, H.; Van de Weijer, J. Eye Tracking: A Comprehensive Guide to Methods and Measures; OUP: Oxford, UK, 2011. [Google Scholar]
- Gralak, R. Assumptions to the selective system of navigational-maneuvering information presentation. Int. J. Mar. Navig. Saf. Sea Transp. 2011, 5, 433–438. [Google Scholar]
- Wartenberg, C.; Wiborg, P. Precision of exocentric distance judgments in desktop and cube presentation. Teleoper. Virtual Environ. 2003, 12, 196–206. [Google Scholar] [CrossRef]
- Yang Young-Hoon, L.B.-W. A study on the design of ergonomic bridge conning display. J. Korean Soc. Mar. Environ. Saf. 2005, 11, 2. [Google Scholar]


| Rudder | Throttle | Thrusters | Visual Observation of the Environment | Rudder Indicator | Throttle Indicator | COG | ROT | Bow Thruster Indicator | Stern Thruster Indicator | Sway Indicator | Surge Indicator | PNS_AoI Defined for Ship | PNS_AoI Defined for Environment | |
|---|---|---|---|---|---|---|---|---|---|---|---|---|---|---|
| Rudder | 47 | 3 | 14 | 5 | 4 | 2 | 0 | 0 | 0 | 1 | 3 | 3 | 7 | 3 |
| Throttle | 9 | 245 | 17 | 4 | 11 | 35 | 0 | 1 | 0 | 12 | 3 | 8 | 32 | 16 |
| Thrusters | 14 | 20 | 359 | 14 | 1 | 9 | 0 | 1 | 4 | 8 | 29 | 14 | 62 | 37 |
| Visual observation of the environment | 2 | 6 | 21 | 3570 | 40 | 71 | 6 | 13 | 30 | 1 | 50 | 227 | 168 | 51 |
| Rudder indicator | 1 | 7 | 1 | 65 | 227 | 55 | 0 | 2 | 2 | 12 | 33 | 61 | 14 | 4 |
| Throttle indicator | 2 | 9 | 2 | 76 | 54 | 334 | 0 | 1 | 10 | 13 | 46 | 133 | 32 | 8 |
| COG | 0 | 0 | 0 | 3 | 0 | 0 | 18 | 14 | 3 | 1 | 2 | 1 | 0 | 0 |
| ROT | 0 | 1 | 3 | 37 | 2 | 4 | 15 | 118 | 5 | 0 | 21 | 20 | 6 | 8 |
| Bow thruster indicator | 0 | 3 | 4 | 53 | 11 | 20 | 1 | 37 | 164 | 4 | 48 | 57 | 12 | 4 |
| Stern thruster indicator | 0 | 1 | 4 | 3 | 13 | 10 | 0 | 0 | 0 | 32 | 21 | 23 | 2 | 4 |
| Sway indicator | 0 | 10 | 19 | 89 | 56 | 62 | 2 | 28 | 57 | 9 | 461 | 170 | 43 | 11 |
| Surge indicator | 1 | 26 | 20 | 149 | 58 | 109 | 0 | 16 | 110 | 14 | 233 | 939 | 95 | 32 |
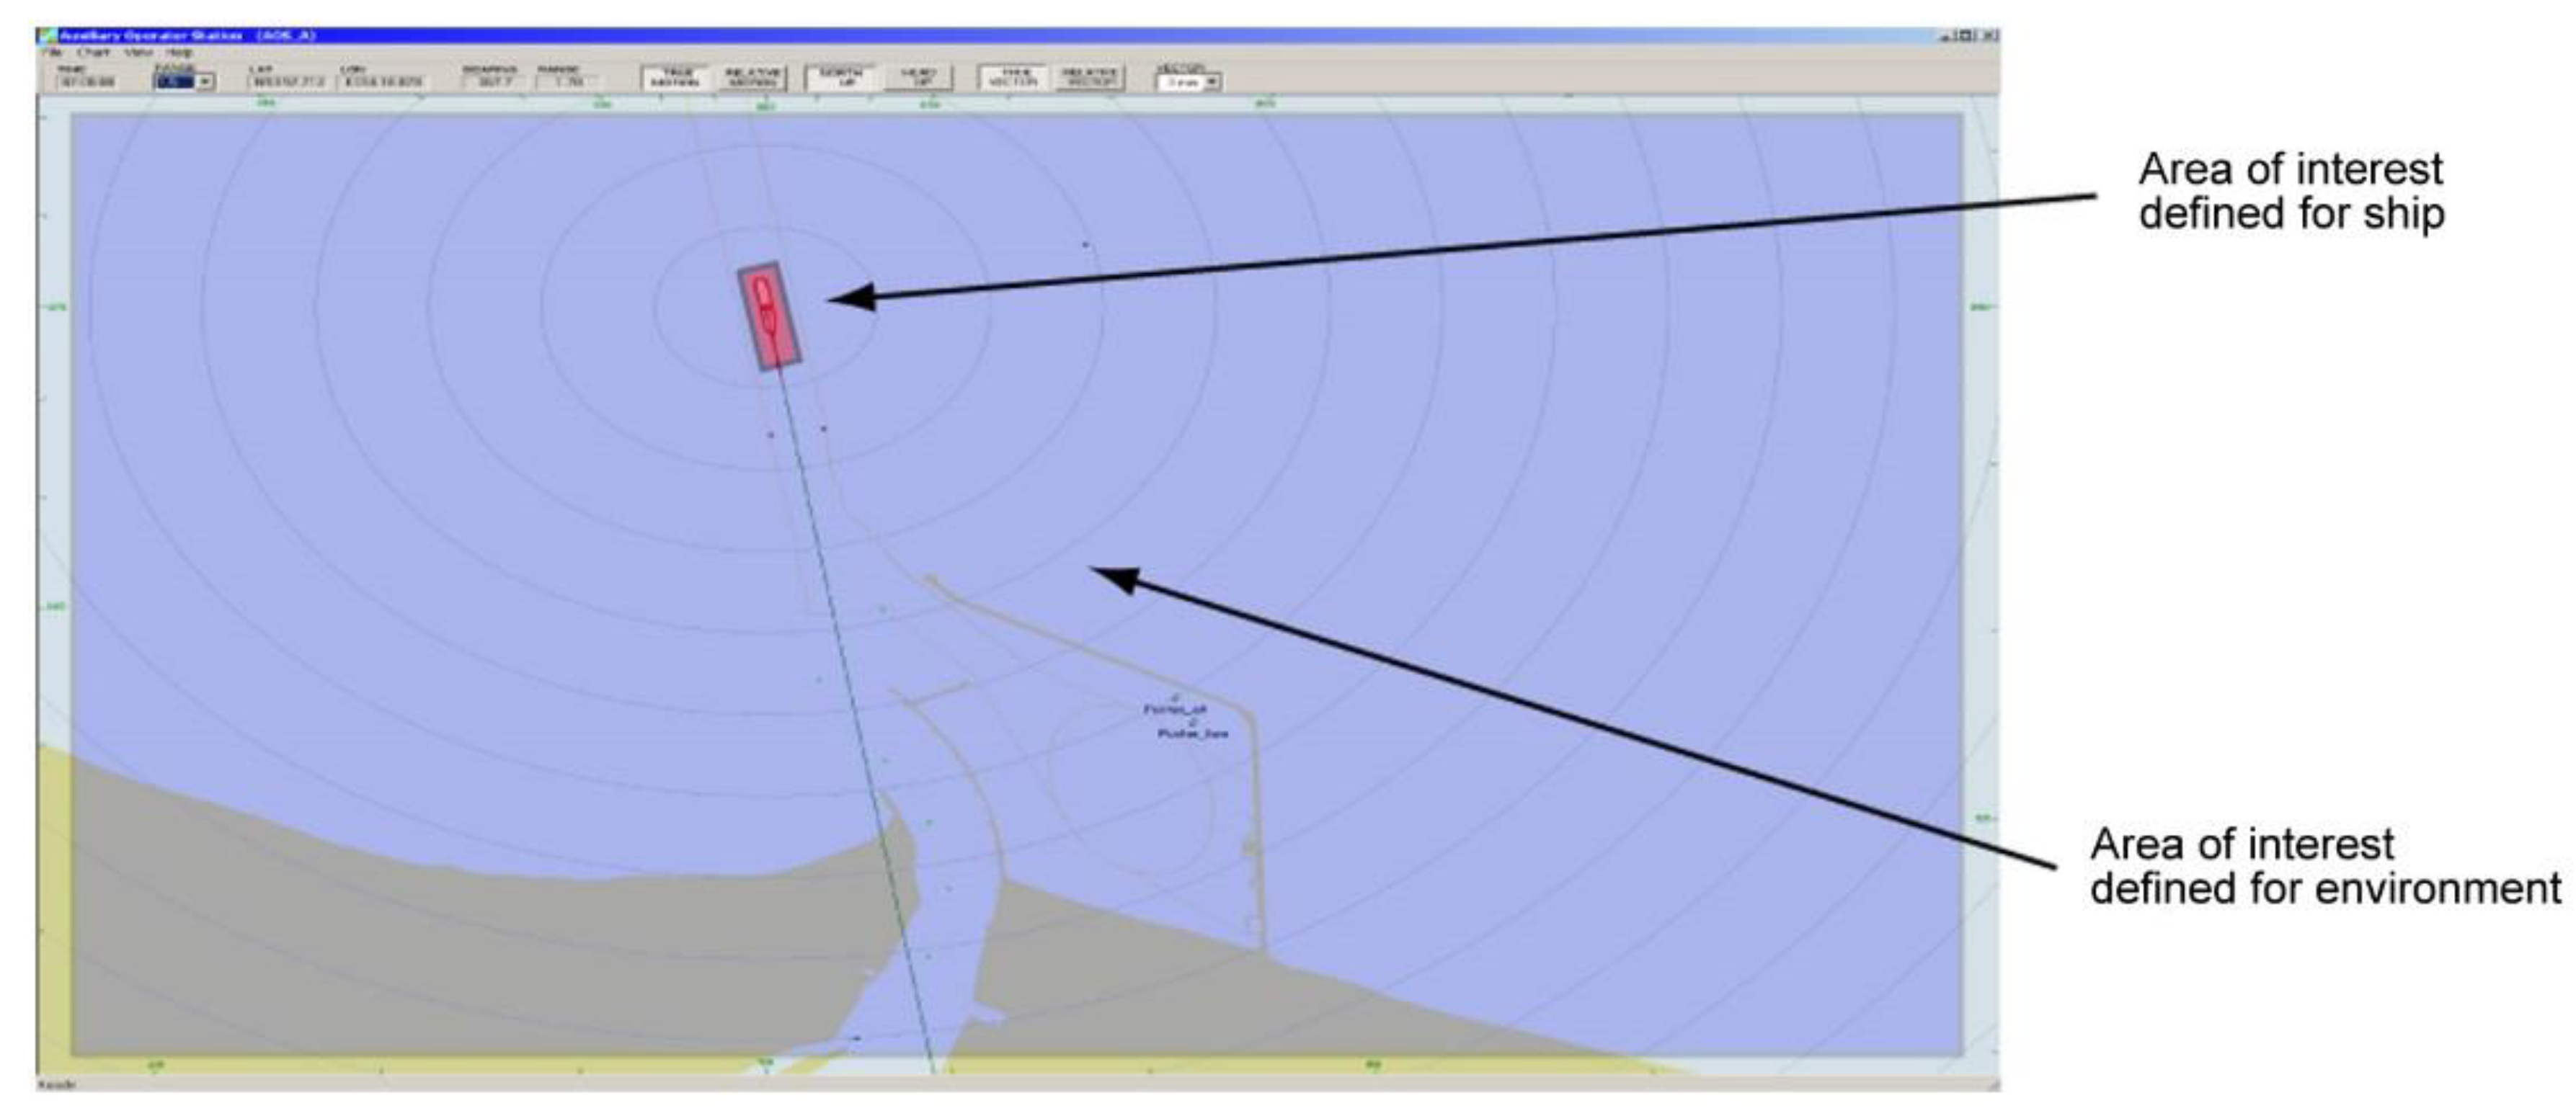
| PNS_AoI defined for ship | 5 | 33 | 57 | 92 | 8 | 3 | 0 | 5 | 16 | 1 | 31 | 75 | 742 | 223 |
| PNS_AoI defined for environment | 10 | 28 | 51 | 97 | 1 | 5 | 0 | 5 | 13 | 4 | 36 | 65 | 209 | 600 |
© 2020 by the author. Licensee MDPI, Basel, Switzerland. This article is an open access article distributed under the terms and conditions of the Creative Commons Attribution (CC BY) license (http://creativecommons.org/licenses/by/4.0/).
Share and Cite
Gralak, R. A Method of Navigational Information Display Using Augmented Virtuality. J. Mar. Sci. Eng. 2020, 8, 237. https://doi.org/10.3390/jmse8040237
Gralak R. A Method of Navigational Information Display Using Augmented Virtuality. Journal of Marine Science and Engineering. 2020; 8(4):237. https://doi.org/10.3390/jmse8040237
Chicago/Turabian StyleGralak, Rafał. 2020. "A Method of Navigational Information Display Using Augmented Virtuality" Journal of Marine Science and Engineering 8, no. 4: 237. https://doi.org/10.3390/jmse8040237
APA StyleGralak, R. (2020). A Method of Navigational Information Display Using Augmented Virtuality. Journal of Marine Science and Engineering, 8(4), 237. https://doi.org/10.3390/jmse8040237