Article

Navigators’ Behavior Analysis Using Data Mining

by
Zbigniew Pietrzykowski
1,*,
Miroslaw Wielgosz
2 and
Marcin Breitsprecher
1
1
Faculty of Computer Science and Telecommunication, Maritime University of Szczecin, 70-500 Szczecin, Poland
2
Faculty of Navigation, Maritime University of Szczecin, 70-500 Szczecin, Poland
*
Author to whom correspondence should be addressed.
J. Mar. Sci. Eng. 2020, 8(1), 50; https://doi.org/10.3390/jmse8010050
Submission received: 22 December 2019 / Revised: 2 January 2020 / Accepted: 13 January 2020 / Published: 17 January 2020

Abstract

:
One of the ways to prevent accidents at sea is to detect risks caused by humans and to counteract them. These tasks can be executed through an analysis of ship maneuvers and the identification of behavior considered to be potentially dangerous, e.g., based on data obtained online from the automatic identification system (AIS). As a result, additional measures or actions can be taken, e.g., passing at a distance greater than previously planned. The detection of risks at sea requires a prior definition of behavior patterns and the criteria assigned to them. Each pattern represents a specific navigator’s safety profile. The criteria assigned to each pattern for the identification of the navigator’s safety profile were determined from previously recorded AIS data. Due to a large amount of data and their complex relationships, these authors have proposed to use data mining tools. This work continues previous research on this subject. The conducted analysis covered data recorded in simulation tests done by navigators. Typical ship encounter situations were included. Based on additional simulation data, the patterns of behavior were verified for the determination of a navigator’s safety profile. An example of using the presented method is given.

1. Introduction

All modes of transport should assure safe and cost-effective transport of cargo and passengers. Actions taken to perform this function are aimed at preventing accidents and minimization of transport costs.

1.1. Safety of Navigation

An important direction of measures aimed at raising the safety of cargo and passenger transport is reducing human errors, the major cause of accidents. This also refers to sea transport, where the human error is claimed to be the main cause or one of the causes of nearly 80% of accidents at sea.
Human errors can be limited by: 1. the improvement of navigators’ education process; 2. identification of mental and physical characteristics of navigators and their impact on collision risk and 3. innovation and invention of new navigational devices and systems raising the situational awareness of the decision maker. In the first case, there is increasingly more training using shiphandling simulators that enable generating any navigational situations in various water areas based on the created ship and area models. Secondly, like in other modes of transport, increasingly more attention is paid to the identification of the psychophysical characteristics of navigators. The impact of these characteristics on navigational safety is subject to scientific investigation, because these characteristics are of particular importance in difficult and complex situations and when the navigator’s workload is excessive. In the third case, attempts are made to increase the situational awareness by obtaining and presenting information that is essential for decision making. This function is performed by various indicators of the present situation, including indicators of the risk of collision, e.g., based on the current value of the closest point of approach (CPA) and time to reaching CPA. In the case of decision support systems, proposals are generated for solving dangerous situations.
Each of the above three types of actions differs in the area and scope of application. The first and third cases have been known and used for a long time. The second one—identification of mental and physical characteristics of navigators and their impact on collision risk—although known before, has been gaining importance. It mainly included classical psychological tests. At present, it tends towards an analysis of real behavior of navigators, based on recorded data. Such analyses are possible owing to modern technologies, information technology in particular.

1.2. Behaviour Profiles

One approach taken in testing the behavior of transport vehicle operators is an analysis of human psychophysical characteristics. The purpose is to determine the relationship between the operator and job performance, probability of his/her error and associated impact on accident risk. These tests are usually part of an examination procedure leading to the confirmation of the ability to operate a specific transport vehicle. For example, in [1] airplane pilots were distinguished by five hazardous attitudes leading to dangerous decisions: anti-authority, impulsivity, invulnerability, macho and resignation.
More and more research is conducted to determine the operator’s profile on the basis of an analysis of his/her real behavior based on data from recorders installed in vehicles. Such tests may be conducted in real conditions and by simulation. For instance, in one study [2] a comprehensive assessment of the truck and its driver performance was carried out. The proposed method of driving style identification was based on recorded changes in the acceleration pedal position. The types of driver behavior were defined as calm, neutral, or active. Similarly, in publications [3,4] the model of driver types identification distinguished mild, aggressive, average drivers on the basis of gas and brake pedal position changes.
Similar tests are conducted in maritime transport. Three groups of navigators, sea pilots, were distinguished in [5] for the purpose of assessing their attitudes towards risk: chancer, eager to take a risk; neutral, conservative and passive, reluctant to take a risk. The identification was conducted on the basis of recorded simulation tests and questionnaire surveys. The factors taken into account included the local area knowledge and navigator’s experience, sea service in the capacity of the captain and the pilot. The probability of making a wrong decision by the navigator is determined by using the developed model of the human factor.
Interesting results of the study are presented in work [6]. Two models of navigator’s behavior were proposed and preliminarily verified: success and failure models for collision avoidance. To this end, simulation tests were conducted for two ships encounter situations. The navigators’ task was to avoid a collision with the other ship. The analysis covered navigators’ maneuvers using the rudder and the propulsion. The account was taken of alterations in the course and ship passing distances. The purpose was to identify navigators’ behavior in collision situations, in particular the errors made, leading to ship collisions. In both cases, data from ship recorders were used. Not all of them are available outside the examined ship, for instance rudder angle or engine setting.

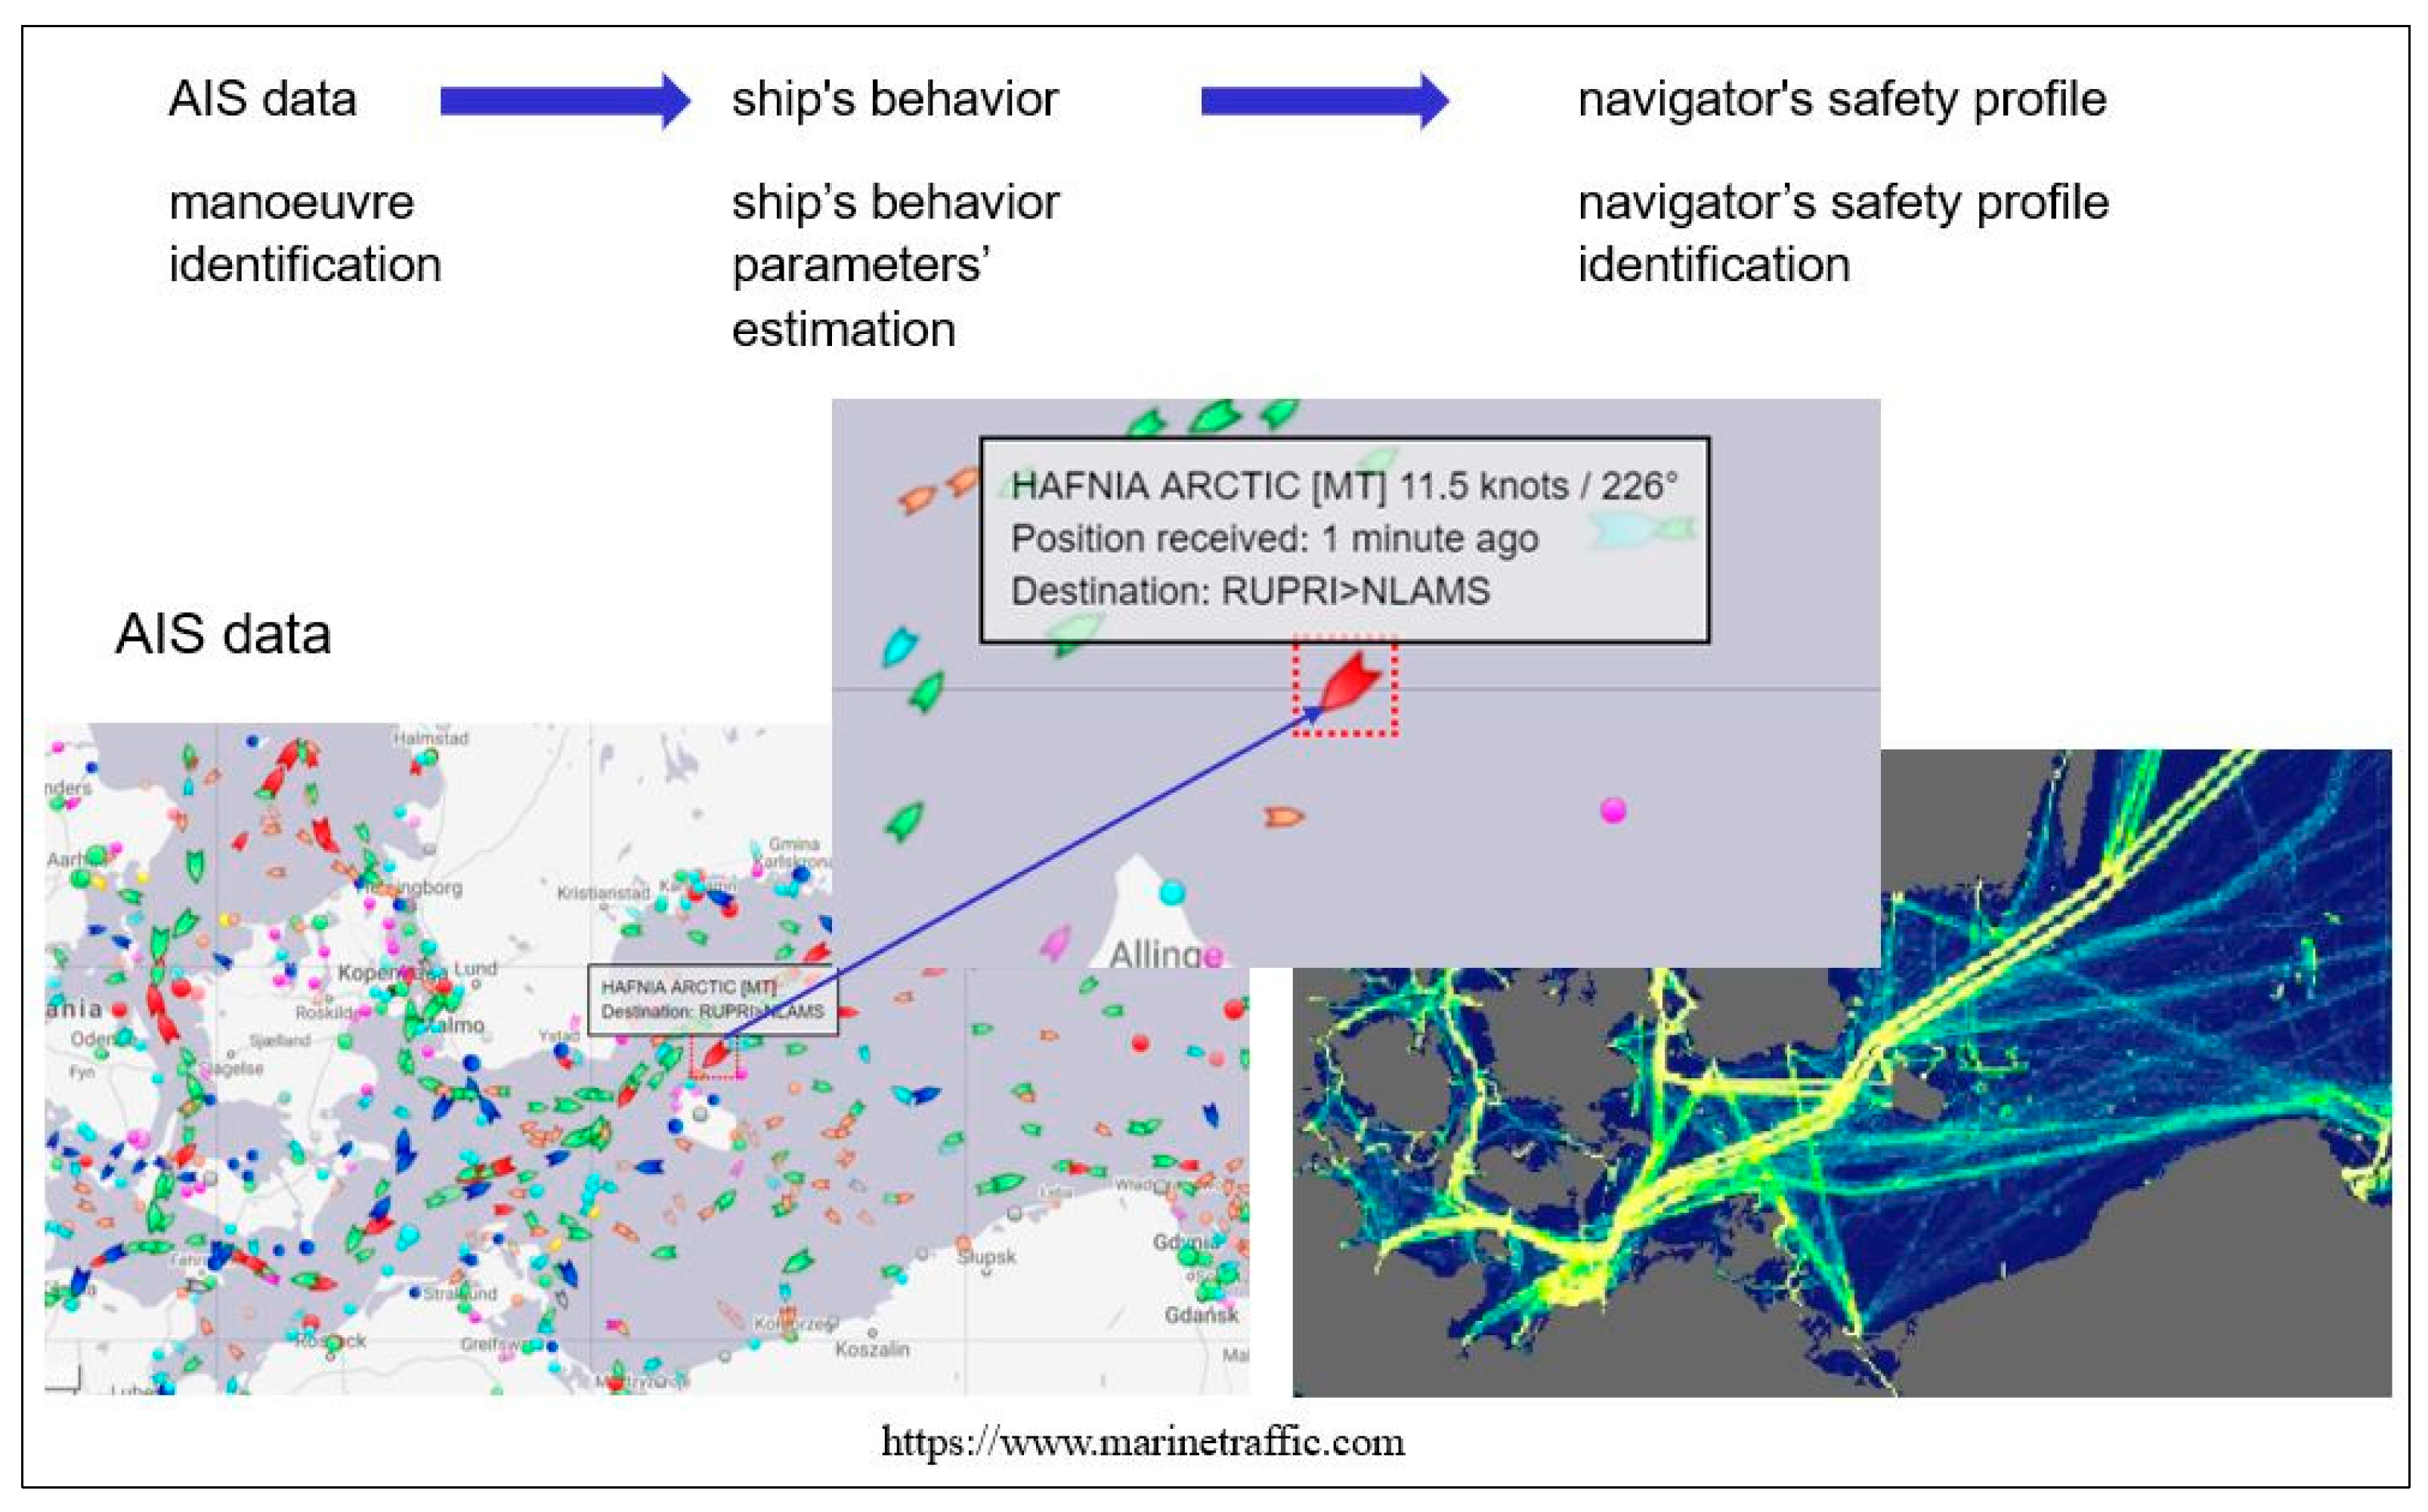
1.3. Navigators’ Safety Profile

Expert tests of navigators’ profiles were made in, e.g., [7,8]. The tests, conducted using questionnaires, were done by employed professionals. Their task was to determine the types of navigators’ behavior at sea. Altogether, 13 types of behavior were distinguished, the most frequent were: professional (15.3%), decisive (15.3%), risk-takers (14%), careful (13.9%) and very careful (11.1%). The navigators were also asked to declare, in their opinions, safe passing distances of ships in an encounter situation. A relation was observed between navigator-declared profiles and passing distances of ships on opposite courses these navigators found safe. It was assumed that the passing distance reached was only one of the criteria describing the navigator’s safety profile. The navigator’s safety profile identification may be a valuable hint for posting a sharp lookout directed on ships that may be a potential risk. For this to be possible, the data from which the navigator’s profile is identified should be available outside the examined ship. An example of this is data available in the automatic identification system (AIS) system. This was a prerequisite for starting research into the possibility of identifying the navigator’s safety profile of both own and other ships on the basis of recorded AIS data [9]. The general concept of navigator’s profile identification is shown in Figure 1.
In the tests, real data from AIS were replaced by data obtained through tests conducted on an Electronic Chart Display and Information System (ECDIS) simulator at the Maritime University of Szczecin. Examined situations were encounters of ships on opposite courses. Two general profiles are distinguished: hazardous (risk-taker) and safe (professional, decisive, careful and very careful). The method of navigator’s safety profile identification is presented using data mining tools. Preliminary test results confirm the possibility of identifying the navigator’s safety profile on the basis of AIS data. The need is indicated to expand the methods and tools of navigator’s profile identification and to include various encounter scenarios in the tests.
The main aim of the work is to develop methods for navigator’s safety profile identification using available AIS data. For this purpose different data mining methods and tools including data pre-processing are investigated and their effectiveness is discussed, the main contributions of this study.

2. Materials and Methods

The navigator’s profile identification process consisted of two stages (Figure 2). In the first stage, simulation tests of navigators’ behavior in collision situations were conducted (AIS data). That stage consisted of preliminary processing and visualization of recorded data, used for assessment of ships’ behavior by experts. The data thus obtained were used in the second stage of creating a model (classifier) of the navigator’s profile identification. Statistical and artificial intelligence methods were used for integration, fusion and aggregation of data, pre-processing and identification and validation of the model.

2.1. Simulation Research—Stage I

The method of simulation tests conducted using an ECDIS simulator allowed us to implement selected, previously prepared scenarios of ship encounters. The ECDIS simulator used consisted of eight independent stations (ships), NaviTrainer 4000 from TRANSAS, cooperating with eight ECDIS NaviSailor 3000i stations.
Participants of the research were 417 certified navigators of different levels attending ECDIS courses (captains, chief officers and officers of watch).

2.1.1. Scenarios

The simulator installed at Szczecin Maritime University enables executing practically every scenario in selected areas and offers several ship models. Each model is capable of fully using shipboard devices. Area visualization allows performing visual observation (lookout), and the navigator may choose to use any system found on the modern navigational bridge. The vessels are non-autonomous real time models, with full-range course and speed maneuverability.
The test station consists of an ECDIS simulator and a recorder of data from the AIS. The device allows recording standard data transmitted by ships’ AIS systems at one second frequency. The research was conducted in the following configuration:
(1)
Seven stations are manned by training course participants, each with full access to shipboard equipment (radar, ARPA, AIS and ECDIS) and visualization, with the ability to alter ship’s course and/or speed.
(2)
The other (target) ship is programmed to move without course or speed changes, regardless of its status as give-up or stand-on vessel;
(3)
At the start of the exercise, registration begins of data from the AIS systems of the seven independent own ships and the target ship.
Three encounter situations and three models of vessels were selected for the tests. For these, scenarios were created and saved, allowing multiple reproduction of the initial situation from which each navigator could perform at his/her discretion. The following encounters were selected as the most representative events:
(1)
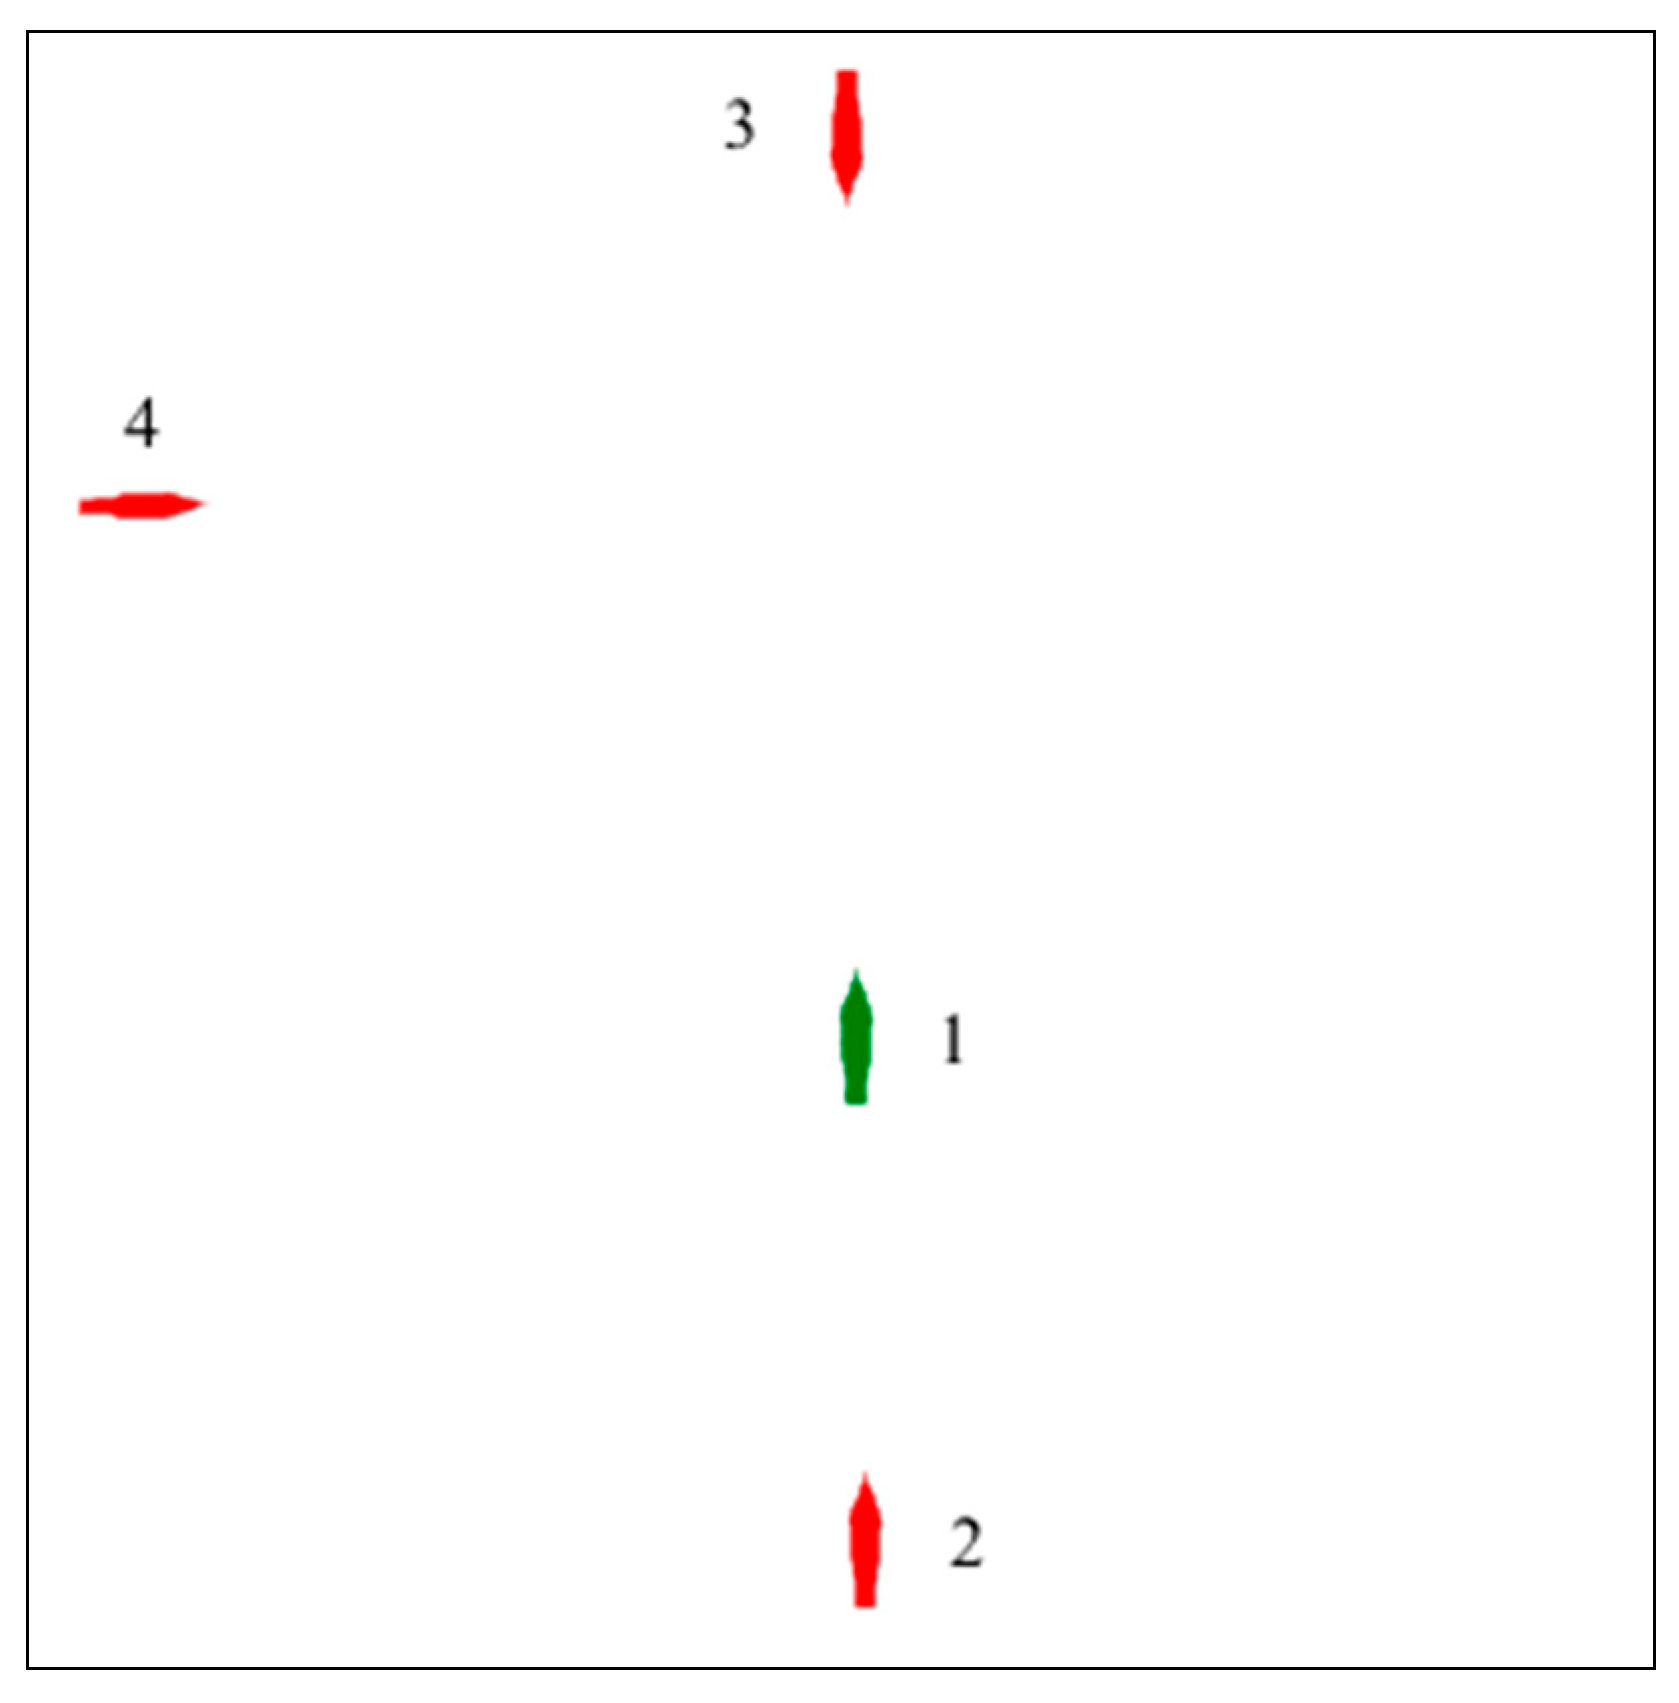
Encounter of two ships, initial course 180°—“Overtaking”, maneuvering ship does not have the right of way (Figure 3, ship 2);
(2)
Encounter of two ships, initial course 000°, “Head-on” situation, maneuvering ship does not have the right of way, both ships should perform a maneuver (Figure 3, ship 3);
(3)
Encounter of two ships, initial course 045°—“Crossing”, maneuvering ship does not have the right of way (Figure 3, ship 4).
The initial positions of ships in the conducted scenarios are shown in Figure 3.
Legend:
(1)
Non-maneuvering ship on a preset course;
(2)
Maneuvering ship in the scenario “Overtaking”;
(3)
Maneuvering ship in the scenario “Head-on”;
(4)
Maneuvering ship in the scenario “Crossing”.

2.1.2. Data Collection

Each of the scenarios was tested five times, which gave 30–35 individual passages (six or seven participants in each) of ships maneuvering in each scenario. Altogether, 75 scenario executions and 464 individual passages performed by 417 participants were recorded.
Three models of ships of different sizes were used, further referred to as large, medium and small (Table 1). The selected models range from the universal and widely used “Coaster” type ship, which dominates short distance sea shipping, through medium-sized general cargo carrier to “Panamax” tanker. In this way, not only the size but also the types of vessels were taken into account. Conducting research on ships of this size, taking into account subsequent interpolation and a small (10–15%) extrapolation will allow us to apply the results to ships from about 80 m to 294 m, which includes the vast majority of ships engaged in international shipping.
The tests were run in two restricted areas—Singapore Strait and Dover Strait, for three speed combinations [10]:
(1)
Equal: all ships ‘full ahead’,
(2)
“High-slow”—maneuvering ship at ‘full ahead’, approximately twice faster than the non-maneuvering ship’s speed,
(3)
‘Slow-high”—maneuvering ship proceeds at a speed approximately twice slower than the non-maneuvering ship going ‘full ahead’.

2.1.3. Data Processing

The first step to the analysis and calculations for all scenarios was to determine the true trajectories of the ships. This was helpful in a preliminary visual assessment of the data. The real trajectories in one scenario 045° are depicted in Figure 4, where red and blue arrows show movement directions for non-maneuvering and maneuvering ships respectively.

2.2. Data Mining—Stage II

2.2.1. Data Mining Methods and Tools

Data mining is a process of discovering patterns in large data sets [11,12,13]. It consists of a number of techniques, from statistical methods through algorithms of machine learning to databases. Data mining also includes issues related to a preliminary data analysis (data pre-processing), creation of models, inference and data visualization. Unlike a typical analysis of data aimed at testing models and hypotheses, data mining uses algorithms of machine learning and statistical models for revealing new knowledge and discovering hidden patterns in large data sets. Data mining is intended for examining a data set to indicate groups of records (cluster analysis), anomalies (outliers) and data correlations. These tasks are usually difficult or impossible to be performed by traditional techniques [14].
Data mining uses a number of methods, techniques and tools. Some of these are traditional mathematical methods, including statistical ones (mean, standard deviation, etc.), data visualization techniques (diagrams), artificial intelligence tools: neural networks, machine learning, evolutionary methods, fuzzy logic and approximate sets [15]. These data mining methods and tools are presented in the specialist literature and implemented in a number of computer applications, e.g., [16,17].

2.2.2. The Navigator Profile Identification Method

The data used for the analysis of navigator profile included the following parameters: geographical position (latitude and longitude), speed and course over ground, rate of turn and time of measurement recording. Each of the simulated navigational situations was additionally described: maneuver to port, number of return maneuvers, etc. (first step).
In the second step, new data were created and calculated from values of attributes existing in the data set. During this step, distance to the target was calculated at the start of the maneuver (relative and absolute), visibility of maneuver, time of maneuver start, duration and end, values of heading alterations, changes in rate of turn, relative and absolute speeds of encountering ships, minimum passing distance, etc. All parameters were recorded in the database, constituting a set of attributes used further in data mining.
One problem in creating a model for classifying explored data is the choice of the best set of attributes describing the objects involved. It cannot be assumed that all characteristics will enable the creation of an effective classifier. The selection of attributes can be made by various algorithms, e.g., [16,17,18,19]:
(1)
Evolutionary weights optimization—this operator calculates the weights of the attributes of the given example set by using a genetic algorithm. The higher the weight of an attribute, the more relevant it is considered;
(2)
Backward weight optimization—assumes that features are independent and optimizes the weights of the attributes with a linear search. It involves starting with all candidate variables, testing the deletion of each variable using a chosen model fit criterion, deleting the variable (if any) whose loss gives the most statistically insignificant deterioration of the model fit, and repeating this process until no further variables can be deleted without a statistically significant loss of fit;
(3)
PSO weight optimization (Particle Swarm Optimization)—uses a particle swarm optimization approach. PSO algorithm works by having a population (called a swarm) of candidate solutions (called particles). These particles are moved around in the search-space according to a few simple formulae.
Besides, for the creation of the heuristic rules, attributes were selected manually, following the opinions of expert navigators.
Another, fourth step was the choice of the profile identification model. Of a number of data mining methods for the identification of navigator’s profile, the examined classifiers included the decision tree, neural network, heuristic algorithm (rules) and a model identifying outliers. The mentioned models (excluding the outliers) were validated, which consisted in dividing the data set into training and testing subsets and multiple tests of the model.
The second part of the data mining experiment consisted of these steps:
(1)
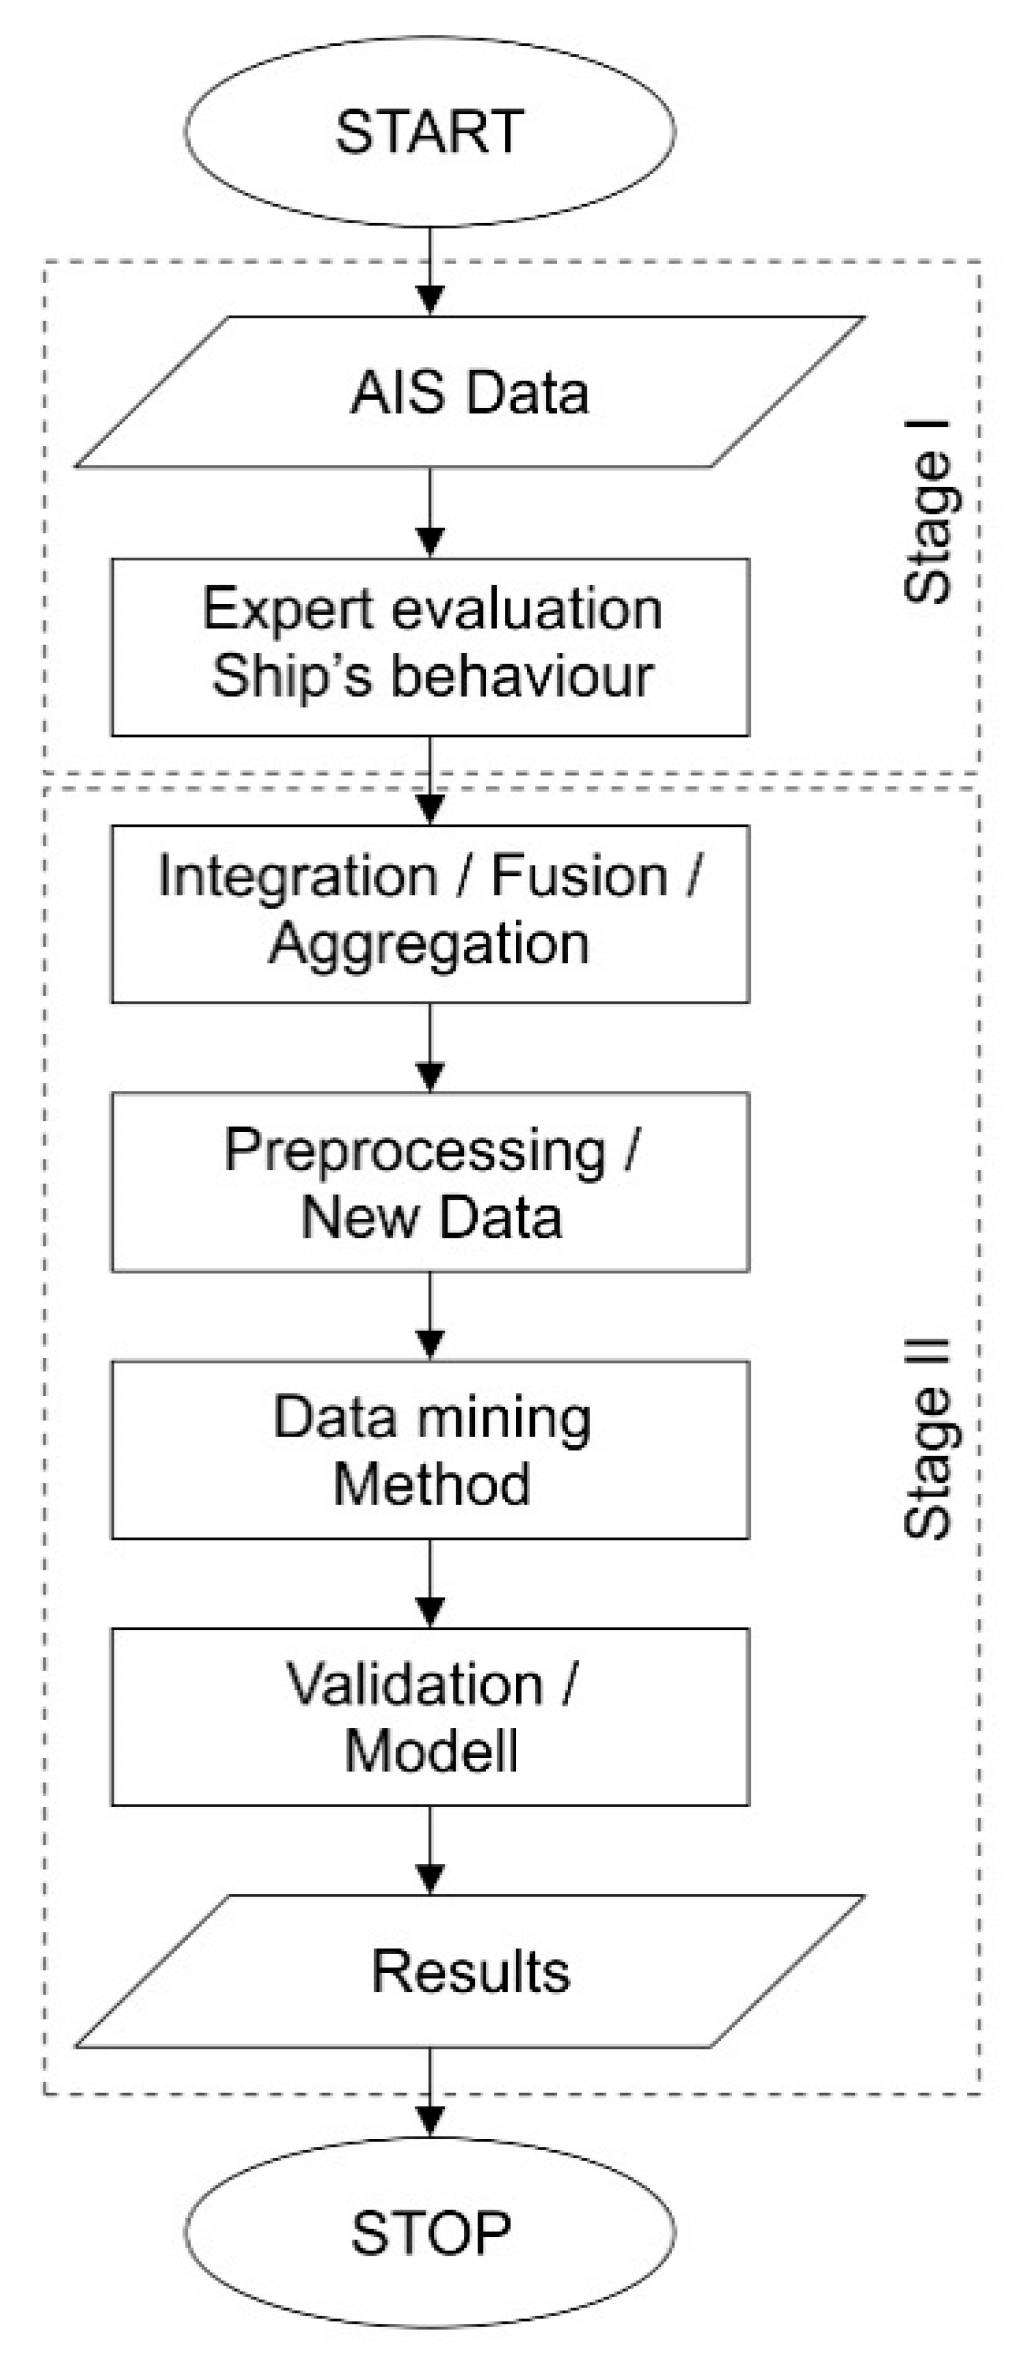
Integration/Fusion/Aggregation—reduction of ‘raw’ AIS data (simulator) to single records of data corresponding to one passage; aggregation of the obtained data with expert’s evaluation.
(2)
Pre-processing/New Data—data cleansing, verification of data correctness, determining special attributes, modification of the types (domains) and creating new attributes from existing data. Preparation of the data in view of the data mining method chosen in the next step (e.g., domain of the attributes and division of the data set into subsets).
(3)
Data mining method choice; validation of the created model.
(4)
Presentation of the results of the classifier performance.

3. Results

3.1. Simulation Results

The way the maneuvers had been performed was analyzed in view of implemented ship encounter scenarios. Diversified actions were observed, from very conservative (careful) to extremely risky. It was noted that most navigators perform maneuvers in compliance with the Collision Regulations, although there were cases of non-compliant maneuvers where the right of way was not given and passing distances were small.
The analysis of collision avoiding maneuvers was based on such criteria as:
(1)
Time of starting the maneuver;
(2)
Distance at maneuver start;
(3)
Value of course alteration;
(4)
If the maneuver was correct (to port or starboard);
(5)
Number of course maneuvers to pass the other ship;
(6)
Number of course maneuvers to return to original course;
(7)
Number of speed maneuvers;
(8)
If course and speed maneuvers were performed.
Due to the various ship sizes and speeds used in tests, these parameters were not compared directly; some quantities (distances) were calculated as relative values (relative to the ship’s length), and time of maneuver start, for instance, was related to the relative speed difference of the given scenario.

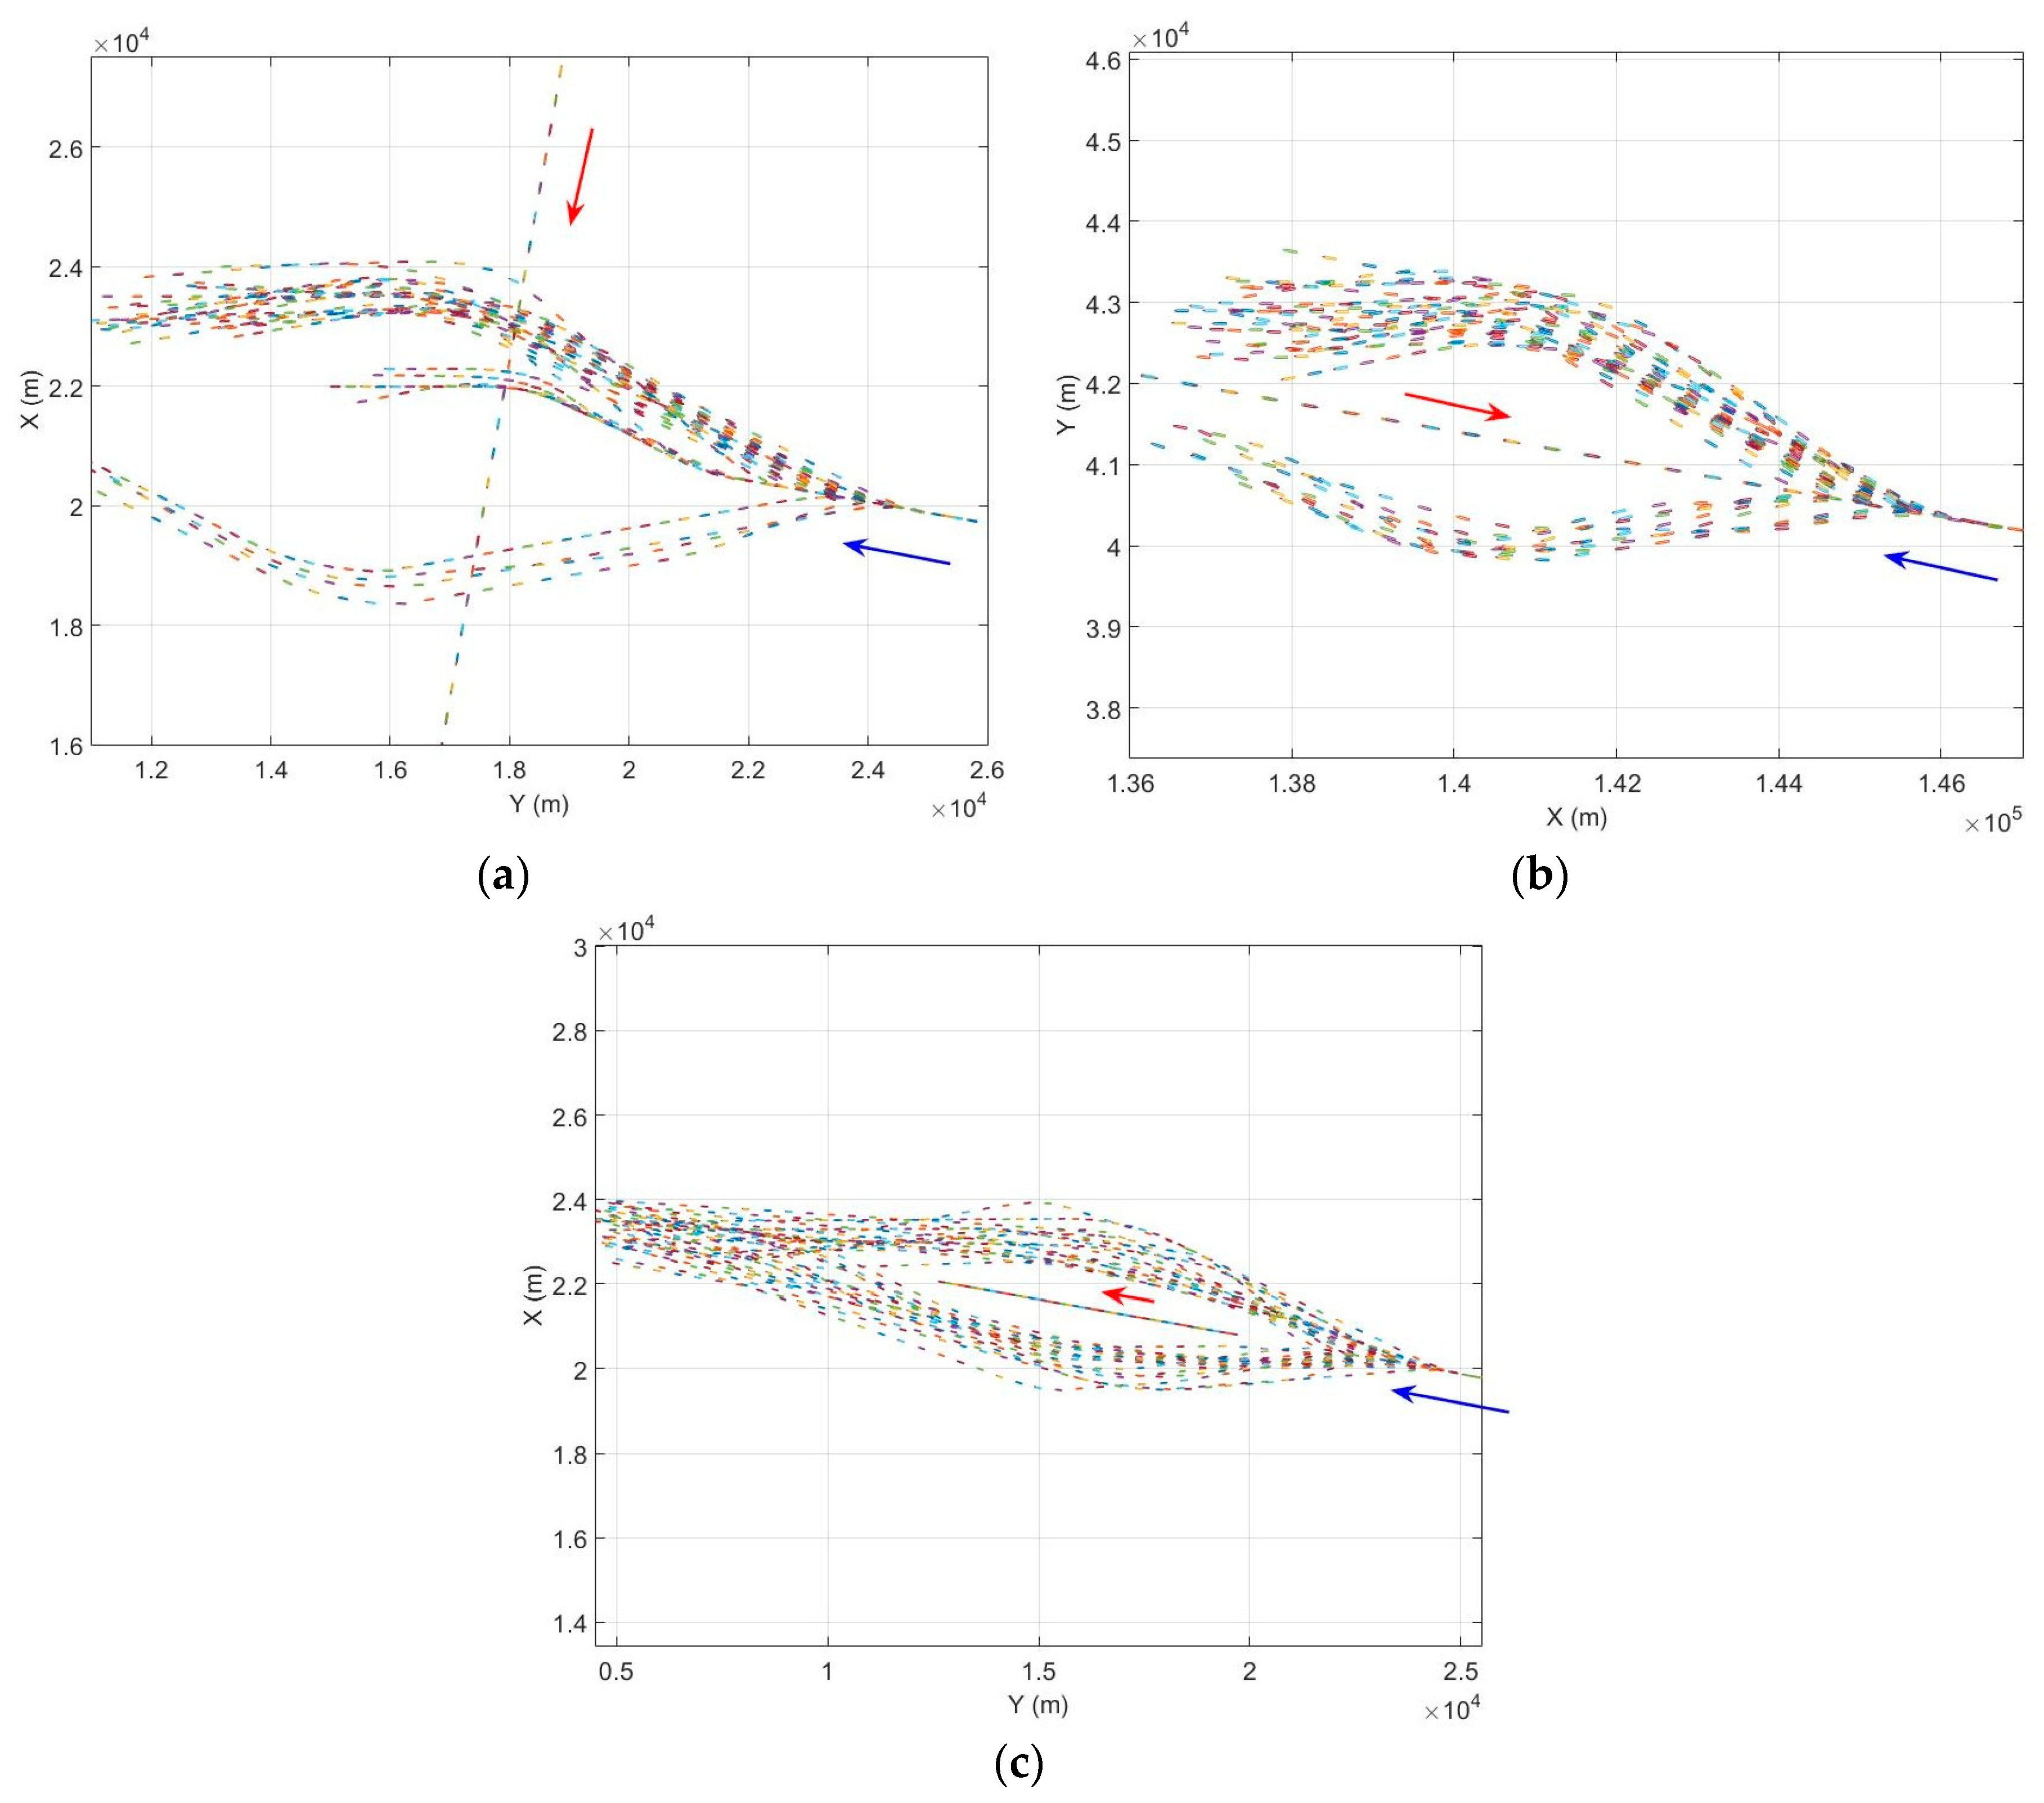
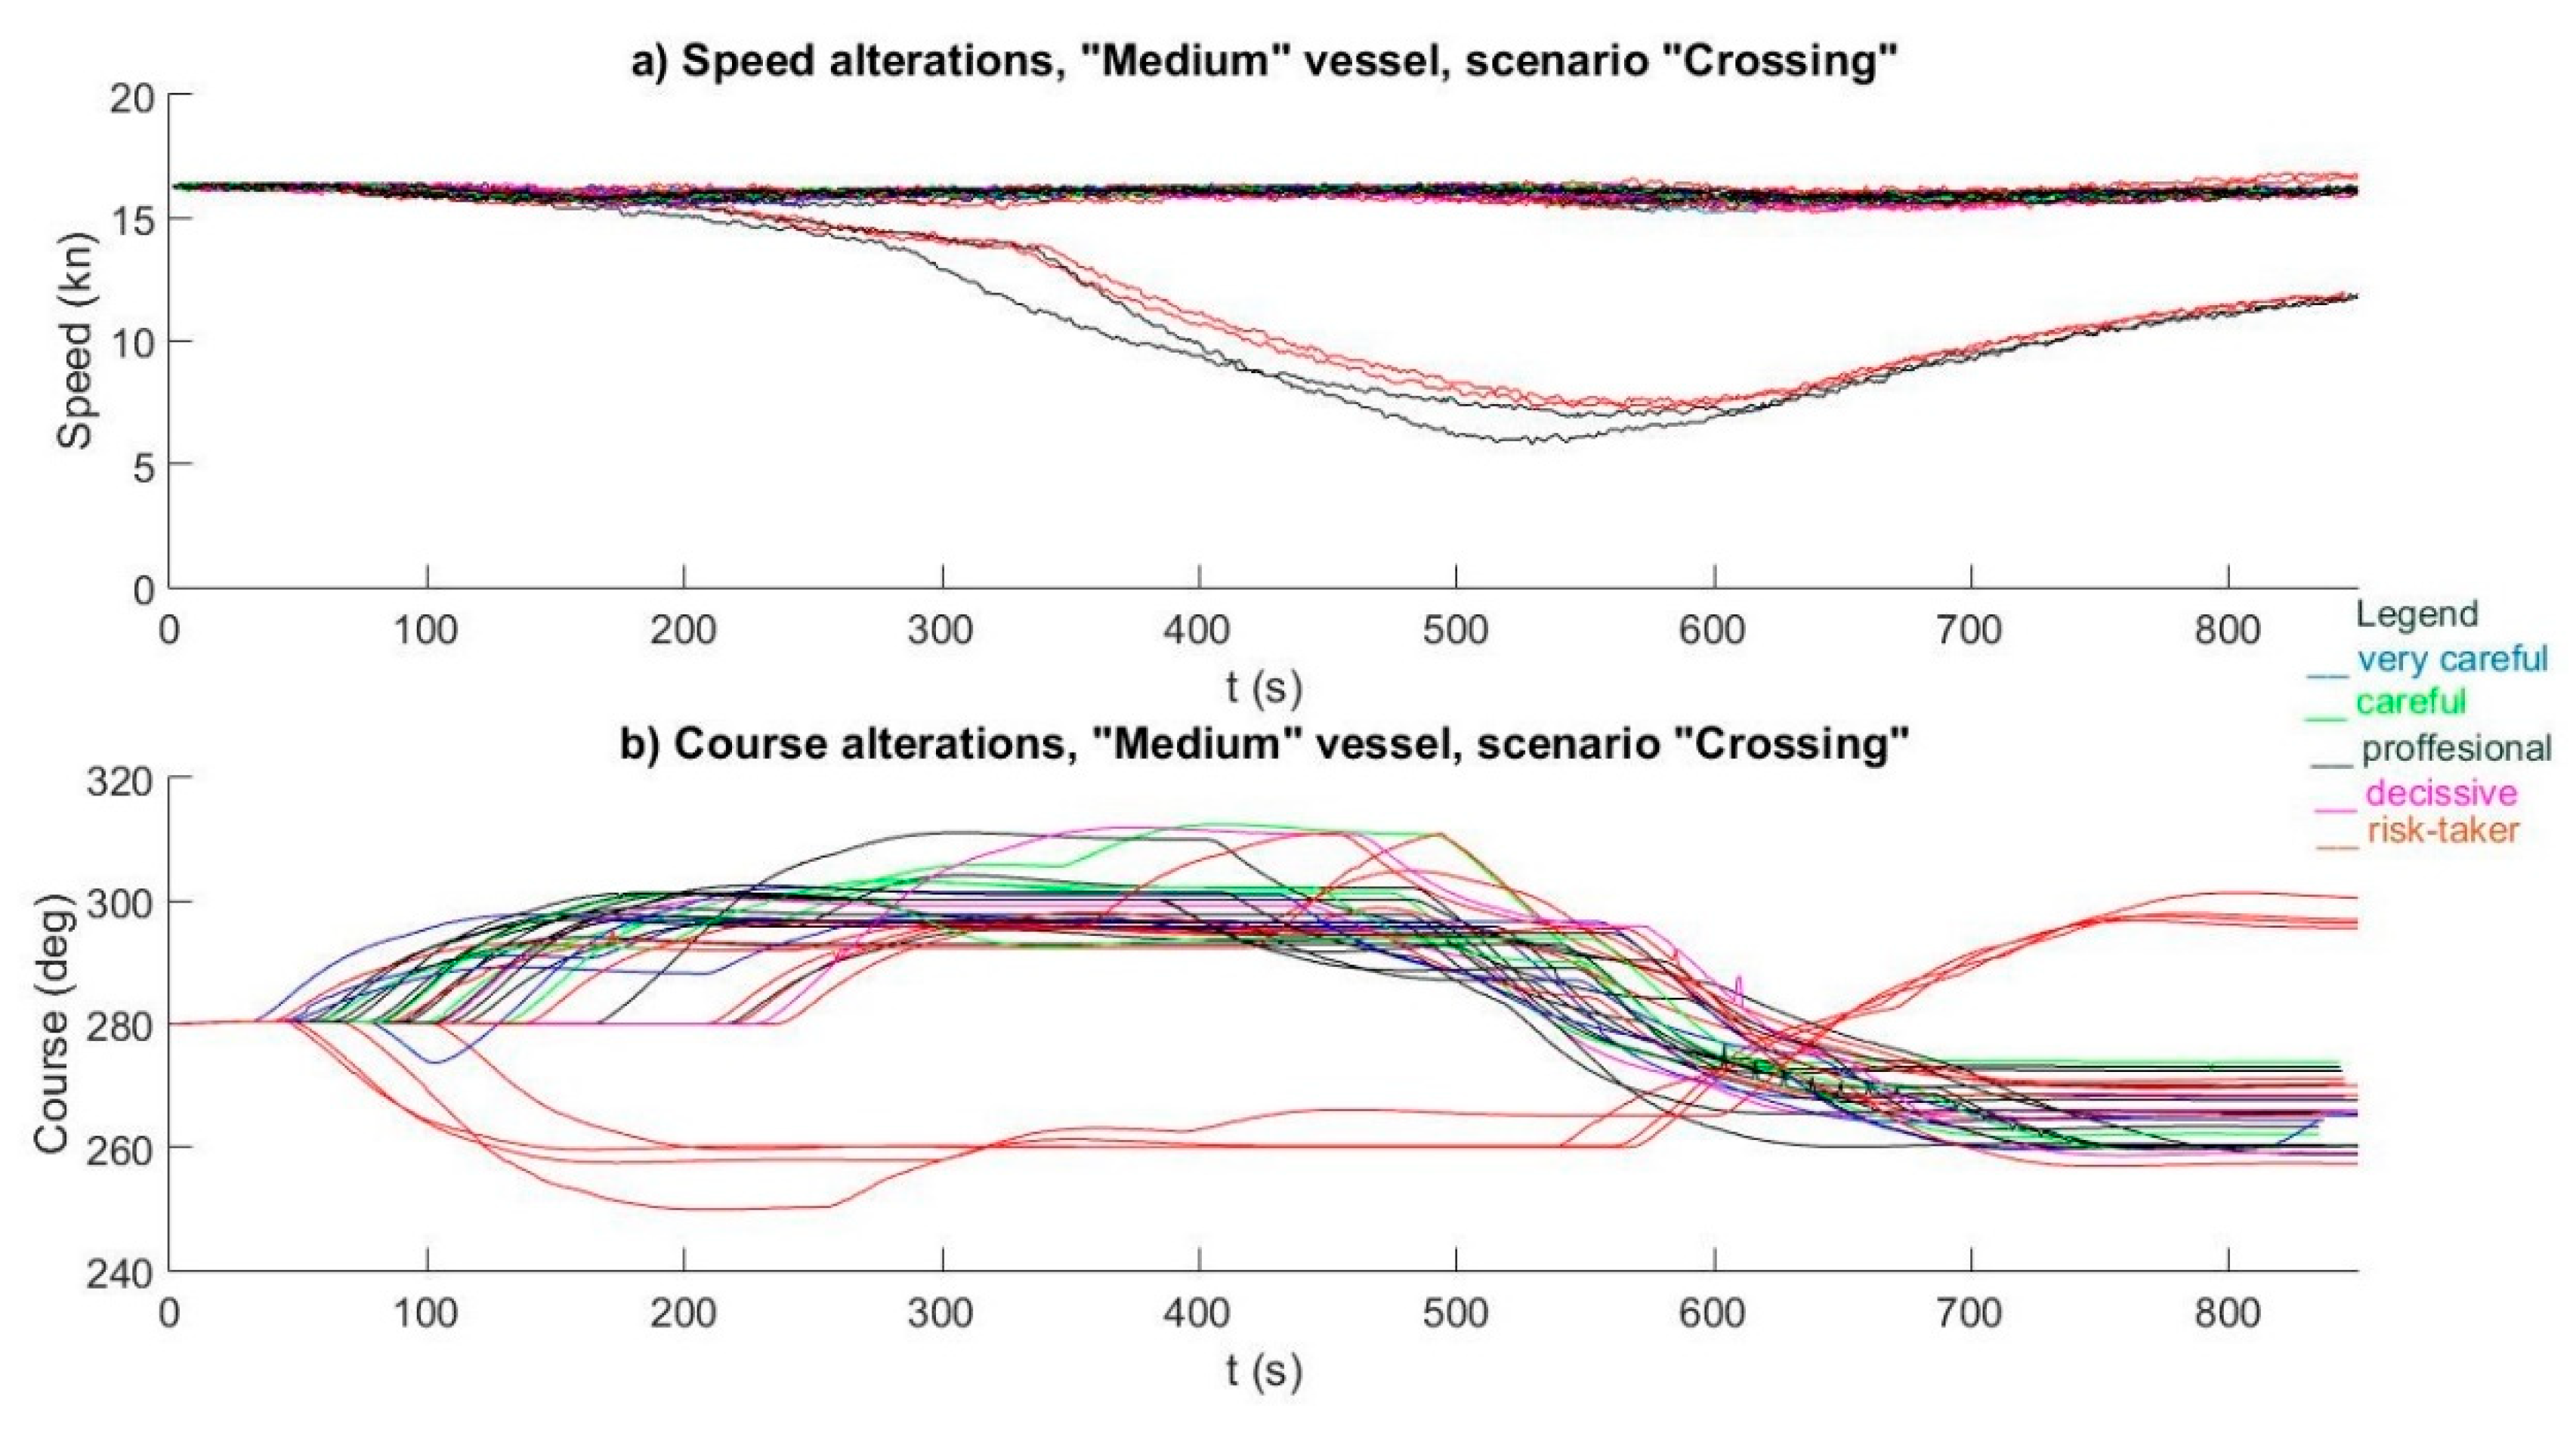
3.1.1. Scenario “Crossing”

Definitely correct actions of the give-way ship navigators were observed, in most cases consisting in course alterations (1–3) or course alteration plus reduction of speed, with a few maneuvers where only speed was reduced (Figure 5). These maneuvers resulted mostly in passing astern of the stand-on vessel. A few maneuvers turning the give-way ship to port plus small increase of speed resulted in passing the stand-on vessel ahead of its bow.

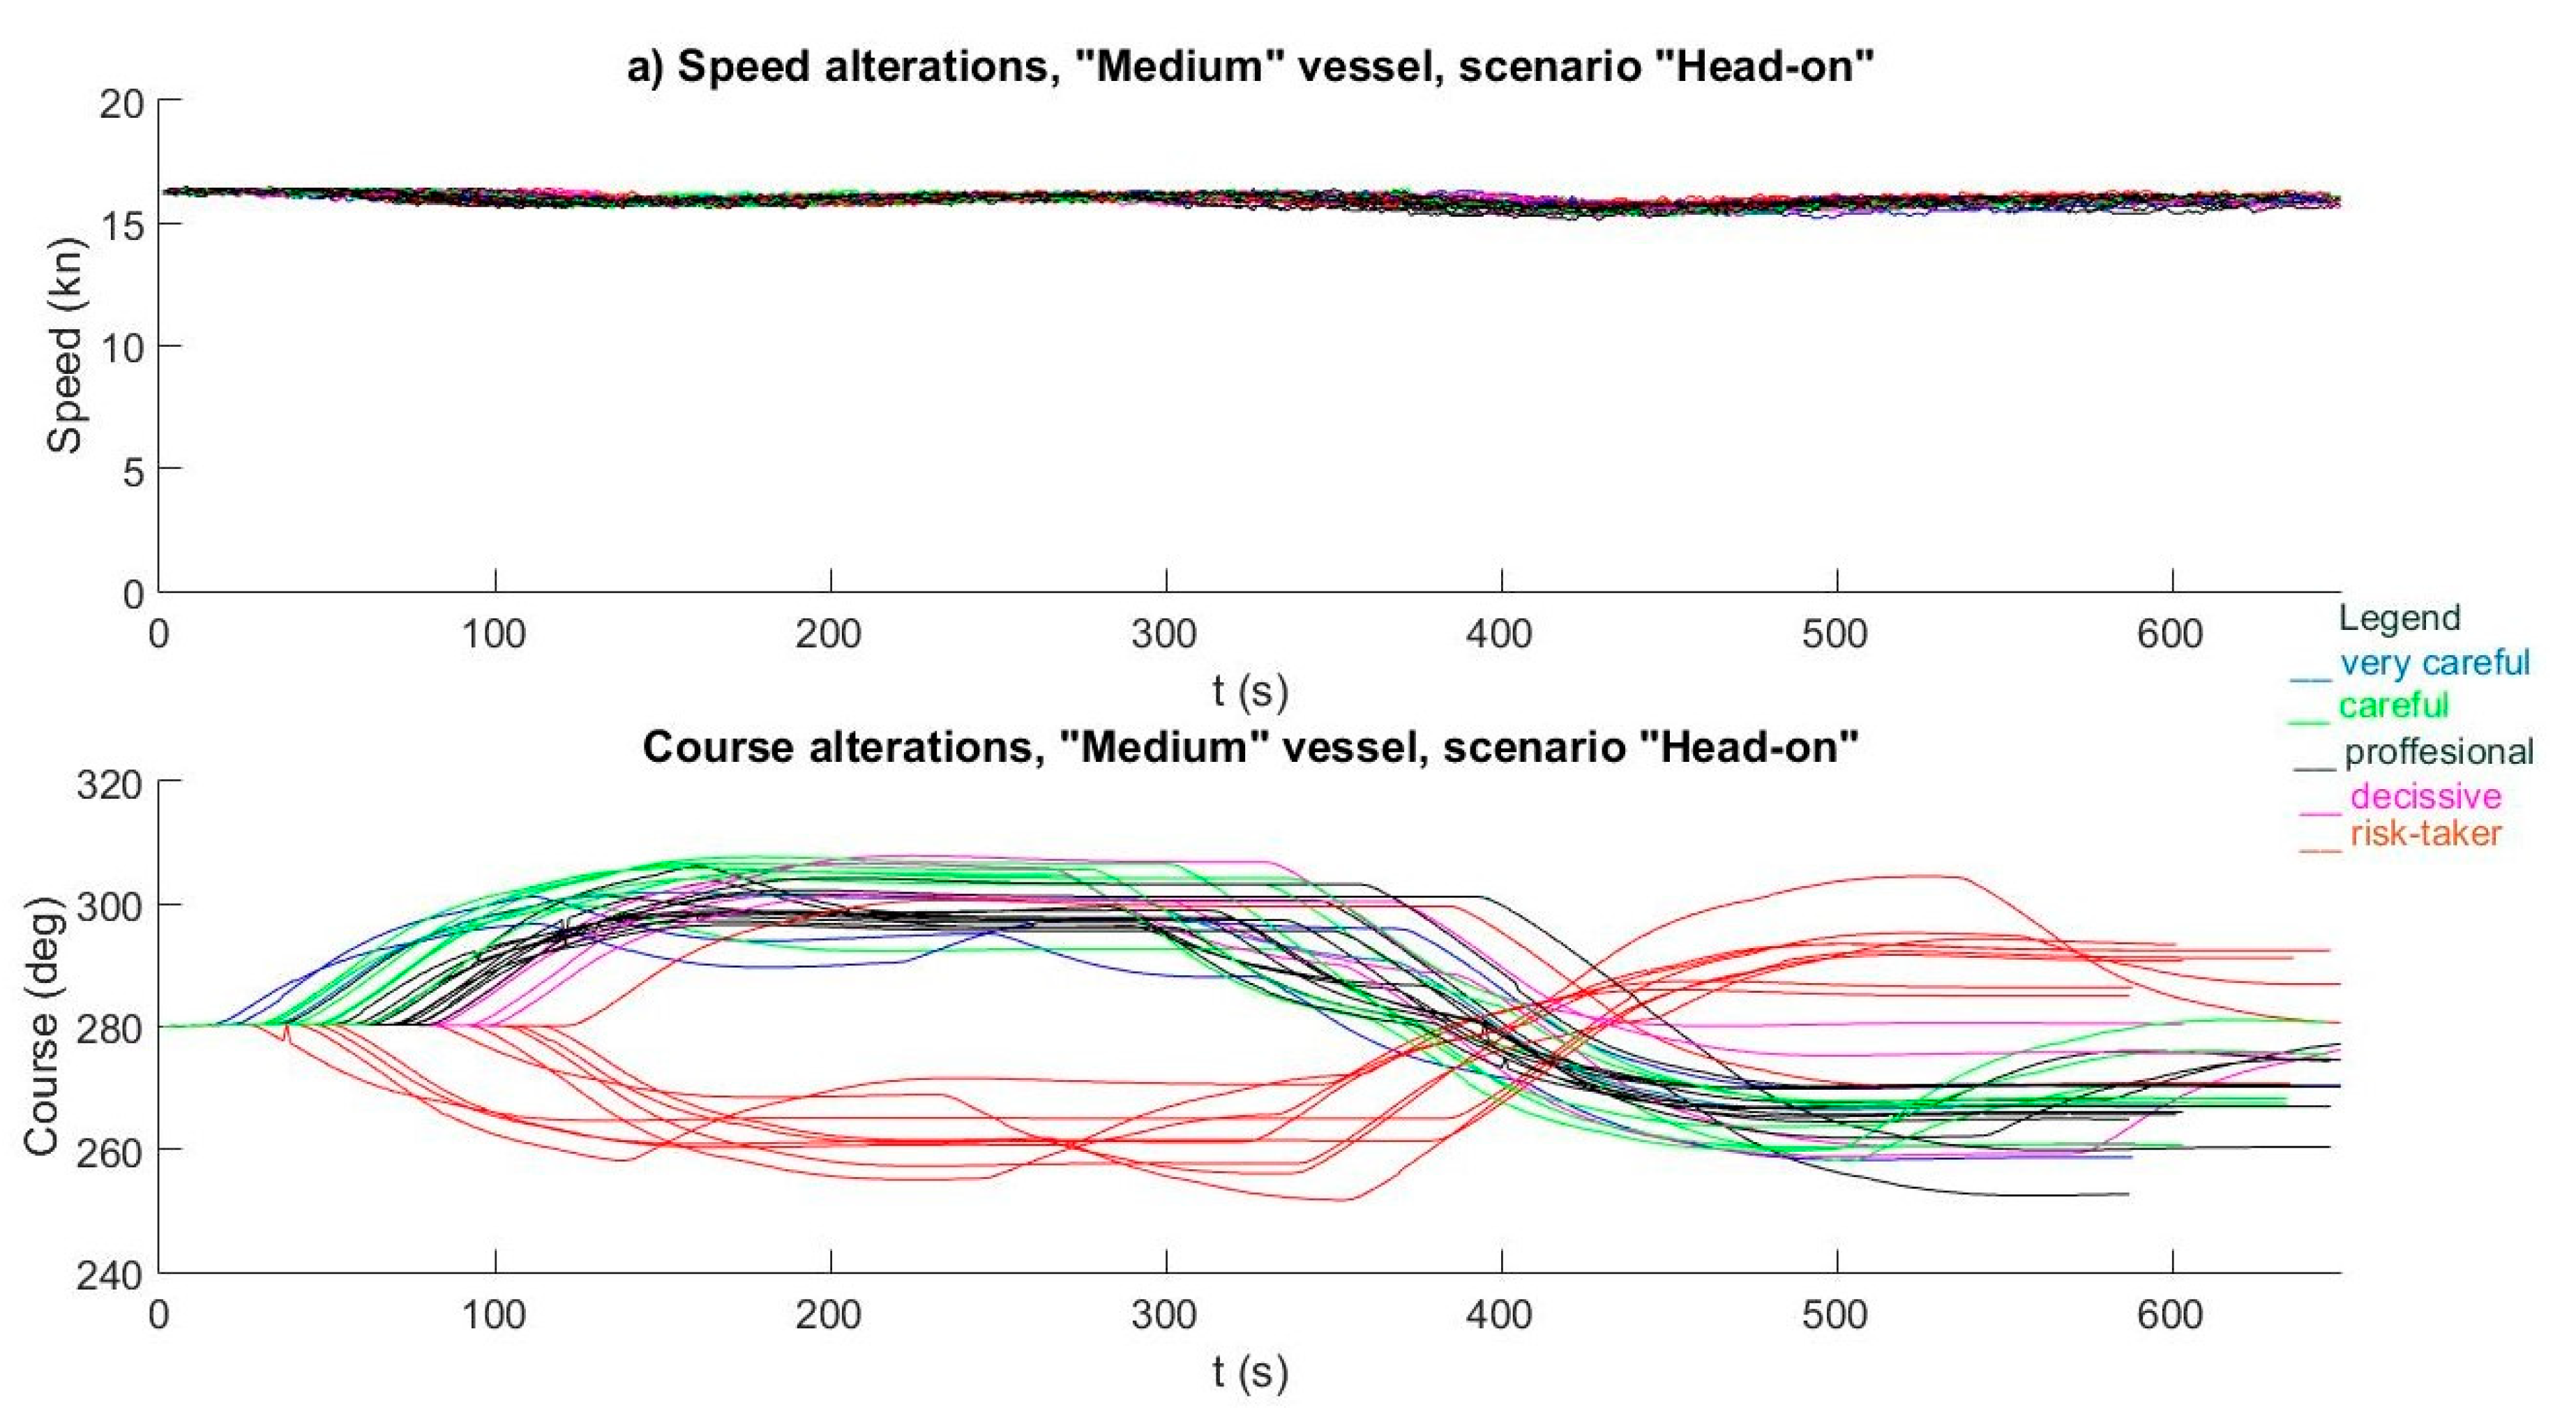
3.1.2. Scenario “Head-on”

To pass the other ship in a head-on situation the great majority of navigators, as required by the COLREGs, decided to alter course to starboard, in most cases one alteration ranging 10–20°, steadying the ship on the opposite course (parallel) and after passing, returning to the original course by two to four maneuvers (Figure 6).
However, more than 30% of the maneuvers to port were of varying degree of safety, but against the regulations. No speed maneuvers were observed.

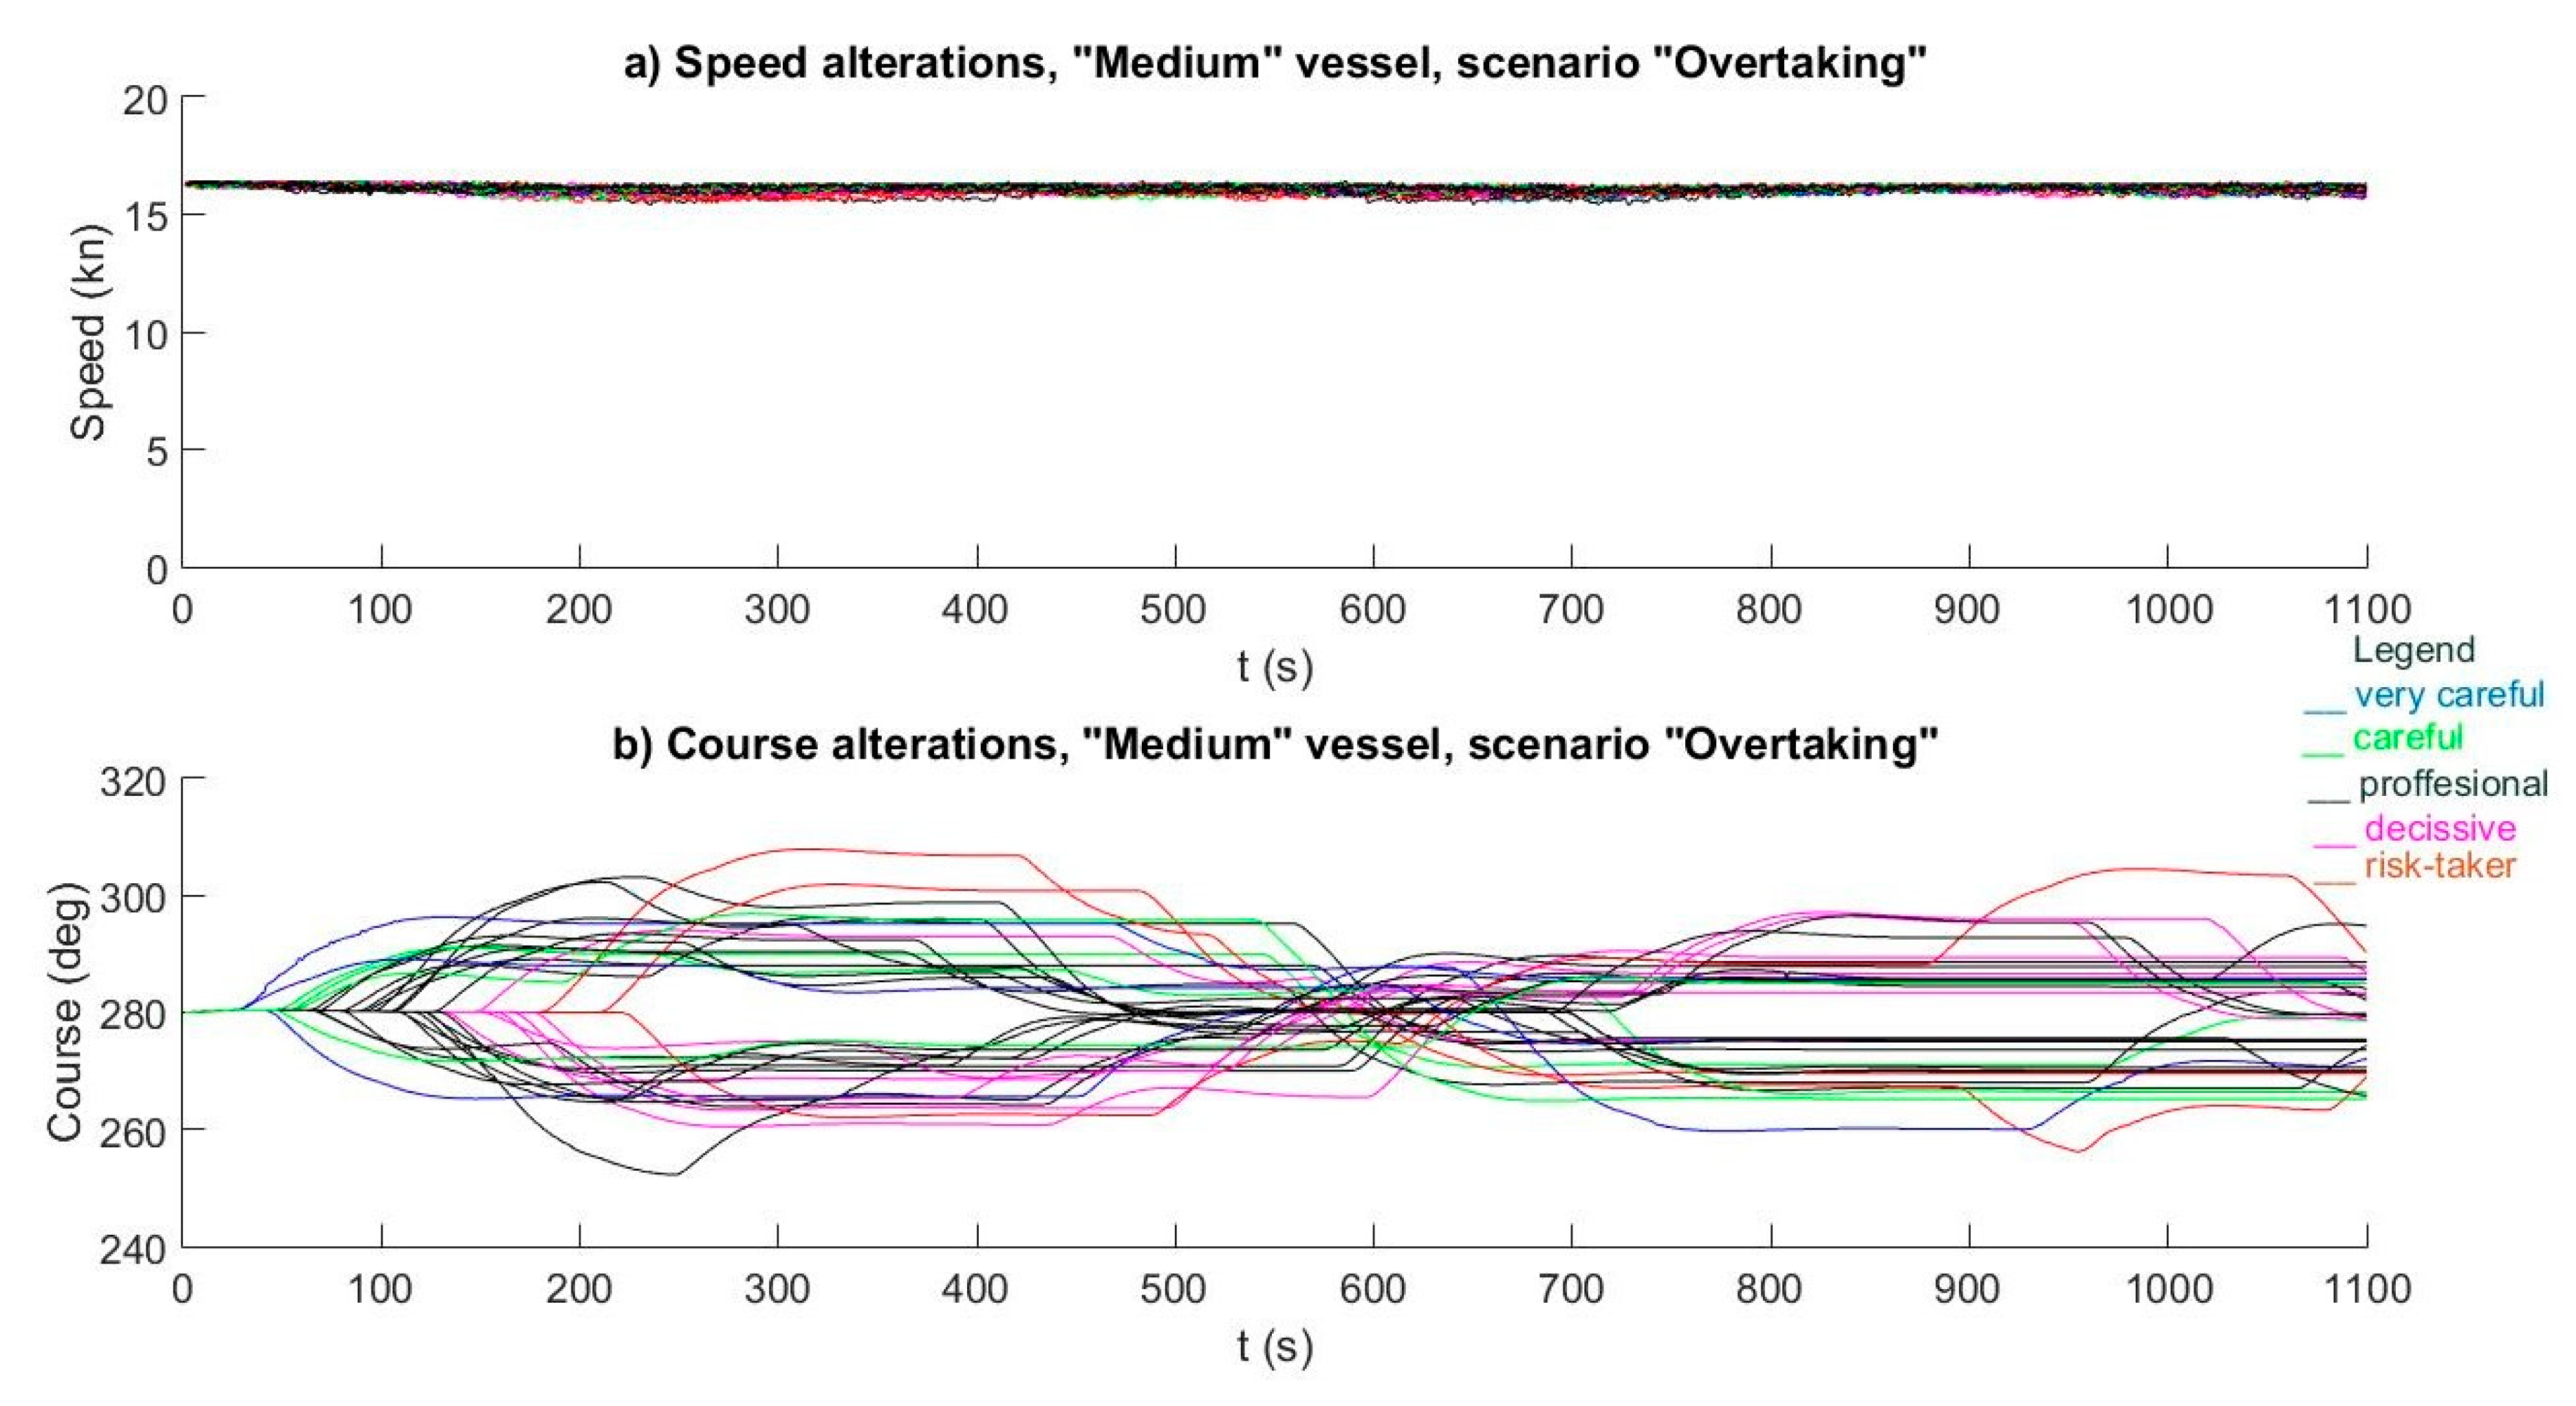
3.1.3. Scenario “Overtaking”

Overtaking maneuvers were executed on either side of the ship being overtaken. All the actions were correct. The moment of starting the maneuver was varied, and most of the test participants performed two course maneuvers till the other ship was overtaken (Figure 7). No speed maneuvers were observed (low speed changes visible in the charts are the side effect of a large and intensive course alteration).

3.2. Data Mining Results

The data mining tool used for navigator’s profile identification was RapidMiner software. This application is a data science software platform that provides an integrated environment for data preparation, machine learning and predictive analytics. It is widely used for business and commercial applications. Many research, education and rapid prototyping are also known. RapidMiner supports all steps of the machine learning process including data preparation, results visualization, model validation and optimization [19].
After initial assessment of maneuvers performed by navigators—expert estimation, (see Section 2.1.1, Section 2.1.2 and Section 2.1.3)—further experiments were conducted, aimed at creating and comparing the models for automatic assessment of navigator’s profile. To this end, processes were constructed, each of which used another method of model generation and assessment. Data supplied to the models were combined AIS data and expert’s evaluation. Then the models classified examples (training data/testing data) and were validated and assessed. Two different classifiers were applied as models: decision trees and neural networks. Changes in parameters for decision trees referred to the maximum depth of the tree, criterion of set division (information gain, gain ratio, accuracy, etc.), and prepruning and pruning were switched on or switched off (with different confidence ratios). For neural networks changes were made in the number of hidden layers, number of neurons in the layers, number of training cycles. For heuristic rules and the outlier method attributes were selected manually and then classified by the model.
Seventy experiments were conducted for the tested models. The parameters of the models, sets of attributes, method of data division into training and testing were modified. After pre-processing and creation of ‘new data’, optimization methods for data sets were used for selected classification models (choice of the best set of attributes). Sixty tests were conducted for the outlier method, where each time another set of input attributes was tested. The data were described (attributes names) in an abbreviated form as shown in Table 2.
To optimize the attributes (assigning numeric weights and rejecting the least essential) the nominal attributes were converted into numeric ones. The conversion was performed by using the strategy of unique integers, which consists in turning the nominal values to real equidistant numbers. Table 3 presents the resultant optimized sets of attributes by evolutionary algorithms, backward selection and PSO.
The task of the above algorithms was to assign weights to each attribute. The zero weight value for an attribute automatically meant eliminating this attribute from the data set.
The method of navigator’s profile identification herein presented makes use of data classification by the decision tree. In the example considered, the maximum depth of the tree has 10 levels, and both prepruning and pruning were not used. The set of all attributes made up input data to the model. The “Gini index” [20] strategy was taken as a criterion for dividing attributes into classes. An evolutionary algorithm was used for the optimization of the set of attributes. This model generated a decision tree for the identification of the navigator profile. The profile identification consisted in data classification into two decision classes—safe profile (Pro-Dec-Ca-VC) and risk-taker profile (Rt). The outcome of data classification after 10-fold cross validation is presented in Table 4 and Figure 8.
The data set contained 464 records, including 417 records of navigators with the safe profile and 47 navigators with the risk-taker profile identified by expert navigators. The model under consideration correctly classified 97.6% of navigators with the safe profile and 61.7% of the navigators with the risk-taker profile. Altogether, 93.96% navigators were correctly classified. It should be noted that 38.3% of navigators with the risk-taker profile were wrongly identified as having the safe profile. This means the precision of the safe profile classification at 95.76%. On the other hand, 2.4% navigators with the safe profile were falsely classified as risk-takers. In this case, the precision of the risk-taker profile classification was at a level of 74.36%.
While the classification of the safe profile navigator as a risk-taker is acceptable, the opposite-risk-taker classified as a safe navigator is highly undesirable.
All models of navigator profile identification were examined. Table 5 presents the classification results for models of the highest accuracy of navigator profile identification:
(1)
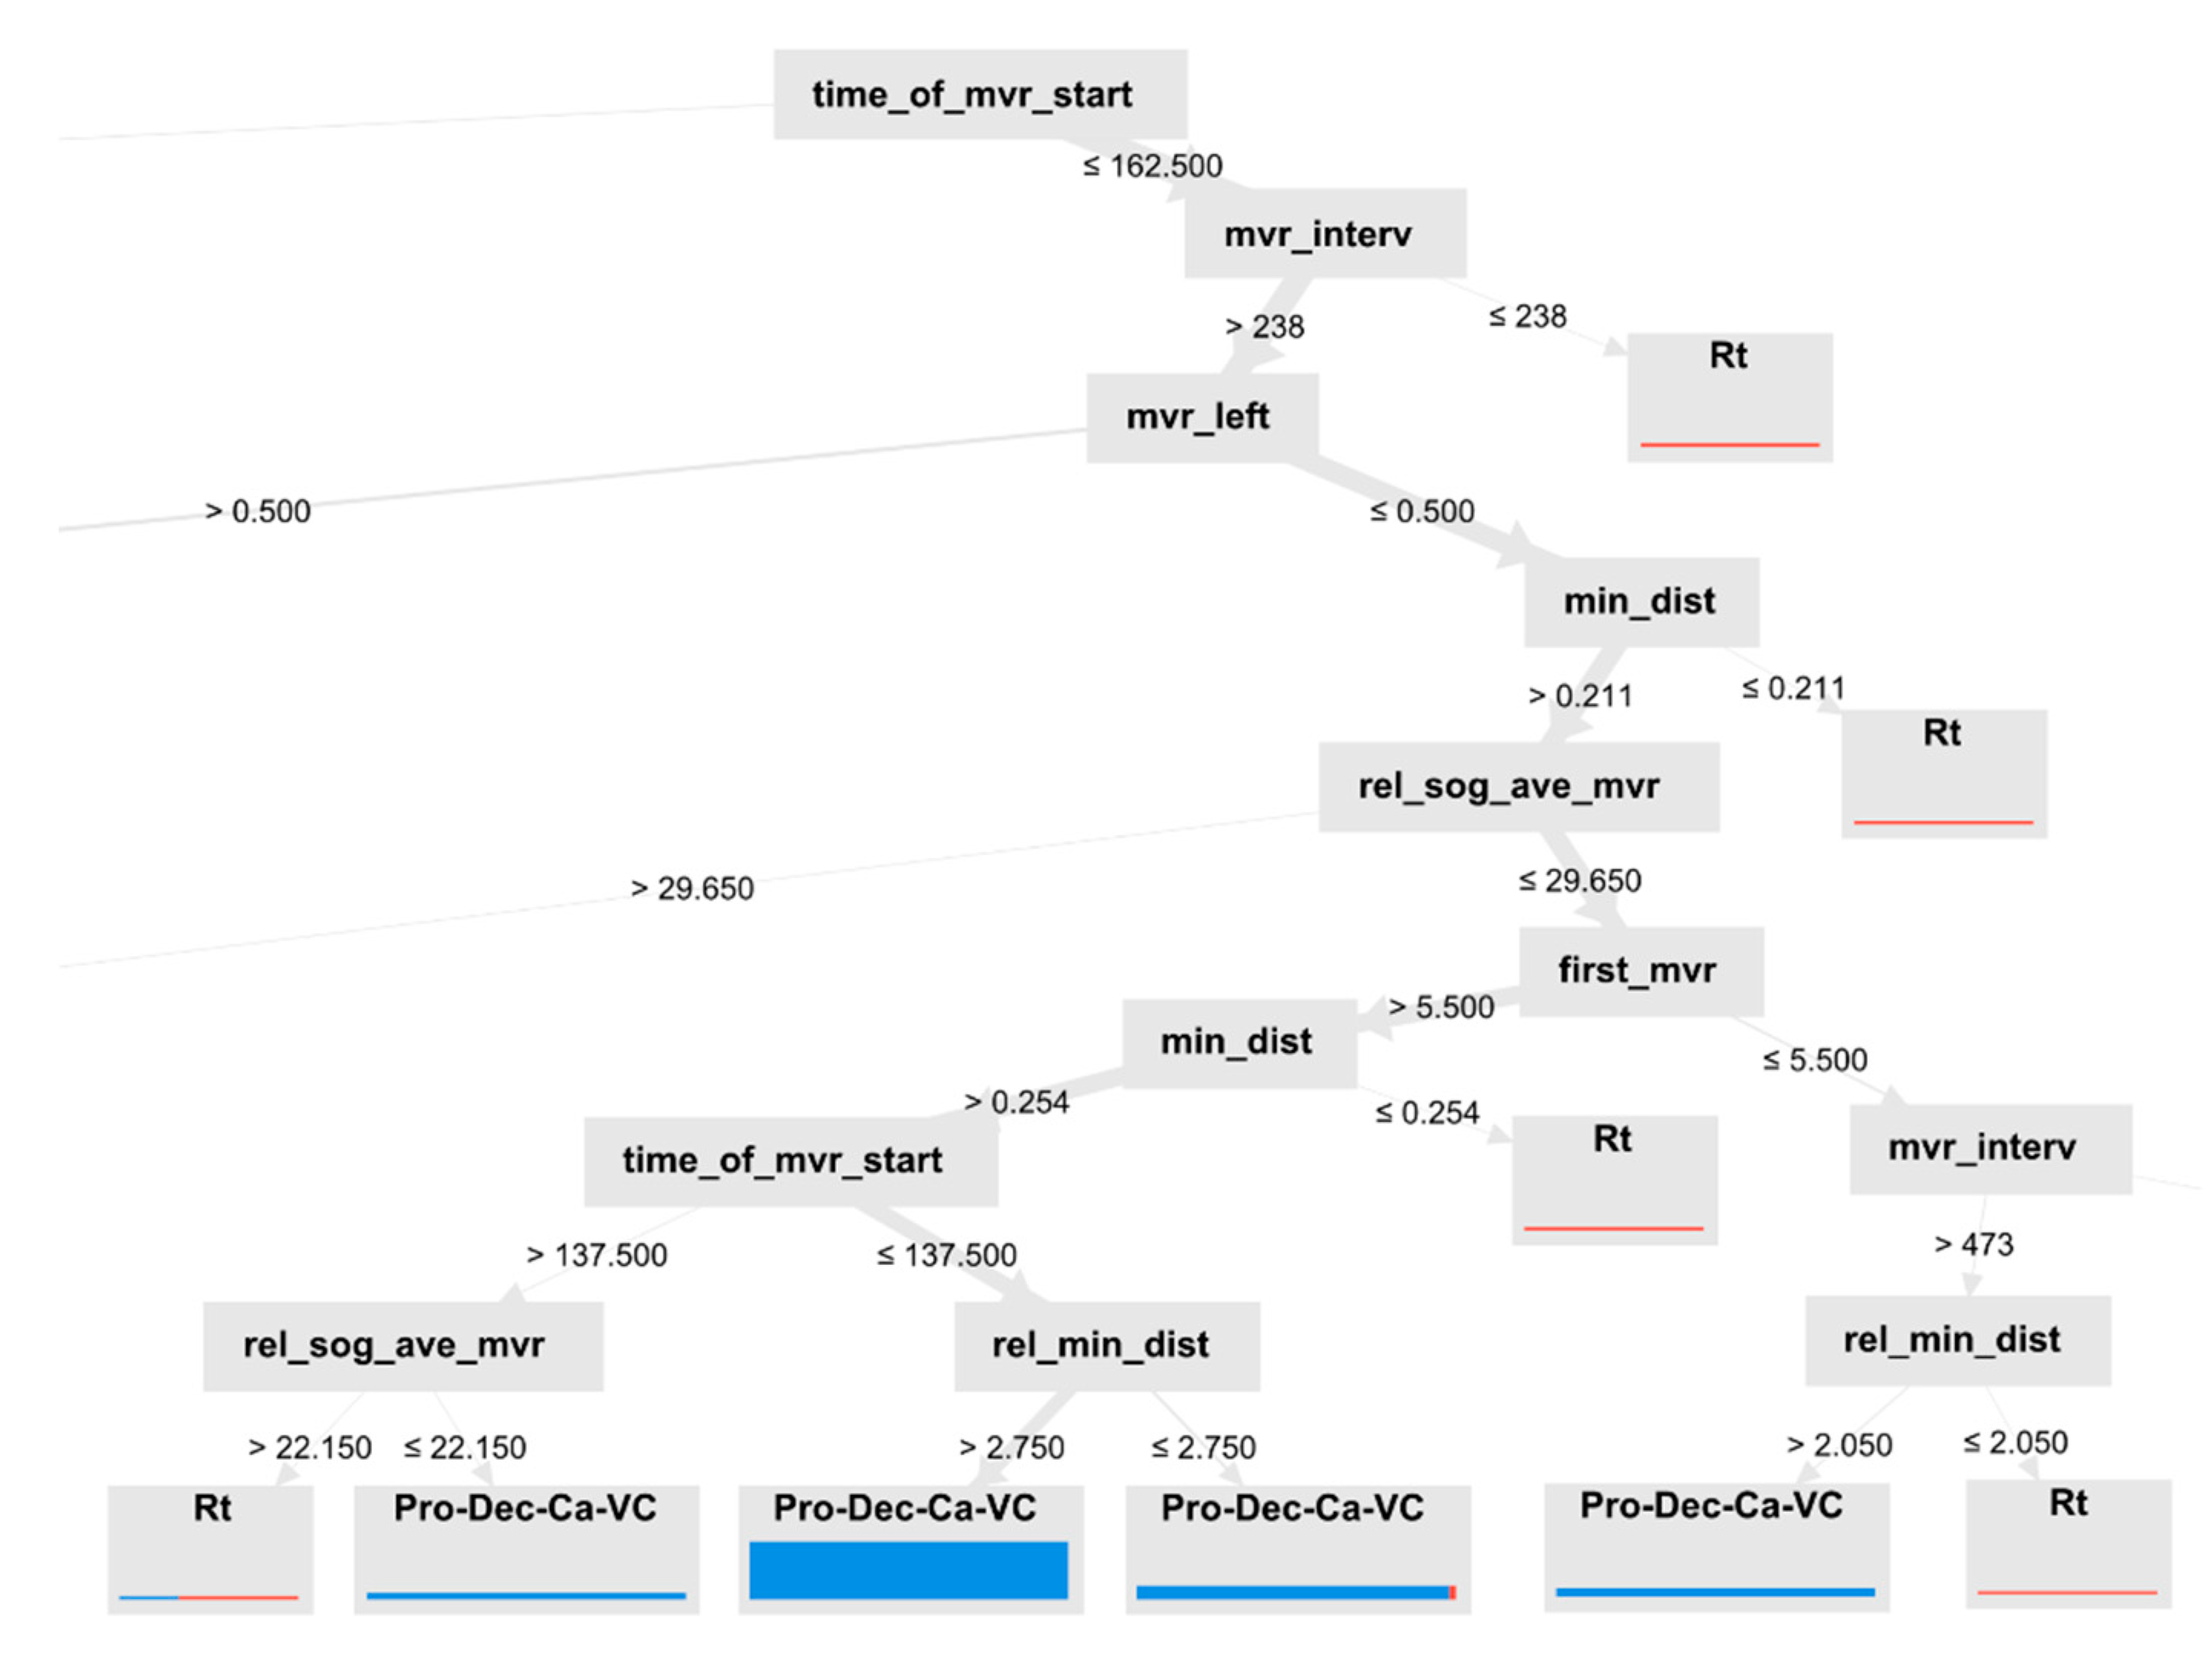
Decision tree #1: max depth—7; split criterion—Gini index; prepruning—false; pruning—false;
(2)
Decision tree #2: max depth—10; split criterion—Gini index; prepruning—true; pruning—false;
(3)
Decision tree #3: max depth—10; split criterion—Gini index; prepruning—false; pruning—false; attribute optimization-evolutionary algorithm; set division: testing/training—0.7/0.3;
(4)
Decision tree #4 max depth—10; split criterion—Gini index; prepruning—false; pruning—false; attribute optimization—PSO algorithm; set division: testing/training—0.7/0.3;
(5)
Neural network: one hidden layer with five neurons; 5000 training epochs;
(6)
Heuristic rules: classifier with decision rules established by experts;
(7)
Outliers: statistic algorithm for indicating data that significantly differ from the others.
It was found that in the case of decision trees, profile classification accuracy is affected by the tree depth. The use of pruning and prepruning techniques slightly impacts the classification accuracy. Significant classification improvement was observed when the Gini index as a spilt criterion was used. Increased accuracy was noted when the optimization algorithms were used for attribute selection. The best classification results were obtained using the PSO algorithm.
Low accuracy of navigator profile identification was observed when neural networks were used. Changes in basic network parameters did not significantly affect the classifier accuracy. This may be due to a small size of the training set. It is recommended to examine the neural networks of different architecture and parameters.
The low effectiveness of classification in the case of heuristic rules may be surprising. Models in this group had the worst result of safe profile identification—74.8%, which may be due to omitting part of the rules necessary for the correct classification. This may result from the fact that the process of analysis and assessment is complex. It should be assumed that in a number of cases the classification quality might be affected by minor differences in attribute values and their specific combinations.
The profile identification by the outlier method achieved the highest accuracy of risk-taker identification (65.2%). It should be noted that this method consists in seeking outliers, which in this case means indicating a relatively narrow group of risk-taking navigators (ca. 10%). At the same time, the method excludes building a new model for classifying new cases. This method may complement the previously mentioned methods.

4. Discussion

The tests of the characteristics of transport vehicle operators in the context of reducing human error as a frequent cause of accidents have been conducted for a number of years. Their aim is to analyze the psychological and physical characteristics of humans. The impact of these characteristics on the safety of movement processes is subject to scientific research. Classical psychological tests make up the basis of these studies. Data from real operator behavior recordings are increasingly used. These data are recorded in transport vehicles, including ships (rudder angle and engine setting). The proposed method extends known methods of identifying the vehicle operator profile. It enables the identification of the profile of own and other ship navigators on the basis of AIS data.
In most cases a group of factors was used to assign a given profile to the navigator by experts. At the same time, differences in maneuver performance by navigators were often small. For this reason it was difficult to determine the methods of navigator profile identification. As a result, errors occurred in the model of navigator profile identification. For instance, actual risk takers were classified as safe navigators and vice versa. It was recognized that a greater disadvantage was to classify risk takers as safe navigators than safe navigators as risk takers.
To improve the operation or effectiveness of the model of navigator profile identification, various methods of pre-processing and data mining were examined.
Very good results were obtained for the identification of safe navigators (97.1%). In the case of risk-taker identification, only 63.8% of the experiment participants were correctly classified. This result is not satisfactory. One reason may be incomplete AIS data and some common characteristics of maneuvers performed by both risk-taker and potentially safe navigators. For instance, although the first course alteration and the moment of its performance were similar, further actions resulted in different passing distances between the ships.
One of the reasons for a relatively low accuracy of the classification of risk taking navigators is the clear imbalance of the number of cases for risk-taker and safe navigator profiles. The subset of risk-takers included 47 elements, which represented 10% of the entire data set. Such disparities between the number of risk-takers and the number of ‘safe navigators’ reflect the assessment of expert navigators. Experts estimate that 10% of the navigators behave in a risky manner.
Further research will be broadened by additional scenarios including passing charted navigational objects. These authors plan to carry out verifications based on real AIS data. There are also plans to continue the research into the various models of profile identification, in particular the model based on the heuristic rules defined by experts.
The proposed method is expected to consist of specific stages. The first step consists in observation and automatic profile identification. The second step consists in prediction of the situation and identifying potential risks. In the case of risk detection, the third step will be to introduce additional safety margin and taking extra collision avoiding actions manually or automatically.
One example of using the profile identification method at a Vessel Traffic System (VTS) centre may be the observation of ships located in its Very High Frequency (VHF) range. Based on the manner of performed passing maneuvers, a VTS operator can identify a ship maneuvering dangerously and pay more attention to such ship, which in justified cases can be advised or instructed to perform specific maneuvers. Besides, the VTS operator may inform other ships in the vicinity of a potentially dangerous target.
It can be expected that the fourth step will be the implementation of the method in ship decision support systems, or in further future, in decision systems of autonomous ships, including taking over ship control.

5. Conclusions

The navigator’s safety profiles were analyzed. Two general safety profiles were distinguished: risk-taker (hazardous) and safe. Registered ECDIS simulator data were used for navigator safety profile identification. Data mining tools were used for navigator’s profile identification. Different profile identification methods were considered. An assessment of the navigator can be used in both onboard and ashore. The main application domains are in the authors’ opinion:
(1)
Onboard to identify potentially dangerous ships (navigators) for consideration in planning own ship maneuvers,
(2)
In the VTS Centre to pay more attention to ship maneuvering dangerously and to inform or warn other ships if needed,
(3)
For personal assessment purposes in shipping and crewing companies,
(4)
In education: for improvement of education at maritime institutions.
The authors plan to take into account weather conditions and charted navigational objects to complement the developed methodology for navigator’s safety profile identification. The analyzed methods for navigators safety profile identification are not fully satisfying. Therefore, other methods need to be considered. Another goal is to optimize developed algorithms and programs to minimize the assessment time especially when using online—onboard and in VTS.
Parallelly, methods for data acquisition from external data sources will be developed. Examples are inter alia SafeSeaNet SSN and Helcom databases. The goal is the use of real data online as well offline for navigator’s safety profile identification. This will allow to achieve the objectives mentioned above for both: onboard ship and ashore.

Author Contributions

Conceptualization, Z.P.; methodology, Z.P.; simulation research and data analysis software, M.W., M.B.; validation, Z.P., M.W., and M.B.; formal analysis, Z.P.; investigation, M.W., M.B.; resources, M.W.; data curation, M.W., M.B.; writing—original draft preparation, M.W., M.B.; writing—review and editing, Z.P.; visualization, M.W., M.B.; supervision and funding acquisition, Z.P. All authors have read and agreed to the published version of the manuscript.

Funding

This research outcome has been achieved under the research project No. 1/S/ITM/16 financed from a subsidy of the Ministry of Science and Higher Education for statutory activities of the Maritime University of Szczecin.

Conflicts of Interest

The authors declare no conflict of interest.

References

  1. U.S. Department of Transportation; Federal Aviation Administration. Flight Standards Service: Aviation Instructor’s Handbook; United States Government Printing Office: Washington, DC, USA, 2008. Available online: http://www.faa.gov/regulations_policies/handbooks_manuals/aviation/aviation_instructors_handbook/media/faa-h-8083-9a.pdf (accessed on 21 January 2019).
  2. Augustynowicz, A. Modeling the Type of Car Driver; Oficyna Wydawnicza Politechniki Opolskiej: Opole, Poland, 2008. (In Polish) [Google Scholar]
  3. Aliefendioglu, O.; Küçükay, F. Real-Time Statistical-Based Test Environment for Transmission Control Unit of Passenger Cars. SAE Trans. 1999, 108, 1944–1953. [Google Scholar]
  4. Kücükay, F.; Bergholz, J. Driver Assistant Systems. In Proceedings of the ICAT 2004 International Conference on Automotive Technology “Future Automotive Technologies on Powertrain and Vehicle”, Istanbul, Turkey, 26 November 2004. [Google Scholar]
  5. Abramowicz-Gerig, T.; Hejmlich, A. Human Factor Modelling in the Risk Assessment of Port Manoeuvers. TransNav Int. J. Mar. Navig. Saf. Sea Transp. 2015, 9. [Google Scholar] [CrossRef] [Green Version]
  6. Yim, J.B.; Park, D.J.; Youn, I.H. Development of navigator behavior models for the evaluation of collision avoidance behavior in the collision-prone navigation environment. Appl. Sci. 2019, 9, 3114. [Google Scholar] [CrossRef] [Green Version]
  7. Wielgosz, M. The safety profile of marine navigator and its significance for the safety of maritime traffic, In Prace Naukowe Politechniki Warszawskiej; Transport: Warsaw, Poland, 2016; Volume 114, pp. 427–437. (In Polish) [Google Scholar]
  8. Wielgosz, M. The safety profile of sea navigator as a criterion for selection of persons responsible for the safety of navigation. In Gospodarka Materiałowa i Logistyka; PWE: Warsaw, Poland, 2016; pp. 849–858. (In Polish) [Google Scholar]
  9. Pietrzykowski, Z.; Wielgosz, M.; Breitsprecher, M. The determination of the sea navigator safety profile using data mining. In Communications in Computer and Information Science 1049; Mikulski, J., Ed.; Springer Nature Switzerland AG: Basel, Switzerland, 2019; pp. 333–345. [Google Scholar]
  10. Wielgosz, M.; Pietrzykowski, Z. Ship domain in the restricted area—Analysis of the influence of ship speed on the shape and size of the domain. Sci. J. Marit. Univ. Szczec. 2012, 30. [Google Scholar]
  11. Hastie, T.; Tibshirani, R.; Friedman, J. The Elements of Statistical Learning: Data Mining, Inference, and Prediction; Springer Science & Business Media: Berlin/Heidelberg, Germany, 2009. [Google Scholar]
  12. Han, J.; Kamber, M.; Pei, J. Data Mining: Concepts and Techniques, 3rd ed.; Morgan Kaufmann: Burlington, MA, USA, 2012. [Google Scholar]
  13. Fayyad, U.; Piatetsky-Shapiro, G.; Smyth, P. From Data Mining to Knowledge Discovery in Databases. AI Mag. 1996, 17, 37. [Google Scholar]
  14. Kantardzic, M. Data Mining: Concepts, Models, Methods, and Algorithms; John Wiley & Sons: Hoboken, NJ, USA, 2003. [Google Scholar]
  15. Hofmann, M.; Klinkenberg, R. RapidMiner: Data Mining Use Cases and Business Analytics Applications. In Chapman & Hall/CRC Data Mining and Knowledge Discovery Series; CRC Press: Boca Raton, FL, USA, 2013. [Google Scholar]
  16. Zhang, Y.A. Comprehensive Survey on Particle Swarm Optimization Algorithm and Its Applications. Math. Probl. Eng. 2015, 2015, 931256. [Google Scholar] [CrossRef] [Green Version]
  17. Anand, D. Feature extraction for collaborative filtering: A genetic programming approach. Int. J. Comput. Sci. Issues 2012, 9, 348. [Google Scholar]
  18. Mikut, R.; Reischl, M. Data Mining Tools. Wiley Interdiscip. Rev. Data Min. Knowl. Discov. 2011, 1, 431–443. [Google Scholar] [CrossRef]
  19. Available online: https://rapidminer.com (accessed on 1 September 2019).
  20. Nisbet, R.; Miner, G.; Yale, K. Data Understanding and Preparation. In Handbook of Statistical Analysis and Data Mining Applications; Academic Press: Cambridge, MA, USA, 2017; pp. 55–82. [Google Scholar]
Figure 1. Navigator’s real behavior for his/her profile determination to use automatic identification system (AIS) data.
Jmse 08 00050 g001
Figure 2. The process of navigator’s profile identification.
Jmse 08 00050 g002
Figure 3. Initial positions of ships in the scenarios.
Jmse 08 00050 g003
Figure 4. True trajectories for “medium” ship in selected scenarios: (a) “Crossing”; (b) “Head-on” and (c) “Overtaking”.
Jmse 08 00050 g004
Figure 5. Alterations of ship speed and course. Medium ship, ‘Crossing’.
Jmse 08 00050 g005
Figure 6. Alterations of speed and course. Medium ship, ‘Head-on’.
Jmse 08 00050 g006
Figure 7. Alterations of speed and course. Medium ship, ‘Overtaking’.
Jmse 08 00050 g007
Figure 8. Decision tree #3—fragment.
Jmse 08 00050 g008
Table 1. The technical and operational parameters of ships used in the tests.
ParameterShip Size
LargeMediumSmall
Length (LOA; m)261.3173.595.0
Breadth (B; m)48.023.013.0
Draught (T) (m)9.08.13.7
Displacement (D; t)63,43019,5123,510
Speed (v; kn)16.318.911.1
Table 2. Descriptions of input attributes.
AttributeDescription
COLREGsscenario (head-on, crossing, overtake)
course & speed altercourse and speed maneuver
dist_at_mvrreal distance at maneuver start
first_mvrvisibility of first maneuver
min_distpassing distance
mvr_intervmaneuvering duration (from start to passing)
mvr_leftmaneuver to the left
No_course_alternumber of course alterations
No_mvr_returnnumber of return maneuvers
No_speed_alternumber of speed alterations
rel_dist_at_mvrrelative distance at maneuver start
rel_min_distrelative distance of passing
rel_sog_ave_mvrrelative average speed during maneuver
rel_sog_mvr_startrelative speed at maneuver start
sizelength of ship
sog_avereal average speed over ground (whole scenario)
sog_ave_mvrreal average speed over ground
time_of_min_disttime of minimal distance
time_of_mvr_starttime of maneuver start
Table 3. Attribute weights after optimization.
Optimization MethodEvolutionaryBackwardPSO
AttributeWeights
mvr_interv1.0001.001.000
time_of_mvr_start1.0001.001.000
sog_ave1.0001.000.828
sog_ave_mvr1.0001.000.420
rel_dist_at_mvr1.0001.000.005
rel_sog_ave_mvr1.0001.000.000
rel_sog_mvr_start0.8771.000.488
course&speed_alter0.4841.001.000
mvr_left0.2111.001.000
COLREGs0.2051.000.200
size0.0991.000.000
No_course_alter0.0001.000.590
min_dist0.0001.000.468
time_of_min_dist0.0001.000.387
rel_min_dist0.0001.000.373
dist_at_mvr0.0001.000.201
first_mvr0.0001.000.000
No_mvr_return0.0000.000.000
No_speed_alter0.0001.000.000
Table 4. The result of the classification—decision tree #3.
Class PredictionPro-Dec-Ca-VCRtClass Precision
Pred. Pro-Dec-Ca-VC4071895.76%
Pred. Rt102974.36%
Class recall97.60%61.70%-
Accuracy 93.96% ± 2.95% (micro average: 93.97%)-
Table 5. Classification results.
Model/
Classifier
Decision
Tree #1
Decision
Tree #2
Decision
Tree #3
Decision
Tree #4
Neural NetworkHeuristic RulesOutliers
Risk-taker (%)46.853.261.763.842.660.965.2
Safe (%)98.896.697.697.199.2874.896.2

