Article

Simplified Method for Defining 2-Dimensional Design Failure Curve of Marine Silty Sand under Dynamic Loading

1
Seismic Simulation Test Center, Pusan National University, Busan 46241, Korea
2
Department of Civil and Environment Engineering, Pusan National University, Busan 46241, Korea
*
Author to whom correspondence should be addressed.
J. Mar. Sci. Eng. 2020, 8(1), 51; https://doi.org/10.3390/jmse8010051
Submission received: 24 December 2019 / Revised: 9 January 2020 / Accepted: 10 January 2020 / Published: 17 January 2020
(This article belongs to the Section Ocean Engineering)

Abstract

:
Global warming is becoming worse owing to carbon dioxide emissions around the world, and eco-friendly energy for reducing carbon dioxide emissions is gaining importance. Wind power plants are the most representative of the environmentally friendly energy power plants built in the ocean. The fatigue loading and long-term dynamic behavior of offshore soils are important considerations in the construction of structures such as wind turbines in the ocean as they are subject to long-term loads such as wind and wave loads. A design graph presents the short- and long-term behaviors of soil. Several laboratory tests are typically conducted to create design graphs. In this study, a cyclic simple shear test conducted at various confining pressures and relative densities is presented in design graphs. The authors analyzed the sensitivity of the relative density and the confining pressure, and proposed a drawing technique to easily create two-dimensional design graphs. The authors found that the effect of the relative density on the design failure curve was higher compared with that of the confining pressure. The elliptic equation graph achieved the best match to the design failure curve, and the design failure curve drawing technique was summarized in five stages. In addition, the normalized cyclic stress ratio graph to distinguish safety or failure was presented.

1. Introduction

The construction of structures onshore has spatial limitations, such as size, city, and underground burial. Currently, many structures are being built offshore. Offshore structures are being constructed at deep depths as well as shallow depths. Initially, the focus was on shallow depths, such as building on land acquired through coastal reclamation and installing wind turbines offshore. However, the installation area has been increasingly extended to deeper depths.
Specific problematic soils (e.g., calcareous soils) or environmental conditions (e.g., ice forces in Canadian waters) have led to new foundation or platform concepts (e.g., grouted piles in calcareous soils, sand islands in the Beaufort Sea) [1]. New fields have been developed for offshore structure installation at greater distances from the shore, and hence in deeper water, for special projects such as marine fuel extraction, storage tank installation, and marine exploration. The development of fields in deep water has led to a variety of flexible structures for floating facilities tethered or moored by tension members and seabed anchors, with perhaps the most significant being suction-installed deep caissons such as those used for the Na Kika facility (Gulf of Mexico, USA) [2].
Global warming is becoming worse owing to carbon dioxide emissions around the world, and eco-friendly energy for reducing carbon dioxide emissions is gaining importance. In 2005, the Kyoto protocol of the United Nations framework convention on climate change was officially published [3]. It requires many target countries to reduce six types of emissions: carbon dioxide (CO2), methane (CH4), nitrous oxide (N2O), perfluorocarbons (PFCs), hydrofluorocarbon (HFC), and sulfur hexafluoride (SF6). The Kyoto protocol also requires policies and measures to be implemented to reduce greenhouse gases. In addition, energy efficiency improvement, the protection of greenhouse gas absorption and storage sources, and renewable energy development and research should be conducted in the target countries. Wind power plants are the most representative environmentally friendly energy power plants built in the ocean. As wind turbines are subject to long-term loads such as wind and wave loads, fatigue loading and long-term dynamic behavior of offshore soils are important considerations in the construction of structures such as wind turbines in the ocean. Many researchers have investigated the dynamic behavior of the ocean ground. The response of soil to cyclic loads is very complex and can be a function of many variables, such as the amplitude and number of cycles of the applied shear stresses, the density of the soil, and the stress history of the soil [4,5,6].
Stokoe et al. [7,8] analyzed the dynamic soil properties of undisturbed and remolded specimens under cyclic loading conditions using resonant column torsional shear equipment and investigated the correlation between field and laboratory conditions. Lanzo et al. [9] conducted a cyclic simple shear test on very soft clay samples collected offshore and analyzed the stress–strain behavior. The dependence of the small-strain shear modulus (G0), normalized equivalent shear modulus curve (Geq/G0c), and damping ratio curve (D-γc) on factors such as the void ratio, stress history, and loading cycles was analyzed and discussed. Cyclic stress τa is defined respectively as the amplitude of the cyclic stress and the average of the applied stress around which cyclic loading is applied. Four generic patterns of cyclic loading can be defined depending on the level of the average shear stress τa [1]. (1) ‘Two-way’ cyclic loading is used to denote cycling in such a way that zero stress is crossed, that is cycling from negative to positive values of stress (Figure 1a,b). (2) ‘One-way’ cyclic loading is denoted as cycling in a range in which no zero stress is crossed (Figure 1c,d). (3) ‘Symmetric’ cyclic loading is a particular case of two-way loading with zero mean stress and is also known as zero mean stress cyclic loading (Figure 1a). (4) ‘Asymmetric’ cyclic loading denotes cycling around non-zero mean stress and is also known as non-zero mean stress cyclic loading (Figure 1b–d).
Figure 2 shows the development of the pore pressure and shear strain during asymmetric cyclic loading. The load cycles with a single-amplitude shear stress, τcy, around a constant shear stress, τa. The cyclic loading generates a pore pressure characterized by a permanent pore-pressure component, up, and a cyclic pore pressure component, ucy. The pore pressures are generated only if the shear strains exceed the volumetric threshold. The increased pore pressure reduces the effective stresses in the soil, resulting in increased permanent, γp, and cyclic, γcy, shear strains with time. Figure 3 illustrates the stress–strain behavior of a soil element under cyclic loading. The decrease in the shear stiffness is due to soil degradation [10]. It should be noted, however, that the example given above does not always occur. There are situations where the pore pressure and shear strain evolution respond directly [11].
Research on the dynamic characteristics of marine soils has been conducted in many countries [12,13,14,15]. Andersen [16,17] presented a design diagram based on laboratory tests. In the diagram, it was assumed that Δτa is the applied undrained cyclic loading. Andersen presented a diagram showing the effect of applying drained cyclic loading, Δτa for normally consolidated Drammen clay [16]. The effect of drained versus undrained for very dense sand was presented in [17]. Most studies on design graphs focused mainly on design graphs with two-dimensional shapes, and the design graphs were prepared by conducting many dynamic laboratory tests [10,18,19,20]. Son et al. [21] proposed a three-dimensional design graph based on the number of iterations leading to failure using the relationship between the cyclic stress ratio (CSR), the average stress ratio (ASR), and the relative density (Dr).
In this paper, we propose a technique to draw a design graph with minimum number of tests. The sensitivity of the confining pressure and the relative density on the design graph of marine silty sand subjected to long-term dynamic load was analyzed. The proposed drawing technique is expected to reduce the design graph drawing time as it minimizes the number of dynamic tests conducted.

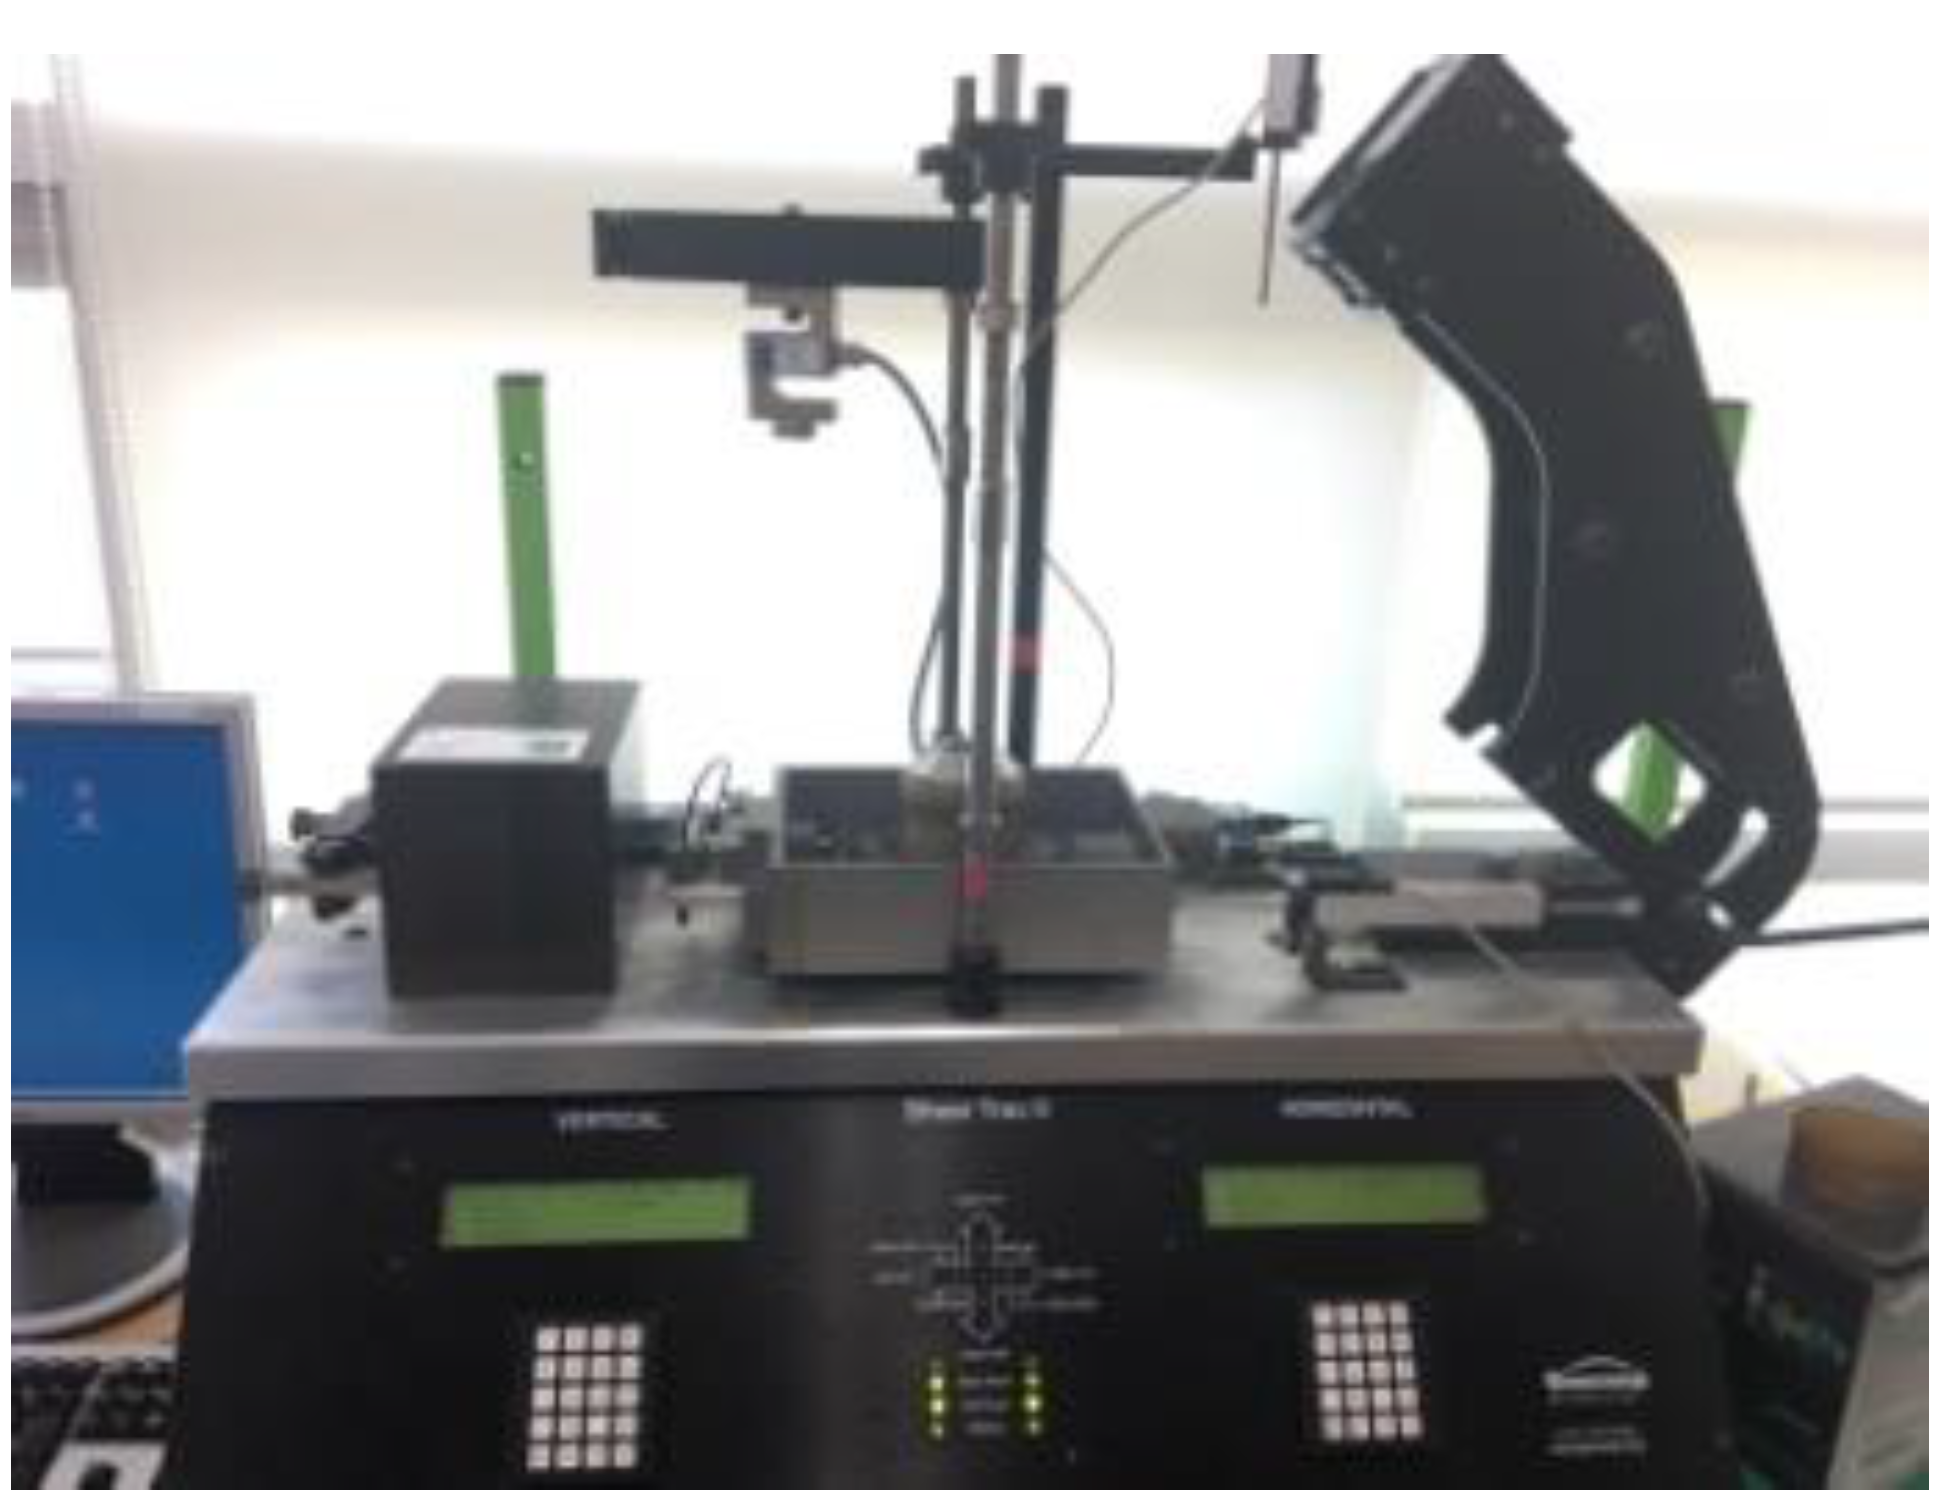
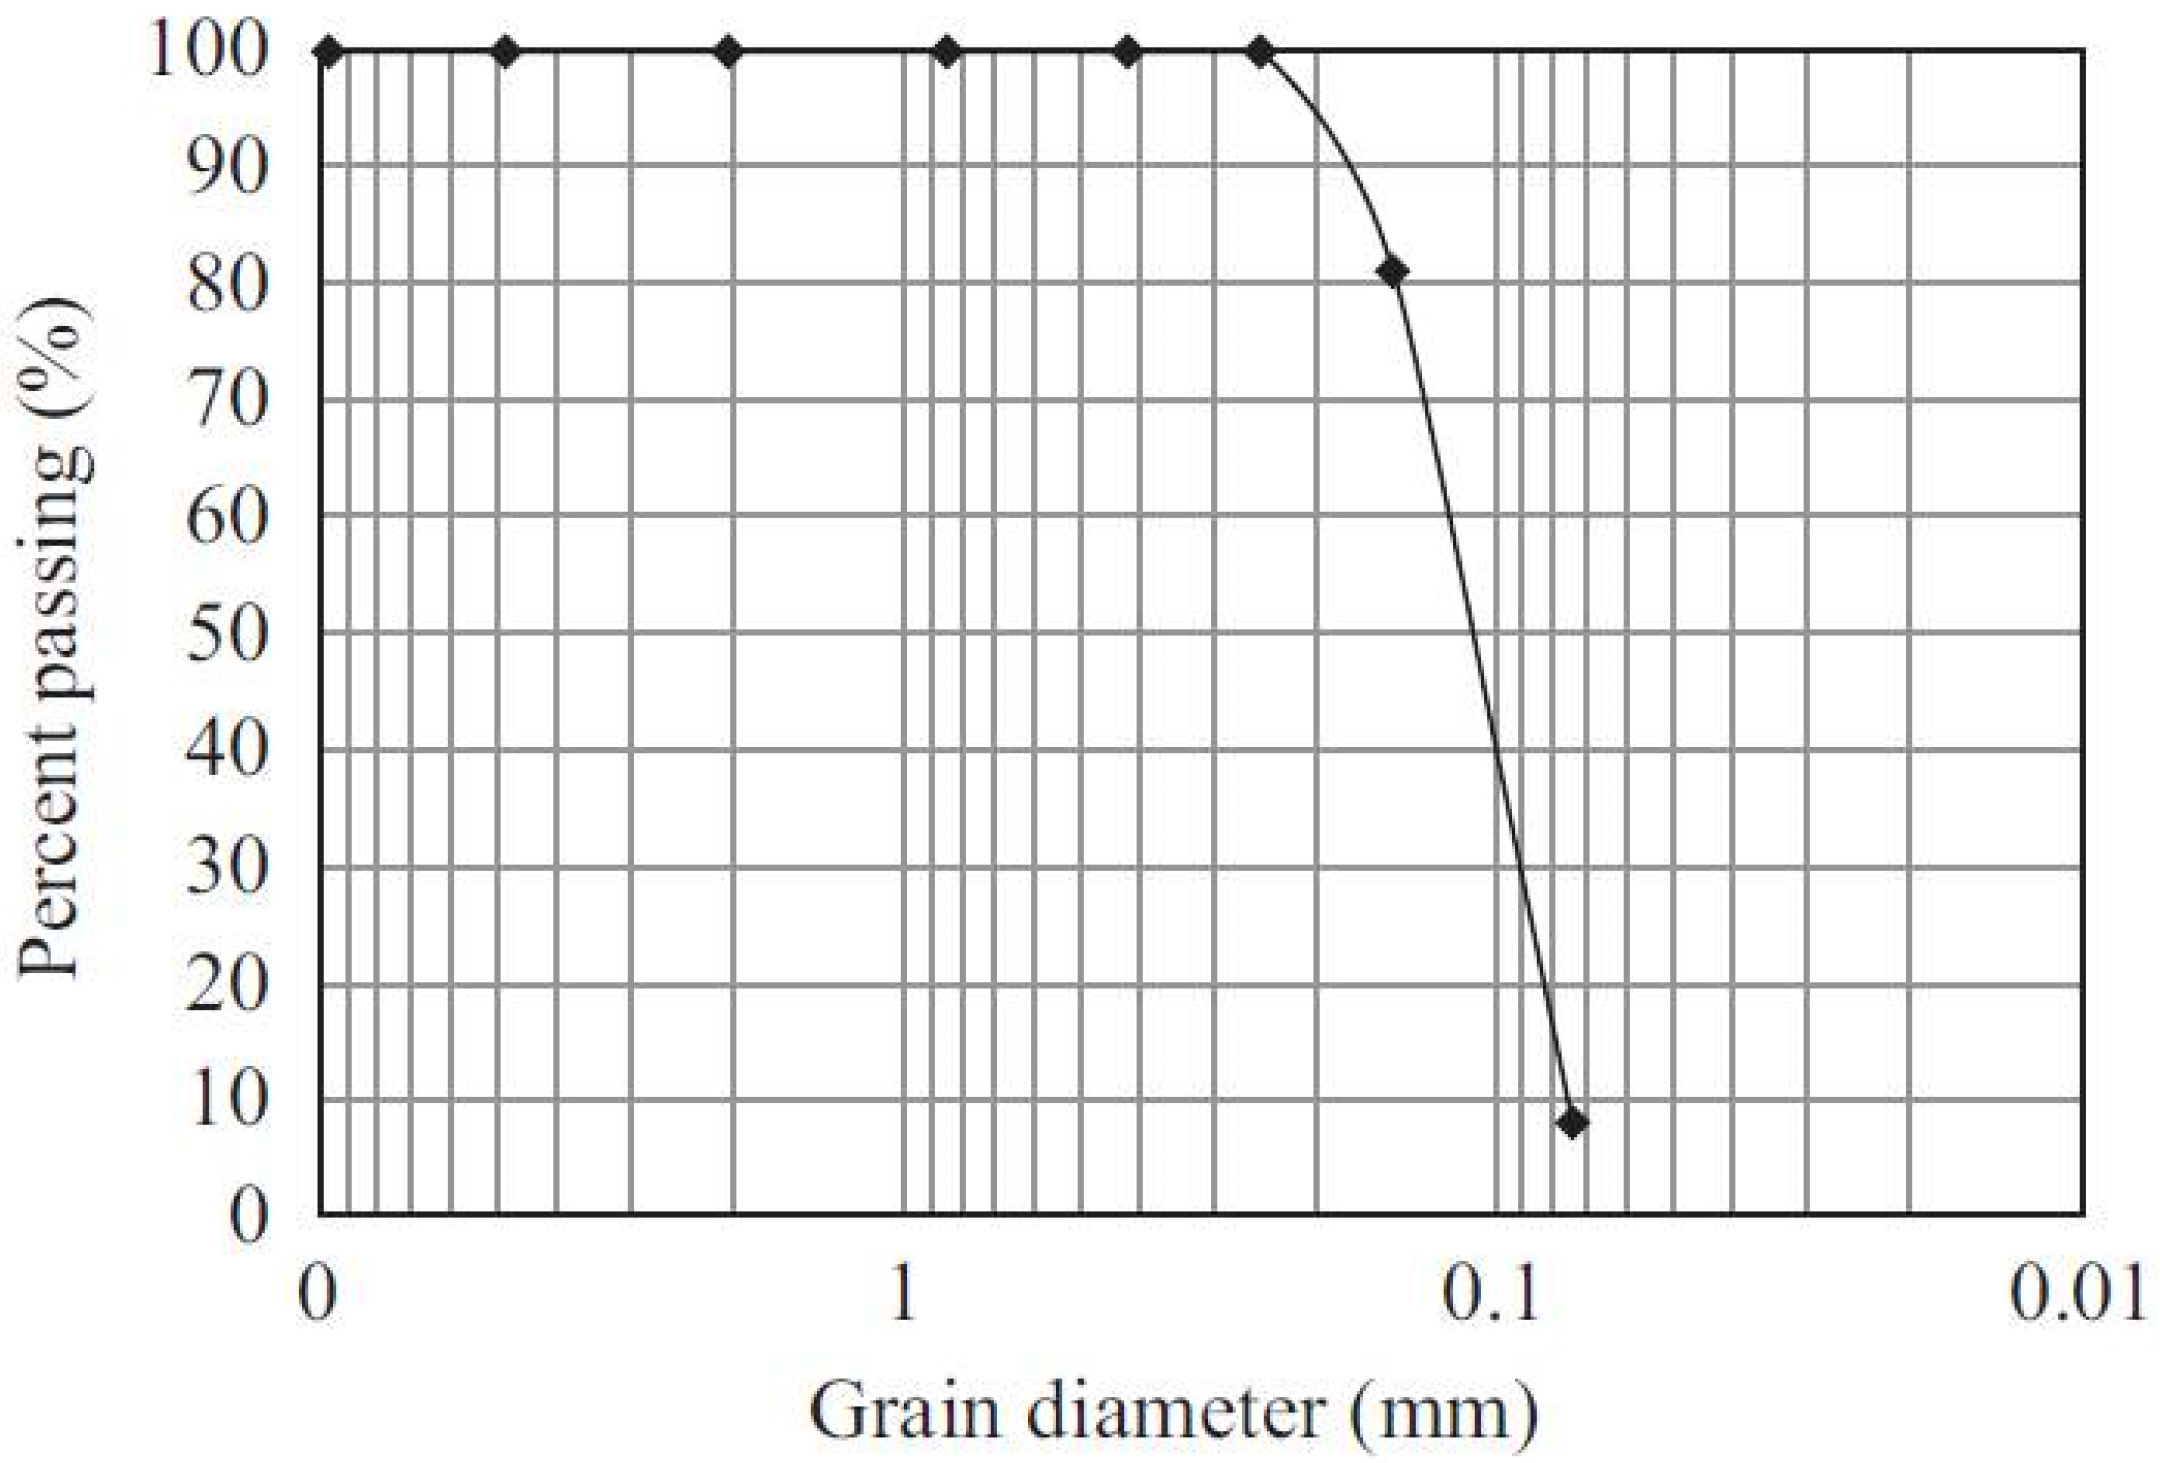
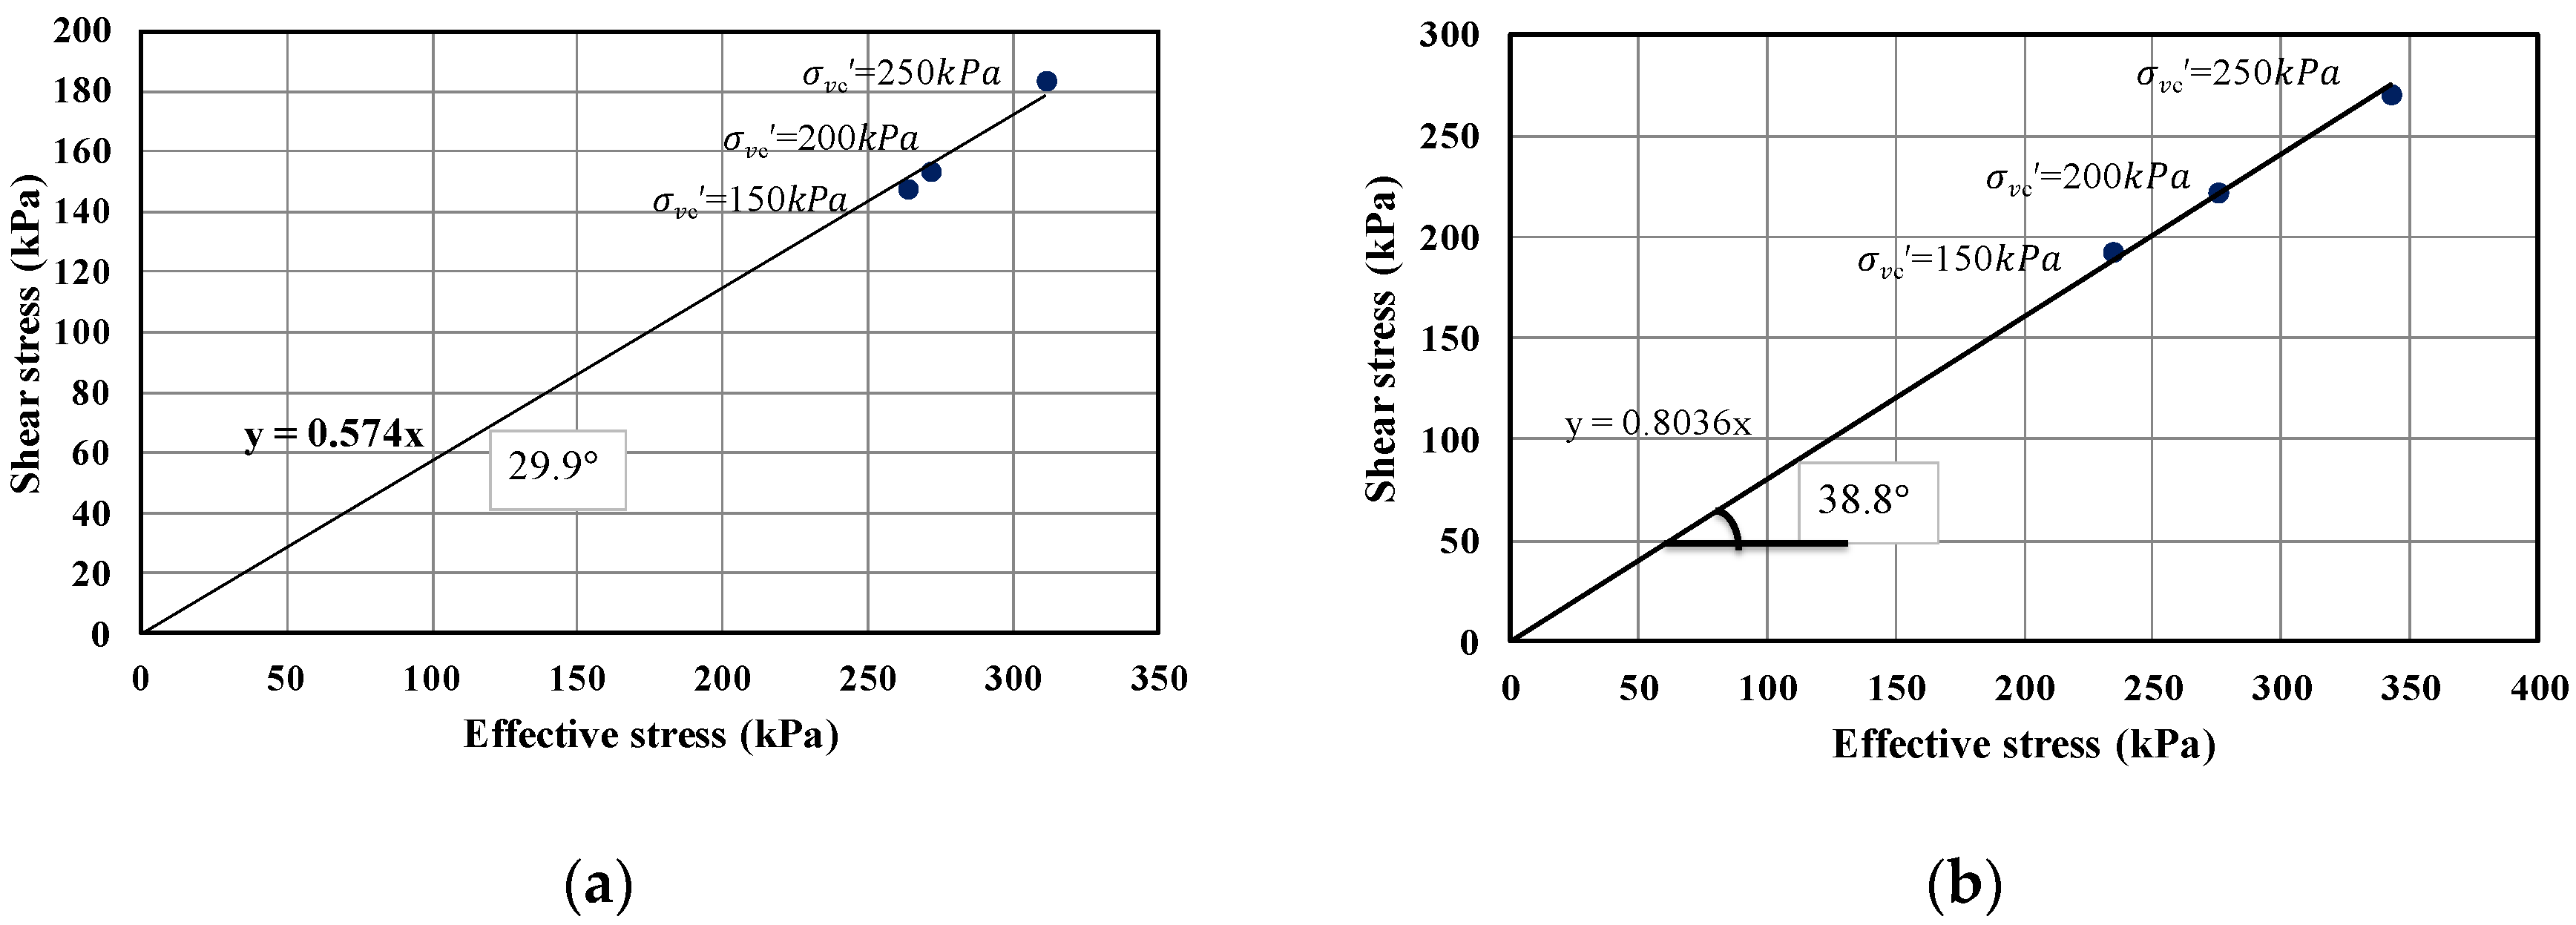
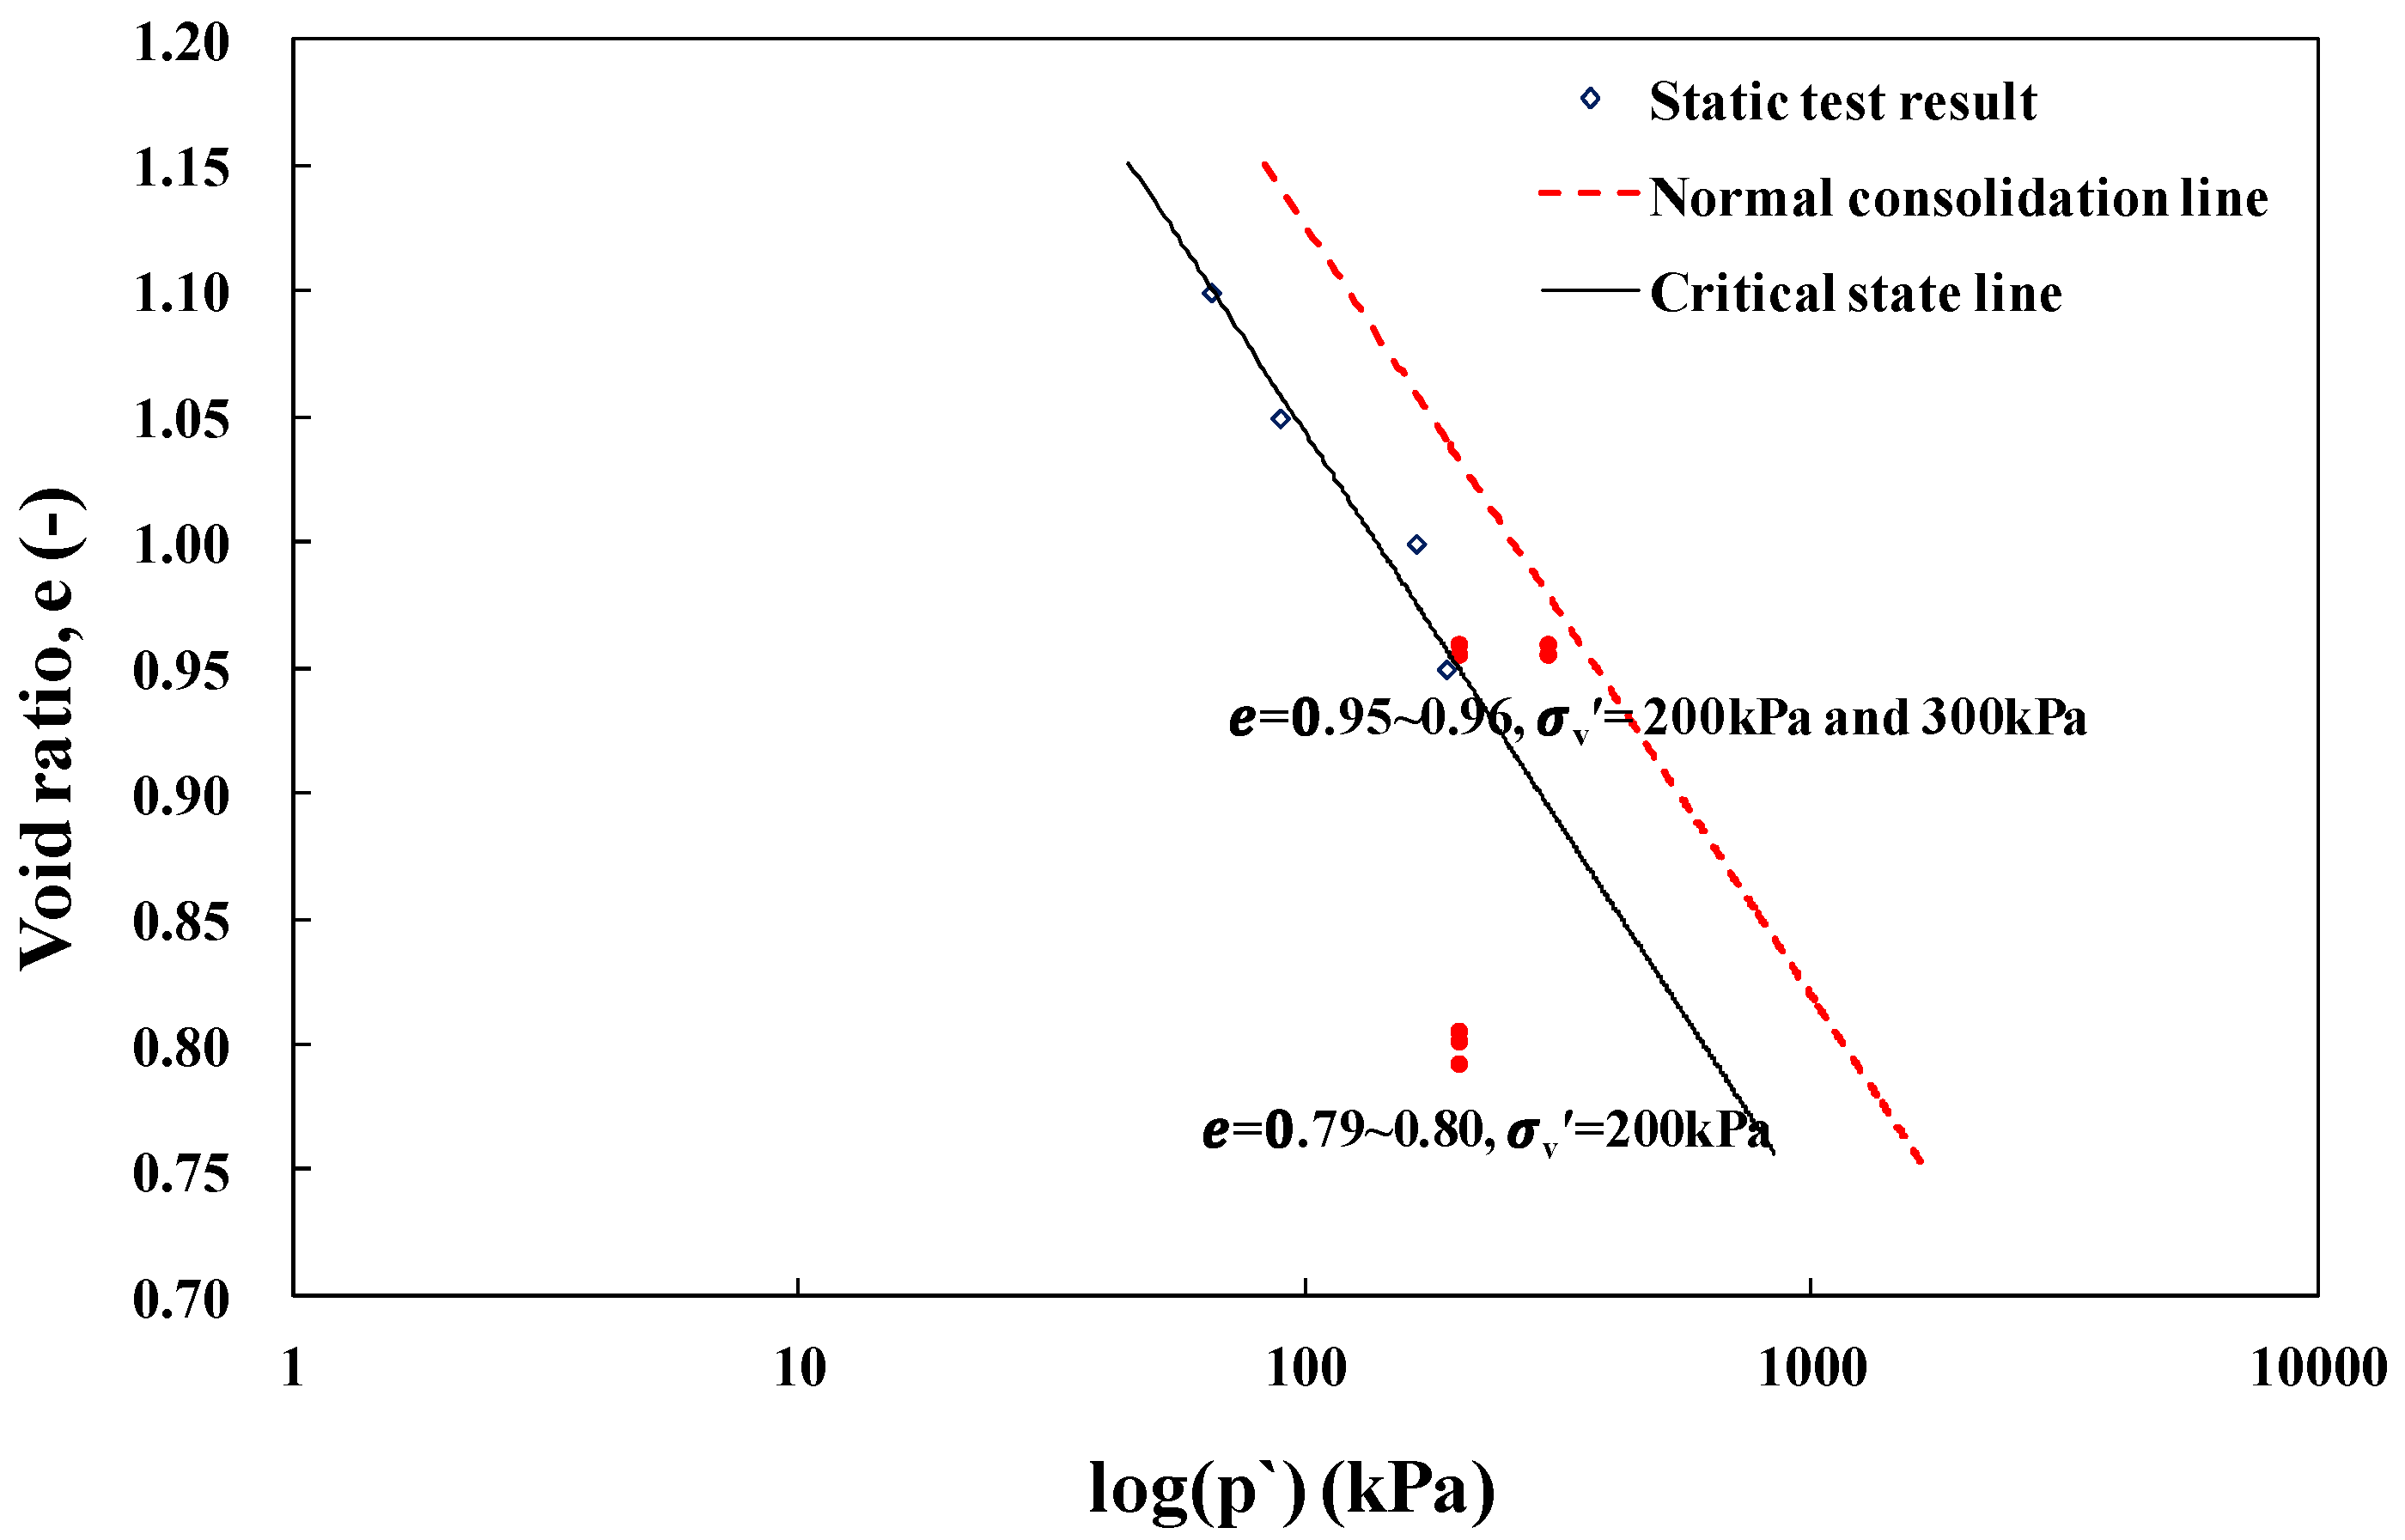
2. Test Apparatus and Program

In this study, the test was conducted using a cyclic direct simple shear apparatus as shown in Figure 4. This apparatus, which is a Norwegian Geotechnical Institute (NGI) type device [22], was used to measure the shear strength of the soil under plain strain conditions with continuous rotation of the principal stresses [23,24,25]. A cyclic direct simple shear test can be used to accurately measure the dynamic characteristics with cyclic loading in a large to medium strain range. The test was conducted in accordance with the ASTM standard D6528-17 [26] using the apparatus in Figure 4 under undrained conditions. The height of the specimen was controlled while applying shear stress to maintain a constant volume, and it was assumed that changes in the vertical stress were the same as changes in the pore pressure under undrained conditiona.
The dimensions of the specimen used in the cyclic direct simple shear test were 63.5 mm (diameter) and 21.5 mm to 23.4 mm (height). The height of the sample varies because the weight of the sample is the same in this experiment, but the relative density is controlled by varying the height. The initial relative density was 50–85%. The samples were prepared using the air pluviation method with the dry tamping method. In this experiment, the applied frequency of 0.1 Hz corresponding to the wave loading period in the offshore structures was used. The failure criterion for the strain was determined based on the studies in [1] and [27]. The study in [27] defined a double amplitude strain of 15% as the failure criterion using experiments conducted for the design of an offshore structure. The study in [1] proposed a strain contour using a cyclic simple shear test, and defined the number of failures as the number of times the permanent shear strain or the double amplitude shear strain is equal to 15%, which was obtained from the cyclic simple shear test results with asymmetric cyclic loading on normally consolidated Drammen clay. In this study, the failure criterion for the double amplitude of the shear strain and permanent shear strain of 15% was employed. An additional failure criterion for the occurrence of liquefaction when the effective vertical stress becomes zero was also used. The onset of liquefaction is defined when pore water pressure ratio ru is equal to 1. Vertical consolidation stress was set to 200 kPa and 300 kPa within the expected stress range on the foundation of the offshore wind turbine generator.
The properties and particle size curve for the soil used in this study are presented in Table 1 and Figure 5, respectively. The soil can be classified as silt sand and sand collected from the west coast area based on unified soil classification system(USCS) test results. In 2012, Korea Electric Power Corporation(KEPCO) conducted a ground survey [28] for construction of an offshore wind farm in the yellow sea. The results of this survey show that the soil comprises fine-grained sand mixed with silt. The samples used in this study were also collected close to the area where the ground survey was conducted. Hence, we judged that the samples are representative of samples from the ocean ground.
The internal friction angles of the specimens were obtained through static tests as 29.9° and 38.8° at relative densities of 50% and 85%, respectively (Figure 6). The internal friction angles of the specimen indicate the static stress ratio; the static stress ratios ( τ σ ) are 0.574 (density 50%) and 0.804 (density 85%), respectively. The stress ratios were obtained when the cyclic shear stress ratio is zero, and this is considered the initial point of the stress based on the failure criterion. However, these values are approximate values because the ratio of the shear stress to the vertical effective stress is the ratio of stresses on the horizontal plane, which is not the failure plane. Figure 7 shows the critical state line (CSL), which corresponds to the effective stress path of the soil for this study obtained from the results of the static test. In this study, the confining pressures are 200 kPa and 300 kPa at the CSL of Figure 7. Here, it can be observed that 200 kPa indicates a dense condition, whereas 300 kPa indicates a loose condition.
To compare the behavior under various conditions, a total of 15 or more cyclic simple shear tests were conducted at average shear stress ratio in the range of 0.0–0.4 and cyclic shear stress ratio in the range of 0.1–0.5. The ranges were set within the criterion to achieve failure in 1 to 10,000 cycles (Table 2).

3. Design Failure Curve
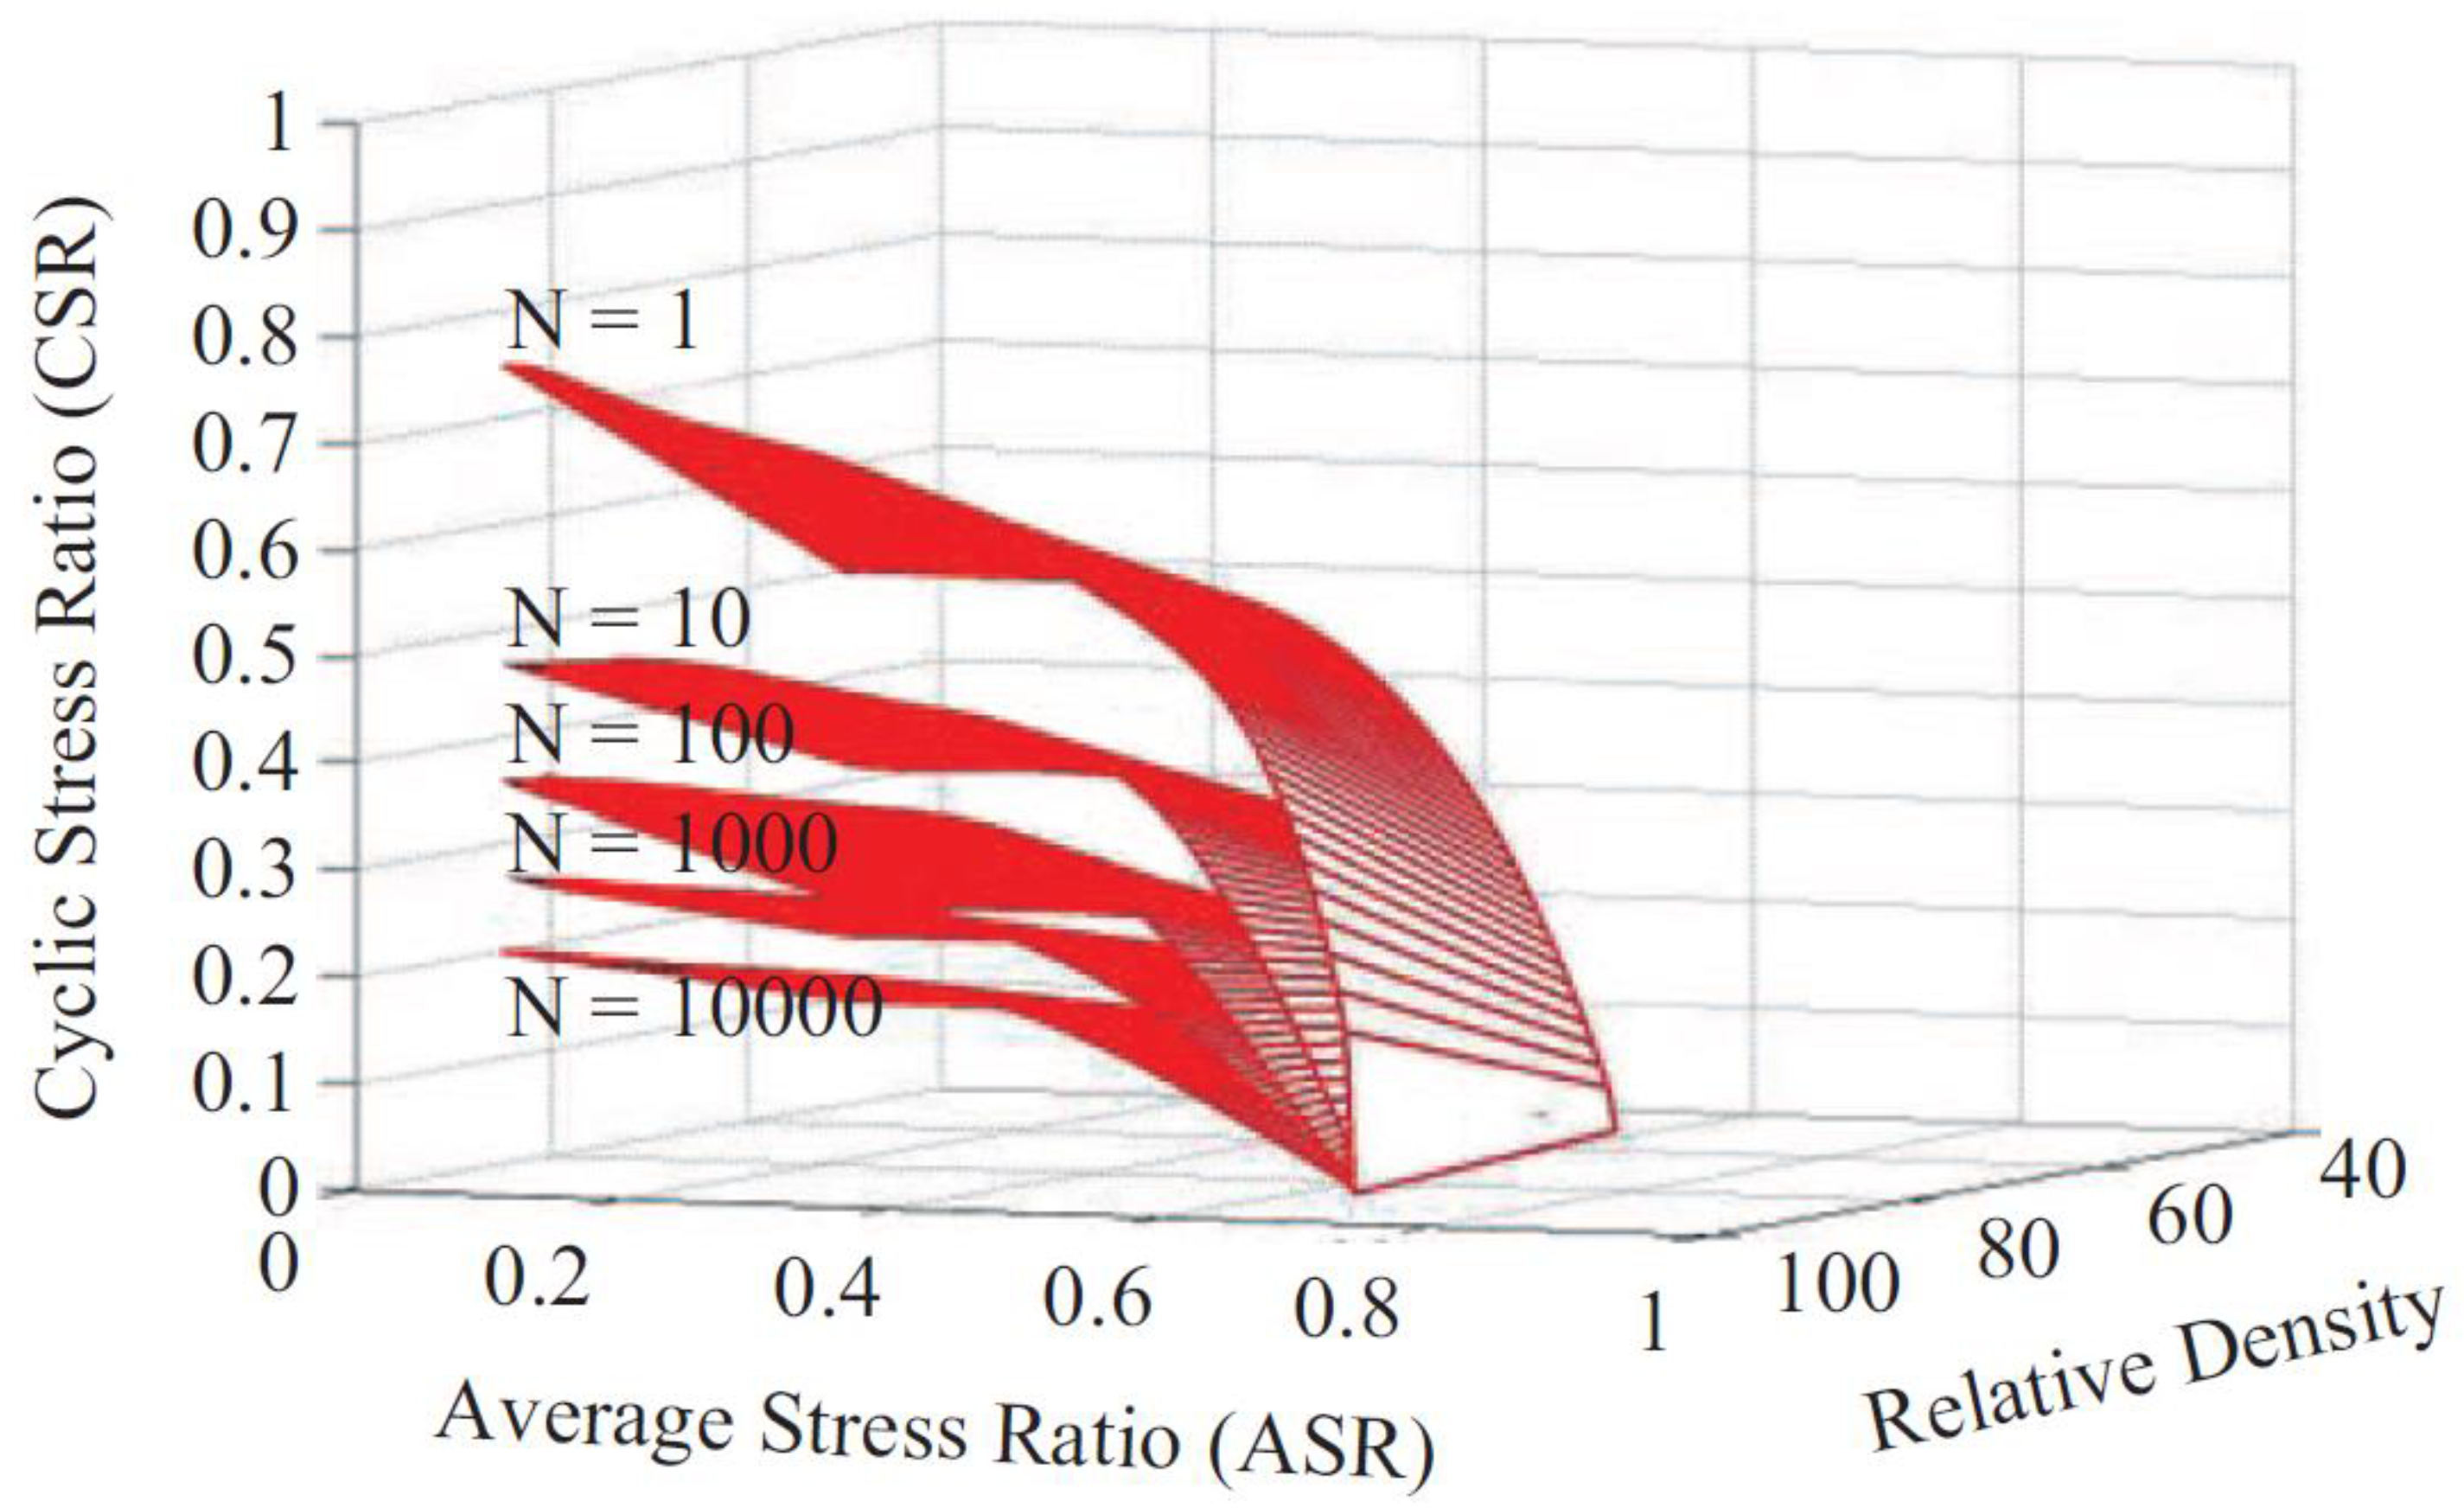
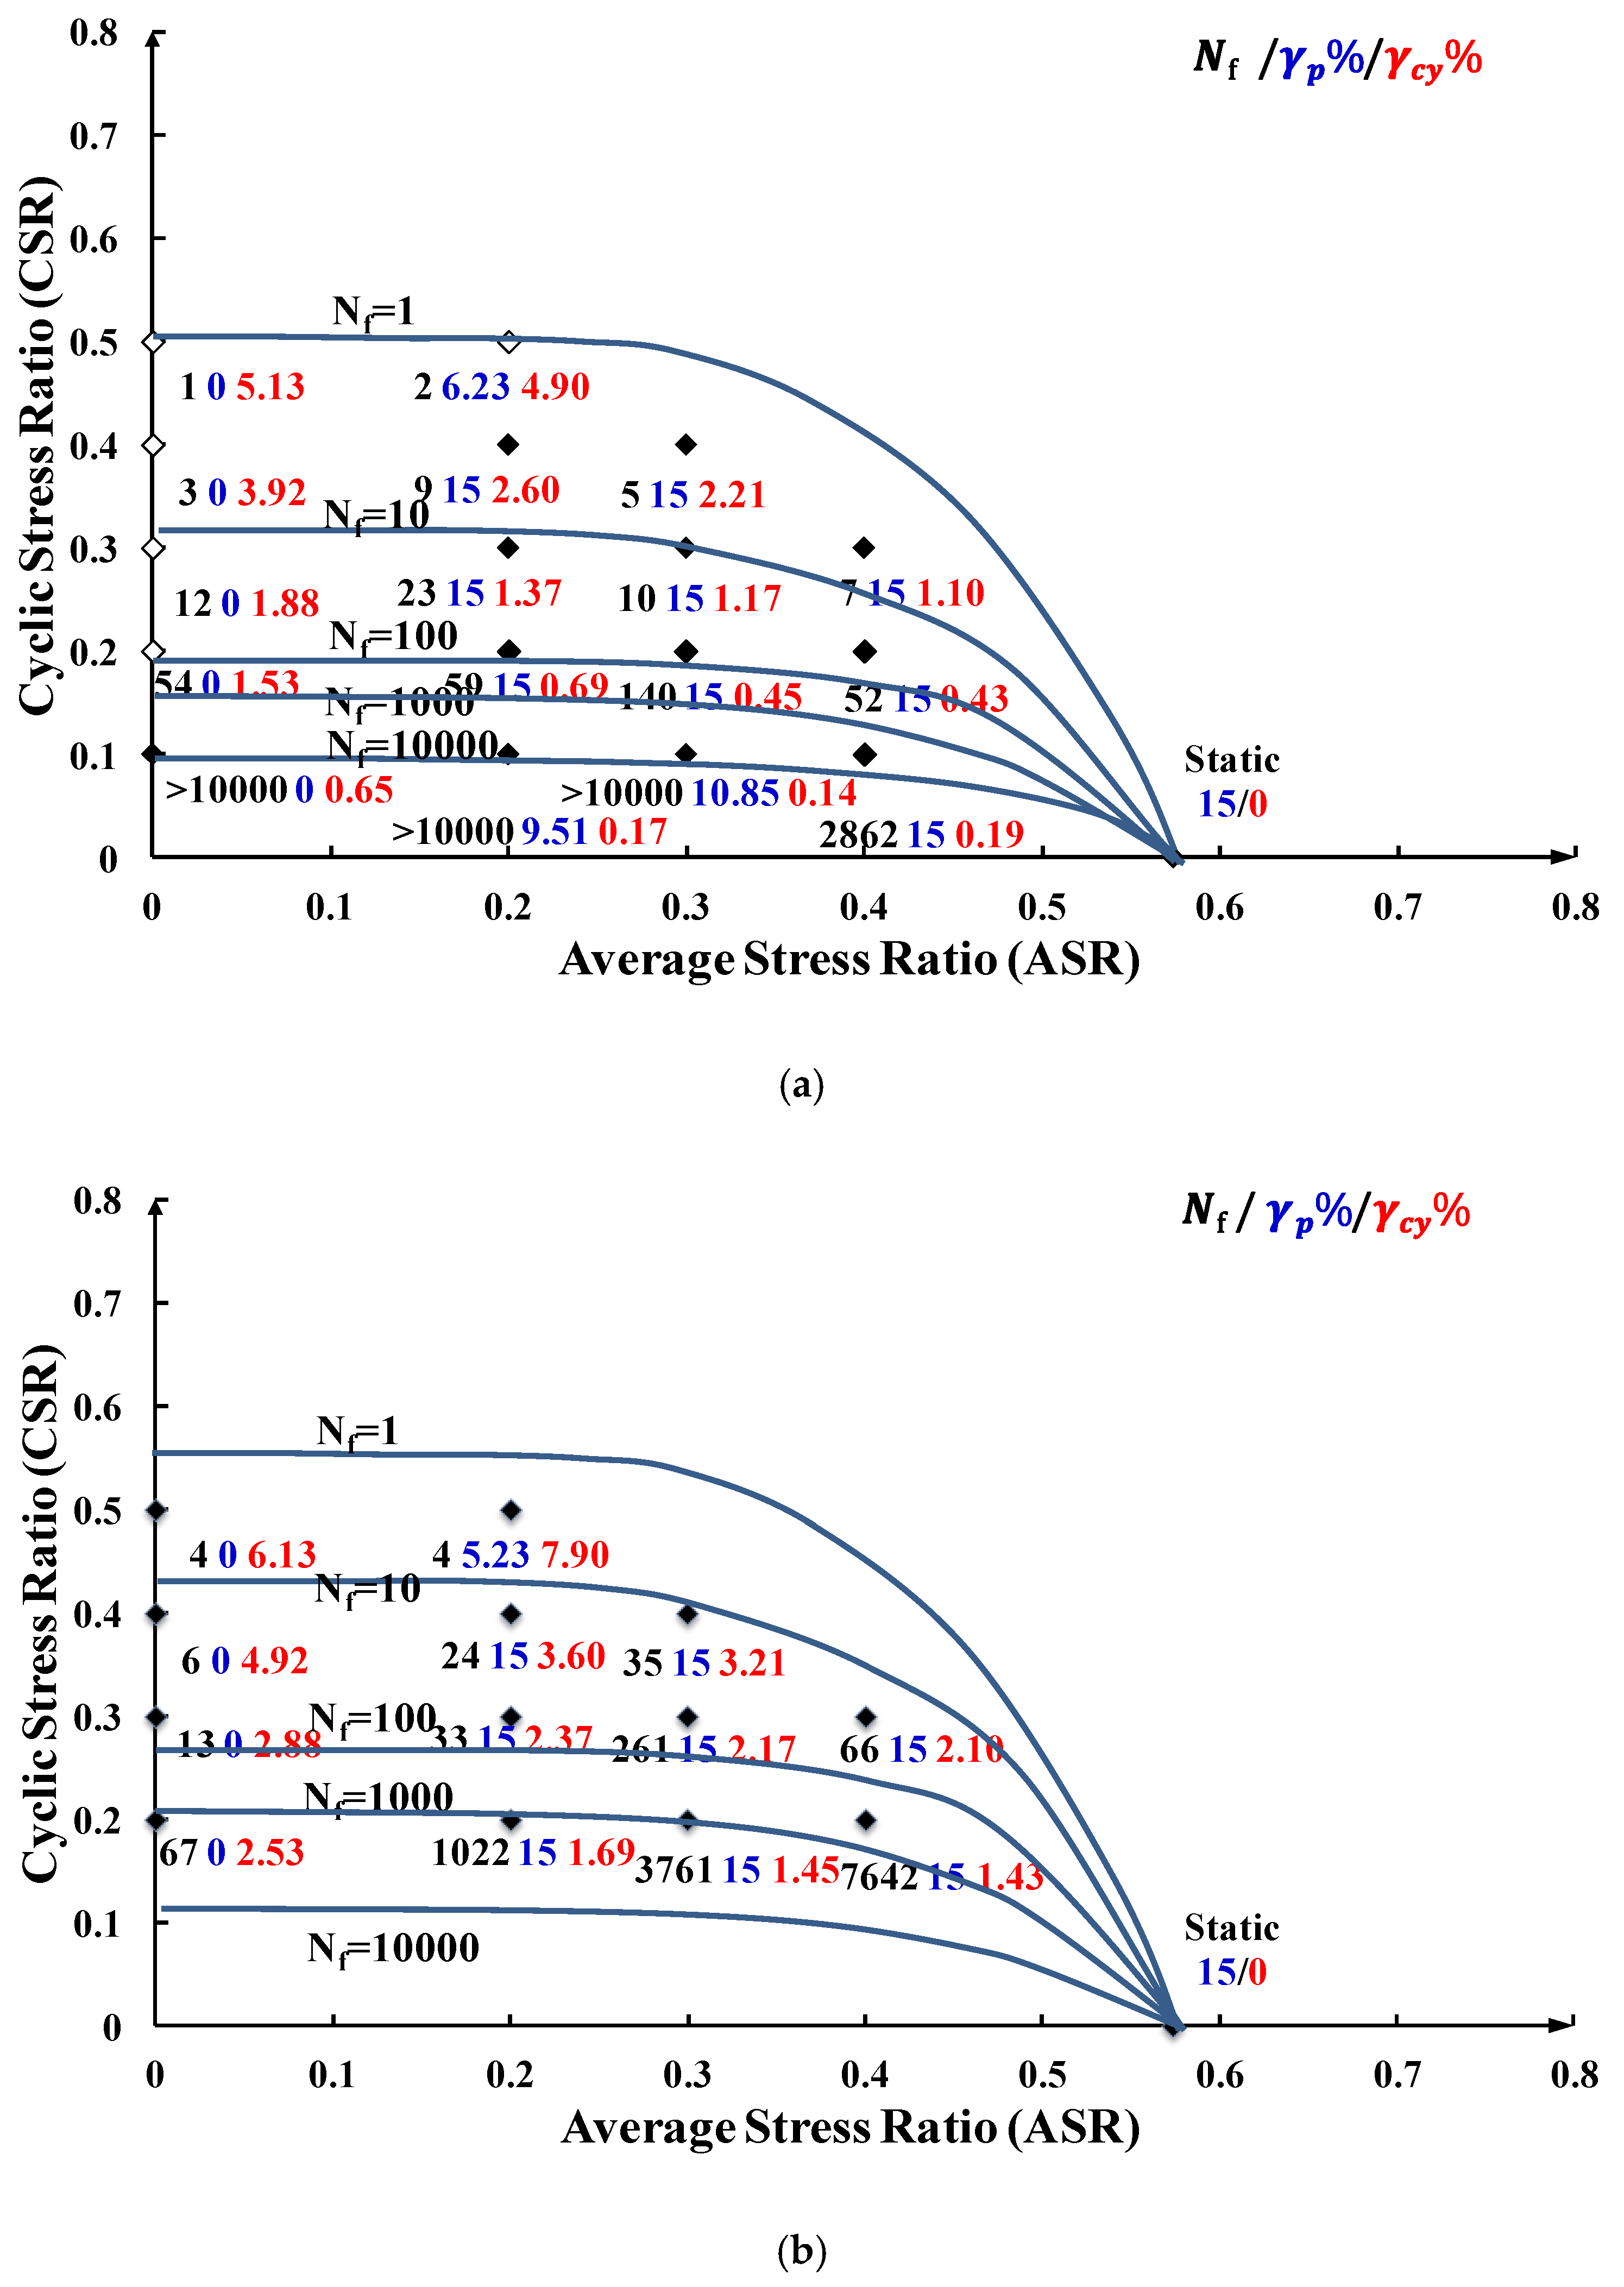
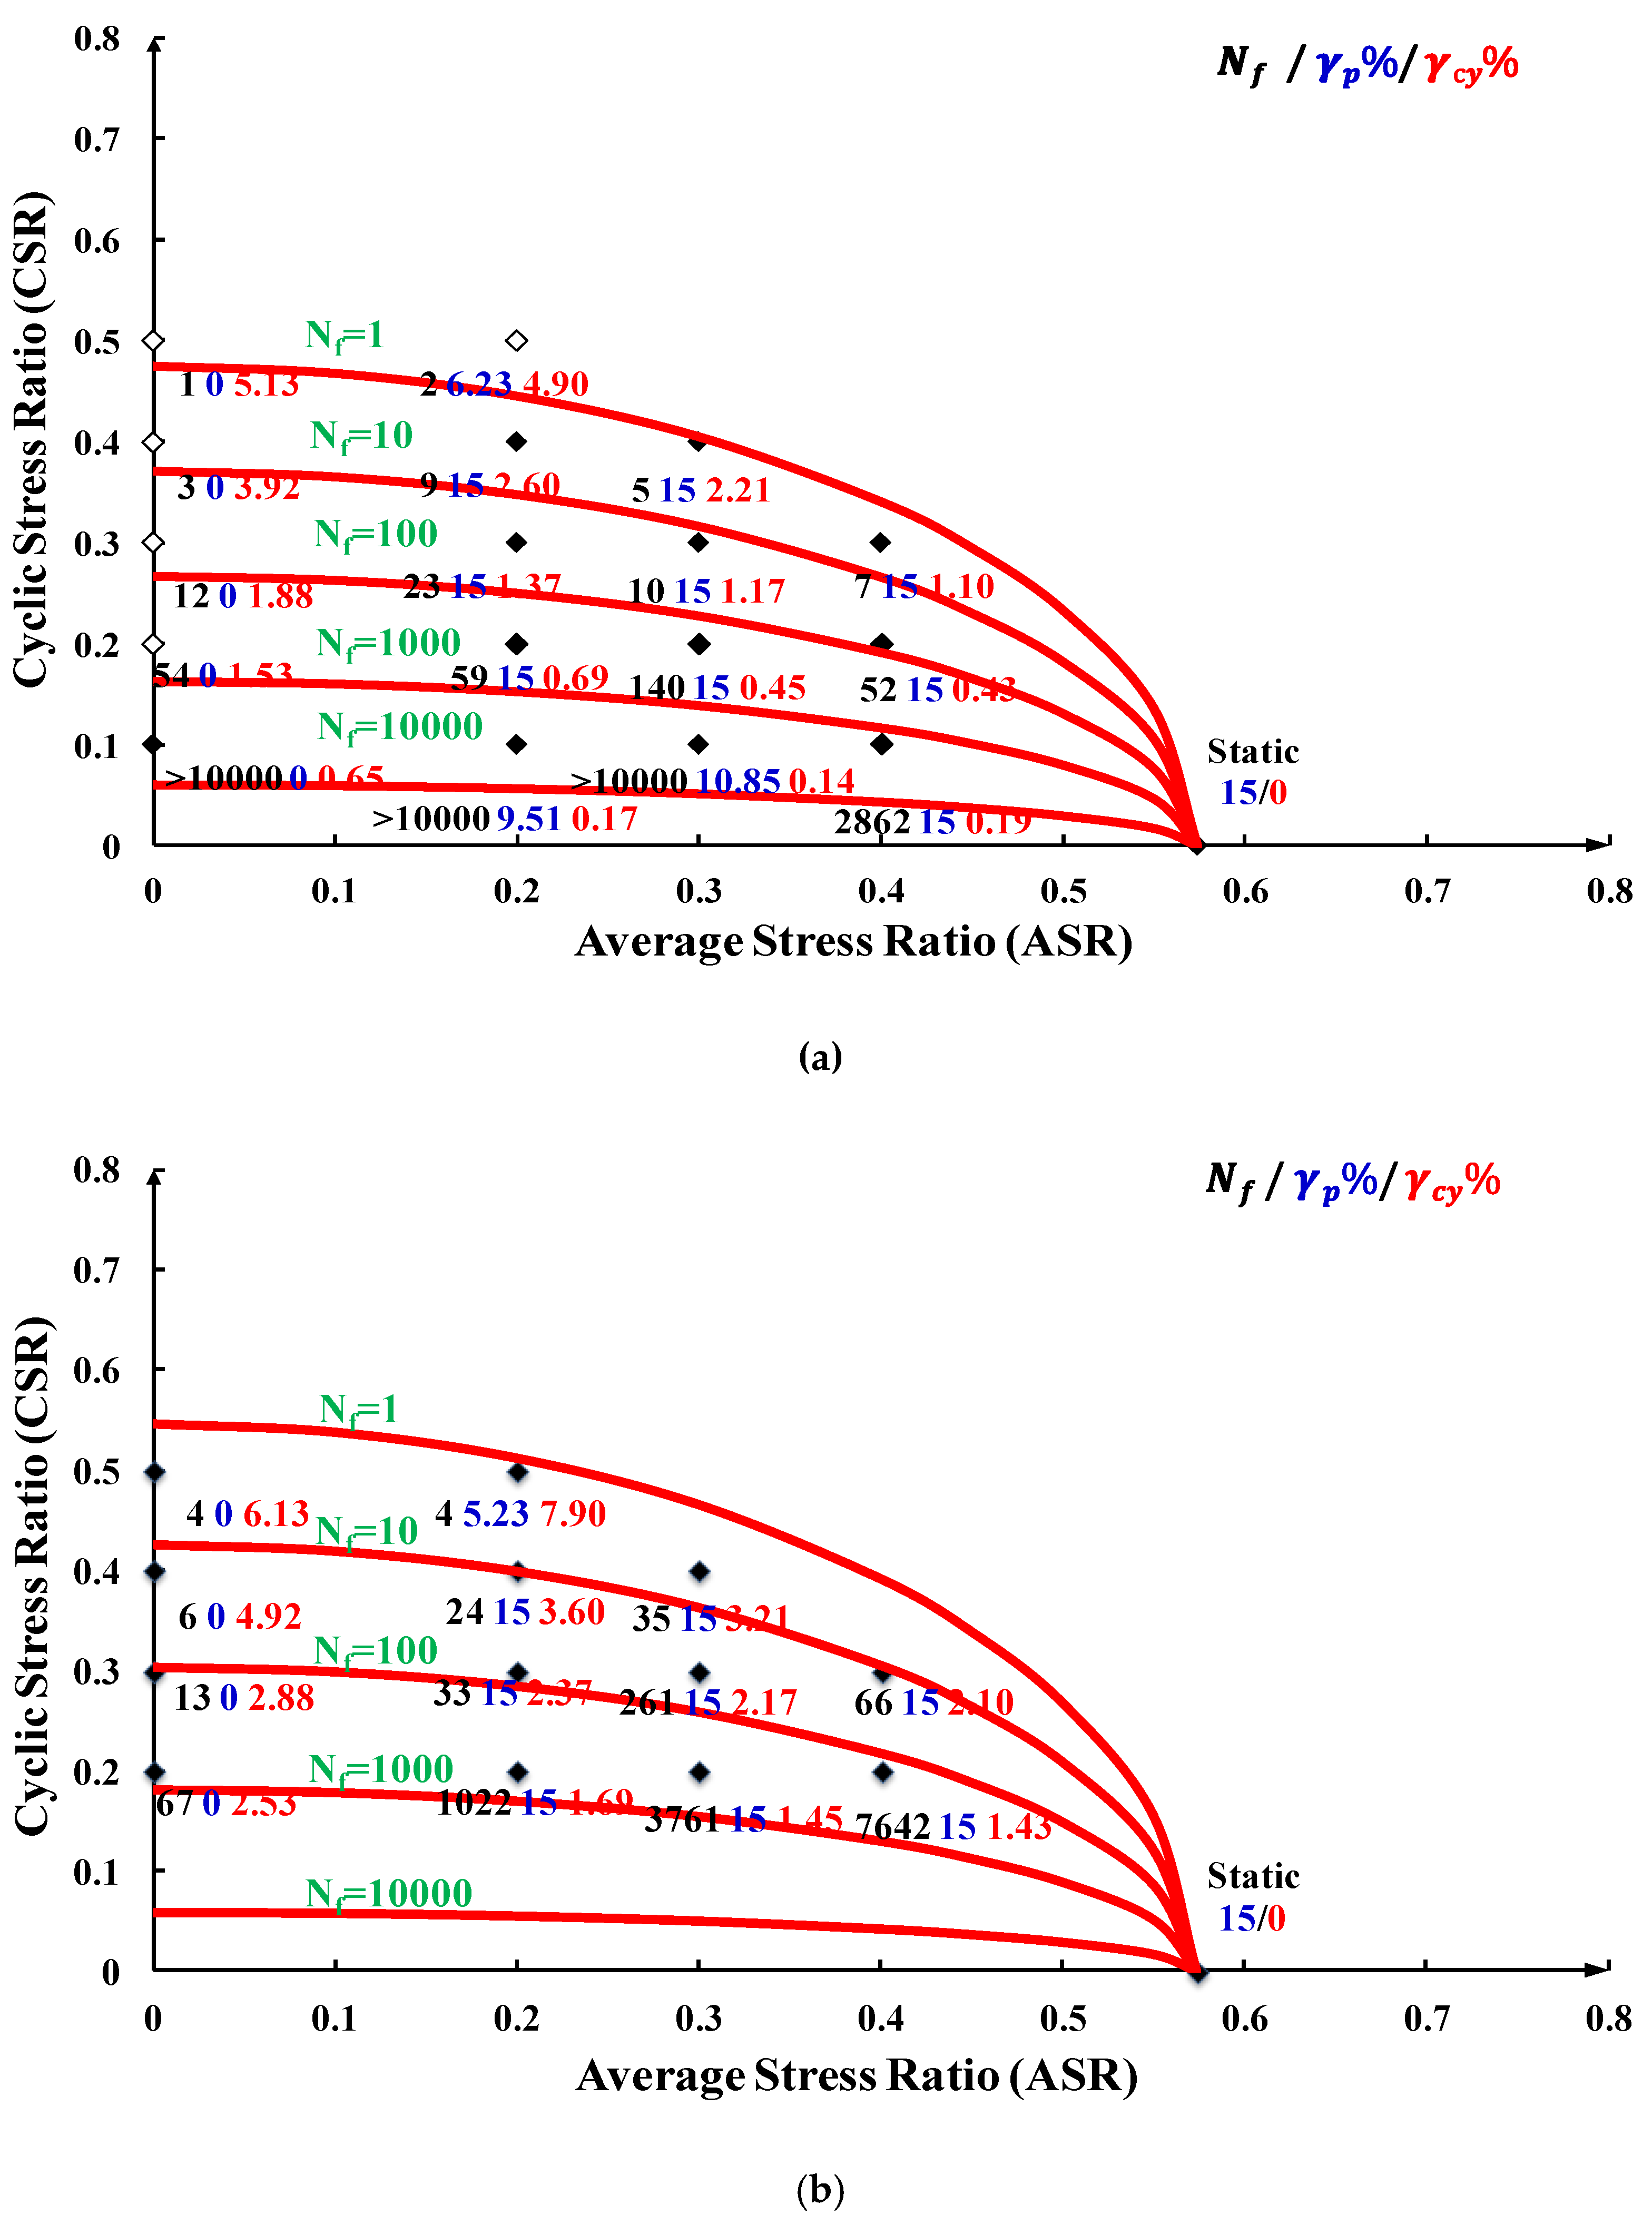
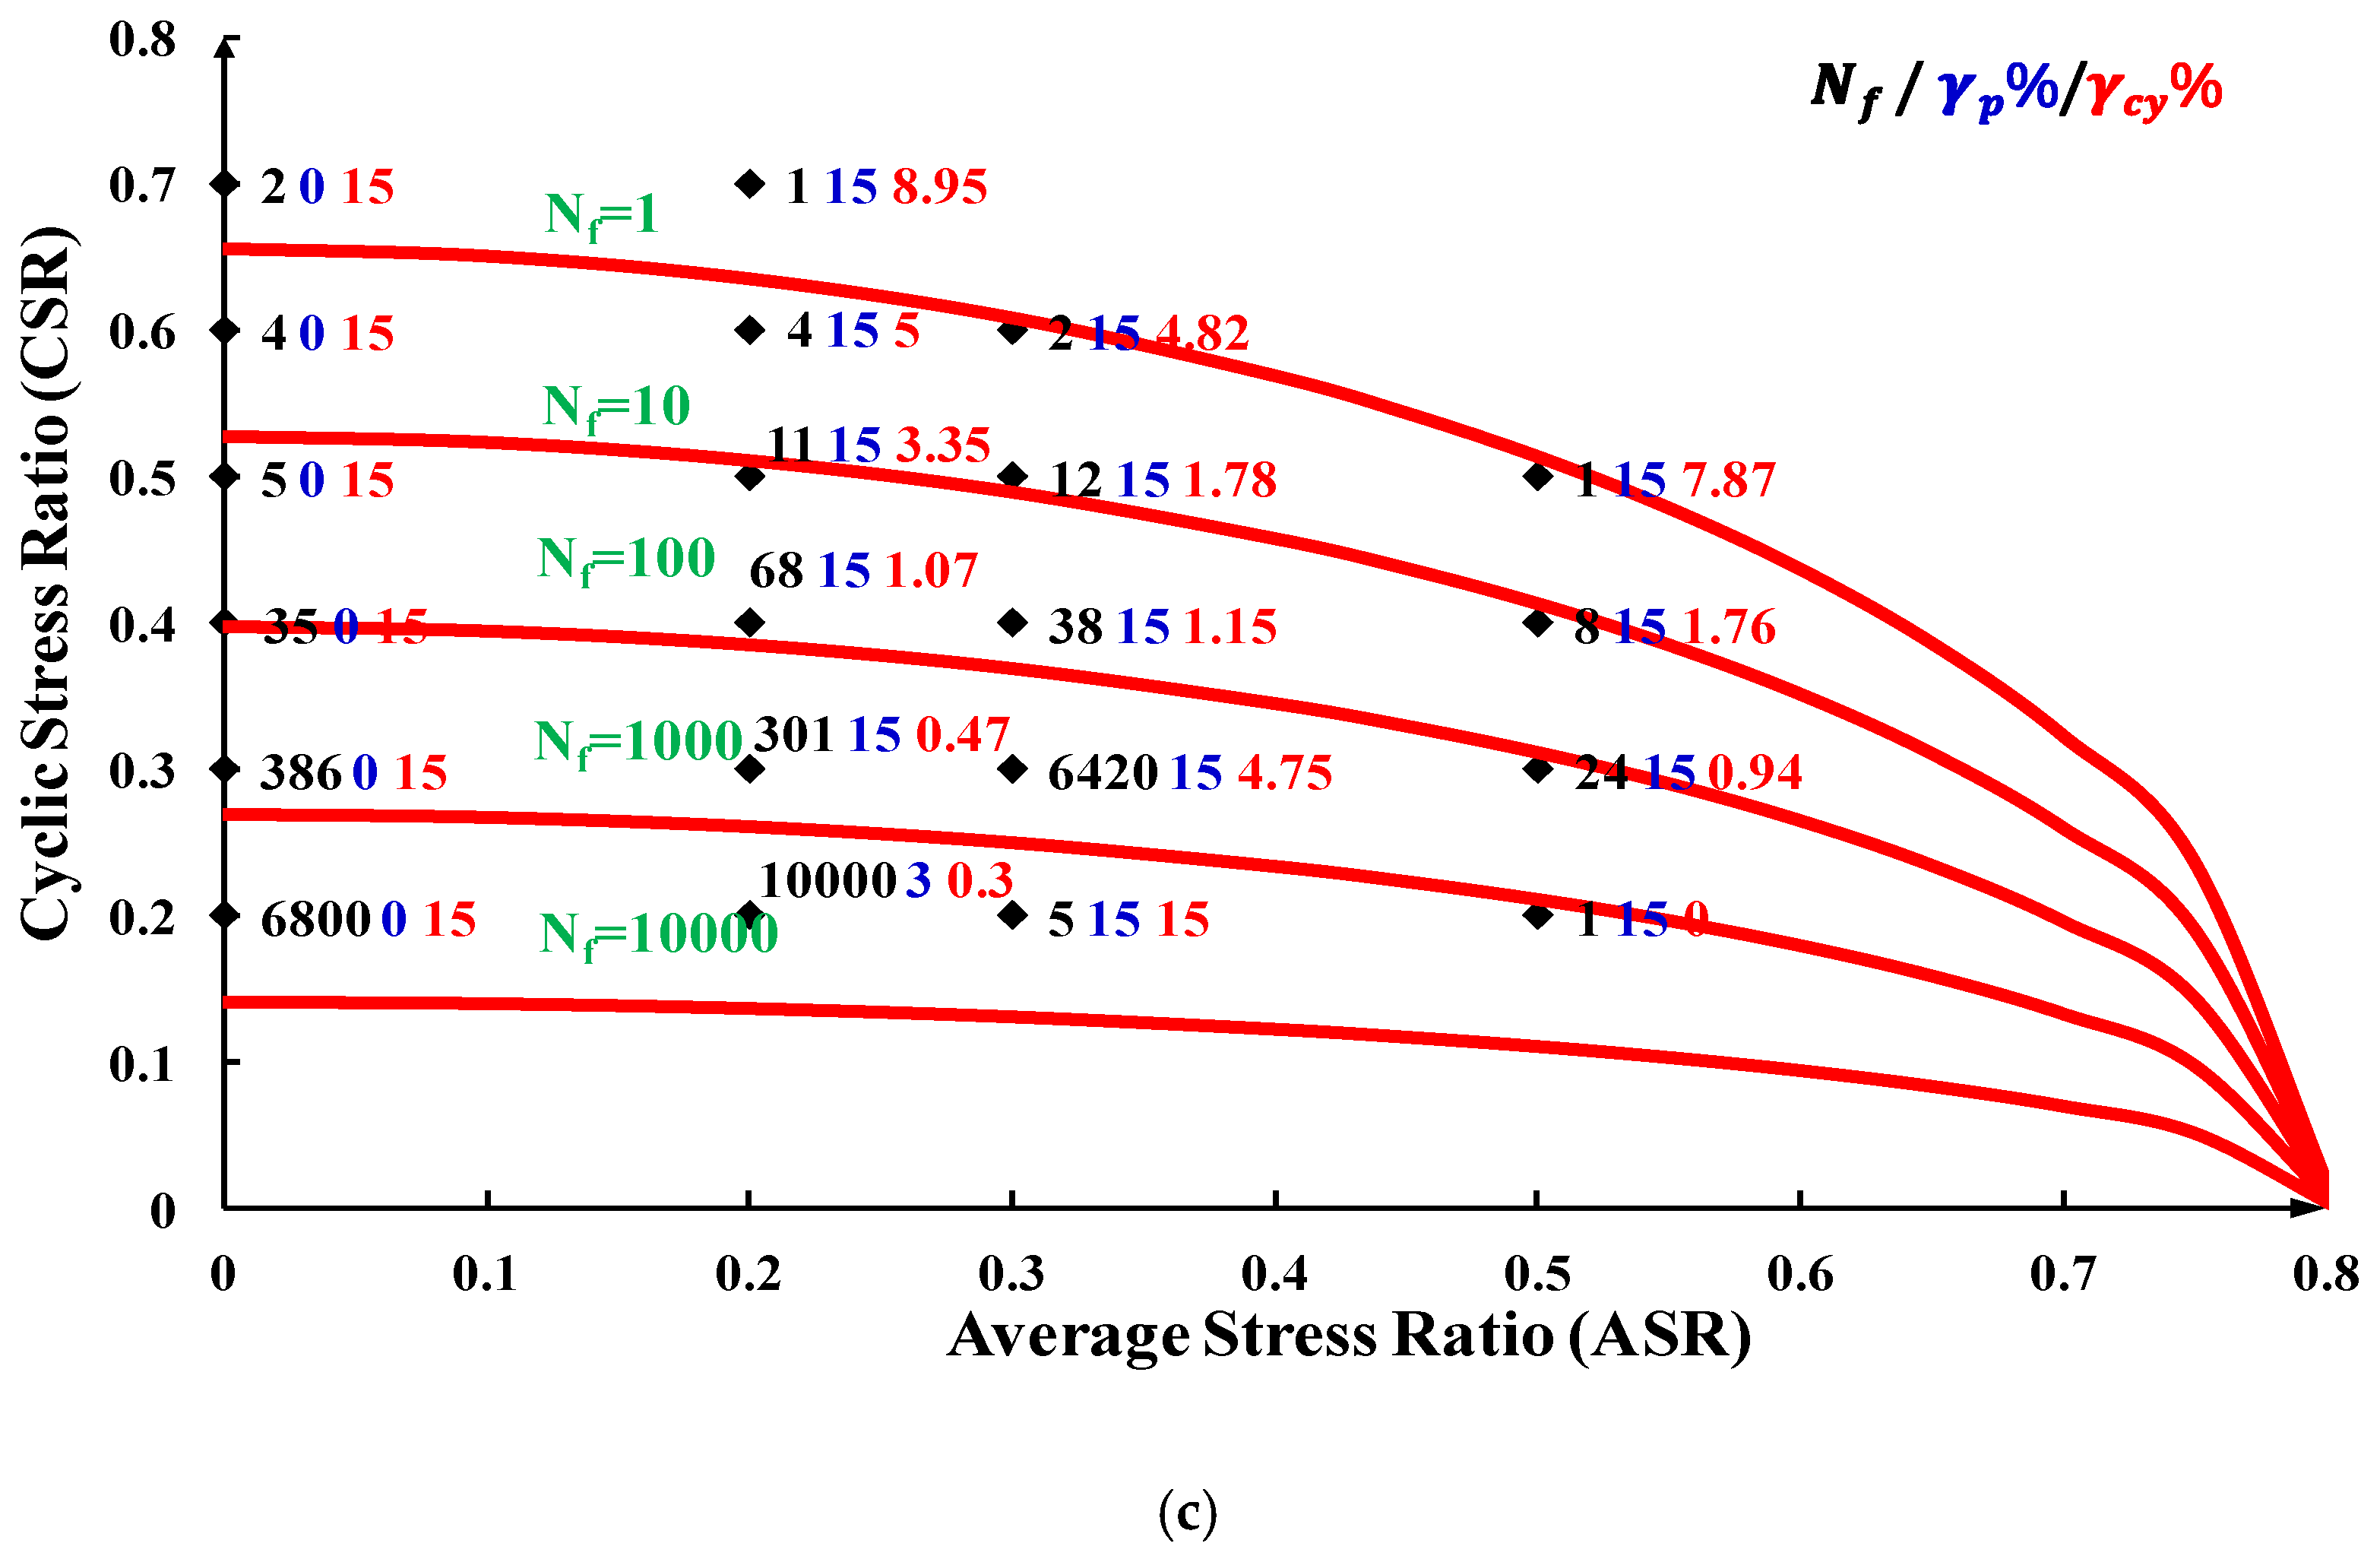
3.1. Design Graph

A design graph is a graph showing the failure diagram (stress ratio contour line following a stress ratio combination corresponding to the same number of cyclic loads) according to the stress condition using the number of cycles (Nf), the permanent shear strain (γp), and the cyclic shear strain (γcy) at failure. To create a design graph, a combination of the average and the cyclic shear stress ratios that achieve failure in more than 1–10,000 cycles is required. Figure 8 shows the criterion lines [21] created in three dimensions. When the design graph is drawn, it is possible to identify the failure line corresponding to the load of the structure and the dynamic load applied to the structure when designing the ground.

3.2. Design Graph Result

The design graph in Figure 9 was created using five failure curves. The starting point of each failure diagram is the result of the static test (static stress ratios of 0.574 and 0.803), which is the point at which the graph starts when the cyclic shear stress ratio is zero.
In the stress-based failure diagrams presented underground conditions with different relative densities, if the cyclic shear stress ratio or the average shear stress ratio increases while either the cyclic shear stress ratio or the average shear stress ratio is constant, the number of cyclic loads to achieve the failure criterion decreases. These failure curves tend to drift downward by 0.1–0.2 owing to the combined decrease of the cyclic shear stress ratio and the average shear stress ratio in loose sand rather than in dense sand. In addition, stress combinations that exhibit long-term cyclic behavior also tend to decrease in loose sand (CSR = 0.1) than in dense sand (CSR = 0.2). In dense ground, when the average shear stress ratio is close to zero, failure is mainly caused by cyclic shear deformation (based on 15% of the double amplitude shear strain), but when the average shear stress ratio increases and moves away from zero, it is mainly determined by permanent shear deformation rather than cyclic shear deformation, as shown in Figure 9c. This was reported in [29]. However, in Figure 9a,b which indicates a loose sandy ground condition, the failure pattern when the average shear stress ratio is close to zero shows that the pore water pressure increases before the cyclic shear strain reaches 15%, which achieves the required number of cycles to achieve failure. These results show that the effect of the relative density on the main failure elements, such as permanent and cyclic shear deformation, and failure curve phase is higher compared with that of the confining pressure.
In the case of loose sand, the higher the confining pressure under the same stress conditions, the higher the number of cycles to achieve failure. As the depth of the ground increases or the structure becomes heavier, the upper load applied to the ground increases. This is similar to increasing the confining pressure. The results show that the heavier the structure loaded on top, the higher the number of cycles to achieve failure and the greater the resistance to cyclic loading. The smaller the CSR and ASR values, the larger the Nf value, but the smaller the difference in Nf according to the confining pressure than the smaller Nf. This result shows that the influence of Nf and the confining pressure are inversely proportional. When the CSR and ASR values are large, the smaller the Nf value, and the larger the difference is due to the confining pressure.

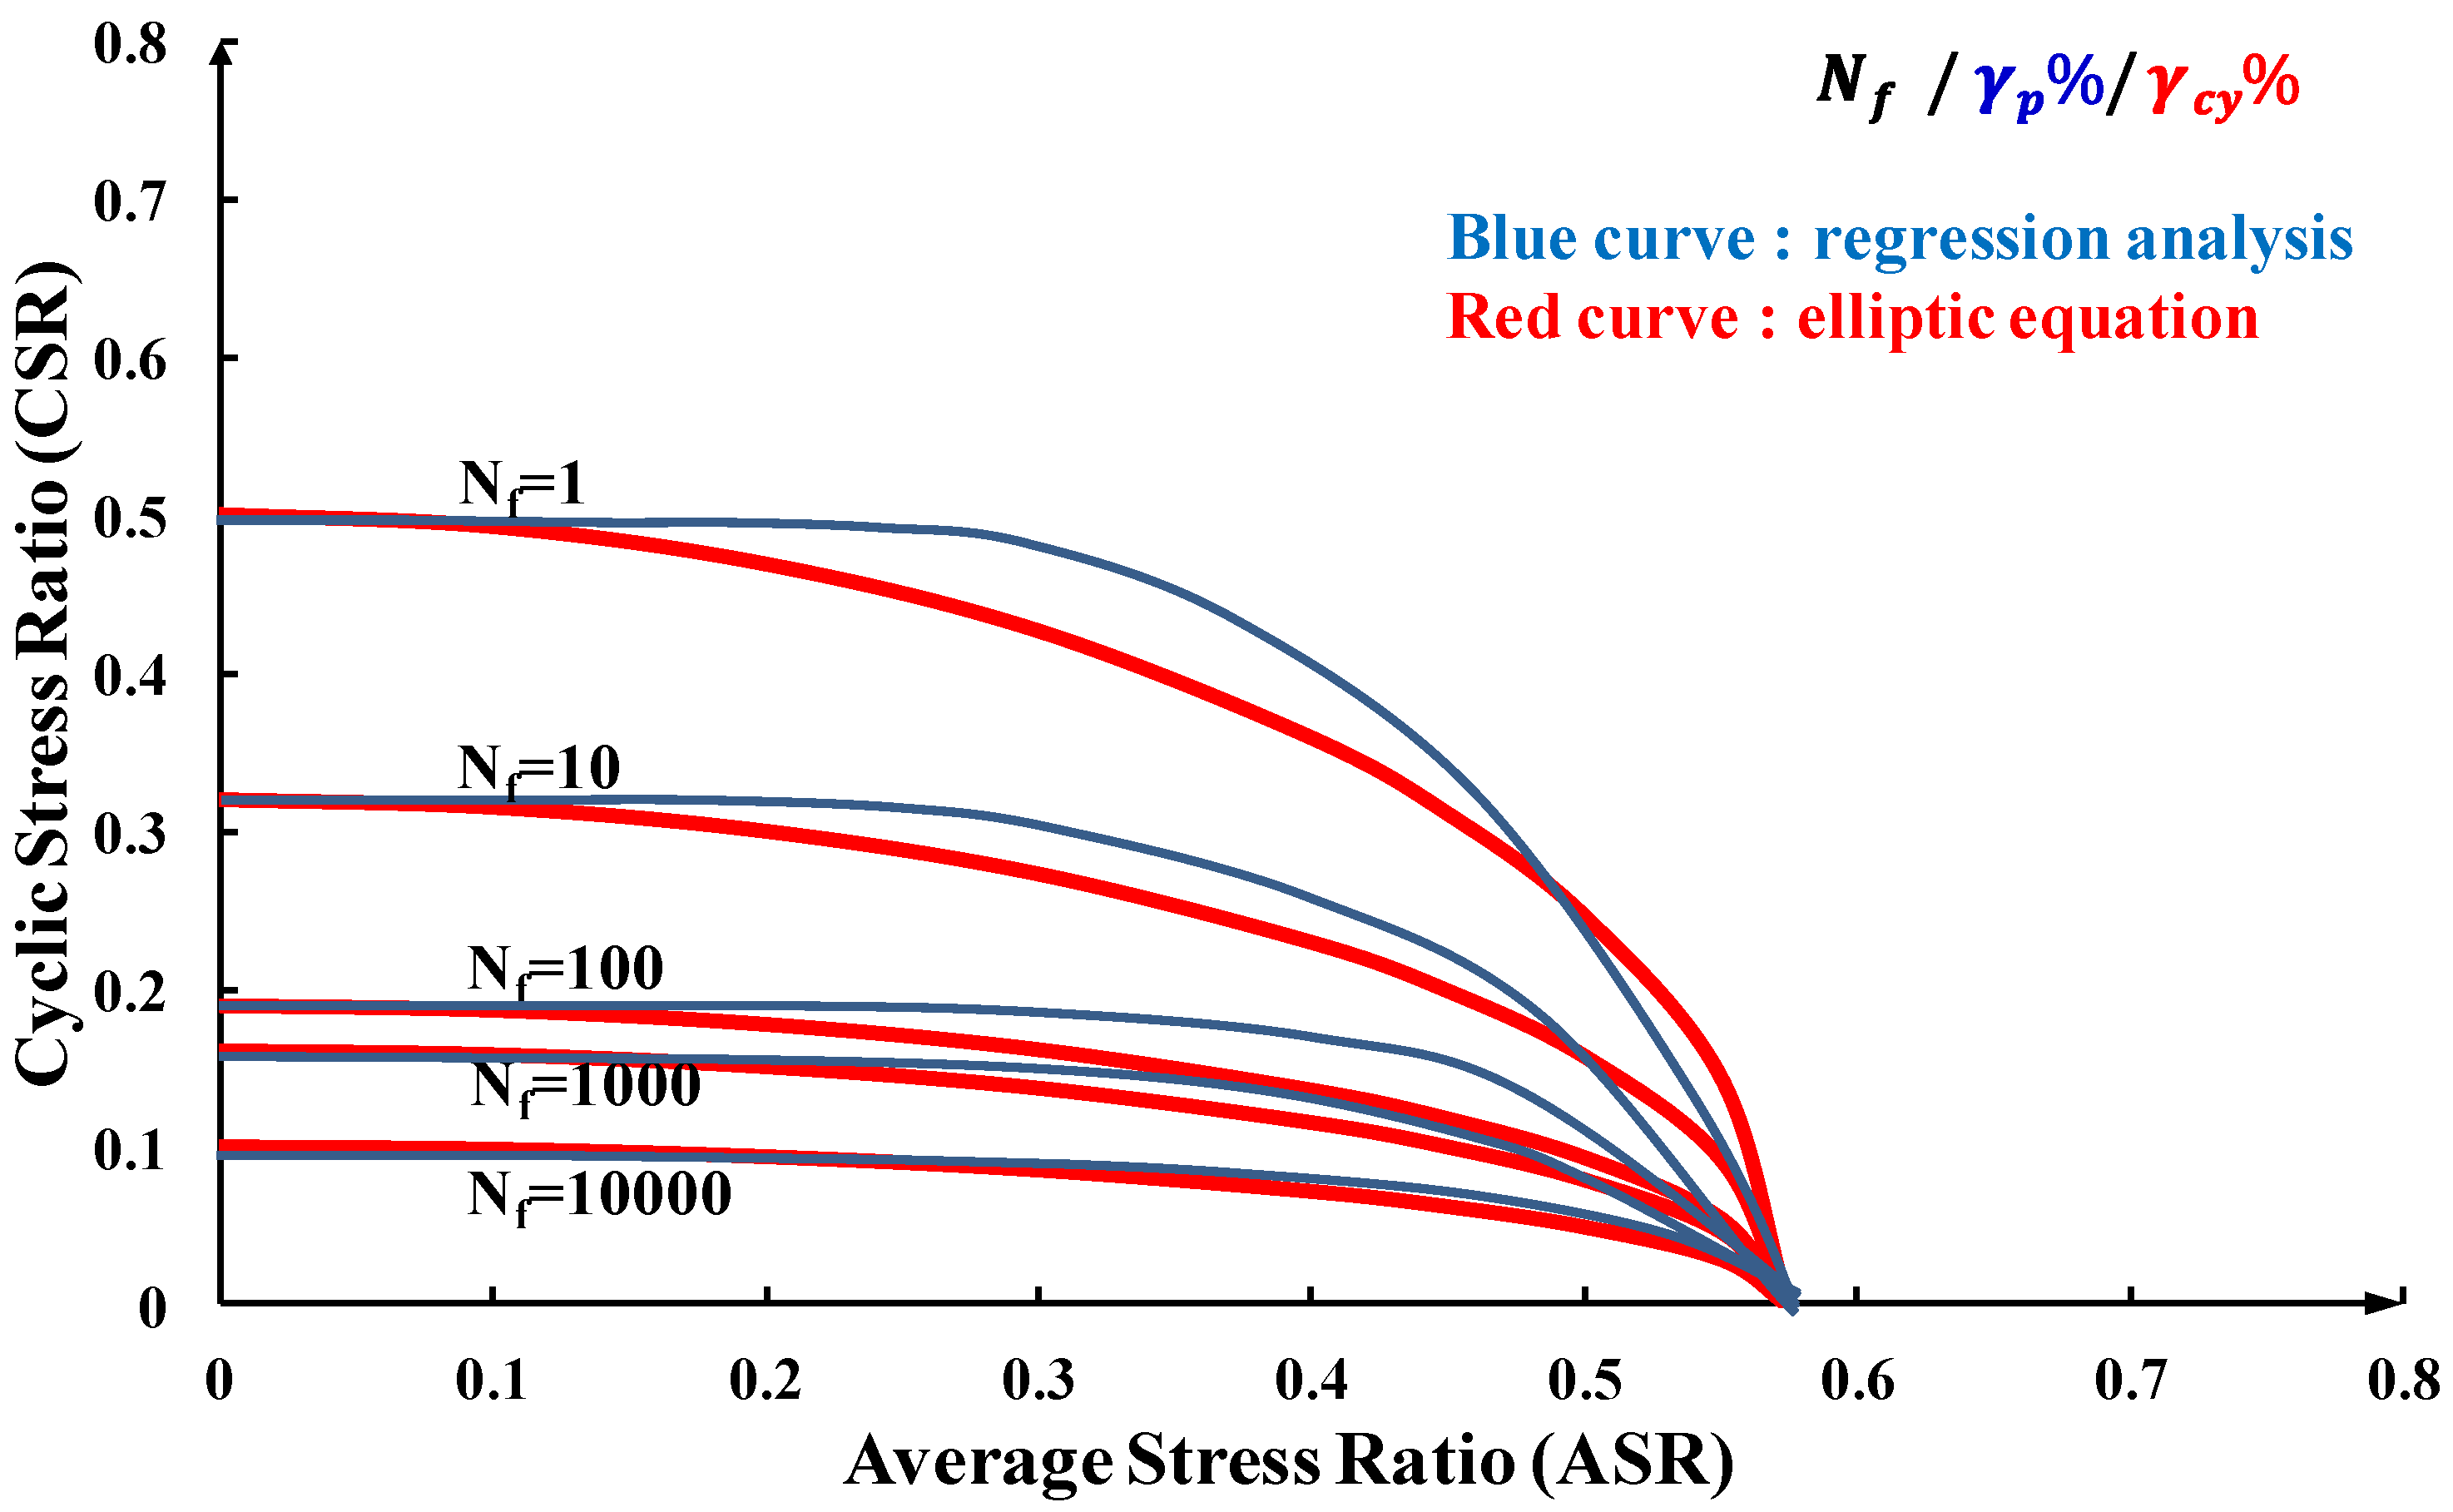
3.3. Proposed Drawing Technique of Design Failure Curve Model

Various shapes such as circles, ellipses, and hyperbolas were considered for the simple model of the design failure curve. Finally, an ellipse was selected and matched with the design graph as shown in Figure 10. As a result of the matching, the design curve is similar to an ellipse and hence can be expressed using an elliptic equation. An ellipse seemed to match better compared with a hyperbola as the latter cannot fix the ASR value when CSR = 0. The elliptic equation was converted to a relation between CSR and ASR, and the graph and equation of the relationship are shown in Figure 11.
The important parameters needed to create a design curve are (1) the ASR value when CSR = 0, which is obtained from the static test and (2) the trend line of CSR and Nf when ASR = 0 or 0.1. The design failure curve drawing technique can be summarized in five stages as follows based on the matching results.
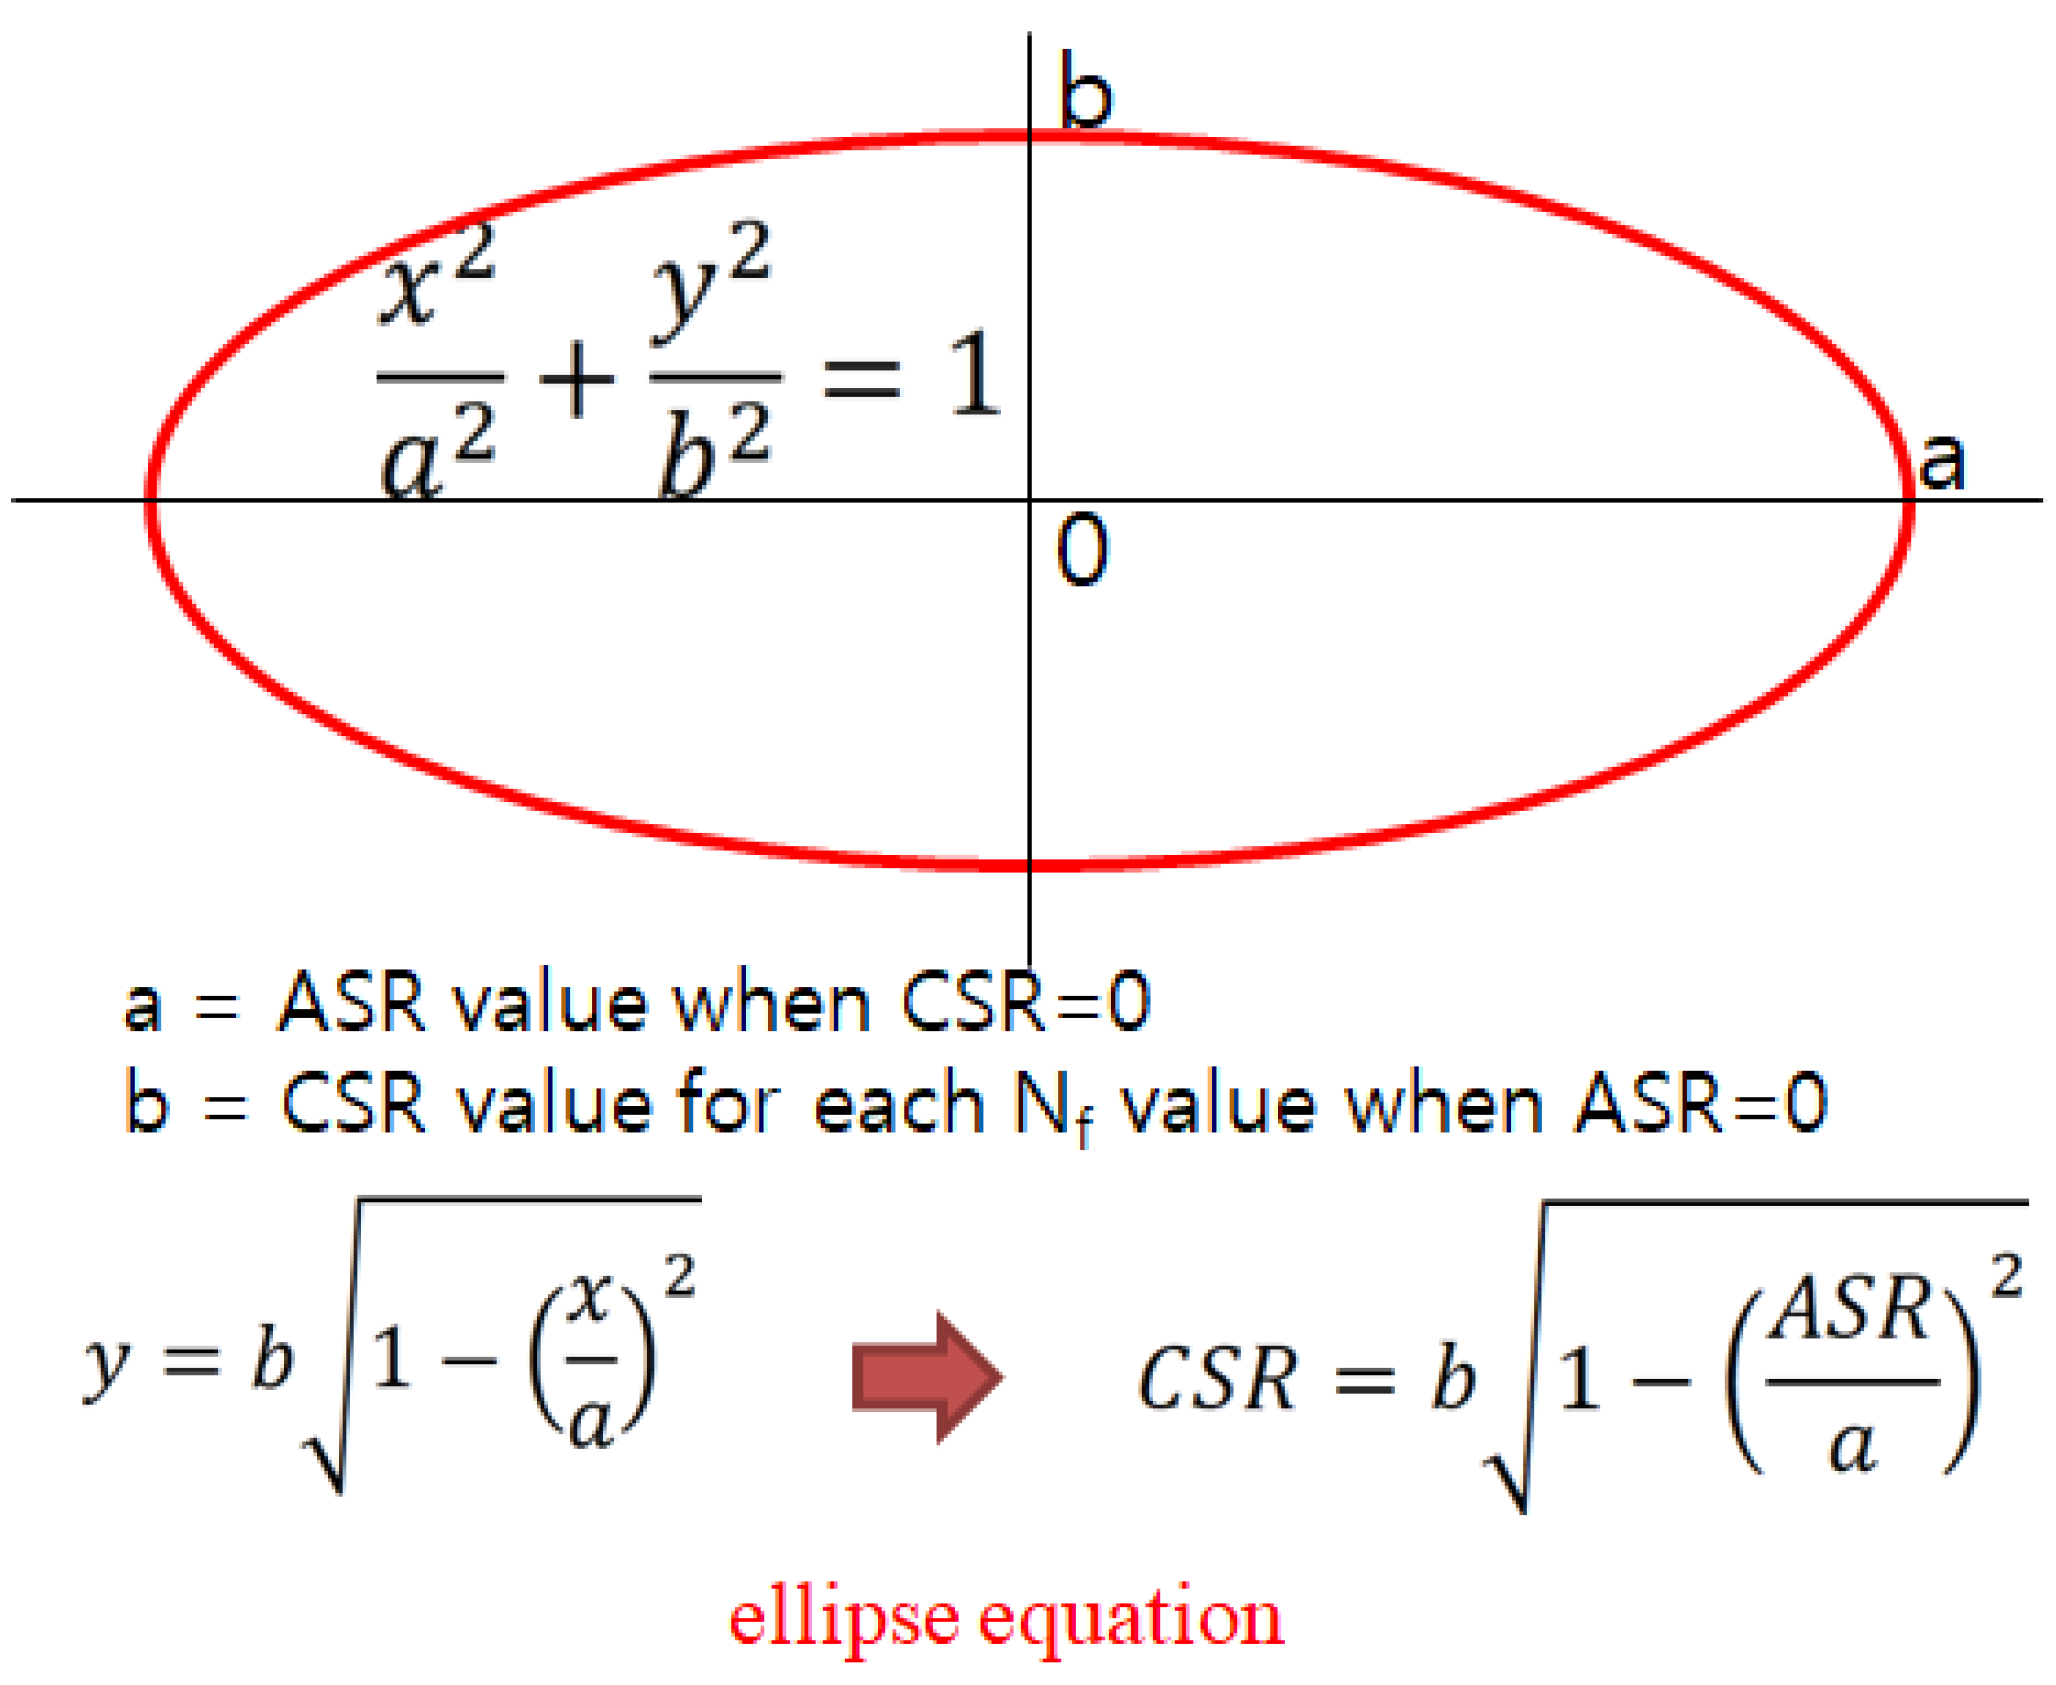
  • Conduct the static test. Obtain the ASR value when CSR = 0.
  • Conduct the cyclic test to obtain the CSR value when ASR = 0 or 0.1.
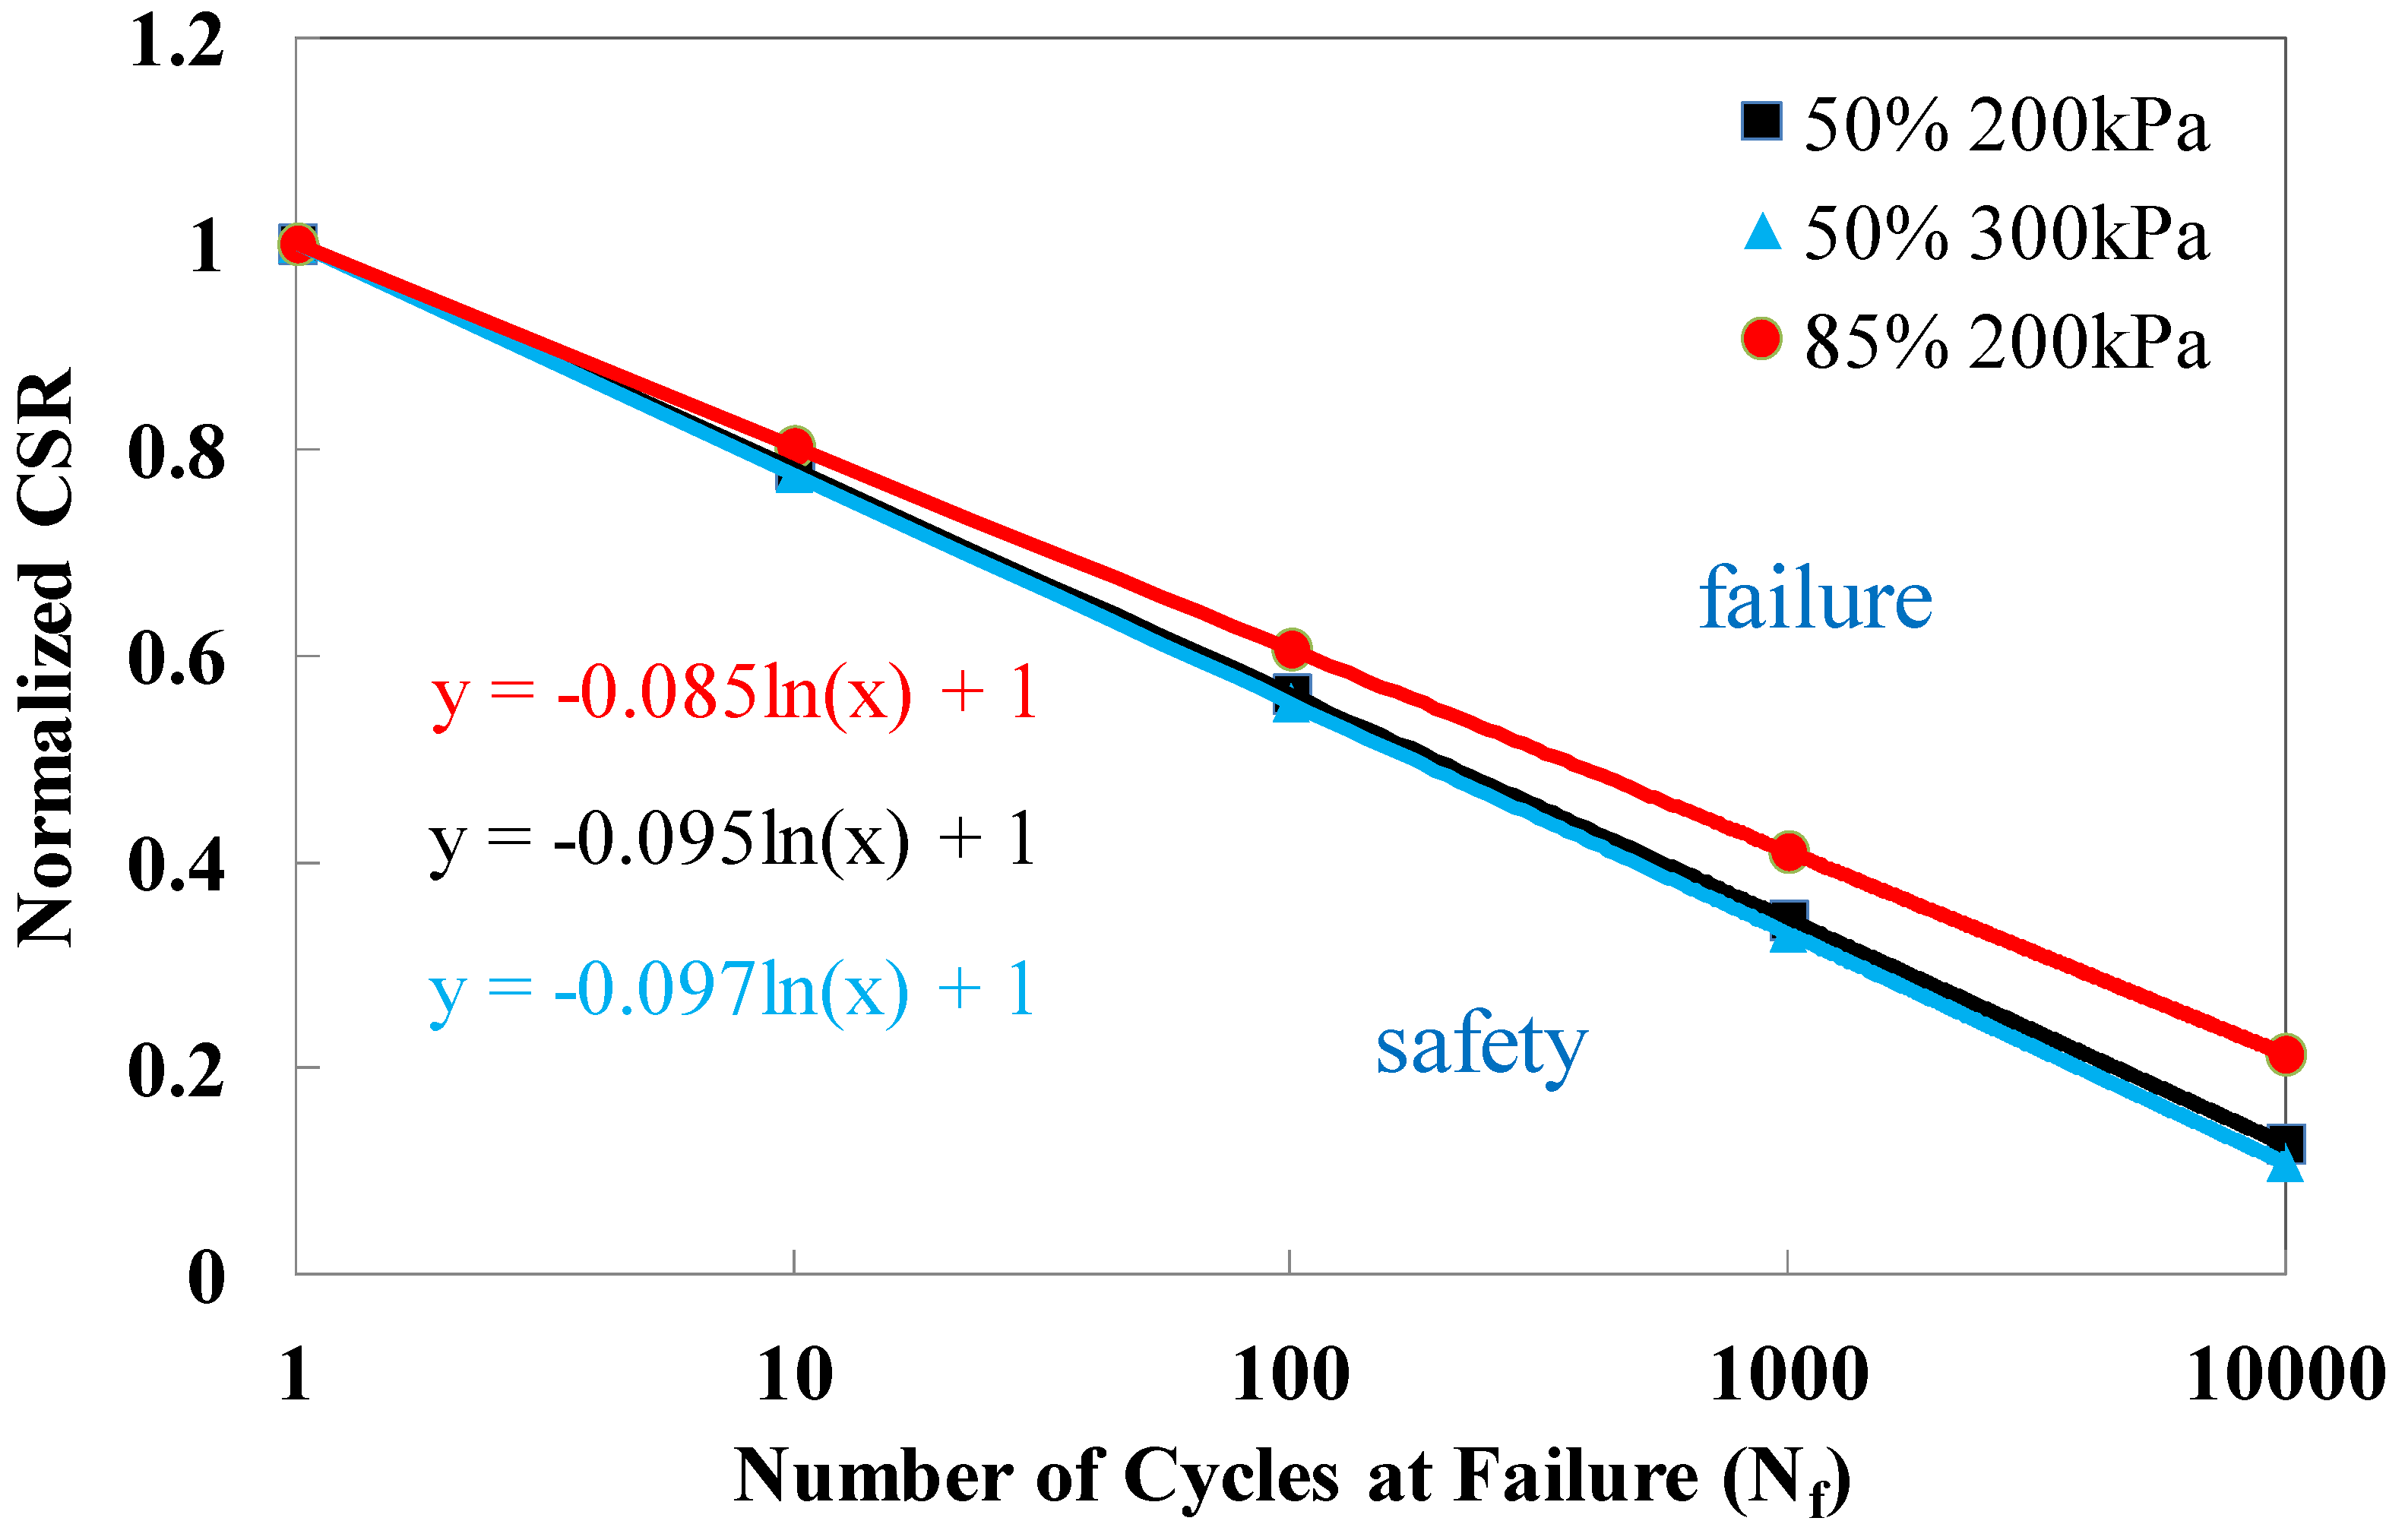
  • Plot the trend line between CSR and Nf when ASR = 0 or 0.1, obtained from step 2.
  • Using the trend line in step 3, calculate the CSR value for each Nf value when ASR = 0 (Nf = 1, 10, 100, 1000, 10,000).
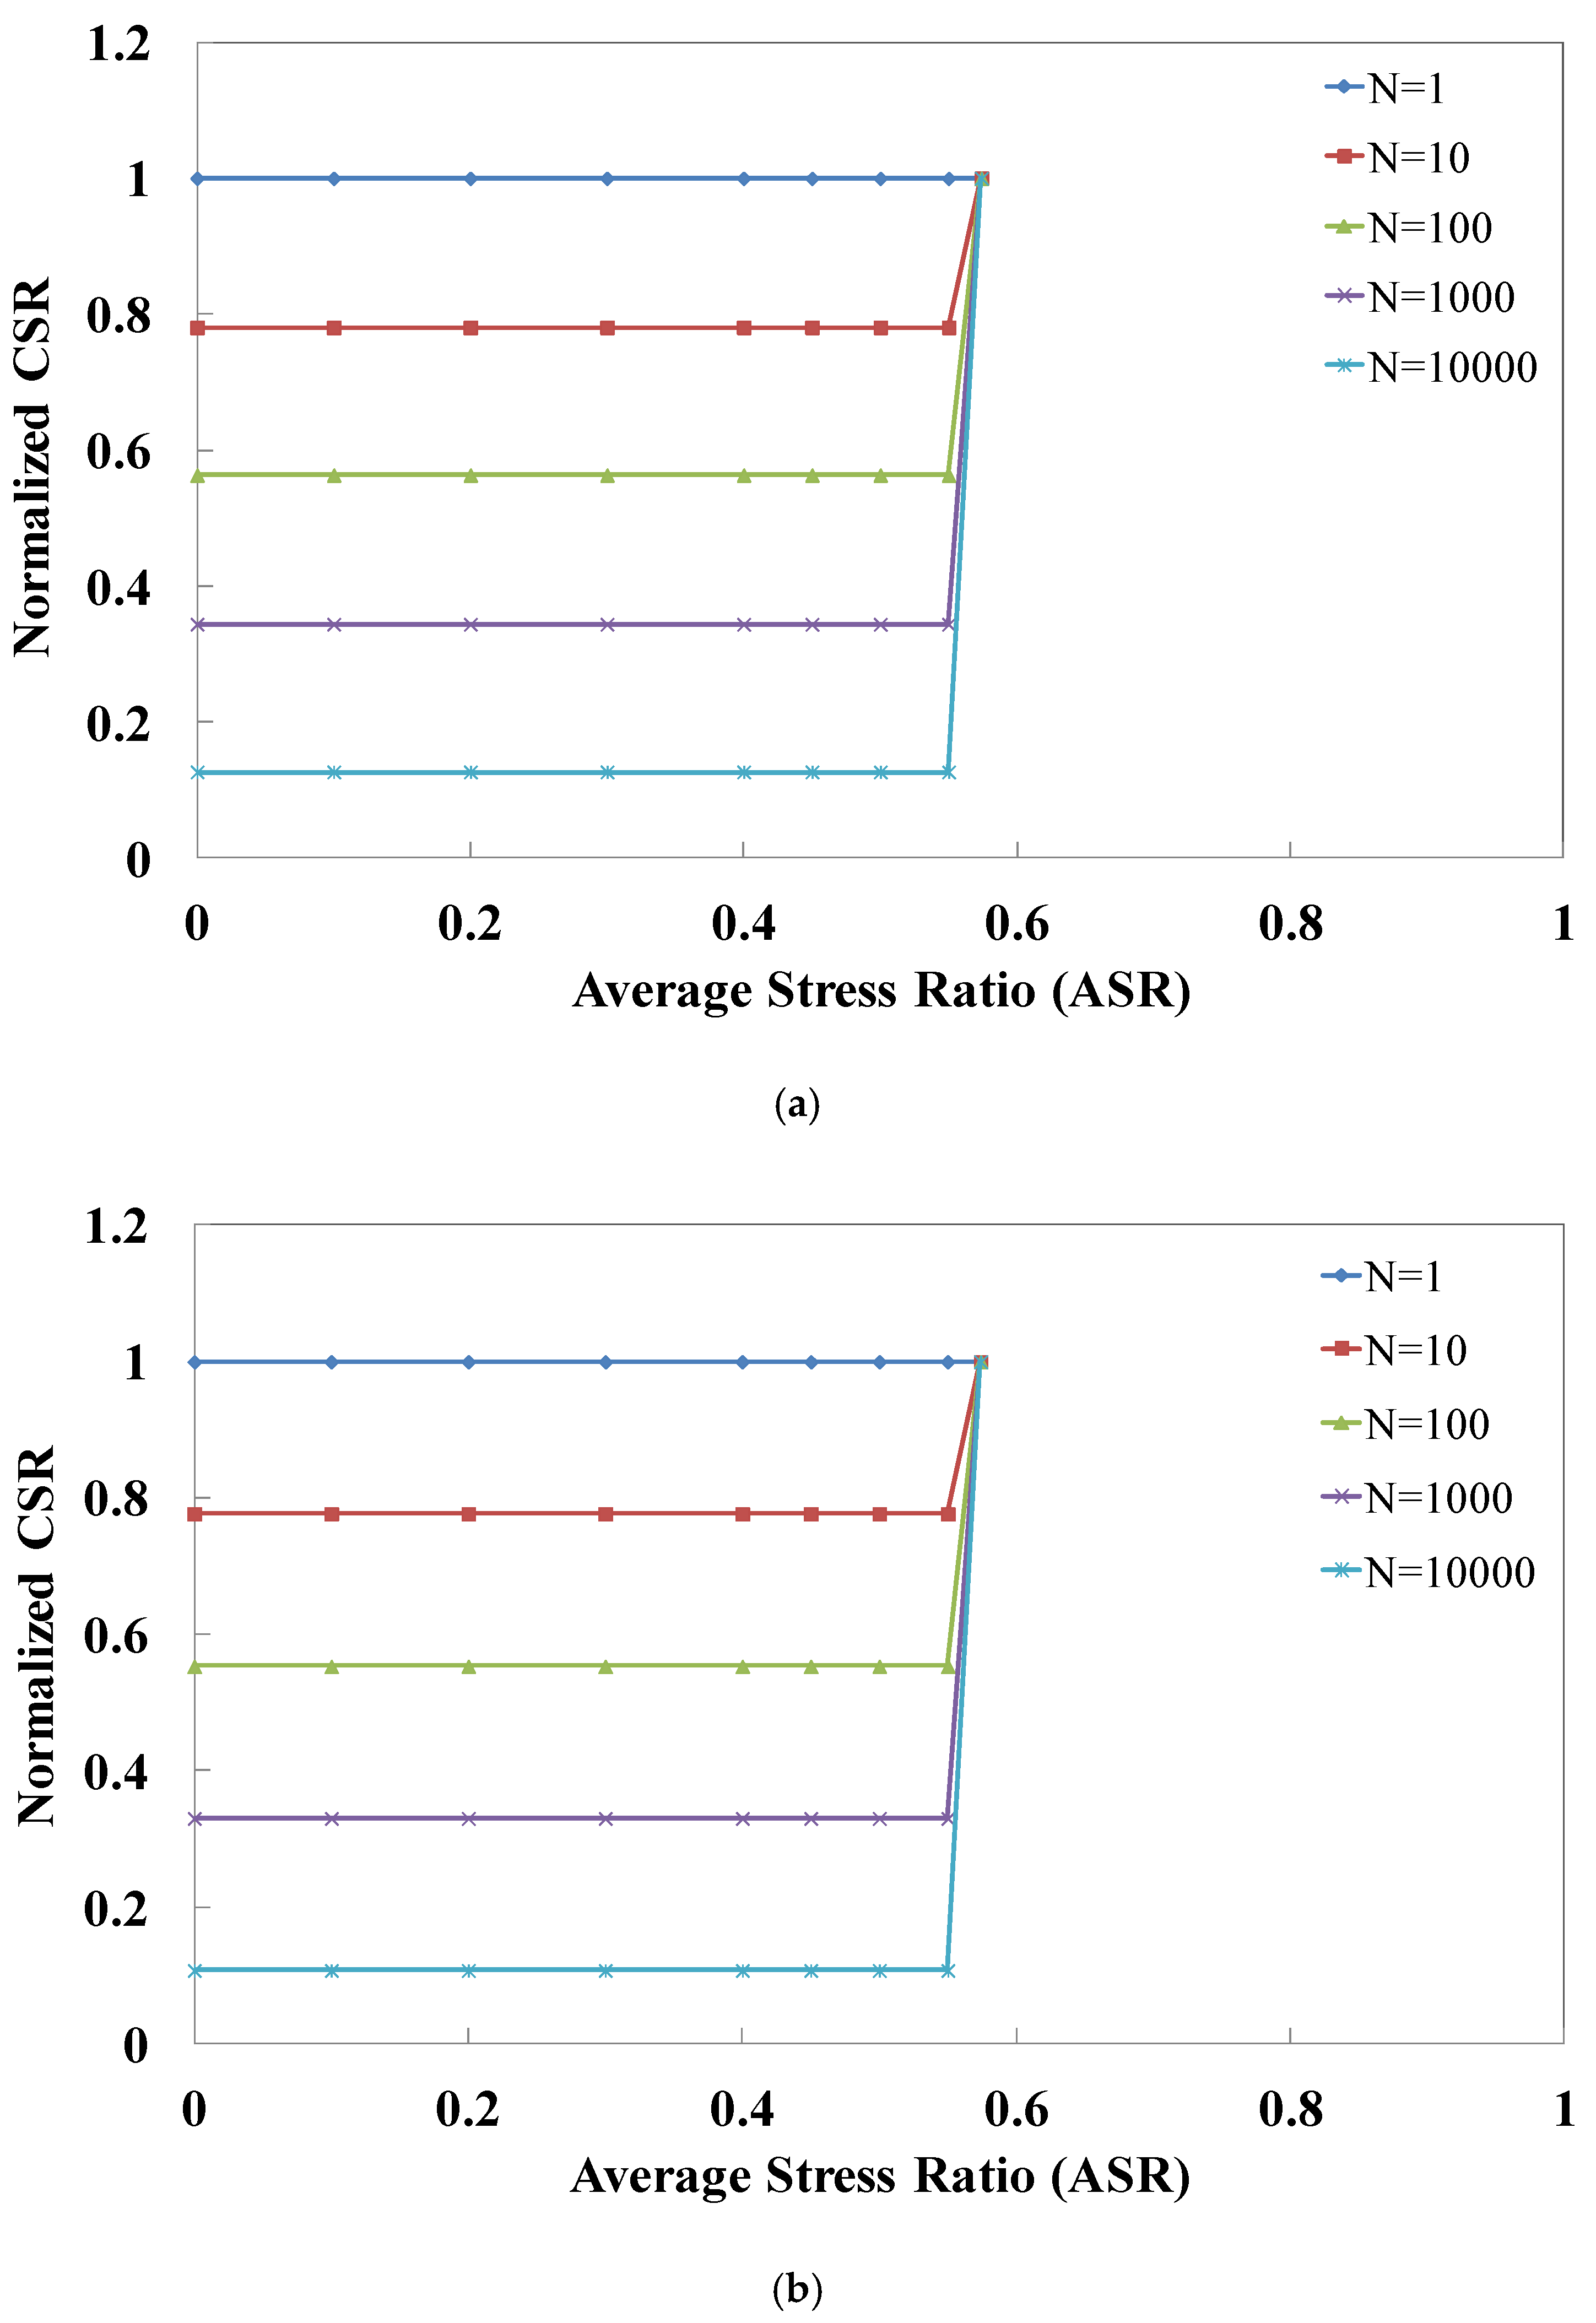
  • Create the graph by applying the elliptic equation parameters ‘a’ (ASR value when CSR = 0) and ‘b’ (CSR value for each Nf value when ASR = 0).
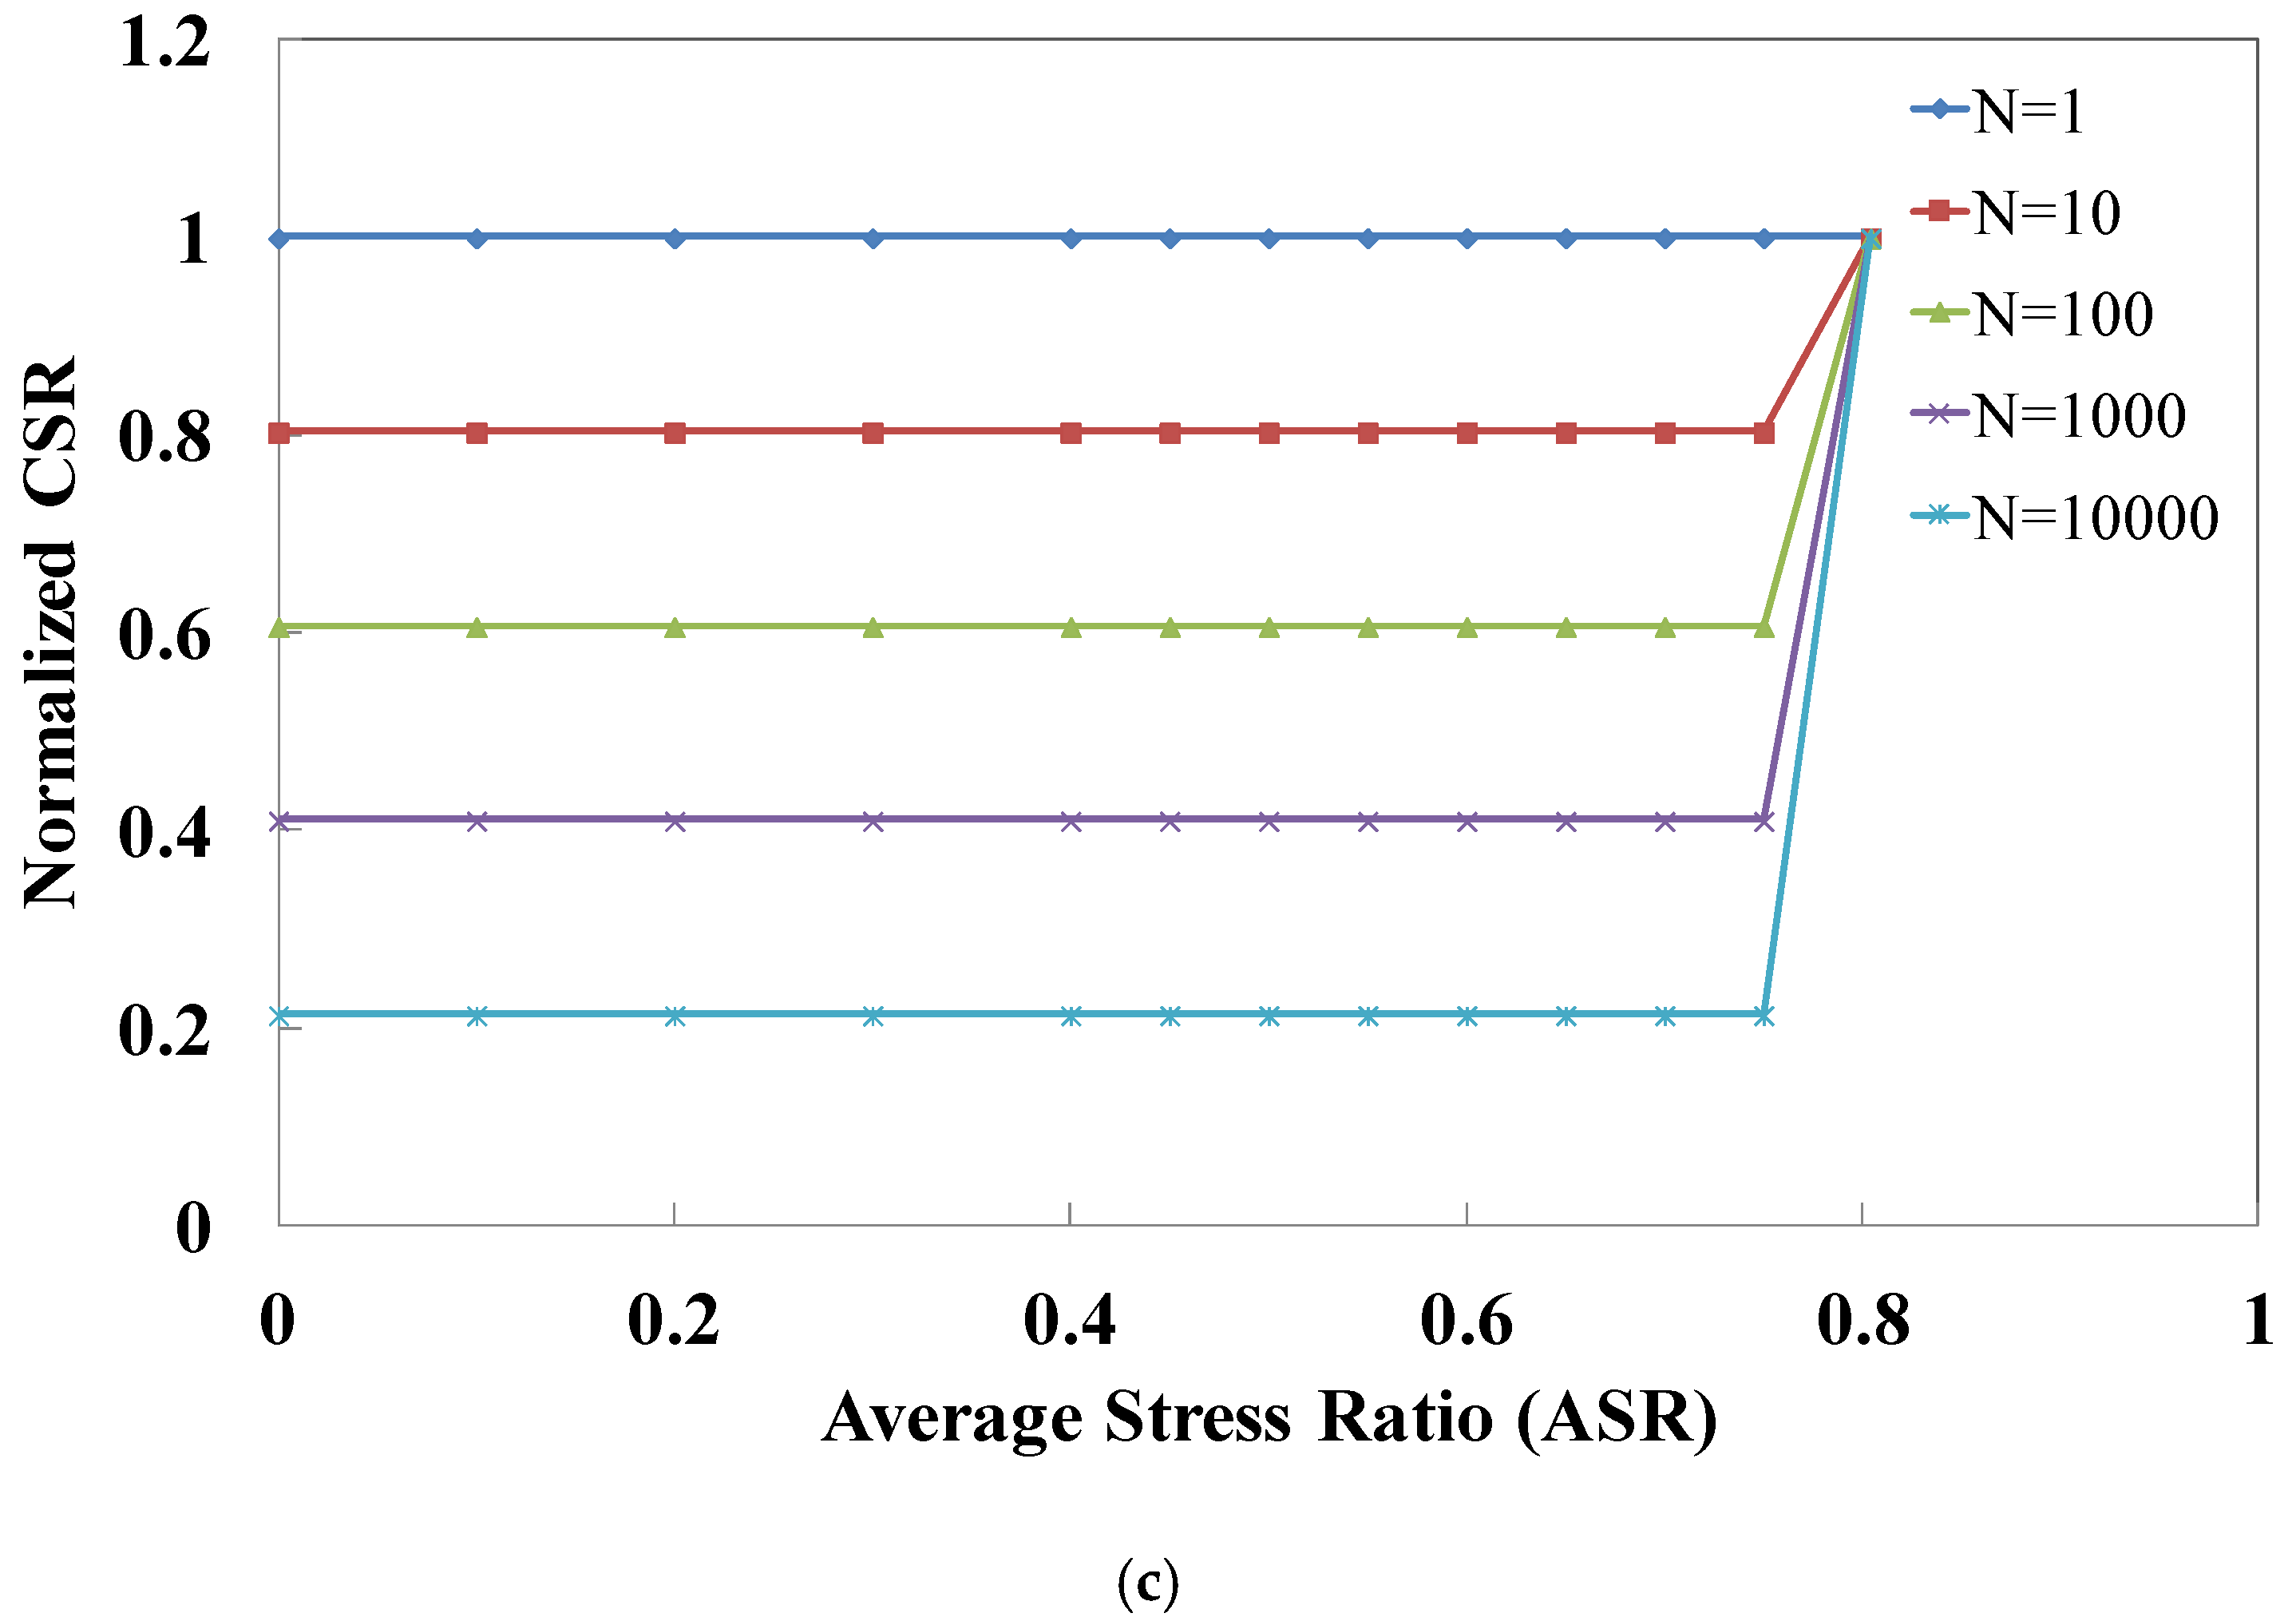
Figure 12 shows a graph based on the proposed technique. The proposed model curve with similar ASR values shows a lower CSR than the regression analysis curve, indicating a conservative design method. The larger the confining pressure or relative density, the larger the safety zone obtained for the design failure curves. If a conservative design approach is not needed, a graph of ‘b’ can be created directly without obtaining the trend line in Step 3. However, as the number of cycles increases, the design failure curve follows the trend line, and the behavior of the ground around offshore structures is more important in the long-term than in the short-term. Therefore, the proposed design failure curve drawing technique using a conservative design approach is more appropriate.

3.4. Normalized CSR

Figure 13 shows a graph of the normalized CSR and Nf. Here, the normalized CSR is obtained by dividing the CSR at various Nf values by the CSR at Nf = 1(normalized CSR = CSRNf/CSRN1), where Nf is the number of cycles to achieve failure. The graph classifies the safety area according to the cyclic load. The area under the straight line in the graph is the safety zone, whereas the area above the straight line is the failure zone. The area above the line indicates stress that cannot achieved in soils, and failure occurs along the line. The graph also has the advantage of distinguishing safety or failure through the CSR based on Nf. The slope of the graph is the magnitude change of the CSR with respect to Nf. The larger the slope, the smaller the safety zone area at an increasing number of cycles. Figure 13 shows that the slope at a relative density of 50% is greater than that at a relative density of 85%. This shows that the smaller the relative density, the smaller the slope and the smaller the size of the safety zone. The larger the slope, the smaller the normalized CSR reaches to the failure. A comparison of the two cases with different confining pressures at the same relative density indicates that the larger the confining pressure, the larger the slope. The reason for this is that as the relative density decreases or the confining pressure increases, the compactness of the specimen decreases, which affects the safety zone area. This can be confirmed by the compactness of the specimens classified based on the critical state line.
From the value of the slope, it can be deduced that the relative density has a greater effect on the slope than the confining pressure, as the relative density is more sensitive to slope than the confining pressure. To confirm this sensitivity numerically, we formulated simultaneous equations as follows.
ax1 + bx2 + c = y1
ax1 + bx2 + c = y2
ax1 + bx2 + c = y3
where x1 is the relative density, x2 is the confining pressure, yi is the slope of the equation, and a, b, and c are parameters.
This equation can be expressed as follows:
85a + 200b + c = −0.085
50a + 200b + c = −0.095
50a + 300b + c = −0.097.
Thus, the sensitivity indexes for each parameter in the simultaneous equations were obtained. We found that a = 2.9 × 10⁻⁴, b = −2 × 10⁻⁵, and c = −0.105286. The parameters ‘a’ and ‘b’ corresponding to the relative density and the confining pressure were compared. It can be observed that ‘a’ is larger than ‘b’. A small sensitivity index may have been obtained as the confining pressure is large and in multiples of 100. Also, the sensitivity was calculated by changing 200 kPa to 20 and 300 kPa to 30, but the value ‘b’ was smaller than ‘a’ with ‘b = −2 × 10⁻⁴‘. This shows that the relative density is more sensitive to the slope of the CSR graph than the confining pressure. In other words, the relative density has a greater effect on the slope than the confining pressure. Combining these results, it can be inferred that the larger the relative density or the smaller the confining pressure, the wider the slope and the safety zone area.
Figure 14 shows the normalized CSR with ASR. It can be observed from the graph that the normalized CSR is constant with variations in the value of ASR. This means that ASR has no effect on the normalized CSR.

4. Conclusions

This study proposed a two-dimensional simplified method based on a design graph created using a CDSS experiment and analyzes the sensitivity of the relative density and the confining pressure. The main conclusions of the study are as follows.
(1) According to the analysis results of the relative density, the failure curves tend to drift downward by 0.1–0.2 owing to the combined decrease of the cyclic shear stress ratio and the average shear stress ratio decreasing more in loose sand than in dense sand. In addition, stress combinations that exhibit long-term cyclic behavior also tend to decrease more in loose sand (CSR = 0.1) than in dense sand (CSR = 0.2).
(2) According to the analysis results of the confining pressure, the greater the confining pressures under the same stress conditions in loose sand, the greater the number of cycles to achieve failure. The smaller the CSR and ASR values, the larger the Nf, but the smaller the difference in Nf according to the confining pressure than the smaller Nf. This indicates that the influence of Nf and the confining pressure are inversely proportional. When the CSR and ASR values are large, the smaller the Nf and the larger the difference in Nf with respect to the restraining pressure.
(3) The normalized CSR graph to distinguish safety or failure was presented. The slope of the graph indicates the magnitude change of CSR with respect to Nf. The larger the slope, the smaller the safety zone area as the number of cycles increases. Analysis results of the graph and the sensitivity indicate that the relative density has a greater effect on the slope than the confining pressure.
(4) In this study, we proposed a drawing technique that considers various shapes to easily draw two-dimensional design graphs. The elliptic equation graph achieved the best match to the design failure curve, and the design failure curve drawing technique was summarized in five stages. The proposed technique is expected to reduce the time required to create a design graph in the future.
(5) In this study, the sensitivity of the relative density and the confining pressure was analyzed. The effect of the relative density on the design failure curve was higher compared with that of the confining pressure. However, it is expected that the reliability of the sensitivity analysis will be higher if the latter is performed using more relative density and confining pressure conditions. In addition, this study proposed a 2D design curve creation technique. However, we are currently conducting research on a 3D design curve creation technique.

Author Contributions

Conceptualization and methodology, S.-W.S. and J.M.K.; investigation and analysis, S.-W.S. and J.-C.Y.; writing—original draft preparation, S.-W.S.; writing—review and editing, J.-M.K., J.-C.Y., and S.-W.S.; supervision, J.-M.K. All authors have read and agreed to the published version of the manuscript.

Funding

This research received funding as described in Acknowledgments.

Acknowledgments

This paper was financially supported by the National Research Foundation of Korea (NRF-2017R1A2B4010201 and NRF-2019R1I1A1A01060584) and the Ministry of the Interior and Safety as Earthquake Disaster Prevention Human resource development Project.

Conflicts of Interest

The authors declare no conflict of interest.

References

  1. Randolph, M.; Gourvenec, S. Offshore Geotechnical Engineering; Spon Press/Taylor & Francis Group: New York, NY, USA, 2011. [Google Scholar]
  2. Newlin, J.A. Suction Anchor Piles for the Na Kita FDS Mooring System, Part 1: Site Characterization and Design. In Deepwater Mooring Systems: Ceoncepts, Design, Analysis, and Materials; ASCE: Houston, TX, USA, 2003; pp. 28–54. [Google Scholar] [CrossRef]
  3. United Nations. Kyoto Protocol to the United Nations Framework Convention on Climate Change. 1998. Available online: https://unfccc.int/resource/docs/convkp/kpeng.pdf (accessed on 24 December 2019).
  4. Lee, K.; Seed, H.B. Dynamic strength of anisotropically consolidated sand. J. Soil Mech. Found. Div. 1967, 93, 169–190. [Google Scholar]
  5. Finn, W.D.L.; Vaid, Y.P. Liquefaction Potential from Drained Constant Volume Cyclic Simple Shear Test. In Proceedings of the 6th World Conference on Earthquake Engineering, New Delhi, India, 10–14 January 1977. [Google Scholar]
  6. Finn, W.D.L.; Vaid, Y.P.; Bhatia, S.K. Constant Volume Simple Shear Testing. In Proceedings of the 2nd International Conference on Microzonation for Safer Construction Research and Application, San Francisco, CA, USA, 26 November–1 December 1978; Volume 26, pp. 839–851. [Google Scholar]
  7. Stokoe, K.H.; Hwang, S.K.; Lee, J.N.K. Effects of Various Parameters on the Stiffness and Damping of Soils at Small to Medium Strains. In Prefailure Deformation of Geomaterials; Shibuya, S., Mitachi, T., Miura, S., Eds.; A.A. Balkema: Rotterdam, The Netherlands, 1994; Volume 2, pp. 785–816. [Google Scholar]
  8. Stokoe, K.H.; Darendeli, M.B.; Andrus, R.D.; Brown, L.T. Dynamic Soil Properties: Laboratory, Field and Correlation Studies. In Proceedings of the 2nd International Conference on Earthquake Geotechnical Engineering, Lisbon, Portugal, 21–25 June 1999; Volume 3, pp. 811–845. [Google Scholar]
  9. Lanzo, G.; Pagliaroli, A.; Tommasi, P.; Chiocci, F.L. Simple shear testing of sensitive, very soft offshore clay for wide strain range. Can. Geotech. J. 2009, 46, 1277–1288. [Google Scholar] [CrossRef]
  10. Andersen, K.H. Bearing capacity under cyclic loading—Offshore, along the coast, and on land. The 21st Bjerrum Lecture presented in Oslo, 23 November 2007. Can. Geotech. J. 2009, 46, 513–553. [Google Scholar] [CrossRef]
  11. Shajarati, A.; Srensen, K.W.; Nielsen, S.K.; Ibsen, L.B. Manual for Cyclic Triaxial Test; DCE Technical Memorandum No. 14; Aalborg University: Aalborg, Denmark, 2012. [Google Scholar]
  12. Kim, A.R.; Chang, I.; Cho, G.C.; Shim, S.H. Strength and dynamic properties of cement-mixed Korean marine clays. KSCE J. Civ. Eng. 2018, 22, 1150–1161. [Google Scholar] [CrossRef] [Green Version]
  13. Zhao, Y.; Du, X.; Xiong, B.; Zhang, D. Experimental Study on Dynamic Characteristics of Marine Soft Clay in North China. J. Coast. Res. 2018, 474–478. [Google Scholar] [CrossRef]
  14. Nian, T.K.; Jiao, H.B.; Fan, N.; Guo, X.S. Microstructure analysis on the dynamic behavior of marine clay in the south China sea. Mar. Georesources Geotech. 2019, 1–14. [Google Scholar] [CrossRef]
  15. Banerjee, S.; Balaji, P. Effect of anisotropy on cyclic properties of Chennai marine clay. Int. J. Geosynth. Ground Eng. 2018, 4, 27. [Google Scholar] [CrossRef]
  16. Andersen, K.H. Properties of soft clay under static and cyclic loading. In Proceedings of the International Conference on Engineering Problems of Regional Soils, Beijing, China, 11–15 August 1988; Chinese Institution of Soil Mechanics, Ed.; Foundation Engineering International Academic Publishers: Beijing, China, 1988; pp. 7–26, (Also published in Publikasjon—Norges Geotekniske Institutt, Volume 176, pp. 1–20.). [Google Scholar] [CrossRef]
  17. Andersen, K.H.; Berre, T. Behaviour of a dense sand under monotonic and cyclic loading. In Proceedings of the 12th ECSMGE, Geotechnical Engineering for Transportation Infrastructure, Amsterdam, The Netherlands, 7–10 June 1999; A.A. Balkema: Rotterdam, The Netherlands, 1999; Volume 2, pp. 667–676. [Google Scholar]
  18. Andersen, K.H. Cyclic Clay Data for Foundation Design of Structures Subjected to Wave Loading. In Proceedings of the International Conference on Cyclic Behaviour of Soils and Liquefaction Phenomena, Bochum, Germany, 31 March–2 April 2004; Triantafyllidis, T., Ed.; CRC Press/Taylor & Francis Group: London, UK, 2004; pp. 371–387. [Google Scholar] [CrossRef]
  19. Ryu, T.G.; Kim, J.M. Stress-dependent failure criteria for marine silty sand subject to cyclic loading. J. Korean Geotech. Soc. 2015, 31, 15–23. (In Korean) [Google Scholar] [CrossRef] [Green Version]
  20. Ko, M.J.; Son, S.W.; Kim, J.M. Relative density and stress-dependent failure criteria of marine silty sand subject to cyclic loading. J. Korean Geotech. Soc. 2017, 33, 79–91. (In Korean) [Google Scholar]
  21. Son, S.W.; Ko, M.J.; Kim, J.M. Cyclic shear behavior characteristics of marine silty sand. J. Mar. Sci. Technol. 2017, 25, 784–790. [Google Scholar] [CrossRef]
  22. Bjerrum, L.; Landva, A. Direct simple shear rests on a Norwegian quick clay. Geotechnique 1966, 16, 1–20. [Google Scholar] [CrossRef]
  23. Peacock, W.H.; Seed, H.B. Sand Liquefaction under Cyclic Loading Simple Shear Conditions. J. Soil Mech. Found. Div. 1968, 94, 689–708. [Google Scholar]
  24. De Alba, P.; Seed, H.B.; Chan, C.K. Sand Liquefaction in Large-Scale Simple Shear Tests. J. Geotech. Eng. Div. 1976, 102, 909–927. [Google Scholar] [CrossRef]
  25. Dyvik, R.; Berre, T.; Lacasse, S.; Raadim, B. Comparison of truly undrained and constant volume direct simple shear tests. Geotechnique 1987, 37, 3–10. [Google Scholar] [CrossRef]
  26. ASTM D 6528-17. Standard Test Method for Consolidated Undrained Direct Simple Shear Testing of Fine Grain Soils; ASTM International: West Conshohocken, PA, USA, 2017.
  27. Nielsen, S.D.; Shajarati, A.; Sorenson, K.W.; Ibsen, L.B. Behaviour of Dense Frederikshavn Sand during Cyclic Loading; DCE Technical Memorandum; Department of Civil Engineering, Aalborg University: Aalborg, Denmark, 2012; pp. 1–9. [Google Scholar]
  28. Korea Electric Power Corporation (KEPCO). Test Bed for 2.5GW Offshore Wind Farm at Yellow Sea Preliminary Design Basis Report; Korea Electric Power Corporation (KEPCO): Seoul, Korea, 2012. (In Korean) [Google Scholar]
  29. Ryu, T.G. Long-Term Dynamic Behavior Study of Marine Silty Sand for Offshore Structure Foundation Design. Master’s Thesis, Pusan National University, Busan, Korea, 2016. [Google Scholar]
Figure 1. Modes of cyclic loading: (a) two-way, τa = 0 (symmetric); (b) two-way, τa > 0 (asymmetric); (c) one-way, τa = τcy; (d) one-way, τa > τcy [1].
Jmse 08 00051 g001aJmse 08 00051 g001b
Figure 2. Pore pressure and shear strain as a function of time under undrained cyclic loading: (a) Cyclic and average shear stresses; (b) Pore pressure generation; (c) Cyclic and permanent shear strains [10]. Here, u is the pore pressure, γ is the shear strain, and τ0 is the initial consolidation shear stress.
Jmse 08 00051 g002
Figure 3. Stress–strain behavior under cyclic loading [10].
Jmse 08 00051 g003
Figure 4. Direct simple shear apparatus.
Jmse 08 00051 g004
Figure 5. Grain size distribution curve of silty sand (adapted from [20]).
Jmse 08 00051 g005
Figure 6. Effective internal friction angle (adapted from [21]): (a) Dr = 50%; (b) Dr = 85%.
Jmse 08 00051 g006
Figure 7. Critical state line (CSL) (adapted from [21]).
Jmse 08 00051 g007
Figure 8. Three-dimensional criterion lines for marine silty sand showing CSR, ASR, and Dr, and the corresponding cyclic and permanent shear strains at failure (adapted from [21]).
Jmse 08 00051 g008
Figure 9. Design graph results: (a) Confining pressure 200 kPa, Relative density 50% [18]; (b) Confining pressure 300 kPa, Relative density 50% [21]; (c) Confining pressure 200 kPa, Relative density 85%.
Jmse 08 00051 g009aJmse 08 00051 g009b
Figure 10. Graph matching of the design curve and elliptic graph.
Jmse 08 00051 g010
Figure 11. Elliptic graph and equation.
Jmse 08 00051 g011
Figure 12. Proposed design curve procedure: (a) 200 kPa (Dr = 50%); (b) 300 kPa (Dr = 50%); (c) 200 kPa (Dr = 85%).
Jmse 08 00051 g012aJmse 08 00051 g012b
Figure 13. Normalized CSR versus Nf.
Jmse 08 00051 g013
Figure 14. Normalized CSR versus ASR: (a) Dr = 50% (CP = 200 kPa); (b) Dr = 50% (CP = 300 kPa); (c) Dr = 85% (CP = 200 kPa).
Jmse 08 00051 g014aJmse 08 00051 g014b
Table 1. Properties of west coast marine silty sand [21].
Max. Voids Ratio (-)Min. Voids Ratio (-)Uniformity Coefficient (-)Coefficient of Curvature (-)Unified Soil Classification System (USCS)Specific Gravity (-)
0.741.181.800.15SP-SM2.62
Table 2. Summary of cyclic direct simple shear (CDSS) tests with corresponding cyclic stress ratio (CSR) and average stress ratio (ASR) values.
Test IDCyclic Stress Ratio (CSR)
cyvc`)
Average Stress Ratio (ASR)
avc`)
CDSS_10.10
CDSS_20.10.2
CDSS_30.10.3
CDSS_40.10.4
CDSS_50.20
CDSS_60.20.2
CDSS_70.20.3
CDSS_80.20.4
CDSS_90.30
CDSS_100.30.2
CDSS_110.30.3
CDSS_120.30.4
CDSS_130.40
CDSS_140.40.2
CDSS_150.40.3
CDSS_160.50
CDSS_170.50.2

