Abstract
One of the significant problems in the safe operation of vessels is the behavior of the ship on the wave. Of all degrees of freedom, the greatest threat to the safety of a ship is associated with excessive rolling. One of the best methods to improve the safety of a ship in this field is to carry out experiments on the ship model, performed at her design stage. The problem is that the model tests are costly. An alternative is to conduct simulation tests based on numerical models. The primary goal of the article is to present the results of the simulation regarding the determination of parameters describing the risk areas of chaotic rolling for the ship designed for transporting liquefied natural gas (LNG carrier) and offshore support vessel (OSV). The first discusses the state of knowledge on mathematical modeling of oscillations. Then, the theory of nonlinear differential equations is presented, and the mathematical model of ship rolling is described. This model is used to prepare and conduct a numerical simulation in the Mathematica package. The results of these studies and their discussion constitute the central part of the article. Finally, the conclusions are presented.
1. Introduction
Rolling with large amplitudes can be a real threat to a ship, its crew, and cargo. In adverse weather, the amplitude of rolling frequently exceeds angles of 20–25° and in resonance conditions, even 40°. In comparison, amplitudes of pitch usually do not exceed 1–2°. However, in severe weather conditions, in a head sea, it could exceed even 5° [1,2]. For the exact ship, the testing of its behavior in the adverse weather conditions can be carried out in the form of an experiment or numerical simulations. However, an experiment performed on a ship model has several limitations, among which is the maximum amplitude of rolling. Usually, during the ship model tests, the amplitude of 20–25° is not exceeded. Other significant problems are the cost of such an experiment and access to a suitably large and equipped ship tank. This is why the numerical simulations of ship rolling are much more accessible.
Generally, during the numerical simulations, the mathematical model, which describes the motions of the exact object, is used. The full mathematical model, which represents the ship behavior in the rough sea, is the six degrees of freedom (6-DOF) model where each degree of freedom is coupled to a greater or lesser extent with the others DOF. However, in the presented research, the 1-DOF rolling model is used. Accepting such simplification, the rolling can be described by the single, second-order ordinary differential equation. In many cases, for medium and exceptionally large amplitudes of rolling, a mathematical model of rolling reveals nonlinear behavior. A parameter that determines the nonlinearity of rolling most of all is the restoring moment, which is commonly described by the righting arms curve (GZ curve). For small amplitudes, the nonlinearity of the GZ curve is small and can be ignored. However, when medium and especially large amplitudes of rolling are analyzed, phenomena typical for nonlinear oscillations should be considered. In rolling, these phenomena are most often revealed when the maximum of the GZ curve is located at relatively small angles – for an intact ship; it concerns angles close to 30°. Therefore, given that extreme amplitudes of rolling in resonance conditions can achieve 35–40°, it should be assumed that the phenomena typical for nonlinear oscillations can occur under real conditions.
The phenomena, which are characteristic for nonlinear oscillations (rolling), are:
- the resonance frequency dependence on oscillations amplitude [3,4,5,6,7],
- bistability (multivaluedness) [4,6,8],
- bifurcation [6,8,9,10],
- jumps of oscillations amplitude [6,8,11,12].
The last three phenomena are related directly to the area of the unstable solutions, which can be observed inside the area of the possible solutions of the rolling equation when strong nonlinearity occurs. A two-dimensional analysis should be done to reveal the area of unstable solutions, such as in [8]. Amplitude jumps are the derivative of bifurcations. These, in turn, apply to nonlinear dynamics systems. Nonetheless, when roll amplitude jumps occur, rolling can seem chaotic.
In general, the problem of parametric rolling is the subject of many scientific studies. This research mainly concerns parametric rolling [1,13,14,15,16,17,18,19]. On the other hand, there are some studies that focused on synchronous rolling [6].
Because the parametric rolling is a complex engineering problem, some research results present the different mathematical models of the rolling as the nonlinear oscillators [3,4,5,6,7,11,12,20]. According to this approach, some papers with solutions of the bifurcation and bistability were presented [4,6,8,9,10]. The cause of rolling determines the difference between these two approaches. The bistability phenomenon refers only to synchronous rolling, and the bifurcation concerns both synchronous and parametric rolling [6,10,19].
Only a few papers took into account the chaotic roll motion. One approach is subjected to a stochastic analysis procedure, where the periodic excitation with a random noise disturbance is considered [21]. Some results are about the application of Lapunov Characteristic Exponents to parametric resonance stability of ships [22]. An interesting approach is given in [23]. There, the real-time prediction model of ship rolling motion is based on support vector machines, which utilizes phase space reconstruction theory of chaotic systems and online least squares support vector machine (LSSVM).
The main aim of the paper is to determine parameters describing the risk areas of chaotic rolling according to simulation methods based on the Duffing equation. The method of defining areas of risk of chaotic rolling proposed in the paper is a novel approach to this problem.
2. Materials and Methods
2.1. Basic Notations
As indicated in the introduction, the essential mathematical tool to describe resonance phenomena in rolling is using nonlinear ordinary differential equations of second order. In some cases, it can be done more efficiently, according to Mathieu’s equations [24]. Unfortunately, this approach does not allow taking into account all the parameters necessary for a proper description of the rolling motion. Somehow, the Duffing equation is the starting approach for modeling the ships rolling. The most general form of this equation is given as [24,25,26,27]:
where is the damping parameter (i.e., it controls the amount of damping), is the forcing parameter (i.e., describes the amplitude of the periodic driving force), is parameter describing the behavior of the system (controls the amount of non-linearity in the restoring force), is the control input, angular frequency of the periodic driving force, and controls the linear term in non-linear stiffness.
Equation (1) has wide-range engineering applications, e.g., different mechanical systems based on magneto-elastic characteristics [28], large-amplitude oscillations in specific governor systems [29], and vibrations caused by fluid flow modeled with Duffing equation [30]. In other words, using Equation (1), you can describe various physical phenomena with different forms of the Duffing equation dependent on the choice of parameters.
For example, when the system with no damping and no force, i.e., , Equation (1) takes the form:
Furthermore, according to [27], if we take into account the assumption in Equation (2) about it can model the chaotic behavior of the considered system. If , the equation describes a hard spring, in the case when formula characterizes a soft spring.
The introduction indicates that when determining areas of bistability, the concept of bifurcation is used. In the case of dynamical technical systems, it is understood as a qualitative change in their dynamics produced by varying parameters [3,28]. This approach lets one describe the correct nonlinear equation by strange phenomena such as chaos, bifurcations, or symmetry-breaking [3]. If the resonance in dynamic non-linear systems is considered, the bifurcation meaning the multiple solutions at the same excitation frequency.
2.2. Regulation for Avoiding Dangerous Situations for Ship Rolling
The guidelines published by the International Maritime Organization (IMO) MSC/Circ. 707 Guidance to the master for avoiding dangerous situations in following and quartering seas, which was released 19th October 1995 [31] and MSC.1/Circ. 1228 Revised guidance to the master for avoiding dangerous situations in adverse weather and sea conditions on 11th January 2007 [32], which replaces that from 1995, which was focused on identifying critical situations in following seas and on the proposed countermeasures. Both IMO guidelines also include recommendations for the ships’ masters to avoid dangerous situations in heavy weather conditions, especially in following seas and stern quartering seas. However, these guidelines are limited only to the three different criteria, which are intended to avoid the following hazards for ships in heavy weather:
- Surf-riding and broaching-to,
- Successive high wave attack,
- Synchronous rolling and parametric rolling motions.
Generally, to leave one of those dangerous zones, the guidelines recommend to master’s alterations of course and/or change (mainly reduce) speed.
All these criteria define a so-called dangerous zone, depending on several input parameters. During sea passage, this dangerous zone shall be avoided by the master, or, if a ship is within the danger zone, she is recommended to leave that zone, if additional criteria are met. The application of the criteria requires that the stability of the ship fulfills at least the Intact Stability Code.
In both guidelines, the particular emphasis was placed on excessive ship’s motions, which may lead to large roll angles or the capsizing of the vessel, damages to the cargo, major systems, and the crew. Among the analyzed failure states of the ship are considered surf-riding and broaching-to, pure loss of stability on the wave crest, and synchronous and parametric rolling. These IMO publications mentioned above do not contain any recommendation or information for master about the possibility of the occurrence of any nonlinear oscillations, chaotic rolling, or amplitude jumps.
2.3. Applied Model of Ship Rolling
For reasons described in [6,8] during the presented research, the 1-DOF system was used:
where Ix denotes the transverse moment of ship’s inertia, A44 is the moment of added mass due to water dragging by the rolling hull, Be is the equivalent linear roll damping coefficient, K(ϕ) describes the restoring moment of the ship, Mw is the exciting moment, Md is the additional external moment, ωe is the encounter frequency of waves, and t denotes time. The moments Mw and Md are time-dependent. In the case of Mw, this allows for periodic changes in the value of roll excitation, thus, groups of higher and lower waves can be simulated. The time-varying external moment Md can be used to simulate short external excitation impulses (e.g., caused by the wind).
After a few transformations, the roll Equation (3) becomes:
where µ is the damping coefficient, g is the gravity acceleration, rx is the gyration radius of a ship and added masses (which is assumed to be constant for this study), GZ is the righting arm, ξw is the exciting moment coefficient, and ξd is the coefficient of the additional external moment.
The restoring moment is approximated by the ninth order polynomial with odd powers only:
where C1 to C9 are the coefficients obtained with the use of the least-squares method.
The damping dependence on amplitude of rolling has been modified to the form given by [33]. As a result, Equation (4) becomes:
where α, β, and γ are coefficients, which can be calculated analytically according to a simple Ikeda’s method [34]. However, the bilge keel component was calculated according to the full Ikeda’s method [35]. This modification was made due to the inconsistency in the results for the bilge keel component. It is calculated according to the full and simplified method [36].
When the surface of damping coefficients for the considered range of amplitudes and frequencies of rolling is obtained, for the constant values of roll frequency the coefficients α, β, and γ can be fitted to fulfill condition (7) for a full spectrum of considered amplitudes. However, it should be noted that when the frequency spectrum is too wide, the method gives some inaccuracy:
The last step is performed so that the coefficients α, β and γ take rolling frequency into account—the series of each coefficient (calculated for successive frequencies) are individually fitted for the 4th order polynomial with roll frequency as an argument:
It is worth pointing out that in most cases, polynomials (8), (9), and (10) may be reduced to the 3rd or even 2nd order.
The final form of the roll equation with damping dependence on amplitude and frequency is:
The roll equation in Equation (11) has been developed and used in the research presented in [8].
In the end, it should be noted that Ikeda’s method is fully applicable for amplitudes not bigger than 0.4 rad and does not consider changes to roll damping due to bilge keel emergence and deck submergence. For the latter problem, no exact analytical method is known at the moment—some proposed solutions can be found in [37]. Because of this, in the presented research, values of the roll damping for amplitudes bigger than 0.4 rad are determined following the procedure described above and for amplitudes up to 1 rad.
3. Results and Discussion
3.1. Considered Ships and Loading Conditions
In the research, two ships were considered. The ship transports liquid natural gas (LNG carrier) with length LPP = 278.80 m and offshore support vessel (OSV) with LPP = 76.20 m, both in a single loading condition. Main particulars and some parameters used in calculations, for both ships in selected loading conditions, are shown in Table 1. Shown in Table 1, the natural roll period τ, the natural roll frequency ωn, and the gyration radius (including added masses) rx were calculated under IMO recommendations given in Intact Stability Code [38]:
where .

Table 1.
Main particulars of ships and parameters of selected loading conditions.
In Figure 1a and Figure 2a, the GZ curves (plot between the righting lever and angle of heel) for the considered ships/loading conditions are presented. It is essential to pay attention to the location of the maximum of the GZ curves, which is at 0.47 rad (27°) for the LNG carrier and at 0.70 rad (40°) for OSV vessel. However, the OSV has two maxima with first at 0.39 rad (22°). Additionally, Figure 1b and Figure 2b show the resonance frequency curves (the backbone curves) calculated by two methods: the method proposed by Contento, Francescutto, and Piciullo in [5] and referred to as C.F.P. and the method of the equivalent value of the transverse metacentric height GMeq [7], which is compared to the resonance frequency (the natural roll frequency) calculated with the use of Equation (12).

Figure 1.
The GZ curve (a) and the resonance frequency curve (b) for the LNG carrier in ballast loading condition (T = 7.50 m, GM0 = 4.00 m).

Figure 2.
The GZ curve (a) and the resonance frequency curve (b) for the offshore support vessel (T = 6.10 m, GM0 = 2.50 m).
The surfaces of damping coefficients, estimated according to the simple Ikeda’s method and the next approximated using coefficients α(ω), β(ω) and γ(ω) for Equation (11), are shown in Figure 3 and Figure 4.
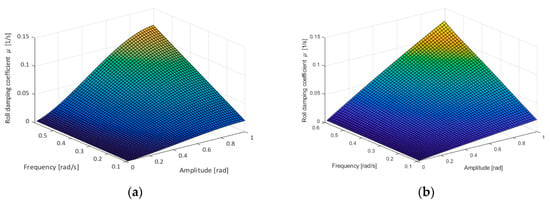
Figure 3.
Damping coefficients for the LNG carrier (T = 7.50 m, GM0 = 4.00 m, CB = 0.813, CM = 0.972, bilge keel: lBK = 40.00 m ≈ 0.15 LPP, bBK = 0.50 m) calculated according to the simple Ikeda’s method (a) and next approximated using coefficients α(ω), β(ω) and γ(ω) in Equation (11) (b).
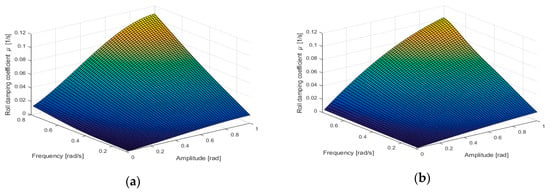
Figure 4.
Damping coefficients for the offshore support vessel (T = 6.10 m, GM0 = 2.50 m, CB = 0.778, CM = 0.987, bilge keel: lBK = 19.00 m, bBK = 0.30 m) calculated according to the simple Ikeda’s method (a) and next approximated using coefficients α(ω), β(ω) and γ(ω) in Equation (11) (b).
3.2. Areas of Bistability and Unstable Solution of the Mathematical Model of Rolling
For the strongly nonlinear system, the roll spectrum should be developed with the use of a two-dimensional analysis [8]. The result of such calculations for the considered ships in selected loading conditions and assumptions/parameters specified in the previous section are presented in Figure 5 and Figure 6.
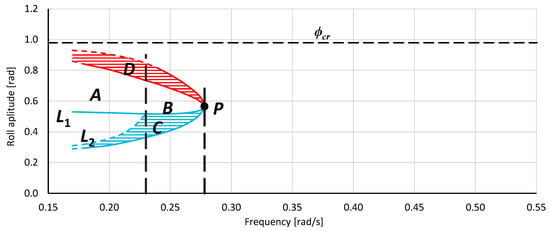
Figure 5.
Areas of bistability and unstable solution of the mathematical model of rolling for the LNG carrier (T = 7.50 m, GM0 = 4.00 m).
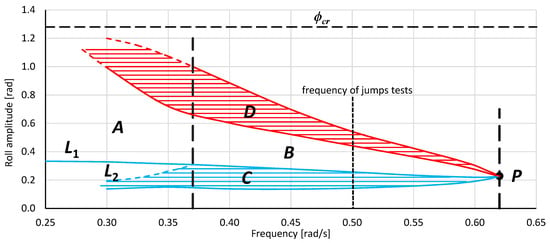
Figure 6.
Areas of bistability and unstable solution of the mathematical model of rolling for the offshore support vessel (T = 6.10 m, GM0 = 2.50 m).
The short description of drawings in Figure 5 and Figure 6 is placed below and for the comprehensive description [8]. In the text below, the meaning of the terms area and region differs; the term area is used concerning a separate part of the graph, whereas the term region refers to the frequency range.
- Point P—the bistability origin point—the onset point of bistability areas C and D.
- Areas C and D—rolling bistability areas. In area C, the oscillations are non-resonant, but the energy provided by the excitation moment is big enough for resonant oscillations within the area D. The transitions between the non-resonant and resonant oscillations, and thus between C and D areas, are possible. The lower limit of area C determines the minimum value of the energy (excitation moment) needed for resonant oscillations.
- Areas B and A—areas of an unstable solution of the rolling equation. Areas B and A appear together with the bistability areas C and D and are separated by a dashed vertical line. The difference between areas B and A is indicated in the description of Line L1. The entire border of the area of unstable solutions of the rolling equation is the line of bifurcation.
- Line L1—the maximum amplitude of non-resonant oscillations that can be obtained, at a given frequency, with the smooth increase in the value of excitation (starting from zero value). Inside region A, further increase of the excitation induces bifurcation with jump-up over the critical amplitude ϕcr. Inside region B, further increase of the excitation induces bifurcation with jump-up to the upper limit of area D and next above it.
- Line L2—the maximum amplitude of non-resonant rolling at which it is possible to force, with the use of an additional impulse, a jump-up to the area of resonant oscillations—from line L1 to the upper limit of area D.
Below, the behavior of roll Equation (11) within regions B and A is described, and a few possible scenarios of these areas crossing are presented. These scenarios were confirmed by numerical simulations of rolling performed for the OSV vessel and LNG carrier. Most of the simulations performed for OSV vessel were conducted for frequency ω = 0.5 rad/s, where lower and upper limits of bistability areas, in radians, are: C(0.135; 0.235) and D(0.436; 0.539). Simulations for LNG carrier was performed for frequency ω = 0.25 rad/s where lower and upper limits of bistability areas, in radians, are: C(0.408; 0.517) and D(0.683; 0.772). Scenarios presented below are taken from [39]. In the text below, when the scenarios are described, the phrase excitation moment Mw or Md is more convenient then excitation coefficient, but in reference to Equation (9), they have a strictly defined correlation.
Generally, two types of scenarios of amplitude jumps can be distinguished. The first one refers to a change in the frequency or value of the excitation moment Mw. In such a case, when the solution of Equation (9) enters the unstable area, the transition (amplitude jump) occurs. In Figure 7a, initially, a ship is rolling with an amplitude on the upper limit of area C. From the 380 s of simulation time, the value of Mw is increased only by 1%. As an effect, the transition (amplitude jump) to the area of resonant oscillations can be observed. In Figure 7b, initially, a ship is rolling with an amplitude on the lower limit of area D. From the 1000 s of simulation time, the value of Mw is decreased by 1%, and the transition (amplitude jump) to the non-resonant oscillations occurs.
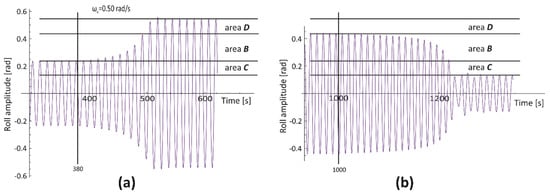
Figure 7.
Roll time history for the OSV vessel (T = 6.10 m, GM0 = 2.50 m). Transitions between the bistability areas cause by a very small and smooth change in the value of the exciting moment (change by 1% of its initial value); (a)—jump-up, (b)—jump- down.
Furthermore, entering area B at the lower limit causes a jump to the upper limit of area D, while entering area B at the upper limit causes a jump to the lower limit of area C. In cases presented in Figure 7, the value of Mw was changed only by 1%, and the transitions (jump-up/jump-down) took several cycles. When changes in the value of Mw will be bigger, the transitions between non-resonant and resonant oscillations will be faster. The transitions can occur even within one cycle, thus, the effect of change of rolling amplitude can be violent and sudden. Such a situation is presented in Figure 8, wherefrom the 4000 s of simulation time, the value of Mw is increased by 1% (left drawing) and by 10% (right drawing). In the case of the (a), the transition (jump-up) takes a few cycles. While in the case on the right graph, the transition takes only one cycle.
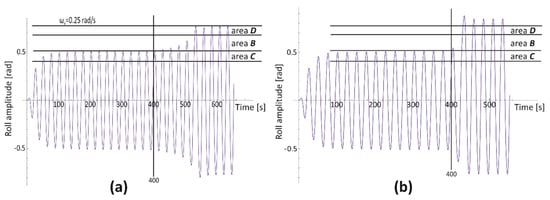
Figure 8.
Roll time history for the LNG carrier (T = 7.50 m, GM0 = 4.00 m). Transitions between the bistability areas cause by change in the value of the exciting moment Mw in 400 s of simulation. (a)—change by 1%; (b)—change by 10%.
The second scenario refers to situations when the frequency and value of excitation moment are constant in time, but due to, e.g., wind or couplings, some additional impulses occur for a short period. Because the time of duration of these additional impulses is short, they are described by a step function. For this second scenario, two cases are described below.
In Figure 9a, initially, the ship is rolling with a stable amplitude below the lower limit of area C. From 380 s of simulation time, the additional excitation moment Md is introduced. Its value and duration time are enough to force a crossing of area C and area B and entering area D—the resonance rolling area. At 440 s, Md is stopped, and although the oscillations are inside the resonance area, the amplitude is decreasing to its initial value—the energy provided by the excitation moment is too small to maintain such a large rolling amplitude, independently from resonance conditions.
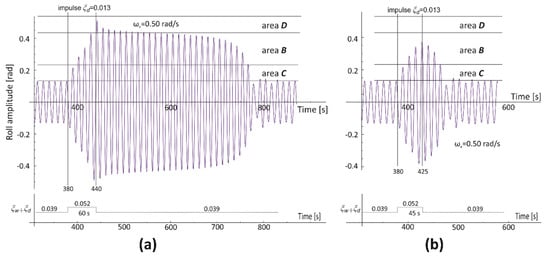
Figure 9.
Roll time history for the OSV vessel (T = 6.10 m, GM0 = 2.50 m, ξw = 0.039). The transition from the area below the bistability area C in the direction of the resonance area D. The reaction to the additional exciting moment: (a)—ξd(380–440 s) = 0.013; (b)—ξd(380–425 s) = 0.013.
Crossing area C, as well as area B, requires providing a sufficient amount of additional energy, even though area B is the area of the unstable solution of the rolling equation. Quantity of the energy needed for a transition to area D depends on the initial rolling amplitude (transition distance) and damping value. Additionally, when the value of Md is large, the time of transition can be short. If this additional energy supply will be stopped before achieving the area of resonance conditions, the solution quickly returns to the initial value of amplitude, such as in Figure 9b. However, when the resonance area is achieved, the return to the initial value of rolling amplitude takes much more time (this time depends on the depth of entry into the area D), and oscillations with large amplitudes are significantly more numerous (Figure 9a).
In Figure 10a, the initial and stable roll amplitude is below but very close to the upper limit of the bistability area C. From 450 s of simulation time, the impulse in the form of additional excitation moment Md is introduced. Its value is very small (ξd ≈ 5% of ξw), and the duration time is short (5 s). The energy that is added to the system is small but big enough for entering area B. Entering area B is very shallow but sufficient for the transition (amplitude jump) to area D, and next to the appearance of stable, resonant rolling. A similar situation is presented in Figure 10b, where initial rolling is also in area B, however not so close to its upper limit. The only difference is that the value of the impulse ξd needed to induce the shallow entry into area B must be bigger. In both cases, crossing through area B takes place without any additional energy support—although it needs some oscillation cycles to fulfill.
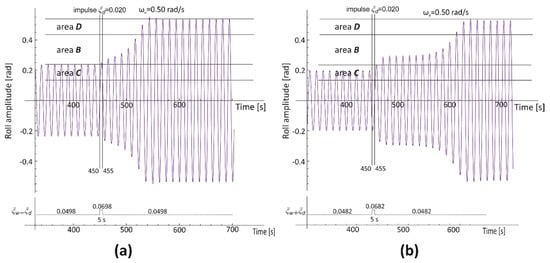
Figure 10.
Roll time history for the OSV vessel (T = 6.10 m, GM0 = 2.50 m, ξw,(a) = 0.0498, ξw,(b) = 0.0482). The transition from the bistability area C to the resonance area D is caused by the additional exciting moment ξd(450–455 s): (a)—the initial and stable roll amplitude is below but very close to the upper limit of the bistability area C; (b)—the initial and stable roll amplitude is below but not so close to upper limit of the bistability area C.
Entering area B not always provides the transition. The transition also depends on the oscillation phase at which the additional exciting moment Md occurs. In roll time history shown in Figure 11, Md occurs three times. Each time, its value and duration are the same as well as the direction is compatible with Mw. The only difference is the oscillation phase of its occurrence. Each time, the oscillations enter the area of the unstable solution, but only in the third case, the transition is observed.
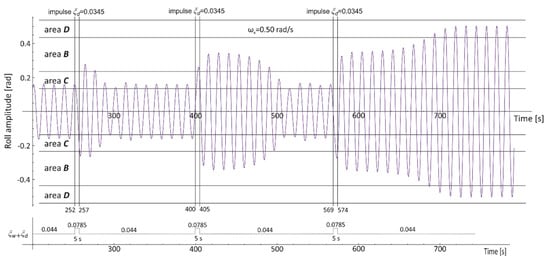
Figure 11.
Roll time history for the OSV vessel (T = 6.10 m, GM0 = 2.50 m, ξw = 0.044). The additional exciting moments: ξd1(252–257 s) = ξd2(400–405 s) = ξd3(569–574 s) = 0.0345.
Another fascinating case is presented in Figure 12, where the situation is similar to the one shown in Figure 10b. The difference is that during the crossing area B, from 600 to 615 s of the simulation, the additional impulse Md is introduced—its direction of action is opposite to Mw. It can be seen that Md enforces the decrease of the amplitude of the oscillations and the direction of its return to area C. However, when Md is stopped, the amplitude of oscillations strives to area D afresh.
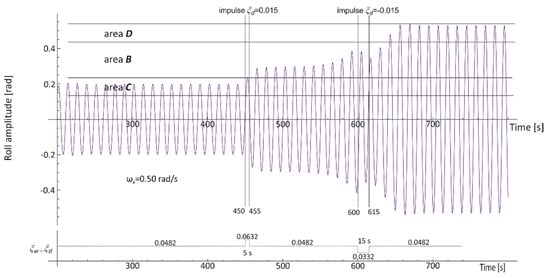
Figure 12.
Roll time history for the OSV vessel (T = 6.10 m, GM0 = 2.50 m, ξw = 0.0482). The additional exciting moments: ξd1(450–455 s) = 0.015, ξd2(600–615 s) = −0.015.
4. Conclusions
The simulations conducted in the paper allow determining the parameters indicating when the OSV vessel and LNG carrier are exposed to chaotic rolling. Particularly, it is expressed by the shape of the bistability areas C and D in Figure 5 and Figure 6. These graphs show that the LNG carrier is less susceptible to the possibility of chaotic rolling than the OSV vessel.
The rolling time history analysis presented in Figure 7, Figure 8, Figure 9, Figure 10, Figure 11 and Figure 12 shows that it is enough considering only two scenarios of simulations to get feedback about the ships’ behavior. In the case of the first scenario, a change in the frequency or value of the excitation moment, causing the entrance to the unstable area, results in the transition (amplitude jump). In the second approach, the frequency and value of excitation moment are both constant in time, but due to some additional impulses, they occur in a short period.
Furthermore, the simulation results confirm the real-world behavior of both types of ships, and in this way, they verify the mathematical model of the ship’s chaotic rolling described and used in the paper.
The knowledge about the characteristics of the ship’s chaotic rolling amplitude can prevent load loss. It is one of the most critical tasks in today’s maritime transport.
Future research will be concern about the relation between the backbone curve and the graphs describing the areas of bistability and unstable solution of the mathematical model of chaotic rolling because, during this research, some observation has been done.
Author Contributions
Conceptualization, W.W., S.G., and P.W.; methodology, S.G., W.W.; software, W.W.; validation, S.G., W.W. and P.W.; formal analysis, S.G., W.W., and P.W.; investigation, W.W.; resources, W.W.; data curation, W.W.; writing—original draft preparation, S.G., W.W., and P.W.; writing—review and editing, S.G., W.W.; visualization, W.W., and S.G.; supervision, S.G., W.W.; project administration, W.W.; funding acquisition, W.W. All authors have read and agreed to the published version of the manuscript.
Funding
This study was financed by the Gdynia Maritime University, the research project: WN/2019/PZ/03.
Conflicts of Interest
The authors declare no conflict of interest.
References
- France, W.M.; Levadou, M.; Treakle, T.W.; Paulling, J.R.; Michel, K.; Moore, C. An Investigation of Head-Sea Parametric Rolling and its Influence on Container Lashing Systems. Mar. Technol. 2003, 40, 1–19. [Google Scholar]
- Acanfora, M.; Montewka, J.; Hinz, T.; Matusiak, J. On the estimation of the design loads on container stacks due to excessive acceleration in adverse weather conditions. Mar. Struct. 2017, 53, 105–123. [Google Scholar] [CrossRef]
- Francescutto, A. On the probability of large amplitude rolling and capsizing as a consequence of bifurcations. In Proceedings of the 9th International Conference on Offshore Mechanics and Arctic Engineering OMAE’91, Stavanger, Norway, 23–28 June 1991; pp. 91–96. [Google Scholar]
- Falzarano, J.; Taz Ul Mulk, M. Large Amplitude Rolling Motion of an Ocean Survey Vessel. Mar. Technol. 1994, 31, 278–285. [Google Scholar]
- Contento, G.; Francescutto, A.; Piciullo, M. On the Effectiveness of Constant Coefficients Roll Motion Equation. Ocean Eng. 1996, 23, 597–618. [Google Scholar] [CrossRef]
- Francescutto, A.; Contento, G. Bifurcations in ship rolling, experimental results and parameter identification technique. Ocean Eng. 1999, 26, 1095–1123. [Google Scholar] [CrossRef]
- Wawrzyński, W.; Krata, P. On ship roll resonance frequency. Ocean Eng. 2016, 126, 92–114. [Google Scholar] [CrossRef]
- Wawrzyński, W. Bistability and accompanying phenomena in the 1-DOF mathematical model of rolling. Ocean Eng. 2018, 147, 565–579. [Google Scholar] [CrossRef]
- Liangqiang, Z.; Fangqi, C. Stability and bifurcation analysis for a model of a nonlinear coupled pitch–roll ship. Math. Comput. Simul. 2008, 79, 149–166. [Google Scholar]
- Fossen, T.; Nijmeijer, H. (Eds.) Parametric Resonance in Dynamical Systems; Springer Science Business Media: Berlin, Germany, 2012. [Google Scholar]
- Jordan, D.W.; Smith, P. Nonlinear Ordinary Differential Equations—An Introduction for Scientists and Engineers, 4th ed.; Oxford University: Oxford, UK, 2007. [Google Scholar]
- Brennan, M.J.; Kovacic, I.; Carrella, A.; Waters, T.P. On the jump-up and jump-down frequencies of the Duffing oscillator. J. Sound Vib. 2008, 318, 1250–1261. [Google Scholar] [CrossRef]
- Shin, Y.S.; Belenky, V.L.; Paulling, J.R.; Weems, K.M.; Lin, W.M. Criteria for Parametric Roll of Large Containerships in Longitudinal Seas; SNAME Annual Meeting: Washington, DC, USA, 2004. [Google Scholar]
- Bulian, G. Nonlinear parametric rolling in regular waves—A general procedure for the analytical approximation of the GZ curve and its use in time domain simulation. Ocean. Eng. 2005, 32, 309–330. [Google Scholar] [CrossRef]
- Holden, C.; Galeazzi, R.; Rodriguez, C.; Perez, T.; Fossen, T.; Blanke, M.; Neves, M. Nonlinear container ship model for the study of parametric roll resonance. Model. Identif. Control 2007, 28. [Google Scholar] [CrossRef]
- Neves, M.; Rodriguez, C. On unstable ship motions resulting from strong non-linear coupling. Ocean. Eng. 2006, 33, 1853–1883. [Google Scholar] [CrossRef]
- Spyrou, K.; Tigkas, I.; Scanferla, G.; Pallikaropoulos, N.; Themelis, N. Prediction potential of the parametric rolling behaviour of a post-Panamax containership. Ocean. Eng. 2008, 35, 1235–1244. [Google Scholar] [CrossRef]
- Ribeiro e Silva, S.; Guedes Soares, C. Prediction of parametric rolling in waves with a time domain non-linear strip theory model. Ocean. Eng. 2013, 72, 453–469. [Google Scholar] [CrossRef]
- Galeazzi, R.; Holdeny, C.; Blanke, M.; Fossen, T. Stabilisation of Parametric Roll Resonance by Combined Speed and Fin Stabiliser Control. In Proceedings of the Control Conference (ECC), Budapest, Hungary, 23–26 August 2009; pp. 4895–4900. [Google Scholar]
- Stoker, J. Nonlinear Vibrations in Mechanical and Electrical Systems; Wiley: New York, NY, USA, 1992. [Google Scholar]
- Lin, H.; Yim, S.C.S. Chaotic roll motion and capsize of ships under periodic excitation with random noise. Appl. Ocean Res. 1995, 17, 185–204. [Google Scholar] [CrossRef]
- Hu, K.; Ding, Y.; Wang, H. Chaotic roll motions of ships in regular longitudinal waves. J. Mar. Sci. Appl. 2010, 9, 208–212. [Google Scholar] [CrossRef]
- Liu, S.; Yang, Z. Real-time online forecasting model of ship rolling motion based on chaotic online LSSVM. In Proceedings of the IEEE 18th International Conference on Industrial Engineering and Engineering Management, Changchun, China, 3–5 September 2011; pp. 1732–1736. [Google Scholar]
- Shaofang, W.; Yongjun, S.; Xianghong, L.; Shaopu, Y. Dynamical analysis of Mathieu equation with two kinds of van der Pol fractional-order terms. Int. J. Non-Linear Mech. 2016, 84, 130–138. [Google Scholar]
- Kovacic, I. Generalised perturbation techniques for strongly nonlinear oscillators with a positive, zero or negative linear stiffness term. Int. J. Dyn. Control 2015, 3, 137–147. [Google Scholar] [CrossRef]
- Kovacic, I.; Brennan, M.J. (Eds.) The Duffing Equation: Nonlinear Oscillators and Their Behavior; John Wiley and Sons: Chichester, UK, 2011. [Google Scholar]
- Eric, W. Duffing Differential Equation. From MathWorld—A Wolfram Web Resource. Available online: http://mathworld.wolfram.com/DuffingDifferentialEquation.html (accessed on 20 September 2019).
- Guckenheimer, J.; Holmes, P. Nonlinear Oscillations, Dynamical Systems and Bifurcations of Vector Fields; Springer: Berlin/Heidelberg, Germany, 1983. [Google Scholar]
- Younesian, D.; Askari, H.; Saadatnia, Z.; Yazdi, M.K. Periodic solutions for nonlinear oscillation of a centrifugal governor system using the He’s frequency–amplitude formulation and He’s energy balance method. Nonlinear Sci. Lett. A 2011, 2, 143–148. [Google Scholar]
- Srinil, N.; Zanganeh, H. Modelling of coupled cross-flow/in-line vortex-induced vibrations using double Duffing and van der Pol oscillators. Ocean Eng. 2012, 53, 83–97. [Google Scholar] [CrossRef]
- IMO MSC/Circ. 707 Guidance to the Master for Avoiding Dangerous Situations in Following and Quartering Seas; IMO: London, UK, 1995. [Google Scholar]
- IMO MSC.1/Circ. 1228 Revised Guidance to the Master for Avoiding Dangerous Situations in Adverse Weather and sea Conditions on 11th January 2007; IMO: London, UK, 2007. [Google Scholar]
- Himeno, Y. Prediction of Ship Roll Damping—State of the Art, Report of Dept. of Naval Architecture and Marine Engineering; No. 239; The University of Michigan: Ann Arbor, MI, USA, 1981. [Google Scholar]
- Kawahara, Y.; Maekawa, K.; Ikeda, Y. A Simple Prediction Formula of Roll Damping of Conventional Cargo Ships on the Basis of Ikeda’s Method and Its Limitations. J. Shipp. Ocean Eng. 2012, 2, 201–210. [Google Scholar]
- ITTC Recommended Procedures, Numerical Estimation of Roll Damping; ITTC: Rio de Janeiro, Brazil, 2011.
- Wawrzyński, W. Predykcja składowej tłumienia kołysań bocznych statku dla stępek przechyłowych, porównanie skróconej i pełnej metody Ikedy, Zeszyty Naukowe Akademii Morskiej w Gdyni. Zeszyt 2017, 102, 124–141. [Google Scholar]
- Bassler, C.; Reed, A. A Method to Model Large Amplitude Ship Roll Damping. In Proceedings of the 11th International Ship Stability Workshop, Wageningen, The Netherlands, 21–23 June 2010; pp. 217–224. [Google Scholar]
- IMO. Intact Stability Code; IMO: London, UK, 2008. [Google Scholar]
- Wawrzyński, W. Area of the unstable solution of rolling equation—Jumps of the oscillations amplitude. J. KONES 2018, 25, 489–496. [Google Scholar]
© 2020 by the authors. Licensee MDPI, Basel, Switzerland. This article is an open access article distributed under the terms and conditions of the Creative Commons Attribution (CC BY) license (http://creativecommons.org/licenses/by/4.0/).