1. Introduction
In recent years, there have been some social and political concerns about climate change and the high dependence on fossil fuels. In order to prevent a big problem, different climate and energy policies are being created to achieve environmental sustainability. Renewable energies are called to play an essential role in this process. The ocean has been an integral part of human civilization and its development for a long time. Although its potential use for power generation has been the object of different patents, only some technologies able of taking advantage of ocean energy resources are in a mature stage of development. This is a key point taking into account that oceans and seas have the potential to play an important role in the supply of clean and endless energy. Oceans and seas contain large quantities of energy potential. In fact, ocean energy resources are estimated with a potential of around 120,000 TWh/year, enough to satisfy more that 400% of the current global demand for electricity.
The great potential shown by ocean energies is due in part to the huge ranges of possibilities: wave, tidal, marine currents, ocean thermal, and osmotic (salinity gradient) energies. In addition to these ones, it is essential to take into account those created in a first moment for onshore locations, and later thought for sites in the sea: wind and solar (onshore on land and offshore on sea), geothermal and biomass. Nowadays, there are some barriers to achieve an adequate development of that sector [
1]. These barriers are mainly: the state of the technology with a lot of important challenges both in the short and medium term, the high capital cost in the first project of each technology, the lack of experience and environmental aspects, etc. These barriers are smaller or larger depending on each of the oceanic technologies and its current development stage.
In recent years, this industry has seen encouraging signs, with some of the technologies showing significant progress. This is the case for offshore wind and tidal energy, which can be considered mature enough to be ready for their commercial development. Regardless, other technologies follow a slower learning curve. Based on this, the forecasts in the short, medium, and long term are not ambitious at all [
2]. With the objective of promoting the sector, various initiatives have emerged to take advantage of its energetic potential. One of them is the Implementation Agreement of Oceanic Energy Systems (IEA-OES), which aims to have installed 337 GW of capacity worldwide in 2050, objective difficult to be achieved with current figures.
Another key aspect in the development of this type of project is the Levelized Cost of Electricity (LCOE) [
3]. LCOE value is very high in the case of prototype projects, having a lot of room for improvement. It is important to take into account that the energy generated must have a competitive cost [
4]. On the other hand, the use of green energy has other benefits. In fact, governments must support this type of project with some incentives to help the companies involved, above all in the early stages of the development of those technologies. On the other hand, a better perception of the citizens about marine renewable energy is essential, because nowadays there is a great ignorance of the possibilities of the ocean to offer clean and endless energy. A high percentage of citizens only know their disadvantages.
In Spain, the case is not different, and the commitments on renewable energy must be achieved. Although the development of onshore facilities is not negligible at all, offshore ones have not yet been developed except with R&D projects, patents and prototypes. So, the road ahead is huge in this area. For that, it is essential to know the available resource. A lot of studies have been carried out to estimate it, but mainly focused on one category, for instance, offshore wind or wave power. There are some examples of these studies focused on different areas in the world: one of themis about the analysis of methodologies for the assessment of wind resource in European Seas [
5]; another one is only focused in offshore wind around Korean peninsula [
6]; another one is about wave energy along the Cornish coast (UK) [
7]; another one analyzes the renewable mix to satisfy the needs of energy of Pantelleria, a real island in the Mediterranean Sea, focusing on starting to study minor island, including the study of different renewable sources: wind, solar and wave [
8]; another one studies the possible energy independence in Malta based on the use of Wave Energy Converters [
9]; another one is about wave energy resource variation in the coast of Ireland [
10]; and another one analyzes the influence of air density changes in the offshore wind potential over Northeastern Scotland [
11].
Furthermore, there are some resource analyses in Spain: one of them determines the wave energy resource in the Estaca de Bares area (Spain) [
12]; another one includes the evaluation of wave energy potential in the Spanish coast [
13]; another one is about a review of combined wave and offshore wind energy [
14]; another one is focused in wave energy in Menorca (Spain) [
15]; another one is related to wave energy trends and its variation, and is very important to be taken into account in the Bay of Biscay [
16]; and another one is about seasonal corrections due to the use of real values of air density for the assessment of offshore wind energy potential in the Iberian Peninsula [
17].
Regarding wave energy, it is can be stated that UK and Spain are pioneering countries. In Spain, some Wave Energy Converters (WEC) were installed in Mutriku breakwater, and this facility is in operation [
18,
19,
20].
Some investigations used different algorithms that included an importance sampling-based expectation-maximization algorithm for sequence detection in a single-photon avalanche diode underwater optical wireless communication [
21]. Other studies are focused on water desalination applied to Sicilia with the objective of solving the problem in water supply for areas with a chronic debt of water [
22]. In other cases, the researchers analyze energy saving in public transport using hydrogen produced by renewable sources instead of fossil fuels [
23].
The main objective of this review paper is to analyze the marine renewable energy resource in the Spanish coast, based on a preliminary and prospective analysis of the possibilities of applying the different types of energies that can be exploited at the sea in the different areas of the Spanish coast. This review gives approximate numbers. If an accuracy number is looked in a specific area, it will be necessary to carry out a detailed analysis in that area. Marine renewable energies are included in the Sustainable Development Goals (SDGs), especially in the SDG-7 (Affordable and Clean Energy, with the objective of ensuring access to affordable, reliable, sustainable and modern energy for all), and in the SDG-14 (Life below Water, with the aim of conserving and sustainable using the oceans, seas and marine resources for sustainable development).
To achieve the abovementioned objective, the first step of the work is based on the need of using renewable energies, in this case marine energies, to achieve a reduction on the polluting gases in the atmosphere. For this, it is essential to carry out an exhaustive search of information about the state of the art of marine energies, the potential and the forecast at short, medium and long term, etc. This is done for all the types of renewable energies to be harnessed in seas and oceans: offshore wind, wave, tidal, marine currents, ocean thermal, osmotic (salinity gradient), solar, geothermal and biomass.
The state-of-the-art is necessary to address the next parts of the work, consisting of carrying out a detailed study and analysis of the potential of marine energies firstly in the world based on a review study, and later along the Spanish coast. For this, the Spanish coast is divided into six different areas: (I) Cantabrian coast, (II) Galician coast, (III) South Atlantic coast, (IV) Canary Islands coast, (V) Southern Mediterranean coast, and (VI) Northern Mediterranean coast. The energy potential associated to each area is indicated. So, optimal areas for each type of marine energy are identified.
This paper gives the basis to achieve the established objectives for the installation of renewable energies in Spain, in the sense of incorporating marine energies, which have been left aside until now in the country. In Spain, it has mainly only been carried out theoretical studies, tests in laboratory and some prototypes.
2. Marine Energy Resource in the World: State-Of-The-Art
A review of energy resource to be exploited in the sea around the world is summarized in this section. The order followed related to the different type of marine energies is: (1) offshore wind, (2) wave, (3) tidal, (4) marine currents, (5) ocean thermal, (6) osmotic, (7) biomass, (8) geothermal and (9) solar. To end this section, LCOE figures are discussed.
There are some specific studies that focus on one or more types of marine renewable energies. Regardless, there is no research that includes all the information of all the above-mentioned types together. On the other hand, there are some specific studies for some countries and some of the types of the abovementioned energies, but not including all the countries and all the types. This can be seen with some examples: wave [
24], tidal, ocean thermal, ocean current and salinity gradient in Iran, wave energy in Asia [
25], wave energy in the Mediterranean Sea [
26], wave energy in Baltic Sea [
27], offshore wind energy in UK [
28], among others.
2.1. Offshore Wind Energy
Offshore wind is similar to onshore wind with some important changes in the protection of all the components against the aggressive marine environment, and with higher costs due to the difficulties related to the construction and operation in the sea [
29]. The main parameter to analyze the wind resource is the average wind speed at the hub height [
30]. This is the first value to be analyzed when identifying potential sites for wind facilities. For more detailed studies of wind resource assessment, other aspects must be considered, as the variability in the time and the horizontal and vertical space, wind direction, turbulence intensity, etc. The wind turbine generator model selected influences clearly when calculating the gross and net production of the facility.
World wind potential, including onshore and offshore, is estimated about 20,000–50,000 TWh/year, representing offshore wind more than 70% of those figures [
31].
Figure 1 shows the annual average wind speed of offshore wind at 90 m high, obtained using NOAA’s Blended Sea Winds global offshore wind dataset. That dataset included wind stresses and vector winds on the ocean surface, with a grid of 0.25°, and with different time resolutions: monthly, daily and 6-h. It includes data from 1986 until 2006 [
32]. Wind speeds represented in
Figure 1 were generated from via satellite observations and in-situ sensors. The direction was a combination of the products of National Centers for Environmental Prediction (NCEP) and European Center for Medium-Range Weather Forecasts (ECMWF). The use of both products together has gaps for obtaining wind speed values. Some complex algorithms were created to fill those gaps, and there are some numerous research groups trying to continue improving those results [
33,
34].
2.2. Wave Energy
Wave energy is a great potential marine renewable energy. Different studies trying to determine the wave energy potential have been carried out in the world. There are some of those studies focused on specific countries, and even in specific areas within a country [
35]. It is important to differentiate between wave energy potential, expressed in kW/m or kWh/year units, and wave energy production, only in kWh/year unit. The wave energy potential is the existing energy to be harnessed in a specific location. The wave energy production is the produced energy in the site using a specific wave energy converter [
36].
For wave energy potential estimation, the only parameters to be taken into account are the average wave climate, including the combination of significant wave heights and peak wave periods. Knowing the wave spectrum type to be considered (JONSWAP, TMA, Pierson-Moskowitz, etc. [
37]), it is easy to obtain the wave potential in a location. Characteristics of wave energy converters must be considered: minimum and maximum depth of the site, way of energy extraction, matrix power, etc. With all those data, the wave energy production (kWh/year) can be calculated [
38].
According to International Energy Agency (IEA) estimations, the wave energy potential can oscillate between 8000 and 80,000 TWh/year [
39].
Figure 2 shows the wave power distribution in the world. It is not homogeneous, with some areas characterized by more than 100 kW/m, and some of them below 10 kW/m [
38].
Figure 2 is based on Mork et al. [
40]. The global wave power dataset used was the default calibrated wave data set included in WorldWaves. WorldWaves included model data for the period between 1997 and 2006, a 10-year period, with 6-h frequencies and 0.5° grid, calibrated and validated with global TOPEX and JASON altimeter wind speed and wave height data. The calibration includes the consideration of some wave buoy records.
2.3. Tidal Energy
Tidal energy is caused by the gravitational attraction generated by the Moon and the Sun. Those gravitational forces are responsible for causing the ascent and descent movement of the seal level. Those movements are described by a wave with a period between 12 and 24 h. It is known as astronomical tides [
43]. The tidal range associated with the astronomical tide is different throughout the planet, with places where the tidal range can be neglected and with locations where it exceeds 10 m [
44]. Although astronomical tides are subject to general conditions, they may be affected by local conditions, such as wave reflection, the depths of the seabed, the shape of the coast, the existence of river mouths, resonance effects, etc.
The energy generated by the tides has been estimated around 26,000 TWh/year [
39]. Ocean tidal ranges can be determined based on harmonic analysis using the formula included in
Figure 3, where O1 and K1 are diurnal tidal constituents, M2 and S2 are semidiurnal tidal constituents, MHWS is mean high-water springs and MLWS is mean low water springs. The tidal range is expressed in meters. Tides can be exploited in two different ways. The first of these ways consists of the construction of dams, which serve as a barrier to maintain water at different levels on both sides of the dam, so that through turbines they can take advantage of the kinetic energy derived from the abovementioned difference in levels. The second way takes advantage of the speed of currents due to differences in sea level without the need of building dams. This process is similar to the use of the energy of ocean currents, and in fact some ocean currents harnessed are tidal currents.
To be able to produce electricity based on tidal dams, the location has to provide a tidal range greater than 5 m [
43,
45,
46]. This strict condition reduces the number of viable sites for the use of tidal energy, as it can be observed in
Figure 3.
2.4. Marine Current Energy
Ocean currents are due to a mix of periodic and aperiodic water movements. There are seasonal and short duration changes, and a lot of oscillatory and sporadic movements superimposed to the general oceanic circulation. Current observation is a very complex challenge [
48]. The origin cause of marine currents is mainly the difference of temperature, salinity, etc. adding to them the influence of the wind, tides, Earth rotation, etc. [
49,
50,
51].
Generally, the most intense marine currents are caused by the effect of the wind and the tides. In case of being due to tides, it is usual to name it a tidal stream. Tidal stream is the most harnessed marine current energy type at the moment. Therefore, this paper is going to be focused on tidal stream when marine current energy is mentioned.
Focusing on tidal stream, the bathymetry can also help to produce a remarkable increase in its characteristics, mainly in narrowing areas with a consequent velocity increase [
52,
53]. The energy capacity of this renewable energy source is high, estimated around 800 TWh/year [
39]. This potential can be increased if it could be taken advantage of not only tidal currents. The speed of currents has to be greater than 2 m/s for the harnessing of this type of energy [
54].
2.5. Ocean Thermal Energy
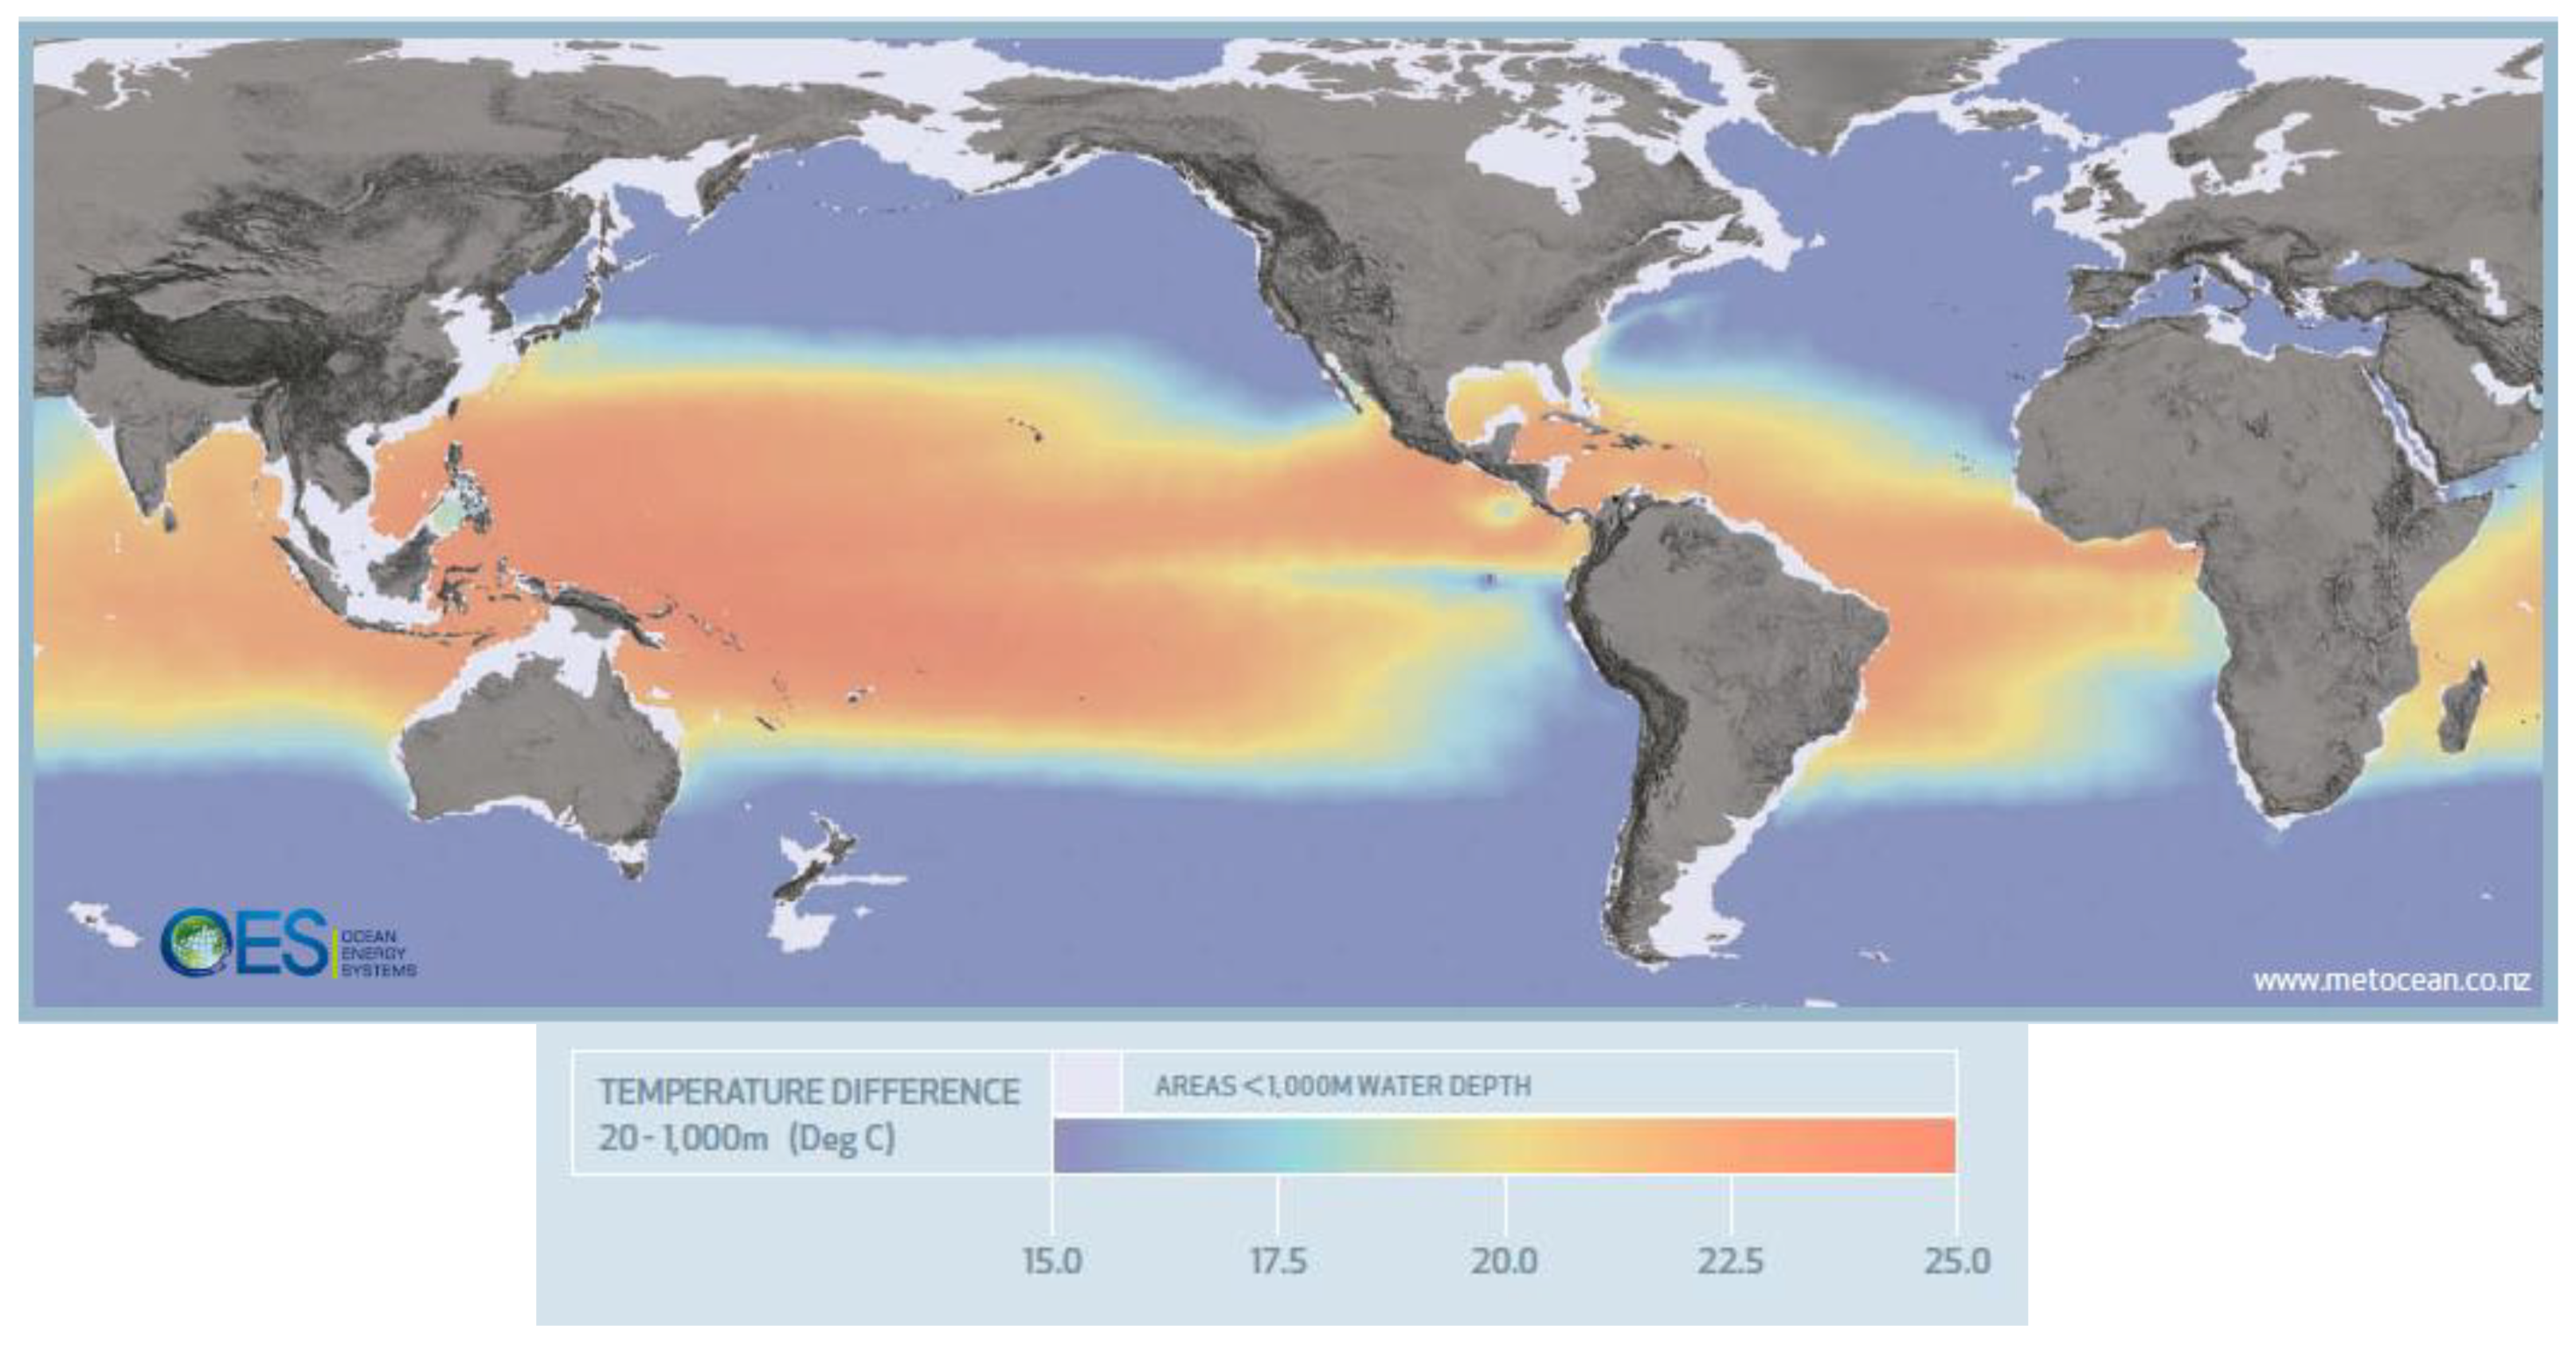
Ocean thermal energy is generated as a consequence of a process that begins with the incidence of solar rays on the sea, increasing its temperature [
55]. Sea water allows the rays to penetrate through its surface, being able to increase the temperature of lower layers of sea water. The penetration will depend, among others, on the water turbidity state. In lower layers the radiation decreases and, therefore, the temperature decreases. This has as a consequence a vertical distribution of temperatures. In fact, this can also be explained as solar energy which is stored as heat in the surface layer of the ocean, and that heat is distributed to water depths around 100 m due to the waves and surface currents. Cold water is found deeper due to its higher density, and this different mass of water is moved by ocean currents. In the world, the temperature difference is between 10 and 25 °C, with the maximum values close to the Equator [
56].
The vertical distribution is marked by two areas with a big change in the temperature between them. The temperature difference between the marine surface and one thousand meters depth in a specific location can allow energy production. This is known as ocean thermal energy. The harvesting of this type of energy is based on the difference between deep cold water and warm surface water; this allows running a heat engine to produce electricity. The mechanism consists of the shallow ocean water heat a liquid in the engine characterized by having a low boiling point. The liquid turns into vapor and it moves a turbine. This vapor cools with the deep water, restarting the generation cycle.
To have a profitable project, the difference in temperature must be at least 20 °C. This condition limits the possibilities of finding a suitable location for ocean thermal energy facilities. The most interesting ones are those located in equatorial and subtropical areas, where the minimum temperature on the surface is around 24 °C and temperatures at depths around one thousand meters are usually around 5 °C. The estimate for ocean thermal energy resource around the world is between 30,000 and 90,000 TWh/year, being usable around 10,000 TWh/year [
39].
Figure 4 shows the temperature difference in degrees along the Earth.
2.6. Osmotic Energy
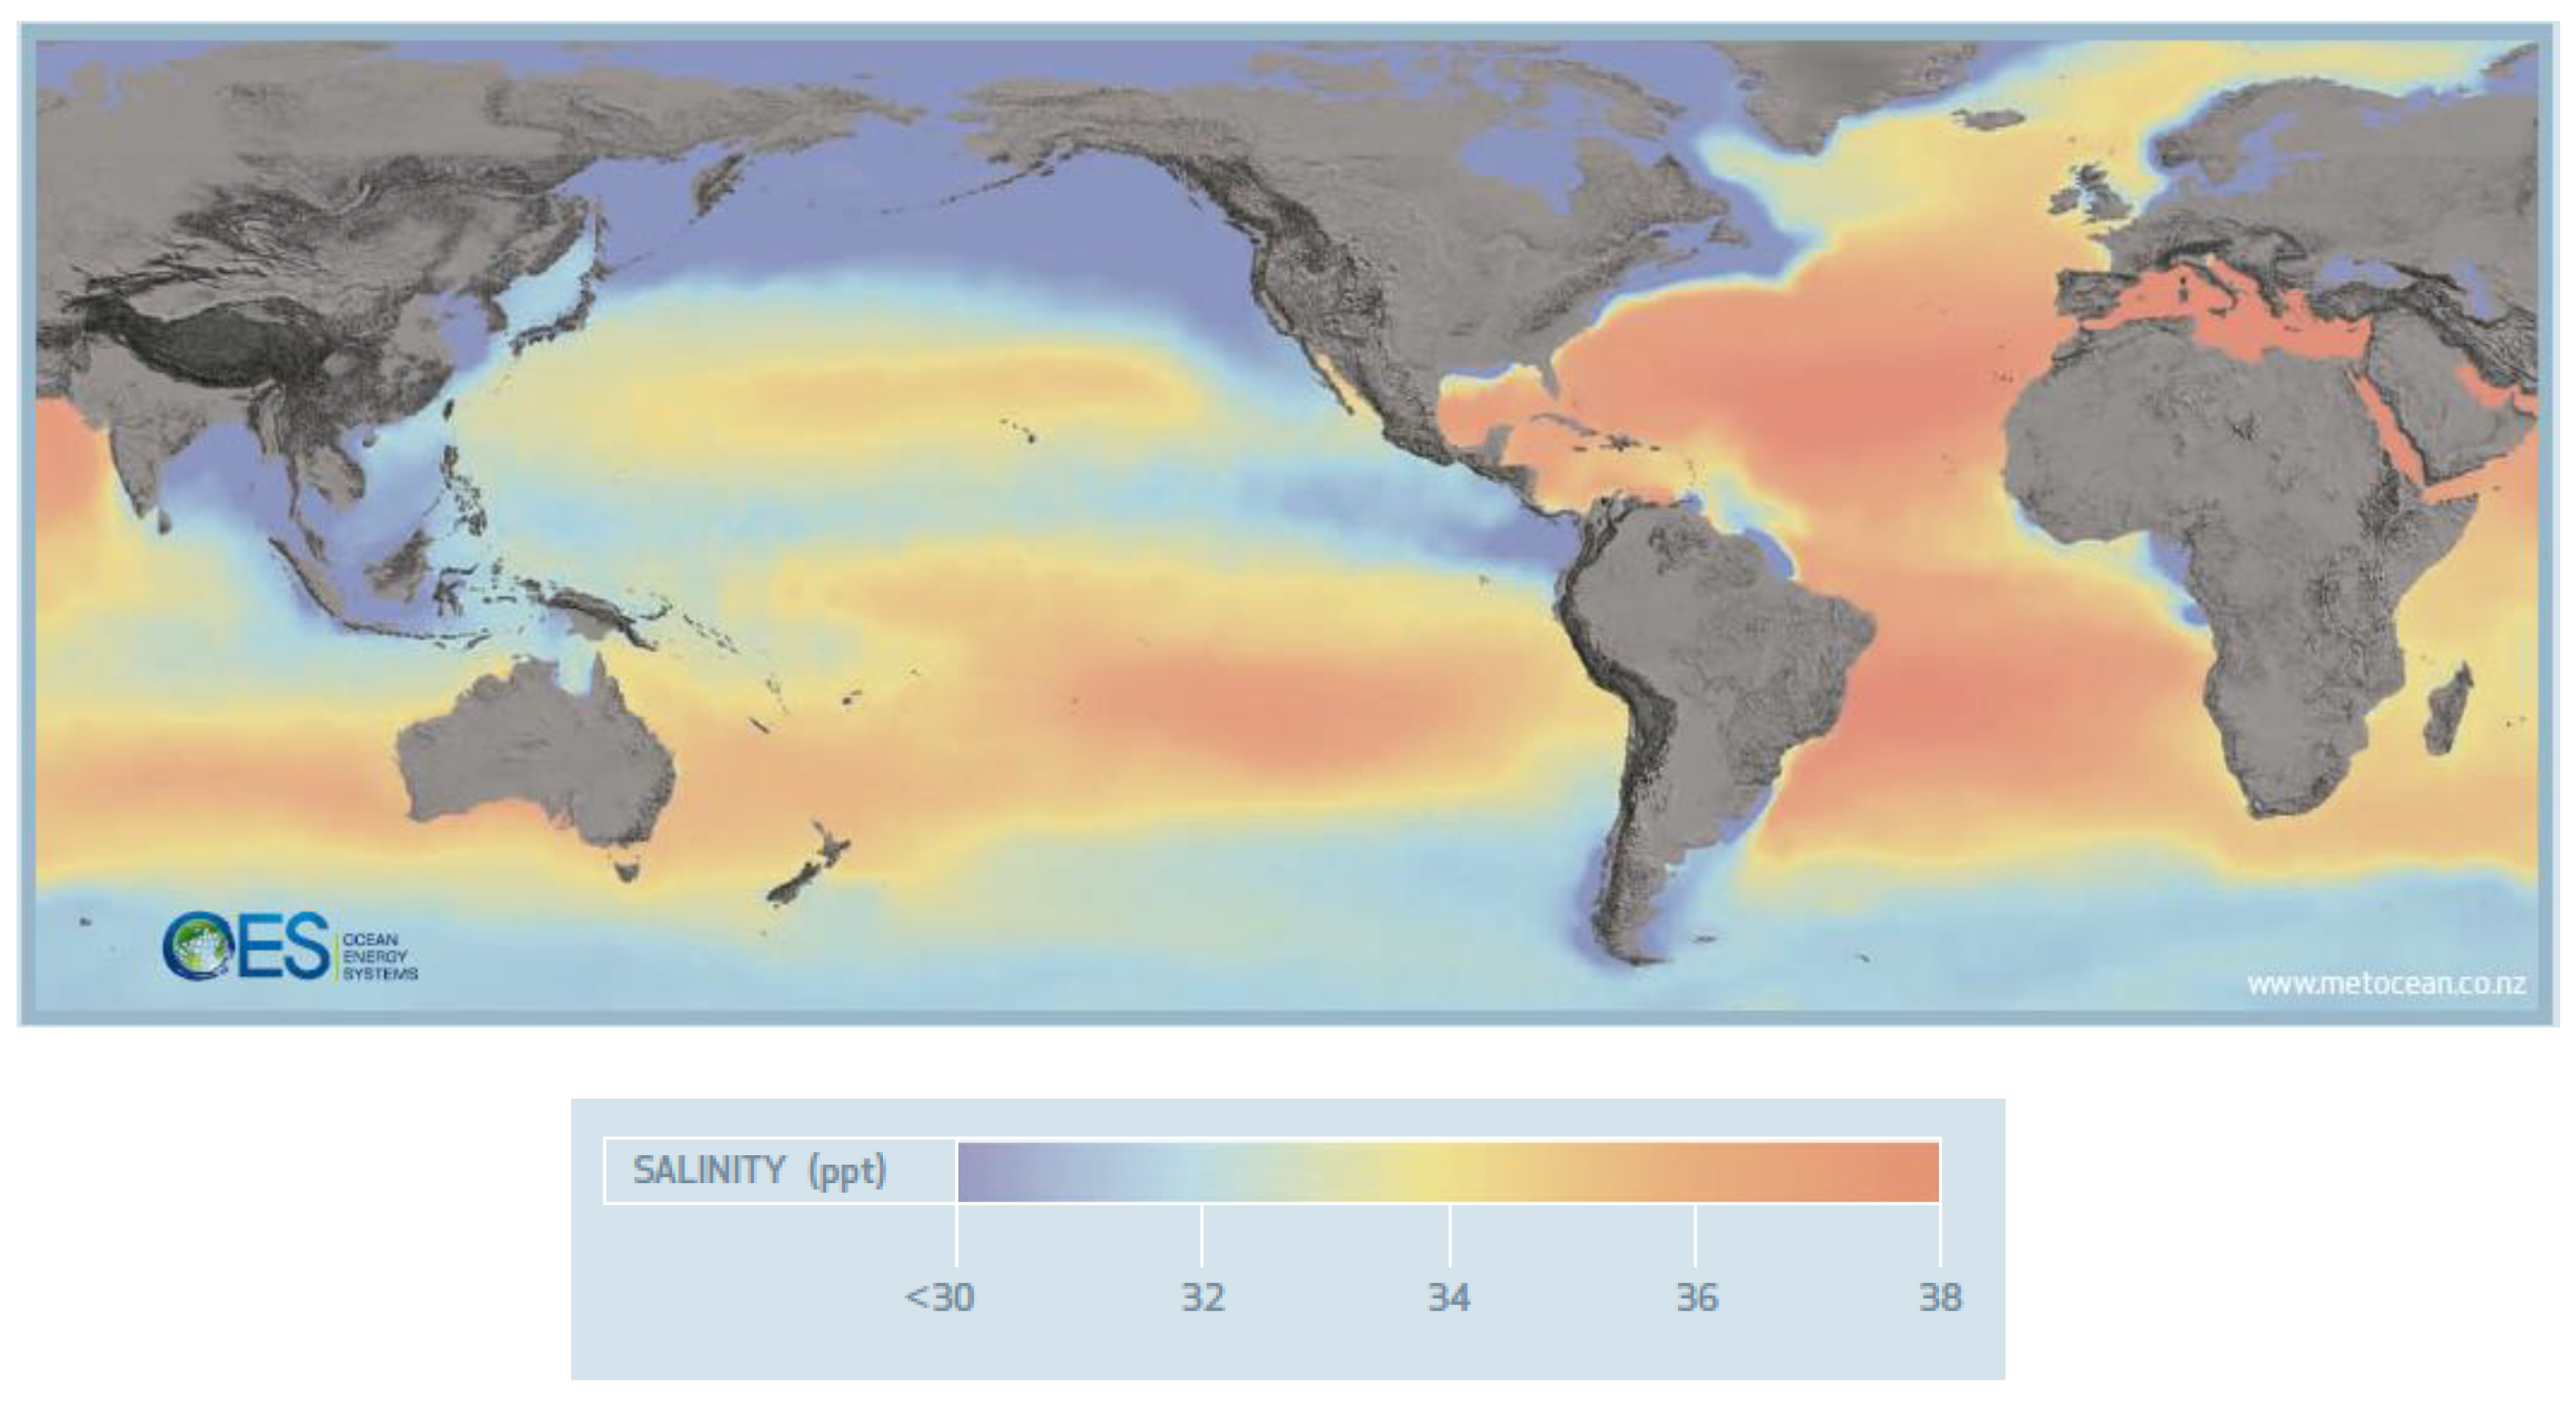
Osmotic energy is based on the difference that occurs in the osmotic pressure due to the difference in salinity between fresh water versus saltwater [
57]. This process occurs when the two fluids come into contact causing a balance in the concentration of salt between them. It is essential that the facilities are located in river mouths looking for the salinity difference [
58]. However, the mouths of rivers can present limitations for the installation of this type of facility due to possible conflicts with other uses or activities usually developed in the rivers’ mouth.
The energy potential is estimated about 2000 TWh/year [
31].
Figure 5 shows salinity concentration in seas and oceans around the world, with greater salinity concentration in places like the Mediterranean Sea, and less salinity concentration in the Arctic Ocean.
2.7. Biomass Energy
Biomass can be defined as the entire living mass of both animal and vegetal origin existing on the Earth. Most of the biomass can be burned for energy production, in the form of heat, electricity or fuel through different types of treatments [
59]. With regard to the biomass in the sea, algae are used to obtain biofuels, based on their function of using the sun energy to transform carbon dioxide, water and organic nutrients into oxygen and vegetable biomass [
60]. These have microbes constituting 90% of the biomass, which gives them a lot of energy. It favors its conversion into various biofuels thanks to its low energy density.
Two types of algae can be differentiated: the microalgae from the aquatic systems and the larger algae known as macro algae that grow attached to stable substrates coming mainly from the seabed. Although microalgae have been studied in recent years for biodiesel production, marine macroalgae have awakened recently a great interest for obtaining different biofuels due to its chemical composition and ability to produce large biomass. Macroalgae have important advantages as a source of biofuels [
61], if it is compared to other raw materials. They have a higher growth than other plants used until now, and its large-scale cultivation is feasible, profitable and it does not occupy land or require fresh water [
62].
The exploitation of this type of cultivation areas is currently very limited. There are around 300,000 hectares of cultivation in the world, which represent more than 90% of global production, estimated at 24.9 million tons. The International Federation of Aquaculture (FAO) indicated that the production of macroalgae increases by 6% every year [
63].
Figure 6 shows the natural distribution of macroalgae in shallow waters, and the capacity of coastal areas for biogas and the percentage of local Net Primary Productivity (NPP).
2.8. Geothermal Energy
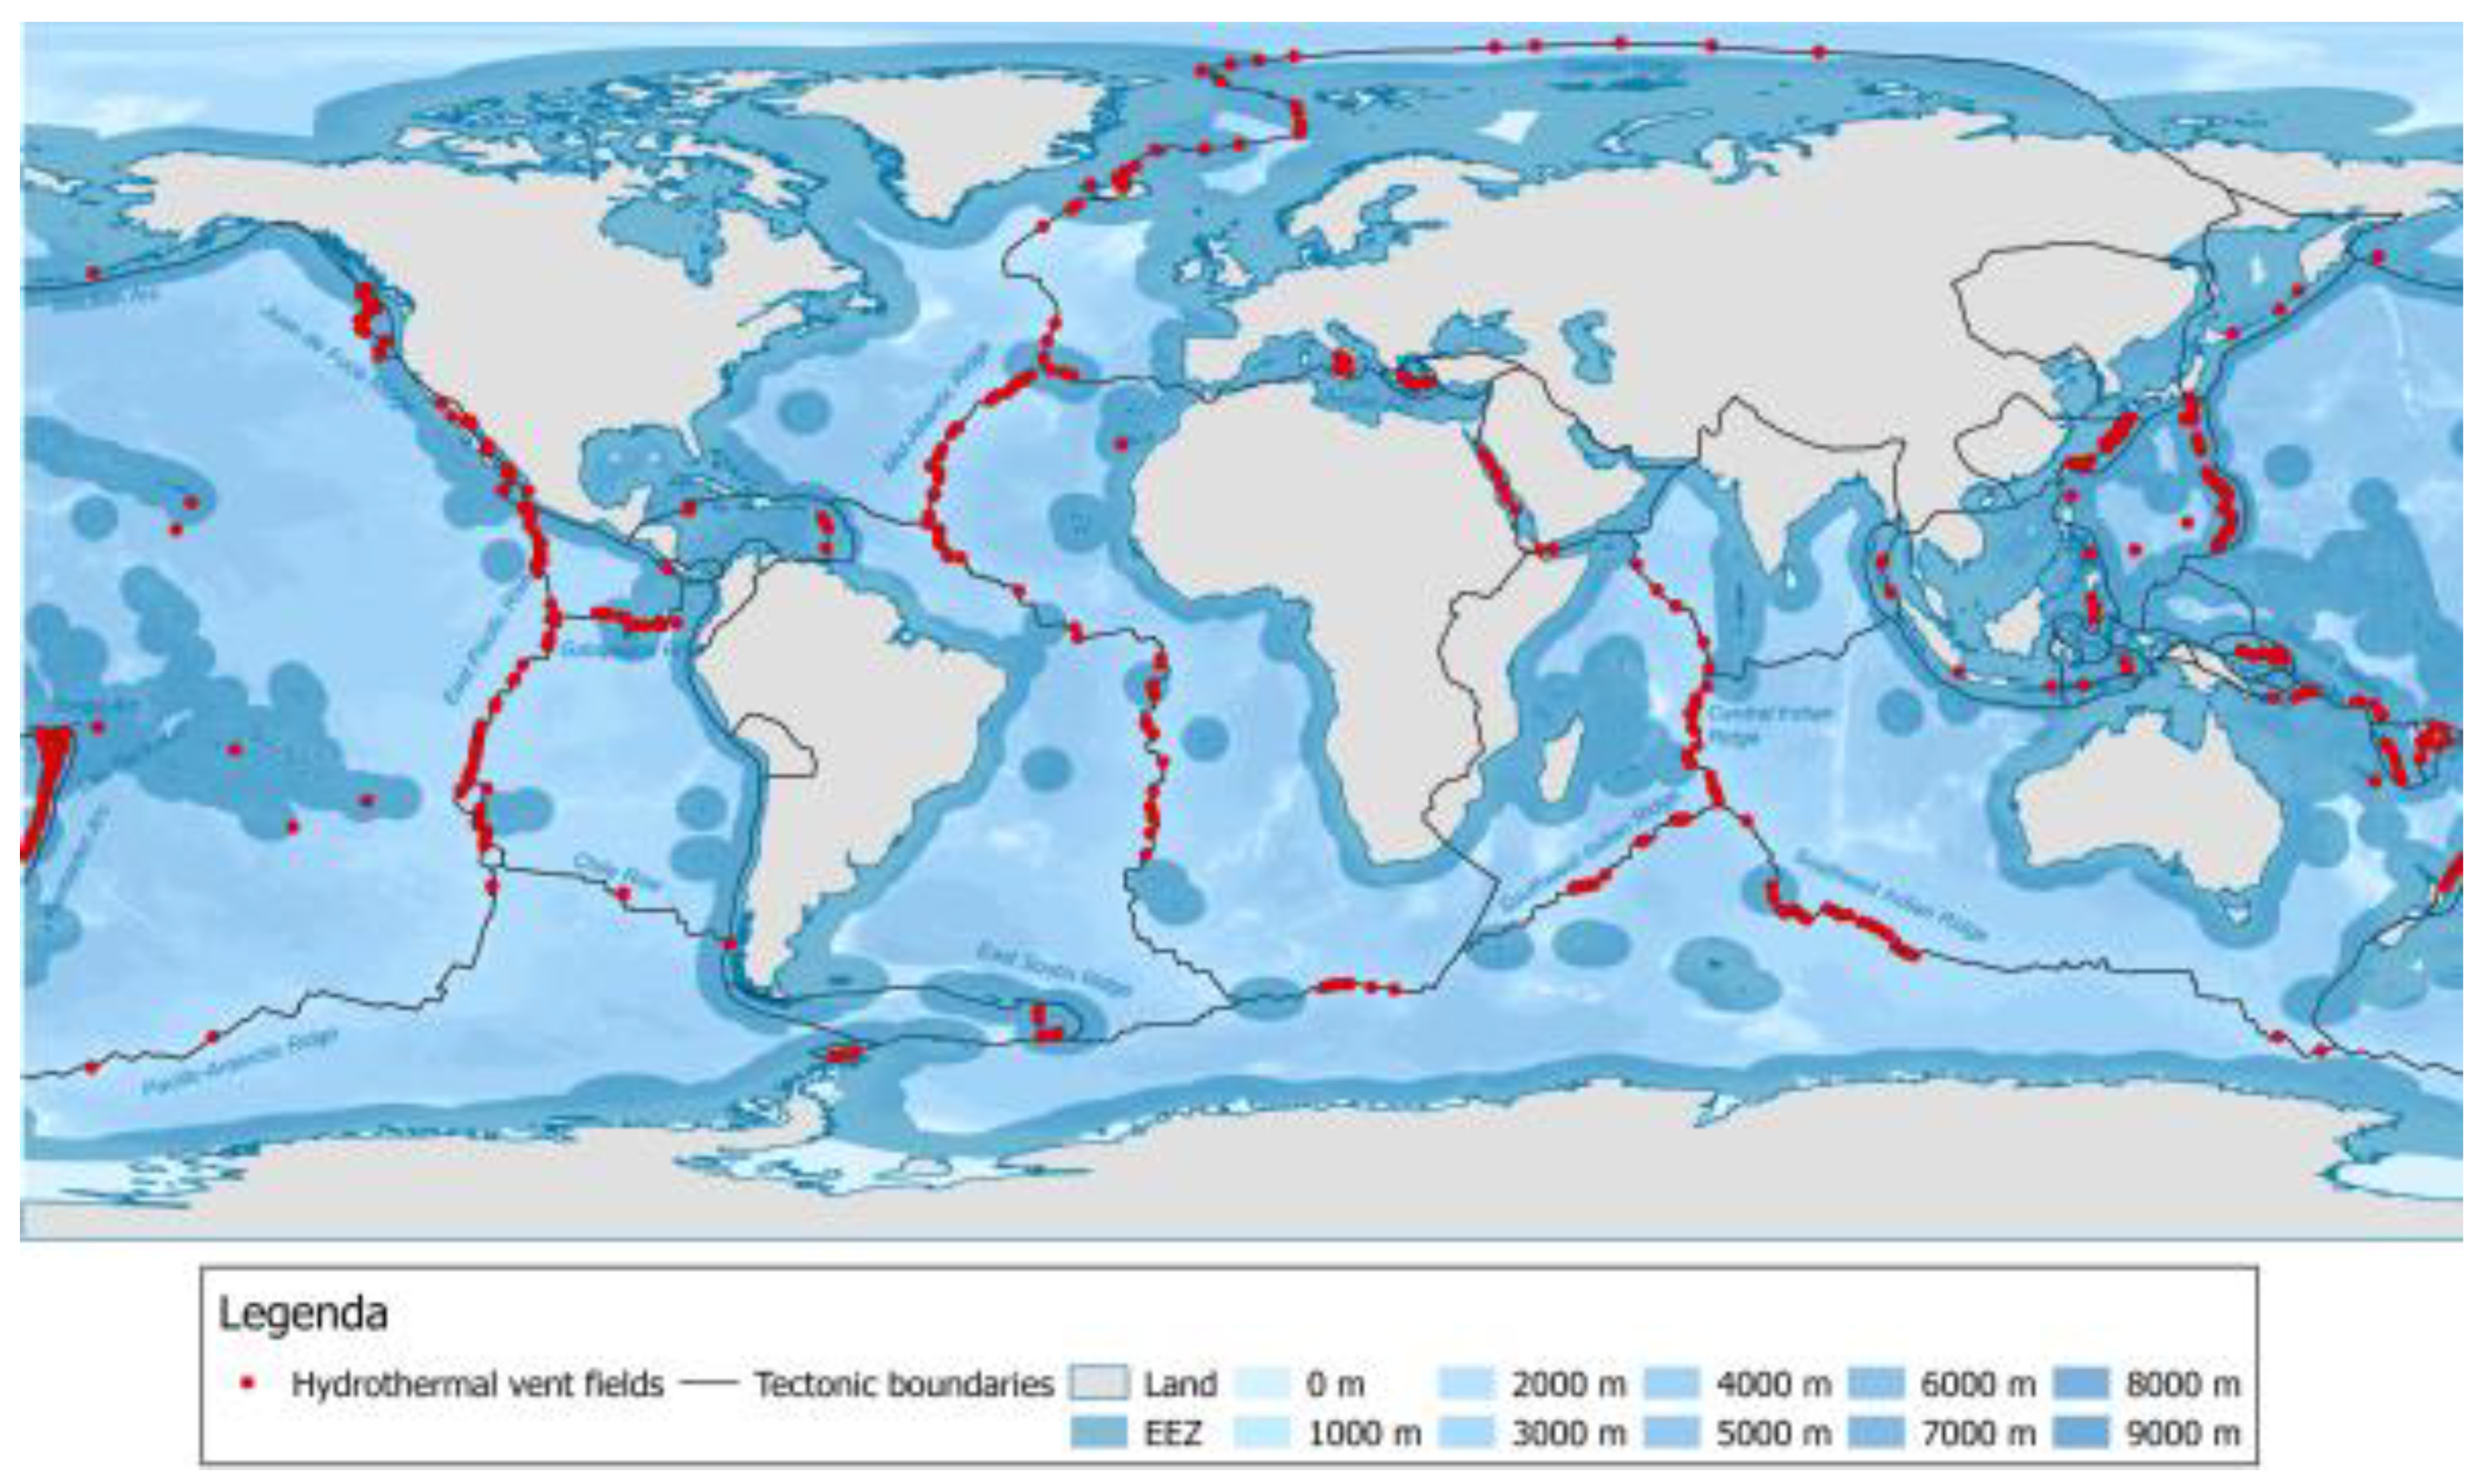
Underwater geothermal energy is based on the existence of deep cracks in the seabed generated by divergent movements of the plates. These movements produce cracks, allowing vertical transfer of the magmatic heat from the mantle to the floor of the ocean. The sea cold water, when coming into contact with these cracks, warms up and chemically changes, producing hot water enriched with hydrogen sulfide expelled through the cracks produced by the movements of the plates, and known as hydrothermal vents. The hot water can be expelled up to 400 °C, getting a high heat flow for its transformation into electrical energy.
Different studies were carried out to analyze the scope of hydrothermal ventilations along the Earth’s crust. There are around 65,000 km of oceanic ridges, representing 30% of all the heat released in the Earth, of which a significant number of ventilations have been obtained hydrothermal vents located at depths greater than 2000 m (
Figure 7). They are usually found in the Pacific and Atlantic Oceans, although there are some cases in the Mediterranean Sea and in the Indian Ocean. Only 13,000 km of the existing ocean ridges have been explored up to the moment, and only around 3900 km (about 30% of the surface explored) have good skills to be exploited.
Marine geothermal energy has a very high potential, but hardly quantifiable, since at present there is no defined system that allows knowing the real and usable potential of this source. This is because the state of technological development is not very mature. There are some estimates, considering only the explored areas, indicating that more than 1000 GW can be extracted [
65,
66].
2.9. Solar Energy
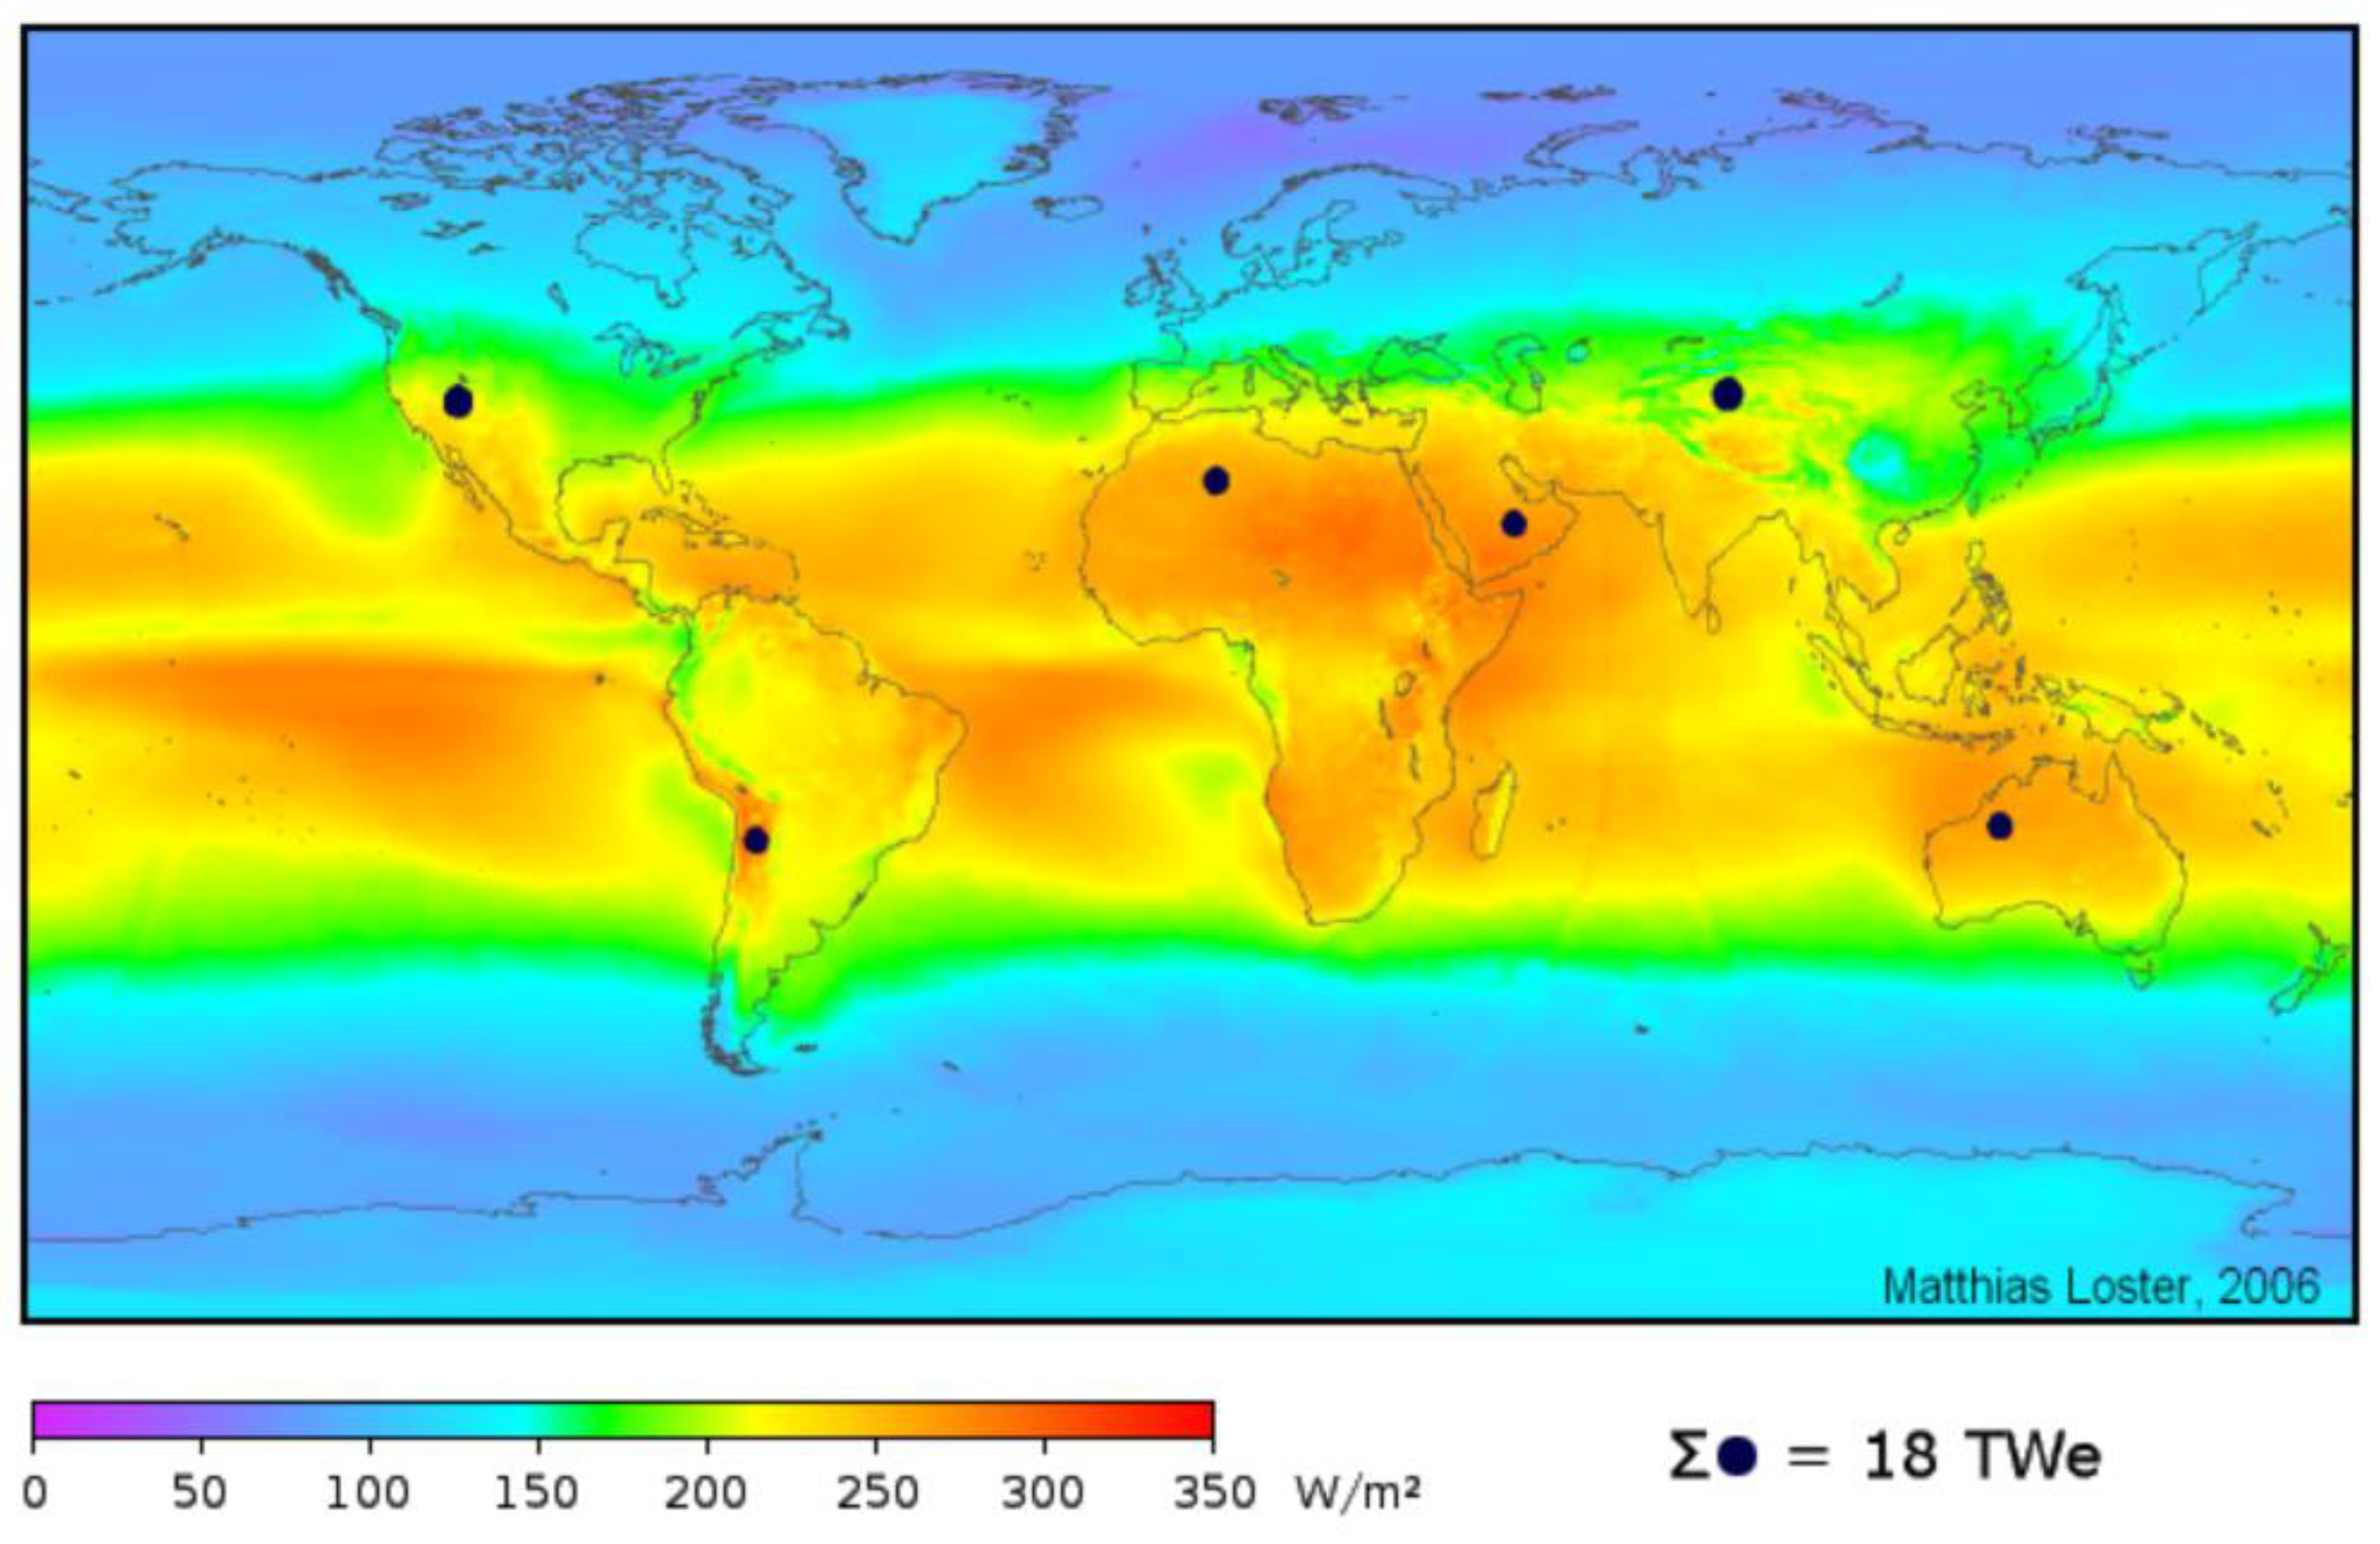
Solar energy can be used for electricity production by direct conversion of solar radiation into electric current passing through solar or photovoltaic cells. Its implementation to date has been done mainly onshore, but some companies in the sector have developed some designs with the objective of being able to take advantage of this energy in the surface of seas and oceans [
67]. Maritime surface represents more than 70% of the global surface of the earth.
Figure 8 shows the solar radiation marine great potential, with around 18 TWe only in the black points.
As an outline of the state of this technology,
Figure 9 shows a summary of the power installed in 2015 and the forecasts for 2020 and 2030, focused on Europe considering: (a) waves, currents and tides, (b) offshore wind, (c) onshore solar, and (d) offshore wind.
2.10. Levelized Cost of Energy (LCOE) Data
For investments decision-making, energy industry uses economical models to determine and compare the energy cost of different technologies. The most known one is the levelized cost of power (LCOE). It depends on capital, operating and fuel costs. The value of LCOE is obtained by dividing the sum of costs over lifetime by the sum of electrical energy produced over lifetime. It is important to take into account that most of renewable technologies are capital intensive but have low operational costs, while fossil fuel-based technologies may be cheaper to construct but much more expensive to operate.
Anyway, it is important to clarify that LCOE values are more reliable when there are a lot of installed facilities in a specific technology. So, the existing and reliable current LCOE data (median values) are given for offshore wind: 0.1434
$/kWh, for wave: 0.3263
$/kWh, for tidal and marine currents together: 0.3263
$/kWh. The rest of technologies included in the paper have not a reliable LCOE value. On the other hand, it is recommended to know LCOE values of other onshore renewable technologies: 0.0777
$/kWh in onshore wind, 0.1320
$/kWh in solar photovoltaic, 0.2466
$/kWh in solar thermal, 0.0479
$/kWh in hydropower, 0.0951
$/kWh in biomass, 0.0635
$/kWh in geothermal [
69]. Although there are many uncertainties regarding the LCOE values in the medium term, it is expected that they will stabilize and even decrease as the learning curve progresses.
3. Practical Application: Marine Energy Resource in the Spanish Coast
Spain has a larger potential of marine energies as has been indicated by Montoya et al. [
70], mainly focusing that work on onshore renewable energies, including a brief section about marine energies. The Spanish coast has more than 7800 km; the culture and the economy are very linked to the ocean in coastal areas. The study and exploitation of marine renewable energies are destined to play an essential role in the medium term. Many investigations have been carried out in the field of marine renewable energies in last years; specialized technology centers and demonstration plants have been installed focused on advancing in this field, which will be essential to achieve progress and development. Based on the investigation and different tests and errors, it will be possible to reach the sufficient maturity of the installations of the use of marine renewable energies so that its commercial development is feasible.
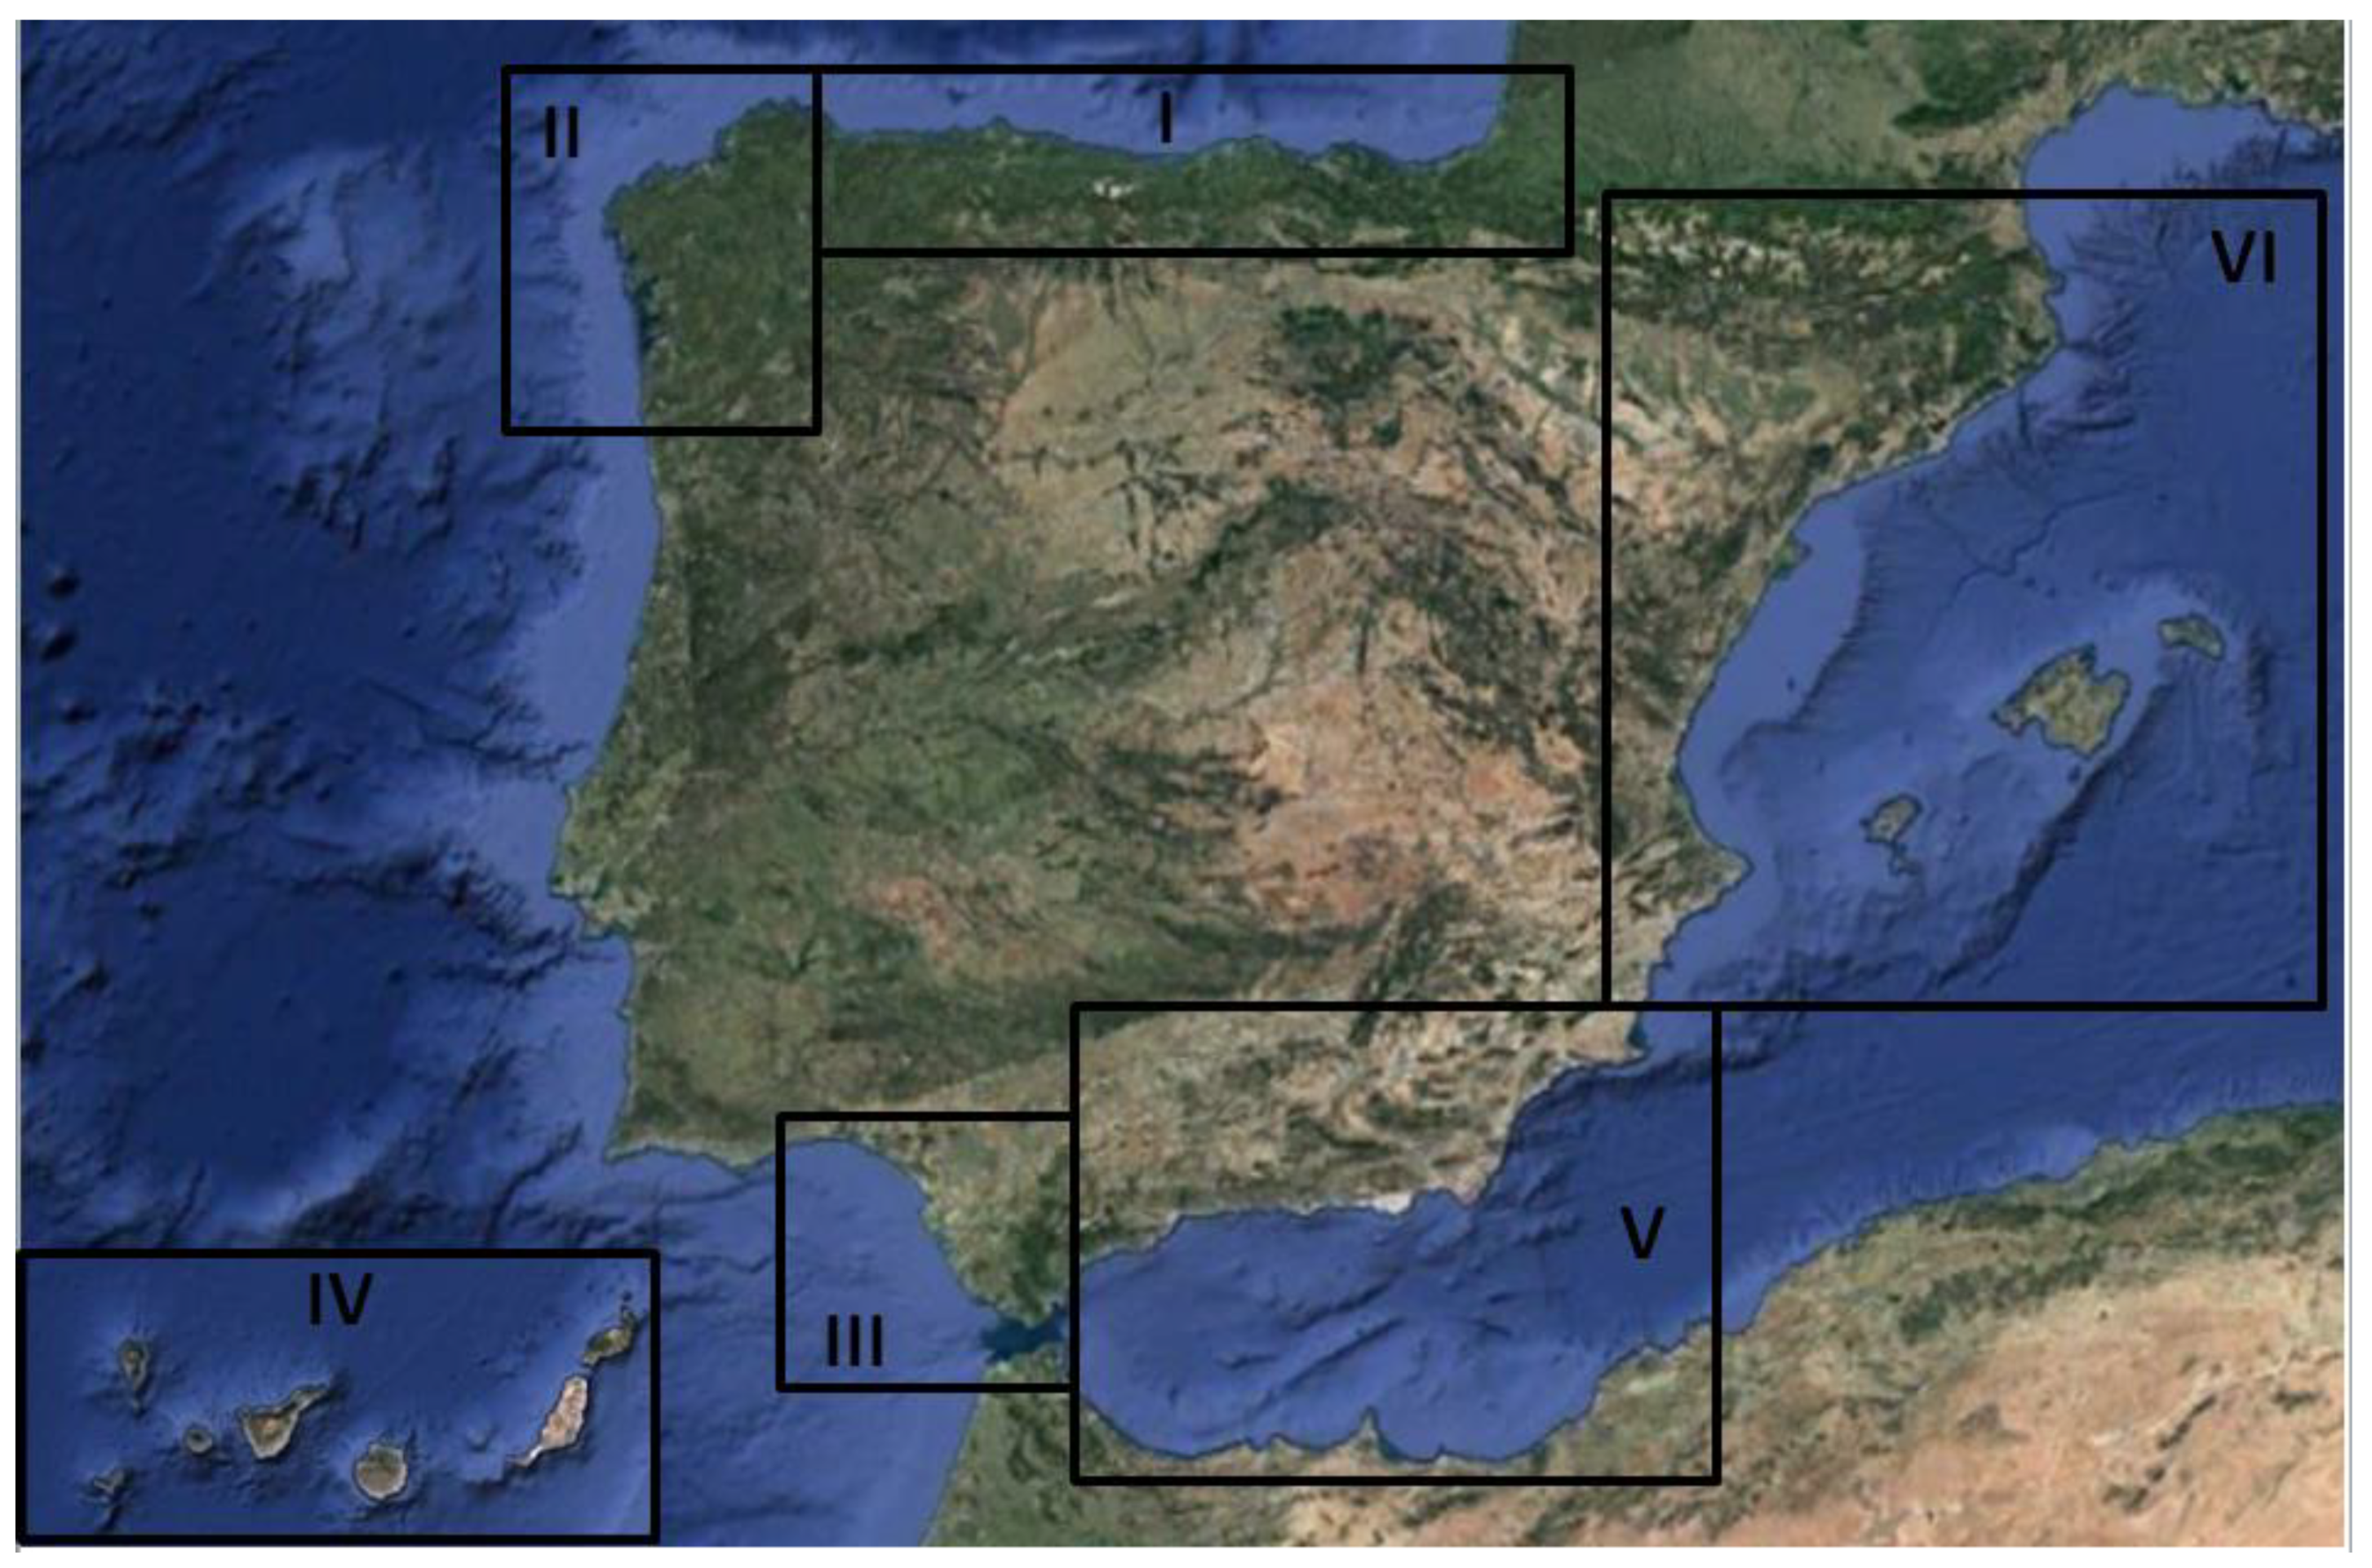
Spain has a very heterogeneous coastline in terms of energy potential. It belongs to a peninsula (the Iberian Peninsula), connected in the Northeast with France. In addition, the Spanish territory also has two archipelagos of islands: The Canary and Balearic Islands. Canary Islands are located in the Atlantic Ocean, southwest of the Iberian Peninsula and close to the African coast. Balearic Islands are located in the Mediterranean Sea, east of the Iberian Peninsula. For this reason, the Spanish coast cannot be studied as a single area since a great mistake would be made. The best alternative to this situation is to zone this coast in areas with homogeneous energy characteristics. Therefore, this paper divides the Spanish coast into six different areas: (I) Cantabrian coast, (II) Galician coast, (III) South Atlantic coast, (IV) Canary Islands coast, (V) Southern Mediterranean coast, and (VI) Northern Mediterranean coast (
Figure 10). Areas I, II, III, V and VI correspond to the Iberian Peninsula, with the Balearic Islands included in Area VI. Area IV refers to the Canary Islands.
As it is done in the previous section, the order followed for the analysis in this section is: (1) offshore wind, (2) wave, (3) tidal, (4) marine currents, (5) ocean thermal, (6) osmotic, (7) biomass, (8) geothermal and (9) solar. So, the different types of energy are evaluated in the six areas in which the Spanish coast is divided.
3.1. Offshore Wind Energy
Wind resource study is based on wind speed map from Spanish IDAE (“
Instituto para la Diversificación y Ahorro de la Energía”, in Spanish language) covering a coastal strip of 24 nautical miles, and with the data of the annual average wind speed at 80 m high (
Figure 11) [
71].
This analysis considers next classification depending on the annual average wind speed:
Low: annual average wind speed lower than 6 m/s, in white.
Medium: Low: annual average wind speed between 6 and 7 m/s, in greenish.
Medium: High: annual average wind speed between 7 and 8 m/s, in yellow and orange.
High: annual average wind speed higher than 8 m/s, in pink and reddish tones.
The values of the annual average wind speed (m/s) are shown in
Table 1 for all the areas previously defined, at different water depths (20, 50 and 100 m). The values were obtained after making the average of the annual speeds in different points of each specific zone that make up the different areas. In Cantabrian coast (Area I), specific zones defined are País Vasco, Asturias and Cantabria. In Galician coast (Area II), there is only one specific zone, Galicia. In South Atlantic coast (Area III), the specific zones are Huelva, Cádiz and Estrecho-Ceuta. In the Canary Islands coast (Area IV), there is only one specific zone, Canary Islands. In Southern Mediterranean coast (Area V), the specific zones are Málaga, Almería, Melilla and Murcia. In Northern Mediterranean coast (Area VI), the specific zones are Valencia, Cataluña and Islas Baleares (Balearic Islands).
As it is observed in
Table 1, the most interesting zones for offshore wind facilities are Cádiz at 100 m depth and Estrecho-Ceuta at 50 and 100 m depth, both in Area III (South Atlantic coast) with more than 10 m/s of average wind speed at 80 m high.
Zones and areas with an average wind speed above 7 m/s are: Asturias at 50 and 100 m depth and Cantabria at 100 m depth, both in Area I (Cantabrian coast), Galicia at 50 and 100 m depth in Area II (Galician coast), Huelva at 50 and 100 m depth, Cádiz at 20, 50 and 100 m depth, and Estrecho-Ceuta at 50 and 100 m depth, the three ones in Area III (South Atlantic coast), Canary Island at 100 m depth in Area IV (Canary Island coast), and Málaga at 50 and 100 m depth, Almería at 20, 50 and 100 m depth, Melilla at 50 and 100 m depth and Murcia at 50 and 100 m depth the four ones in Area V (Southern Mediterranean coast). Area VI (Northern Mediterranean coast) has values below 7 m/s.
3.2. Wave Energy
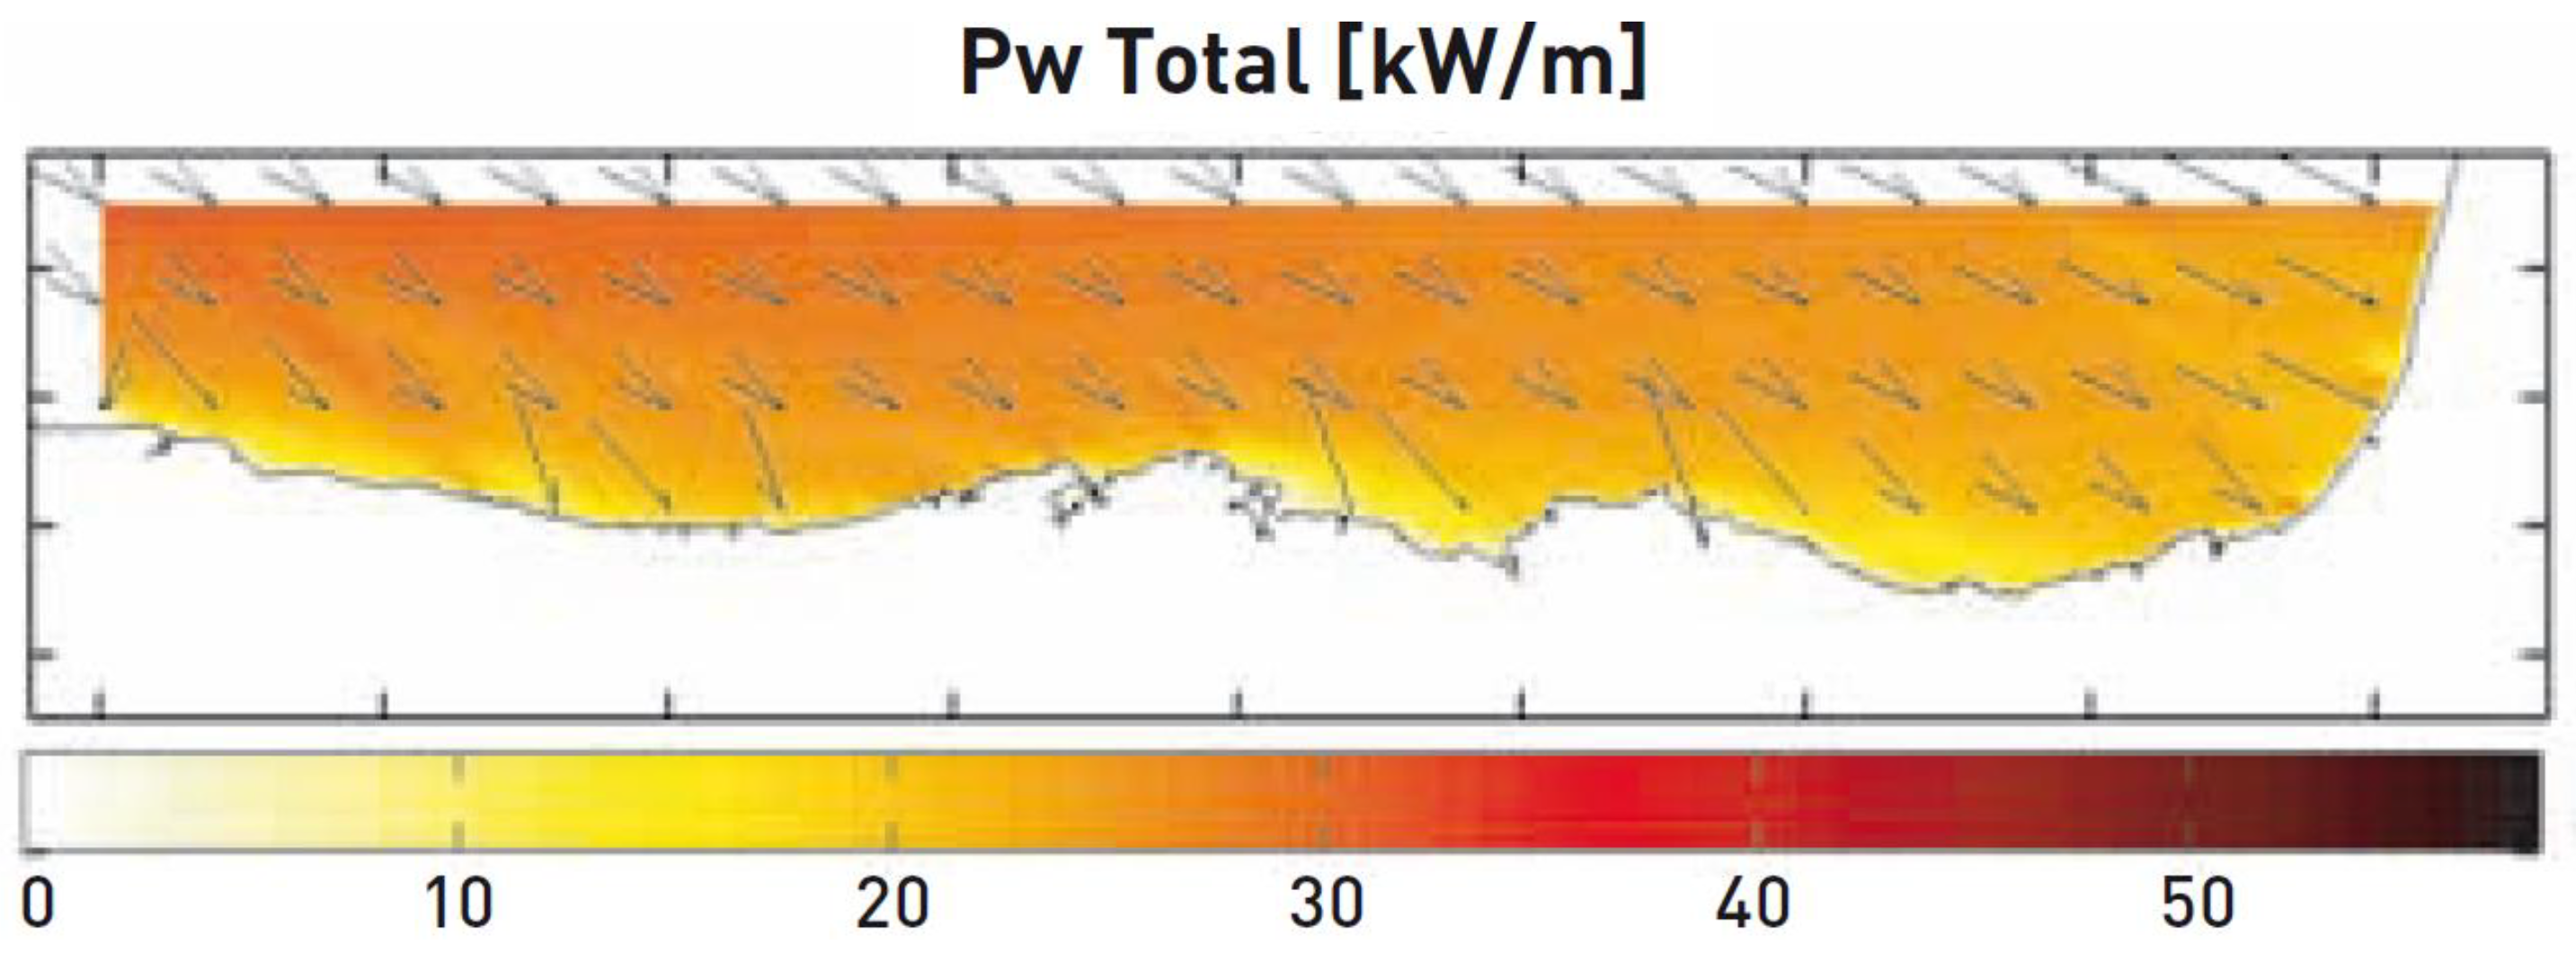
To analyze the potential of wave energy on the Spanish coast, IHCantabria wave atlas is used [
72,
73]. It allows knowing the average wave potential in different locations of the Spanish coast (
Figure 12). For the study of each area, IDAE annual mesh maps are used, allowing obtaining the detailed characteristics of the resource, both considering the power and direction of waves (
Figure 13). Wave energy resource is studied for depths of 20, 50 and 100 m, and also for deep waters.
Based on Atlas data,
Table 2 is prepared. It includes the values of the annual average wave power for different depths in kW/m for each area and specific zone inside each area. Input data are from IDAE through the GOW (Global Ocean Waves) database. The specific zones defined for each area are the same defined for the offshore wind energy in
Section 3.1.
Analyzing previous results, the most interesting areas for harnessing the wave resource power, are:
Galician coast, the area with the greatest potential in Spain, with values maximum above 35 kW/m.
Cantabrian coast, with an average of maximum values around 30 kW/m.
Canary Island coast, with a potential higher than 10 kW/m, specifically on the northern facades if the islands.
The worst locations for wave energy facilities in the Spanish coast are: Murcia, Almería, Cataluña, Málaga, Valencia, Islas Baleares, Cádiz, Estrecho-Ceuta, Huelva and Melilla.
3.3. Tidal Energy
The resource of tidal energy is studied based on the data recorded in “Puertos del Estado” tidal gauges network [
74], located in different coastal areas, mainly ports location.
Table 3 includes different aspects to be considered in the analysis: HAT (High astronomical tide), MHWS (Mean high water springs), MHWN (Mean high water neaps), MSL (Mean sea level), MLWN (Mean low water neaps), MLWS (Mean low water springs) and LAT (Lowest astronomical tide). LAT in all the cases is taken as the zero level of the harbor where the tidal gauge is located.
In Cantabrian coast (Area I), the zones defined are Bilbao, Cantabria and Gijón. In Galician coast (Area II), the zones are Ferrol, Coruña, Vilagarcía and Vigo. In South Atlantic coast (Area III), the zones are Huelva and Bonanza. In Canary Islands coast (Area IV), the zones are Lanzarote, Fuerteventura, Las Palmas, Tenerife, Gomera, La Palma and Hierro. In Southern Mediterranean coast (Area V), the zones are Málaga, Motril, Melilla and Almería. In Northern Mediterranean coast (Area VI), the zones are Gandía, Valencia, Barcelona and Ibiza.
Based on buoys data and current technical minimum criteria before mentioned, tidal range greater than 5 m, the construction of tidal range facilities is not viable in the Spanish coast.
3.4. Marine Currents Energy
To analyze the resource of the energy of marine currents along the Spanish coasts, a study is made with the values obtained in different buoys of “Puertos del Estado” [
74], installed along the Spanish coast.
Table 4 shows marine current speeds in each buoy, including maximum and average speeds between 2007 and 2016. This is the only information available about marine currents in Spain, so the analysis is based on it. Regardless, it will be interested to develop a measurement campaign to determine marine current speed along the water column.
In Cantabrian coast (Area I) the buoys are Bilbao-Vizcaya and Cabo de Peñas. In Galician coast (Area II), the buoys are Estaca de Bares, Villano-Sisargas and Cabo Villano. In South Atlantic coast (Area III), the buoy is Golfo de Cádiz. In Canary Islands coast (Area IV), the buoys are Gran Canaria and Tenerife. In Southern Mediterranean coast (Area V), the buoy is Cabo de Gata. In Northern Mediterranean coast (Area VI), the buoys are Cabo de Palos, Valencia, Tarragona and Dragonera.
The most interesting area for harnessing of marine current power in Spain is Gibraltar Straight, with average values above 1.5 m/s and maximum figures higher than 2.5 m/s.
Table 4 show that there are only 9 maximum values above 100 cm/s: 128 cm/s (Estaca de Bares, year 2016), 127 cm/s (Cabo de Gata, year 2015), 125 cm/s (Cabo de Palos, 2015), 120 cm/s (Cabo de Palos, year 2012), 116 cm/s (Cabo de Gata, year 2016), 110 cm/s (Tenerife, year 2014), 108 cm/s (Valencia, year 2010), 101 cm/s (Villano-Sisargas, year 2015), 101 cm/s (Cabo de Gata, year 2012).
3.5. Ocean Thermal Energy
To analyze the resource of ocean thermal energy along the Spanish coast, a study of the values in “Puertos del Estado” buoys was performed [
74]. The values of maximum, minimum and average temperatures are established for each buoy, considering data in the last 10 years.
Table 5 includes this data for all the areas in the Spanish coast.
In Cantabrian coast (Area I), the buoys are Costera Bilbao, Pasajes, Gijón, Bilbao-Vizcaya and Cabo de Peñas. In Galician coast (Area II), the buoys are Estaca de Bares, Villano-Sisargas and Cabo Silleiro. In South Atlantic coast (Area III), the buoys are Golfo de Cádiz, Cádiz and Tarifa. In Canary Islands coast (Area IV), the buoys are Gran Canaria, Tenerife Sur and Tenerife. In Southern Mediterranean coast (Area V), the buoys are Málaga, Cabo de Gata and Melilla. In Northern Mediterranean coast (Area VI), the buoys are Cabo de Palos, Alicante, Valencia, Costera Valencia, Tarragona, Barcelona, Palamós, Dragonera and Capdevera.
Knowing that the minimum value of temperature in the surface it around 24 degrees, it can be stated that there are not sites in the Spanish coast suitable for taking advantage of this type of energy. This is also indicated in
Figure 4, with temperature differences in deep and surface water below 20 degrees. Therefore, it is not viable to install a device for capturing ocean thermal energy in the Spanish coast.
3.6. Osmotic Energy
For osmotic energy study, the input data were several “Puertos del Estado” buoys [
74], establishing maximum and average salinity concentration in the last 10 years (
Table 6). In order for the use of this energy, it is necessary that the facilities are located close to river mouths so that this difference in salinity occurs.
In Cantabrian coast (Area I) the buoys are Bilbao-Vizcaya and Cabo de Peñas. In Galician coast (Area II), the buoys are Estaca de Bares, Villano-Sisargas and Cabo Silleiro. In South Atlantic coast (Area III), the buoy is Cádiz. In Canary Islands coast (Area IV), the buoys are Gran Canaria and Tenerife. In Southern Mediterranean coast (Area V), the buoy is Cabo de Gata. In Northern Mediterranean coast (Area VI), the buoys are Cabo de Palos, Valencia and Tarragona.
The most interesting areas for this type of energy are Catalonian and Valencia coast, with salinity concentration about 27 parts per thousand. Rivers with mouth in these areas are: Almanzora, Segura, Júcar, Turia or Guadalaviar, Mijares, Ebro, Llobregat, Ter and Fluviá.
3.7. Biomass Energy
In Spain the natural resources of the luminaria, a specific type of algae, are very limited. They are mainly on the Atlantic coast, specifically the northern area corresponding to Cantabrian and Galician coast. In the case of the Cantabrian coast, this resource has diminished its abundance in the last decade, and in some places it has disappeared. At present, it is abundant in some locations in Galicia.
3.8. Geothermal Energy
It can be concluded that Spain does not have hydrothermal vents along its coasts based on the analysis of the world map of submarine ventilation locations (
Figure 7). Therefore, it is not possible to exploit this marine energy resource in the country.
3.9. Solar Energy
To analyze the resource of solar energy along the Spanish coast, the values of solar irradiation annual averages are established in each area, considering for that values between 1985 and 2005 (
Figure 14).
Table 7 shows the average annual radiation in each area, and specific zones. In Cantabrian coast (Area I), the Zones are País Vasco, Cantabria and Asturias. In Galician coast (Area II), the only zone is Galicia. In South Atlantic coast (Area III), the zones are Huelva, Cádiz and Ceuta. In Canary Islands coast (Area IV), the only zone is Canary Island. In Southern Mediterranean coast (Area V), the zones are Málaga, Almería, Murcia and Melilla. In Northern Mediterranean coast (Area VI), the zones are Valencia, Cataluña and Baleares (Balearic Islands).
The most interesting areas for solar exploitation are:
The southern Atlantic coast and the southern Mediterranean coast with values above 5 kWh/m2day, representing the area with the highest radiation in the Spanish coast.
Canary Islands, specifically the southern facade with values above 4.50 kWh/m2day.
The northern Mediterranean coast, specifically in Valencia, Tarragona and the Balearic Islands, with values higher than 4.50 kWh/m2day.


 ,
, 


