Article

Dynamic Response for a Submerged Floating Offshore Wind Turbine with Different Mooring Configurations

1
State Key Laboratory of Hydraulic Engineering Simulation and Safety, Tianjin University, Tianjin 300072, China
2
School of Civil Engineering, Tianjin University, Tianjin 300072, China
3
Key Laboratory of Coast Civil Structure Safety, Ministry of Education, Tianjin University, Tianjin 300072, China
*
Author to whom correspondence should be addressed.
J. Mar. Sci. Eng. 2019, 7(4), 115; https://doi.org/10.3390/jmse7040115
Submission received: 30 January 2019 / Revised: 5 April 2019 / Accepted: 15 April 2019 / Published: 22 April 2019
(This article belongs to the Special Issue Offshore Wind Farms)

Abstract

:
The paper discusses the effects of mooring configurations on the dynamic response of a submerged floating offshore wind turbine (SFOWT) for intermediate water depths. A coupled dynamic model of a wind turbine-tower-floating platform-mooring system is established, and the dynamic response of the platform, tensions in mooring lines, and bending moment at the tower base and blade root under four different mooring configurations are checked. A well-stabilized configuration (i.e., four vertical lines and 12 diagonal lines with an inclination angle of 30°) is selected to study the coupled dynamic responses of SFOWT with broken mooring lines, and in order to keep the safety of SFOWT under extreme sea-states, the pretension of the vertical mooring line has to increase from 1800–2780 kN. Results show that the optimized mooring system can provide larger restoring force, and the SFOWT has a smaller movement response under extreme sea-states; when the mooring lines in the upwind wave direction are broken, an increased motion response of the platform will be caused. However, there is no slack in the remaining mooring lines, and the SFOWT still has enough stability.

1. Introduction

Over recent years, harnessing of offshore wind power usually has been concentrated in shallow water regions (<50 m) using fixed foundations, such as monopile, gravity, or jacket structures [1]. With the depletion of coastal resources, as well as the geographical and environmental constraints, the development of offshore wind power is bound to reach deep water to access abundant wind resources. Fixed foundations are limited at water depths of 30–50 m [2,3,4,5]. A series of floating wind turbine concepts has been proposed at various stages of development, which can be divided into three categories: spar, semi-submersible, and tension leg platform (TLP) [6,7,8,9,10,11,12,13]. In addition, the world’s first commercial floating wind power project, Hywind Scotland pilot park, was put into operation in 2017 [14].
In recent years, several feasibility studies have been performed to investigate the economic viability of FOWT and optimize the design of both support structures and mooring systems [15,16,17]. The offshore code comparison collaboration continuation (OC4) DeepCWind semi-submersible floating offshore wind turbine (FOWT) model was simulated by Liu et al. [18]; a fully-coupled fluid-structure interaction system was analyzed in detail, and the impacts of wind turbine aerodynamics on the behavior of the floating platform and the mooring system responses were examined. Benassai [19] minimized the catenary mooring system weight for tri-floater floating offshore wind turbines and pointed out that the platform admissible offset and mooring line configuration significantly influence the weight of the mooring system. Yusuke [20] proposed a novel type of floating wind turbine with a single-point mooring system and examined two different configurations of the single point mooring system based on a tank test and a real sea test.
In order to ensure the FOWT safety, the aero-hydro-elastic-mooring coupled dynamic response of a floating wind turbine under extreme sea-states has to be checked. Utsunomiya et al. [21] evaluated the dynamic response of a spar-type FOWT under extreme sea-states using the dynamic analysis tool, which consists of a multibody dynamics solver, aerodynamic force evaluation library, hydrodynamic force evaluation library, and mooring force evaluation library. Mooring line damage is a key factor that influences the safety of the whole system. Several related studies have been conducted on the damaged mooring systems for floating offshore wind turbines. Benassai et al. [22] studied the performance changes of the OC4 DeepCWind semisubmersible with one broken mooring line and found that an accidental disconnection of one of the mooring lines changes the platform and turbine orientations, which might cause large nacelle yaw error. Li et al. [23] established a coupled aero-hydro-elastic numerical model to investigate the transient response of a spar-type FOWT in scenarios with fractured mooring lines, and they found that in terms of drift distance, it might be more dangerous to shut down the turbine when the wind load is in the opposite direction of drift. Ahmed et al. [24] established a simplified three-degrees-of-freedom (3-DOFs) model to analyze the transient motion of a truss-spar in the time domain after one or two mooring lines were broken. In the simulations, a quasi-static approach was applied to calculate the mooring loads.
A submerged FOWT (SFOWT) with a taut mooring system was proposed to support a 5-MW wind turbine for a water depth of 50–200 m [25,26,27]. This paper discusses the effects of mooring configurations on the dynamic response of SFOWT. Fully-coupled aero-hydro-servo-elastic time domain simulations were carried out using the code FAST [28] developed by NREL to simulate the dynamic response of SFOWT. TurbSim [29] is used to generate the 3D turbulent wind field, and Sesam/Wadam [30] is used to calculate the hydrodynamic coefficients of the SFOWT in the frequency domain. The coupled dynamic responses of SFOWT with different mooring configurations are investigated, and the dynamic responses of SFOWT with broken mooring lines are further analyzed by selecting the optimal mooring configurations.

2. Theoretical Calculations for SFOWT

2.1. Equation of Motion in the Time Domain

The equation of motion of SFOWT can be expressed as follows [31]:
[ M + A ] ξ ¨ + K ξ = F 1 ( t ) + F n ( t , ξ ˙ ) + F c ( t , ξ ˙ ) + F w ( t ) + F m ( t )
where M is the mass matrix of SFOWT, A is the added mass at infinity frequency, and ξ , ξ ˙ , and ξ ¨ are the 6-DOF displacements, velocities, and accelerations of the platform, respectively. K is the hydrostatic stiffness matrix. F 1 ( t ) is the first-order wave exciting forces. F n ( t , ξ ˙ ) is the nonlinear drag force from Morison’s equation. F w ( t ) is the wind-induced forces including aero-dynamic forces and tower drag forces. F m ( t ) is the restoring force resulting from the taut mooring lines. F c ( t , ξ ˙ ) is the radiation damping force, which can be expressed as:
F c ( t , ξ ˙ ) = t R ( t τ ) ξ ( τ ) d τ
where R ( t ) is the retardation function:
R ( t ) = 2 π 0 b ( w ) cos ( ω t ) d ω
where b is the linear radiation damping matrix.
The hydrodynamic coefficients, such as the added mass, radiation damping, hydrostatic restoring stiffness, and first-order wave excitation force, are calculated in the frequency domain using the potential-based 3D diffraction/radiation code Wadam and then applied in the time domain.

2.2. Mooring Loads for SFOWT

The total pretension of the mooring system F P is:
F P = ( ρ m ) g
where ρ is the density of sea water; is displacement; m is the total mass of the wind turbine system.
If mooring inertias and damping are ignored in a linear mooring system, the mooring load F i t can be calculated as follows [32]:
F i t = F i P K i j t ξ j
where F i P is the ith component of the total pretension; K i j t is the linearized restoring stiffness matrix of the mooring system; ξ j is the ith degree of freedom displacement.
The restoring stiffness matrix of the mooring system can be obtained by the following formulas [27,33]:
K i j t = [ k 11 0 0 0 k 15 0 0 k 22 0 k 24 0 0 k 31 k 32 k 33 k 34 k 35 k 36 0 k 42 0 k 44 0 0 k 51 0 0 0 k 55 0 0 0 0 0 0 k 66 ] Surge Sway Heave Roll Pitch Yaw
k 11 = k 22 = F P l z + ρ g A w δ s l z
k 33 = E A l + ρ g A w
k 44 = ρ g I x cos 3 φ + B ( z B z E ) G ( z G z E ) + E I x x l cos 2 φ + ρ g A w ( z B z E ) δ s + z G T 2 k 22
k 55 = ρ g I y cos 3 θ + B ( z B z E ) G ( z G z E ) + E I y y l cos 2 θ + ρ g A w ( z B z E ) δ s + z G T 2 k 11
k 66 = r 2 ( F P l z + ρ g A w δ s l z )
k 15 = k 51 = z G T k 11
k 24 = k 42 = z G T k 22
k 31 = k 33 ξ 1 / ( 2 l )
k 32 = k 33 ξ 2 / ( 2 l )
k 34 = z G T k 32
k 35 = z G T k 31
k 36 = k 33 ( r 2 ξ 6 ) / ( 2 l )
where B and G are the buoyancy and gravity of the SFOWT, respectively; l is the tether length; l z is the mean vertical distance between the upper fairlead and seabed; E is the modulus of elasticity; A is the sectional area of a mooring line; ρ is the water density; g is the gravitational acceleration; A w is the waterline area of SFOWT; r is the horizontal distance between the center of the column and the center of the cylinder-shaped pontoon; I x and I y are the inertia moment of the waterline about the x-axis and y-axis, respectively; I x x and I y y are the area moment of inertia of the SFOWT about the x-axis and y-axis, respectively; φ and θ are the rotational angles of roll and pitch, z B , z E , and z G are the vertical coordinates of the buoyancy center, the upper fairlead, and the center of gravity, respectively; δ s is the increment of the set-down motion, δ s   =   l     l z ; z G T is vertical distance between the upper fairlead and the center of gravity.

3. Dynamic Response of SFOWT under Different Mooring Configurations

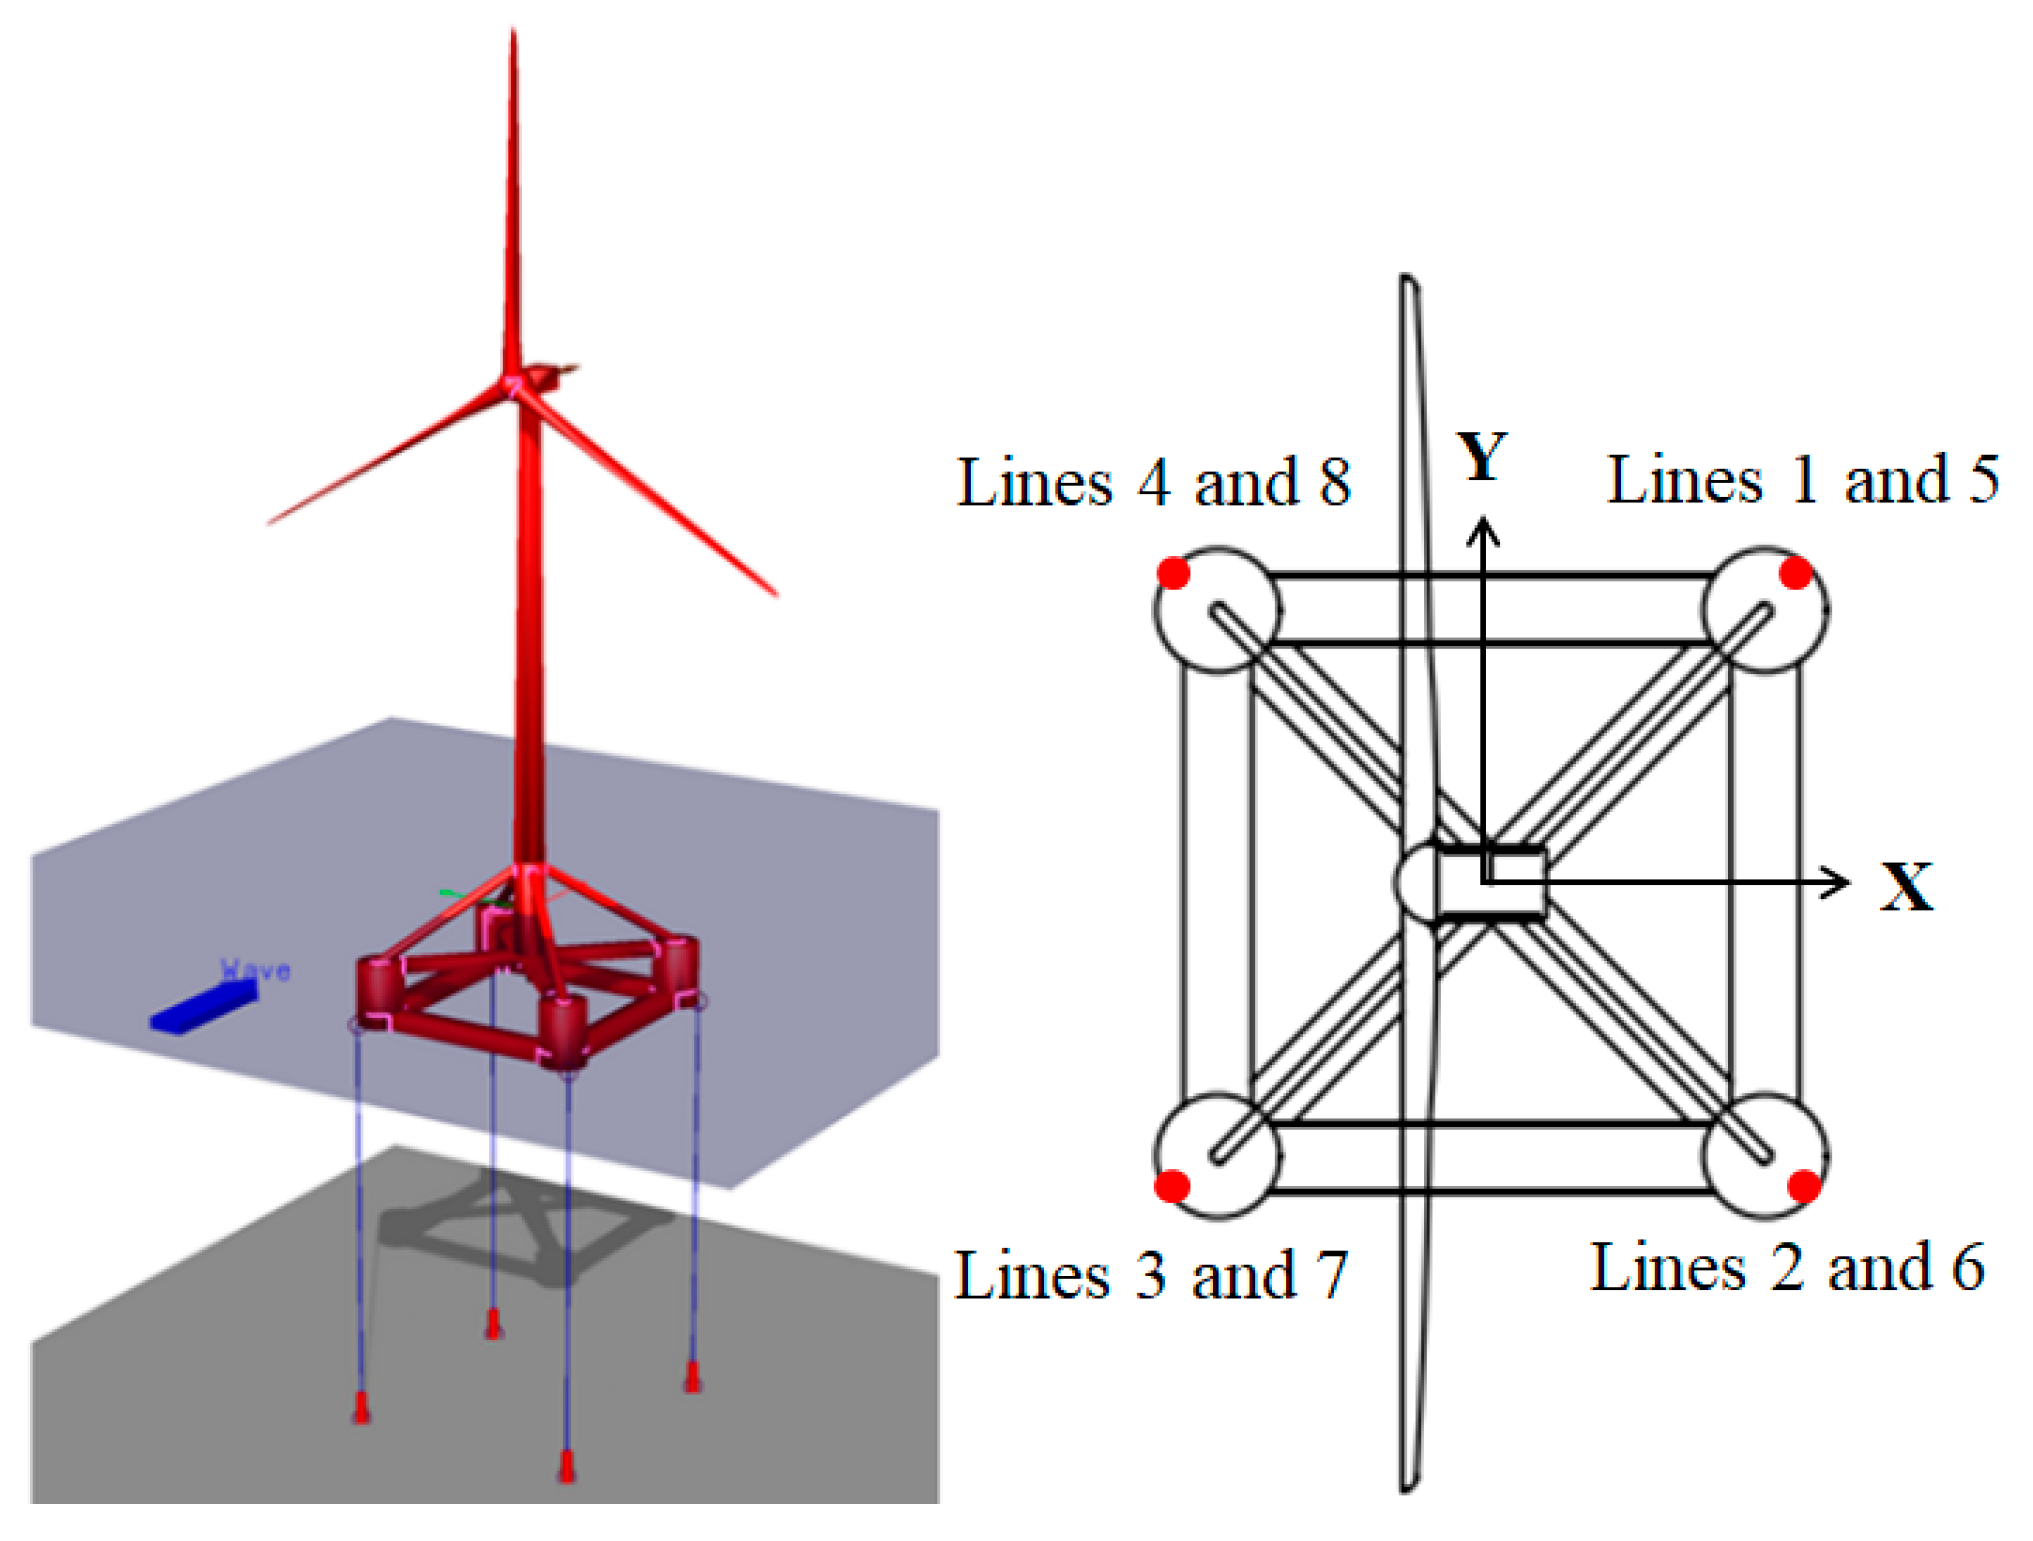
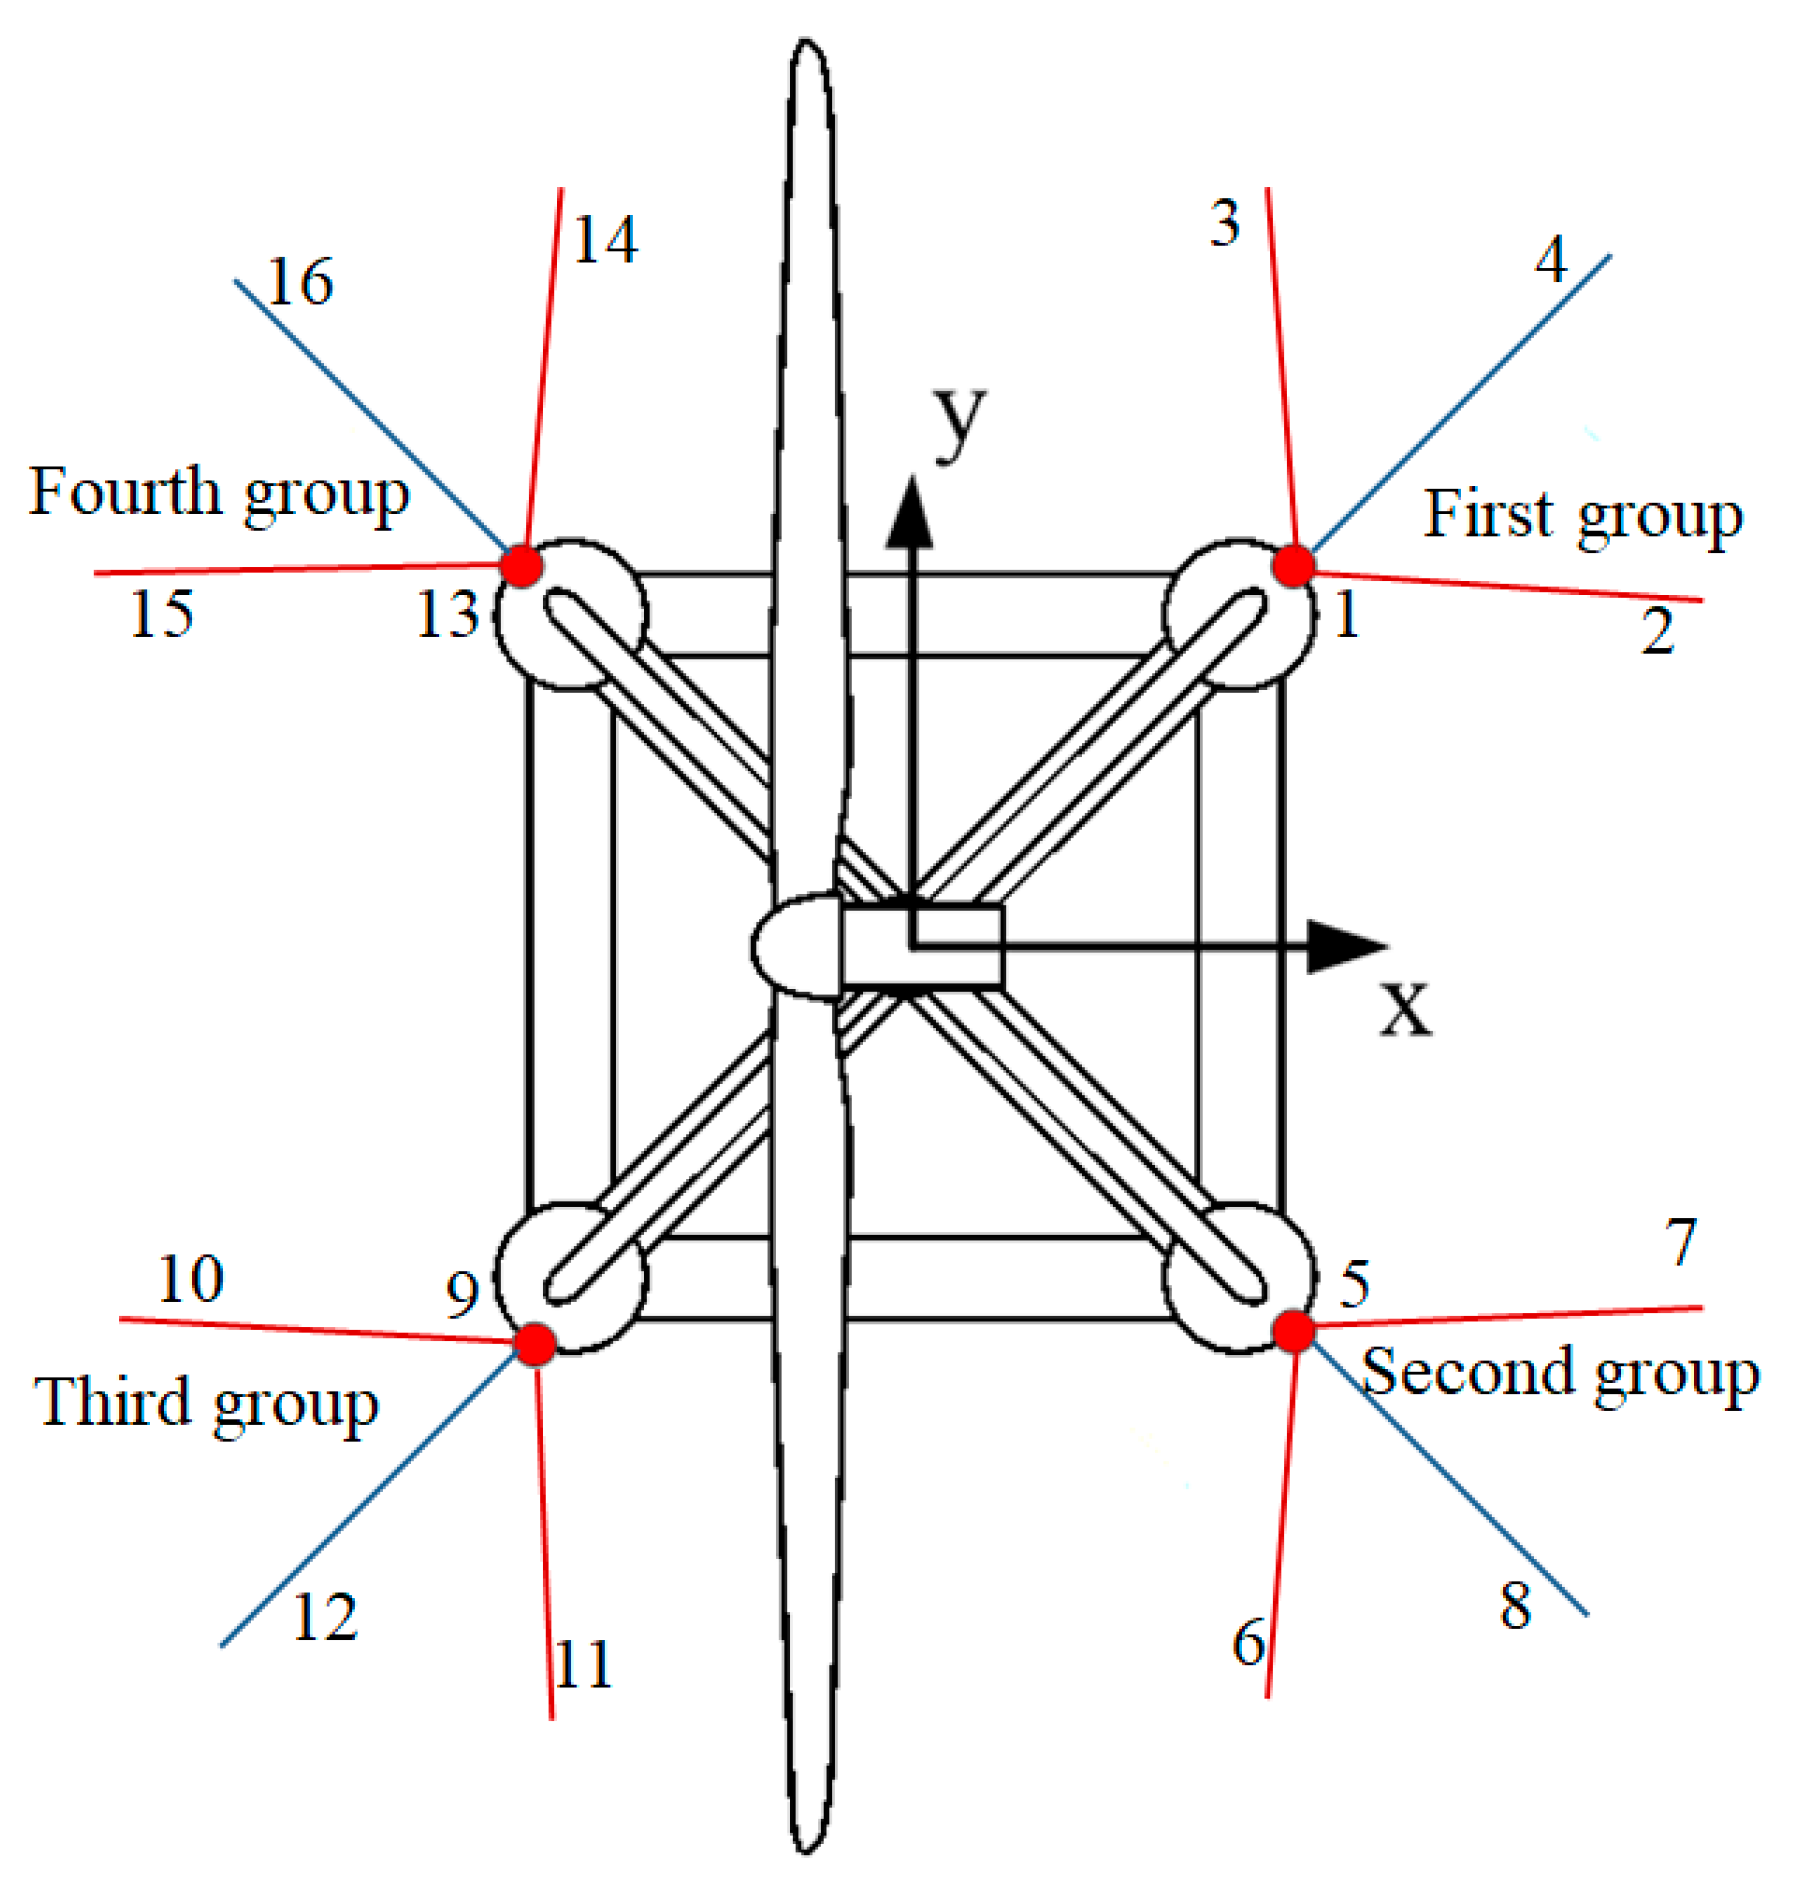
3.1. Structural Form of SFOWT

The SFOWT is shown in Figure 1, and its main parameters are listed in Table 1 and Table 2. The submerged platform was composed of one column and four separated cylinder-shaped vertical pontoons connected by four rectangular horizontal pontoons. The column and pontoons were interconnected by four pipe members and cross braces. The wind turbine was mounted on the column. A NREL 5 MW baseline wind turbine was employed for the analysis, and its main parameters are listed in Table 3 [34].

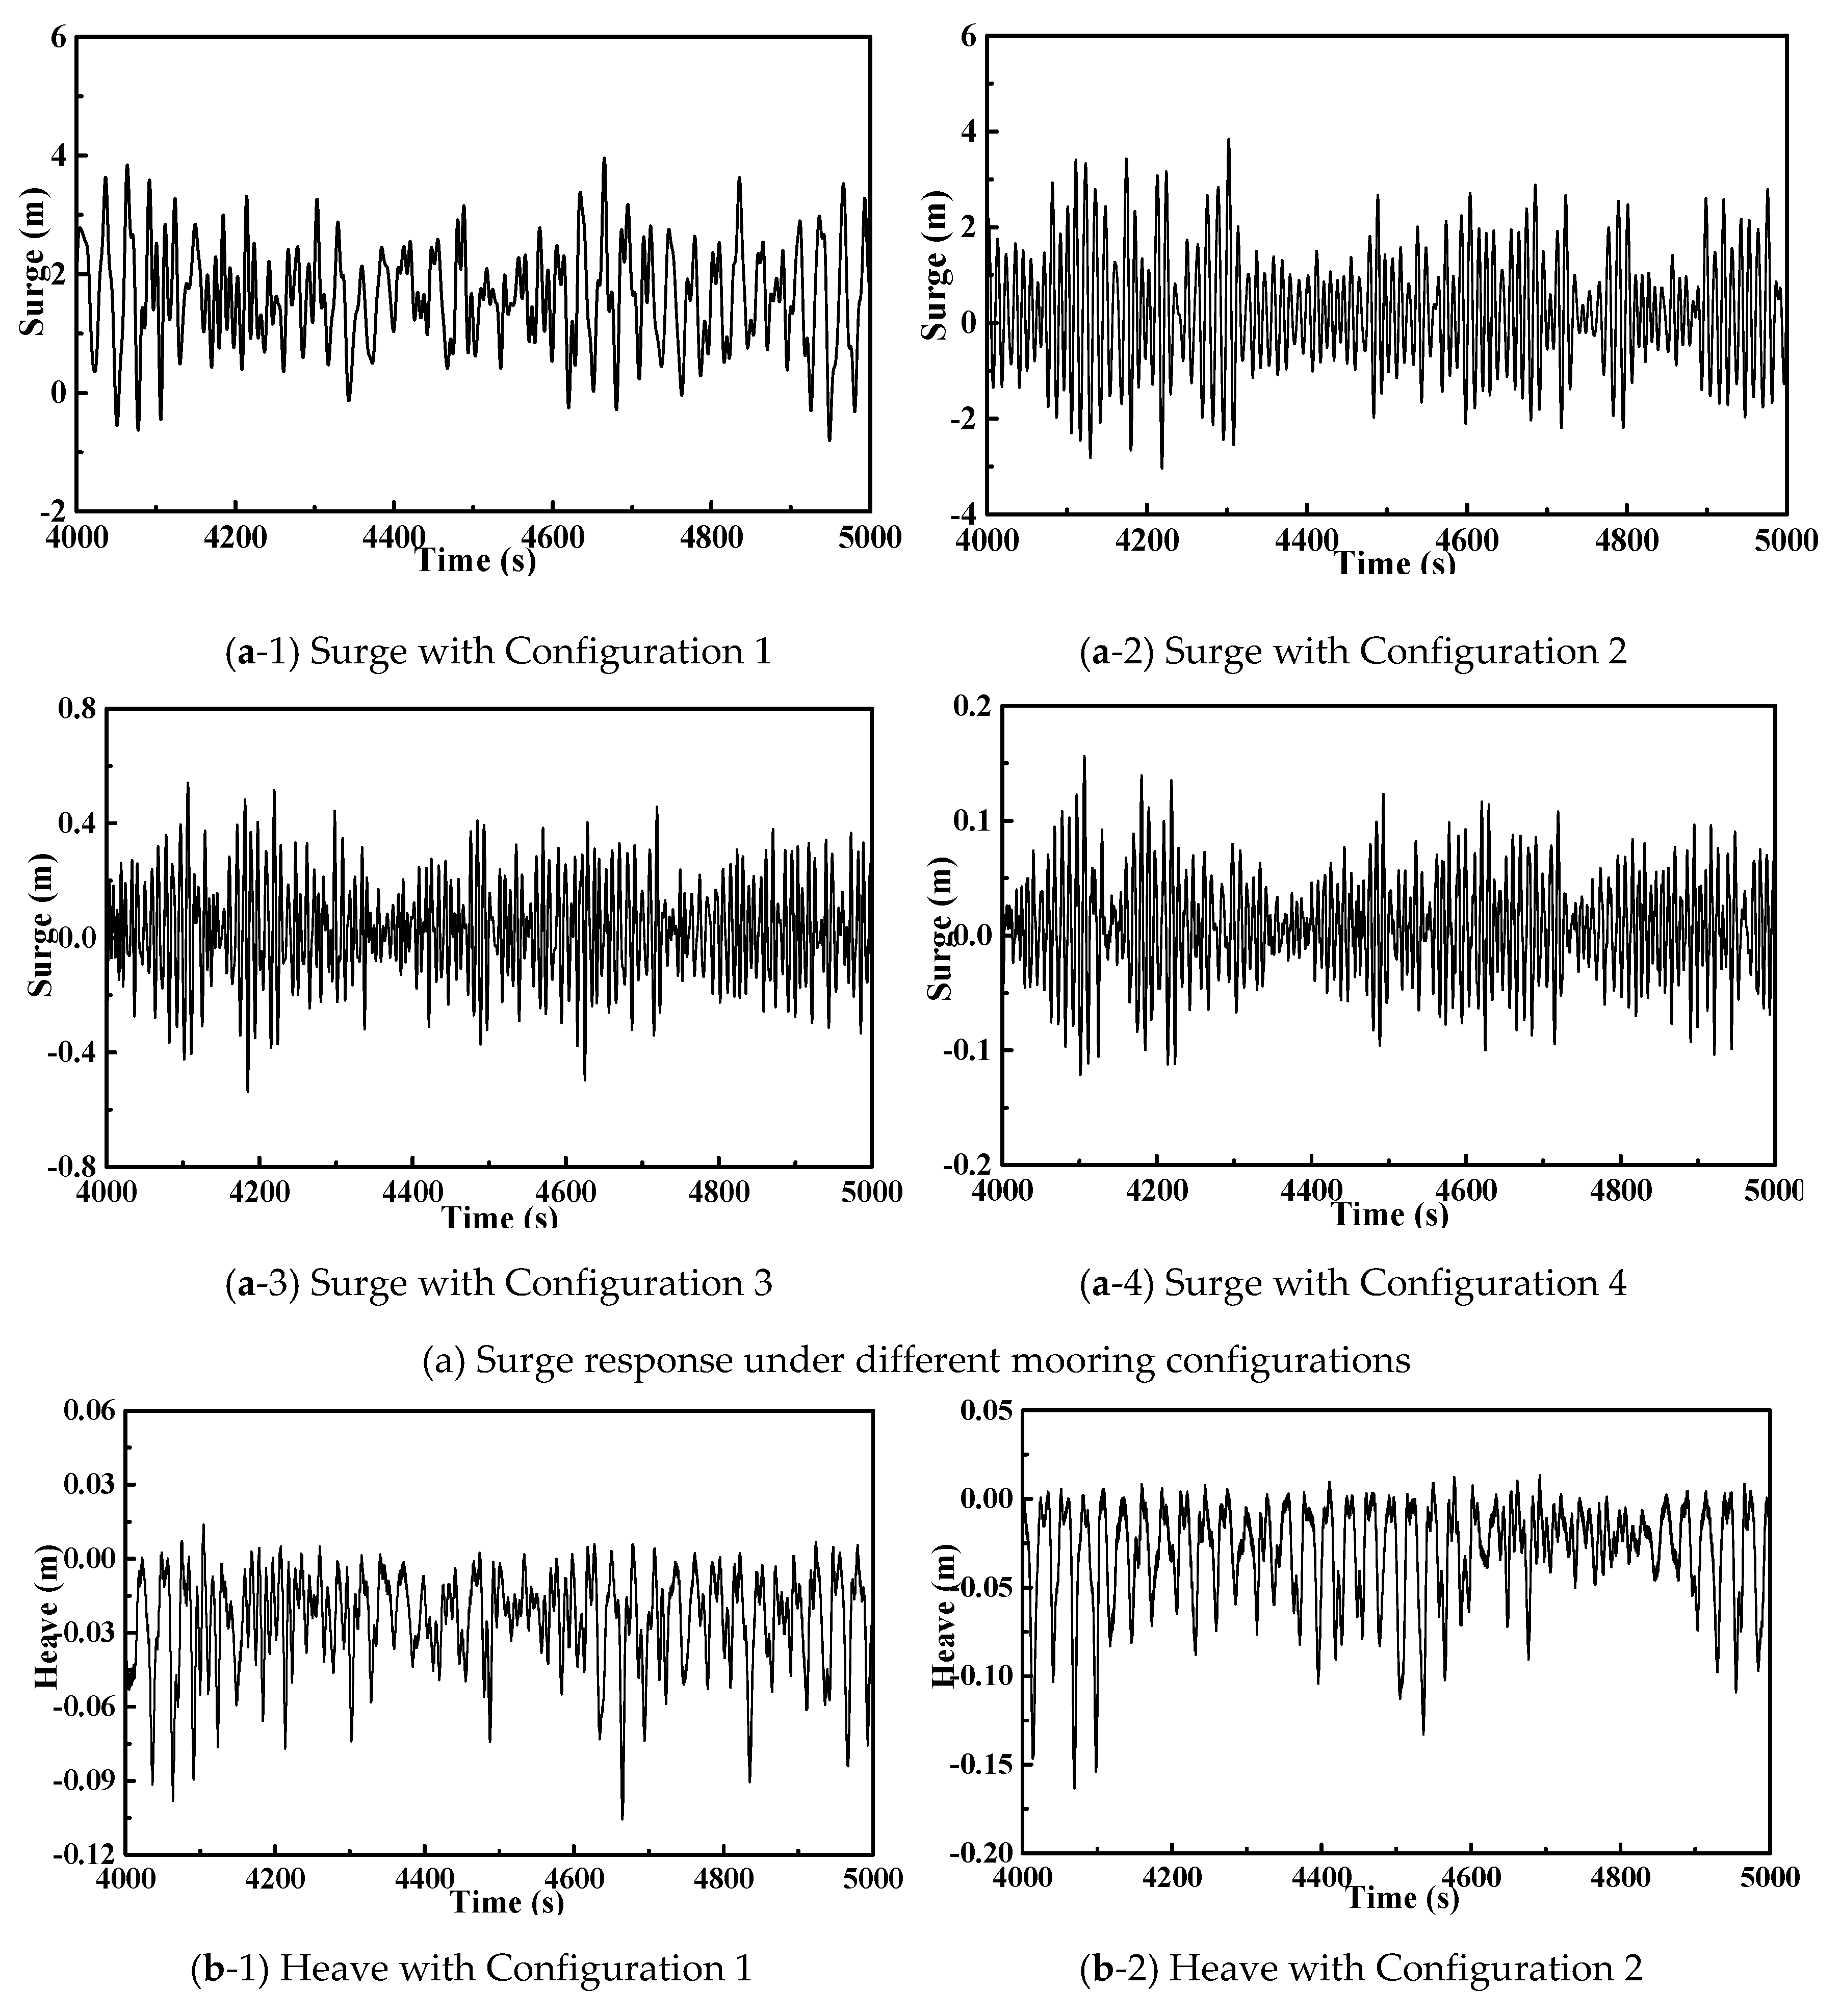
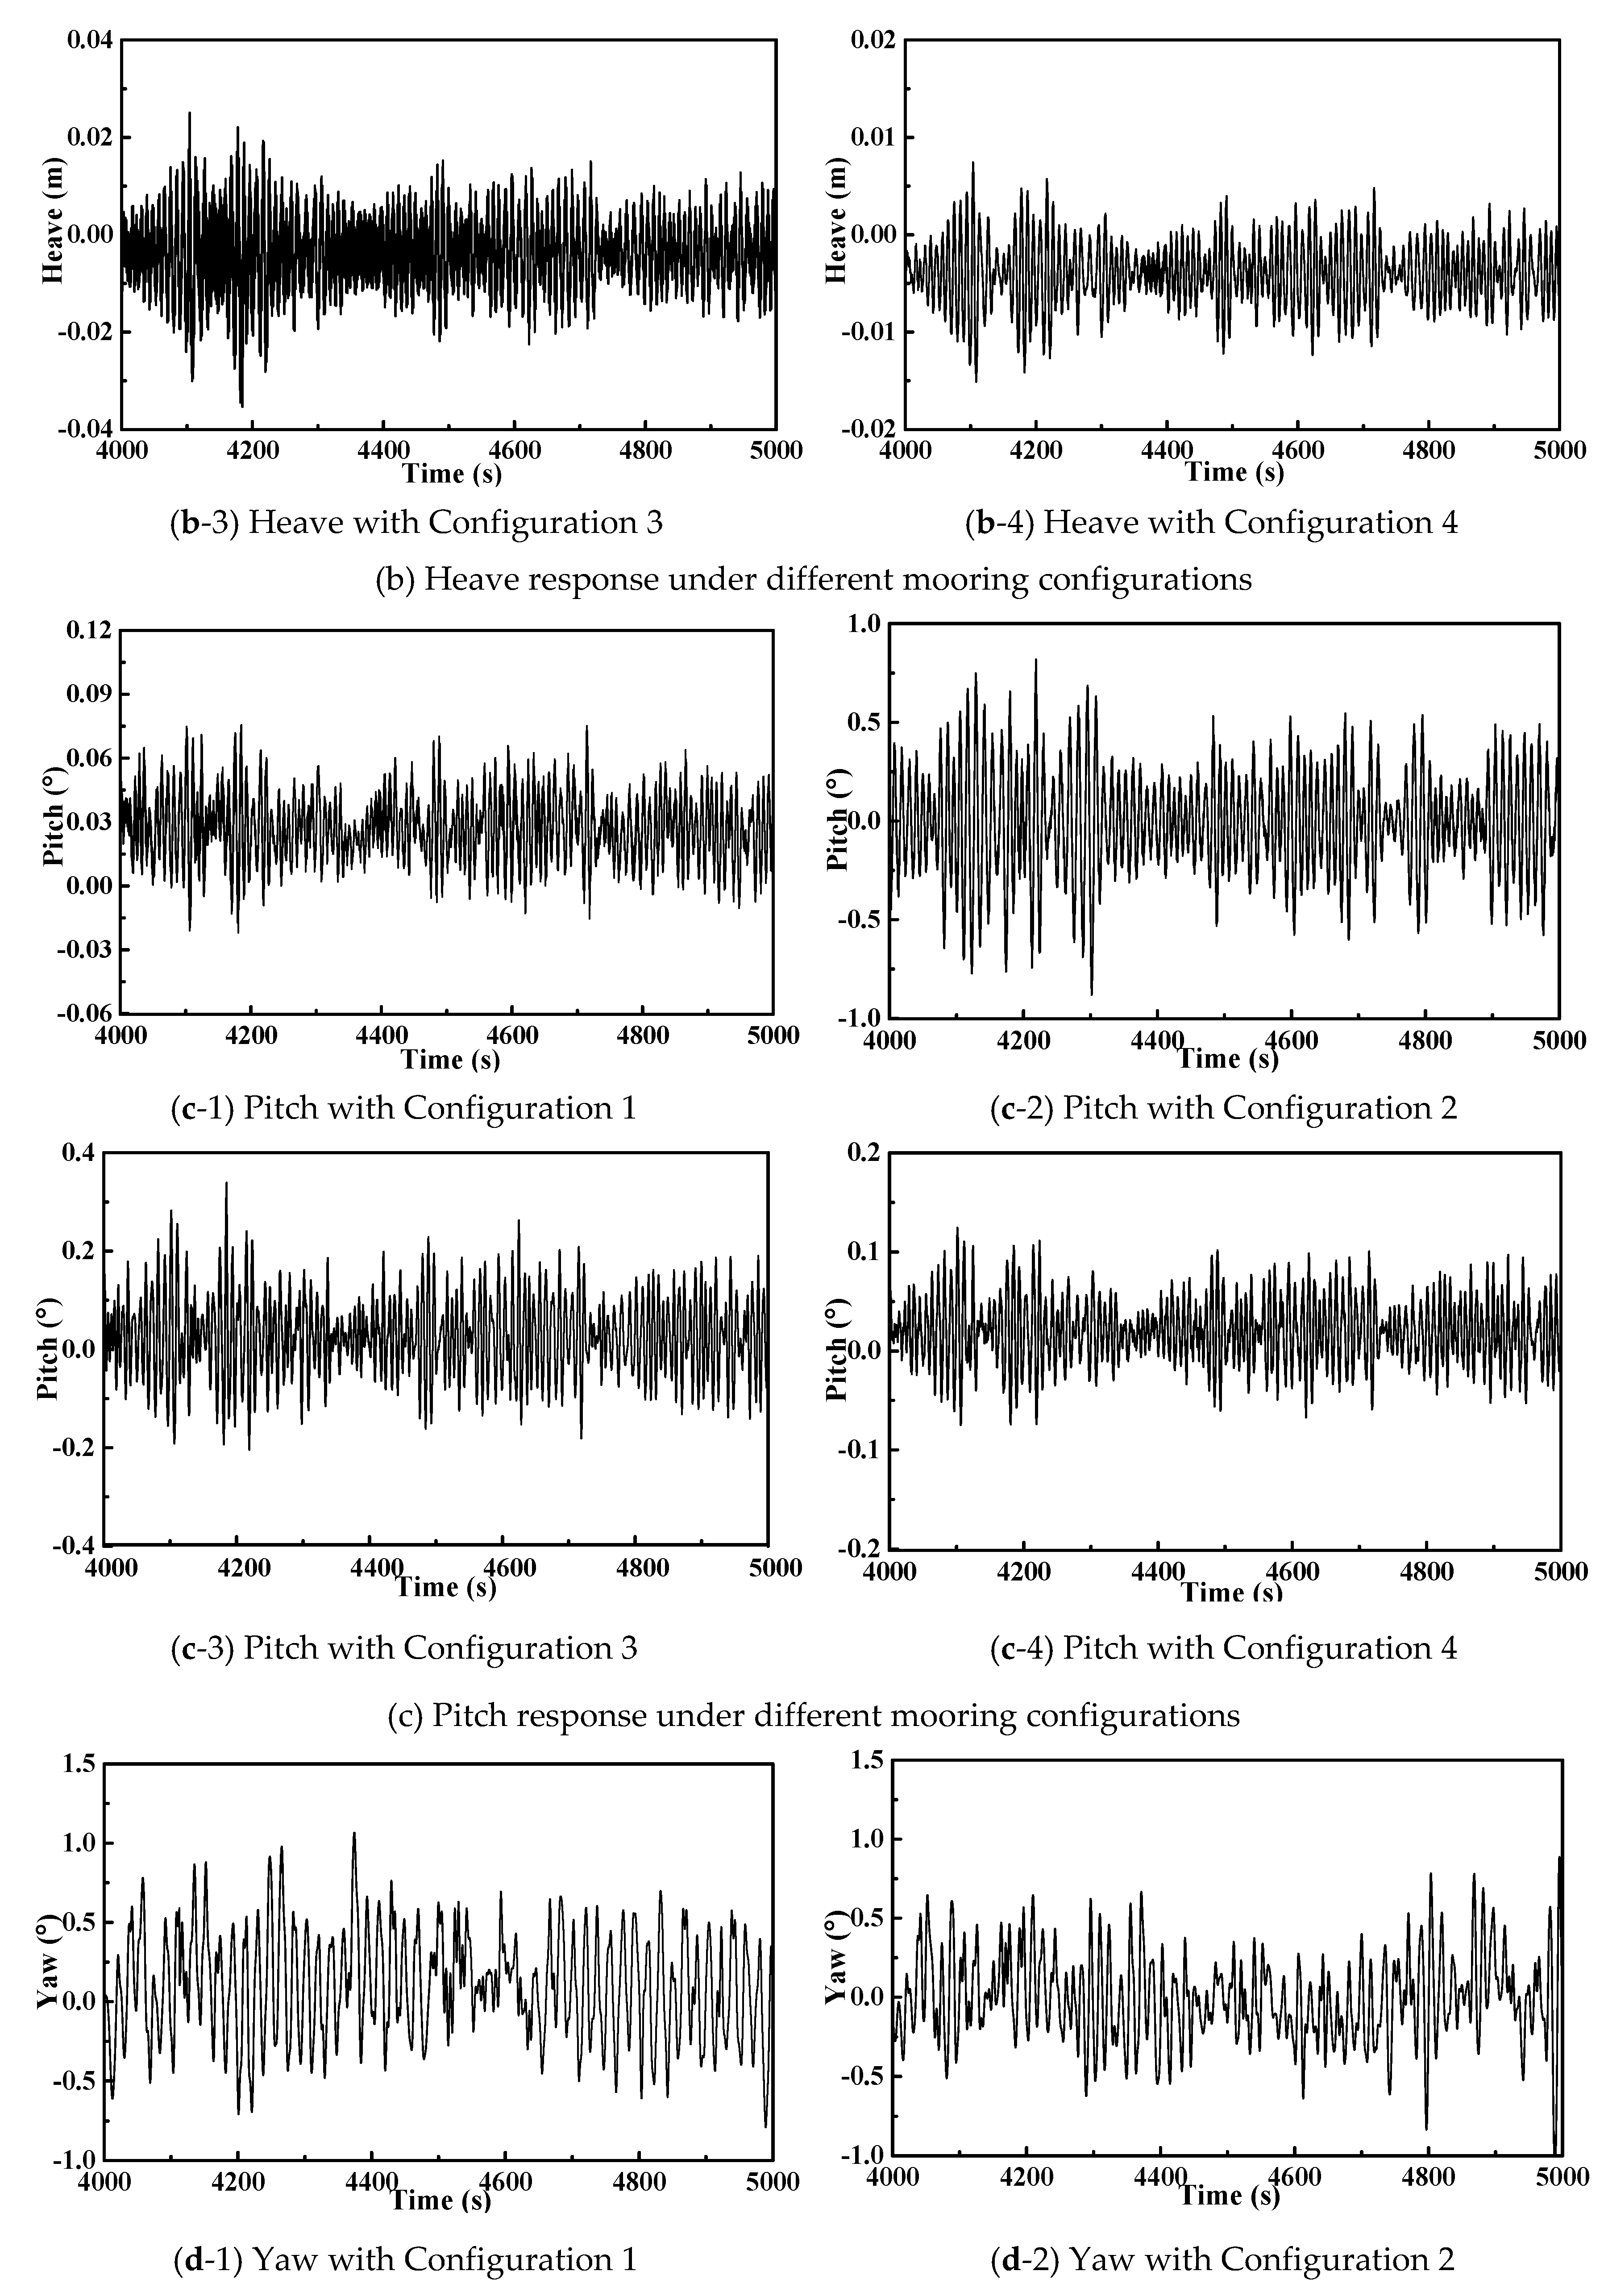
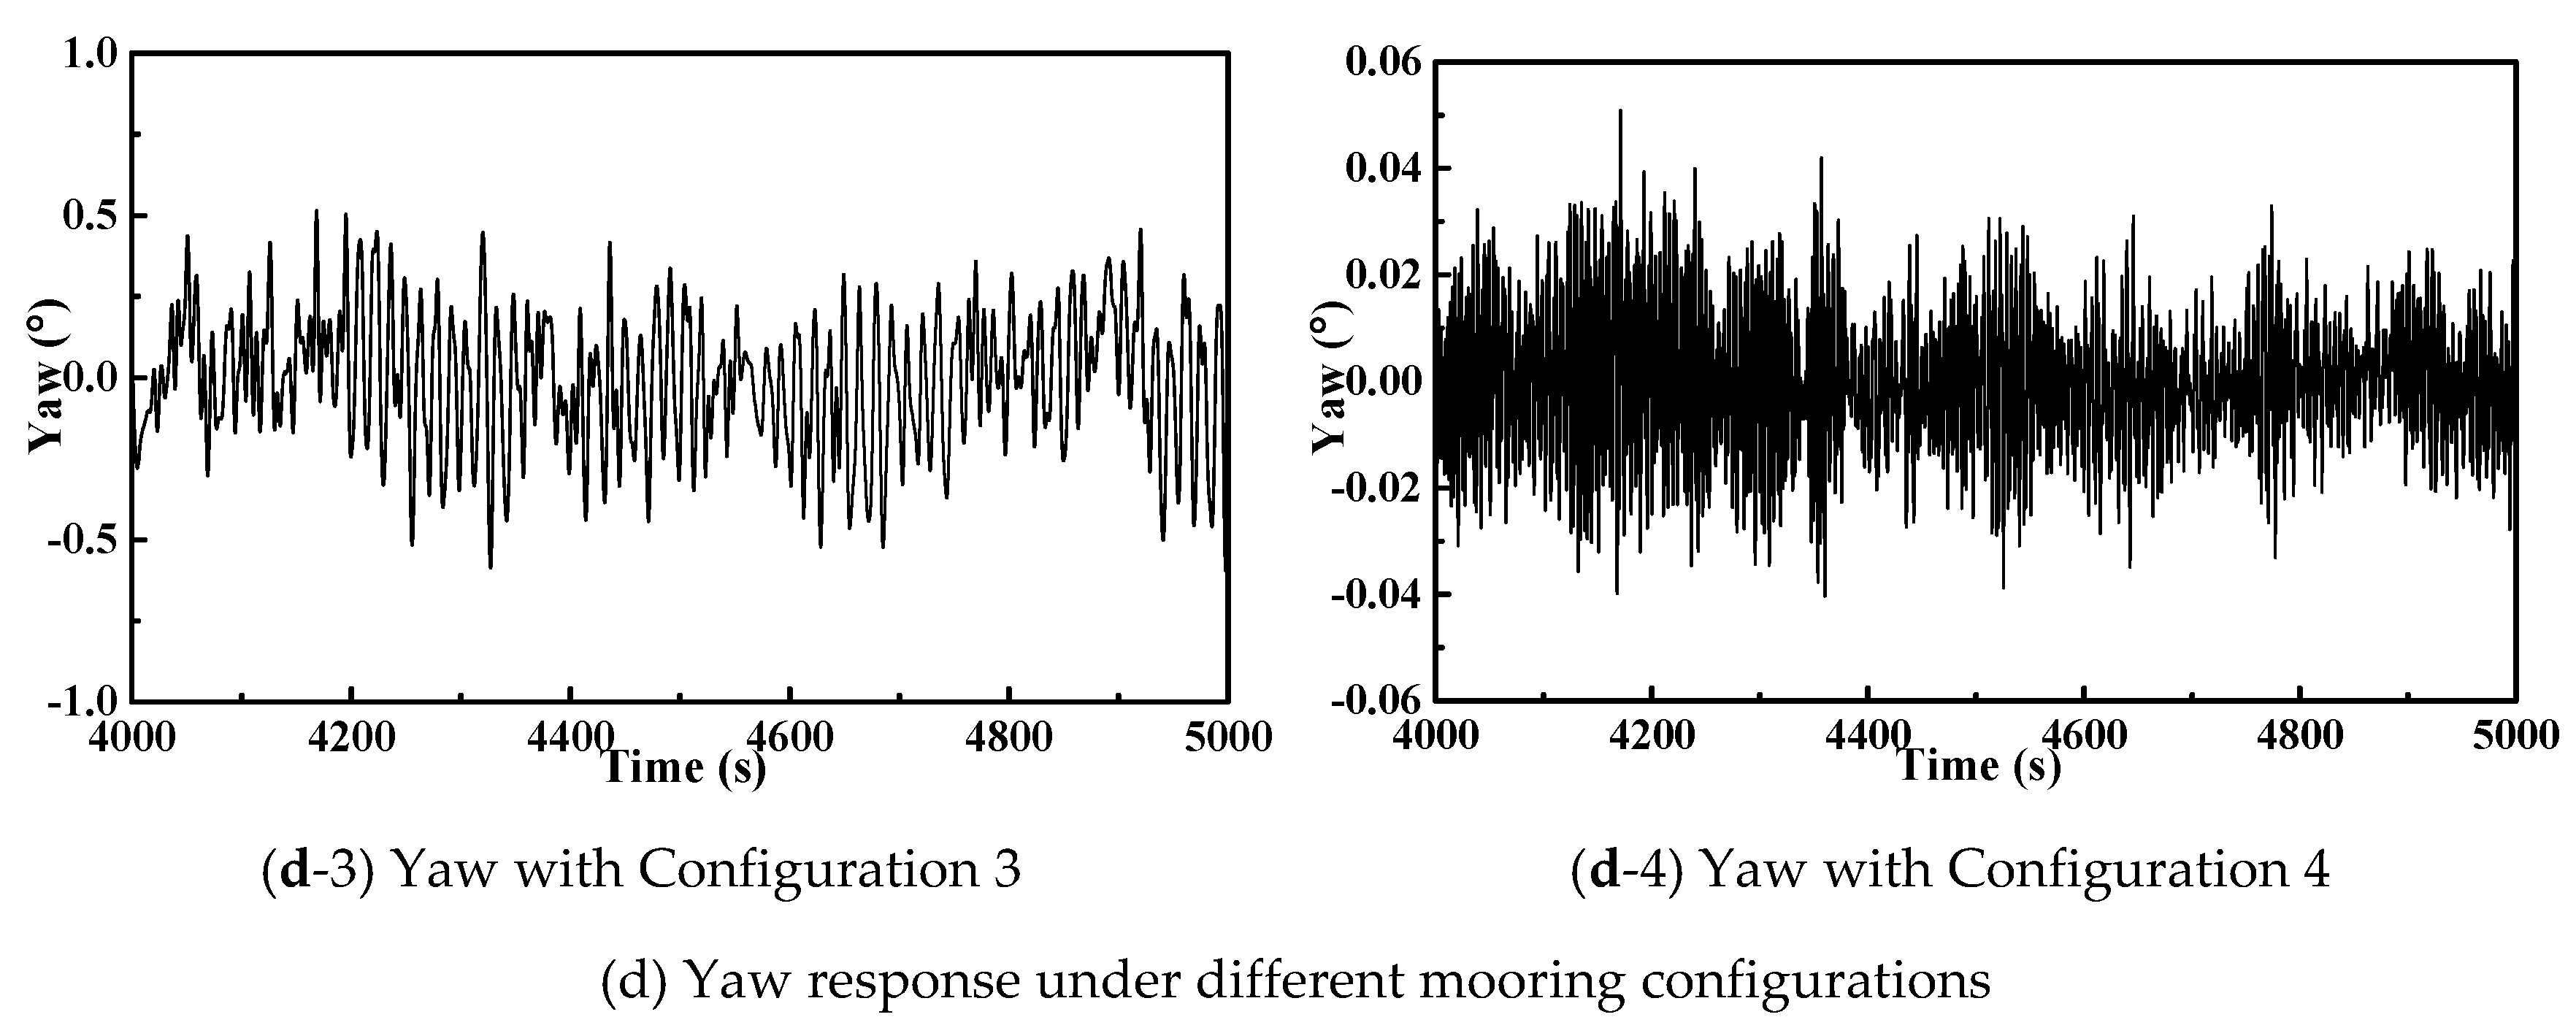
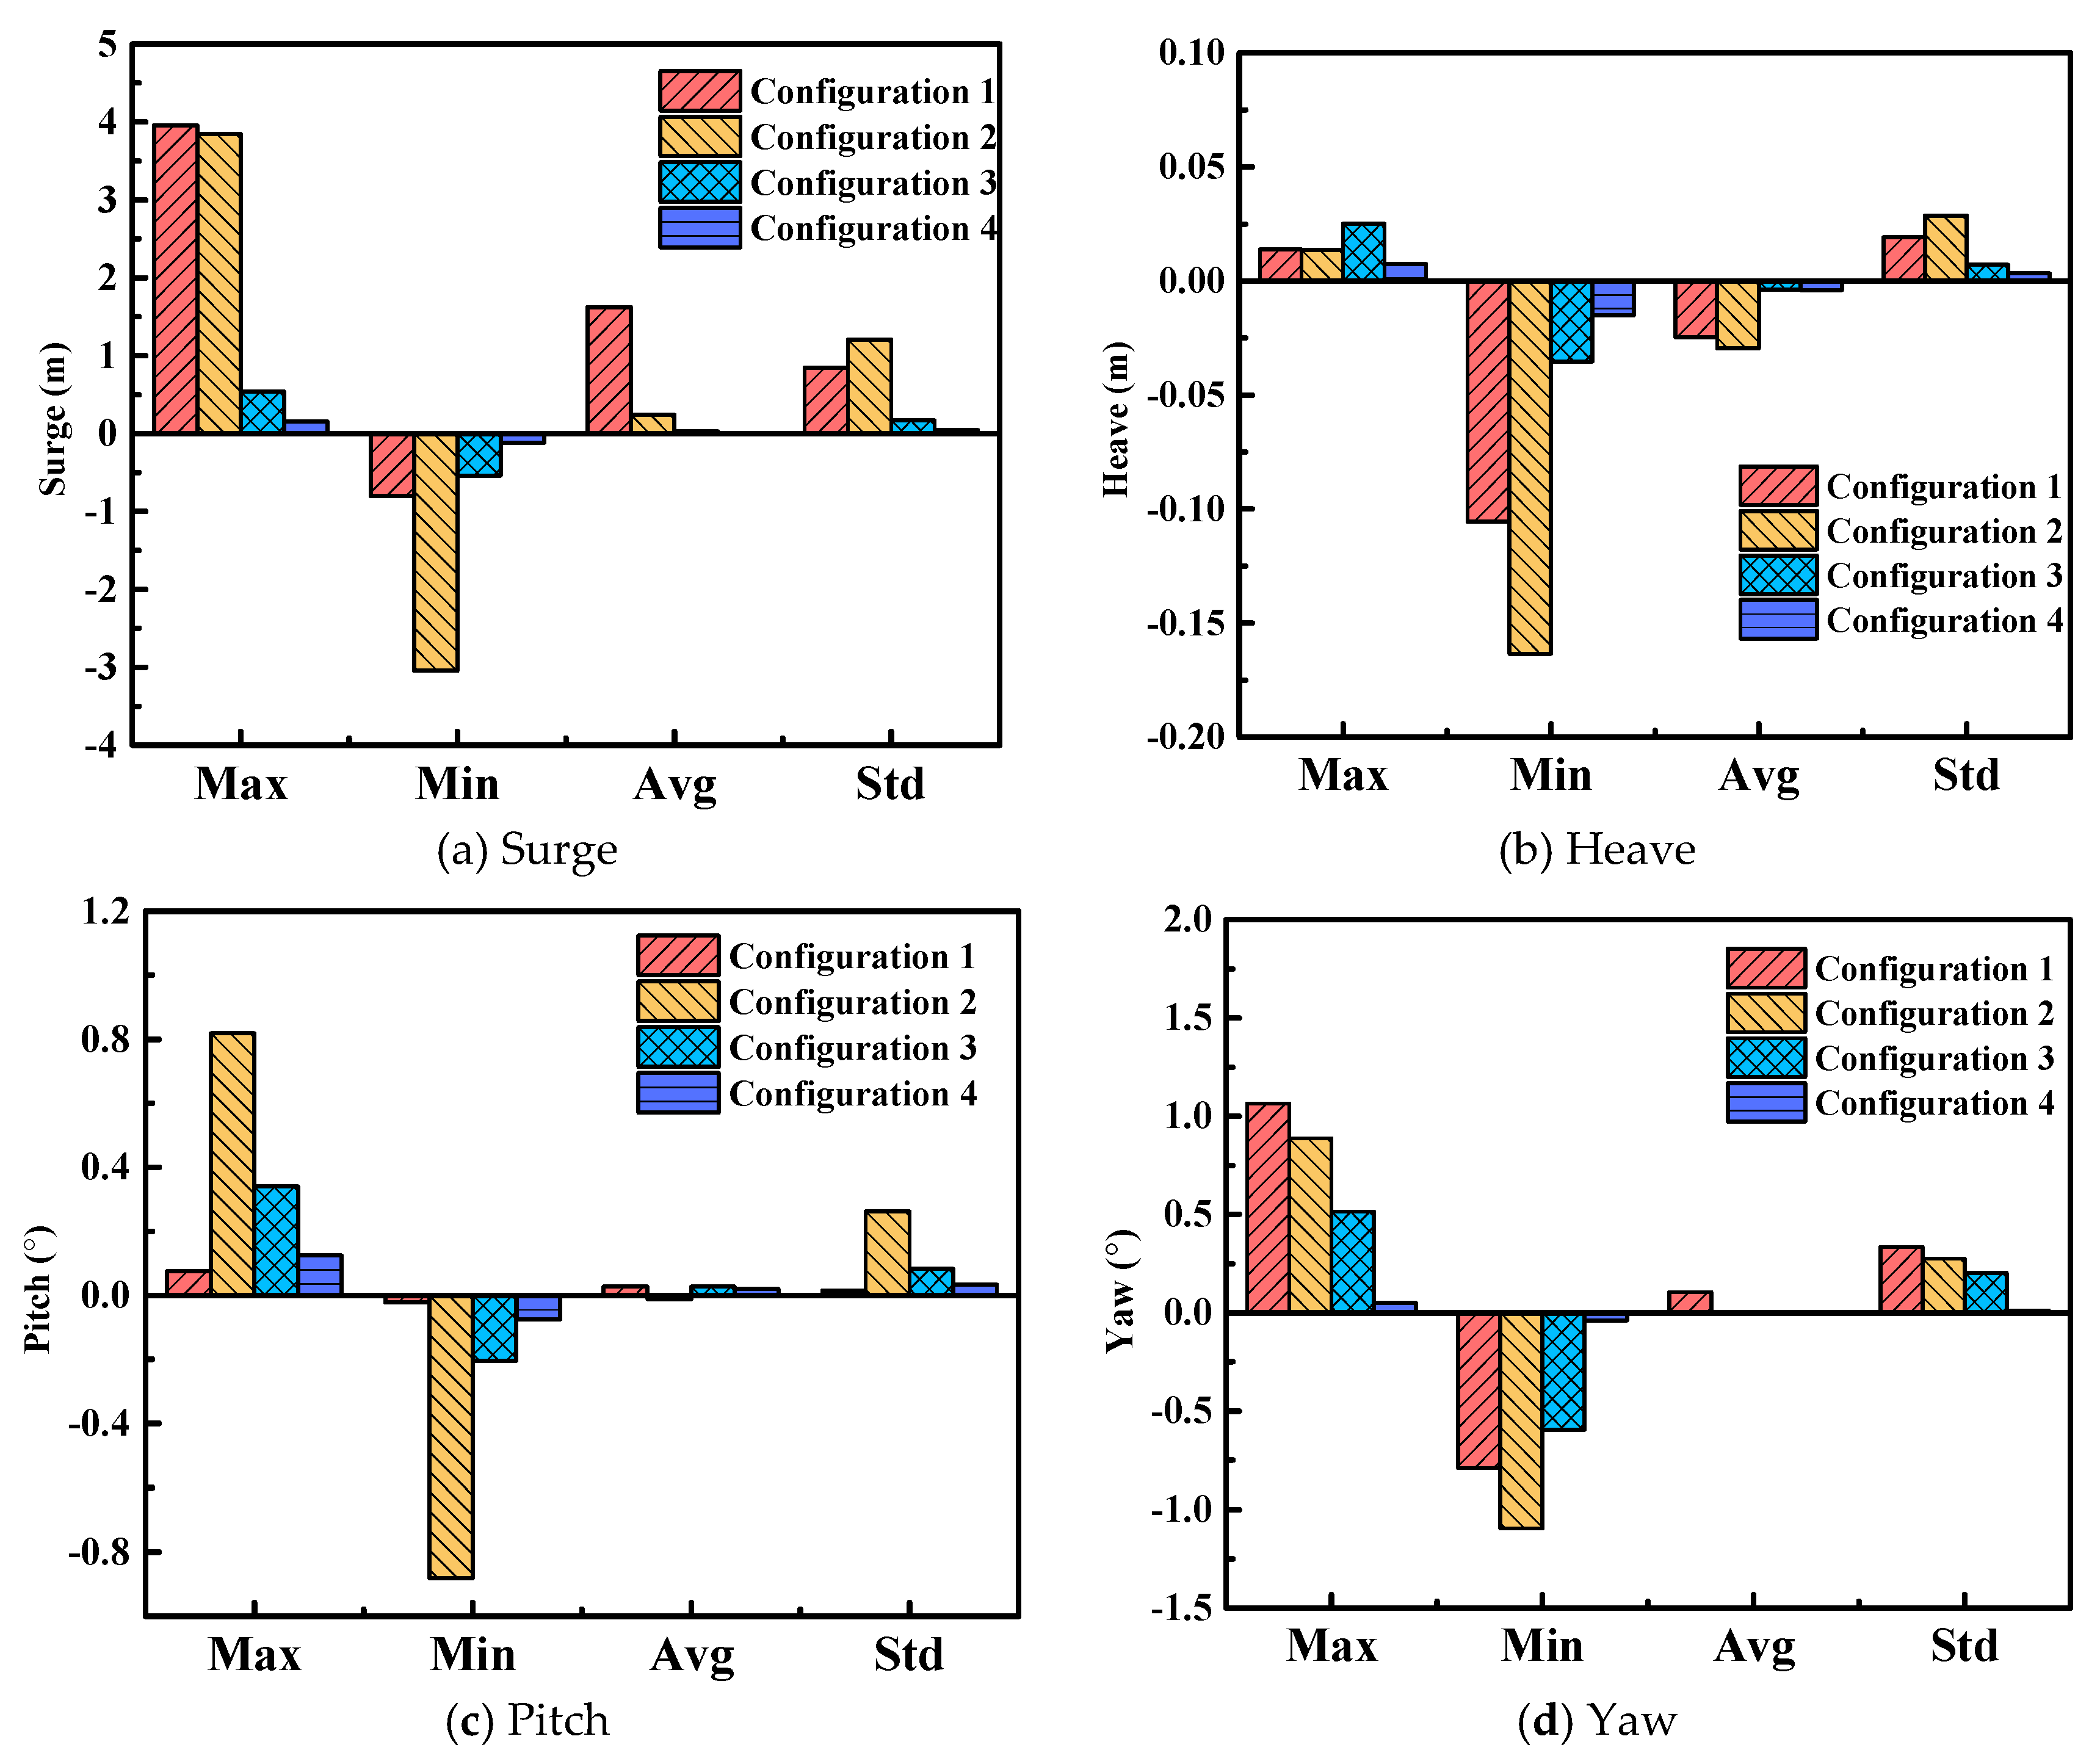
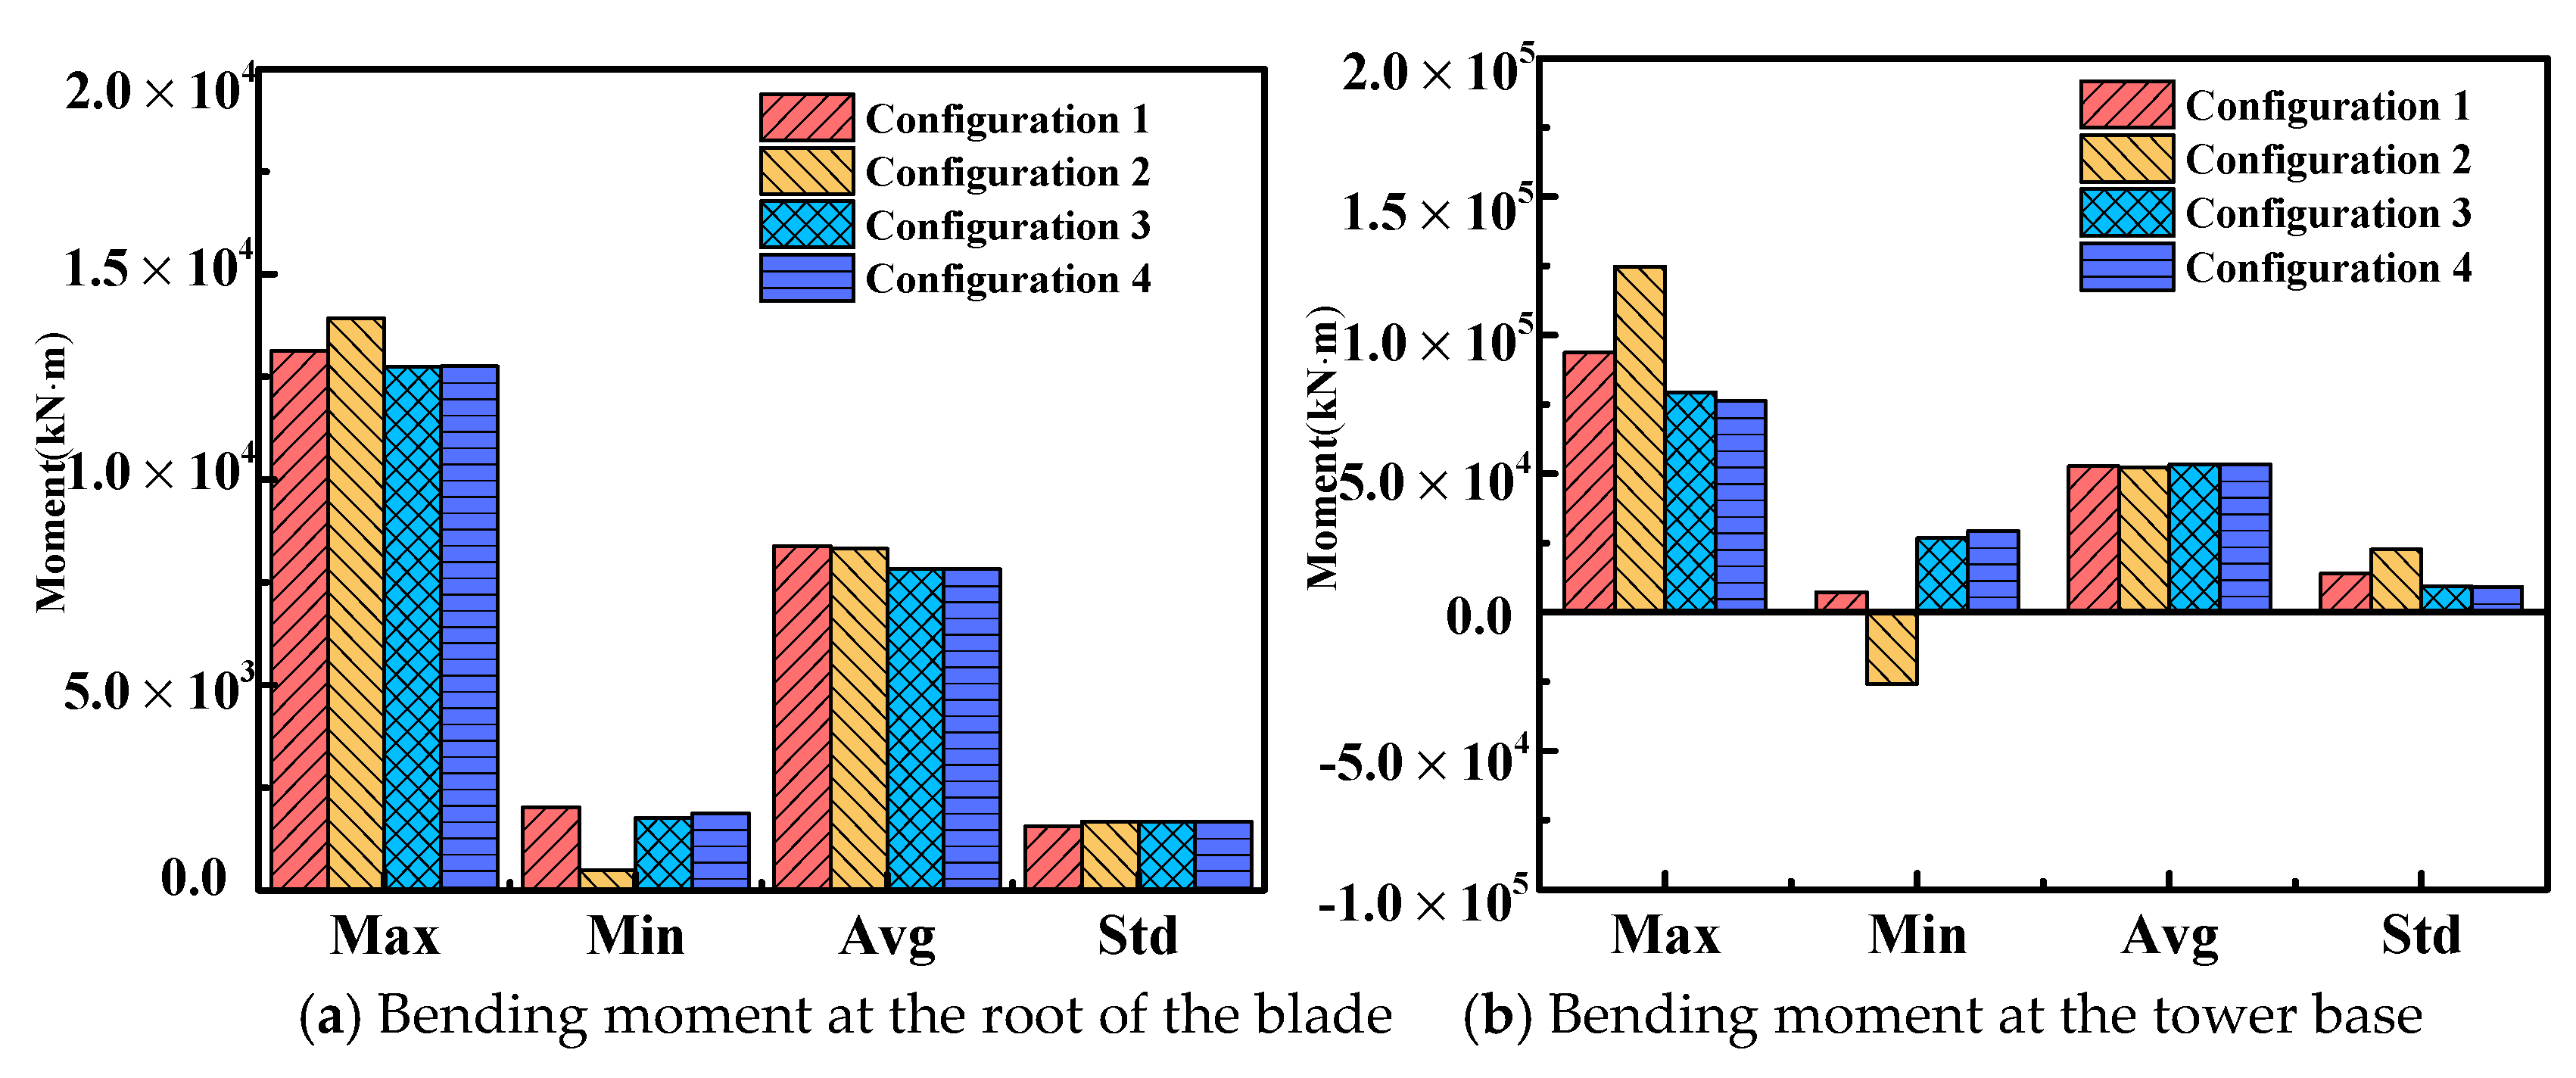
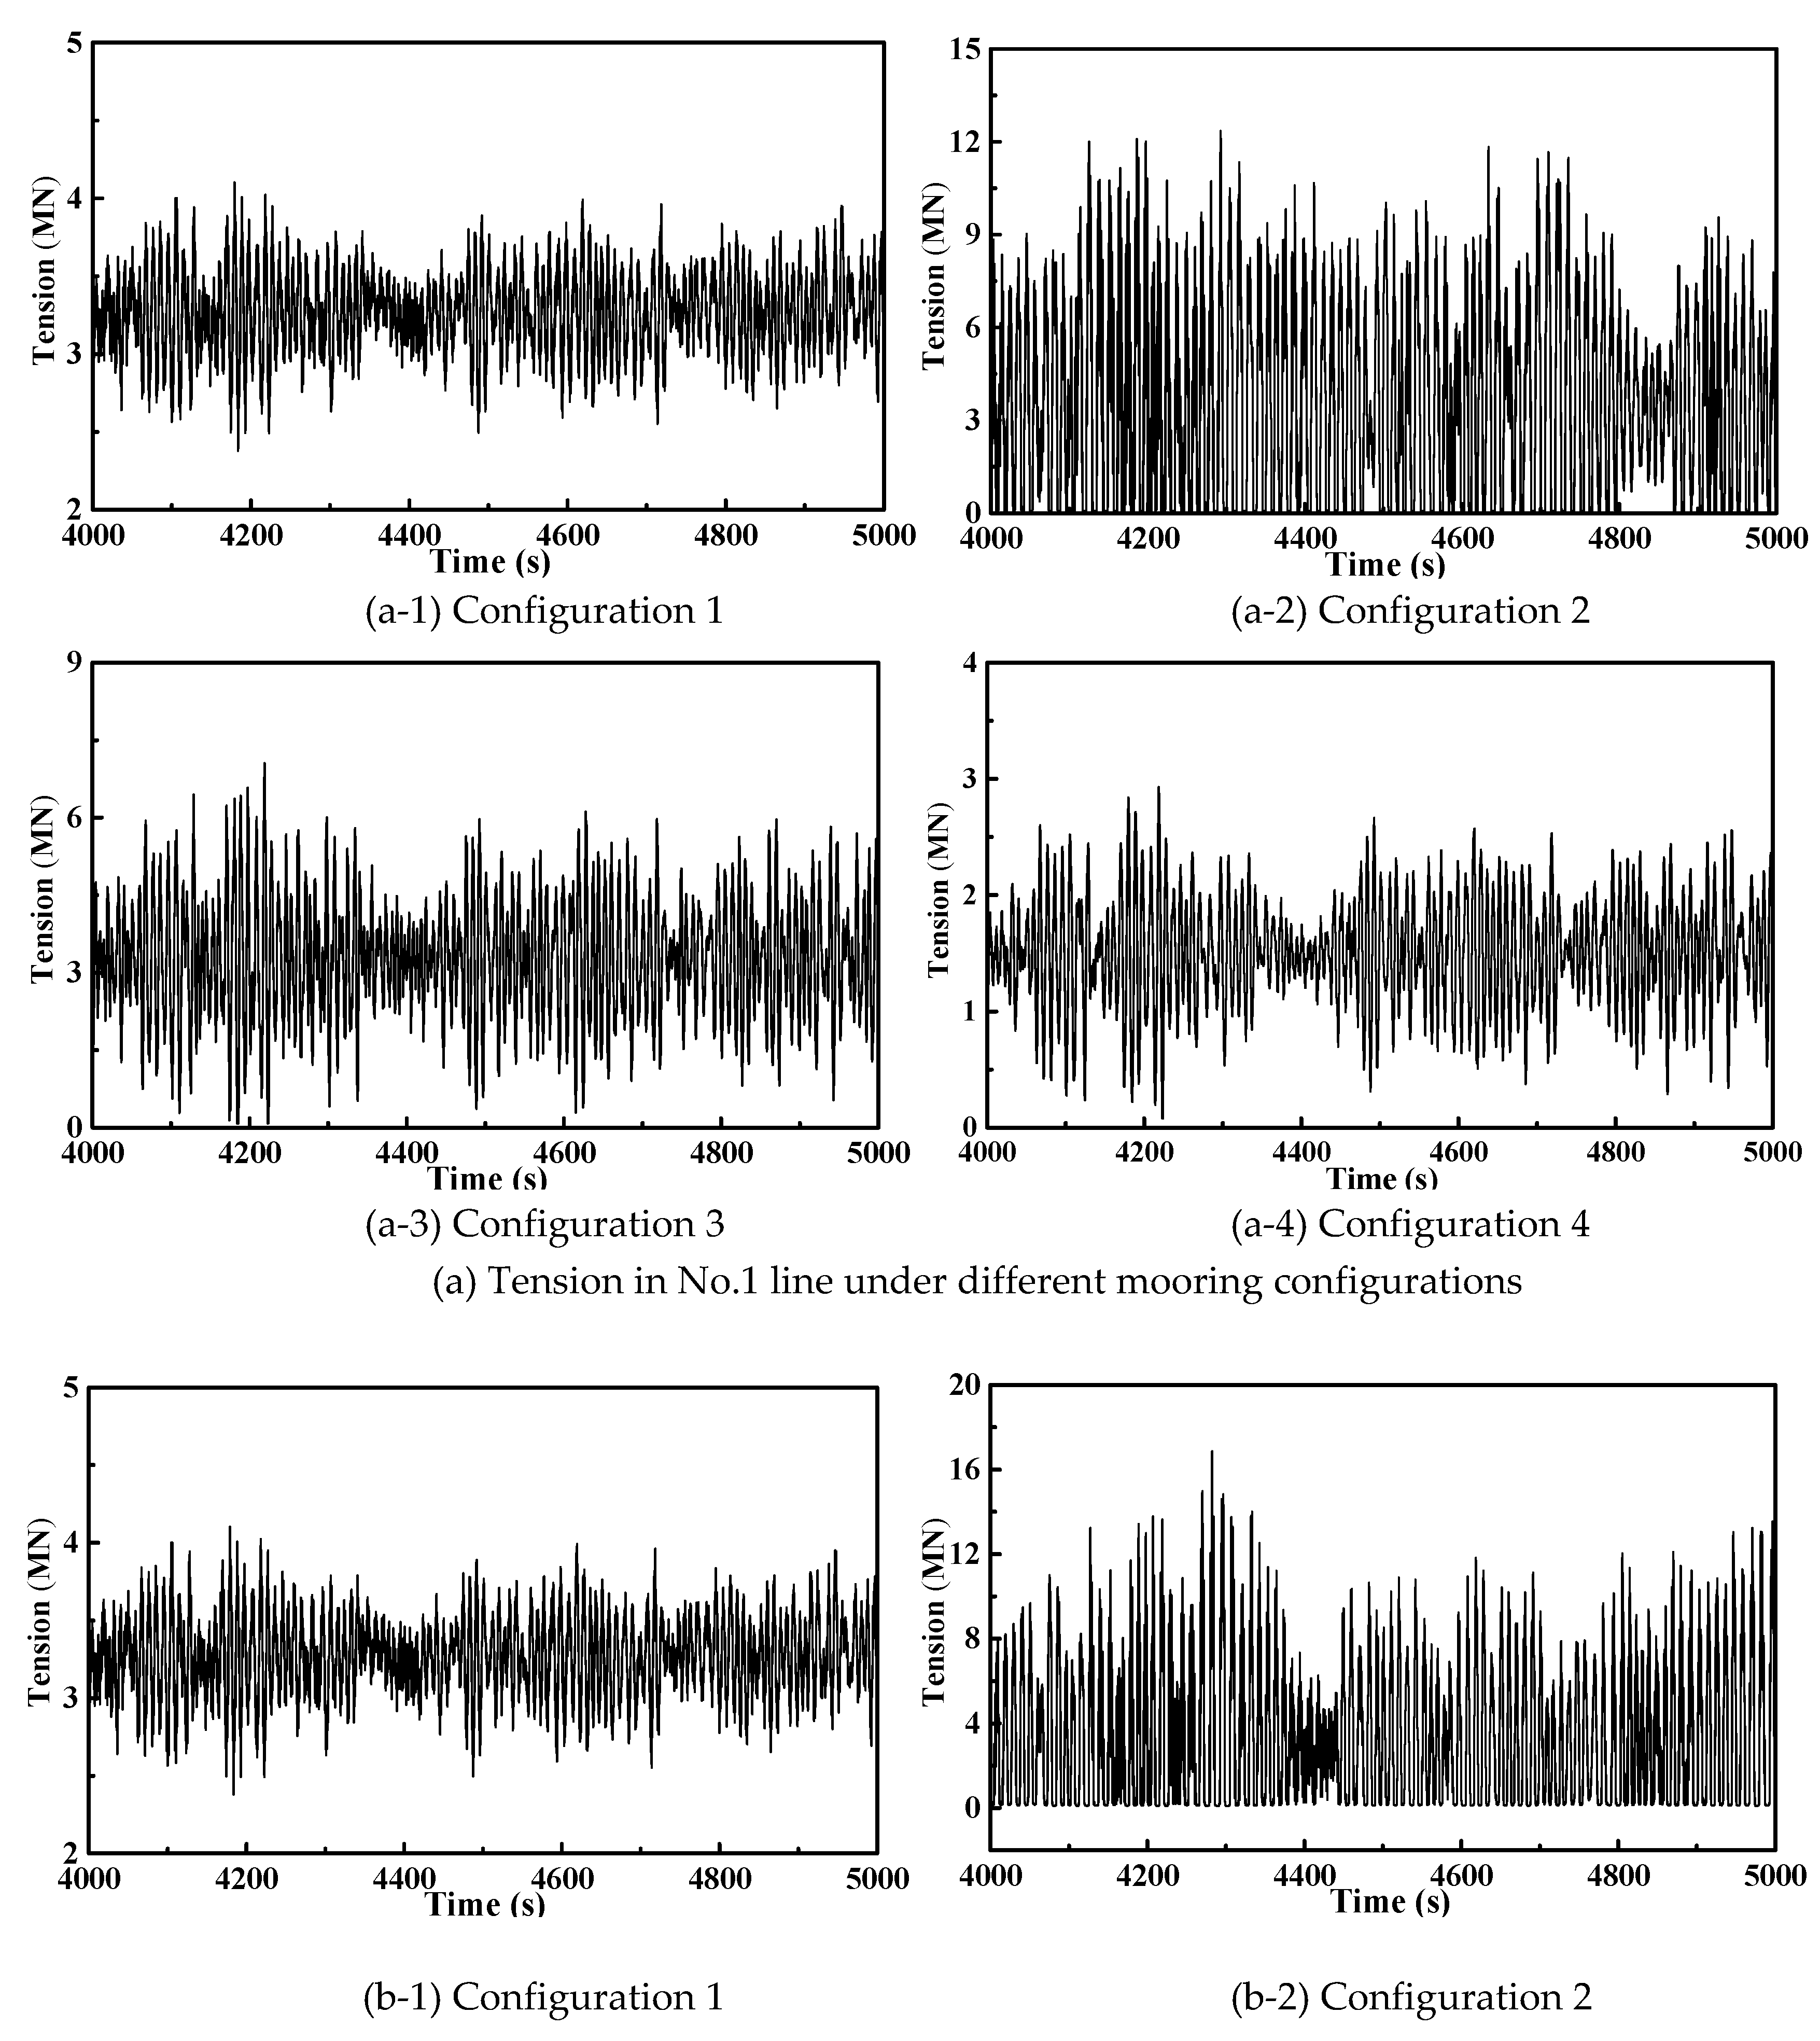
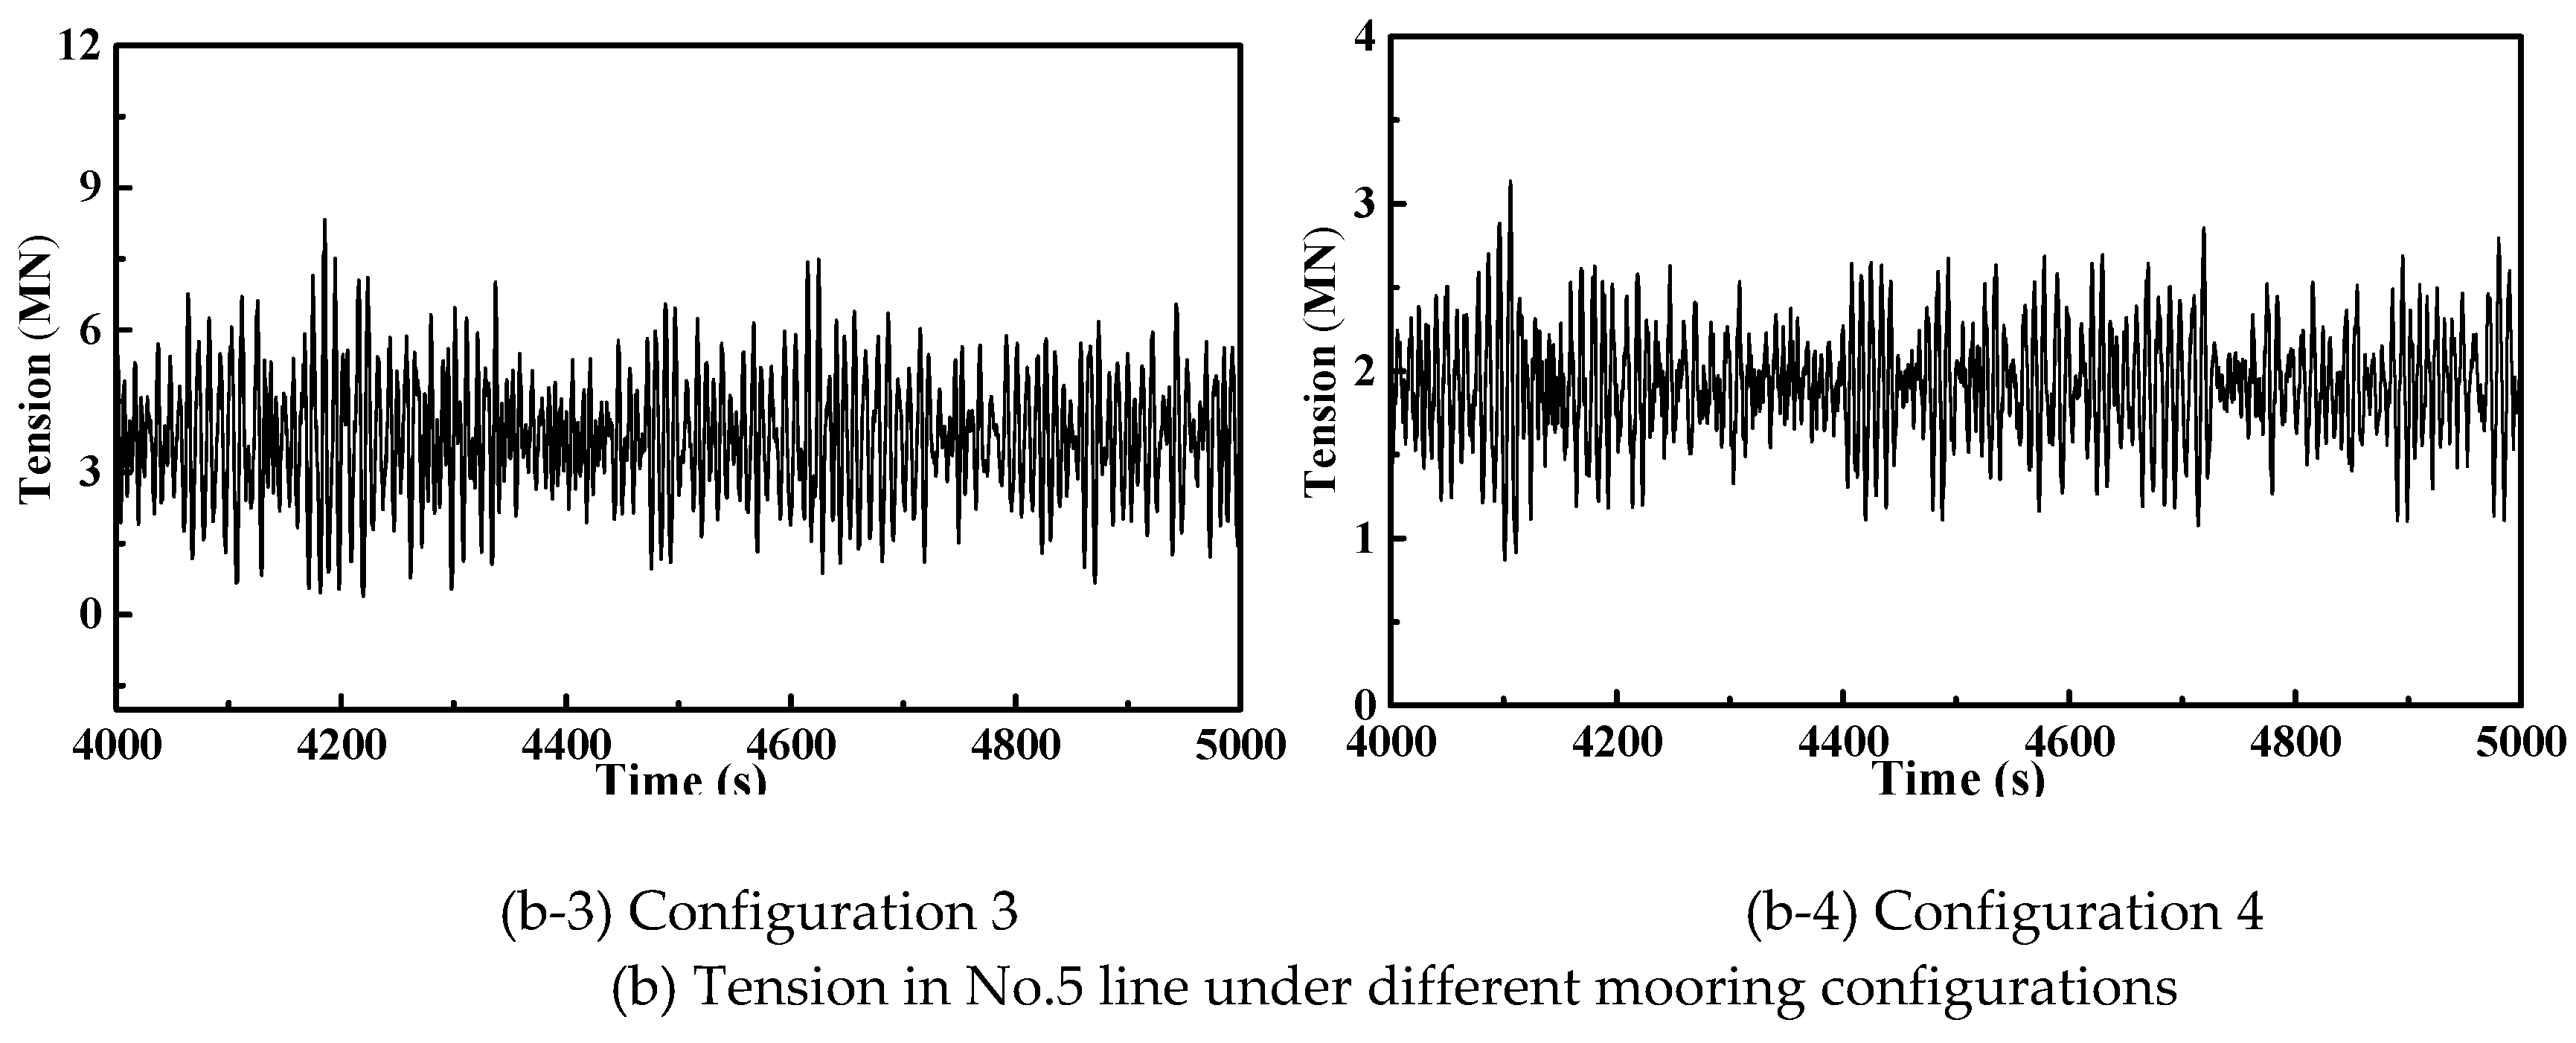
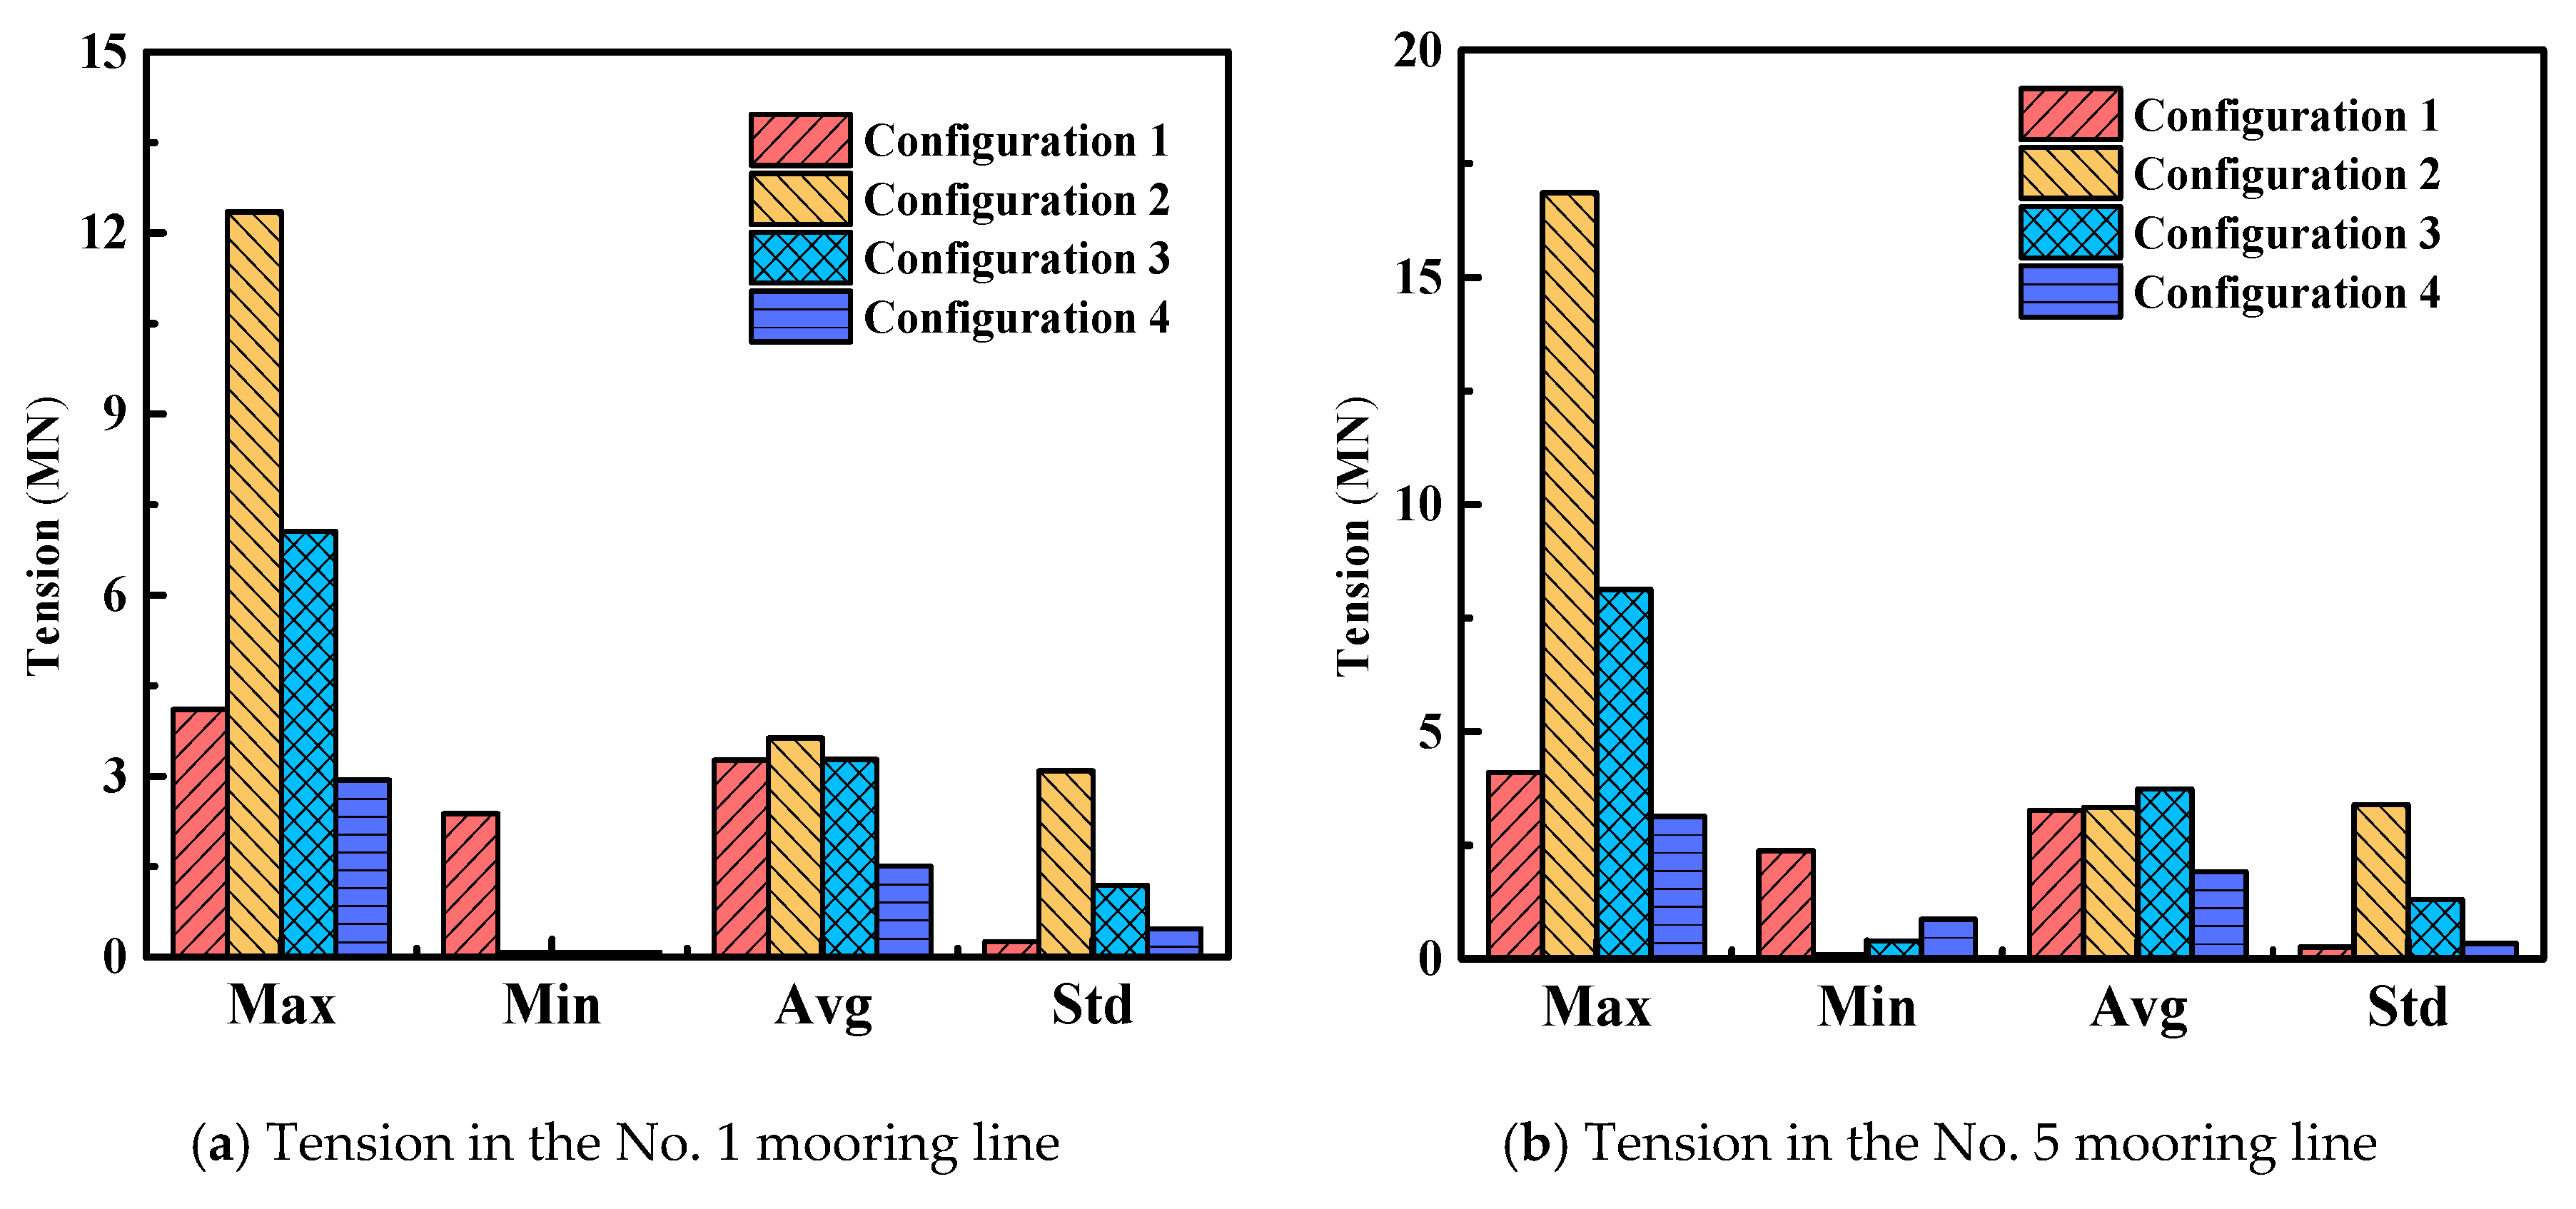
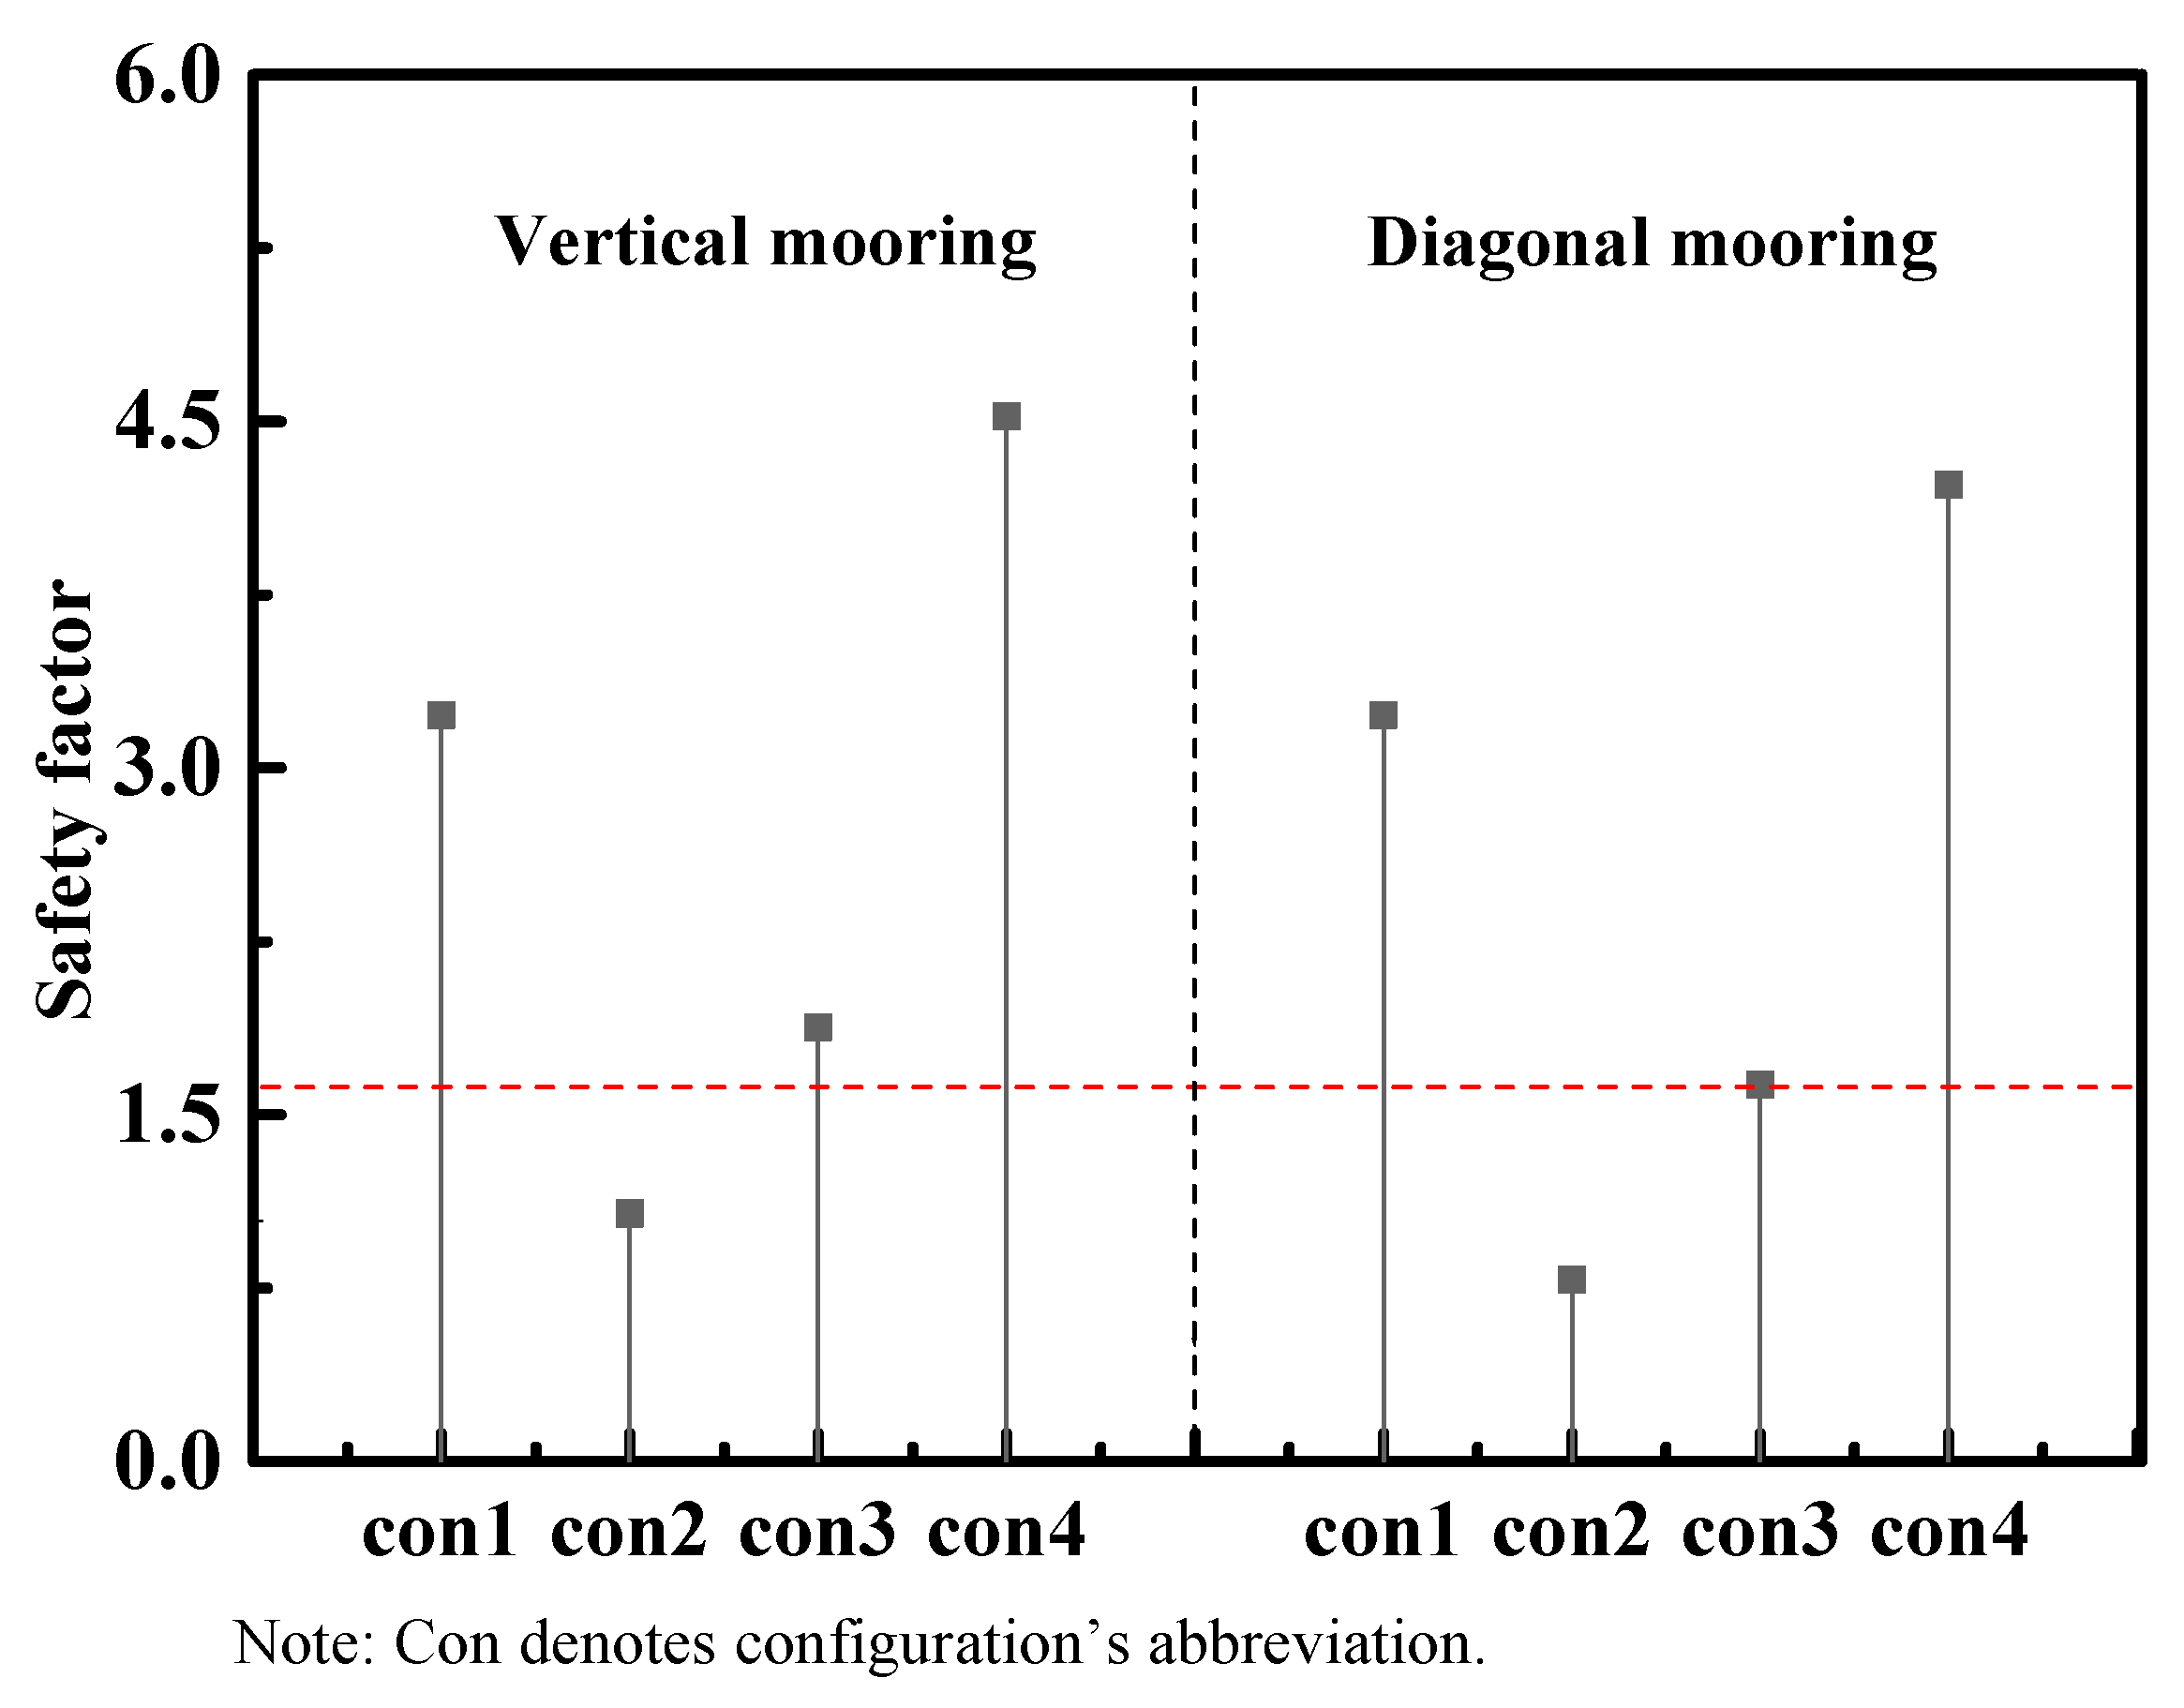
3.2. Dynamic Response

The safety factor of a mooring line can be expressed as follows:
F = P B T max
where P B and T max are the breaking strength and maximum tension in the mooring line, respectively.
The requirements of the minimum safety factor in different states are listed in Table 4.
The motion responses and internal force distributions of SFOWT under four different mooring configurations are shown in Table 5 and Figure 2, with a draft of 22 m, a water depth of 100 m, a wind speed of 11.4 m/s, a significant wave height of 3 m, and a peak period of 10 s generated by the JONSWAP spectrum with a peak enhancement factor of 3.3. The directions of wind and wave are along the X-axis. The sea-states are modeled using three-hour periods, and the statistical analysis was carried out using the time-series of 4000–5000 s. The pretension in mooring lines is shown in Table 6.
Figure 3 and Figure 4 show the time series of platform motion under different mooring configurations and the corresponding motion statistics, respectively. The mooring lines provide a restoring force for the platform, affecting its motion response. As can be seen from Figure 3a and Figure 4a, the surge equilibrium position under Configuration 1 had a larger displacement than the others; when there was a diagonal mooring line, the maximum value and standard deviation of surge were in the order of Configuration 2 > Configuration 3 > Configuration 4. In comparison to Configuration 2, the maximum value and standard deviation under Configuration 4 were reduced by 95.9% and 96.4%, respectively. The diagonal mooring lines provide a horizontal restoring force for the floating platform. As the tilt angle of the mooring line increased, the horizontal restoring force provided by the mooring lines increased. As shown in Figure 3b and Figure 4b, the heave response of the platform under Configuration 2 was larger, because it had a smaller vertical restoring force than Configurations 1 and 4, and the large surge motion also induced the large heave motion due to the set-down motion. Figure 3c,d and Figure 4c,d show that the pitch and yaw responses were largest under Configurations 2, while the average of the pitch and yaw response was close to zero under the four configurations. As shown in Figure 3 and Figure 4, the SFOWT had a smaller response and a better performance under Configuration 4.
Figure 5 and Figure 6 show the time series of bending moment at the root of the blade and tower base under different mooring configurations and the corresponding statistics, respectively. There was little change in the bending moment at the root of the blade, which was due to the bending moment being dominated by wind load. The effect of the specific form of configurations was not obvious. The mean value of the tower base bending moment was mainly wind-induced, while its standard deviation was induced by both wind and wave loads; the standard deviation was also influenced by the motion response of the platform. From Figure 5b and Figure 6b, it can be observed that the maximum value and standard deviation appeared under Configuration 2.
The time series of tension in Mooring Lines No. 1 (vertical) and No. 5 (diagonal) under different mooring configurations and the corresponding statistics are shown in Figure 7 and Figure 8, respectively. The dynamic response of the platform drove the movement of the mooring lines, and the tension was influenced by wave loads. The smallest tensions appeared under Configuration 4.
The safety factor of mooring lines under different mooring configurations is shown in Figure 9. It can be seen that only Configuration 2 cannot meet the specification requirements.

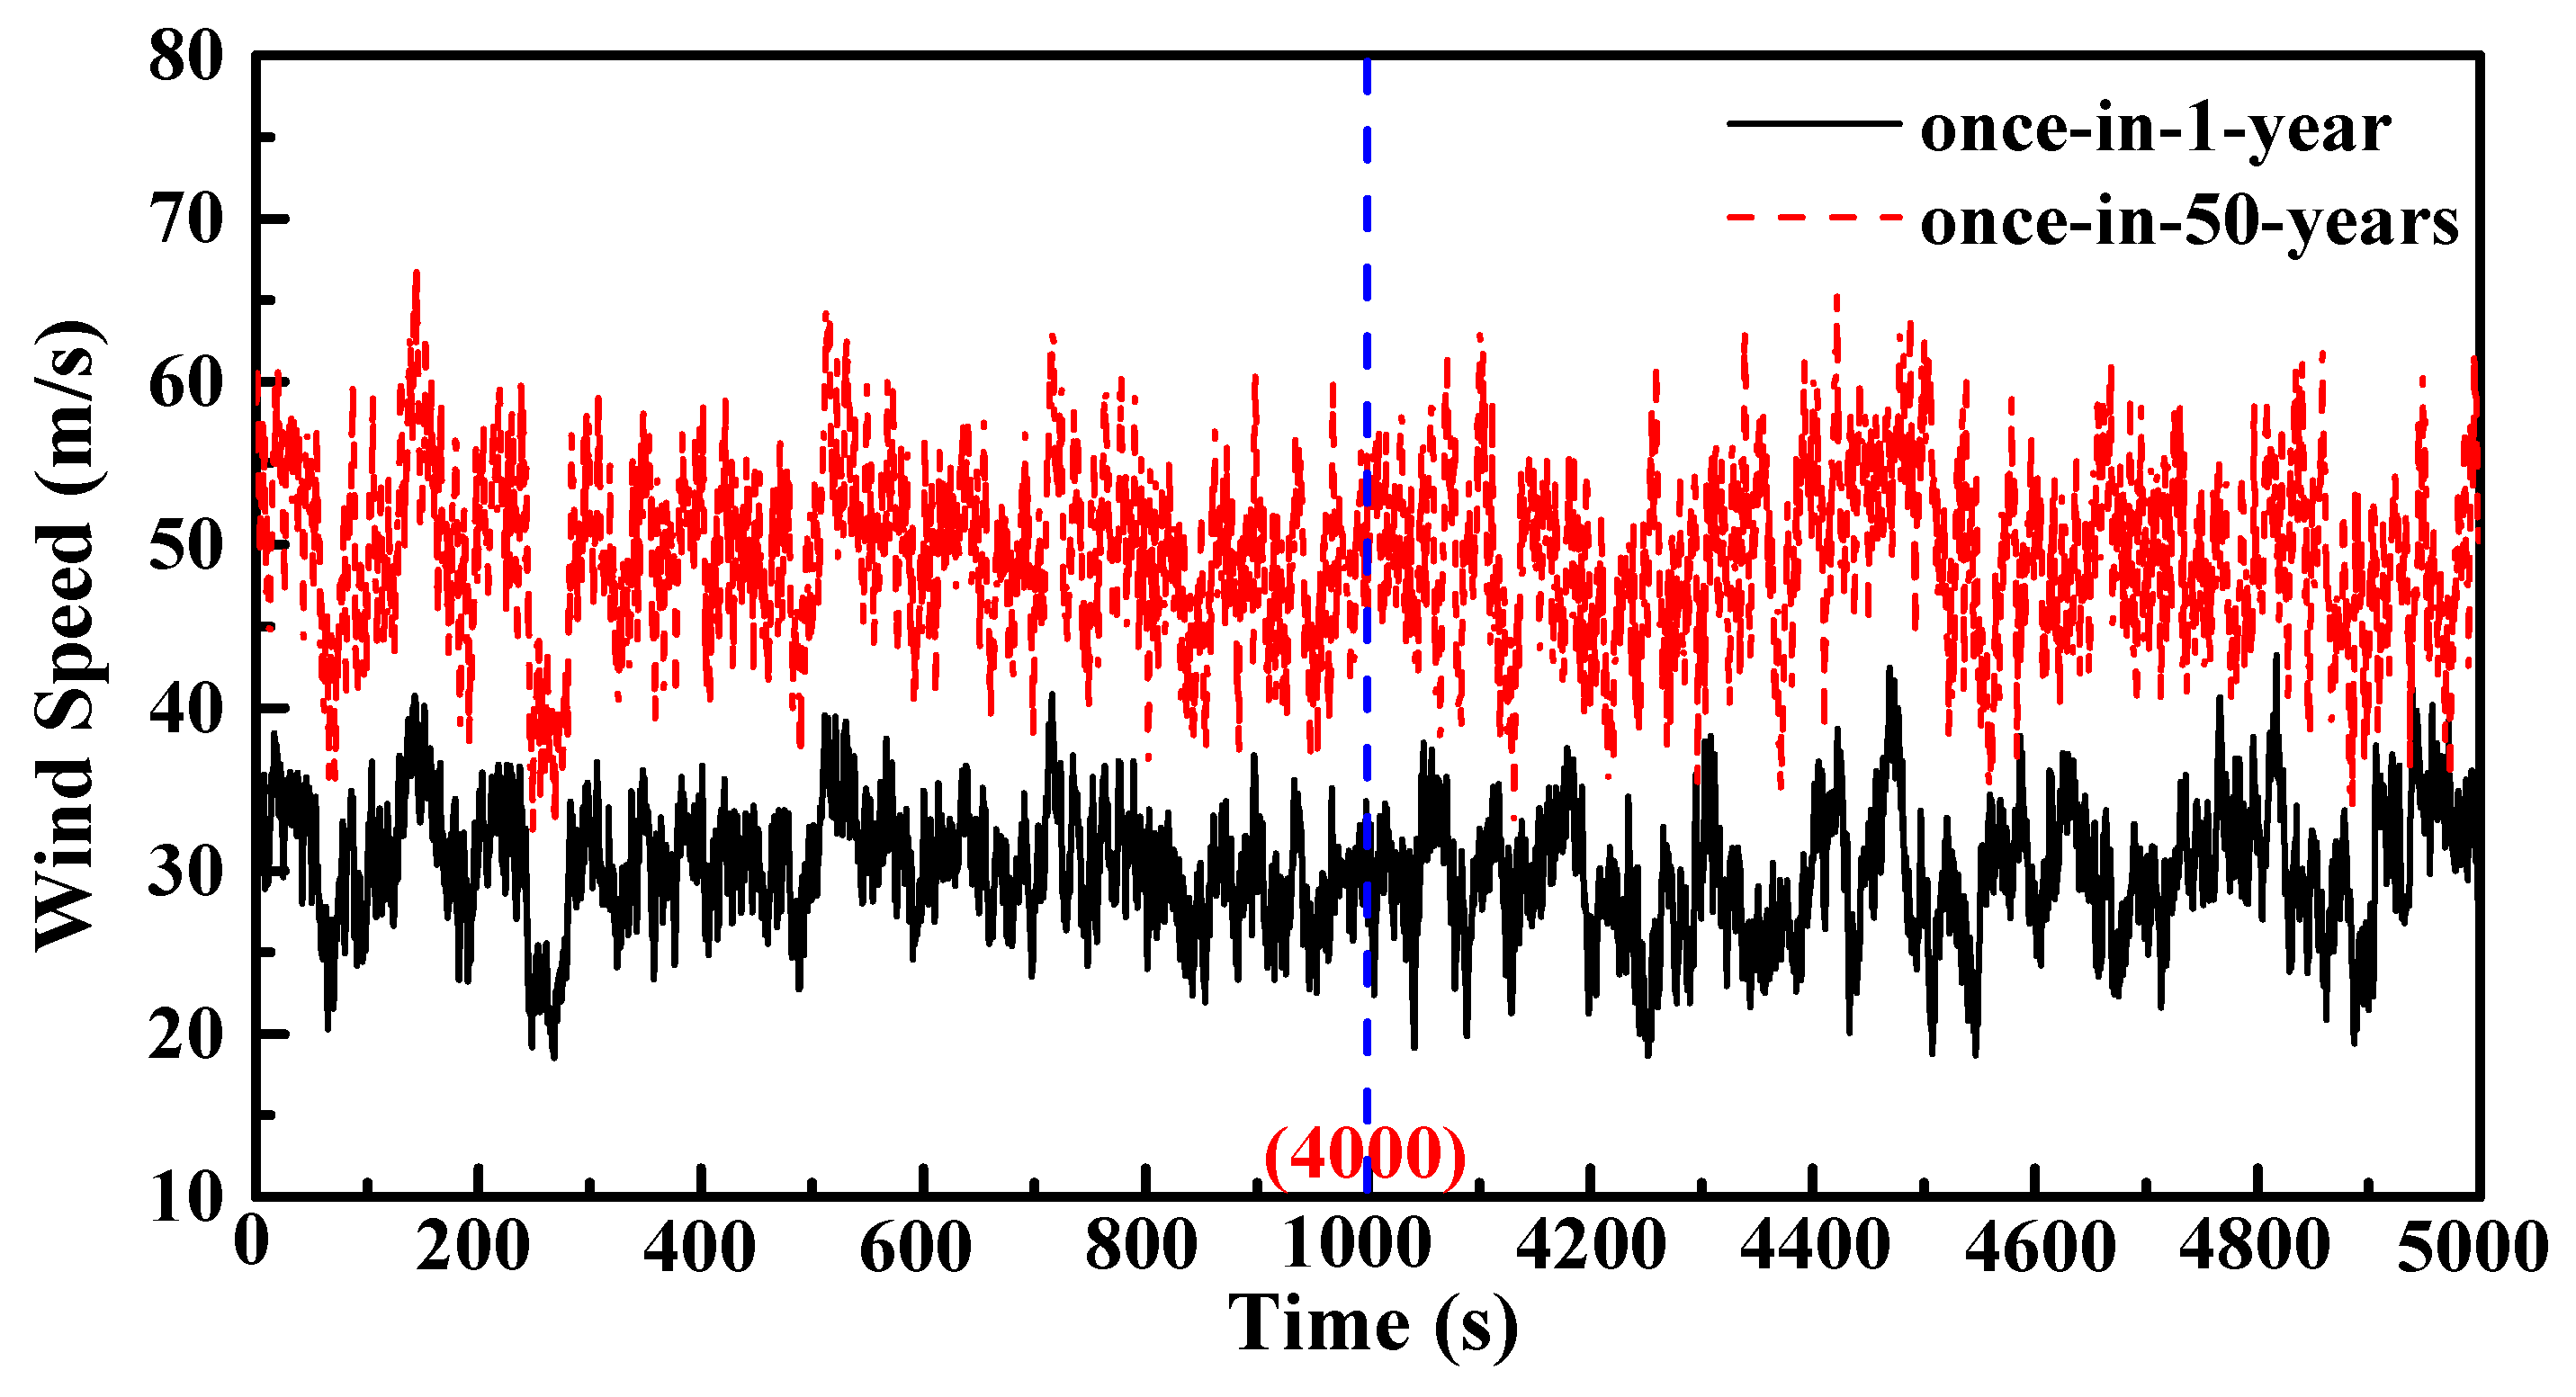
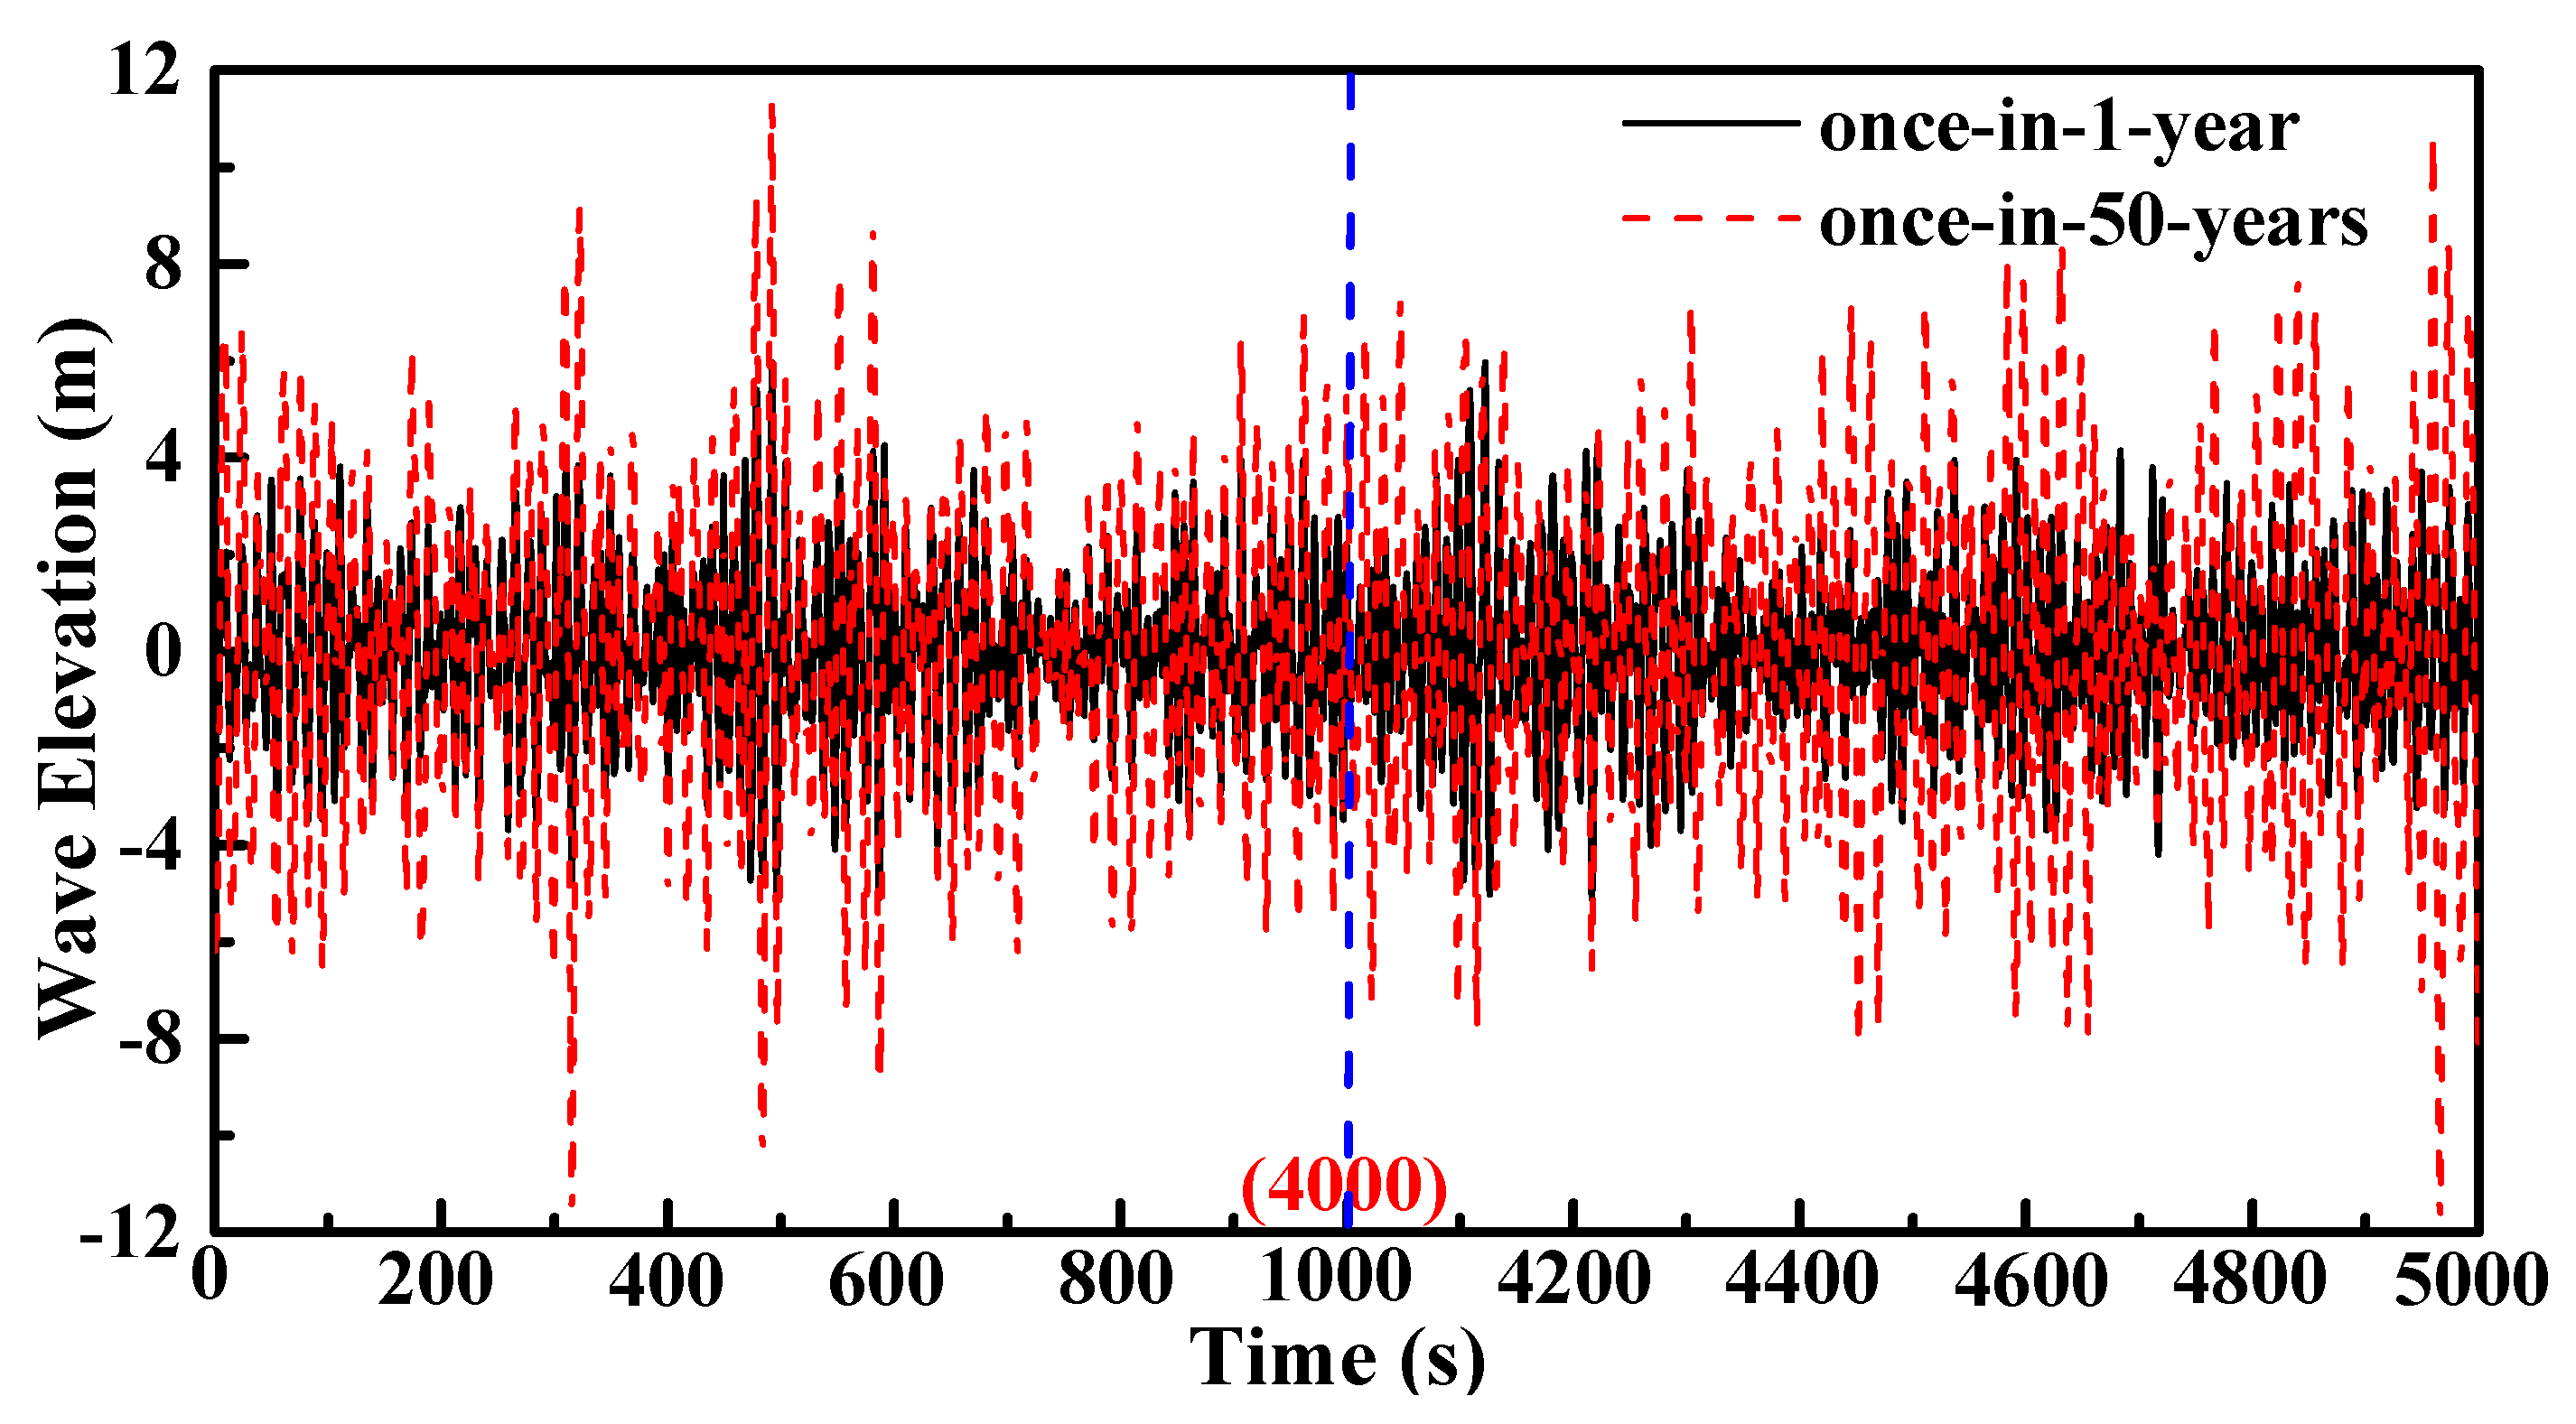
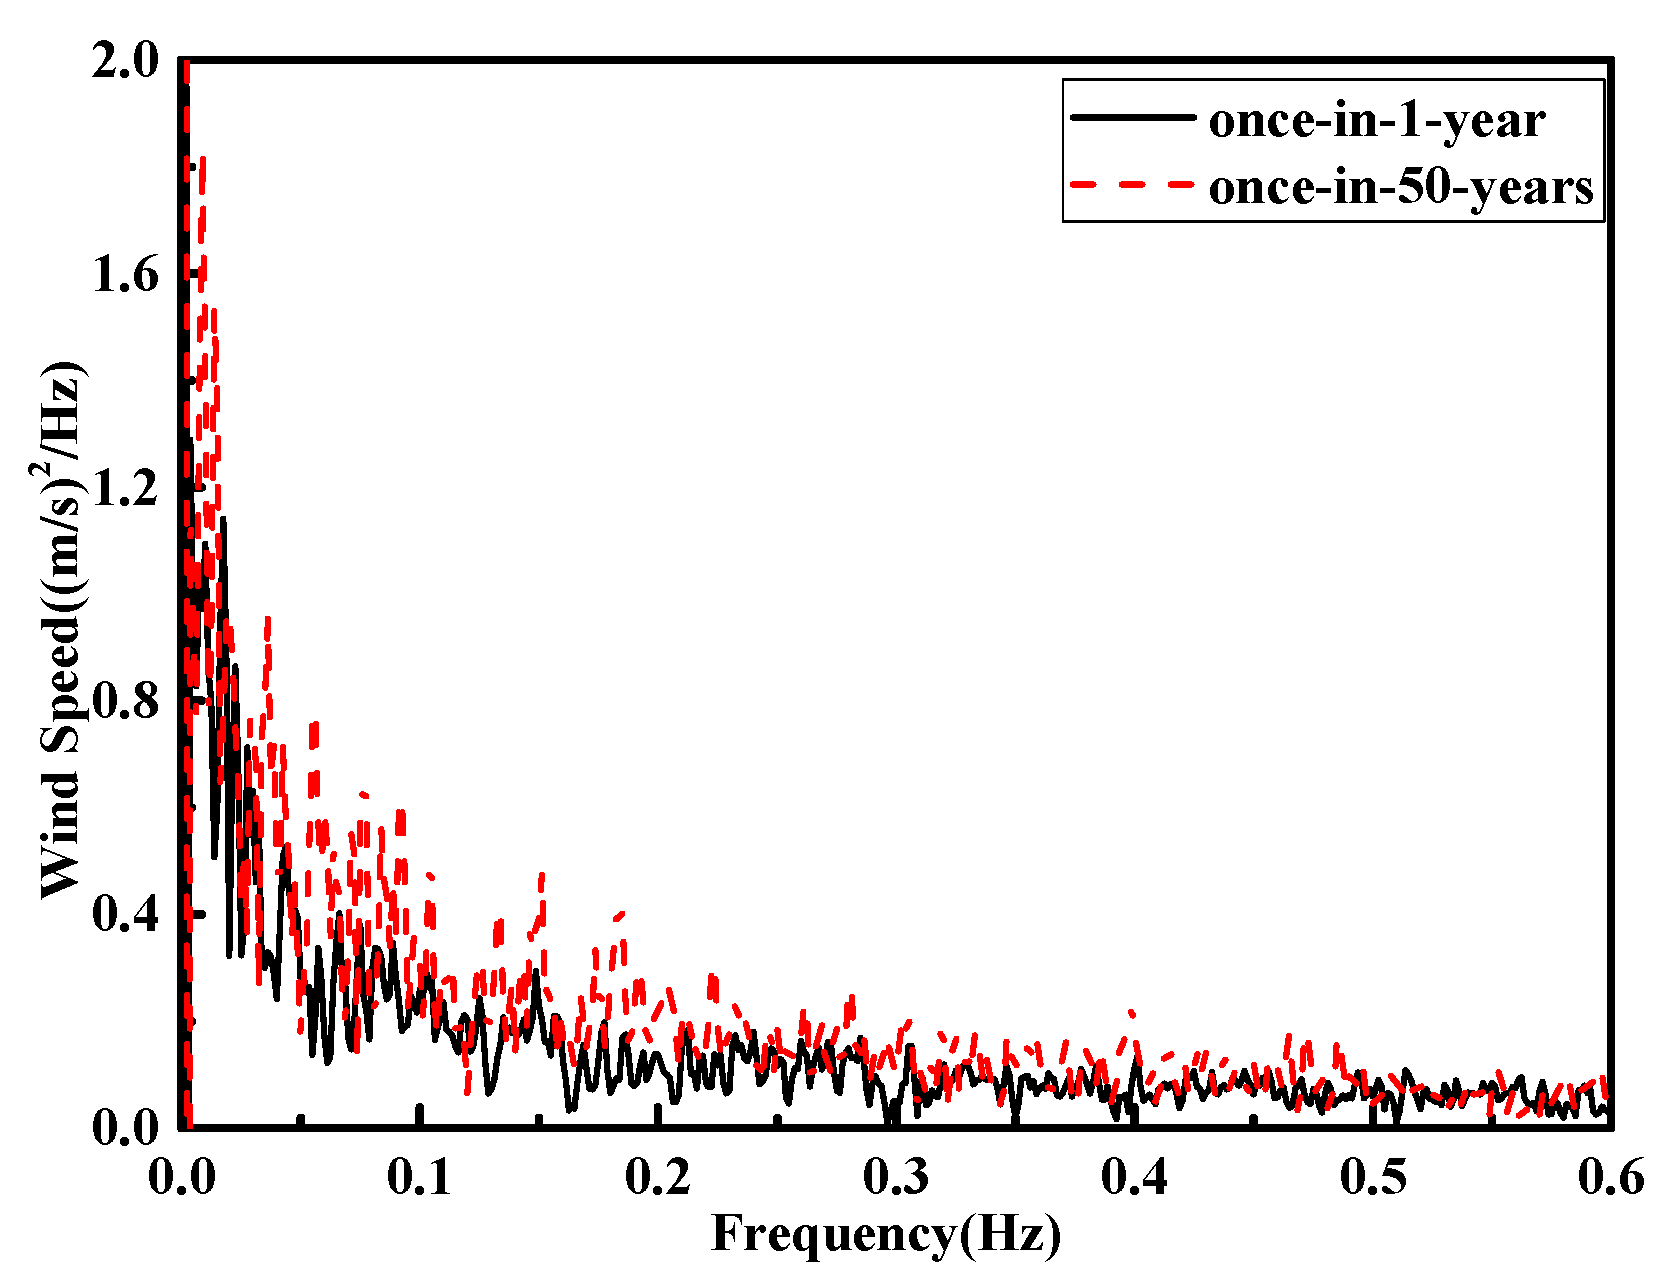
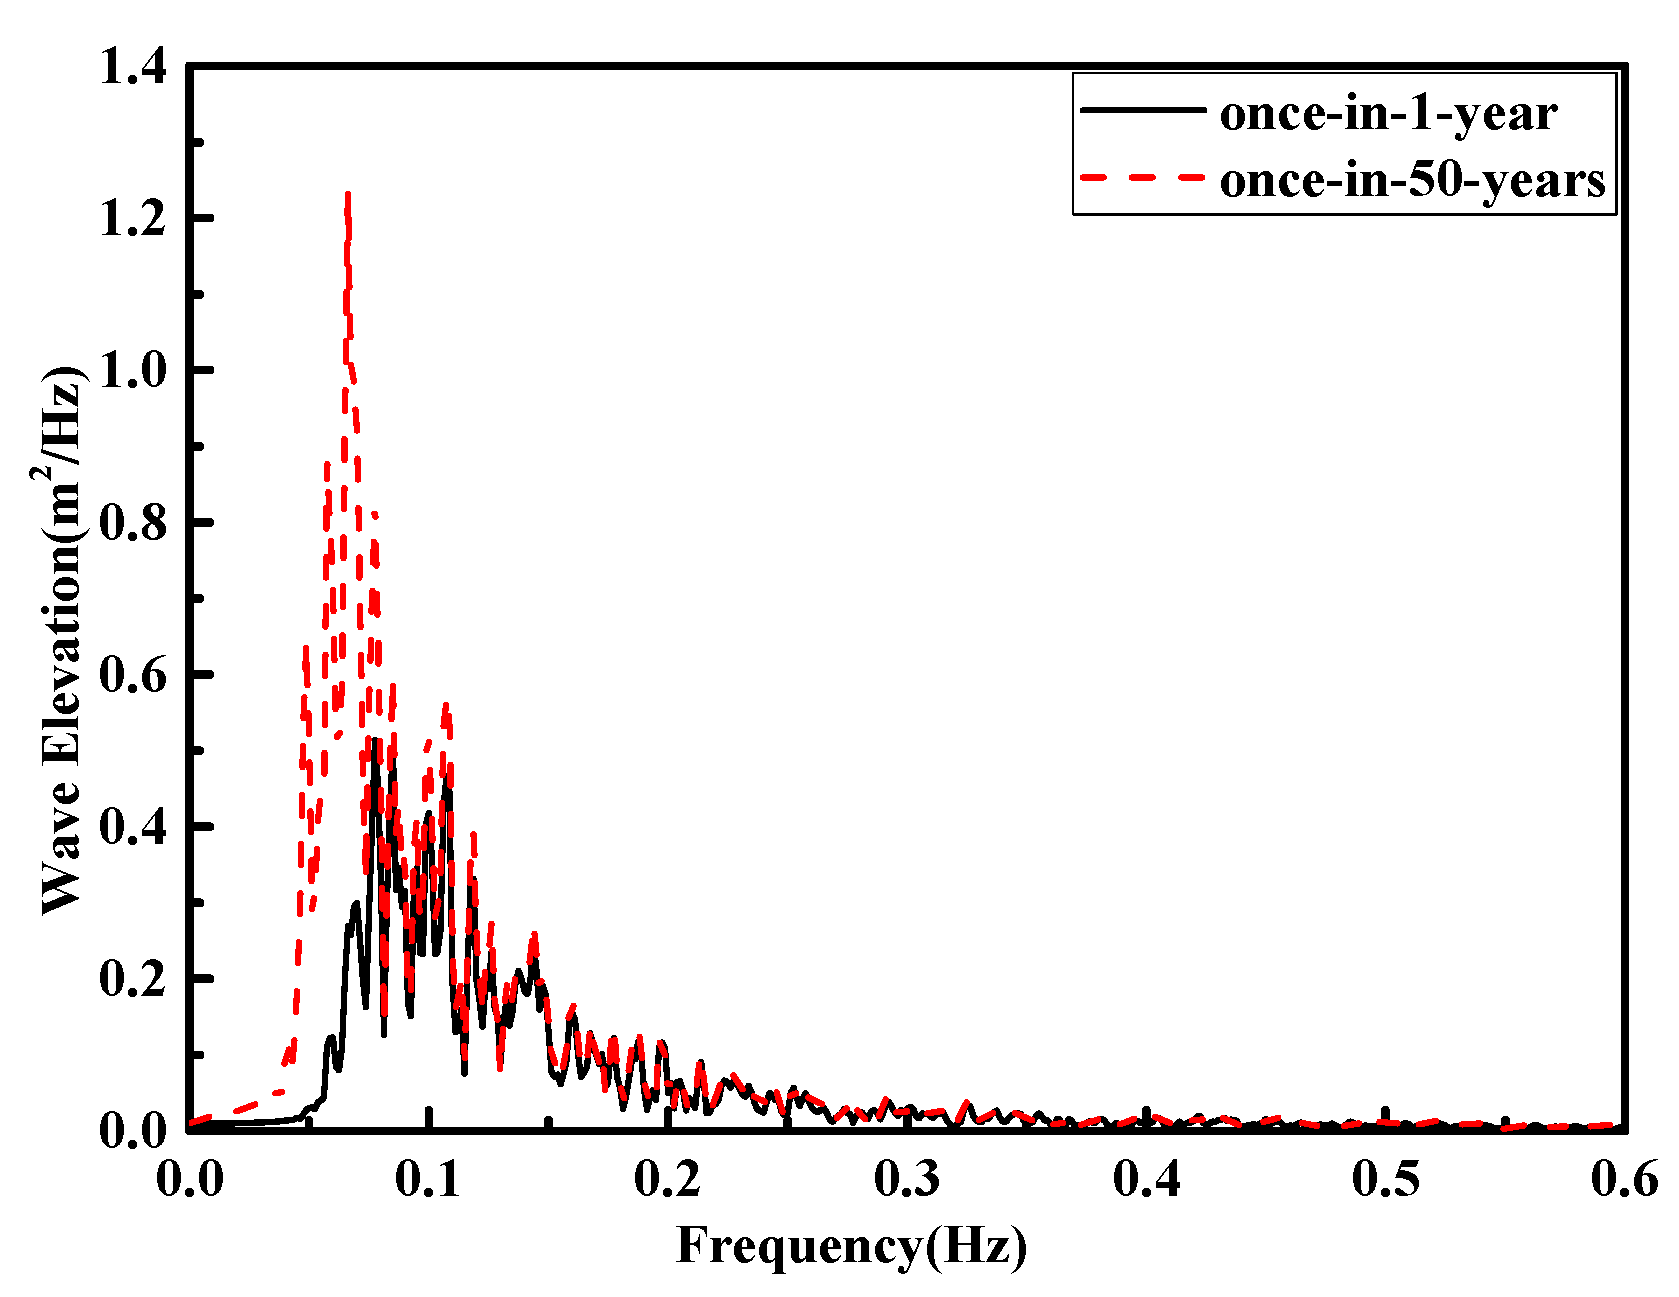
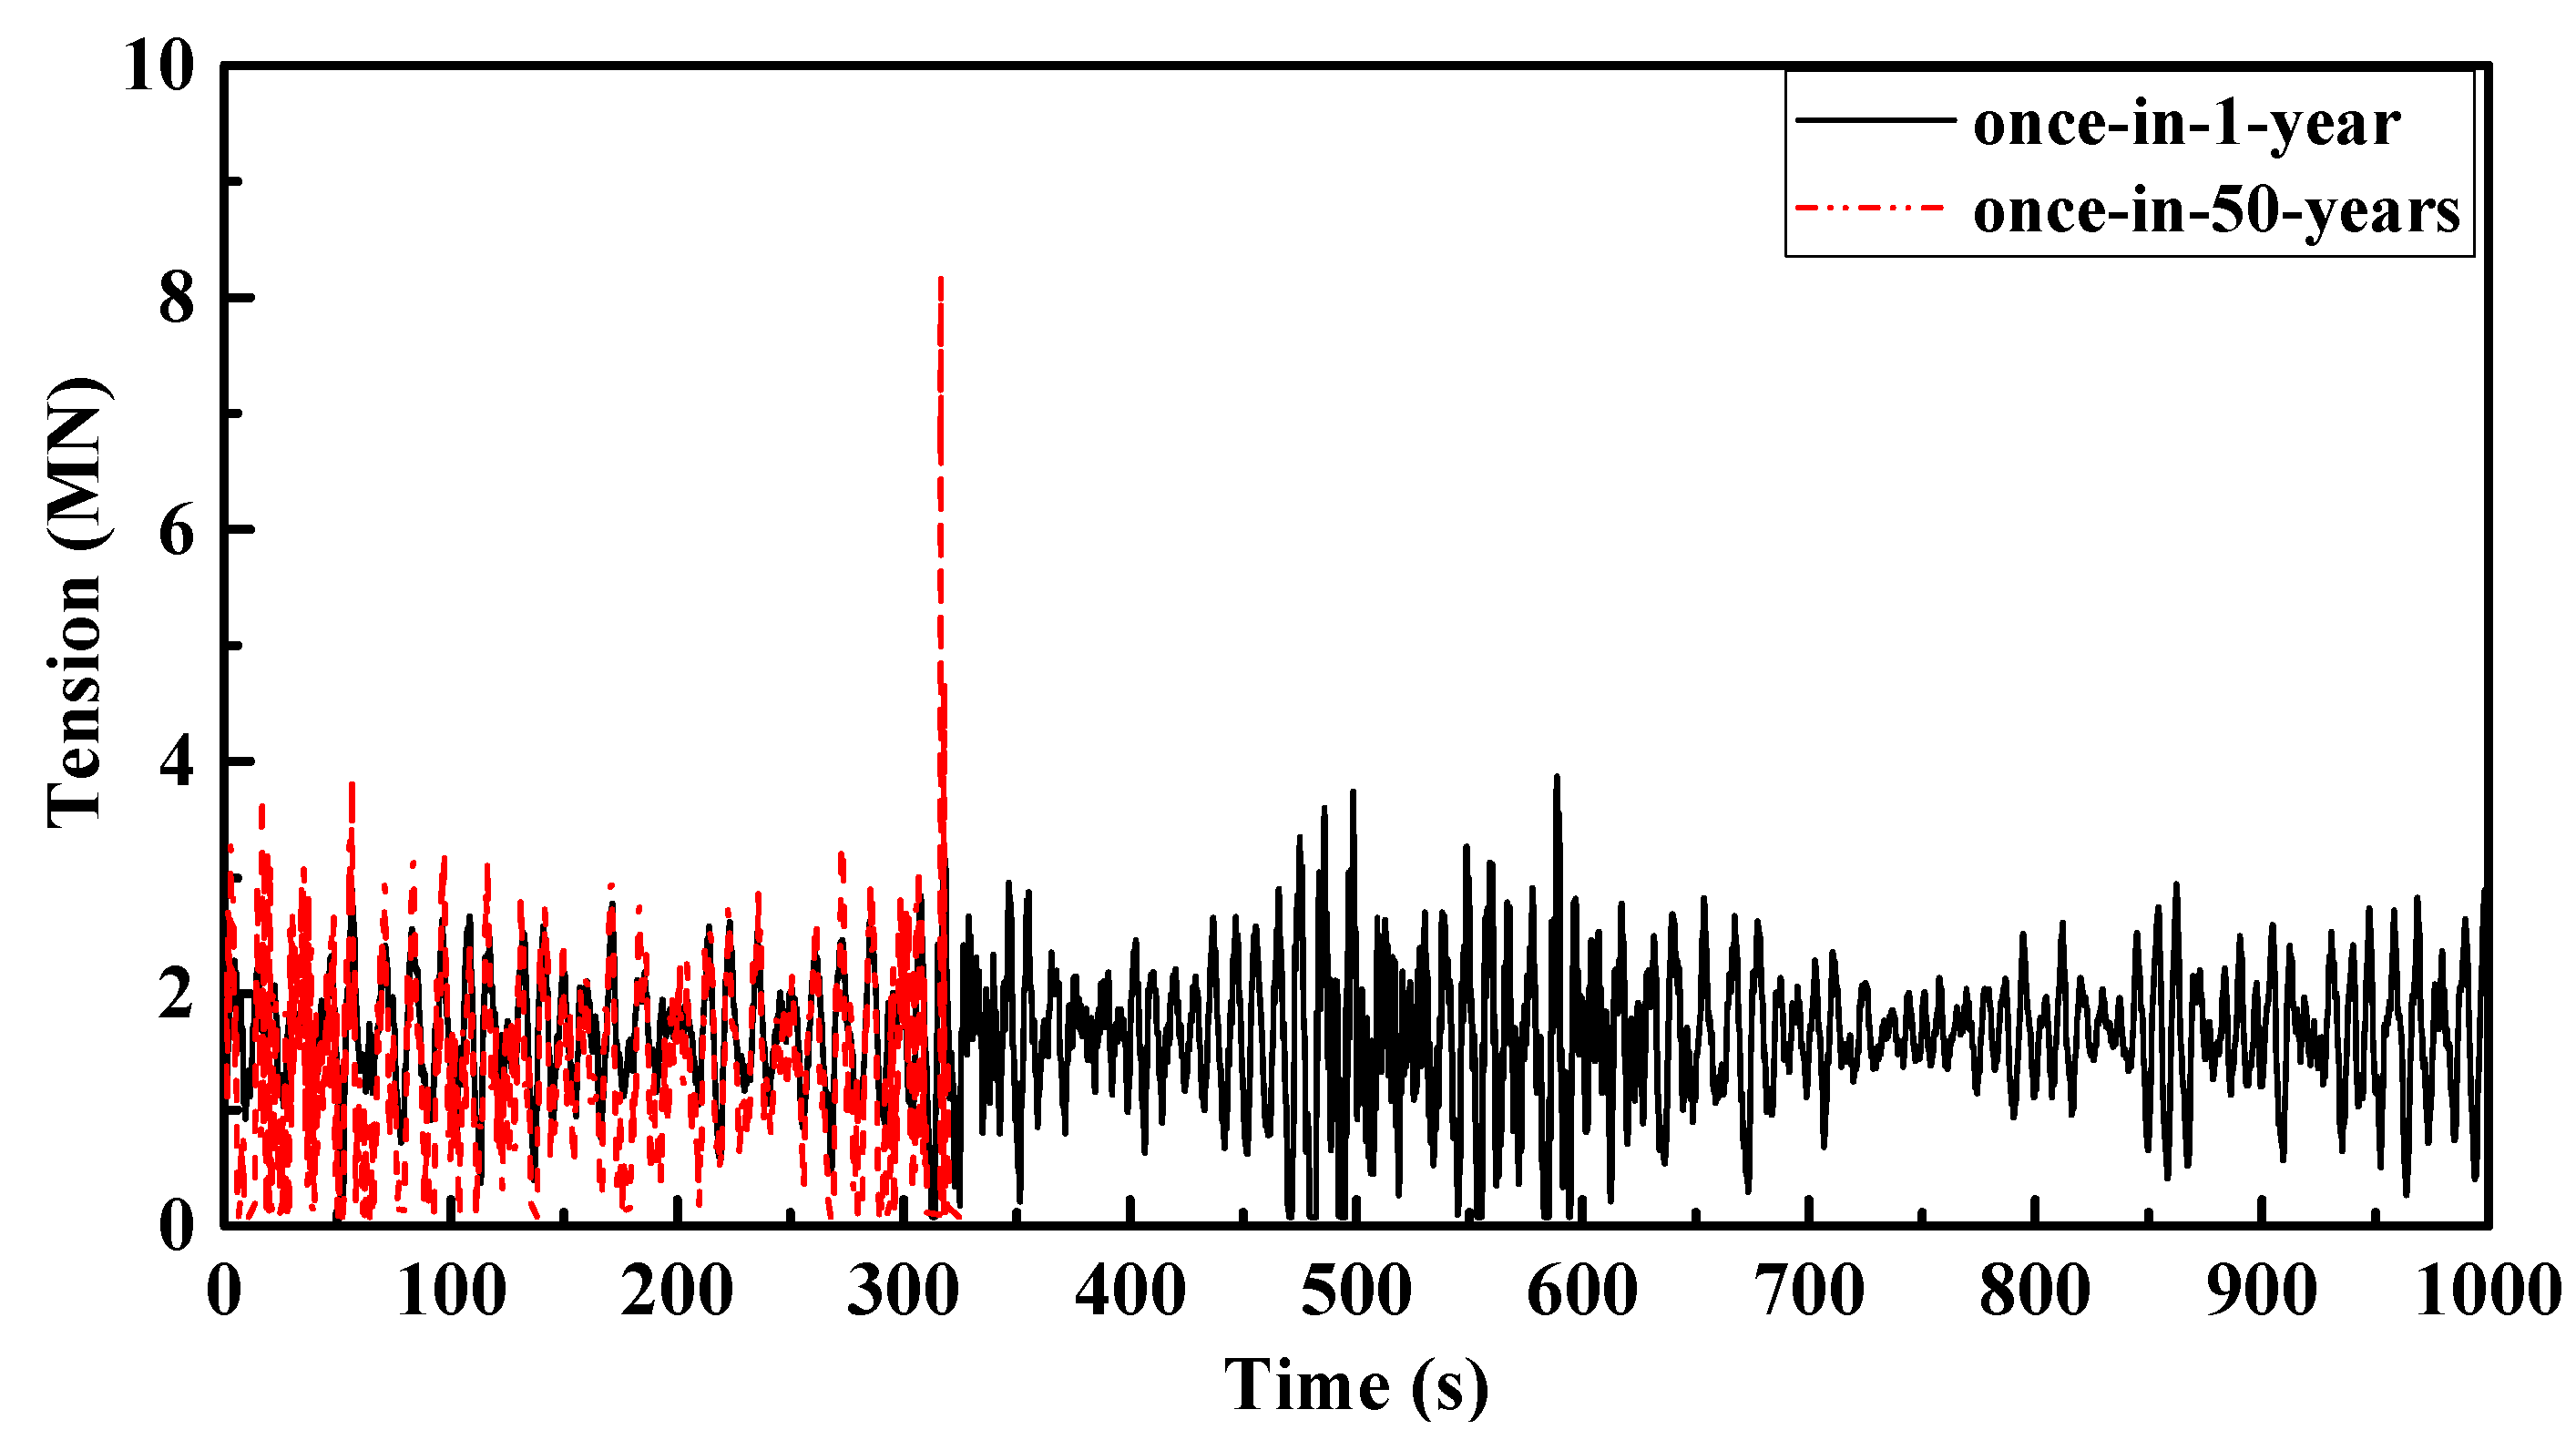
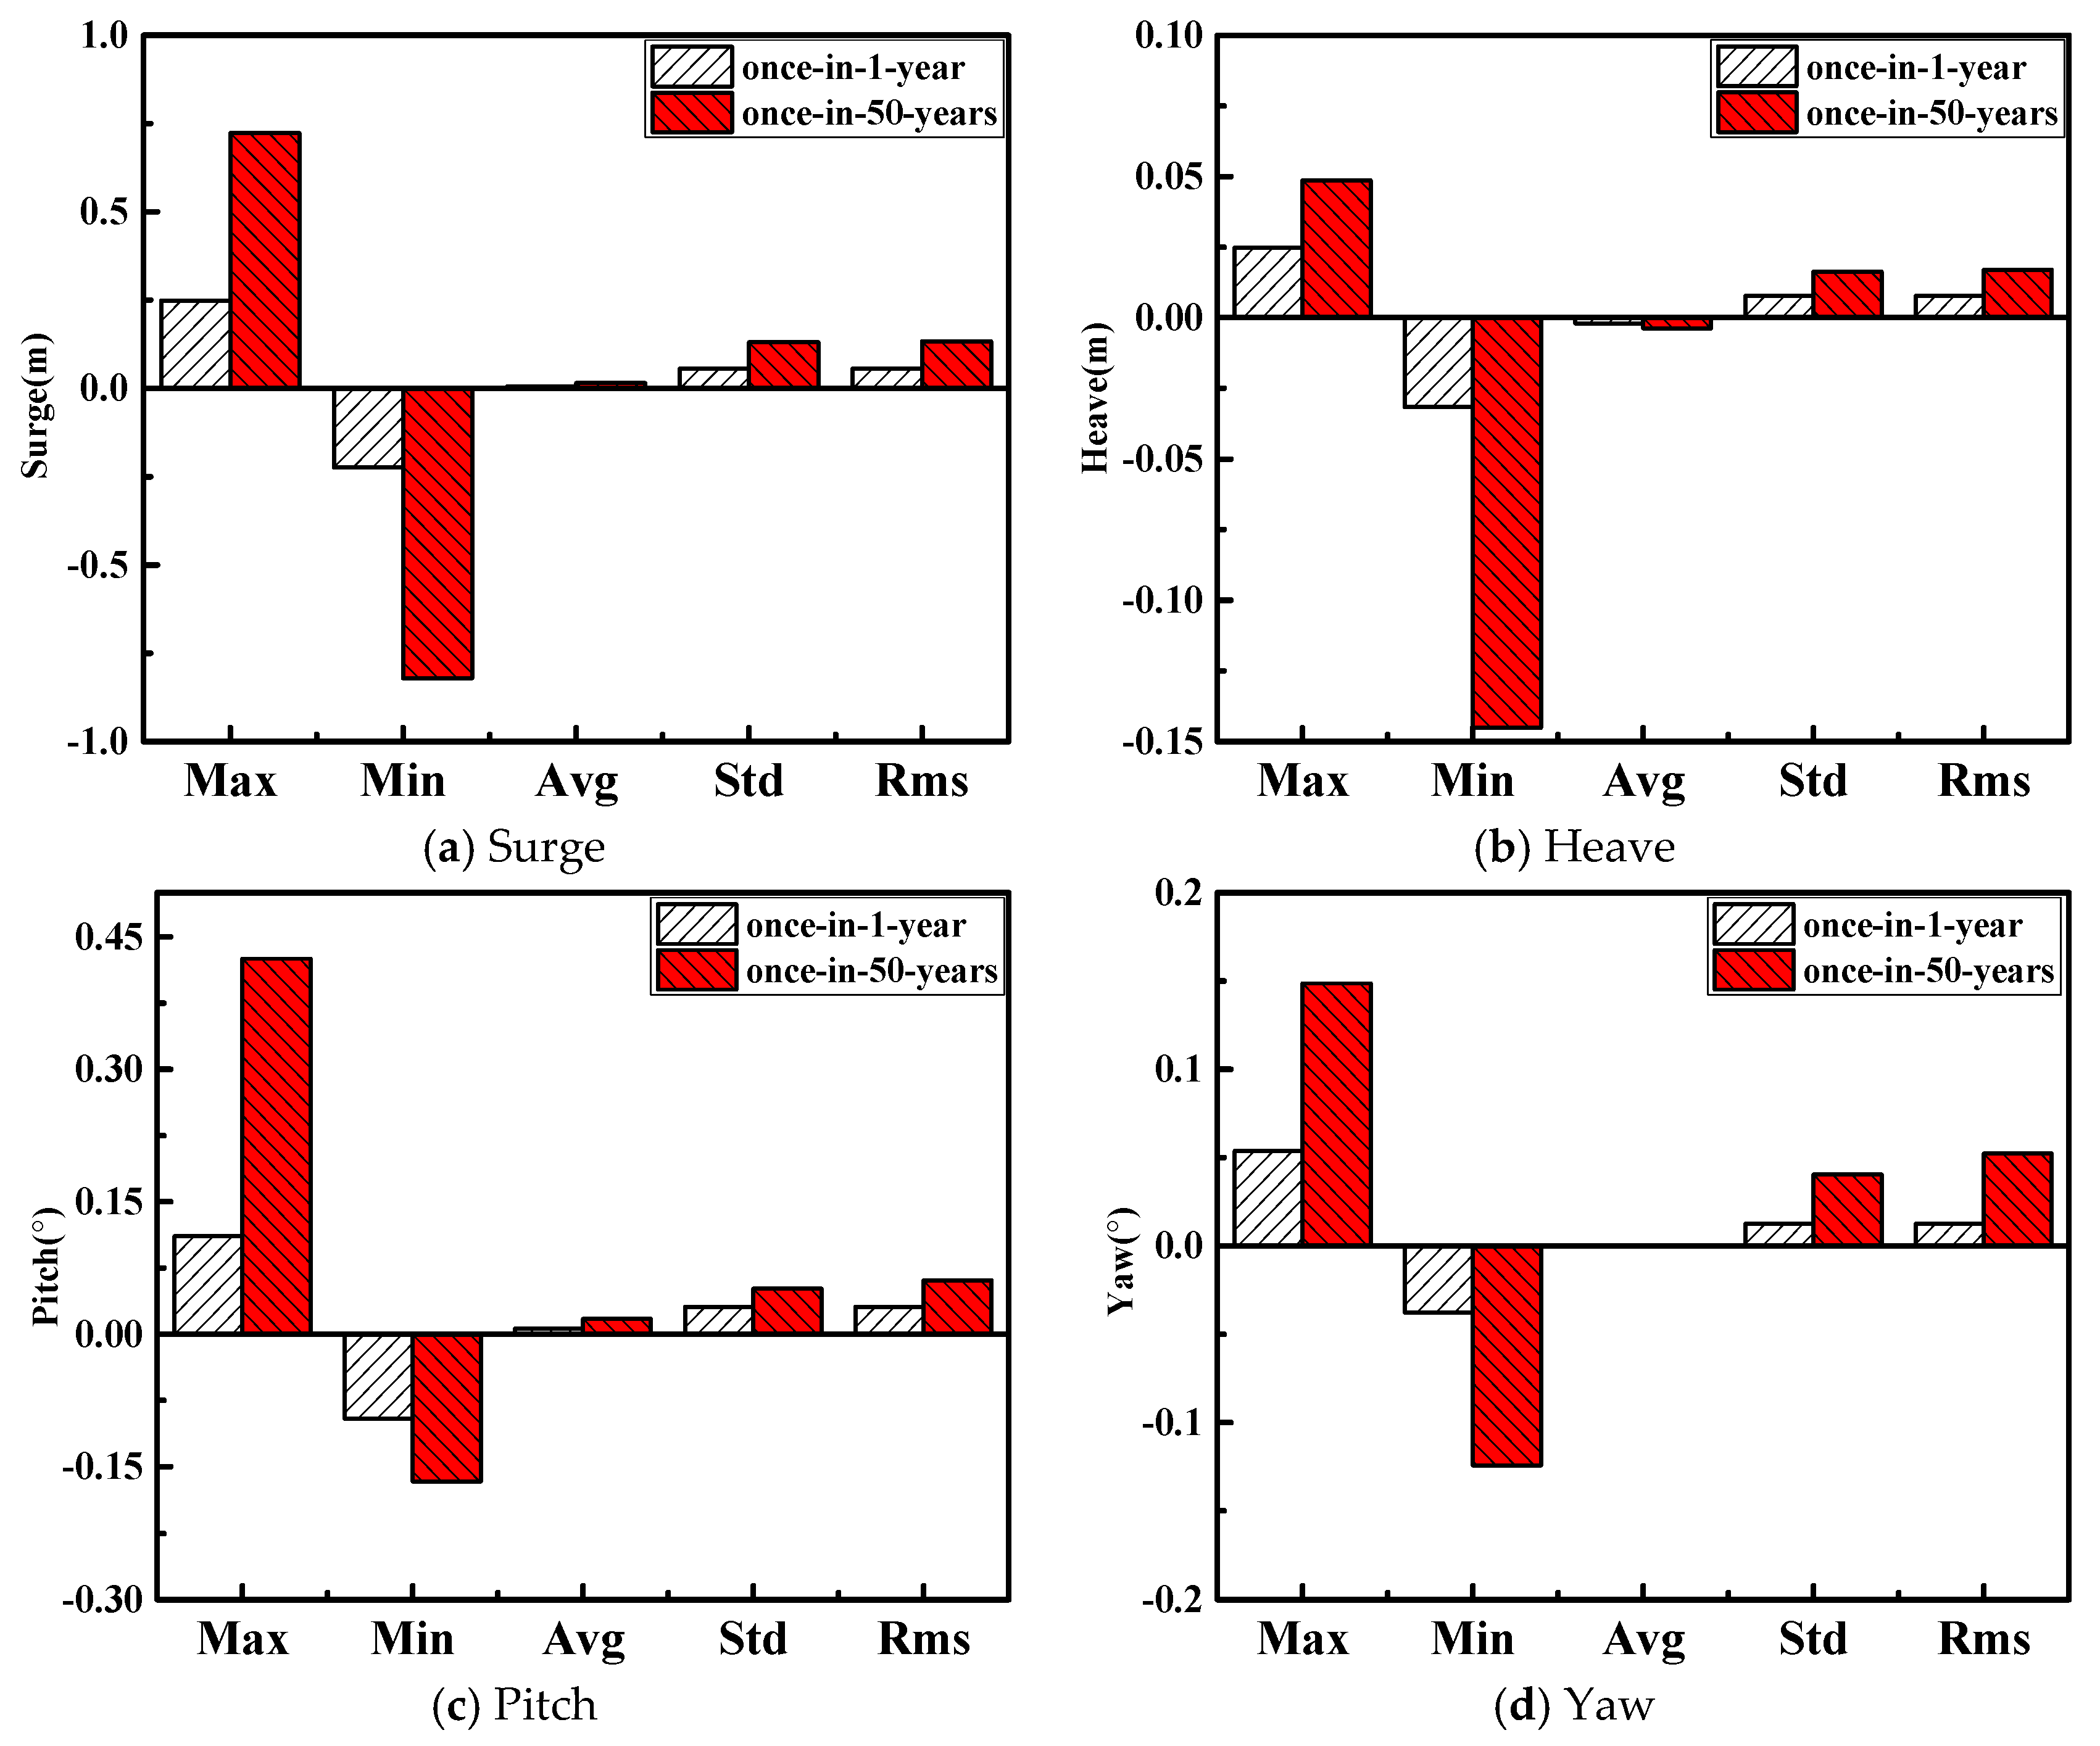
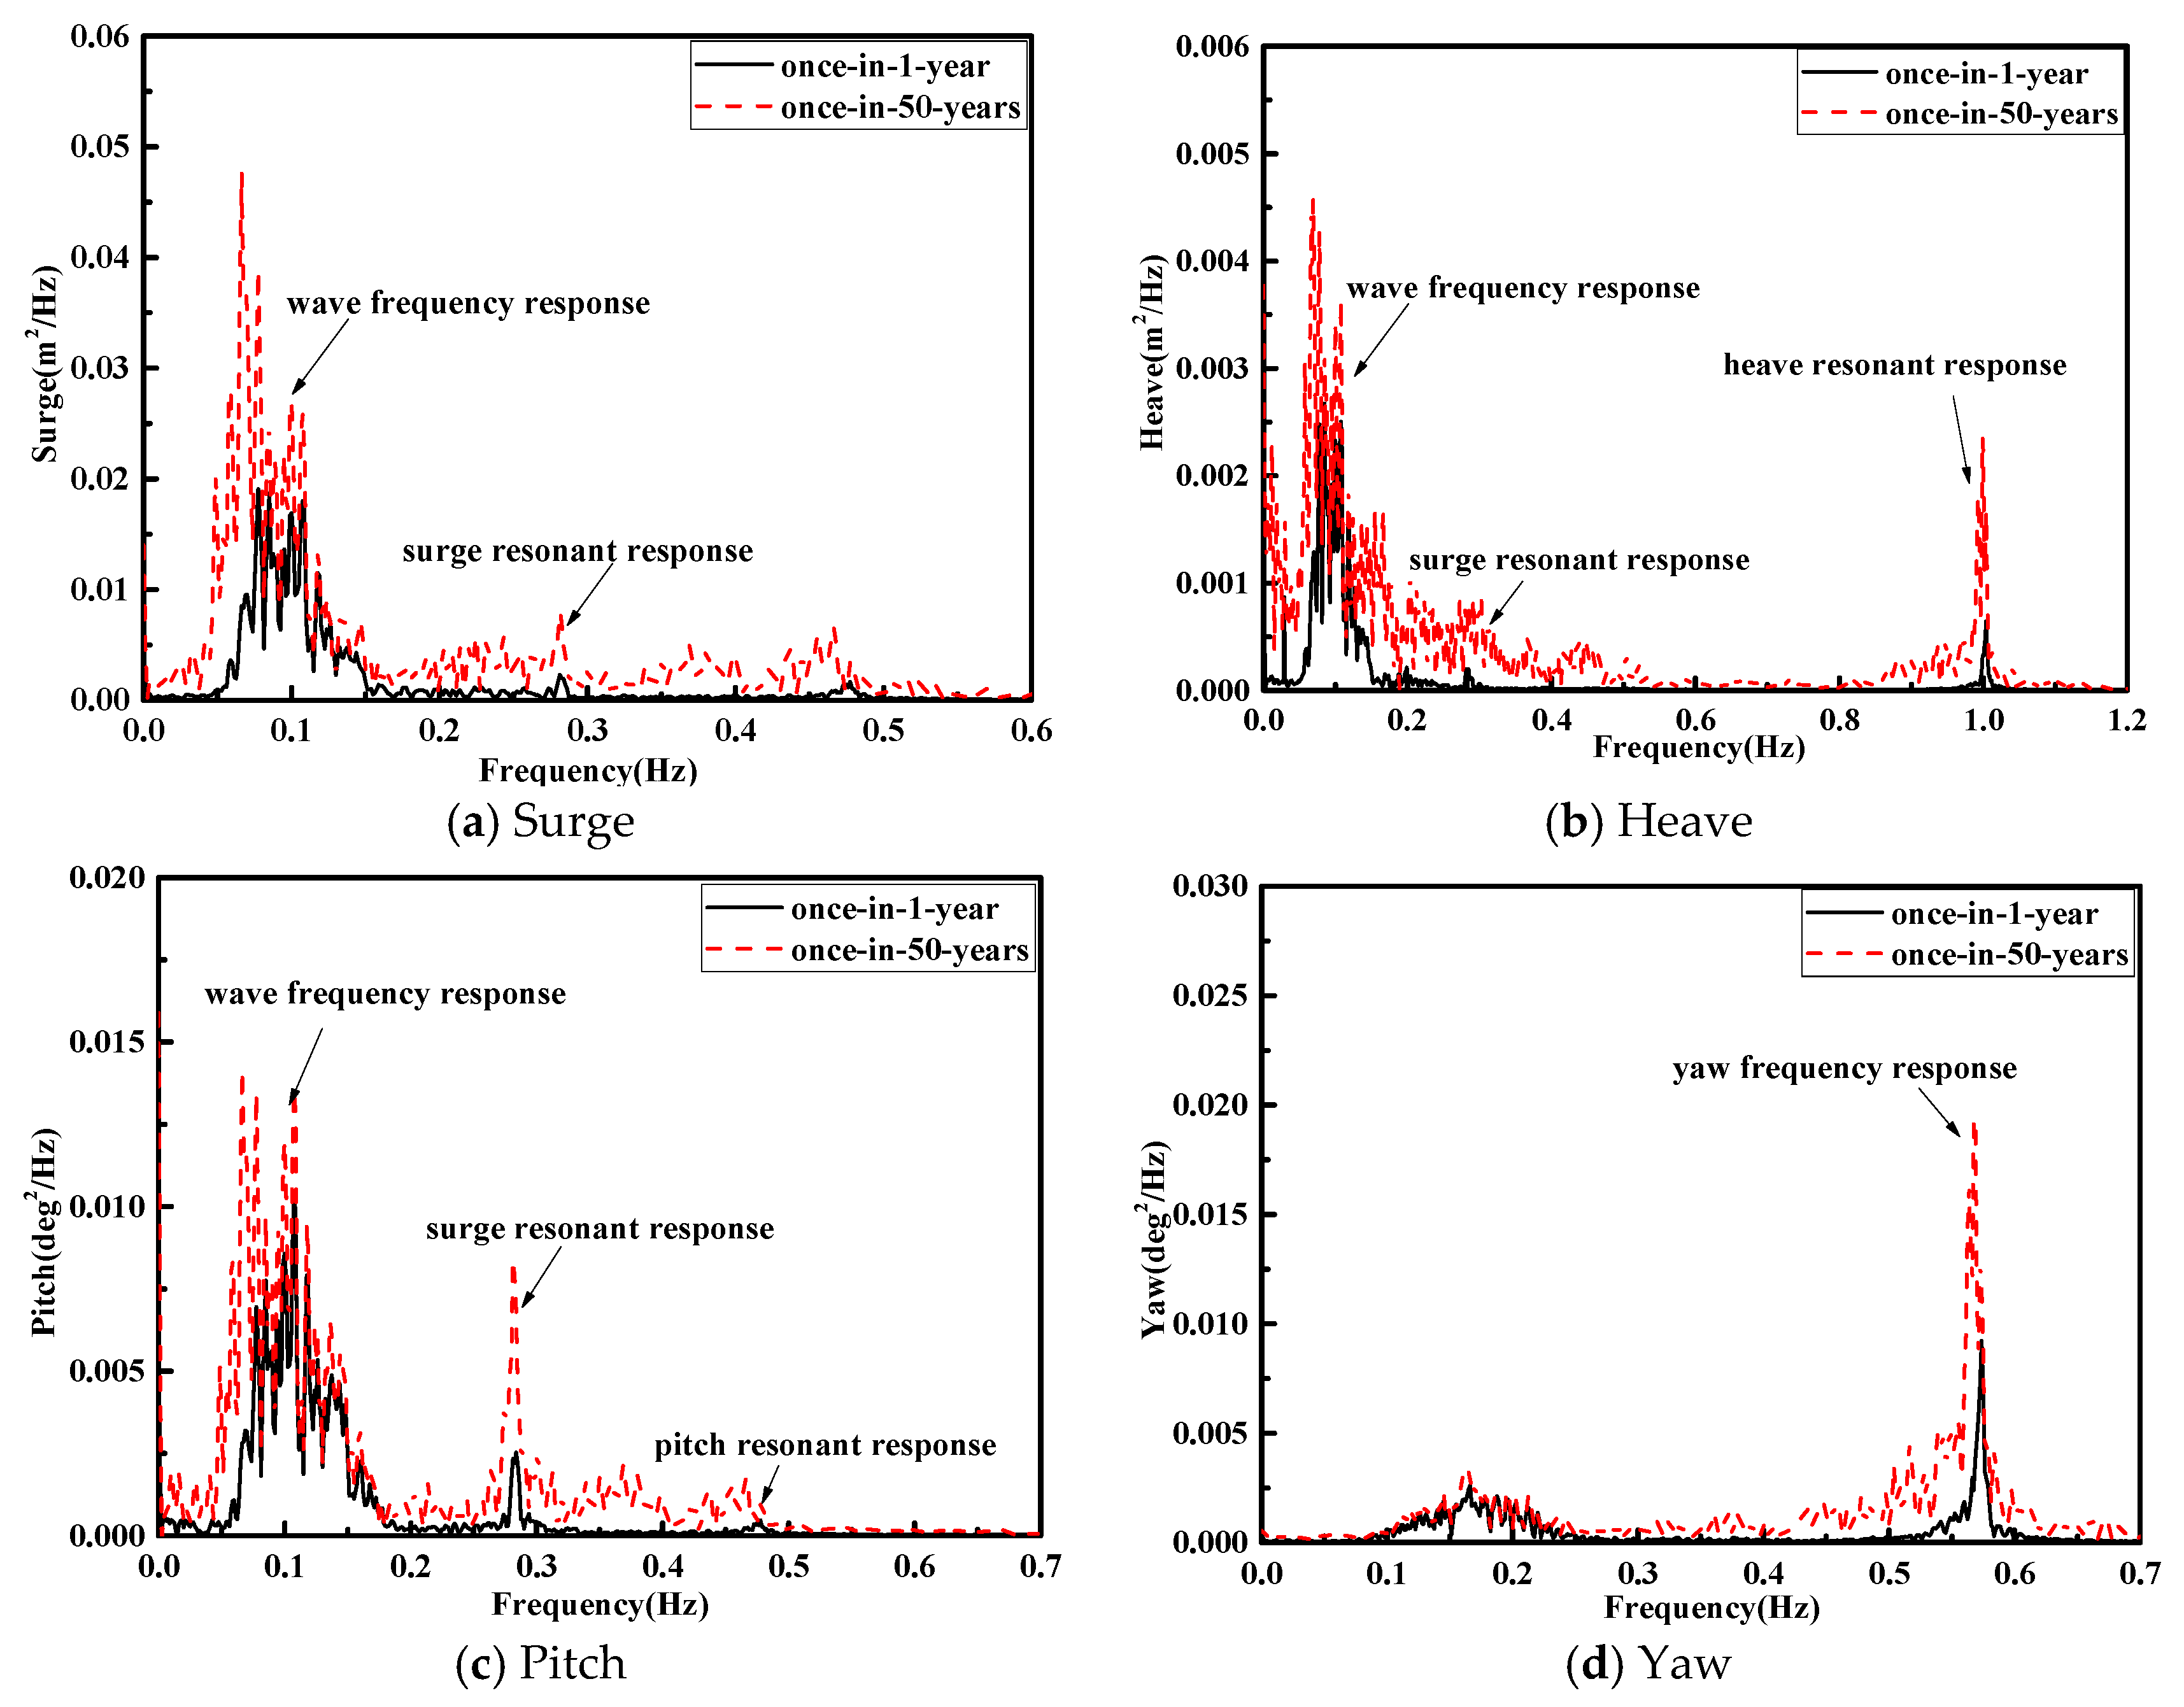
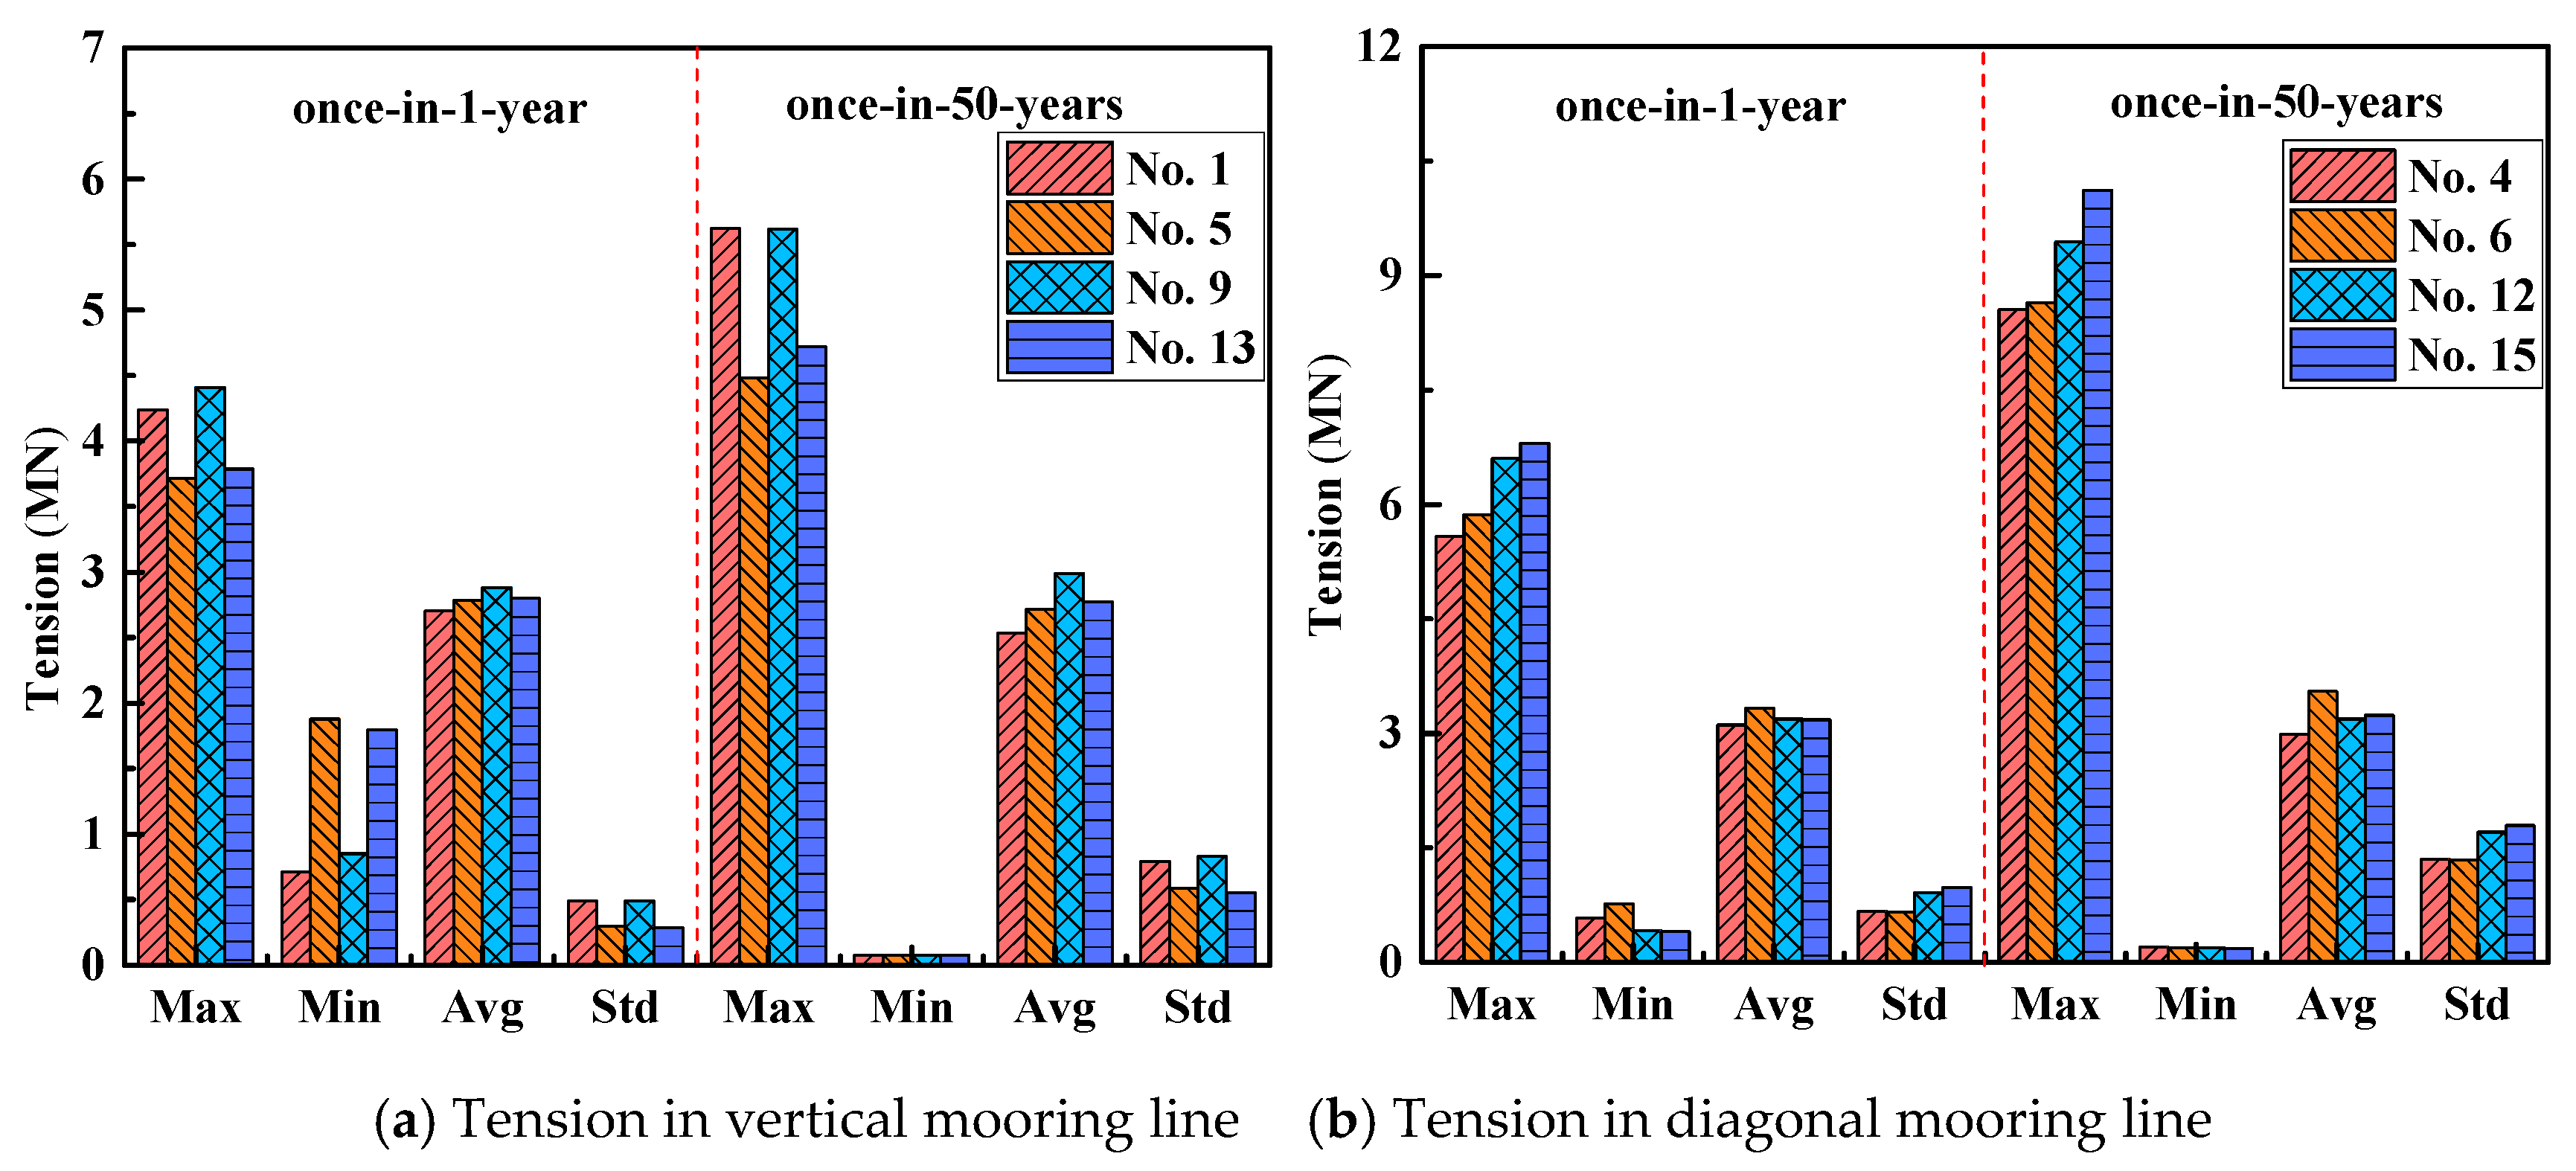
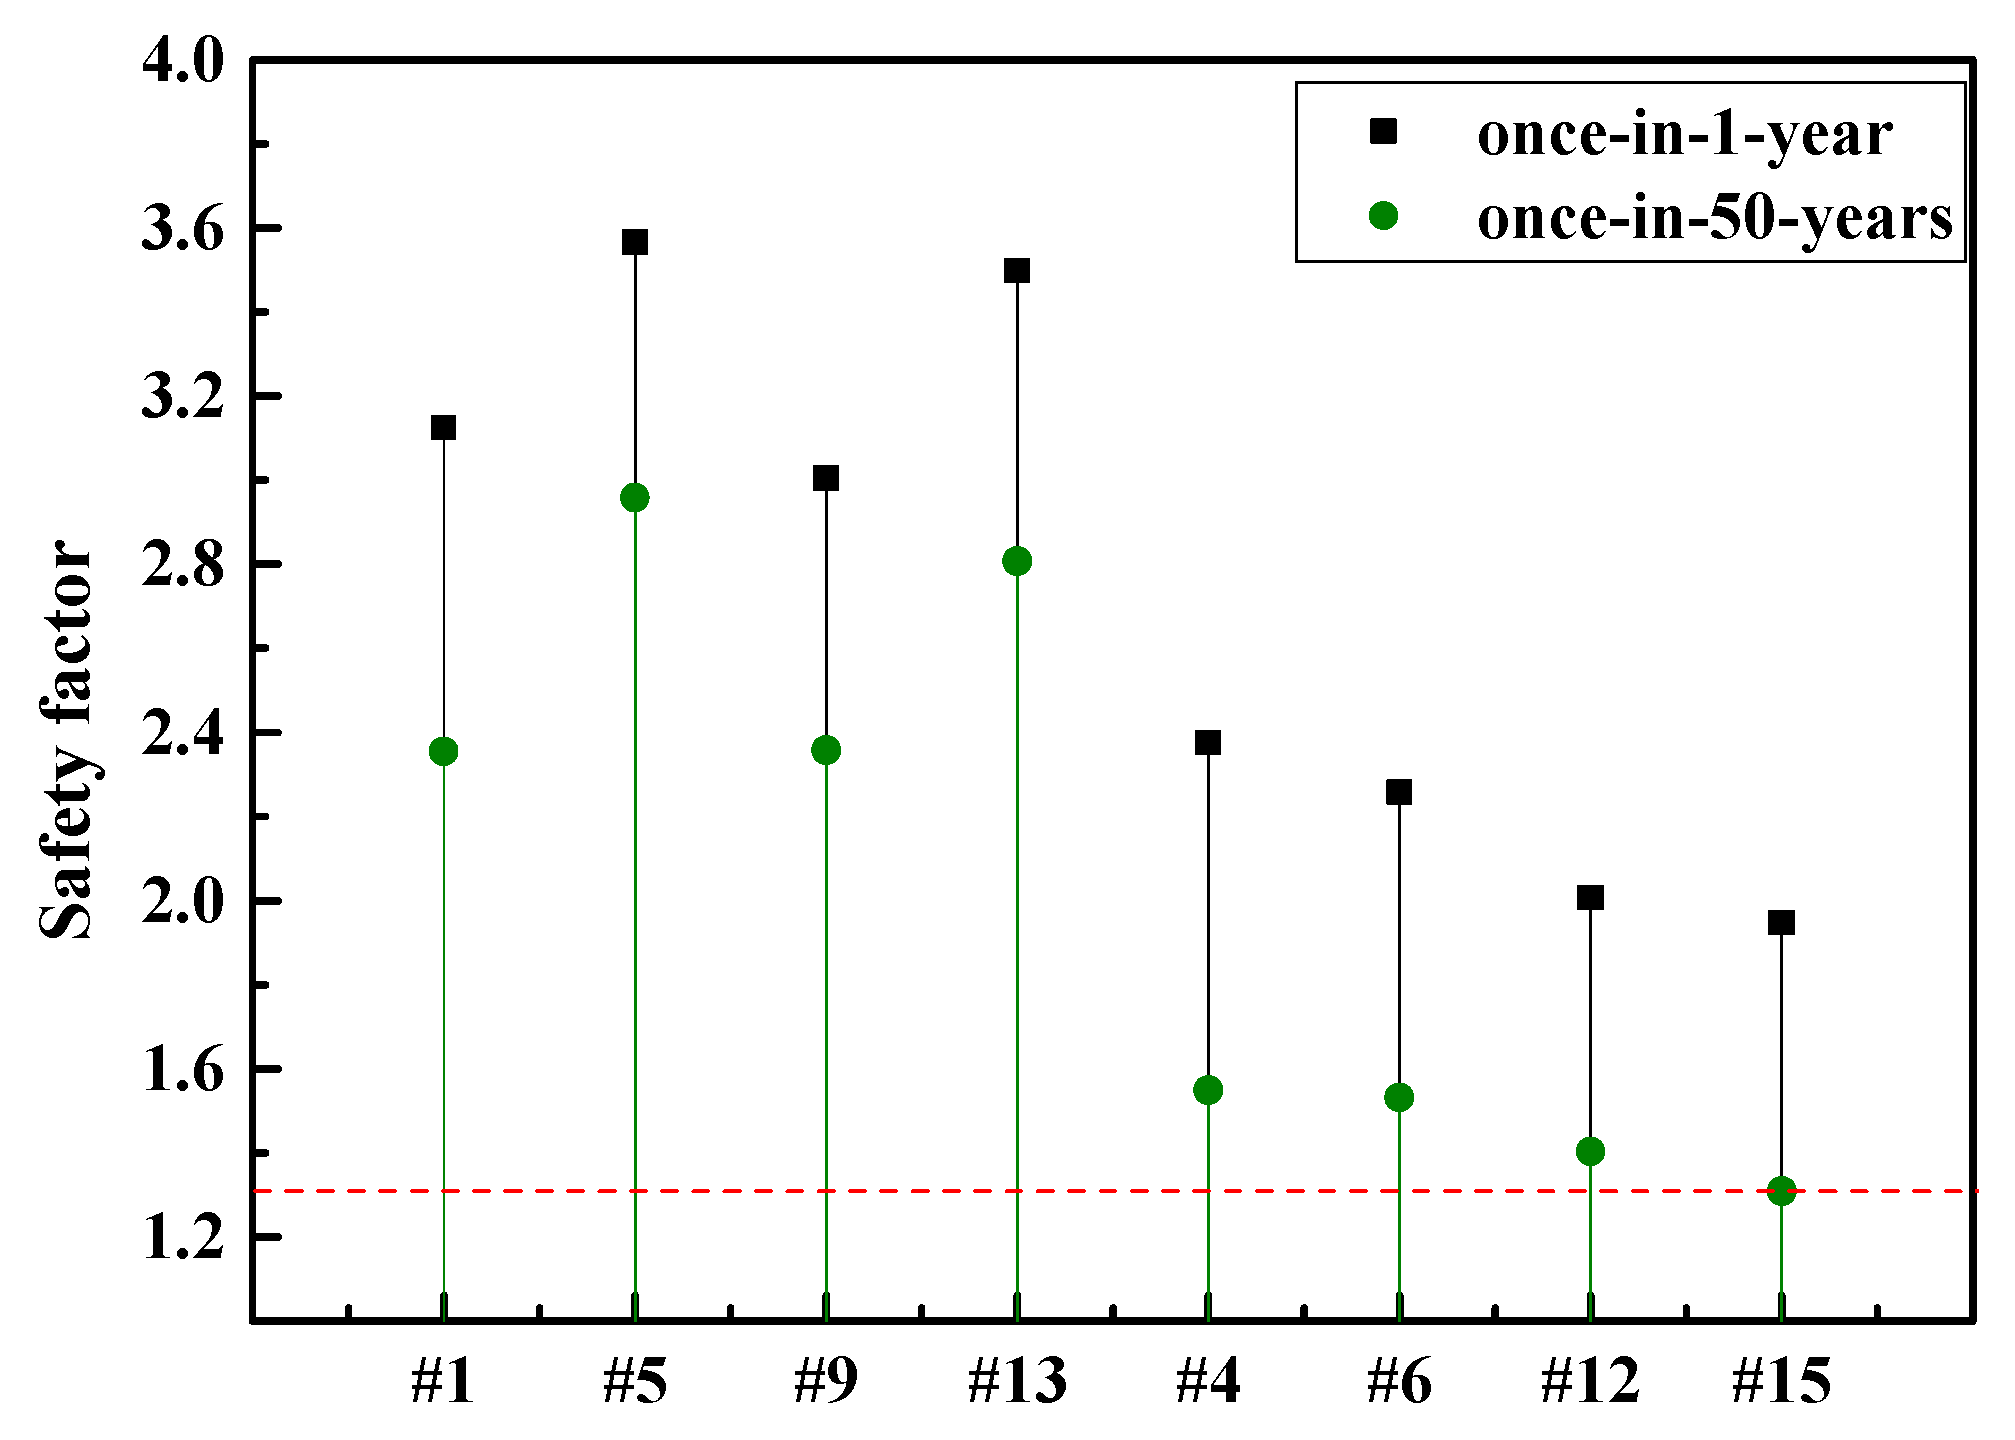
4. Dynamic Response of SFOWT under Extreme Sea-States

The SFOWT under Configuration 4 (i.e., four vertical lines and 12 diagonal lines with an inclination angle of 30°), as shown in Figure 10, were further studied in once-in-one-year and 50-years sea conditions of the East China Sea areas (see Table 7). Under extreme sea-states, the wind speed exceeded its cut-out value, and the wind turbine was under the condition of shutdown. The time histories of wind speed and wave elevation in the X-direction are shown in Figure 11 and Figure 12, respectively; the power spectra of the wind speed and wave elevation are shown in Figure 13 and Figure 14, respectively. We can see that the energy of the wind was mainly concentrated below 0.05 Hz, while the wave spectrum was mainly concentrated around 0.1 Hz.
The time series of platform surge motion and tension in the No. 1 mooring line under extreme sea-states are shown in Figure 15 and Figure 16, respectively. It can be seen that the surge response suddenly increased around 300–340 s in the once-in-50-years sea condition, and the tension in the mooring line also quickly increased and then fell. This is because the wave elevation increased suddenly around 300–340 s (Figure 12), which led to a decrease of the restoring force on the platform and an increase of the motion response, and eventually caused a slack in mooring lines and instability of SFOWT in the once-in-50-years sea condition.
The increase in the pretension in the mooring line can effectively avoid the slack in mooring lines and improve the movement performance of SFOWT. The vertical pretension was increased from 1800–2780 kN per mooring line by adjusting the ballast water of the platform. The corresponding motion statistics and power spectra of platform motion under extreme sea-states are shown in Figure 17 and Figure 18, respectively. The platform had a small surge motion and a better heave performance due to the growing pretension under extreme sea-states. The yaw of SFOWT was small in the two sea conditions. In comparison to the once-in-one-year sea condition, the maximum value and standard deviation of yaw under the once-in-50-years sea condition increased by 176.8% and 319.8%, respectively.
As the wind loads are much smaller than wave loads in extreme sea-states because the turbine is parked, the spectra of motions were mainly dominated by the wave frequency response and resonant response. From Figure 18, it can be found that the surge motion was mainly dominated by the wave-frequency response; the heave motion was mainly induced by the wave-frequency response and set-down effect; and the pitch motion was mainly induced by wave-frequency and surge resonant response. The natural frequency on each DOF was higher than the wave frequency; the heave resonant response was the highest, i.e., 1.0 Hz.
The statistics of tension in vertical mooring lines (Nos. 1, 5, 9, and 13) and diagonal lines (Nos. 4, 6, 12, and 15) under once-in-one-year and 50-years sea conditions are shown in Figure 19. As shown in Figure 19, the No. 9 mooring line, which was located in the upwind direction of the SFOWT, had the largest average and standard deviation of tension among the vertical mooring lines, and the No. 15 mooring line, which was also located in the upwind direction of the SFOWT, had the largest maximum and standard deviation of tension among the diagonal mooring lines. In addition, the minimum tension in each line under extreme sea-states was larger than zero, indicating that they can provide enough stability.
Figure 20 shows the safety factor of mooring lines under extreme sea-states, indicating that the safety factor of each mooring line meets the design requirements in once-in-one-year and 50-years sea conditions. The safety factor of the No. 15 mooring line was the smallest, i.e., 1.31.

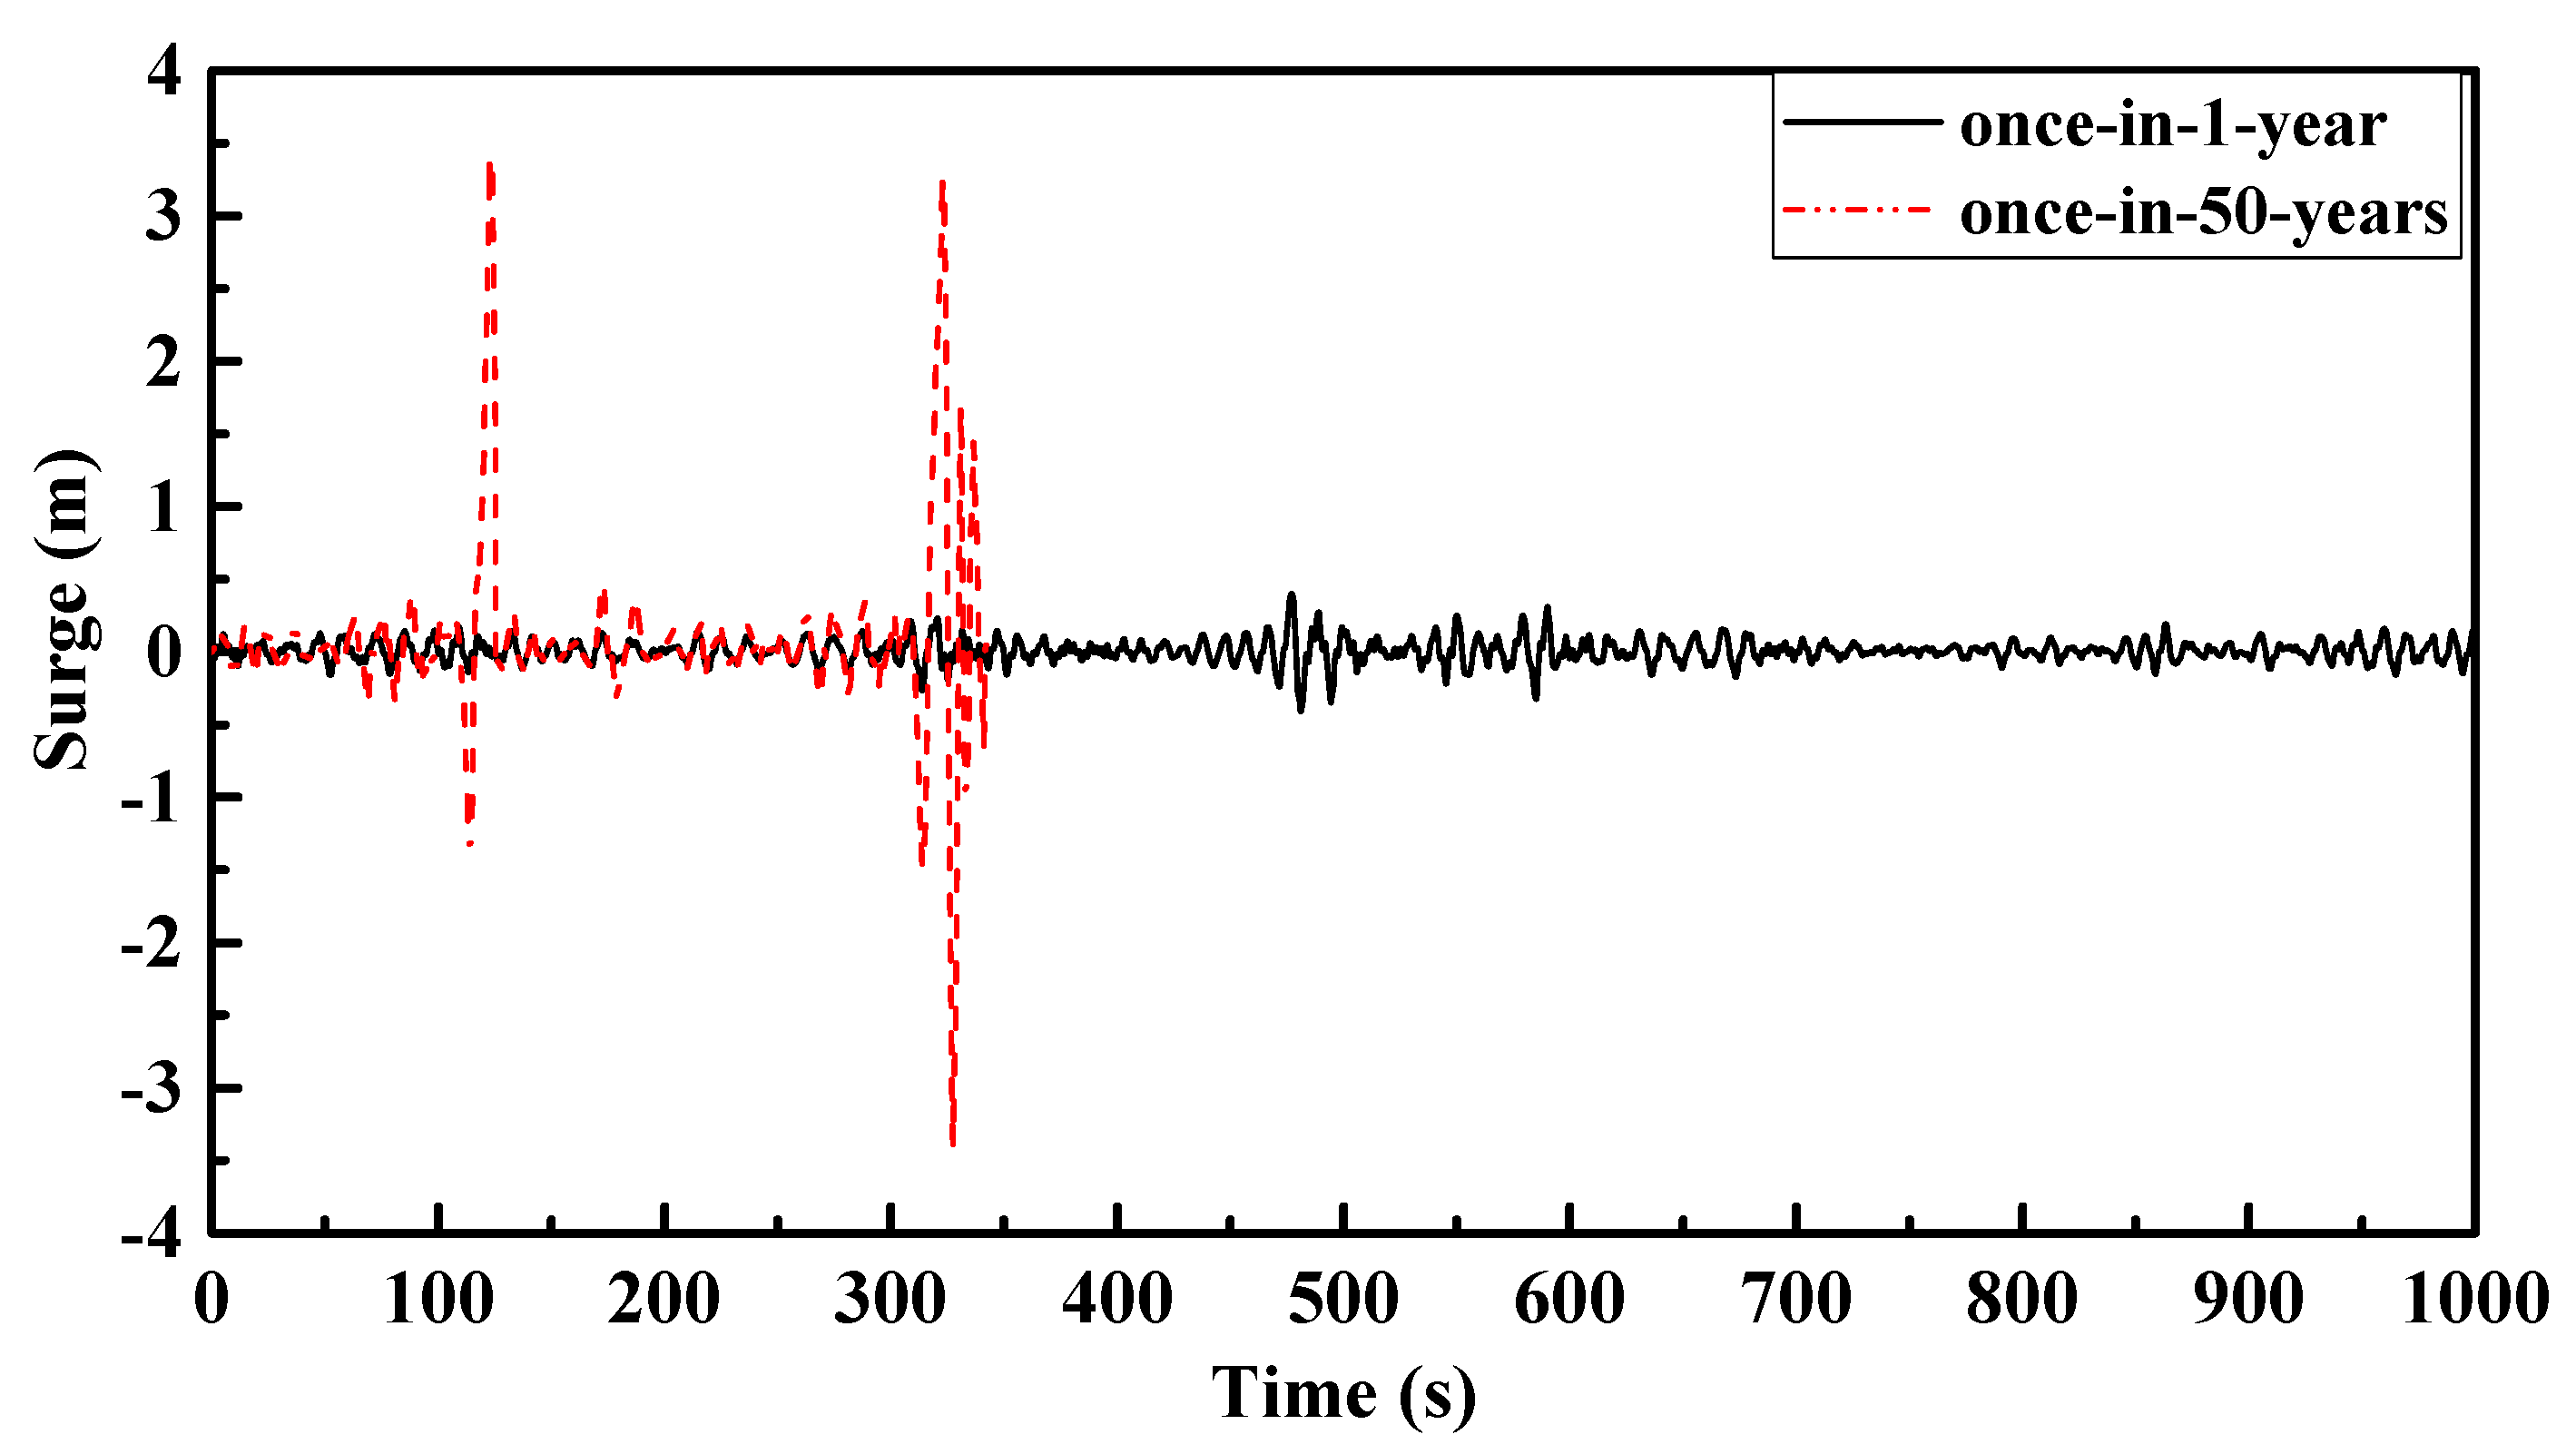
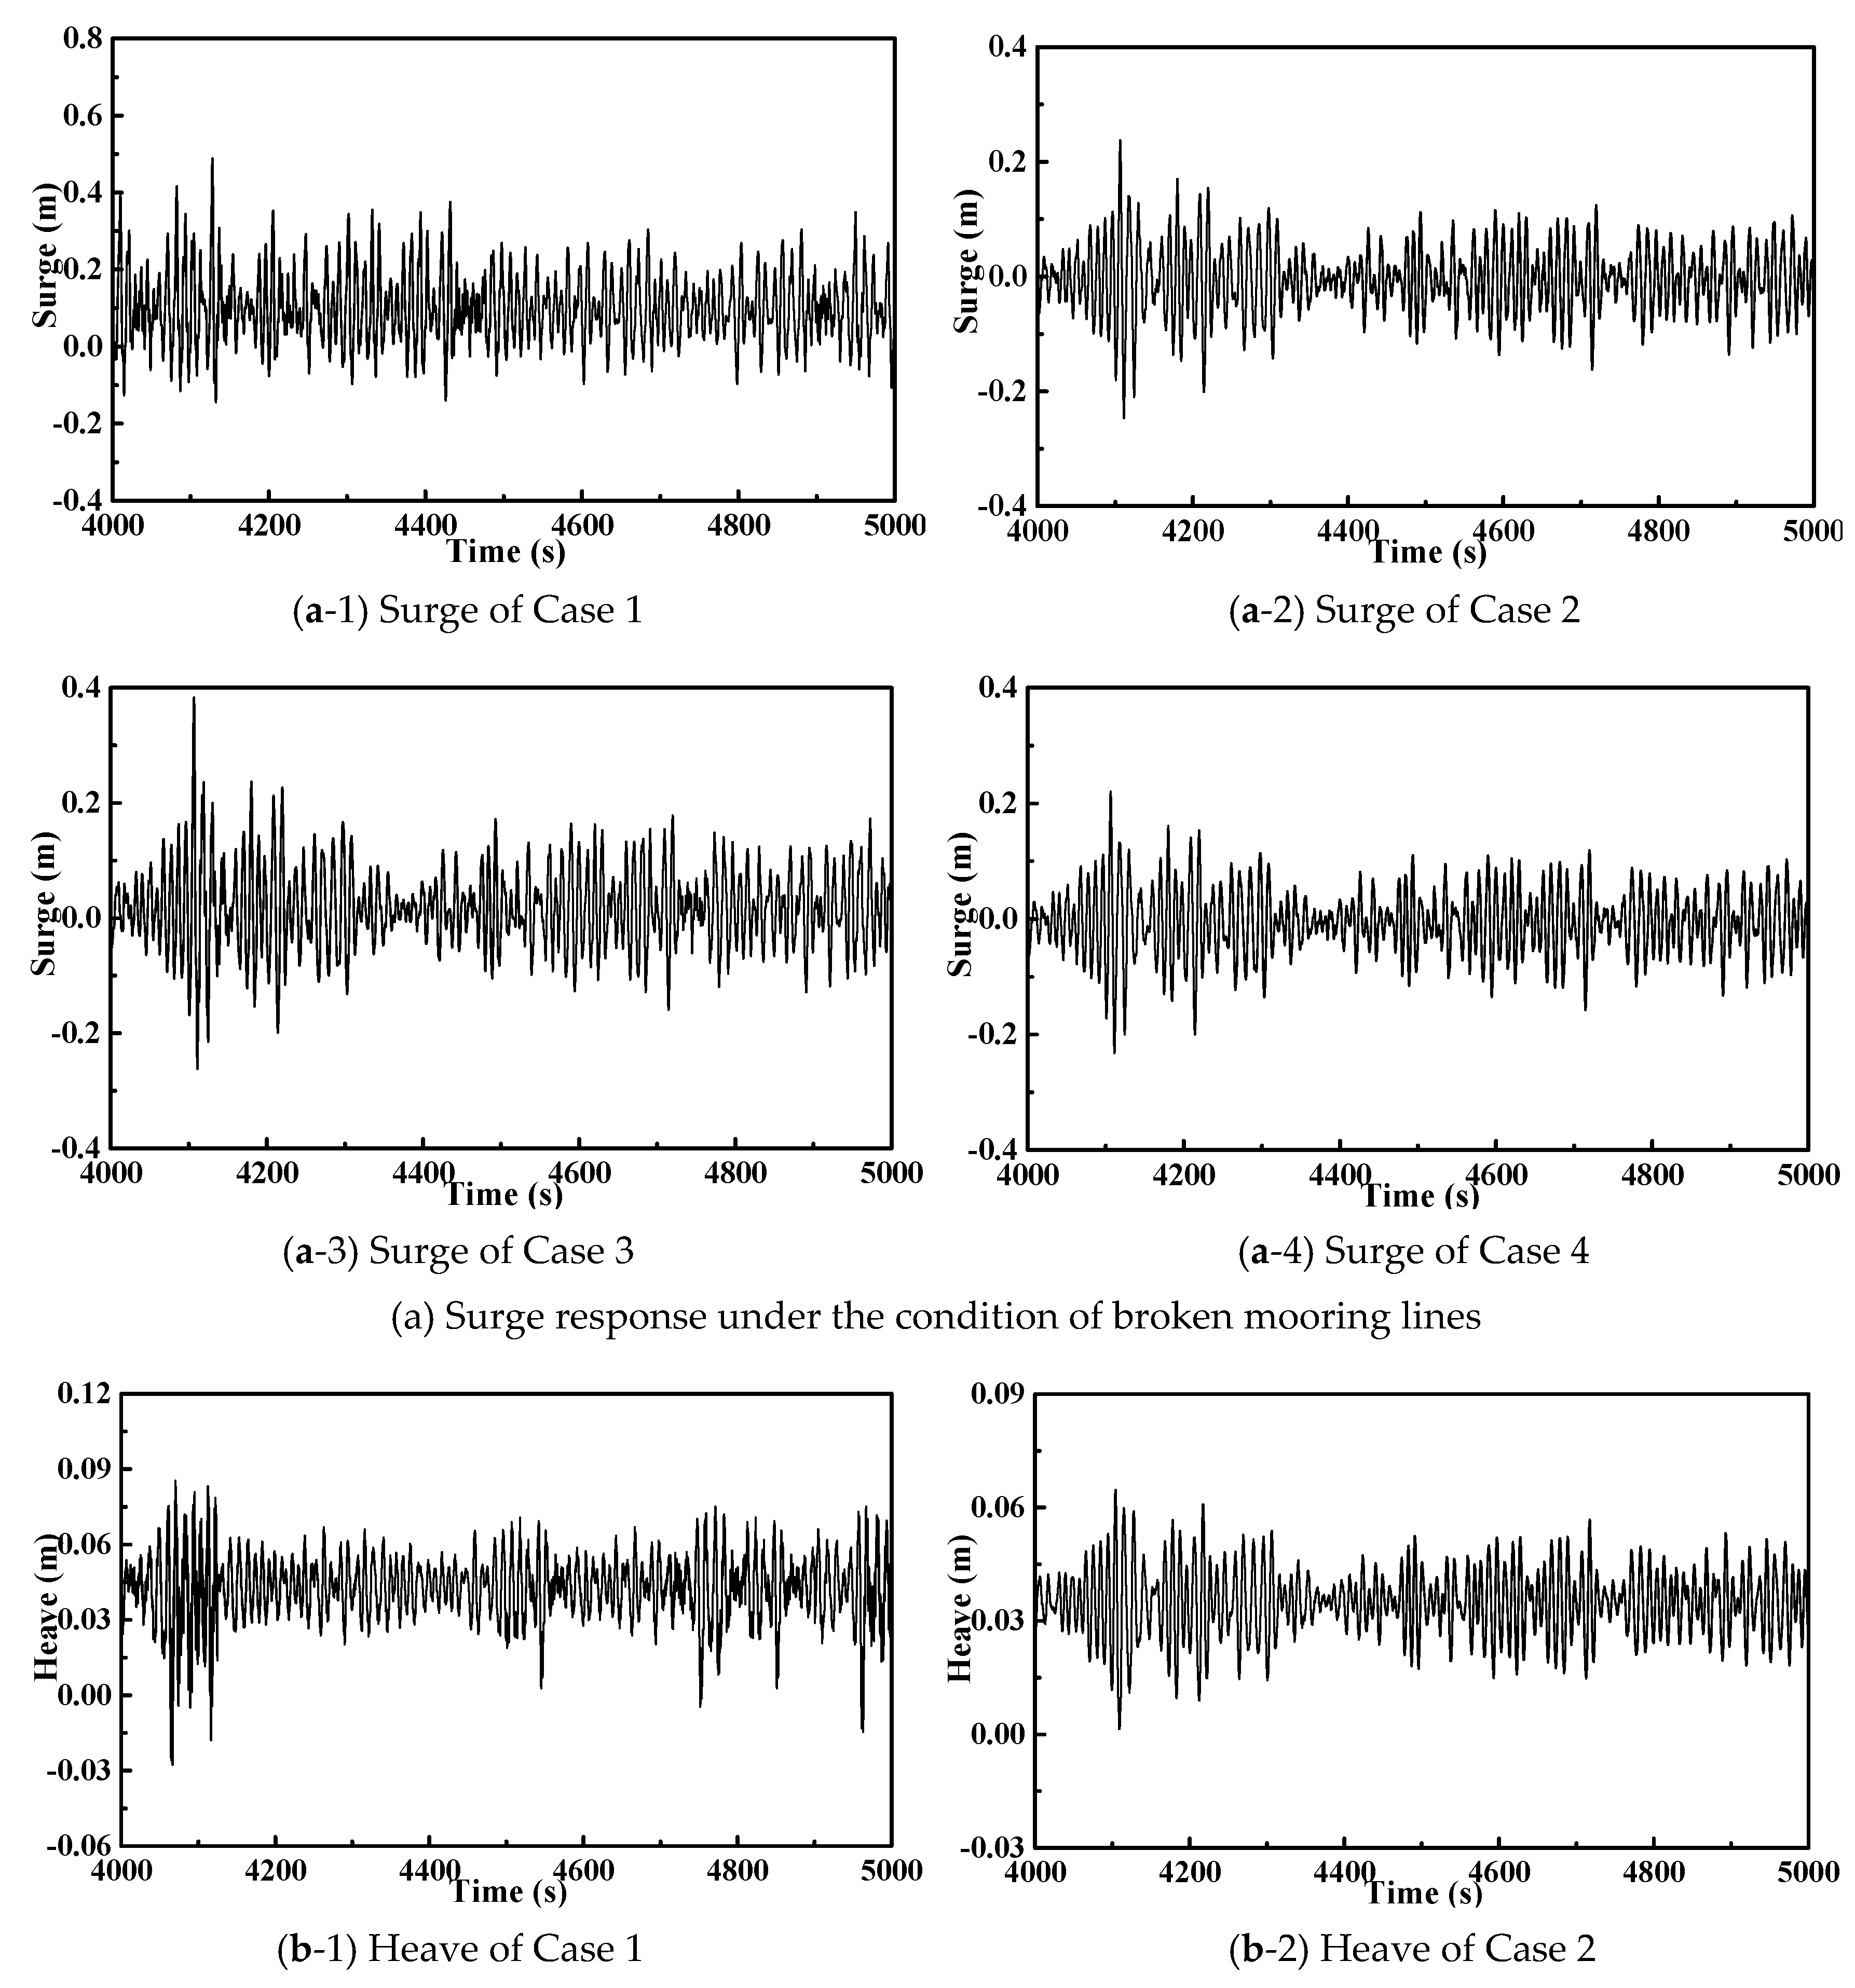
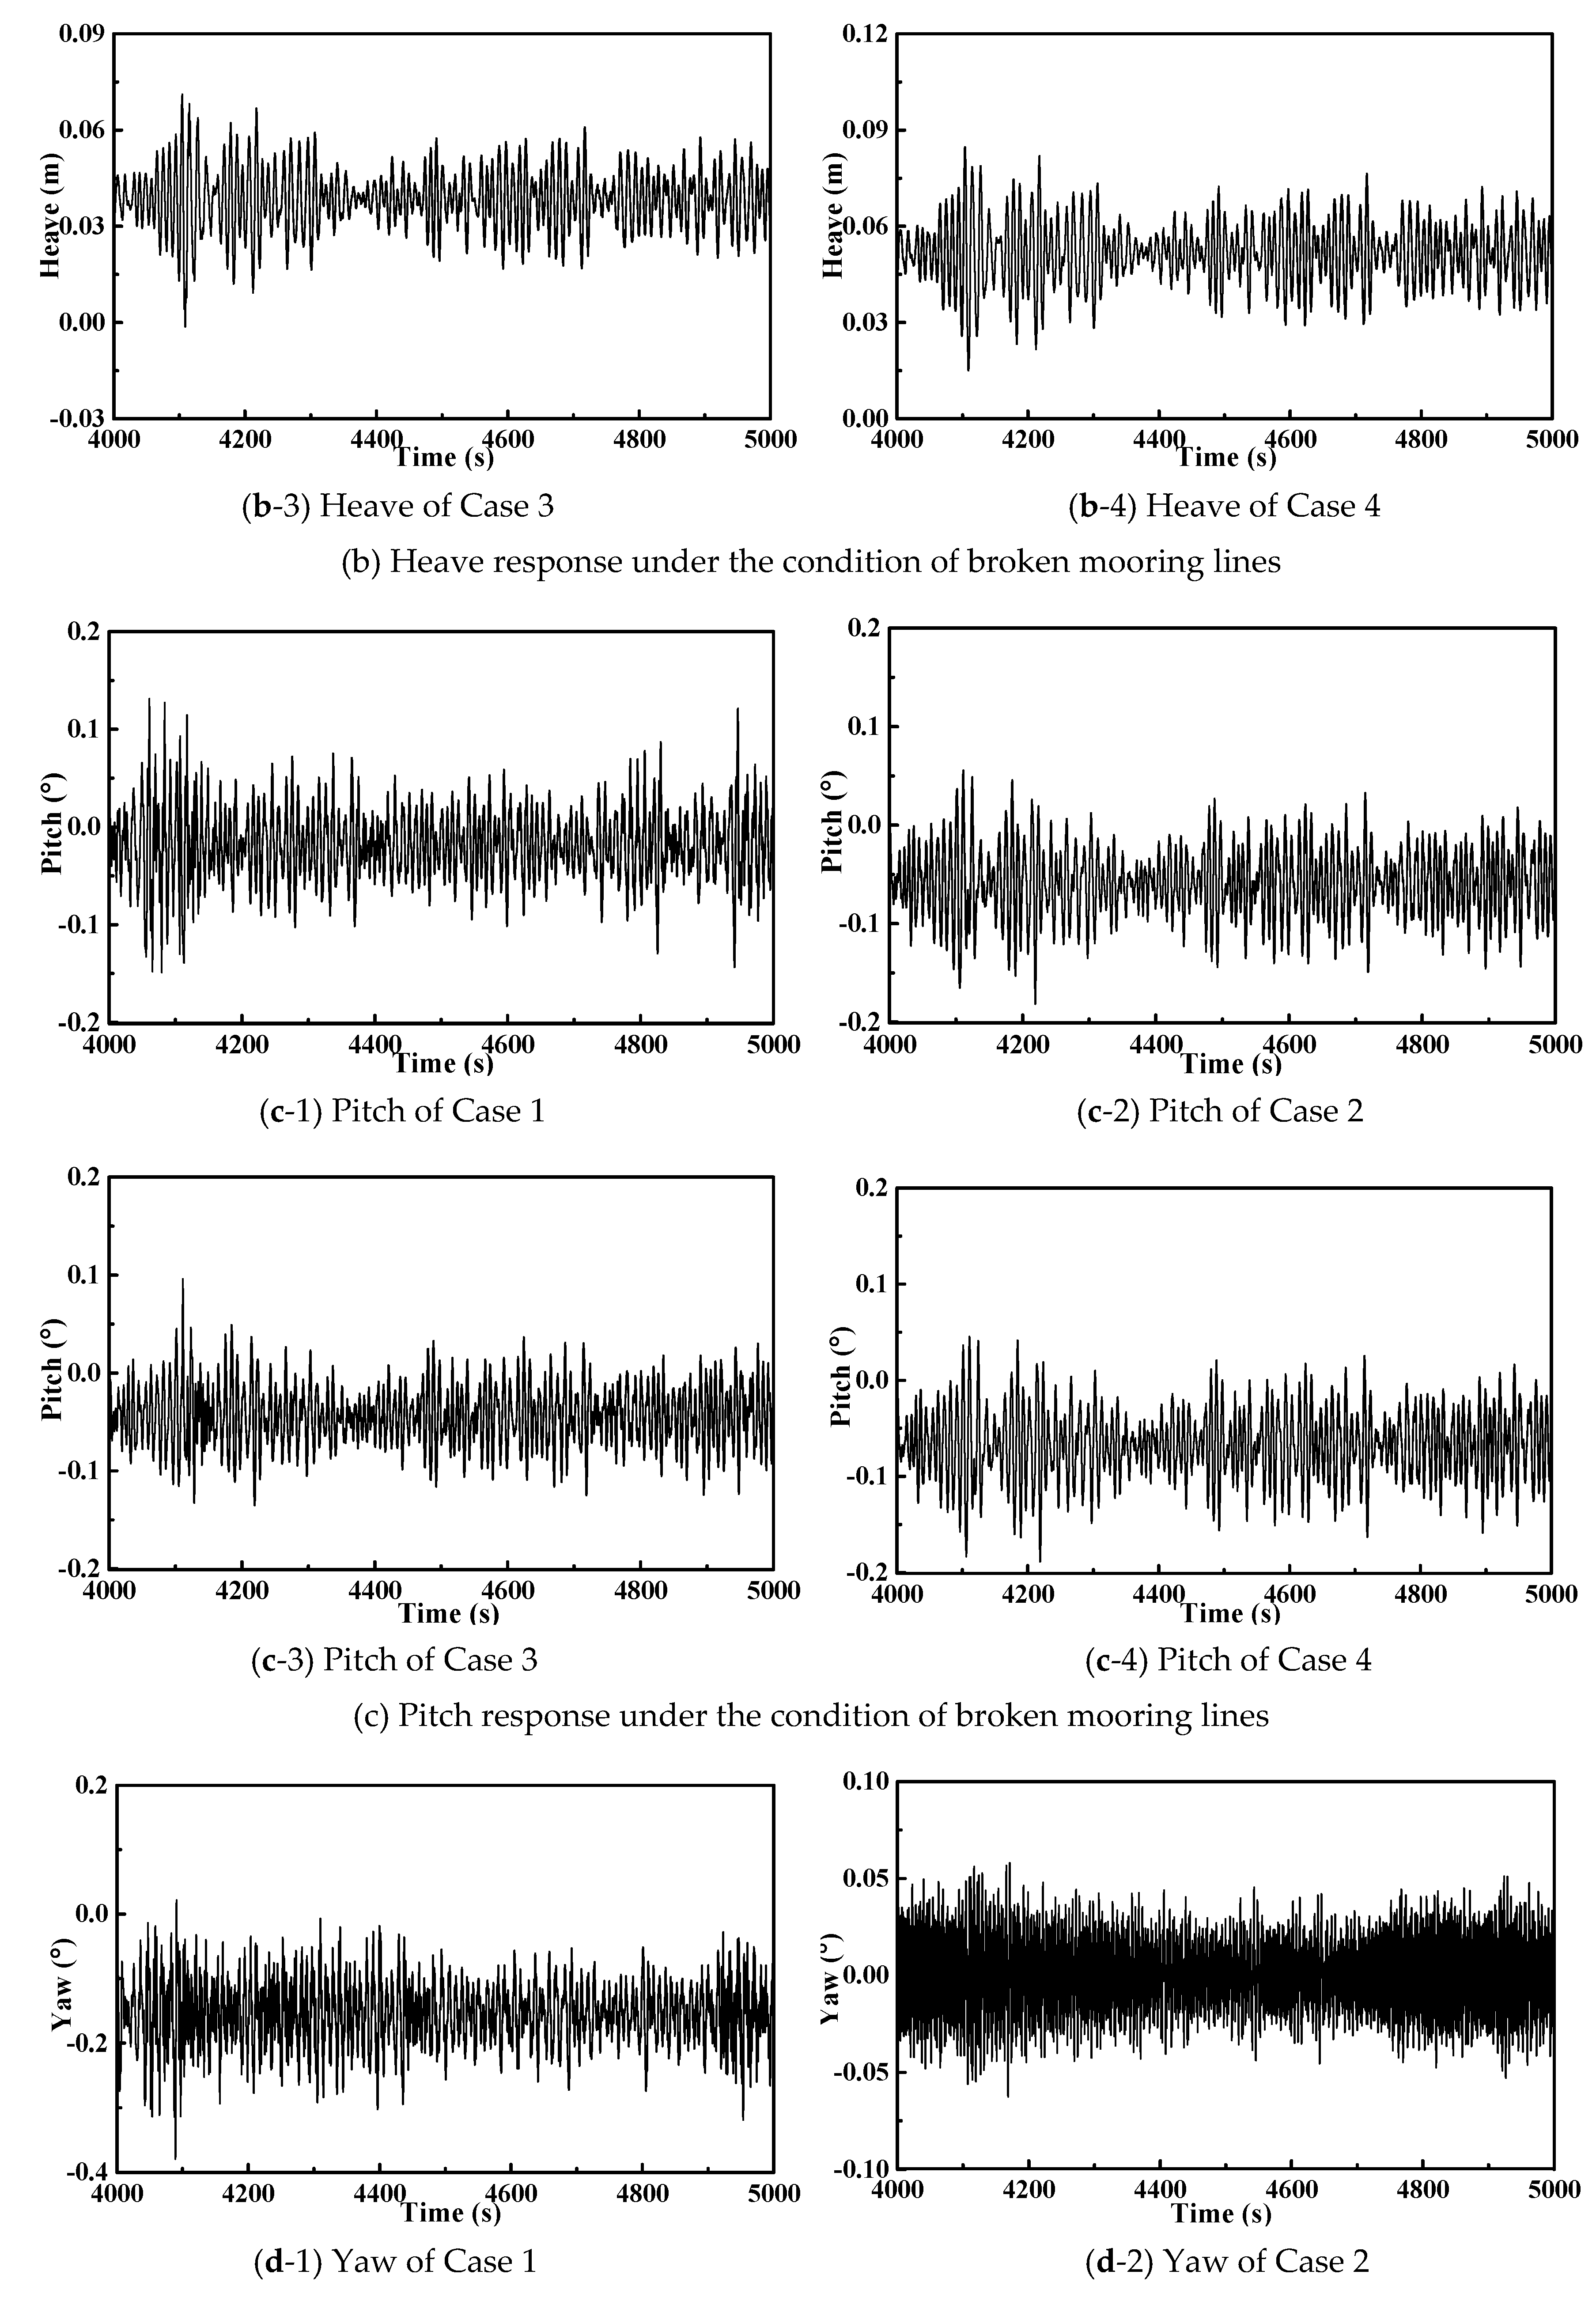
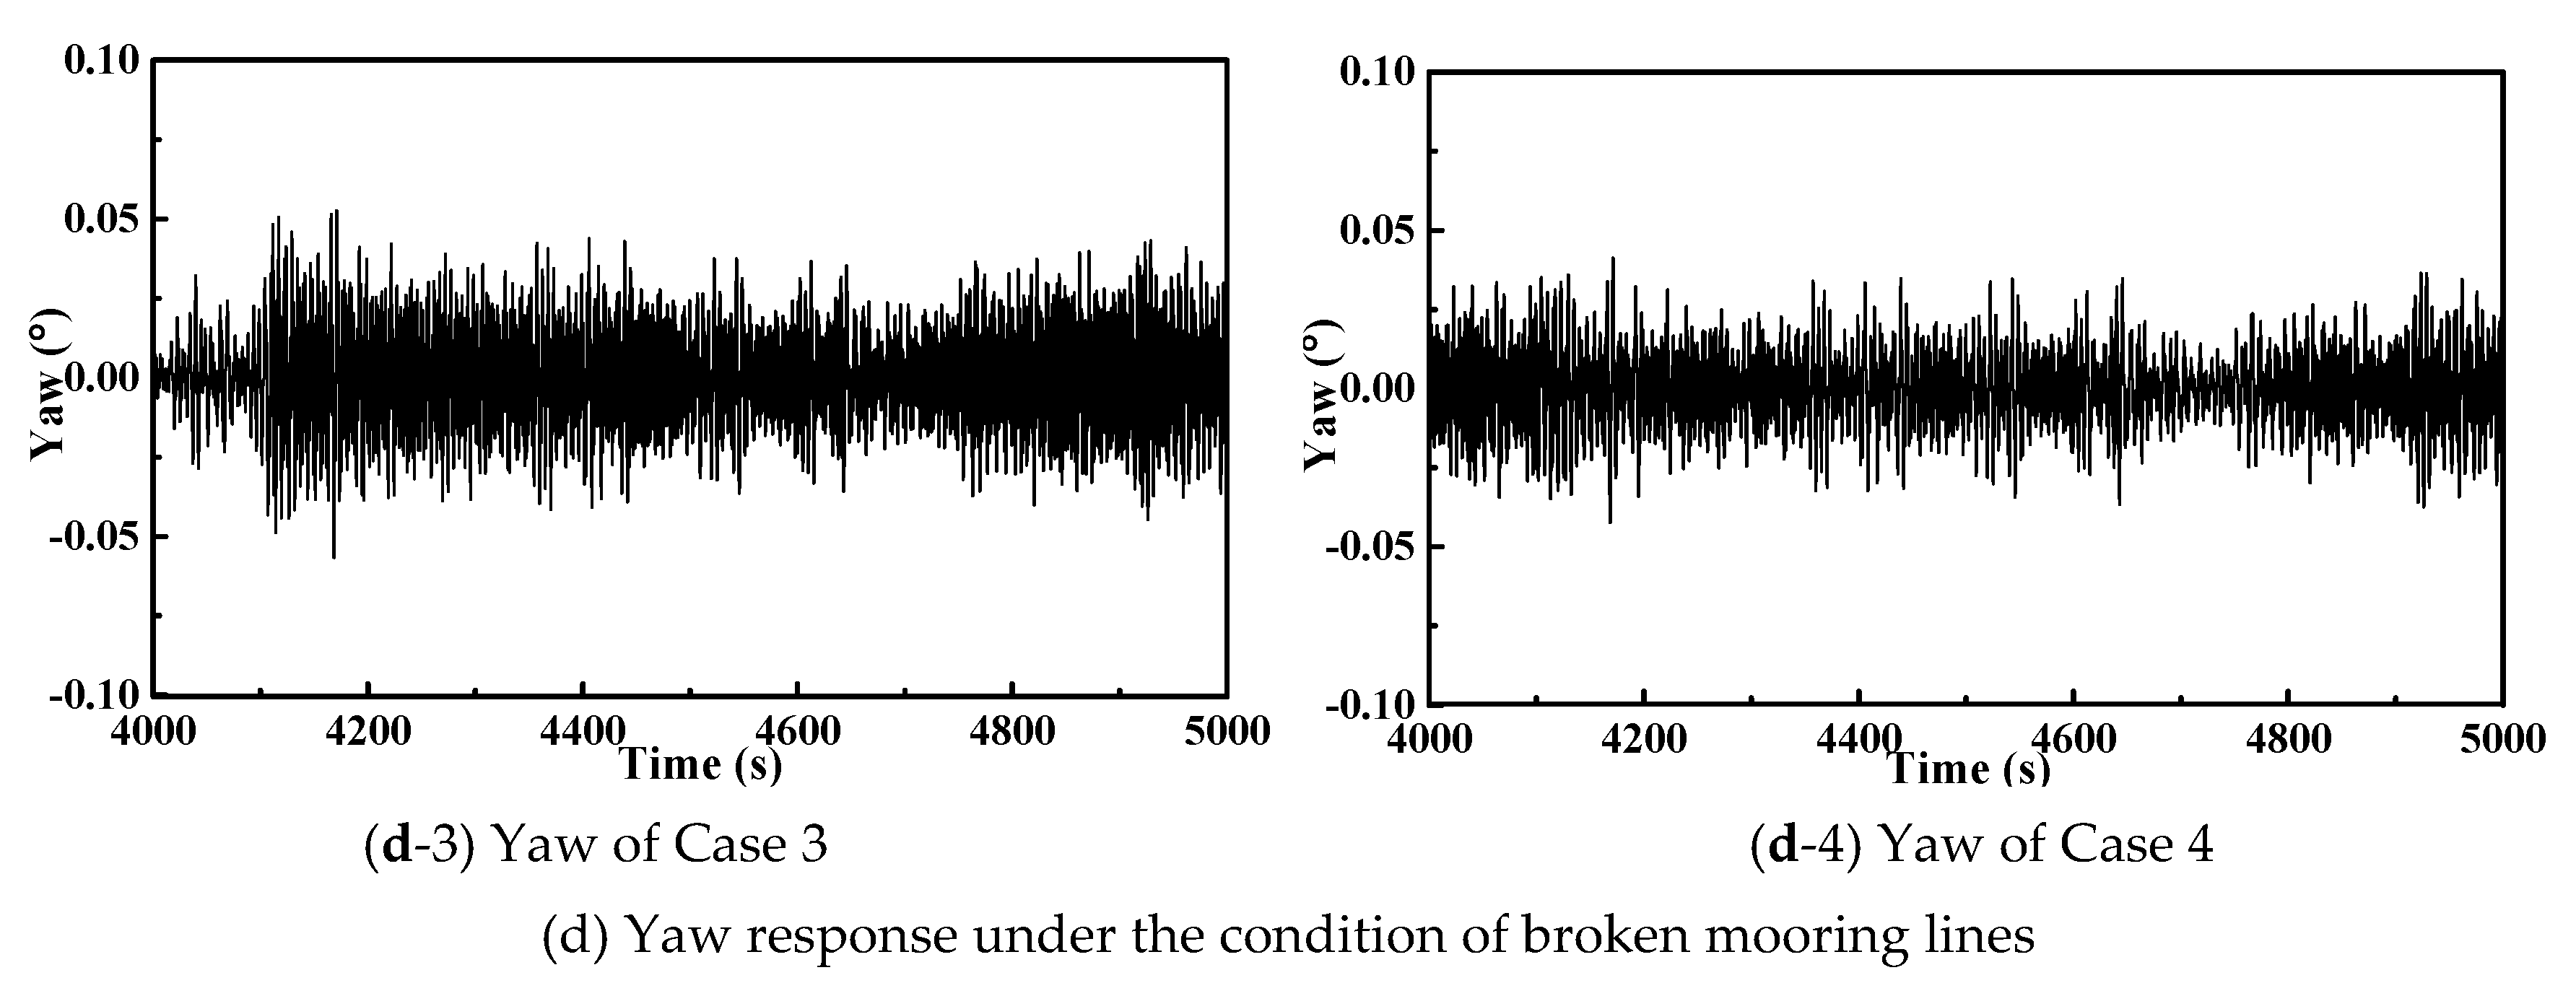
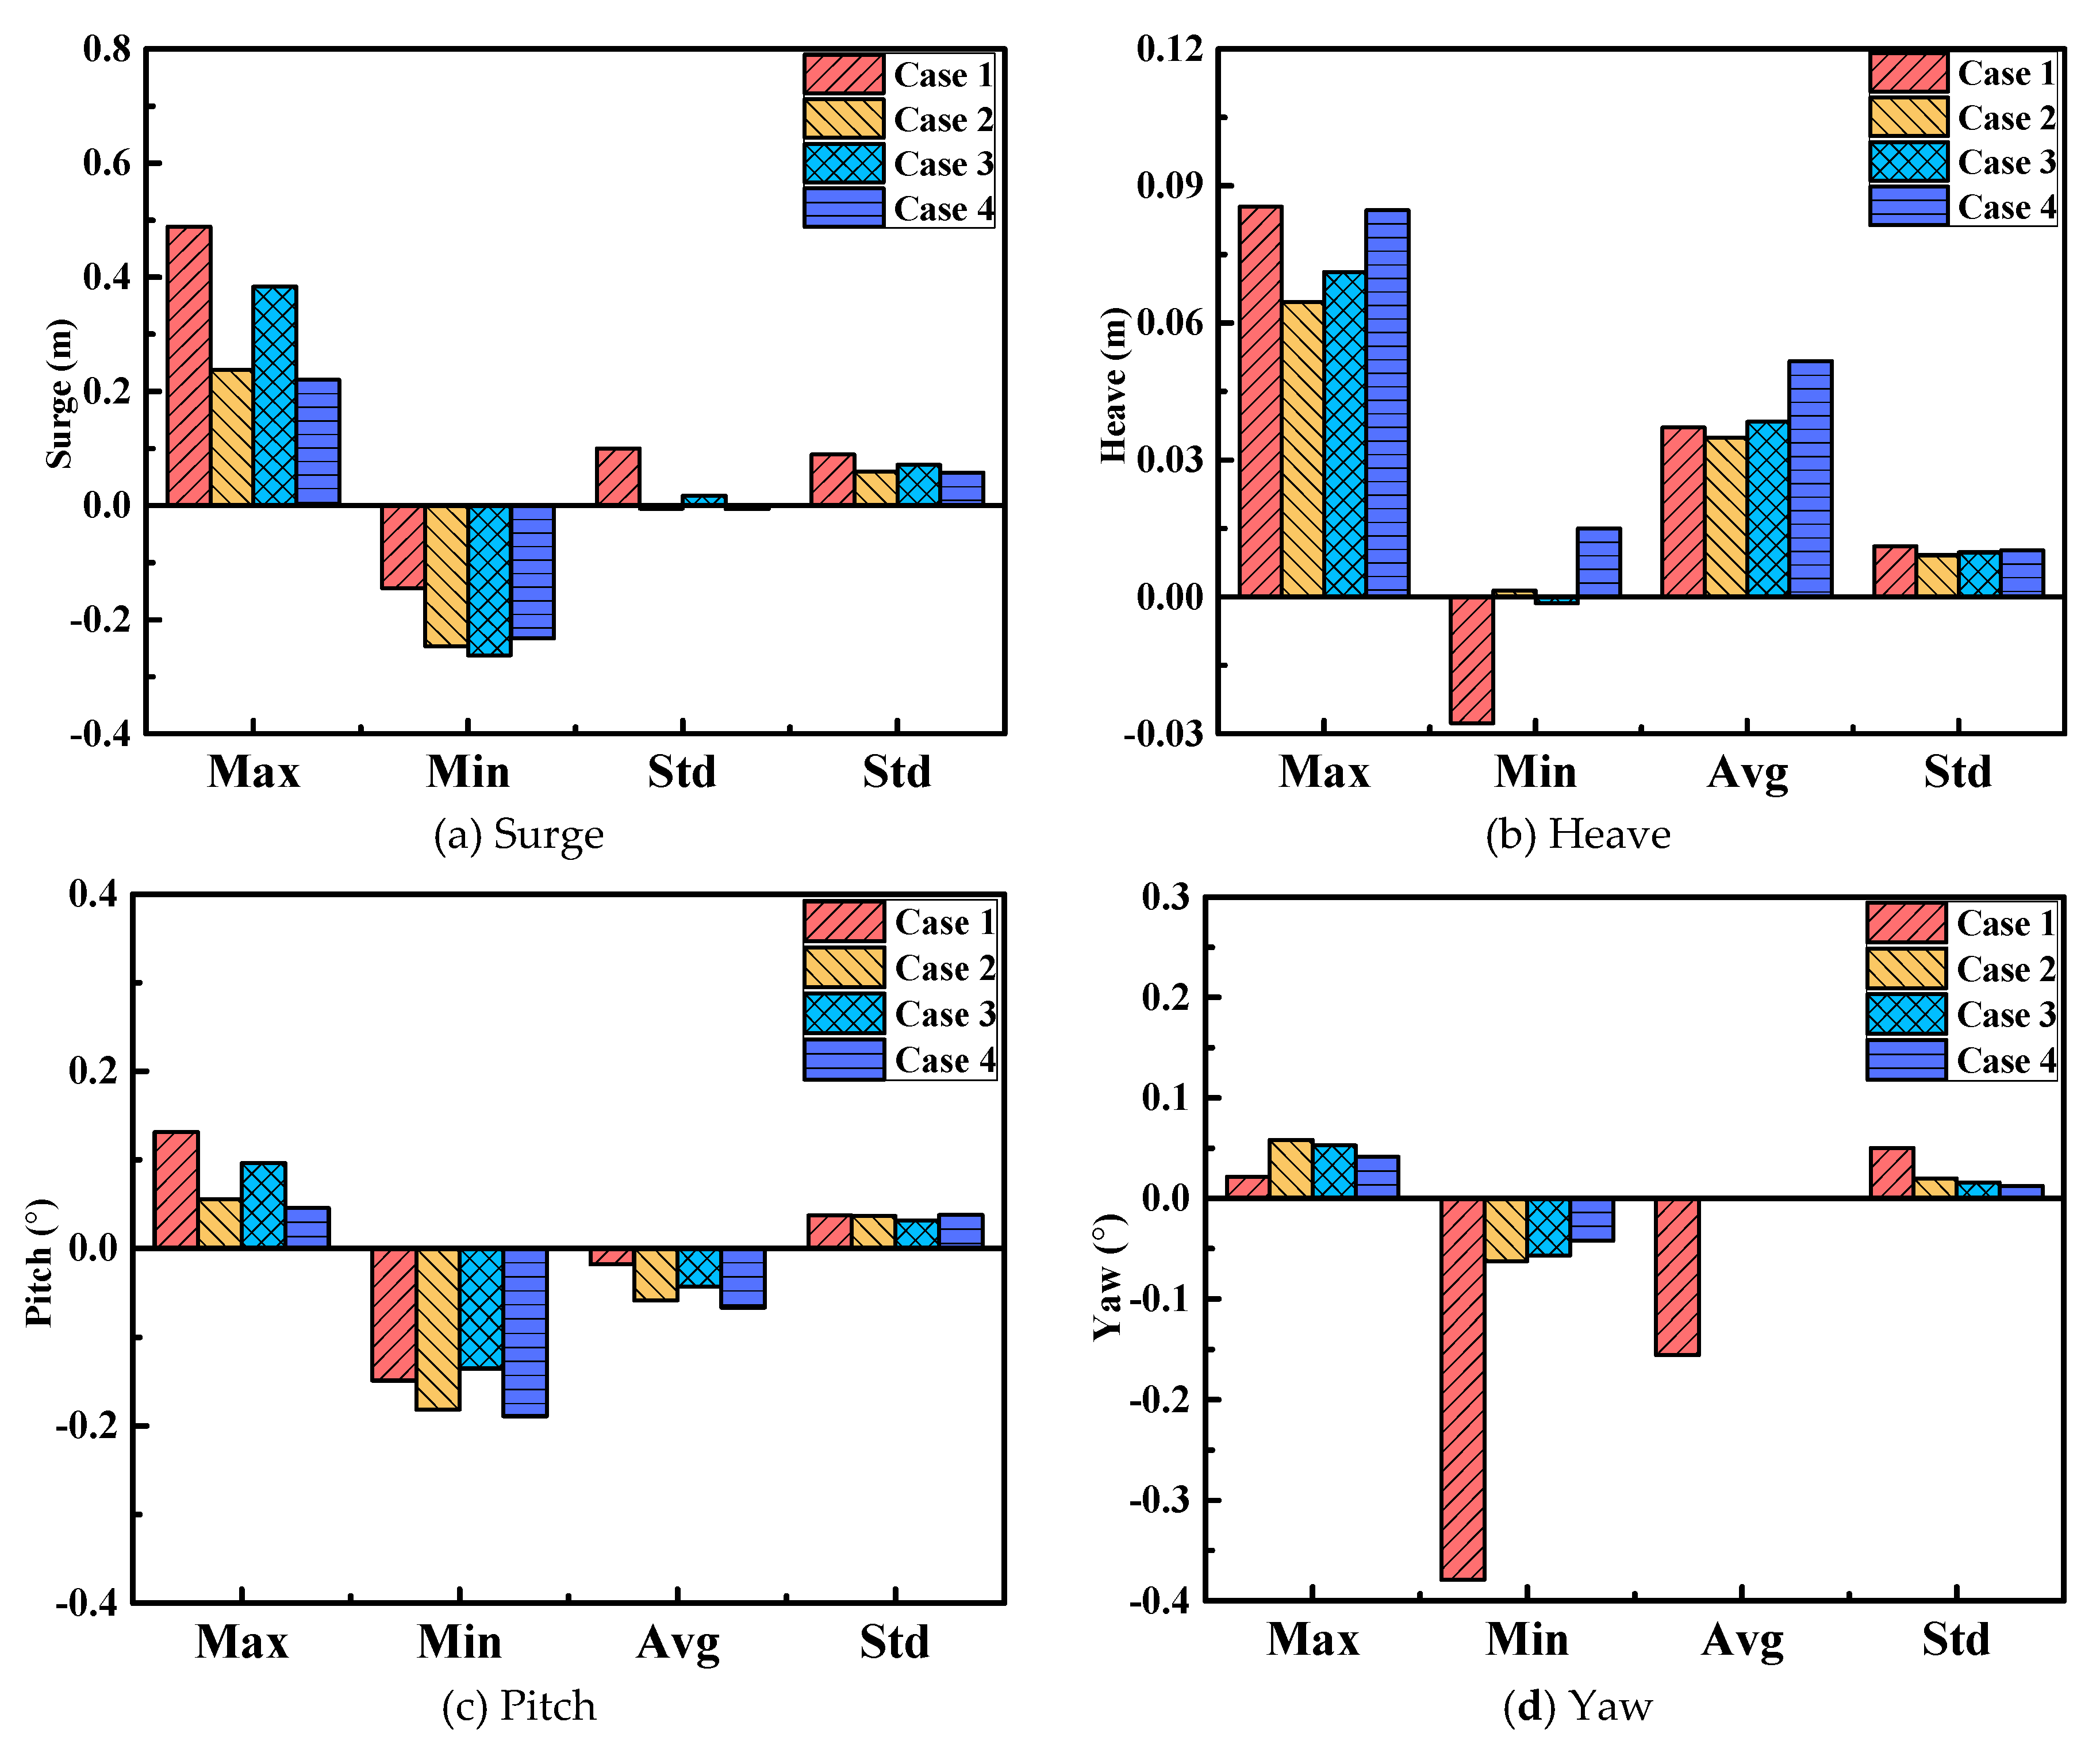
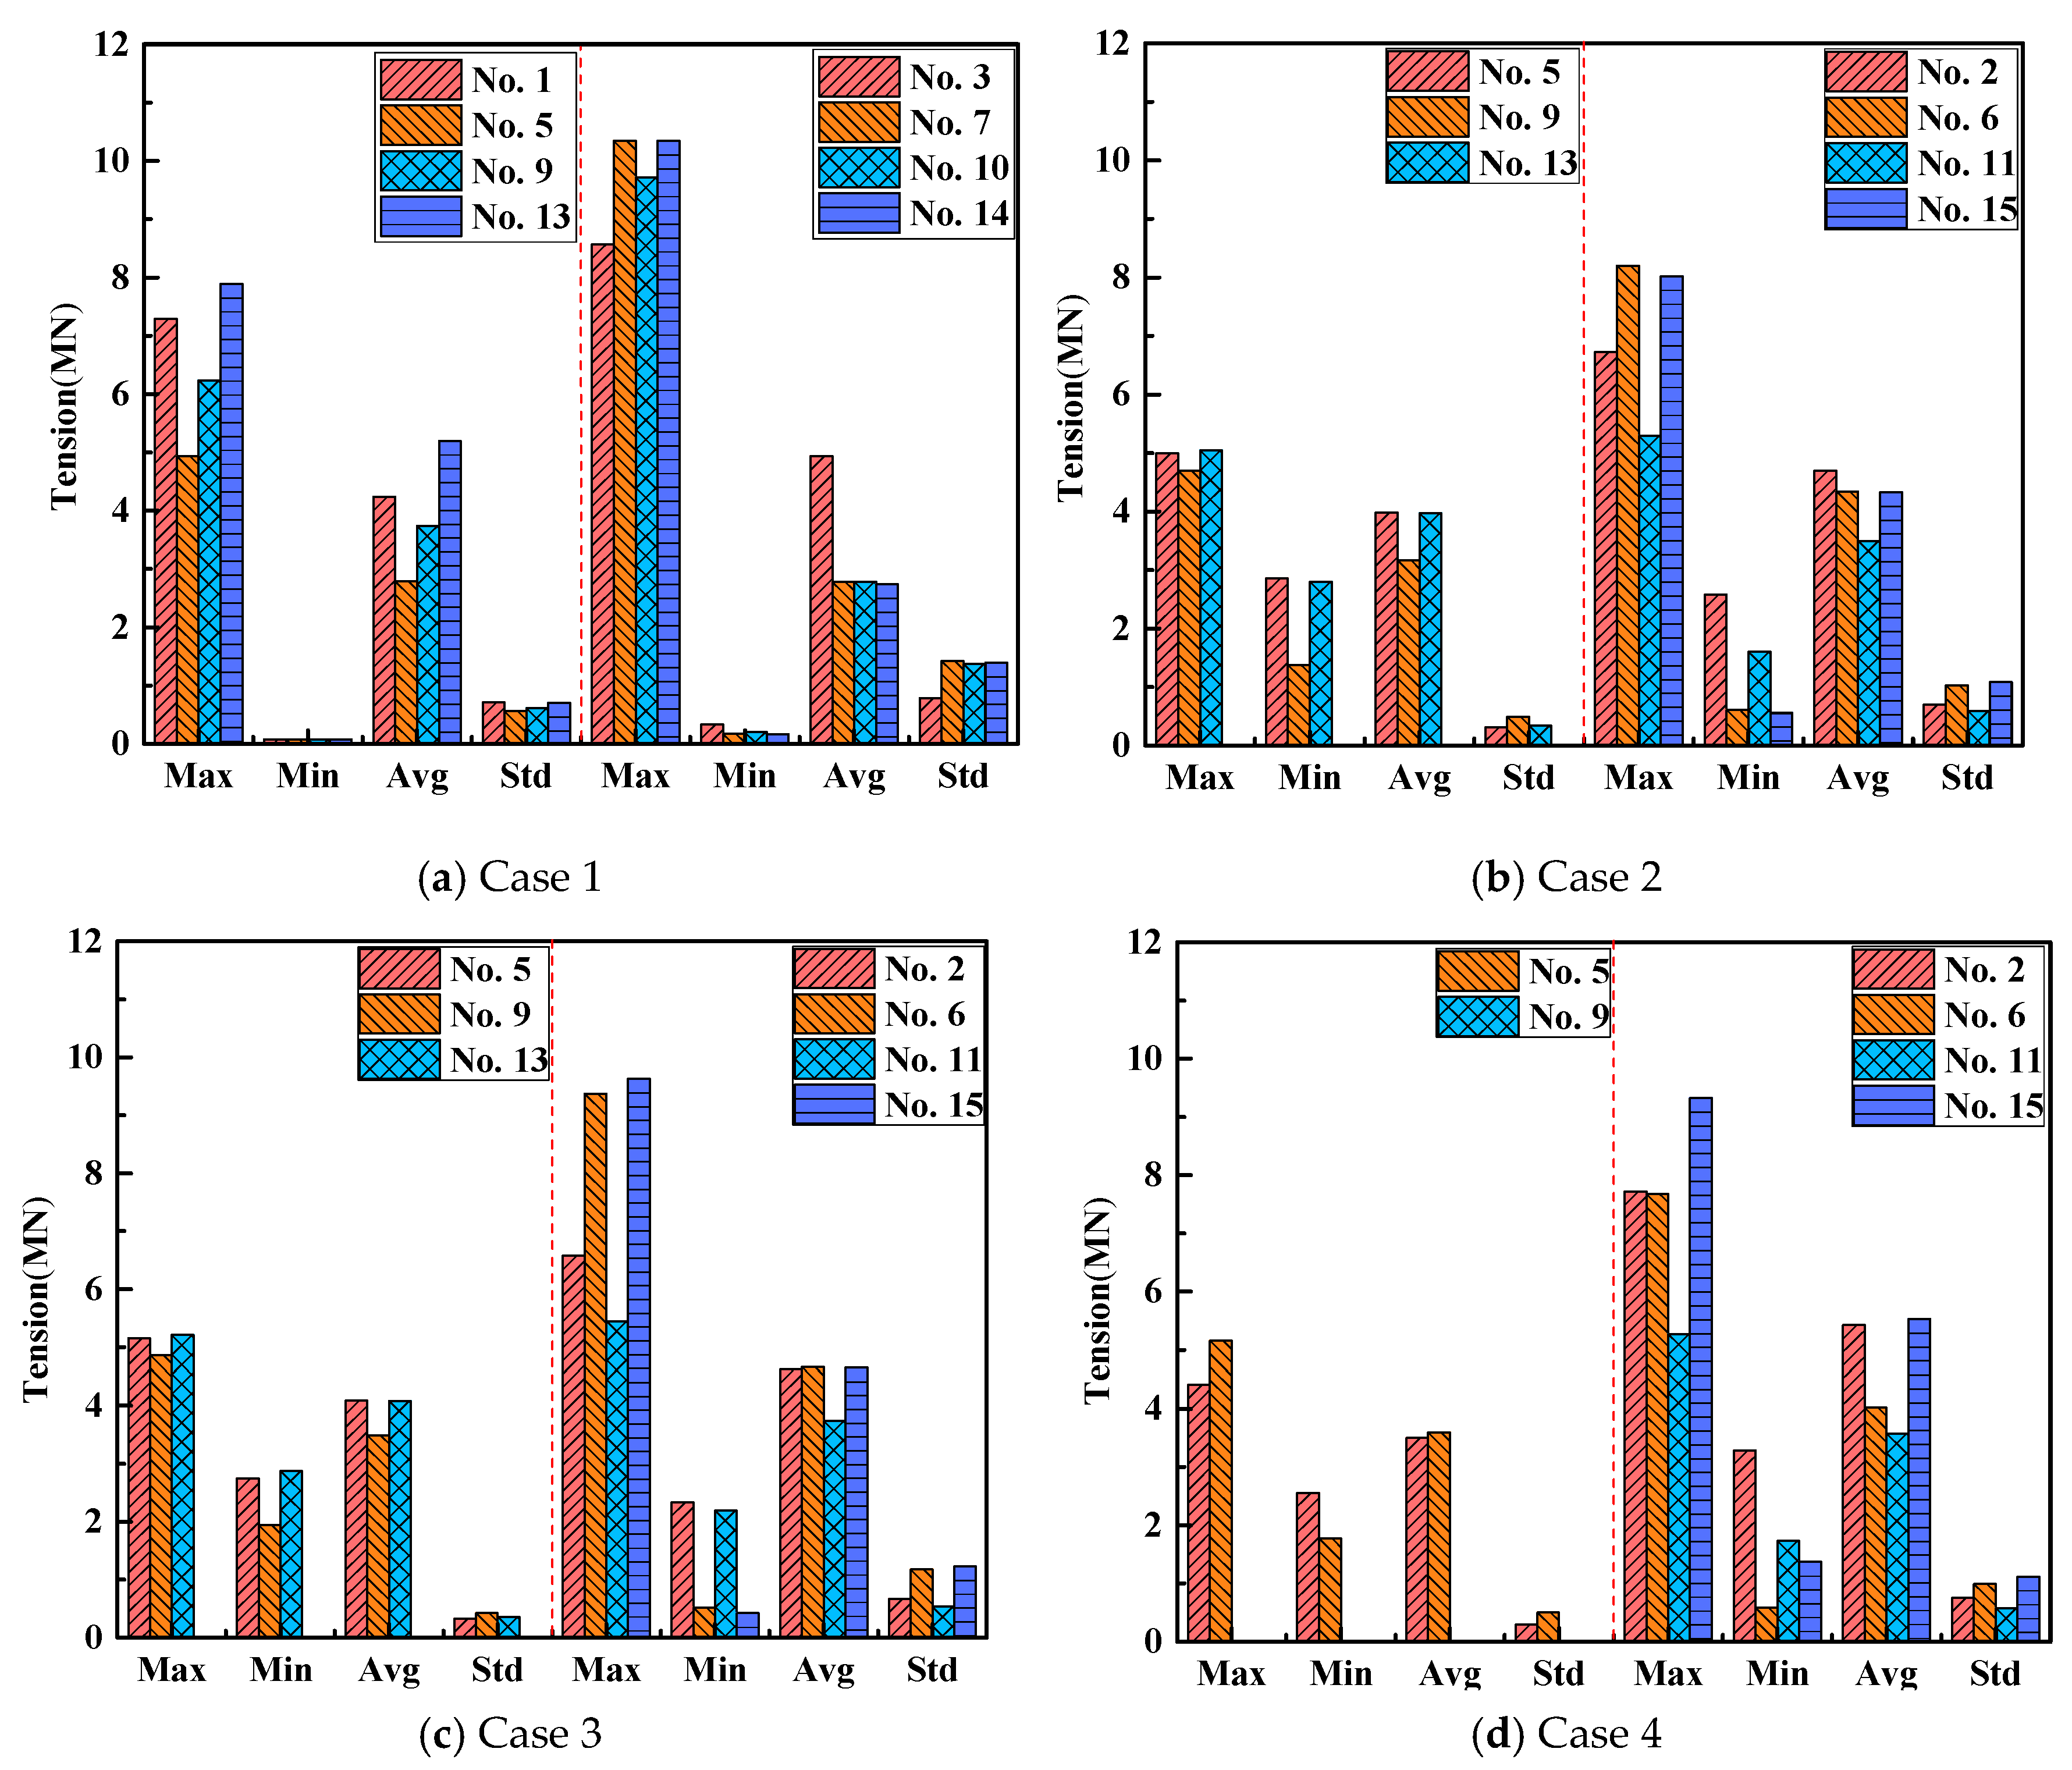
5. Dynamic Response of SFOWT with Broken Mooring Lines

There may be one or several broken mooring lines in a floating wind turbine under long-term environmental loads. The once-in-one-year sea condition was chosen to simulate an accident during operation [36]. Four cases were considered, as listed in Table 8.
The time series and motion statistics of platform motion with broken mooring lines are shown in Figure 21 and Figure 22, respectively. It can be seen that in the course of 4100 s, the motion responses on all DOFs fluctuated and the amplitudes increased due to the wave frequency response. The motion response on each DOF of the platform in Case 1 was the largest. Because the No. 15 mooring line was in the upwind wave direction, as it consistently experienced a larger wave impact, an increasing motion response will be caused if it is broken, and the equilibrium position of yaw motion will be changed when the platform is at a new horizontal location. If the No. 1 mooring line is disconnected, the motion response will be smaller owing to its position in the downwind direction against the environmental loads. In comparison to Case 1, the maximum value and standard deviation of yaw in Case 2 were reduced by 83.5% and 60.2%, respectively.
In all four cases, the motion responses of the platform were relatively smaller on each DOF, indicating that SFOWT had good stability in the condition with broken mooring lines.
The statistics of tension in vertical (Nos. 1, 5, 9, and 13) and diagonal (the one that has the maximum tension in each group) lines in the four different conditions with broken mooring lines are shown in Figure 23. When a certain line is broken, the tension in the mooring line with the same fairlead will increase. The tension of the mooring line in the upwind wave direction will become larger as it consistently experiences wave loads. The tension in the diagonal lines will be larger than those in vertical lines, which is due to the larger pretension in diagonal lines. In all four cases, there was no slack in mooring lines, which remained tight all the time.

6. Conclusions

A coupled dynamic model of SFOWT was established in this paper, and simulations of four different mooring configurations under normal sea conditions were performed. It was found that the motion response of the platform was smaller and the stability of SFOWT was better under Configuration 4 (i.e., four vertical lines and 12 diagonal lines with an inclination angle of 30°). In comparison to Configuration 2 (i.e., four vertical lines and four diagonal lines with an inclination angle of 15°), the maximum value and standard deviation under Configuration 4 were reduced by 95.9% and 96.4%, respectively. Since only the safety factor under Configurations 2 did not meet the requirement, the cross-sectional area of mooring line should be increased to reduce the tension. The safety factors of the No. 1 (vertical) and No. 5 (diagonal) mooring lines under Configuration 4 were 4.52 and 4.23, respectively.
The well-stabilized Configuration 4 was selected, and the pretension was increased to control the platform movement effectively by adjusting the ballast water of the platform. The coupled dynamic responses of SFOWT under extreme sea-states were checked. As the wind loads were much smaller than the wave loads in extreme sea-states because the turbine was parked, the spectra of the motions were mainly dominated by the wave frequency response and resonant response. It was found that this configuration can provide better surge and yaw performances, as well as better horizontal restraints; moreover, the motion responses of SFOWT on six degree of freedoms were smaller.
The influence of broken mooring lines on the SFOWT performance was investigated. Four failure cases of mooring line were considered, among which Case 1, which was the No. 15 mooring line in the upwind wave direction being broken, had the largest motion response. However, there was no slack in the remaining mooring lines, and the SFOWT still had enough stability.

Author Contributions

Conceptualization, H.D., C.L. and P.Z.; Methodology, C.L. and Y.L.; Software, Y.L. and C.L.; validation, C.L., H.D. and P.Z.; Formal Analysis, Y.L. and C.L.; Writing-Original Draft Preparation, Y.L. C.L. and J.Z.; Writing-Review & Editing, C.L. and Y.L.; Supervision, H.D., C.L. and P.Z; Project administration, H.D. and P.Z; Funding acquisition, H.D., P.Z. and C.L.

Funding

This research was funded by the National Natural Science Foundation of China (Grant Nos. 51679163 & 51779171), Innovation Method Fund of China (Grant No. 2016IM030100), Tianjin Municipal Natural Science Foundation (Grant No. 18JCYBJC22800) and State Key Laboratory of Coastal and Offshore Engineering (Grant No. LP1709).

Conflicts of Interest

The authors declare no conflict of interest.

References

  1. Bachynski, E.E. Design and Dynamic Analysis of Tension Leg Platform Wind Turbines; Norwegian University of Science and Technology: Trondheim, Norway, 2014. [Google Scholar]
  2. Wen, B.; Tian, X.; Dong, X.; Peng, Z.; Zhang, W. Influences of surge motion on the power and thrust characteristics of an offshore floating wind turbine. Energy 2017, 141, 2054–2068. [Google Scholar] [CrossRef]
  3. Musial, W.; Butterfield, S.; Boone, A. Feasibility of floating platform systems for wind turbines. In Proceedings of the 42nd AIAA Aerospace Sciences Meeting and Exhibit, Reno, Nevada, 5 January 2004. [Google Scholar]
  4. Roddier, D.; Cermelli, C.; Aubault, A.; Weinstein, A. WindFloat: A floating foundation for offshore wind turbines. J. Renew. Sustain. Energy 2010, 2, 033104. [Google Scholar] [CrossRef]
  5. Hong, S.; Lee, I.; Park, S.H.; Lee, C.; Chun, H.-H.; Lim, H.C. An experimental study of the effect of mooring systems on the dynamics of a spar buoy-type floating offshore wind turbine. Int. J. Nav. Archit. Ocean Eng. 2015, 7, 559–579. [Google Scholar] [CrossRef]
  6. Musial, W.; Butterfield, S.; Ram, B. Energy from offshore wind. In Proceedings of the Offshore Technology Conference, Houston, TX, USA, 1–4 May 2006. [Google Scholar]
  7. Stewart, G.M.; Lackner, M.A. The effect of actuator dynamics on active structural control of offshore wind turbines. Eng. Struct. 2011, 33, 1807–1816. [Google Scholar] [CrossRef]
  8. Arapogianni, A.; Genachte, A.; Ochagavia, R.M.; Vergara, J.P.; Castell, D.; Tsouroukdissian, A.R.; Korbijn, J.; Bolleman, N.C.F.; Huera-Huarte, F.J.; Schuon, F.; et al. Deep Water: The next Step for Offshore Wind Energy; European Wind Energy Association: Belgium, Brussels, 2013. [Google Scholar]
  9. Bjoska, B.; Hanson, T.; Ruy, R.; Nielsen, F. Dynamic response and control of the hywind demo floating wind turbine. In Proceedings of the European Wind Energy Conference, Warsaw, Poland, 20–23 April 2010. [Google Scholar]
  10. Weinzettel, J.; Reenaas, M.; Solli, C.; Hertwich, E.G. Life cycle assess of a floating offshore wind turbine. Renew. Energy 2009, 34, 742–747. [Google Scholar] [CrossRef]
  11. Aubault, A.; Cermelli, C.; Roddier, D. WindFloat: A floating foundation for offshore wind turbines-part III: Structural analysis. In Proceedings of the ASME 2009 28th International Conference on Ocean, Offshore and Arctic Engineering, Honolulu, HI, USA, 31 May–5 June 2009; American Society of Mechanical Engineers: New York, NY, USA, 2009; pp. 213–220. [Google Scholar]
  12. Chengxi, L.; Jun, Z. Nonlinear Coupled Dynamics Analysis of A Truss Spar Platform. China Ocean Eng. 2016, 30, 835–850. [Google Scholar]
  13. Lefebvre, S.; Collu, M. Preliminary design of a floating support structure for 5 MW offshore wind turbine. Ocean Eng. 2012, 40, 15–26. [Google Scholar] [CrossRef]
  14. Polaris Wind Power Network. The Success Assembly of the First Floating Offshore Wind Power Base in the World. Polaris Wind Power. 2017. Available online: http://news.bjx.com.cn/html/20170207/806667.shtml (accessed on 7 February 2017).
  15. Coulling, A.J.; Goupee, A.J.; Robertson, A.N.; Jonkman, J.M.; Dagher, H.J. Validation of a FAST semi-submersible floating wind turbine numerical model with DeepCwind test data. J. Renew. Sustain. Energy 2013, 5, 023116. [Google Scholar] [CrossRef]
  16. Duan, F.; Hu, Z.; Niedzwecki, J.M. Model test investigation of a spar floating wind turbine. Mar. Struct. 2016, 49, 76–96. [Google Scholar] [CrossRef]
  17. Benassai, G.; Campanile, A.; Piscopo, V.; Scamardella, A. Optimization of Mooring Systems for Floating Offshore Wind Turbines. Coast. Eng. J. 2015, 57, 1550021-1–1550021-9. [Google Scholar] [CrossRef]
  18. Liu, Y.; Xiao, Q.; Incecik, A.; Peyrard, C.; Wan, D. Establishing a fully coupled CFD analysis tool for floating offshore wind turbines. Renew. Energy 2017, 112, 280–301. [Google Scholar] [CrossRef] [Green Version]
  19. Benassai, G.; Campanile, A.; Piscopo, V.; Scamardella, A. Ultimate and accidental limit state design for mooring systems of floating offshore wind turbines. Ocean Eng. 2014, 92, 64–74. [Google Scholar] [CrossRef]
  20. Yasunori, N.; Yusuke, M. Research and development about the mechanisms of a single point mooring system for offshore wind turbines. Ocean Eng. 2018, 147, 431–446. [Google Scholar]
  21. Utsunomiya, T.; Yoshida, S.; Ookubo, H.; Sato, I.; Ishida, S. Dynamic analysis of a floating offshore wind turbine under extreme environmental conditions. J. Offshore Mech. Arct. Eng. 2014, 136, 02094. [Google Scholar] [CrossRef]
  22. Bae, Y.H.; Kim, M.H.; Kim, H.C. Performance changes of a floating offshore wind turbine with broken mooring line. Renew. Energy 2017, 101, 364–375. [Google Scholar] [CrossRef]
  23. Li, Y.; Zhu, Q.; Liu, L.; Tang, Y. Transient response of a SPAR-type floating offshore wind turbine with fractured mooring lines. Renew. Energy 2018, 122, 576–588. [Google Scholar] [CrossRef]
  24. Ahmed, M.O.; Yenduri, A.; Kurian, V.J. Evaluation of the dynamic responses of truss SPAR platforms for various mooring configurations with damaged lines. Ocean Eng. 2016, 123, 411–421. [Google Scholar] [CrossRef]
  25. Ding, H.; Han, Y.; Zhang, P. Dynamic analysis of a new type of floating platform for offshore wind turbine. In Proceedings of the 26th International Ocean and Polar Engineering Conference, Rhodes, Greece, 26 June–2 July 2016. [Google Scholar]
  26. Han, Y.; Le, C.; Ding, H.; Cheng, Z.; Zhang, P. Stability and dynamic response analysis of a submerged tension leg platform for offshore wind turbines. Ocean Eng. 2017, 129, 68–82. [Google Scholar] [CrossRef]
  27. Le, C.; Li, Y.; Ding, H. Study on the coupled dynamic responses of a submerged floating wind turbine under different mooring conditions. Energies 2019, 12, 418. [Google Scholar] [CrossRef]
  28. Jonkman, J.M. Dynamics of Offshore Floating Wind Turbines-Model Development and Verification. Wind Energy 2009, 12, 459–492. [Google Scholar] [CrossRef]
  29. Jonkman, B.J. TurbSim User’s Guide: Version 1.50. Available online: https://www.nrel.gov/docs/fy09osti/46198.pdf (accessed on 26 January 2019).
  30. Det Norske Veritas. SESAM User Manual HydroD; Det Norske Veritas: Oslo, Norway, 2013. [Google Scholar]
  31. Bae, Y.H.; Kim, M.H. Rotor-floater-tether coupled dynamic analysis including second-order sum-frequency wave loads for a mono-column-TLP-type FOWT (floating offshore wind turbine). Ocean Eng. 2013, 61, 109–122. [Google Scholar] [CrossRef]
  32. Zhao, Y.S.; Yang, J.M.; He, Y.P. Coupled dynamic response analysis of a multi-column tension-leg-type floating wind turbine. China Ocean Eng. 2016, 30, 505–520. [Google Scholar] [CrossRef]
  33. Li, Y.; Tang, Y.-G.; Zhu, Q.; Qu, X.-Q.; Wang, B.; Zhang, R.-Y. Effects of second-order wave forces and aerodynamic forces on dynamic responses of a TLP-type floating offshore wind turbine considering the set-down motion. J. Renew. Sustain. Energy 2017, 9, 063302. [Google Scholar] [CrossRef]
  34. Jonkman, J.; Butterfield, S.; Musial, W.; Scott, G. Definition of a 5MW Reference Wind Turbine for Offshore System Development; National Renewable Energy Laboratory (NREL): Golden, CO, USA, 2009. [Google Scholar]
  35. DNV. Offshore Standard DNV-OS-J103. Design of Floating Wind Turbine Structures; Det Norske Veritas: Oslo, Norway, 2013. [Google Scholar]
  36. DNV. DNV-RP-C205 Environmental Conditions and Environmental Loads; Det Norske Veritas: Oslo, Norway, 2010. [Google Scholar]
Figure 1. Overall model of the submerged floating offshore wind turbine (SFOWT).
Jmse 07 00115 g001
Figure 2. Four mooring configurations.
Jmse 07 00115 g002
Figure 3. Time series of the platform motion under different mooring configurations.
Jmse 07 00115 g003aJmse 07 00115 g003bJmse 07 00115 g003c
Figure 4. Motion statistics of the platform under different mooring configurations.
Jmse 07 00115 g004
Figure 5. Time series of the bending moment at the root of blade and tower base under different mooring configurations.
Jmse 07 00115 g005
Figure 6. Statistics of the bending moment at the root of blade and tower base under different mooring configurations.
Jmse 07 00115 g006
Figure 7. Time series of tension on mooring lines in different mooring configurations.
Jmse 07 00115 g007aJmse 07 00115 g007b
Figure 8. Statistics of tension in mooring lines under different mooring configurations.
Jmse 07 00115 g008
Figure 9. Safety factor of mooring lines under different mooring configurations.
Jmse 07 00115 g009
Figure 10. Mooring configuration of SFOWT.
Jmse 07 00115 g010
Figure 11. Time series of wind speed under extreme sea-states.
Jmse 07 00115 g011
Figure 12. Time series of wave elevation under extreme sea-states.
Jmse 07 00115 g012
Figure 13. Power spectra of wind speed.
Jmse 07 00115 g013
Figure 14. Power spectra of wave elevation.
Jmse 07 00115 g014
Figure 15. Time series of platform surge motion under extreme sea-states.
Jmse 07 00115 g015
Figure 16. Time series of tension in the No. 1 mooring line under extreme sea-states.
Jmse 07 00115 g016
Figure 17. Motion statistics of the platform under extreme sea-states.
Jmse 07 00115 g017
Figure 18. Power spectra of the platform motion under extreme sea-states.
Jmse 07 00115 g018
Figure 19. Statistics of tension in the mooring lines under extreme sea-states.
Jmse 07 00115 g019
Figure 20. Safety factor of the mooring lines under extreme sea-states.
Jmse 07 00115 g020
Figure 21. Time series of the platform motion under the condition of broken mooring lines.
Jmse 07 00115 g021aJmse 07 00115 g021bJmse 07 00115 g021c
Figure 22. Motion statistics of the platform with broken mooring lines.
Jmse 07 00115 g022
Figure 23. Statistics of tension in mooring lines in conditions with broken mooring lines.
Jmse 07 00115 g023
Table 1. Main parameters of the floating platform.
ParameterValue
Diameter of vertical pontoon9 m
Height of vertical pontoon12 m
Distance between vertical pontoons40 m
Height of column20 m
Column diameter6 m
Mass of platform2,734,200 kg
Mass moment of inertia in roll7.818 × 108 kg m2
Mass moment of inertia in pitch7.818 × 108 kg m2
Mass moment of inertia in yaw1.359 × 109 kg m2
COG of the platform during operation(0, 0, −16.75 m)
Area of water plane during operation51.45 m2
Table 2. Main parameters of the mooring line.
ParameterValue
Diameter of mooring line0.127 m
Mass of per unit length116.027 kg/m
Breaking strength13,249 kN
Axial stiffness of mooring line (EA)2.47 × 10⁹ N
Table 3. Main parameters of the NREL 5 MW wind turbine.
ParameterValue
Rated power5 MW
Turbine control Variable speed, collective pitch
Rotor diameter126 m
Hub diameter3 m
Hub height90 m
Cut-in, rated, cut-out wind speeds3, 11.4, and 25 m/s
Mass of impeller110,000 kg
Mass of nacelle240,000 kg
Mass of tower347,460 kg
Centroid coordinates(−0.2 m, 0, 74 m)
Table 4. Requirements of the minimum safety factors [35].
StateAnalysis MethodSafety Factor
Normal operation state (NOS)Dynamic1.67
Extreme sea-statesDynamic1.3
Broken mooring linesDynamic1.0
Table 5. Mooring configurations.
Mooring ConfigurationNo. of Vertical Mooring LinesNo. of Diagonal Mooring LinesInclination Angle
Configuration 18--
Configuration 24415°
Configuration 34430°
Configuration 441230°
Table 6. Pretension in mooring lines.
Mooring ConfigurationPretension in Vertical Lines/kNPretension in Diagonal Lines/kN
Configuration 13600-
Configuration 236003727
Configuration 336004157
Configuration 418002078
Table 7. Environmental loads under extreme sea-states.
Extreme Sea-StatesWind Speed (m/s)Hs (m)Tp (s)
Once-in-1-year307.111.9
Once-in-50-years491315.5
Table 8. Conditions of broken mooring lines.
CaseBroken Mooring Line
Case 1No. 15
Case 2No. 1
Case 3Nos. 1 and 12
Case 4Nos. 1 and 13

