Article

Loads and Response of a Tension Leg Platform Wind Turbine with Non-Rotating Blades: An Experimental Study

National Centre for Maritime Engineering and Hydrodynamics, Australian Maritime College, University of Tasmania, Launceston, TAS 7250, Australia
*
Author to whom correspondence should be addressed.
J. Mar. Sci. Eng. 2019, 7(3), 56; https://doi.org/10.3390/jmse7030056
Submission received: 31 December 2018 / Revised: 20 February 2019 / Accepted: 22 February 2019 / Published: 27 February 2019
(This article belongs to the Special Issue Offshore Wind Farms)

Abstract

:
This paper describes model testing of a Tension Leg Platform Wind Turbine (TLPWT) with non-rotating blades to better understand its motion and tendon responses when subjected to combined wind and unidirectional regular wave conditions. The TLPWT structure is closely based on the National Renewable Energy Laboratory (NREL) 5 MW concept. Multiple free decay tests were performed to evaluate the natural periods of the model in the key degrees of freedom, whilst Response Amplitude Operators (RAOs) were derived to show the motion and tendon characteristics. The natural periods in surge and pitch motions evaluated from the decay tests had a relatively close agreement to the theoretical values. Overall, the tested TLPWT model exhibited typical motion responses to that of a generalised TLP with significant surge offsets along with stiff heave and pitch motions. The maximum magnitudes for the RAOs of surge motion and all tendons occurred at the longest wave period of 1.23 s (~13.0 s at full-scale) tested in this study. From the attained results, there was evidence that static wind loading on the turbine structure had some impact on the motions and tendon response, particularly in the heave direction, with an average increase of 13.1% in motion amplitude for the tested wind conditions. The wind had a negligible effect on the surge motion and slightly decreased the tendon tensions in all tendons. The results also showed the set-down magnitudes amounting to approximately 2–5% of the offset. Furthermore, the waves are the dominant factor contributing to the set-down of the TLPWT, with a minimal contribution from the static wind loading. The results of this study could be used for calibrating numerical tools such as CFD codes.

1. Introduction

There is an increasing demand worldwide for renewable energy generation, largely due to the increasing awareness of climate change and limited fossil fuel resources [1]. The total capacity of offshore wind has increased considerably in the last decade, with global capacity reaching a recorded 19.27 gigawatts (GW) in 2017, up from only 1.44 GW in 2008 [2]. Many major countries are continuing to develop offshore wind technology. The current rate of development is only set to increase, with predictions of up to 120 GW to be installed by 2030 [3].
Wind energy is considered a potential solution to cope with increasing energy demand, but development has largely been limited to onshore applications. This is particularly evident with 88% of the global offshore wind energy generation capacity located in European shallow waters as of the end of 2016 [4]. A major reason for this is the increased complexity of offshore turbine support structures, combined with additional factors from the maritime environment [5]. Typically, support structures include gravity bases, monopole and jacket structures, with monopoles being the most common, based on competitive fabrication and installation costs [6,7,8]. However, with space fast becoming a limiting factor for land-based wind power generation, significant research and development has been directed towards alternatives better suited for deeper waters [9]. In some cases, nearshore developments are undesirable due to their visual impact, further supporting these developments. For deeper water, floating structures appear to be a viable alternative to the restrictions of piled and jacket-based designs. However, floating structures are more challenging to design, based upon considerations of coupling between the turbine and support structure. Other factors such as mooring configurations and sea state conditions are likely to have a greater effect on the performance of the structure [10].
Currently, there has only been one full-scale Floating Offshore Wind Turbine (FOWT) commercial project commissioned. The Hywind project off the coast of Peterhead, Scotland began commercial generation in October 2017 and consists of five 6 MW turbines supported by spar-buoy floating structures. With the implementation of the first FOWTs, there is potential for FOWTs to play a more prominent role in the offshore wind industry [11]. This is most likely to be evident for larger countries such as the United States, China, Japan and Norway, which are limited in the amount of shallow water areas to place turbines [9].
One proposal for FOWT developments is the concept of Tension Leg Platforms (TLPs). TLPs have long been utilised in the offshore oil and gas industry, with the potential for this expertise to be applied to offshore renewable energy technology [1,12,13]. TLPs are a promising option for intermediate water depths due to the limited motions of the platform, allowing for the reduction of turbine motions and loads [14]. TLPs may also prove more effective for the relatively light topside conditions.
TLPs consist of a floating structure that uses a vertical tether system connected to the seafloor to achieve its required stability [15]. There are a wide range of TLP structure arrangements that have been developed for the different purposes they serve. These different types can be categorised into mono-column and conventional multi-column TLPs [16]. Up until the late 1990s, most oil and gas production platforms consisted of square four-column configurations. However, as time has progressed, more unique designs have been developed such as the single-column SeaStar TLP and the extended pontoon TLP [17].
The intact tendon system provides sufficient righting moments in response to small deformations due to the high vertical tension. This is unique compared to ships or other offshore structures that use conventional mooring systems [16]. This limits the structural loadings on the topside without the need of a deep draft or spread mooring system [14]. The design of the tendons has significant influence over the motion response of TLP structures. The stiff mooring system significantly limits the motions in the heave, pitch, and roll directions when subjected to environmental forces [18]. The tendons also assist in ensuring the natural periods of the structure are outside the typical range of appreciable ocean waves of 6–20 s [19]. However, because of the high axial tension, higher order resonant responses from second order waves can occur in low and high frequency regimes due to the random nature of the sea state [20]. An investigation by Srinivasan et al. [21] has analysed non-linear phenomena such as ringing and springing responses [12,22] that have been observed in TLPs under impact and non-impact wave conditions. These phenomena can pose a threat to platform stability and can result in the eventual fatigue failure of the tendons [21,23].
According to Nihei et al. [24], typical turbine structures of around 450 tonnes total weight could allow for a reduction of a total water plane area and overall hull displacement. These alterations could lead to a reduction in cost and spatial requirements whilst also potentially leading to less tendon tension requirements. There can be major differences in the requirements of the support structure based on the size and rated output of the turbine. Over recent decades, the rated output of wind turbines has substantially increased from 75 kW to the largest current concepts ranging from 5–10 MW [4]. As a way of supporting research and development into TLPWTs, the NREL concept is based on a 5 MW turbine to represent the current technology for typical three-blade designs [25]. This turbine has been used in model experiments and numerical simulations such as Kimball et al. [26] and Koo et al. [10]. This has been applied in a conceptual NREL-MIT TLPWT design developed by Tracy [27].
There are variants of mono-column TLPWTs that have been examined in a parametric study by Bachynski and Moan [14], with five different structures having been investigated that include different hull arrangements and different sizes of submerged pontoons. Up until now, numerical simulations and codes such as FAST, Bladed or FLEX have been used to perform dynamic analysis [9,11,23,28,29,30]. Nevertheless, any numerical simulation techniques can only be trusted by the industry if their results have been thoroughly validated against experimental data first. To date there have been limited scaled model tests performed for FOWTs, particularly with TLPWTs [24,28,31,32,33]. The main purpose of this study is to fill this gap by conducting an experimental study into the hydrodynamic performance of a generic TLPWT model. The outcome of this study can serve as preliminary work to better understanding the motion and tendon responses under the influence of waves and wind forcing. Furthermore, the study aims at providing valuable data to verify/validate the results of numerical simulations to be conducted in future. In order to easily identify the effect of the wind loading on the global loads and responses of the TLPWT model, the wind turbine structure was modelled without considering the turbine thrust generated by spinning blades.
The main scope of this study is to investigate a conceptual TLPWT with a static rotor (i.e., non-rotating blades) using experimental tests at a scale of 1:112 with emphasis on the global hydrodynamic performance under combined wave and wind conditions. The scaled TLP model was based on a generic TLPWT derived from concept designs developed by Matha [9] and Bachynski and Moan [14]. Whilst the wind turbine structure was closely based on the NREL 5 MW turbine to represent the current technology used in the offshore wind industry [4]. To better understand the motion and tendon responses, the model was subjected to several wind and unidirectional regular wave conditions derived from Bachynski and Moan [14]. The study presents the differences in the platform wave-induced motions and tendon response with and without wind acting on the structure. An analysis of how offset and set-down correlate under changing wind and wave conditions was also performed. The materials of this paper are set out as follows: Section 2 describes the TLPWT model, instrumentations and the experimental setup. Furthermore, the wave and wind conditions selected for this study are included in Section 2. Section 3 introduces the results of free decay tests in different degrees of freedom and introduces the results of the uncertainty analyses. Section 4 discusses the obtained results of the model’s dynamic response and tendon tensions and response amplitude operators.

2. Materials and Methods

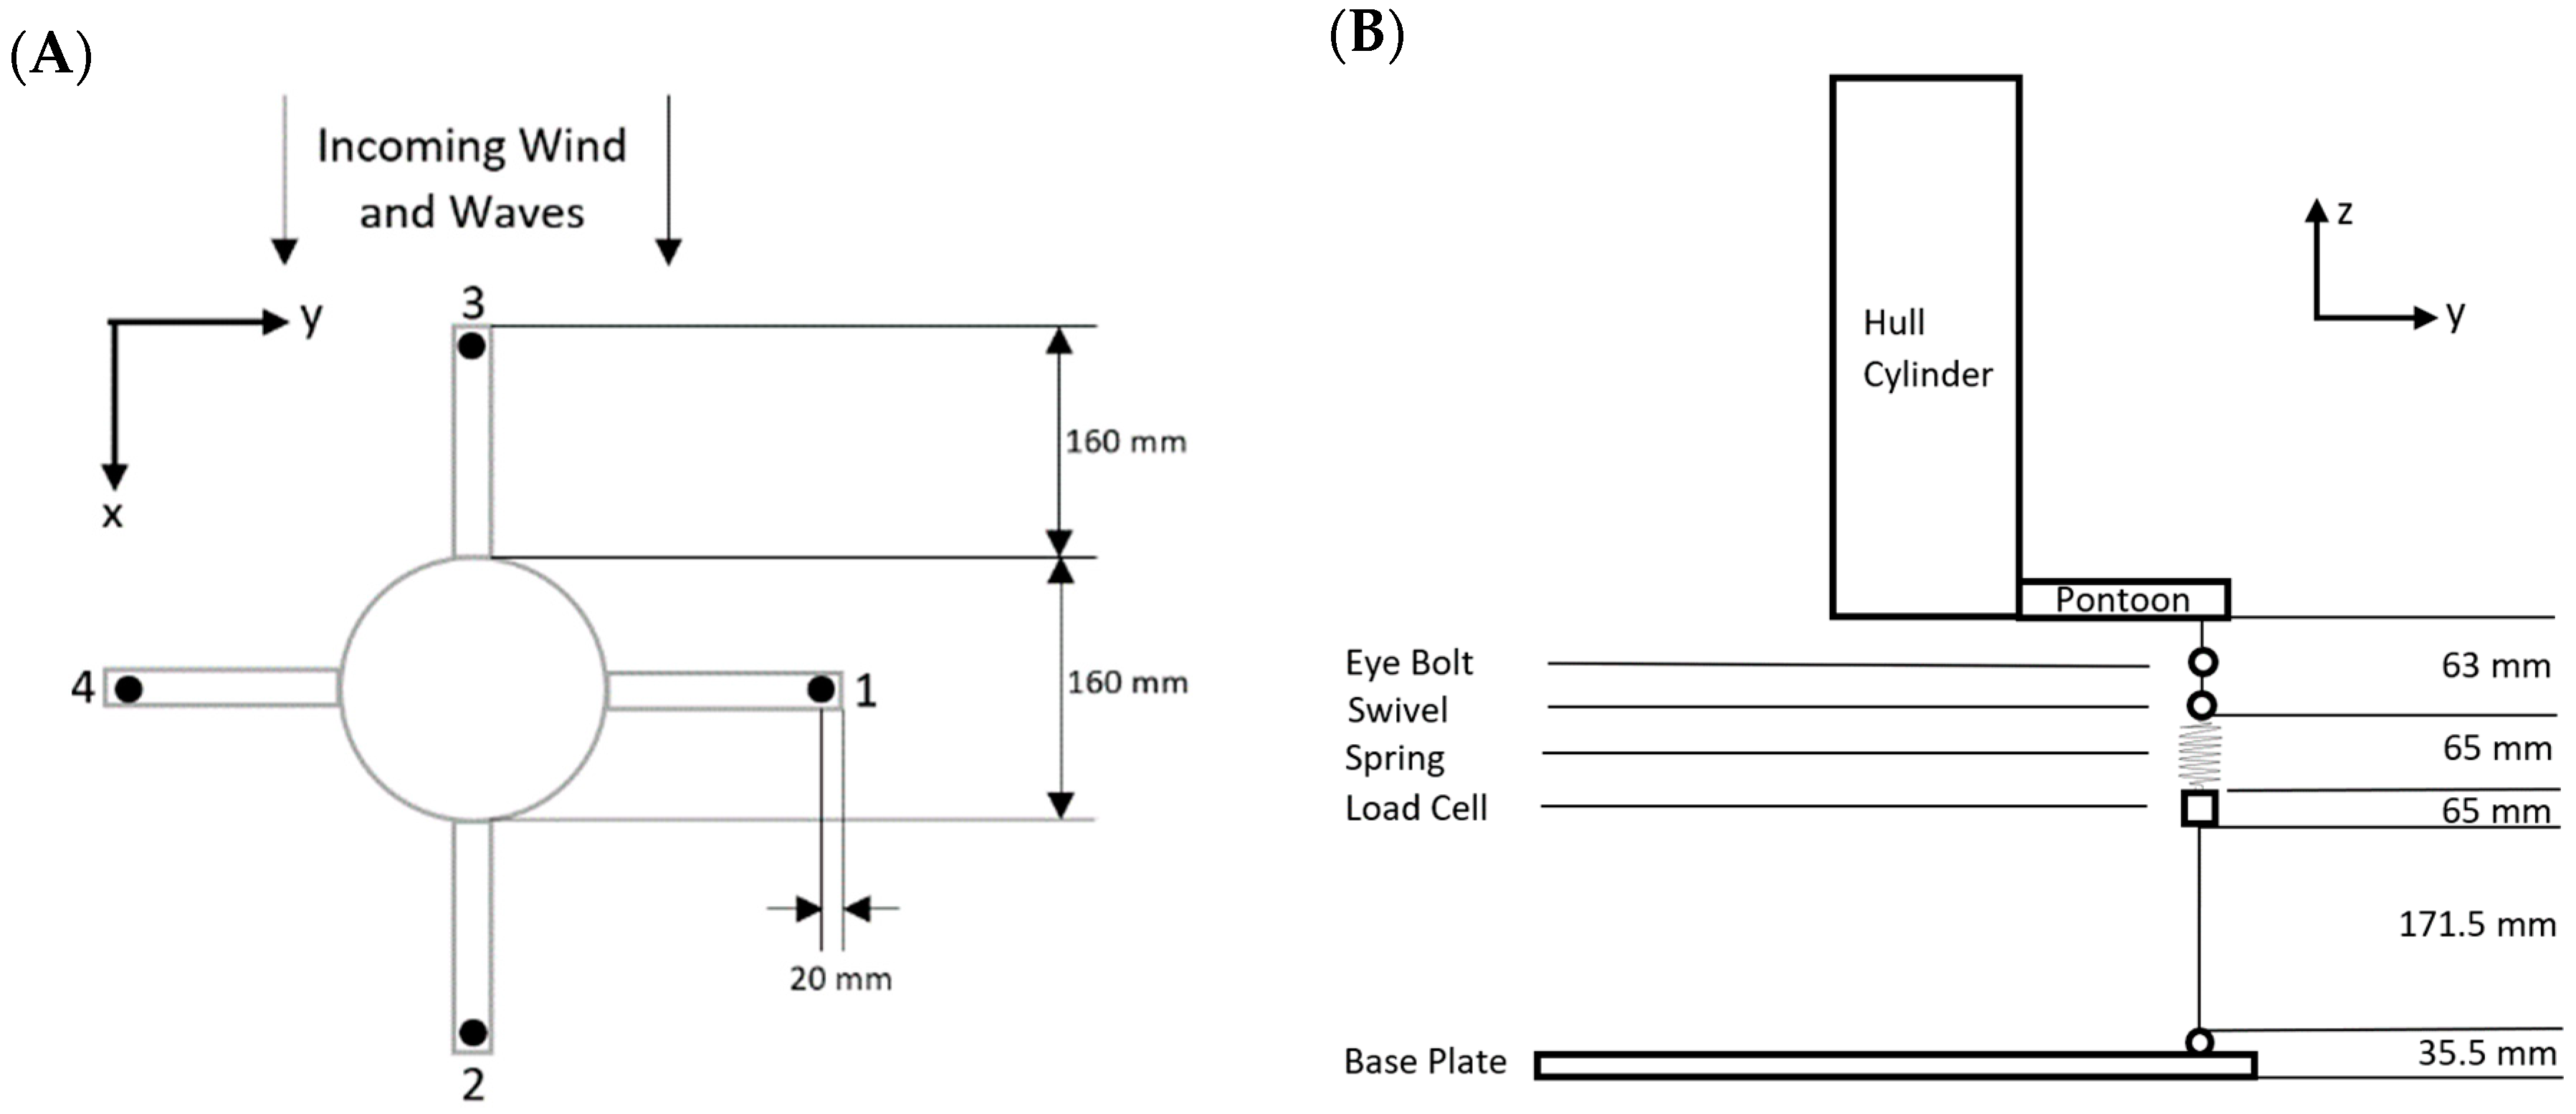
2.1. TLP Model Description

The TLPWT model used for the testing has been closely based in the NREL concept developed by Matha [9], from an initial investigation from Tracy [27]. This TLPWT concept has been used as a basis for experimental testing, including investigations by Nihei et al. [24] and Zamora-Rodriguez et al. [34]. The primary motivation behind using a similar hull and turbine arrangement allows for the close comparison of similarities and differences in results from this set of testing to previous experiments. This arrangement also represents a potential concept that could be used for full scale commercial development in the future.
Froude scaling law was applied to the TLP structure and turbine model to achieve the best possible scaled geometrical and mass properties for the TLPWT model. This methodology is commonly used for offshore structures for experimental testing in wave tanks [19,35,36]. To capture and measure the hydrodynamic behaviour of the model, an appropriate and practical scale of 1:112 was chosen. Based on the platform column diameter and the tested wave conditions discussed thereafter, the Reynolds number was estimated to be in the range of 1.69 × 10⁴–2.90 × 10⁴ (2.00 × 10⁷–3.43 × 10⁷ at full-scale). This scale was chosen due to laboratory and wind/wave generation constraints. However, such a selection does have implications for the scaling of the water depth, as the maximum achievable depth in the testing facility was limited to 900 mm which corresponded to a full-scale water depth of 100.8 m. This approach is considered acceptable since this study aims at investigating the hydrodynamic and wind loads of a generic TLPWT platform rather than the response of a specific TLPWT to be installed at a specific water depth. It is worth mentioning that the 1:112 model scale of the experiment is outside the typically chosen scale range (1:30–1:100) for hydrodynamic model testing [36] which might affect the quality of obtained data. Not only are smaller scales rarely used due to increased uncertainties and less repeatability in the modelling, but also due to scaling effects [36]. However, Hansen et al. [35] constructed and tested a floating TLP wind turbine at 1:200 scale to analyse its dynamic response experimentally in co-directional wind and waves. The authors concluded that their experiments have demonstrated the potential of the model scale floating wind turbine and the measurement set-up to provide data and insight into the dynamic response of a floating wind turbine in different mooring and weather conditions.
The scaled and ‘as-constructed’ parameters for the TLPWT hull are shown in Table 1, with reference to the literature and concept designs to which it is based. A combination of interpretations of this concept design from Matha [9] and Bachynski and Moan [14] were used as a basis for the full-scale parameters. The TLP model was constructed by Chia [37], with the structural geometry remaining the same for this experiment. Some changes were made based on construction and facility limitations, most notably the column height, freeboard and draft. The mass of the structure is greater which resulted in a higher pre-tension, however this proved beneficial for obtaining more reliable tendon tension data during the model testing. Although these changes increase the full-scale footprint and mass of the structure, the general hydrodynamic behaviour will still provide meaningful relationships and trends for the hydrodynamic performance of the model.

2.2. Turbine Model Description

The turbine model was scaled using the same factor as that used for the TLP hull, to ensure similarity for both components. The turbine was constructed as a fixed structure so that only static wind loading would be experienced on the structure. PLA plastic was used for the turbine assembly, which was created using a 3D printer. As can be seen in Table 2, all the geometrical parameters were able to be represented with a high accuracy. However, due to limitations with 3D printing and the scaling of the turbine blades, the weight of the blades was slightly higher compared to the intended scaled value. The turbine blade twist was also neglected, whilst the nacelle dimensions were chosen such that the nacelle mass was scaled appropriately.

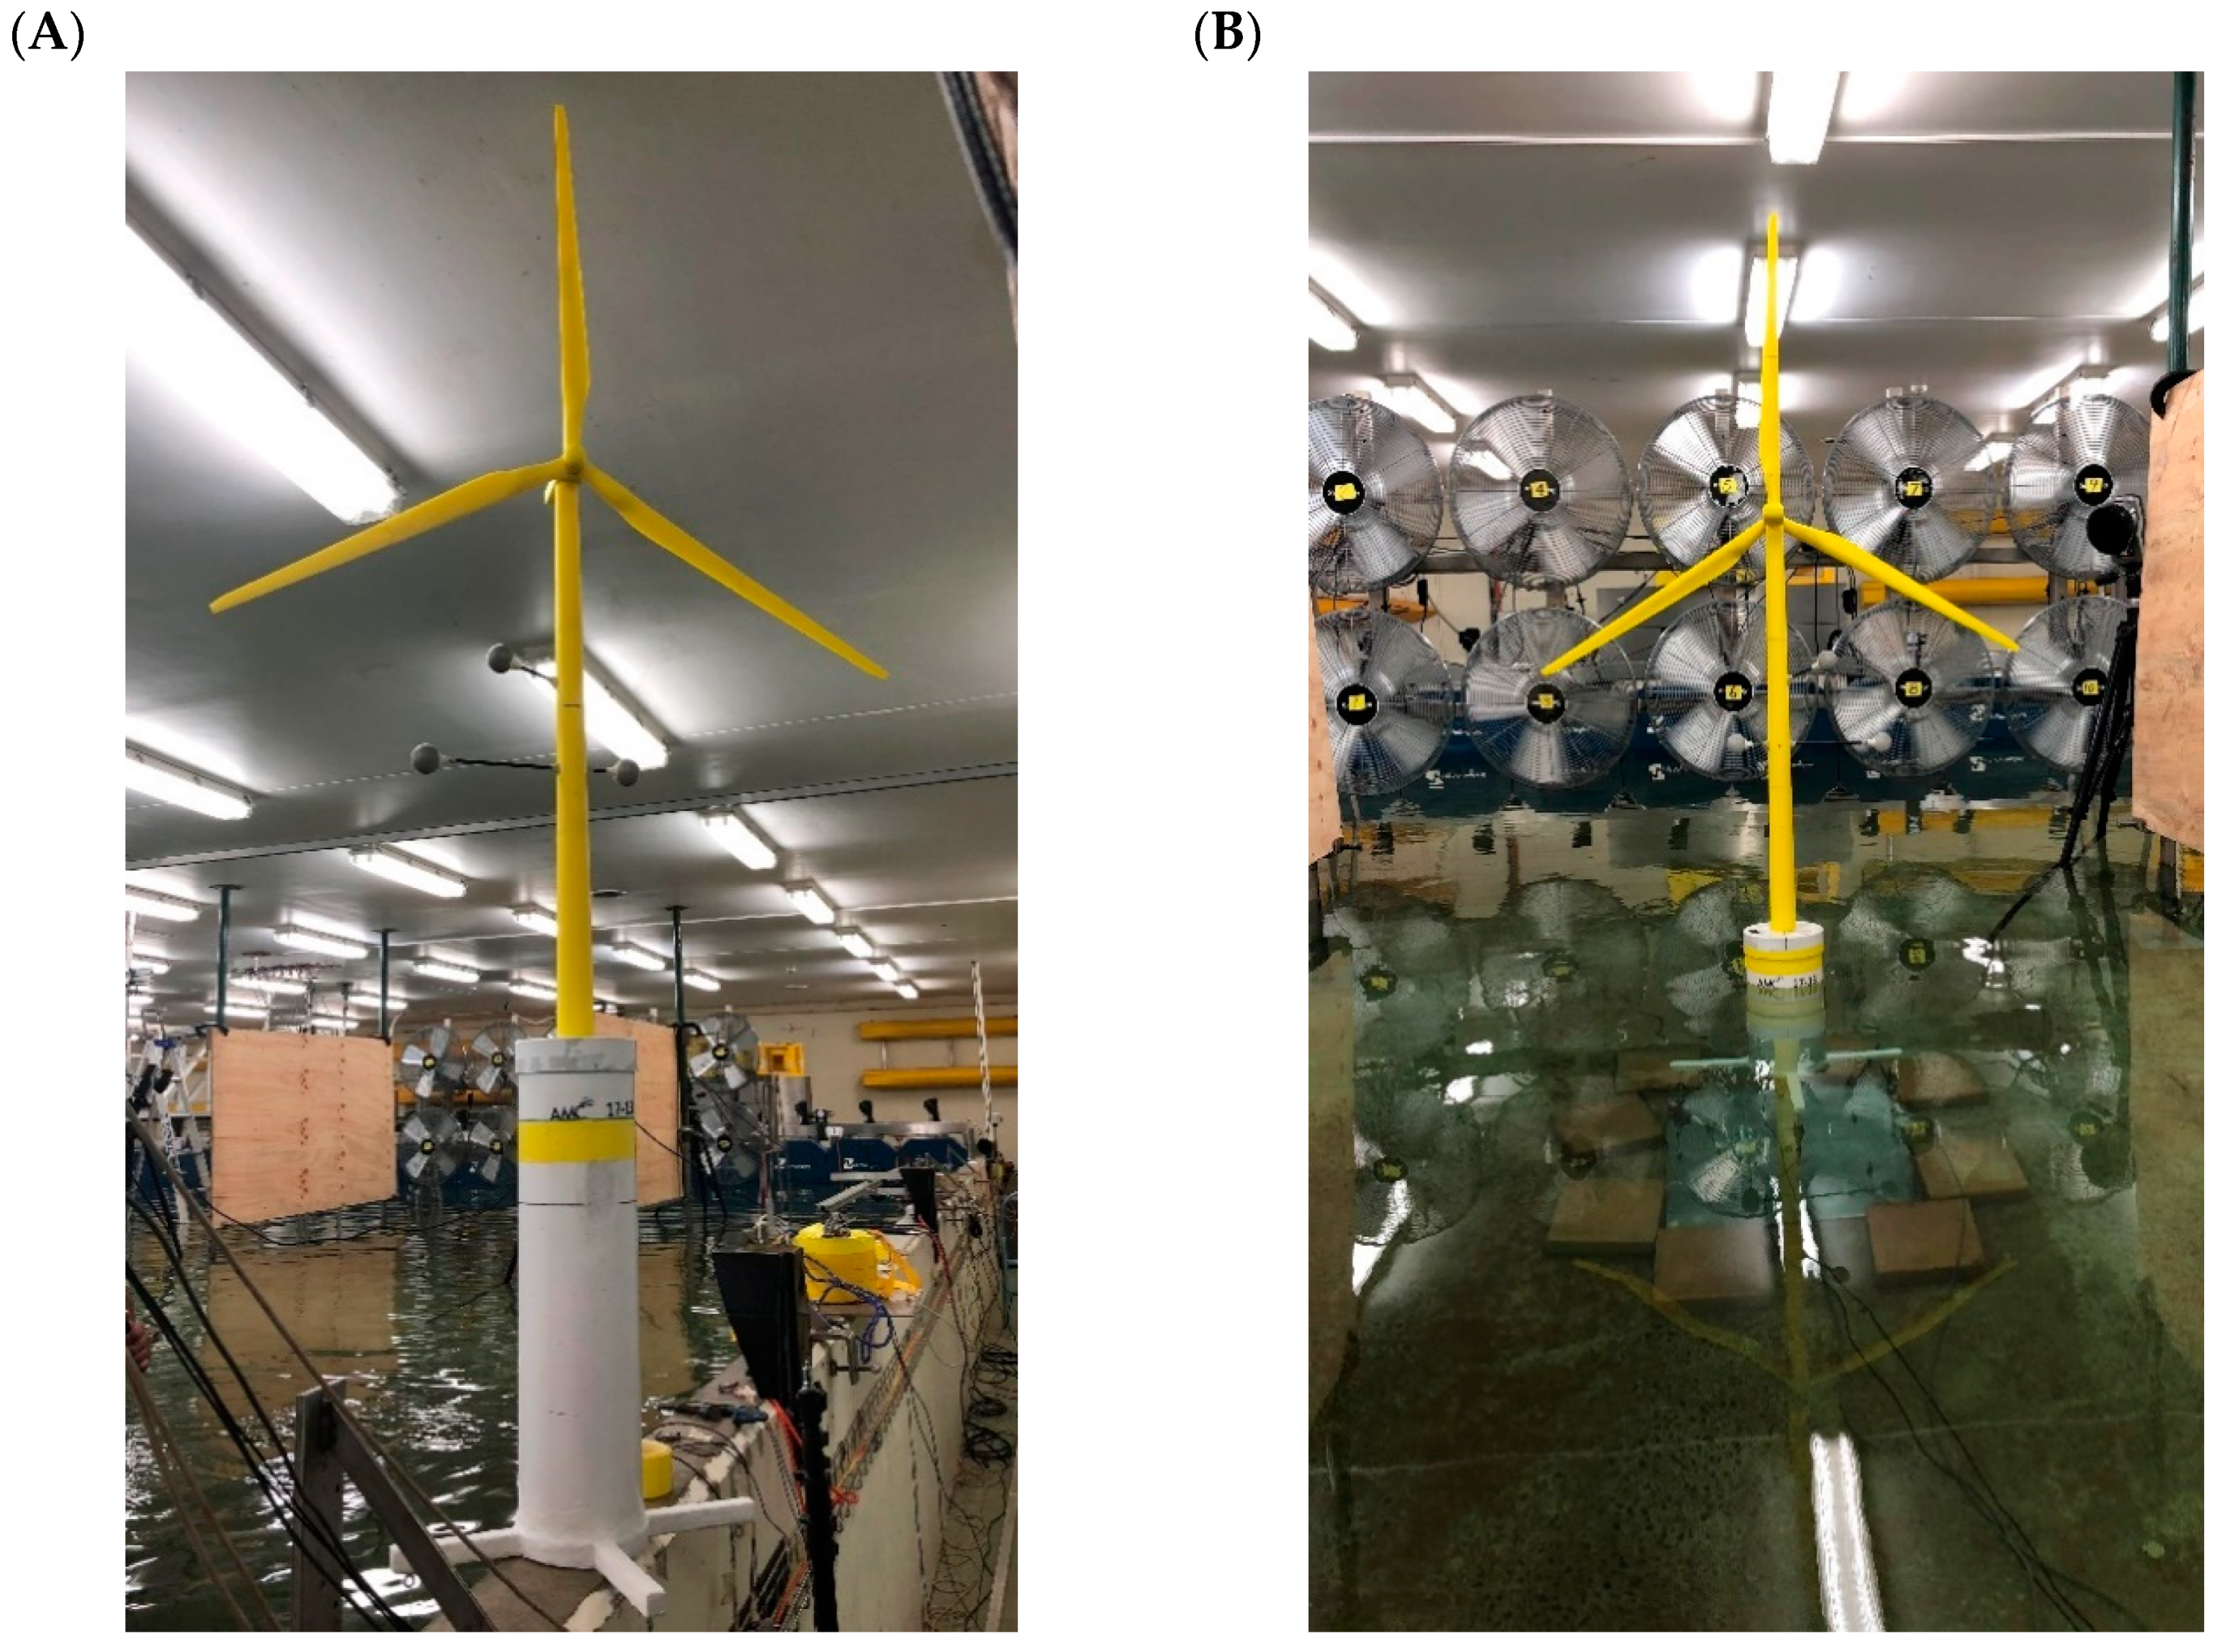
2.3. TLPWT Model Construction

The constructed TLPWT model is shown in Figure 1A. The materials that were used for each component of the model are also shown in Table 3, with their respective weights. To ensure the model was water-tight for the testing, silicon sealant and waterproof tape were applied to the model. These have not been explicitly stated but have been accounted for in the total weight of the model.
Figure 2 shows the arrangement of the tendons and equipment within them. Each of the tendon lines consisted of 7-strand, coated steel wire, each with a spring (spring constant of 16.8 N/mm) and load cell attached to record the tendon tension data. Two different types of load cells (LCs) were used during the experiment, with the forward and aft pontoons using Futek LCs, whilst the port and starboard pontoons consisted of X-Trans LCs. The induced tension on the forward and aft pontoons was increased to account for the variance in weight between the two LC models. To achieve the required draft, a tension load of 1.28 kg was induced into each line, then threaded through eyelets on the base-plate sitting on the floor of the basin.
Before the experiment was conducted, the vertical centre of gravity was verified experimentally. The TLP model and turbine topside were placed on a metal bar to measure the point of equilibrium, with the distance from the keel of the model to the point of equilibrium forming the KG. A computerised model of the physical TLPWT model was developed to determine the mass moments of inertia for the model, and the obtained results are presented in Table 4.

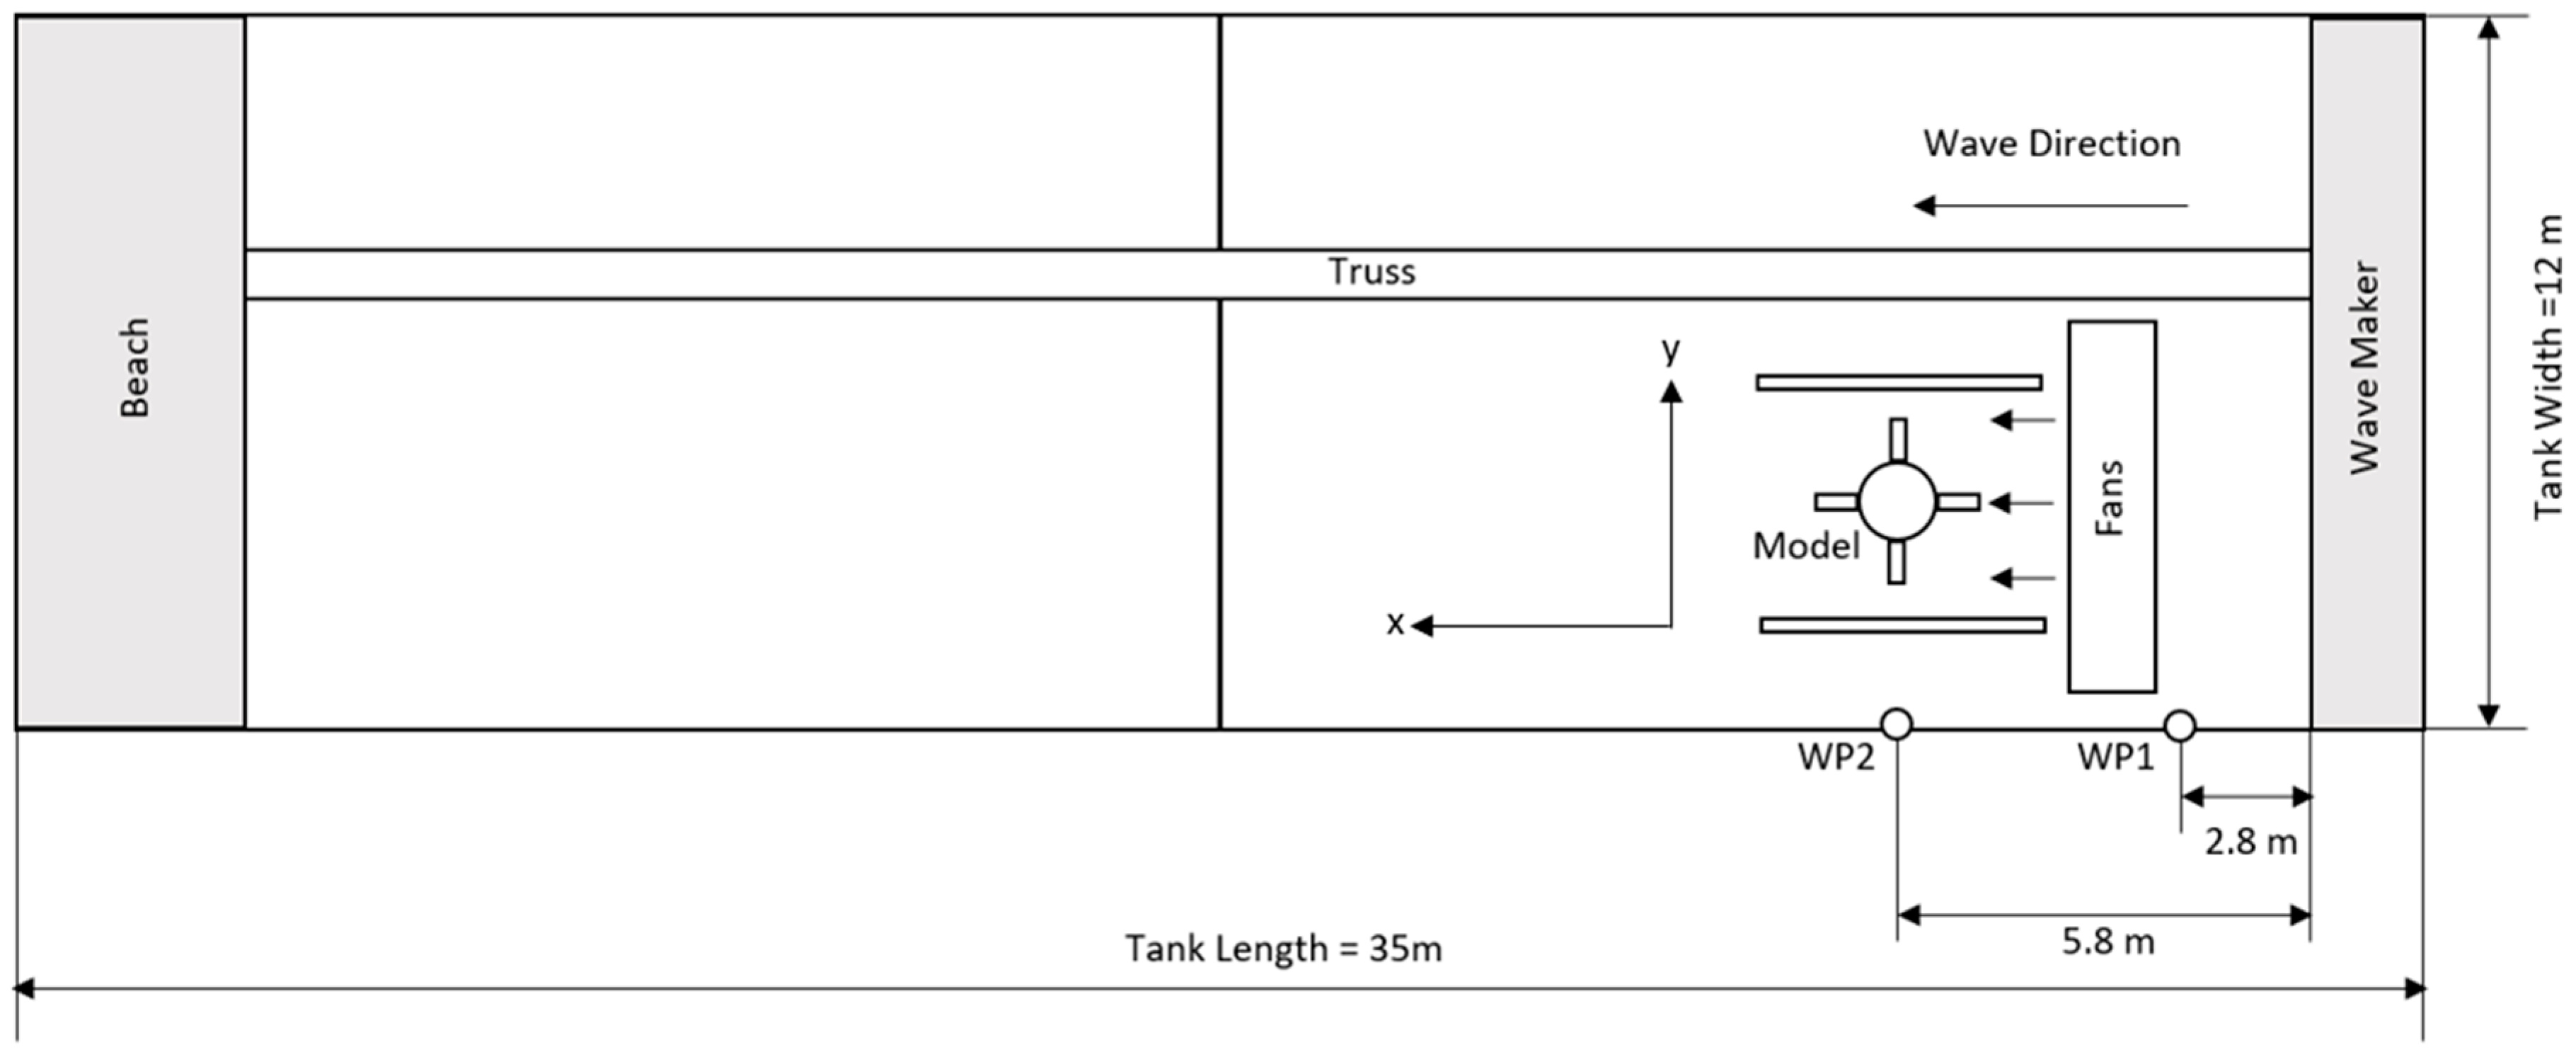
2.4. Experimental Setup and Test Matrix

The model testing was carried out in the Model Test Basin (MTB) at the Australian Maritime College (AMC). The MTB is 35 m long × 12 m wide (Figure 3), with a water depth of 0.9 m being consistent across all tests. This allowed for the best possible scaling of the model parameters and tendons considering the facility limitations. The model was placed at a distance of 5.8 m from the wave-maker such that the fan and motion capture system could be appropriately placed. Wave tank model tests may exhibit large experimental scatter due to wall interaction [19]. As such the centreline of the model’s column was positioned at approximately 3 m from the side of the basin which yields 18.75 times the column diameter. The fans were placed 2 m in front of the model to obtain the best possible air-flow, however this was not optimised for this experiment. While the TLPWT was in the basin, two wave probes (WP) placed along the side of the tank approximately 0.6 m from the wall, 2.8 m (WP1) and 5.8 m (WP2) away from the wavemaker, and 0.6 m off the basin wall were used to measure the wave elevations along the basin. As the wave height depends on the location of the wave probes, WP1 was employed for the wavemaker calibration whereas WP2 (in-line with the model) was employed to derive response amplitude operators. It is worth mentioning that the aspect of wave evolution along the physical wave tank is beyond the scope of this study. Several studies have recently been conducted on experimental waves generated in the model test basin of AMC and the quality of such waves along the basin has been documented in [13,38,39]. A digital Qualisys motion tracking system was used to measure all model motion response in six degrees of freedom [40]. The system consists of 8 cameras located around the test basin which provide the reference coordinates of the Qualisys markers placed on the model’s tower by picking up reflections of the markers from an infra-red signal. The coordinates are plotted in relation to the model’s VCG and accurately capture all motions during wave testing. A sampling frequency of 200 Hz was used in the data acquisition system.
The basis for the testing program was derived from the Bachynski and Moan [14] environmental condition 3 (EC3); representative of operational wind and wave conditions, with a significant wave height of 4.4 m, peak period of 10.6 s, and mean wind speed of 18.0 m/s at the turbine hub (Table 5). According to Bachynski and Moan [14], the EC3 represents an above-rated condition where the generator is operational. At model scale, this translated to a wave height of 0.039 m, peak period of 1 s and wind speed of 1.70 m/s. The test matrix for the model testing involved a series of regular wave runs, both with varying wave height and frequency conditions, to be repeated for conditions with and without wind present. The use of regular waves in model testing has been common in practice, as it provides a practical starting point towards more complex conditions such as testing in irregular waves. As seen in Table 6, test conditions 1–10 of the experiment involved changing the wave period (for T/Tp from 0.777 to 1.23) for ‘wind’ and ‘no-wind’ conditions, whilst conditions 11–20 analysed increasing wave height at the peak period of the EC3 wave spectrum (for H/Hs form 0.0.641 to 1.795). The corresponding values of wave length (L) estimated based on the dispersion relationship [36] yields a d/L range of 0.39 to 0.95 (i.e., intermediate to deep water conditions) and a D/L range of 0.07 to 0.17. As the D/L ratio (column diameter to wave length ratio) is below 0.2 (i.e., the limit of small structures), wave diffraction and reflection effects due to the model presence can be neglected [36,41]. As such the model was placed at a closer distance (5.8 m) from the wave-maker which was controlled by the wind quality that could be produced at the MTB.

3. Model Calibrations

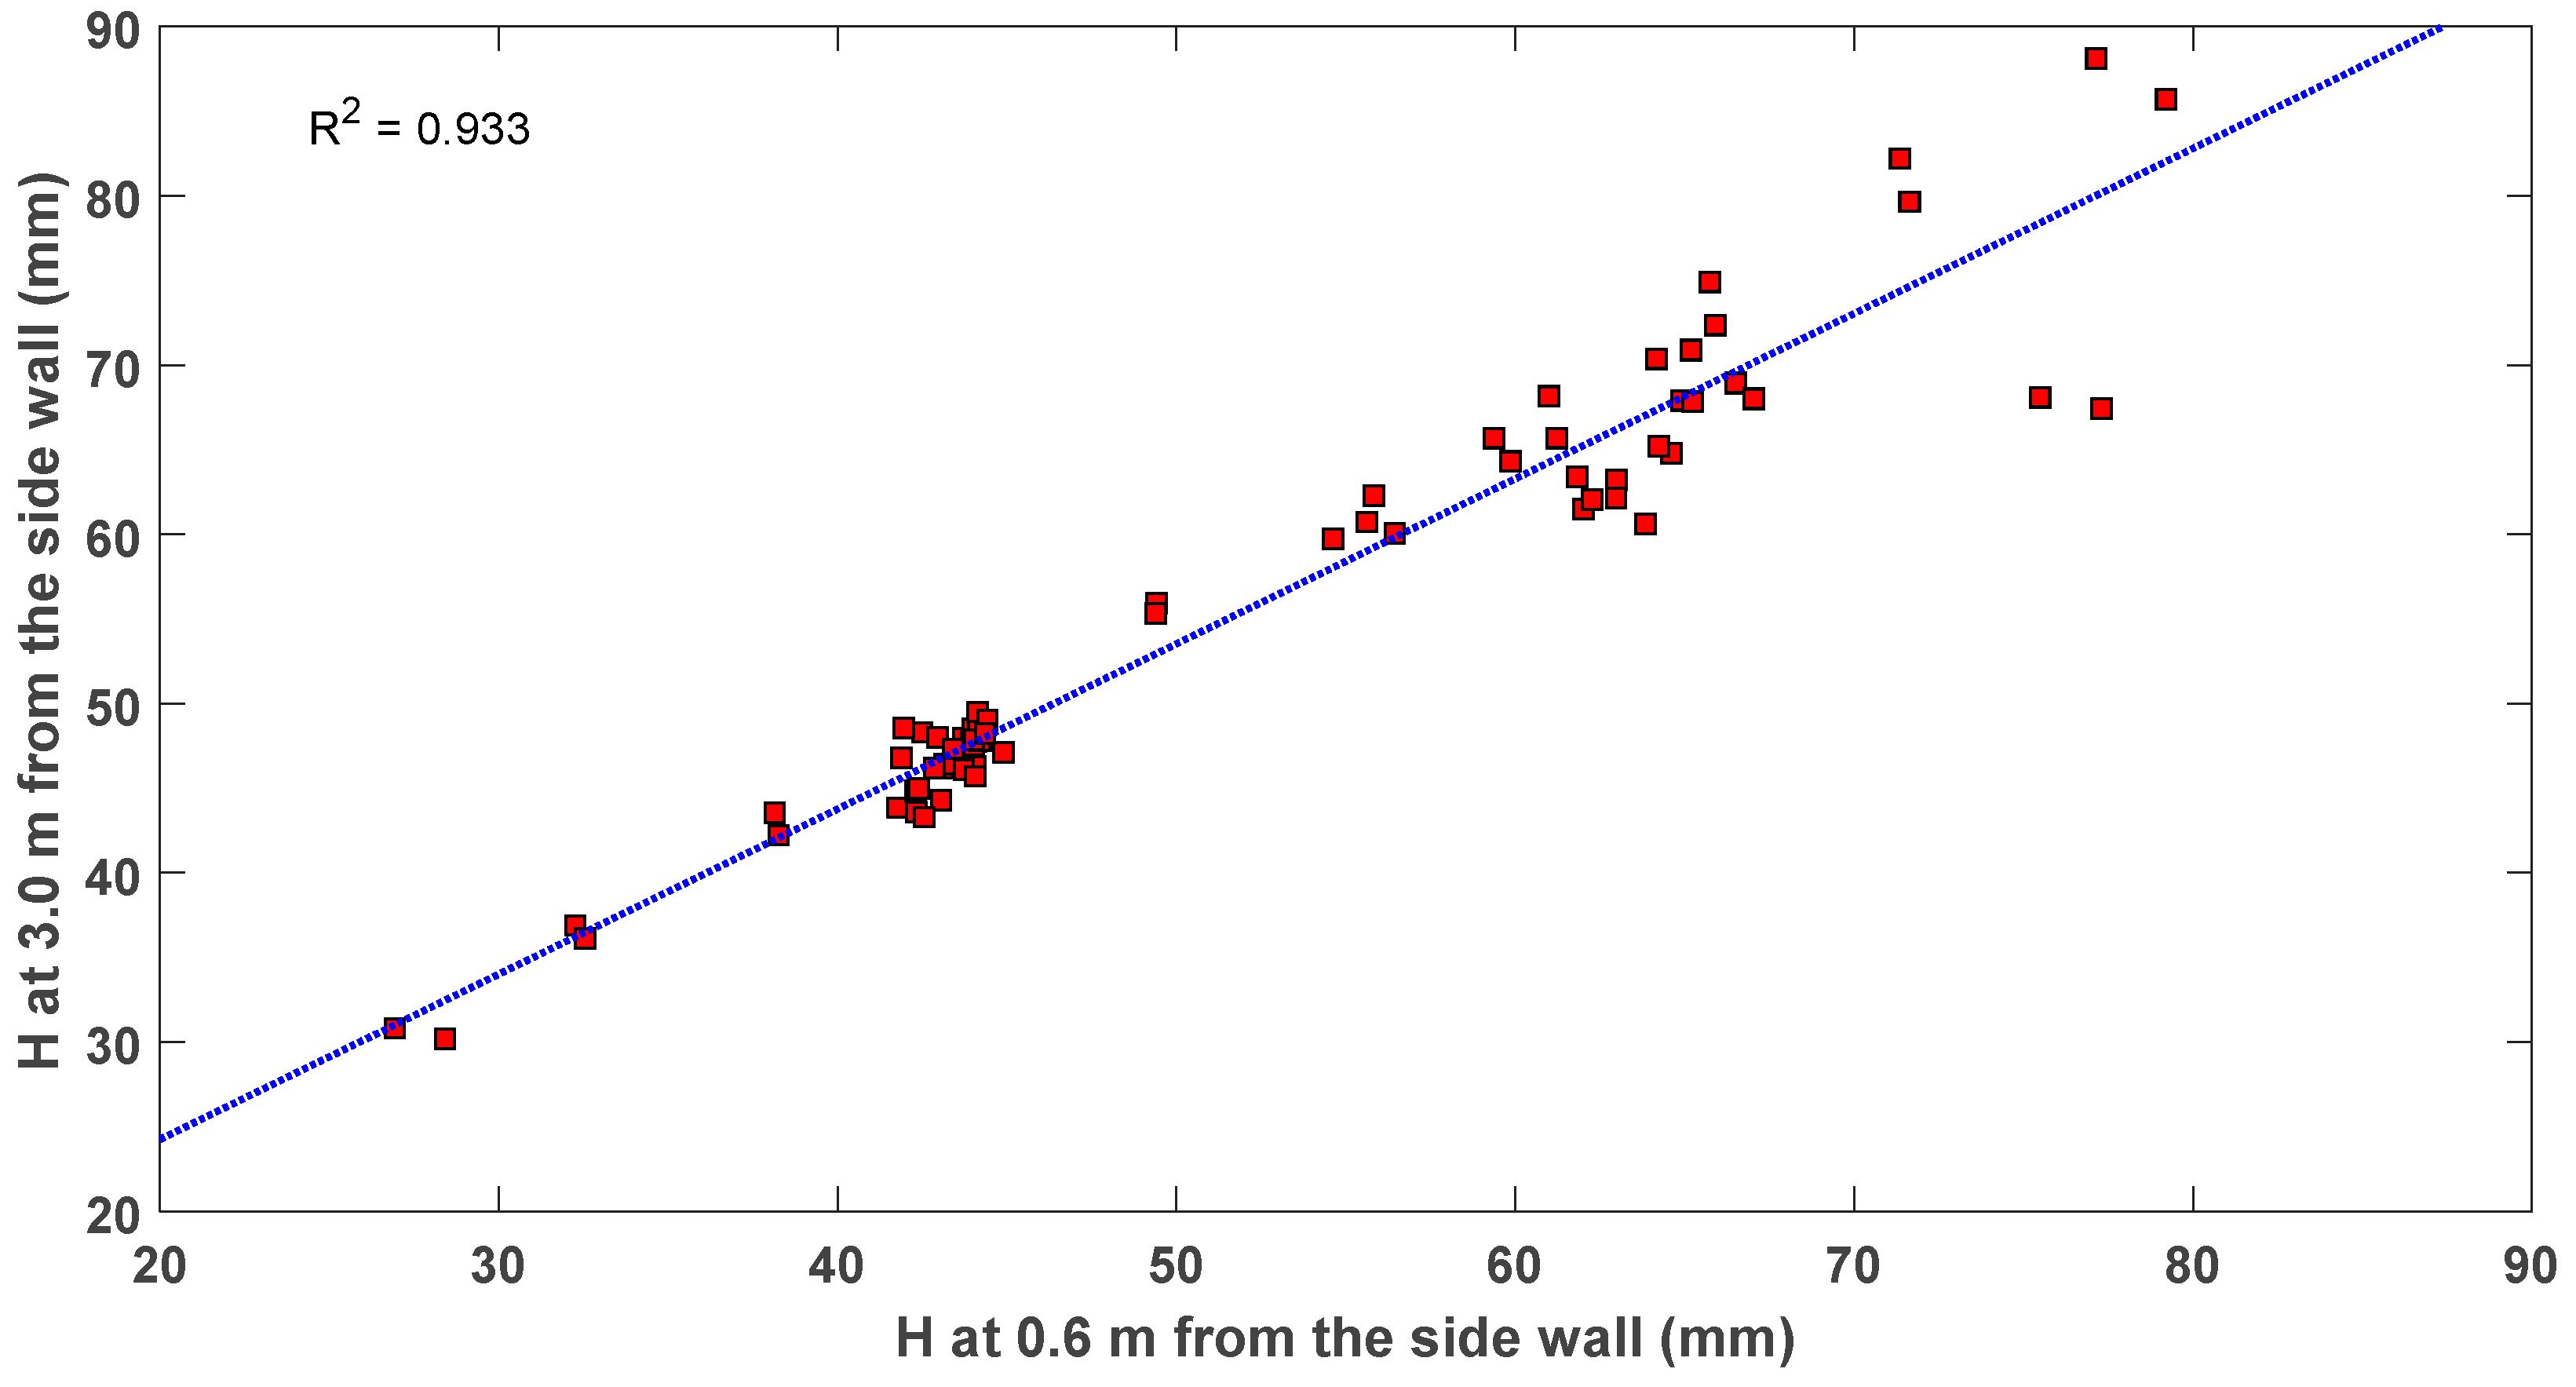
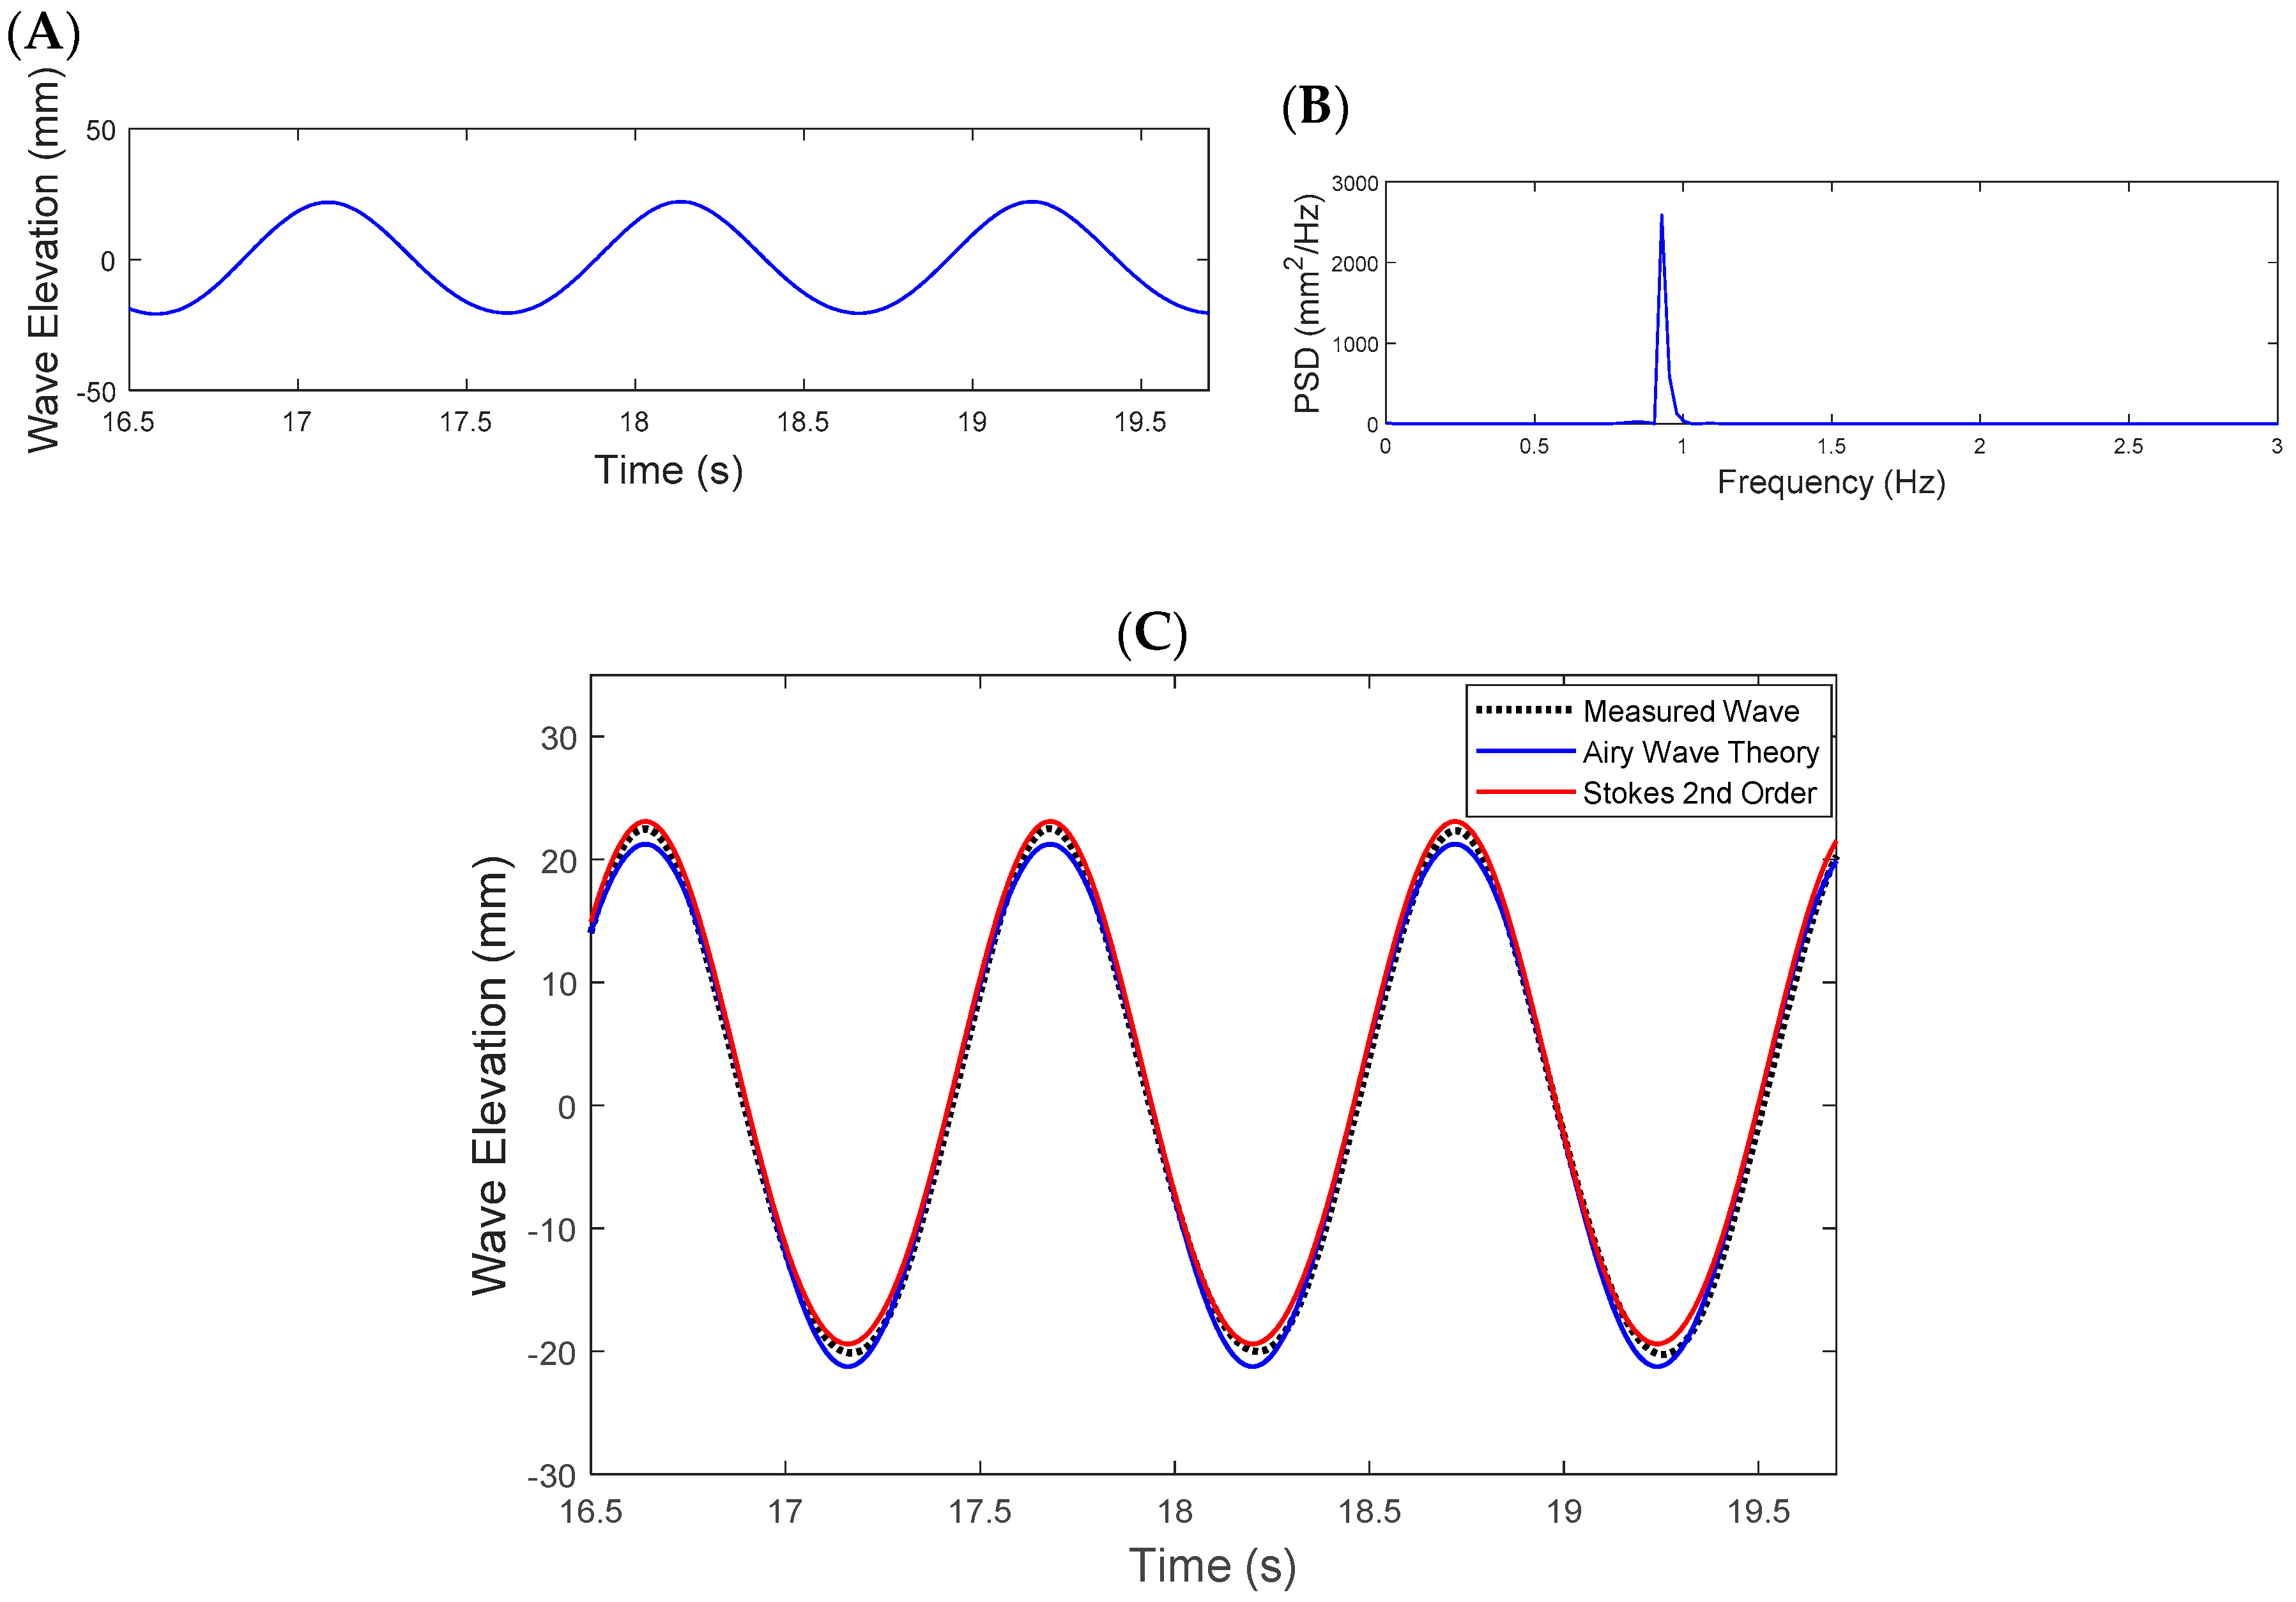
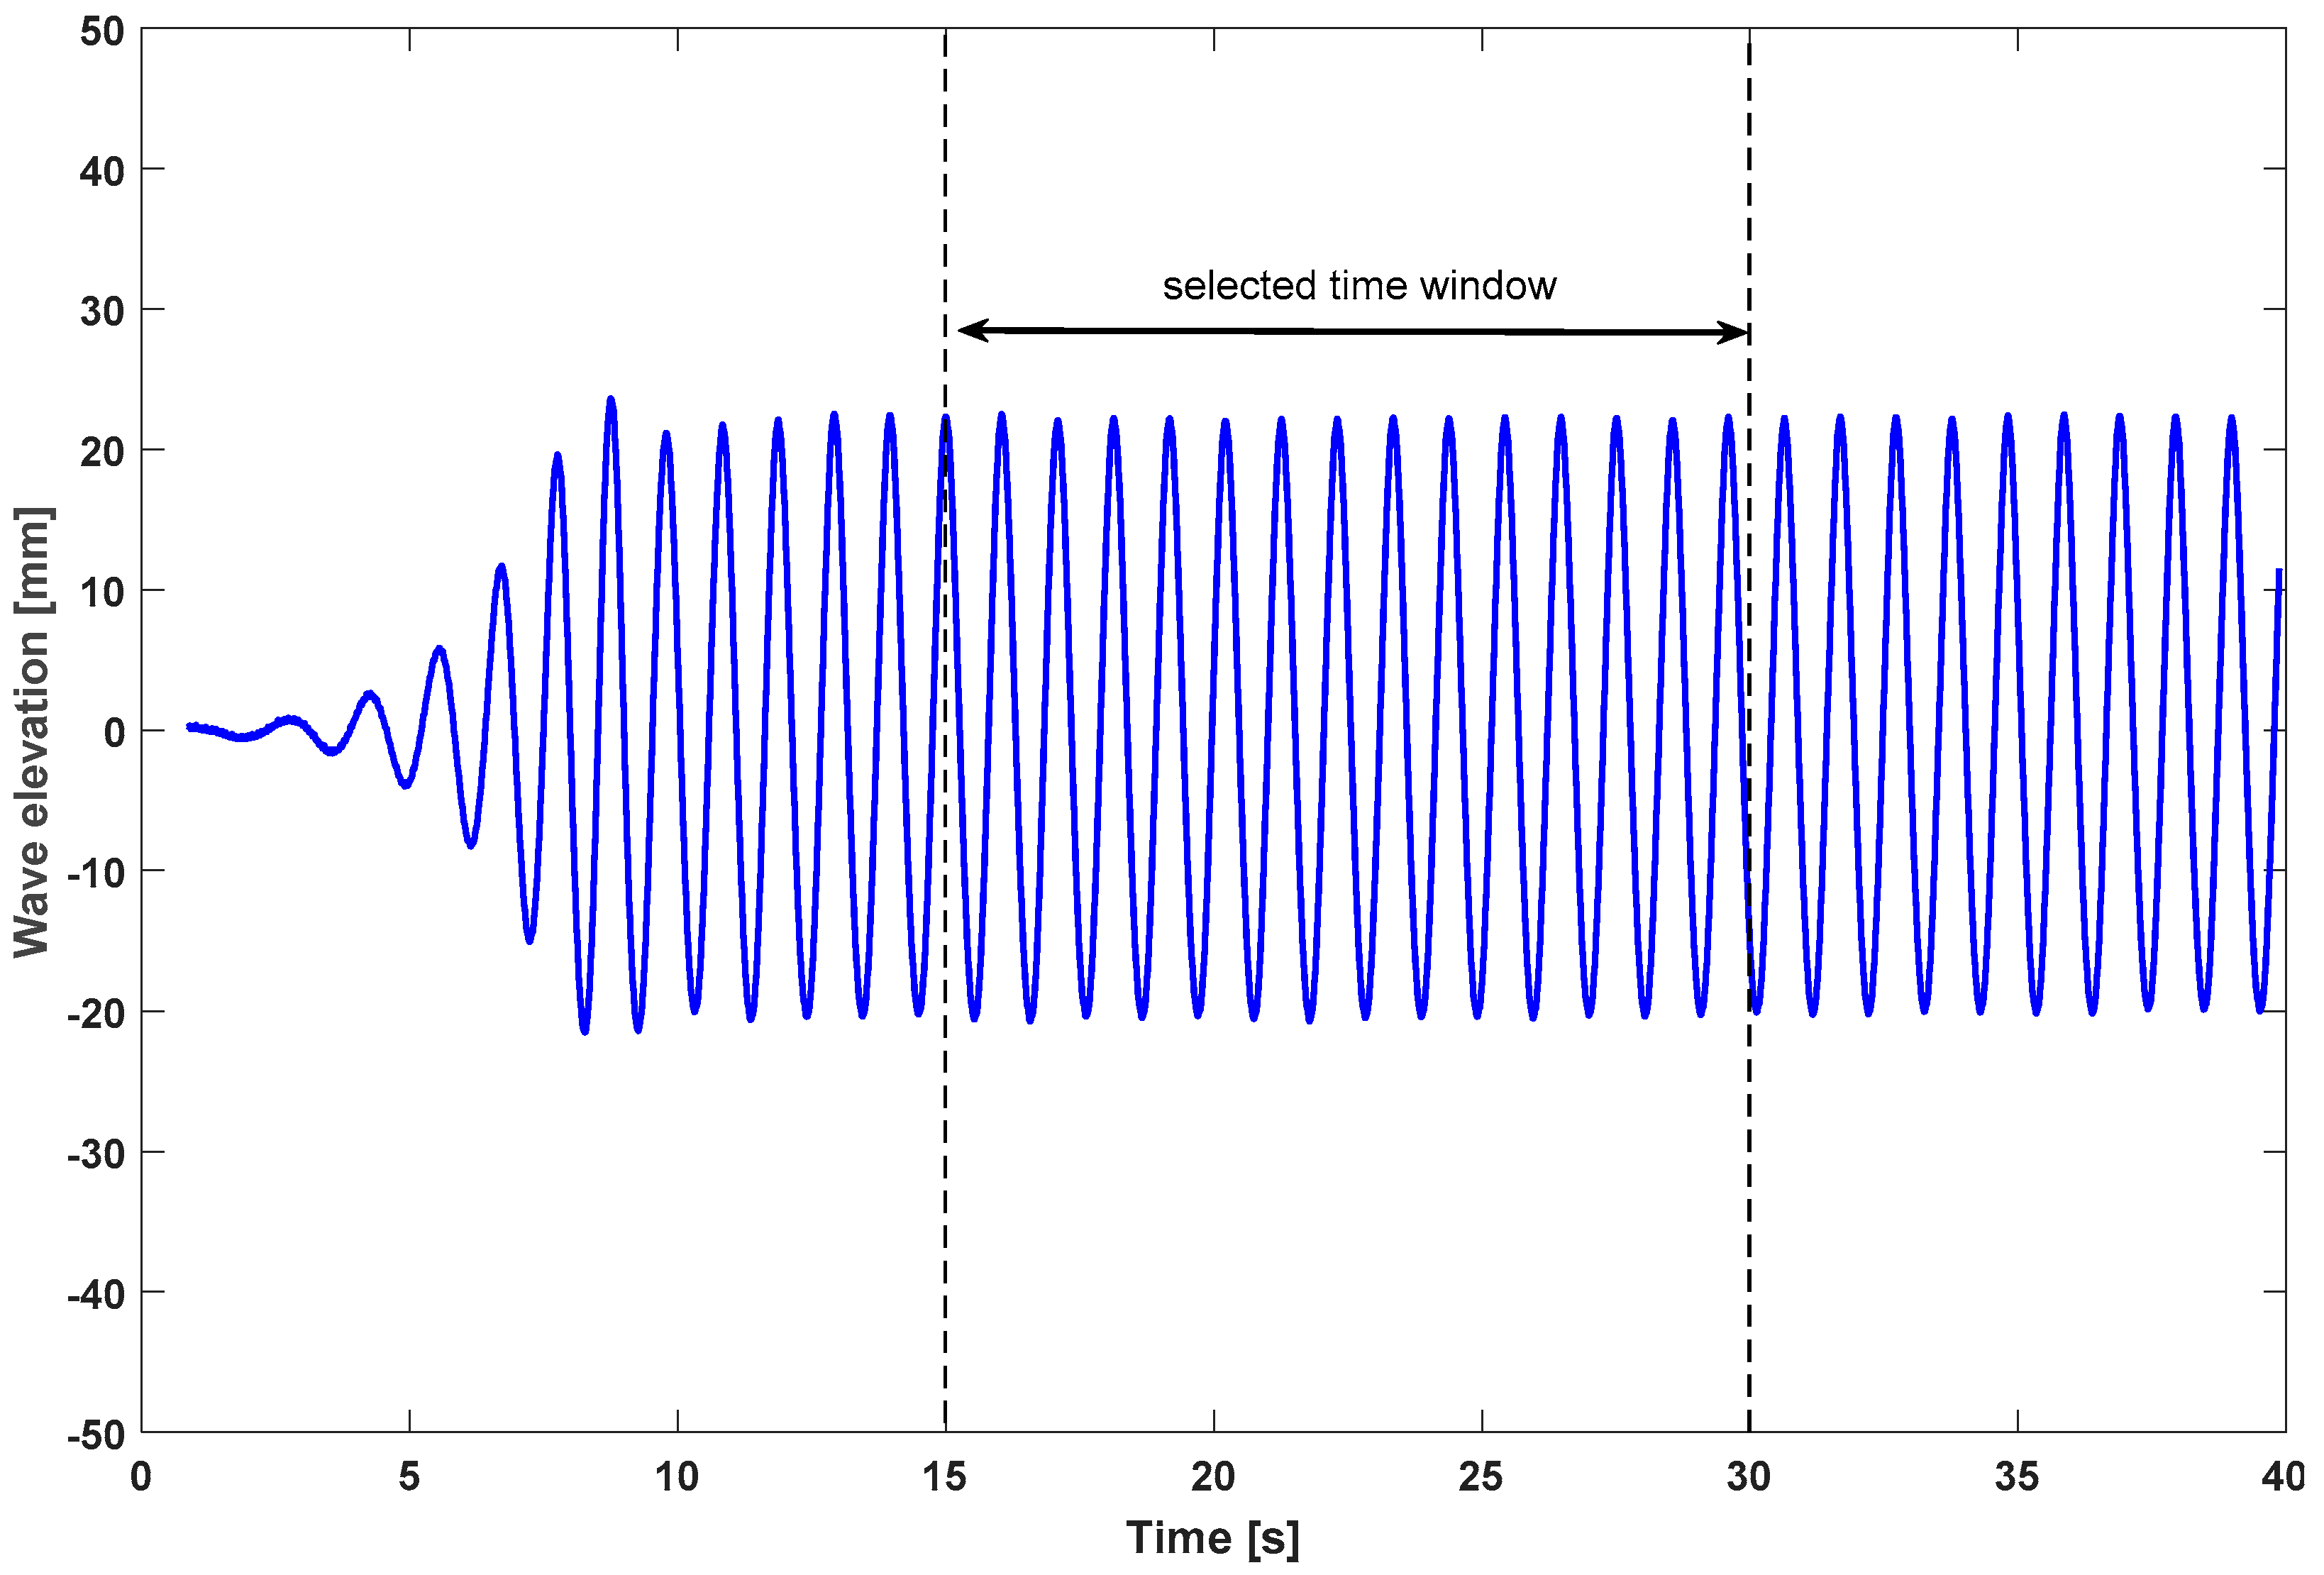
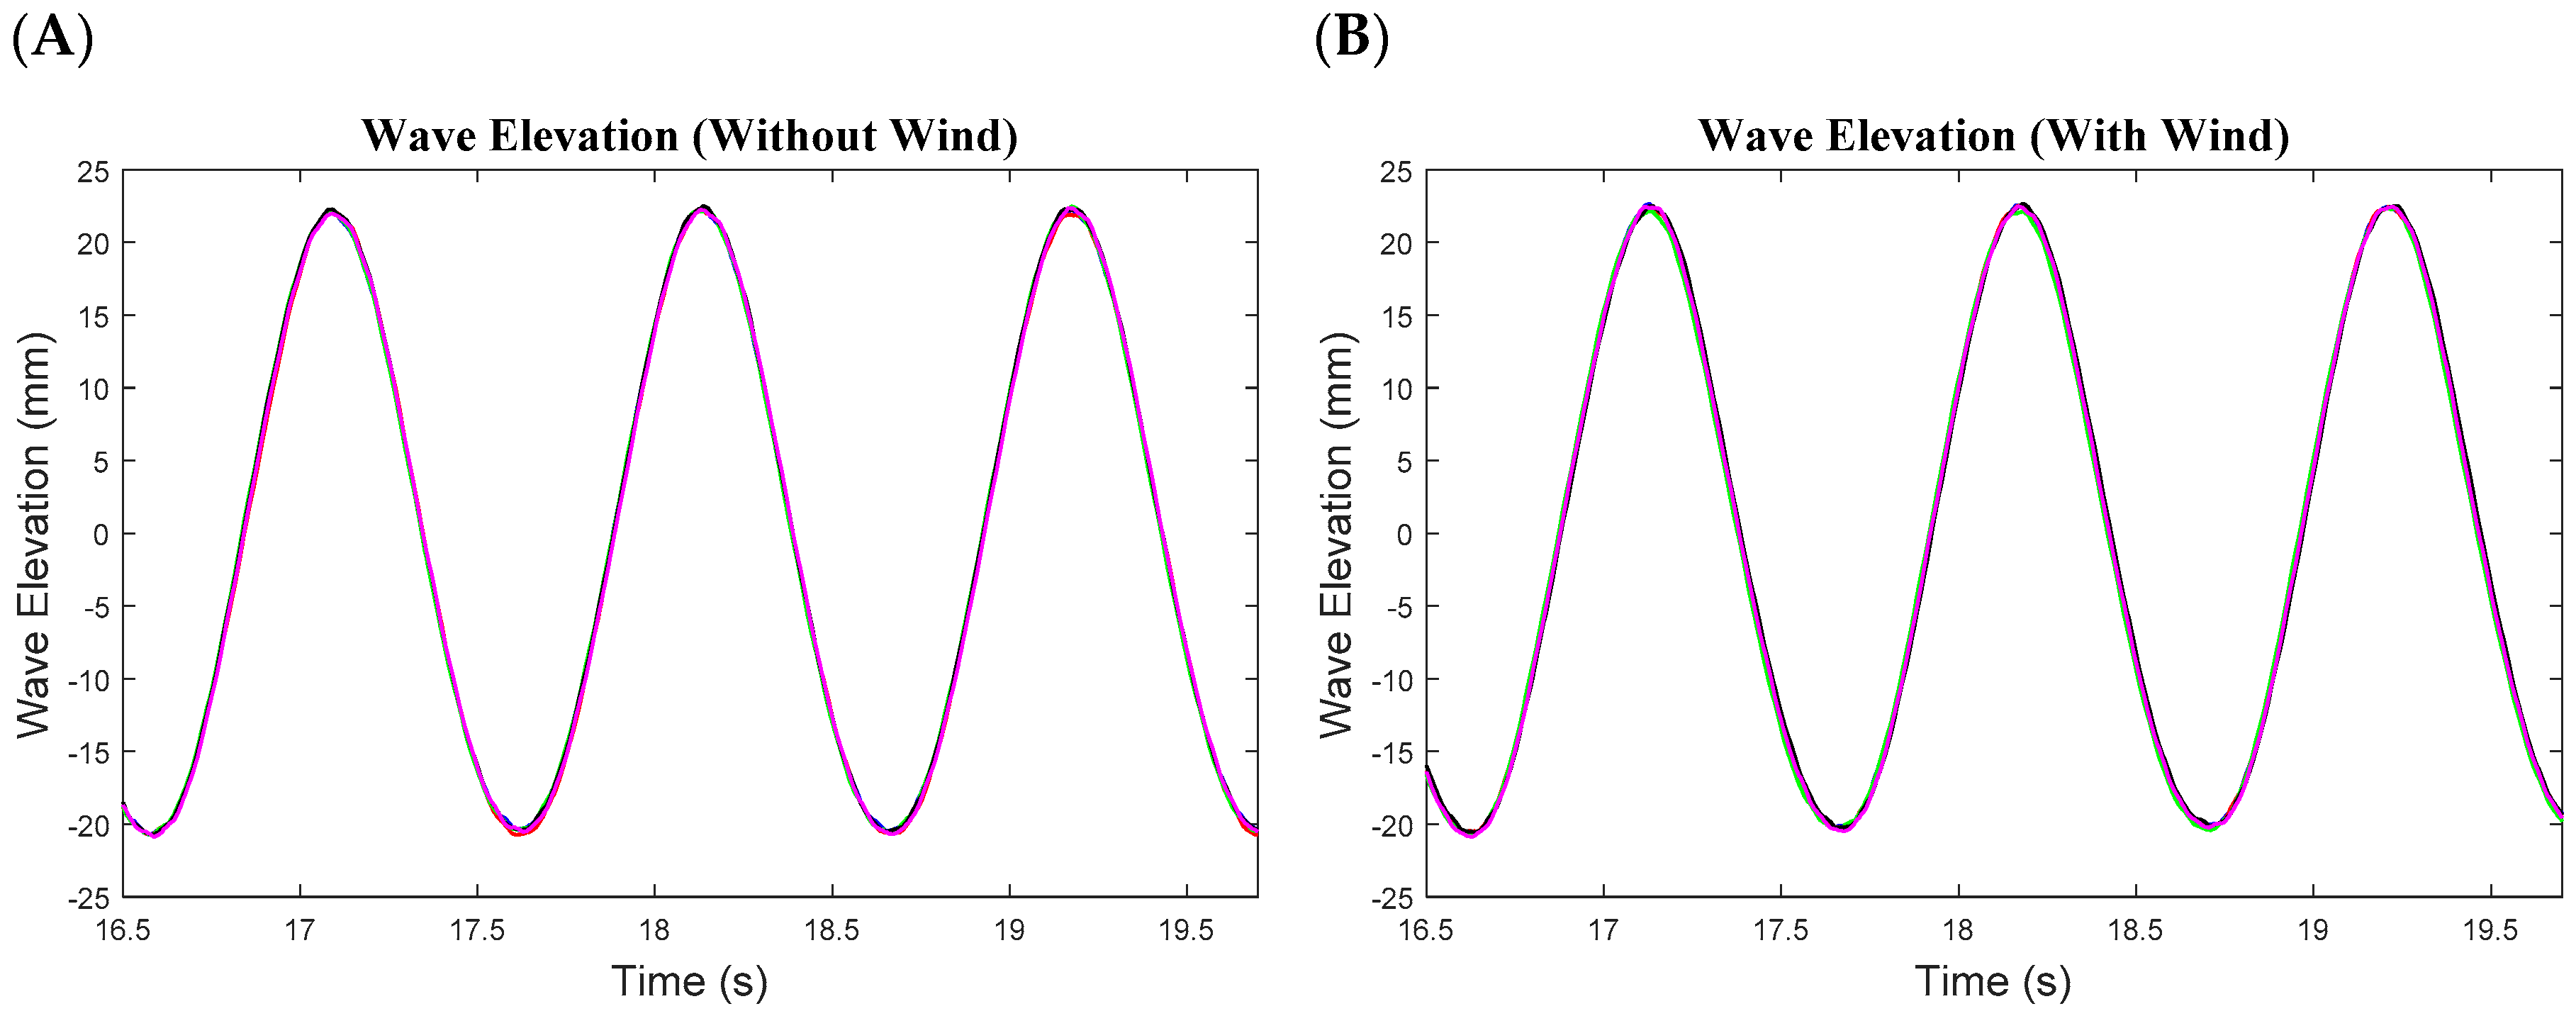
3.1. Wave Calibration

The wave probes used in the experiment were calibrated on daily basis by positioning them at identified heights in a still water condition and fitting a linear relationship to the corresponding measured voltage. Without the TLPWT being in the basin, the change in wave height across the basin was investigated using two wave probes, WP2 (0.6 m from the basin side wall) and the other one at the model’s virtual location (3.0 m from the basin side wall). As seen in Figure 4, the wave height measured across the tank at these two points was quite consistent; the deviation in data started at H > 60 mm. This reveals that the effects of the tank walls have negligible implications on the estimation of RAOs which were obtained using H ~ 40 mm (refer to Table 6). In comparison with wave theory, Figure 5 shows an example of a time-history of the waves for condition 5 as recorded by WP2 (0.6 m from the basin side wall). The Power Spectral Density (PSD) graph was generated from this time-series which shows a peak wave frequency of 0.959 Hz (T = 1.043 s). Upon comparing the obtained wave elevation to the Airy and Stokes 2nd order wave theories, as expected the measured waves exhibited more and less as Stokes 2nd order, with slight differences in the magnitudes of the peaks and troughs as shown in Figure 5C.

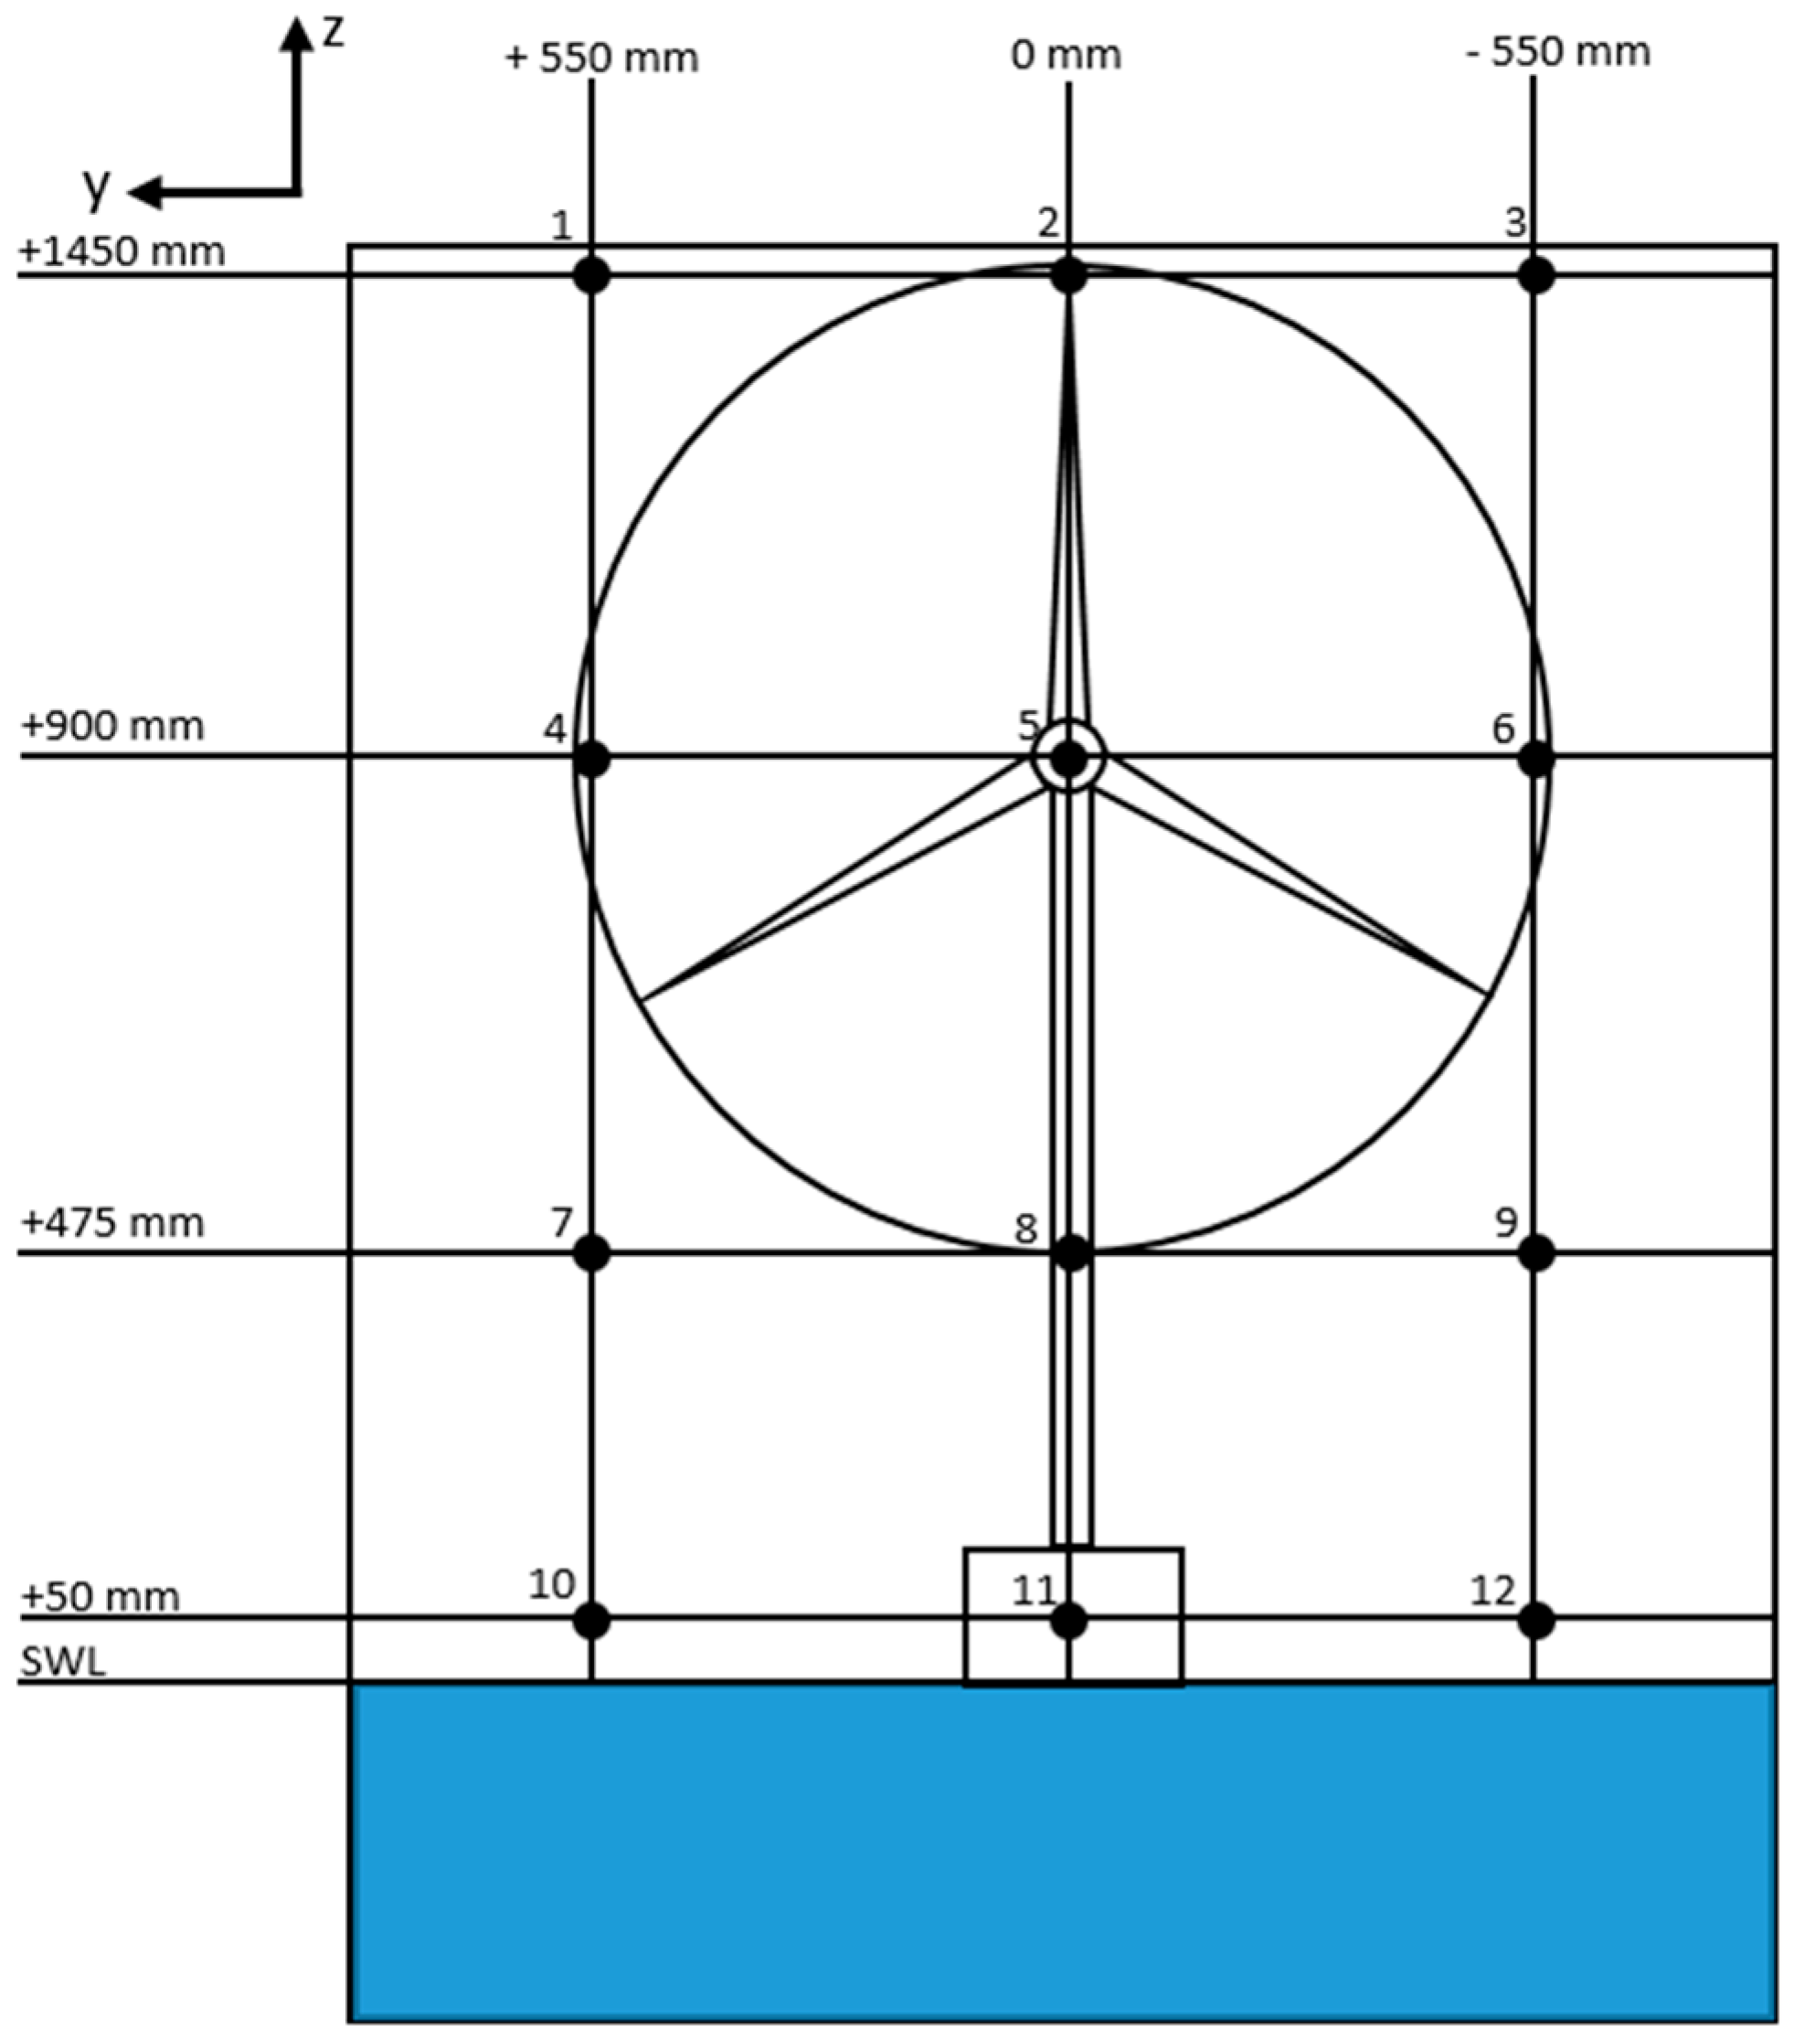
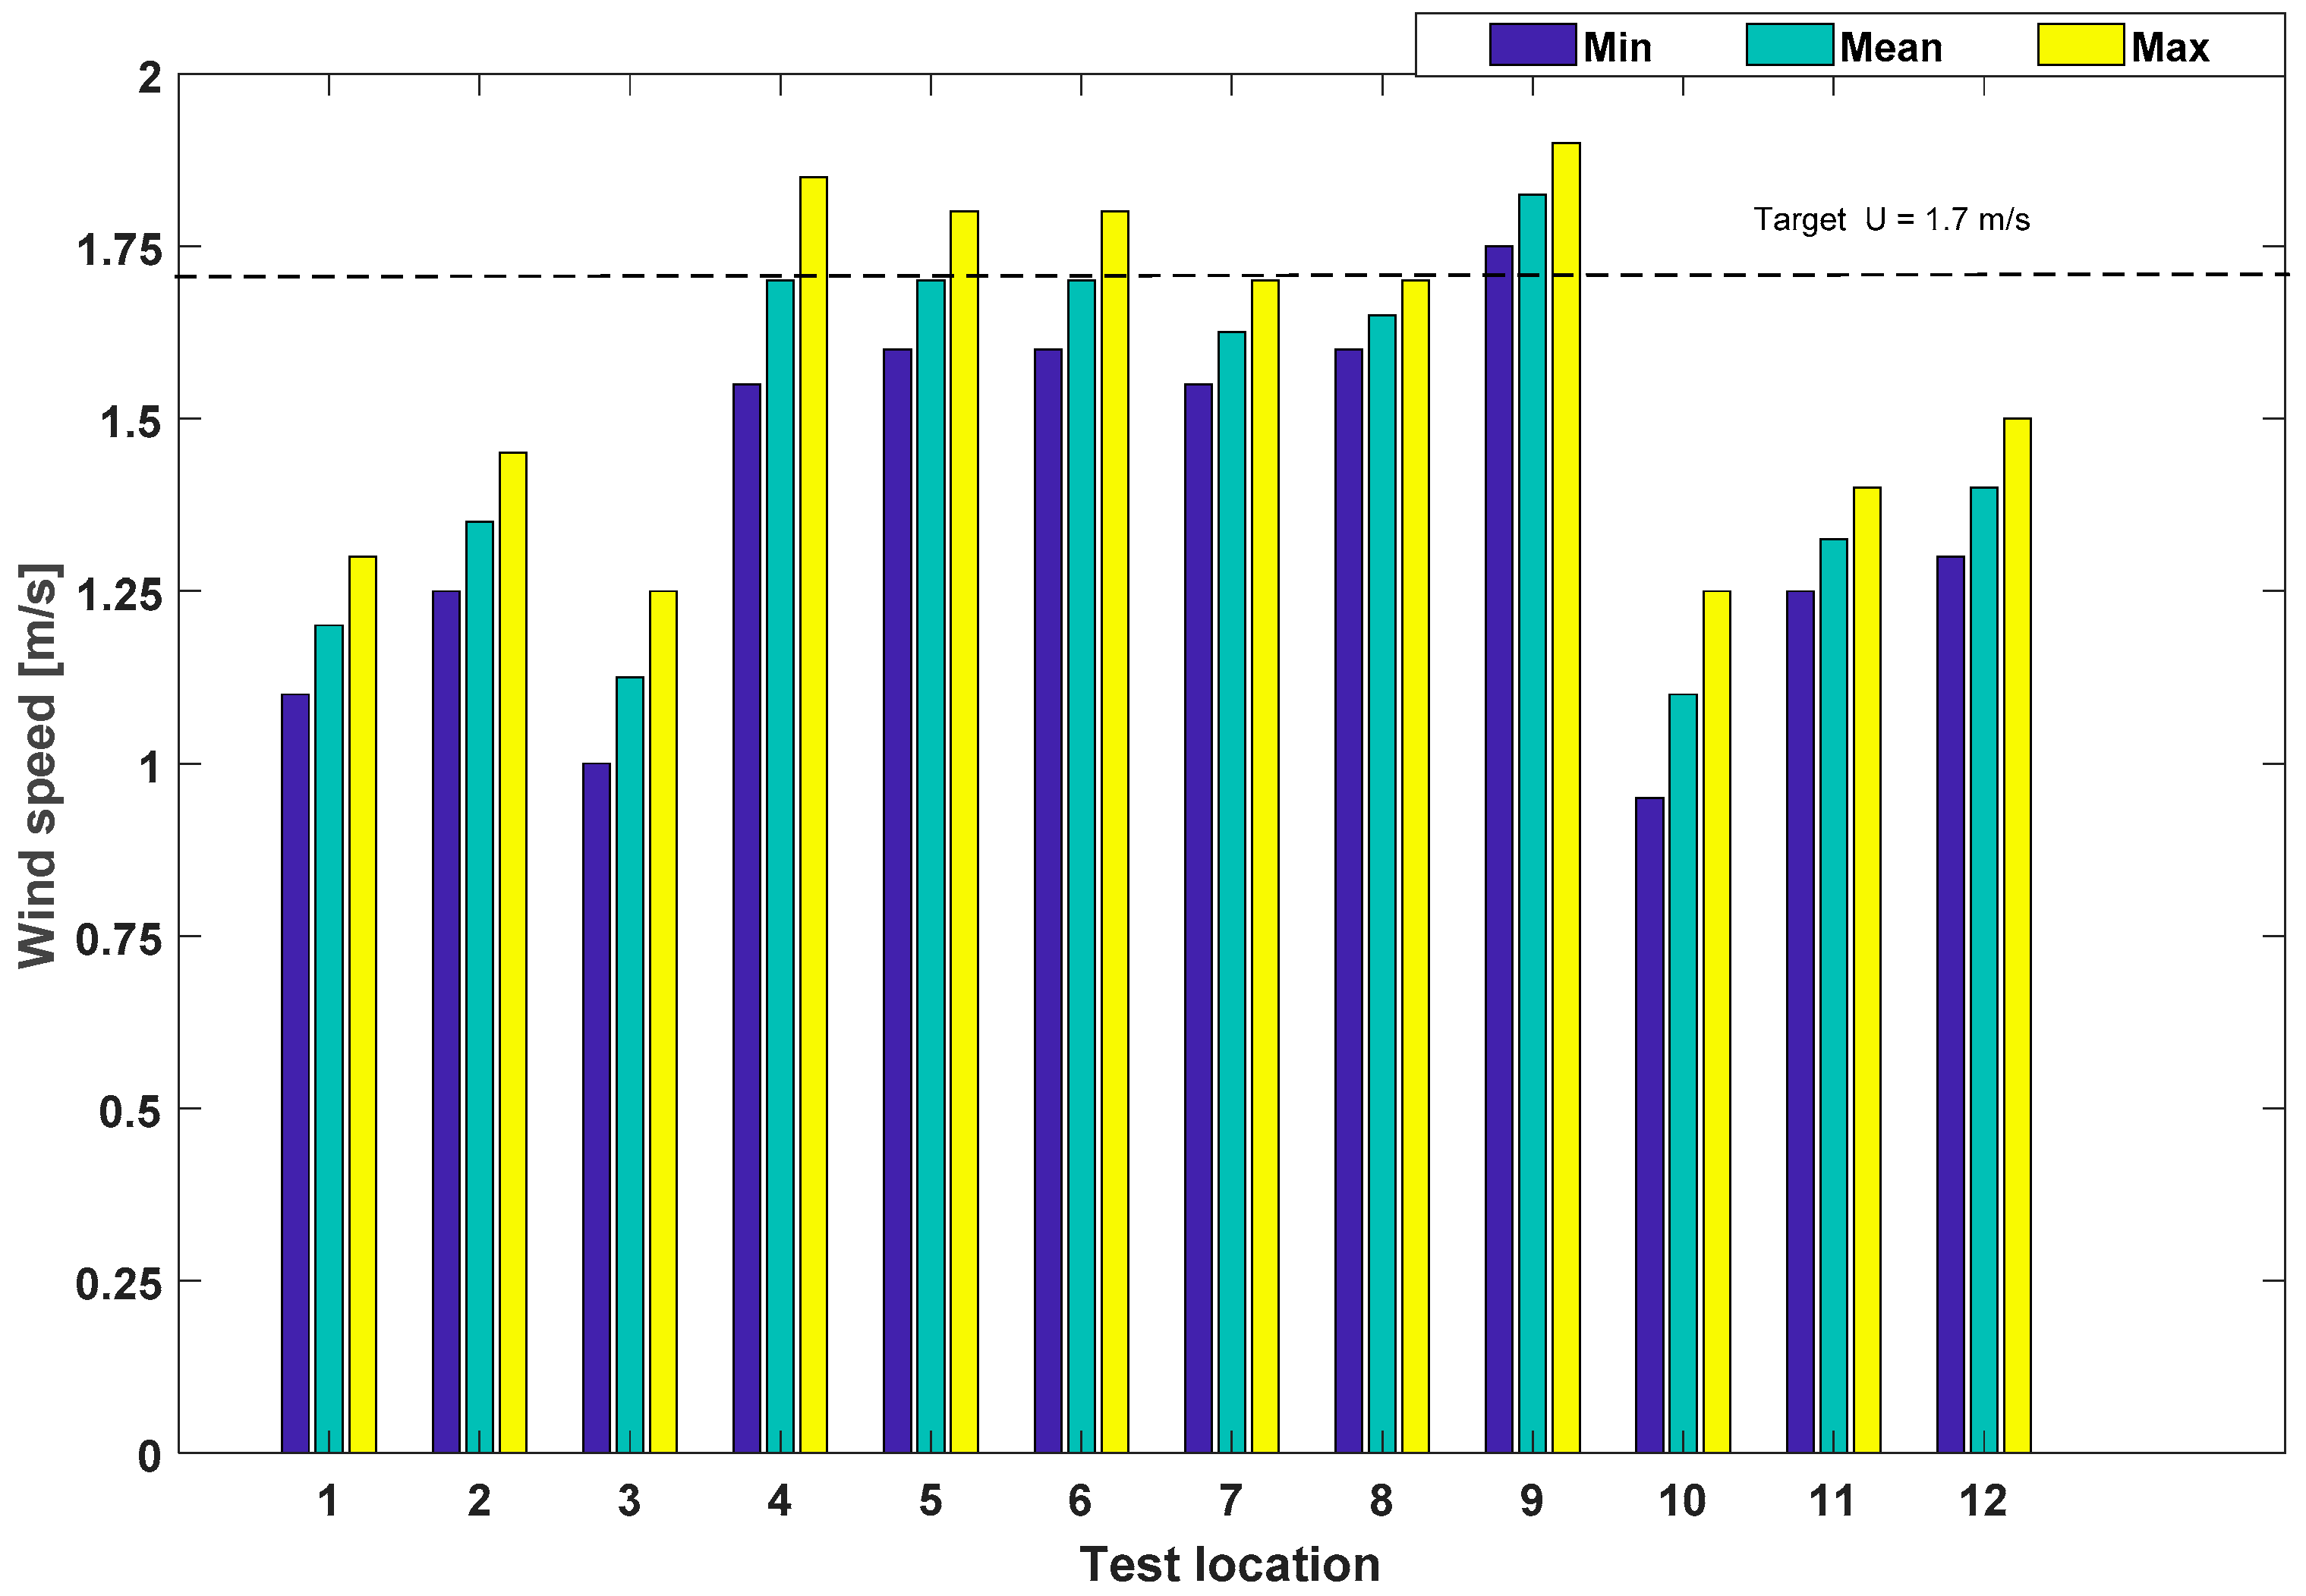
3.2. Wind Calibration

The wind generation was performed by using an array of fans placed 2 m in front of the model. For this experiment, a single wind speed was tested to understand the differences in model motion compared to a ‘no-wind’ condition. As already mentioned, the tested wind speed was based on the environmental condition 3 (EC3) from Bachynski and Moan [14] as a representative operational wind condition. The wind speed was scaled in line with the model scaling, resulting in an input wind speed of 1.70 m/s. To measure the mean wind speed, a hand-held anemometer was used to assist in calibrating the fans to achieve the best possible representation of the scaled wind speed. Figure 6 shows the different recording locations for wind speed, whilst Figure 7 shows the recorded wind speeds at each location, after a three-minute period of monitoring. It should be noted that the anemometer used for the testing did not have time-series data collection capabilities, thus the recorded range is based on visual observations of the wind speed reading. From Figure 7 the calibrated wind speed was closest to the target wind speed (U) of 1.70 m/s at the recording points located near the turbine hub (locations #4–9). Further away from the hub, the wind speed was not as accurate, however this had less bearing on the results due to less impact on the structure.

3.3. Free Decay Tests

Decay tests were performed on the TLPWT model in the heave, pitch, surge, and yaw directions to estimate the natural periods of the structure. The surge and yaw directions (Figure 8A,B) were obtained from the motion capture, whilst the heave and pitch natural periods (Figure 8C,D) were found using the dynamic tension in the tendon load cells. A single impact load on the model allowed for the most accurate measurement in each direction. The logarithmic decrement method was used for the most consistent signal for each test, checked against the spectral method using a Fast Fourier Transform (FFT). From these tests, it was found that the heave and pitch natural periods of 0.256 s and 0.260 s were very similar. The full-scale surge and pitch natural periods were consistent with the results of Oguz et al. [28] despite the difference in the tested water depths. The full-scale values obtained for surge, heave and pitch were all outside the typically experienced wave periods of 6–20 s [19], whilst yaw fell inside this range. The evaluation for yaw is significant in the selection process for TLPWTs. For full-scale turbines, yaw control of the nacelle is typically used to orient the turbine towards the predominant wind direction, which could lead to an increase in yaw motion if excited by wave motion.
The natural periods evaluated from the decay tests have a relatively close agreement to the theoretical values using equations from DNV-RP-C205 [36] and Naess and Moan [42]. It was found that the heave and yaw errors were the most significant at 20.2% and 15.2% exactly, whilst surge and pitch were more accurate with 1.68% and 6.99% error, respectively (Table 7).

3.4. Data Analysis

The time series of the data was collected with a sample frequency of 200 Hz for a collection period of 40 s. Due to the disturbance caused by the start-up condition of the wavemaker (the initial transient periods in Figure 9) and reflected waves travelling back up the tank, a steady state period of fully developed waves was selected for analysis in each run. The steady state period to be analysed was first determined by examining and trimming the phase wave probe data (WP2), and subsequently trimming the motion data relative to the trimmed WP2 data. An example of this process in presented in Figure 9 where the vertical lines represent the range of data to be trimmed.
According to DNV-RP-C205 [36], the repeatability analysis of tank measurements should be documented. A repeatability analysis was performed across all data recording platforms to understand the variability of results from run to run. The generated wave data, load cell data, and motion response data for condition 5 were compared for five repeated runs with identical input wave parameters with and without wind. For the motion response data, the surge motion (denoted by X) was analysed, as it experienced the most significant motions of any direction. Figure 10A,C,E show the time-series data for wave elevation, dynamic tendon tension (i.e., the pretension was subtracted from the total tension), and surge motion for the wave only condition, whilst Figure 10B,D,F show the runs inclusive of wind.
By referring to the details of data variances shown in Table 8 and Table 9, it can be appreciated that the wave elevation and surge motion variation between each run was within expected limits, with a maximum coefficient of variance (CV) and a maximum Normalised Root Mean Square Error (NRMSE) of 0.99 and 0.91%, respectively. Furthermore, a cross-correlation R2 was obtained for the collected time series data in which the minimum R2 was 0.9745 for the tendon tensions of LC3. The load cell data encountered slightly more noise, particularly for the wind assisted conditions with a maximum CV of 5.23% (4.97% NRMSE) for the minimum tension values. The minimum tension demonstrated a large variability, which could be caused by the dynamic response in the tendons [43]. Overall, the maximum and minimum tensions were consistent between wave peaks and runs, resulting in usable data for analysis. These findings were also supported by a previous work [12,38,43,44] conducted at a smaller scale (1:125) which has indicated that good qualitative repeatability can be achieved among multiple repeated runs for all wave probes, Qualisys system and load cells used in their model tests such that lower values of CV were obtained during model calibrations.

4. Results and Discussion

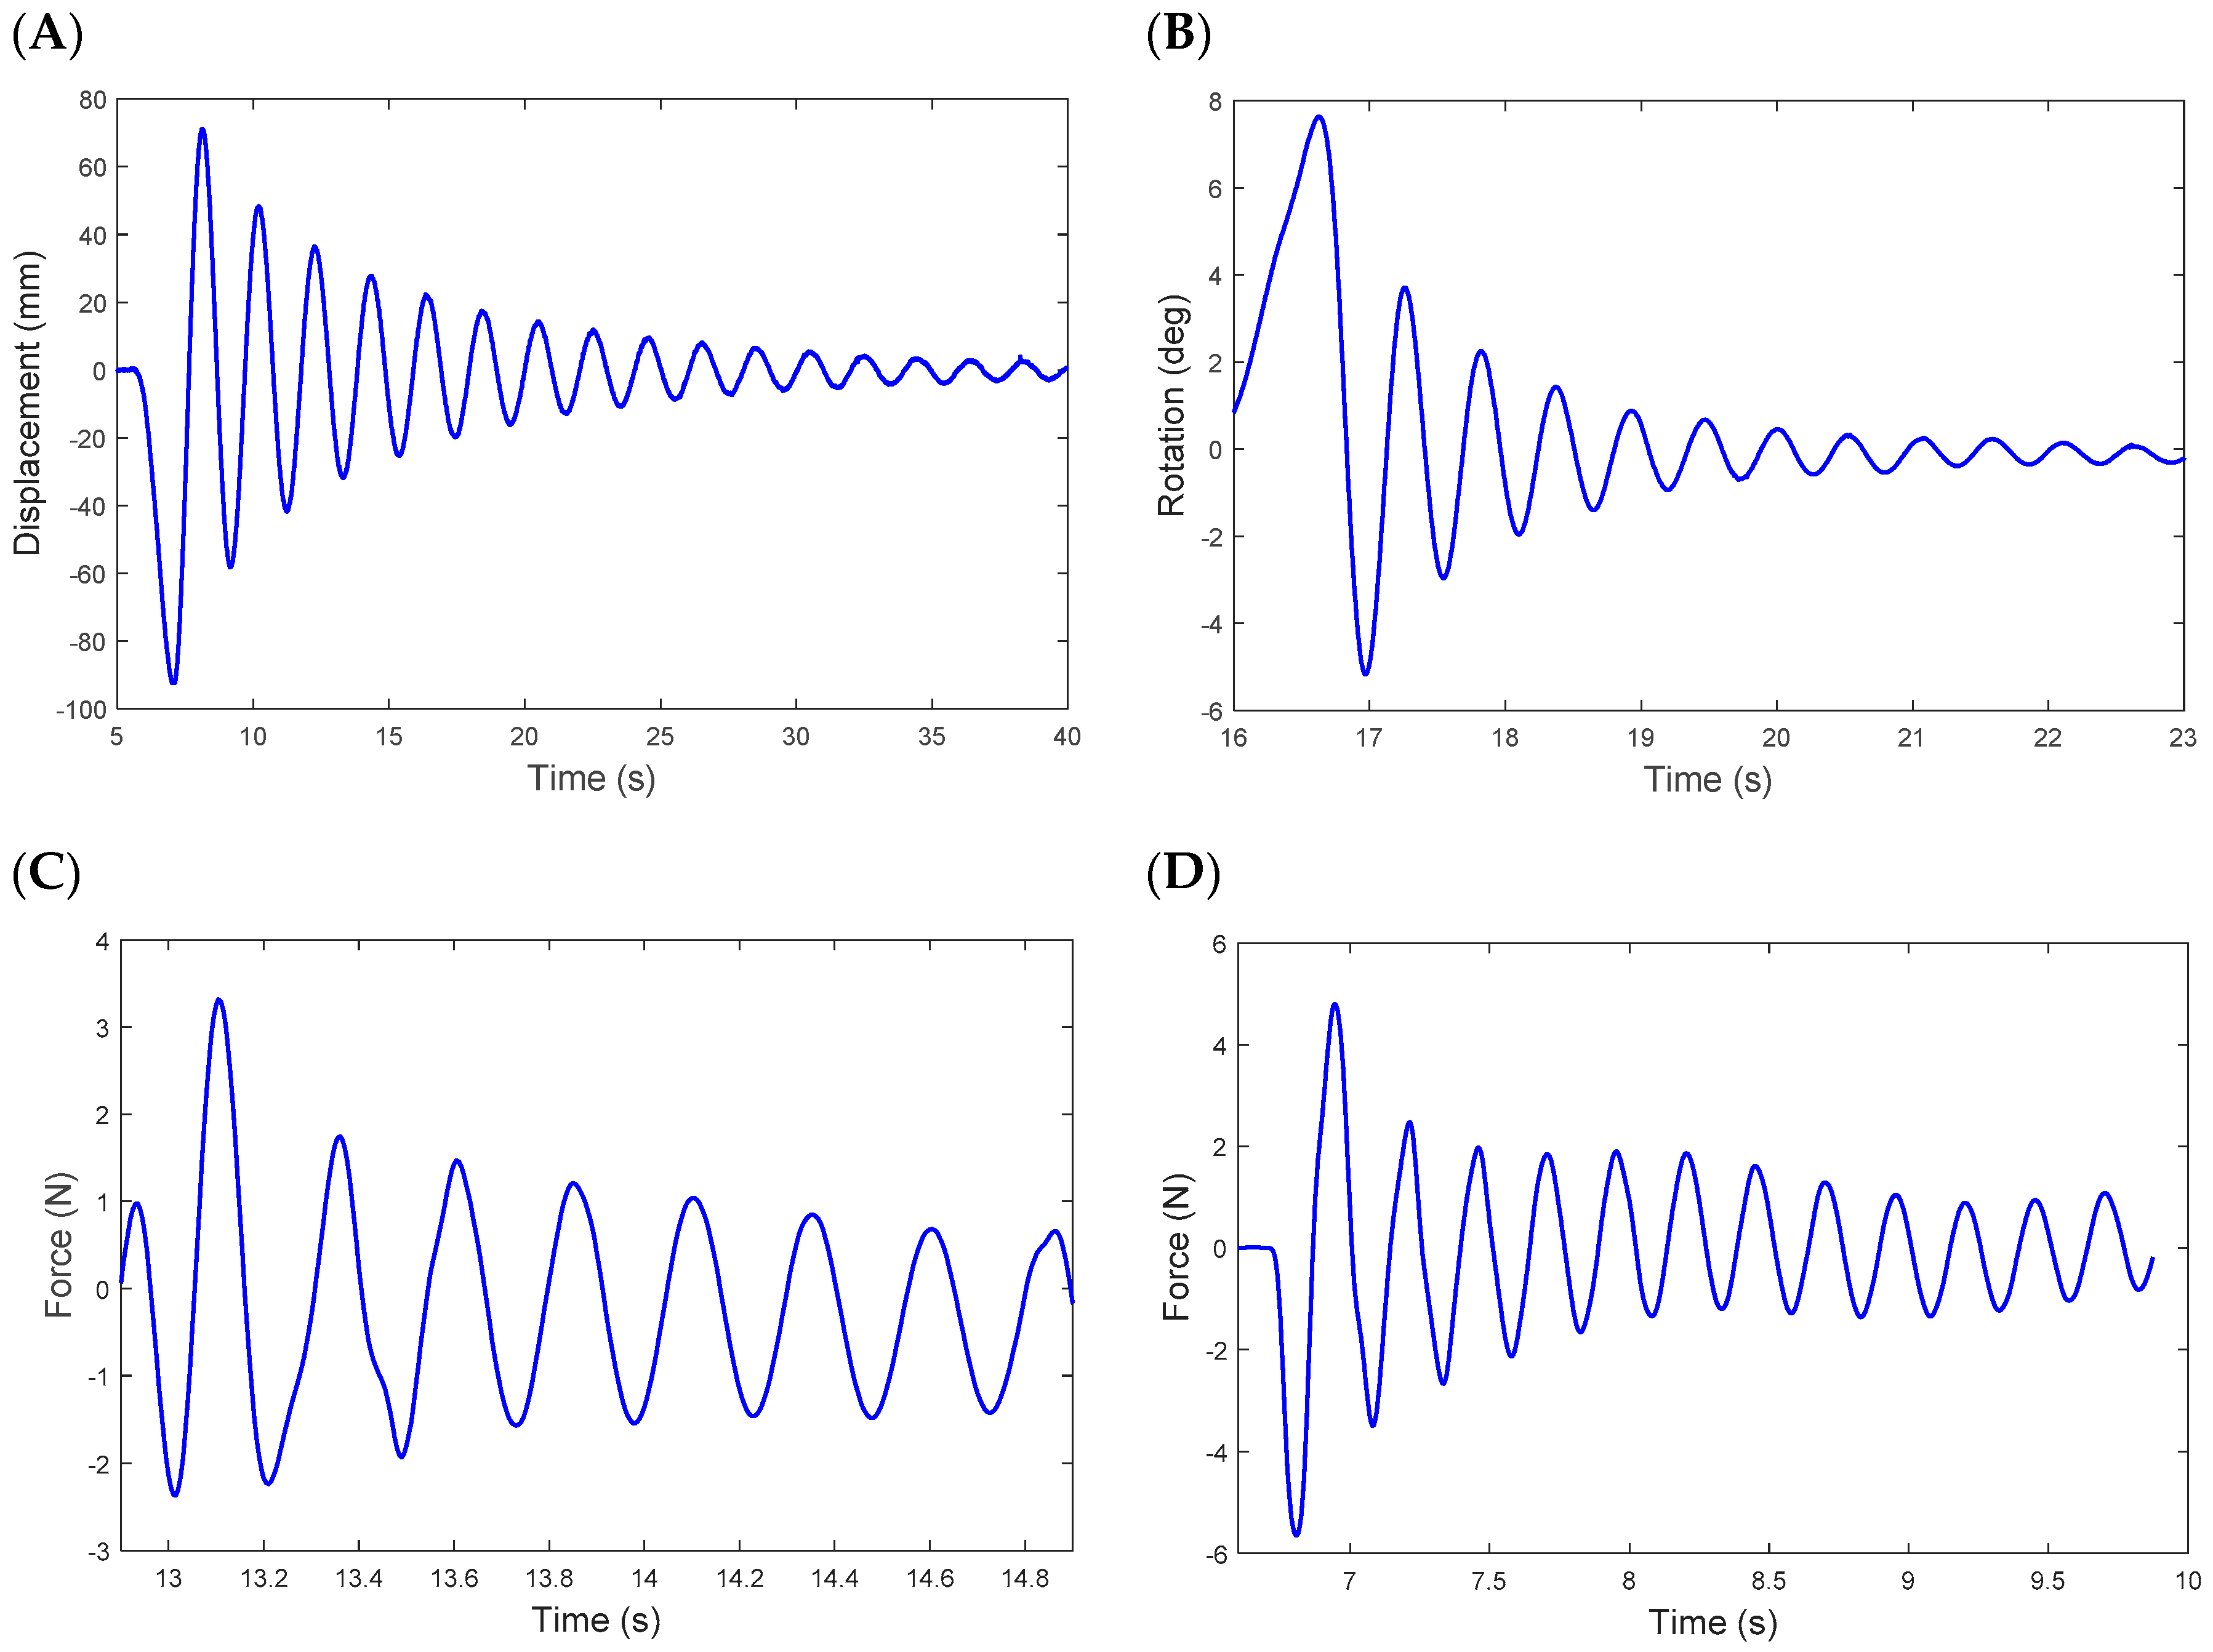
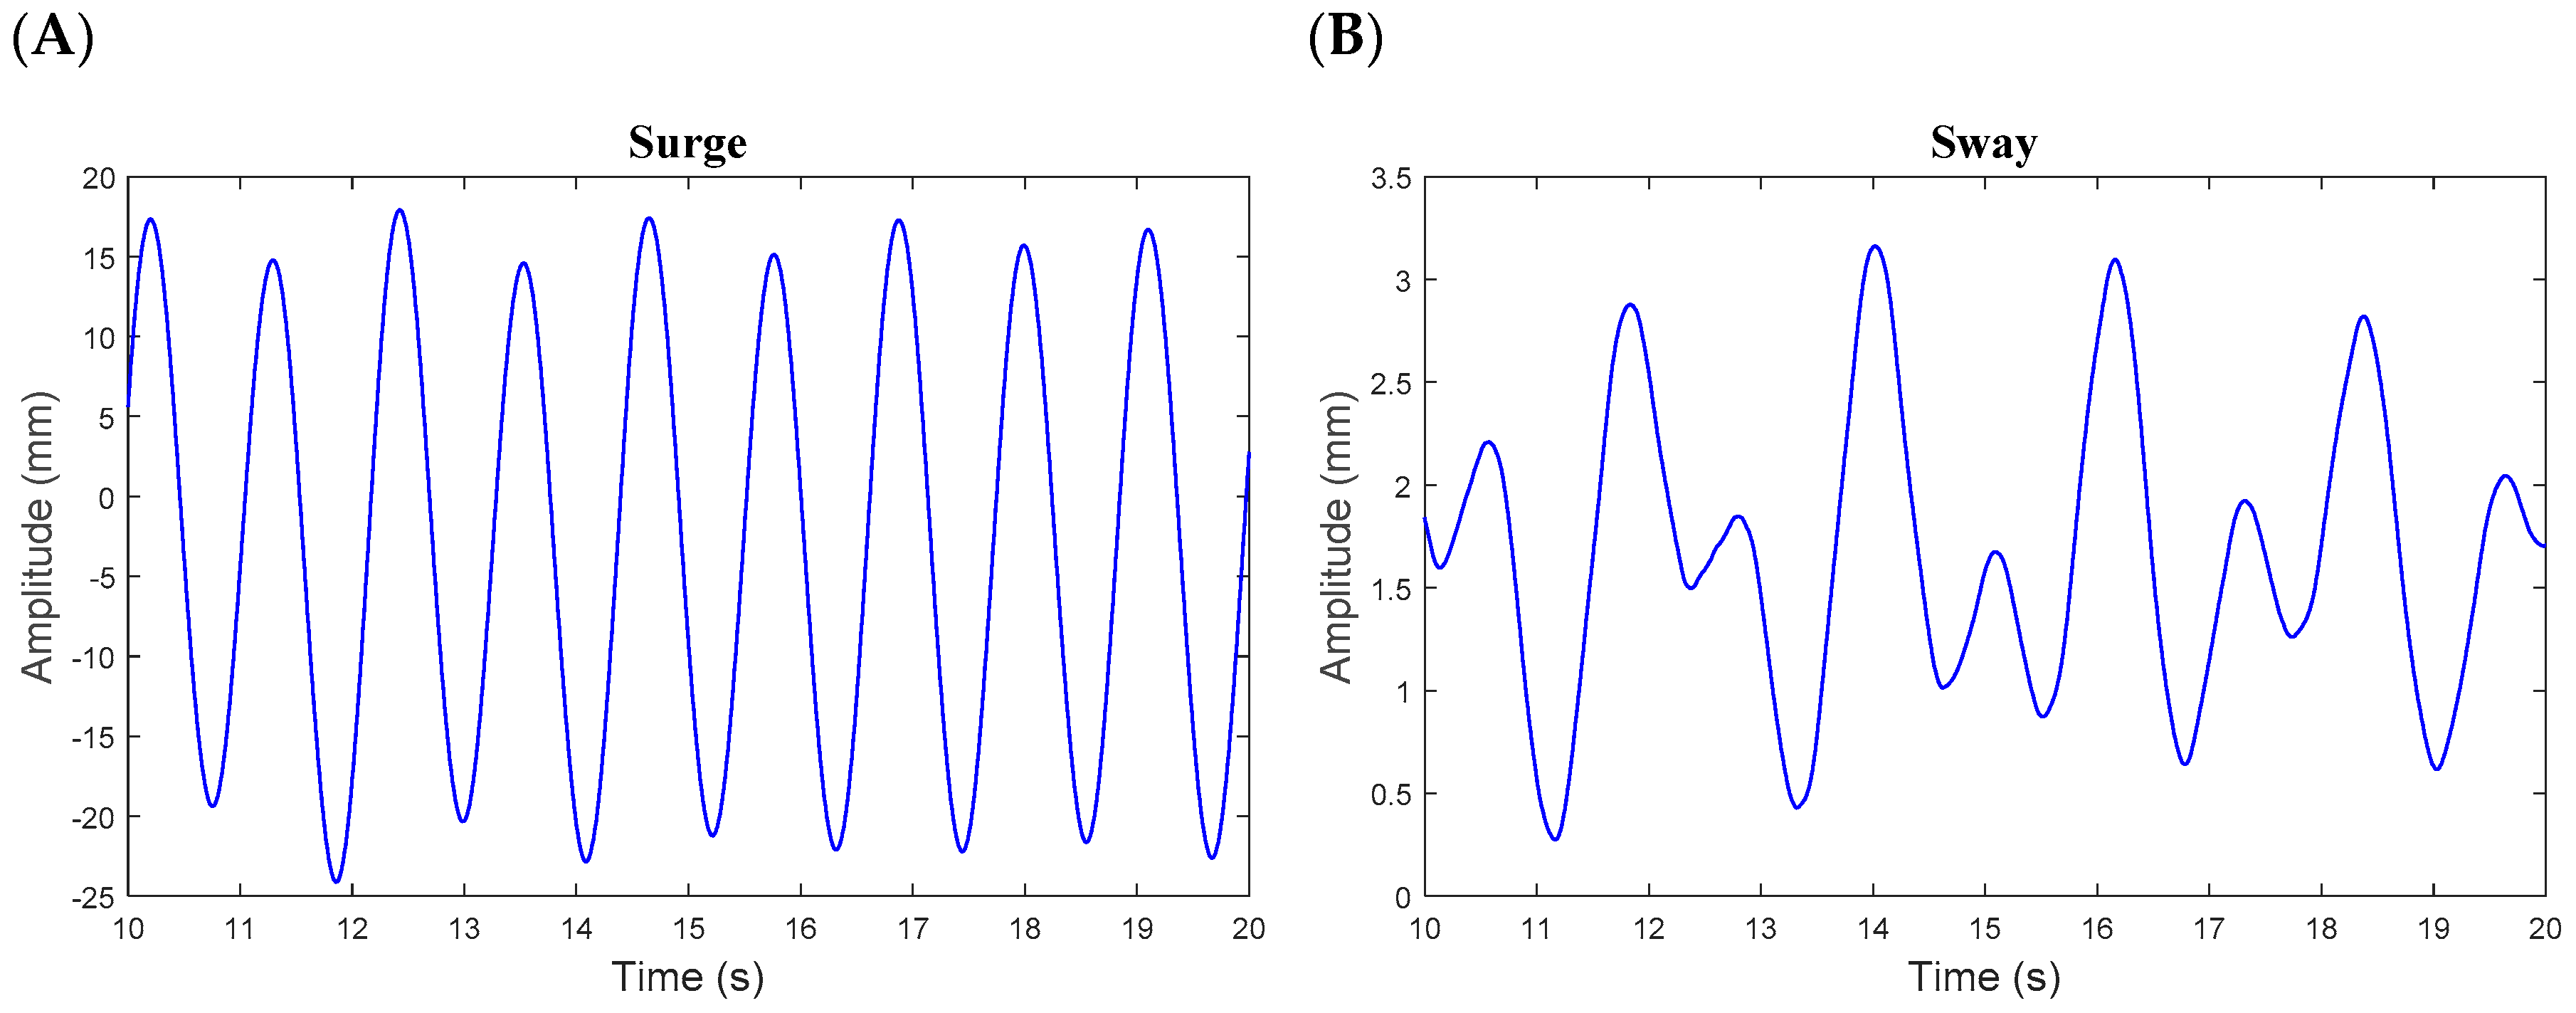
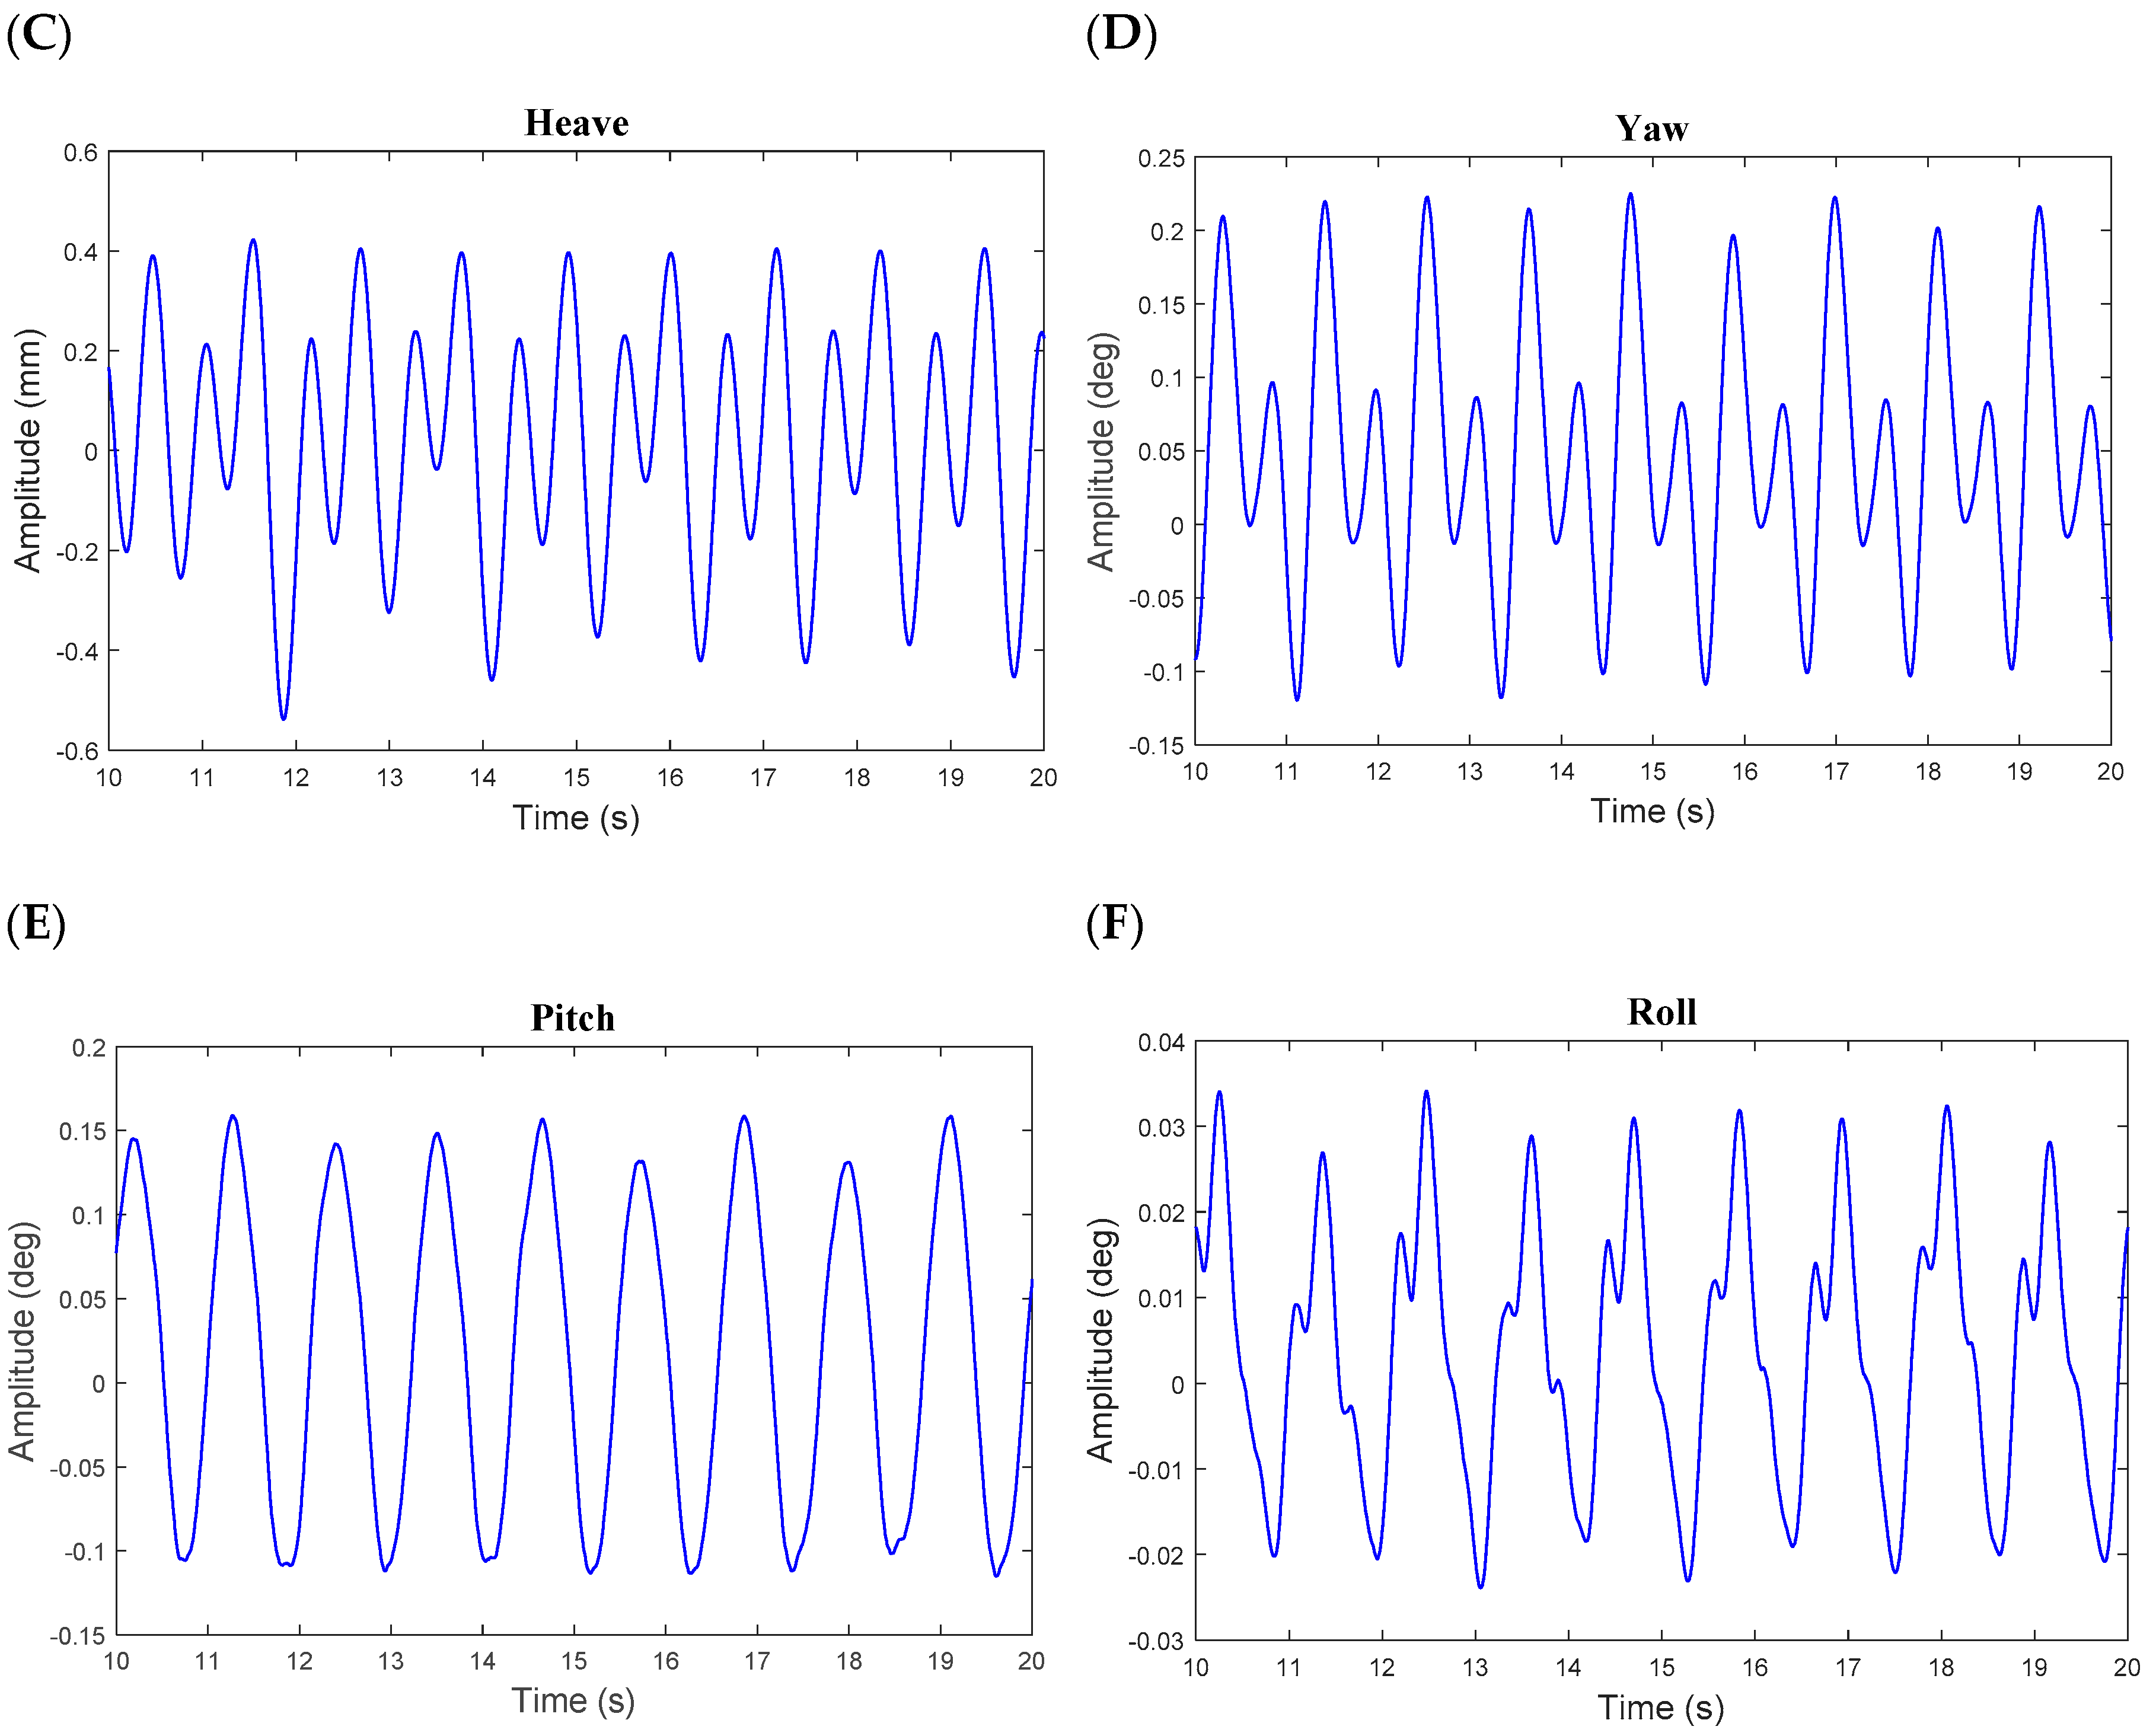
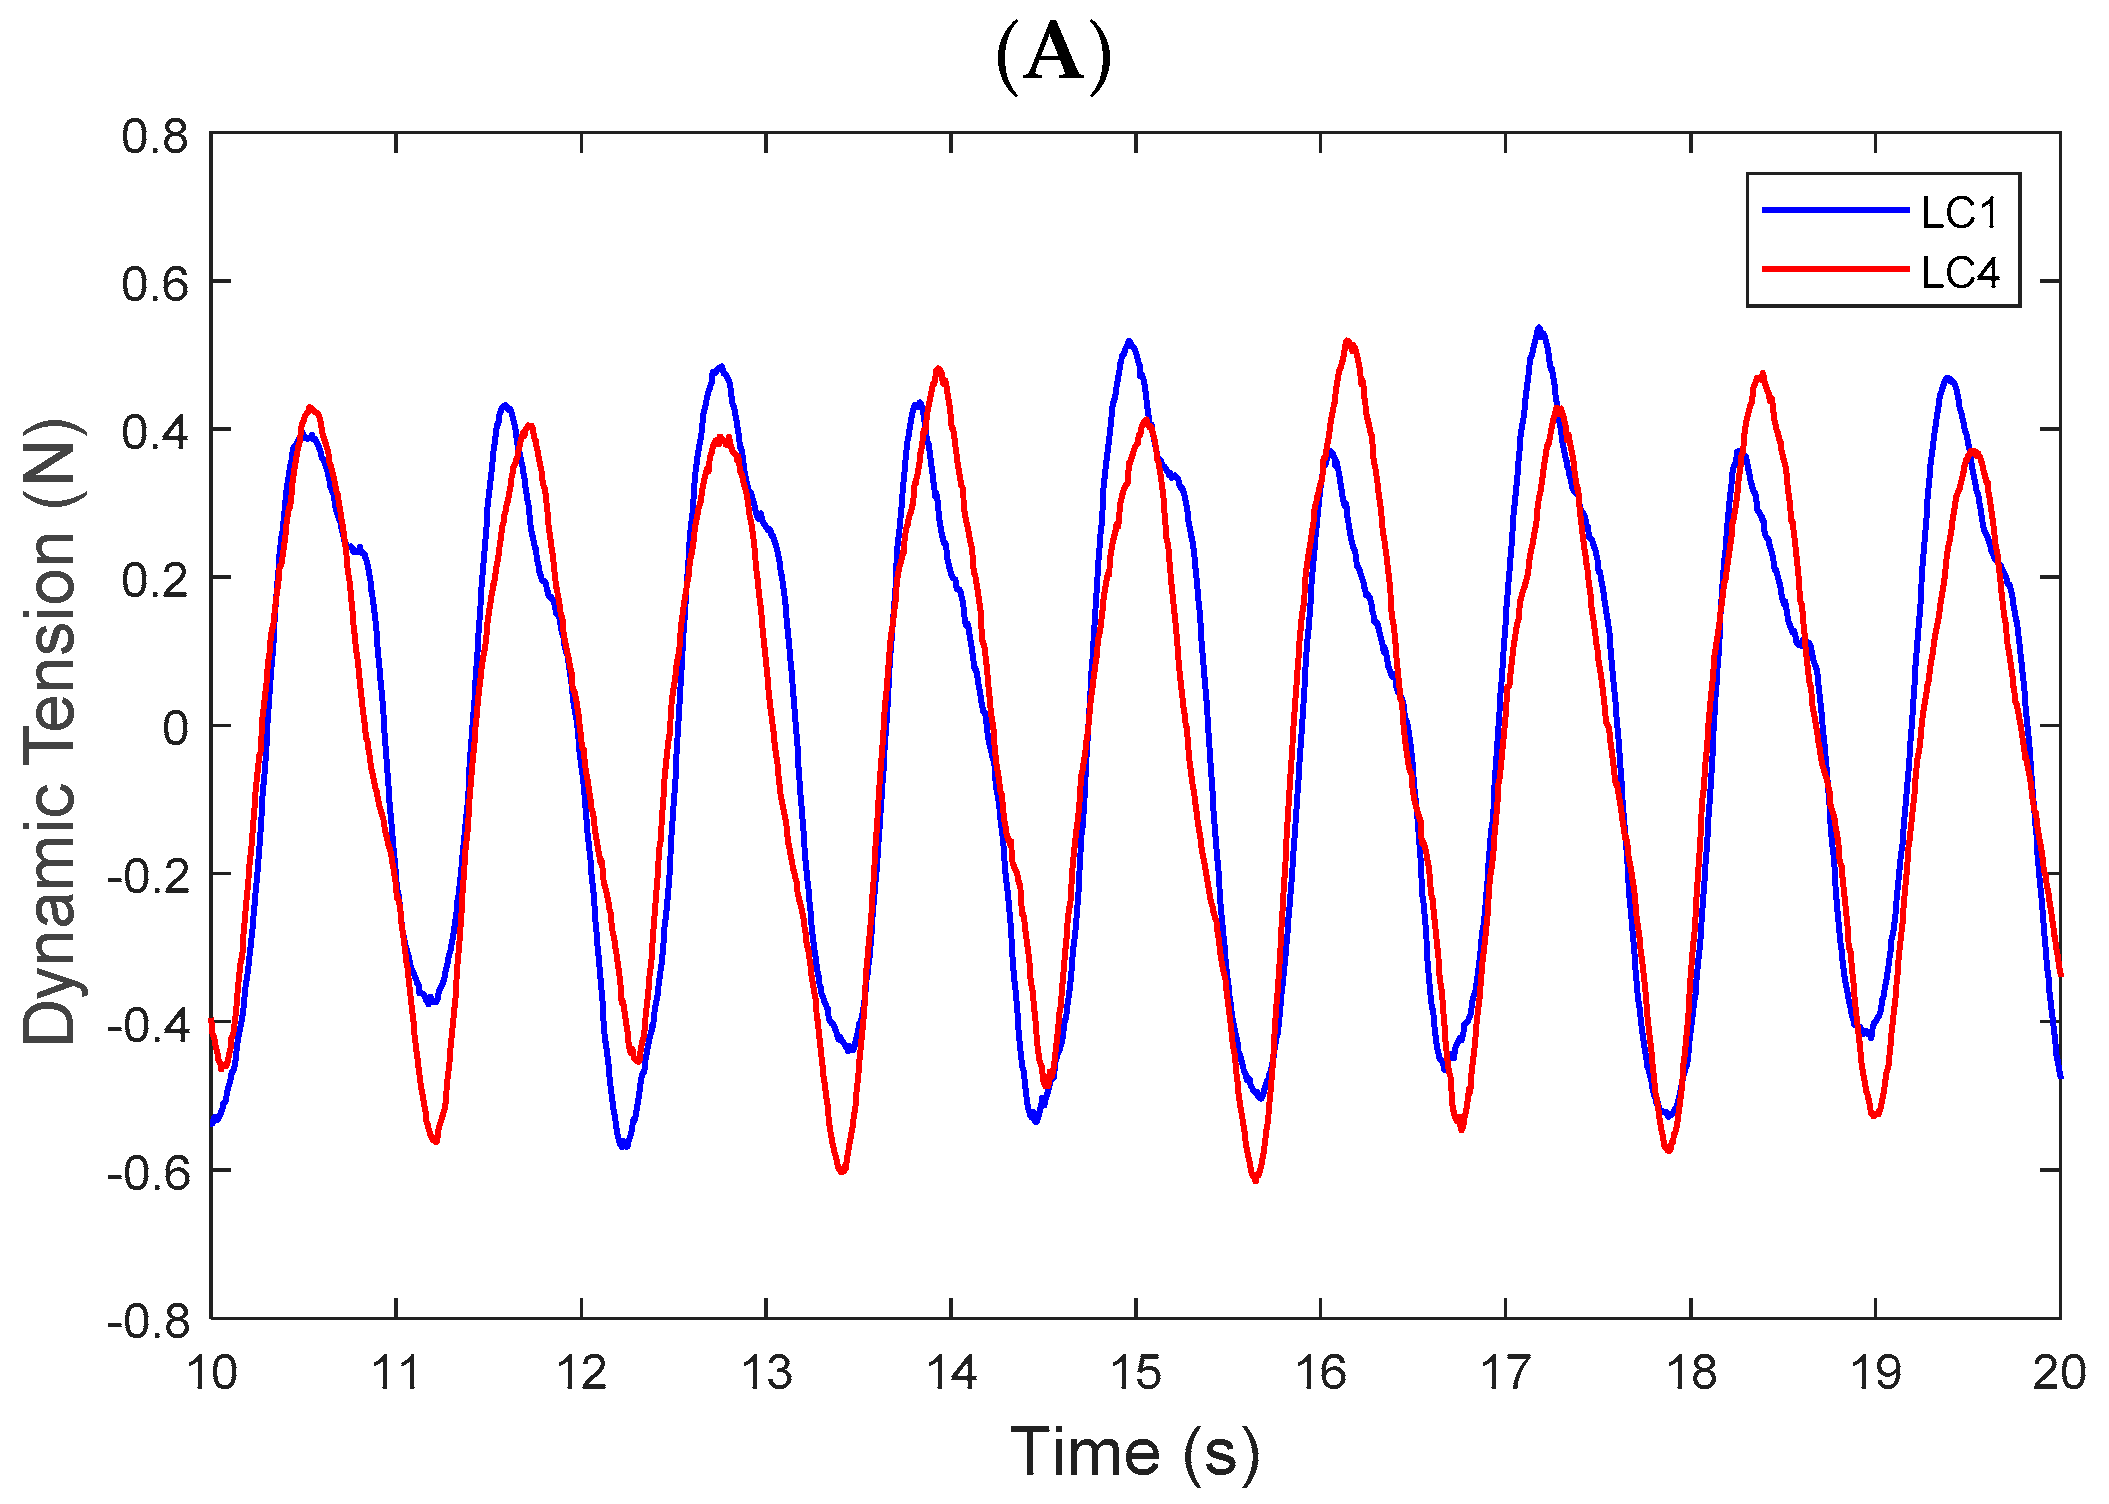
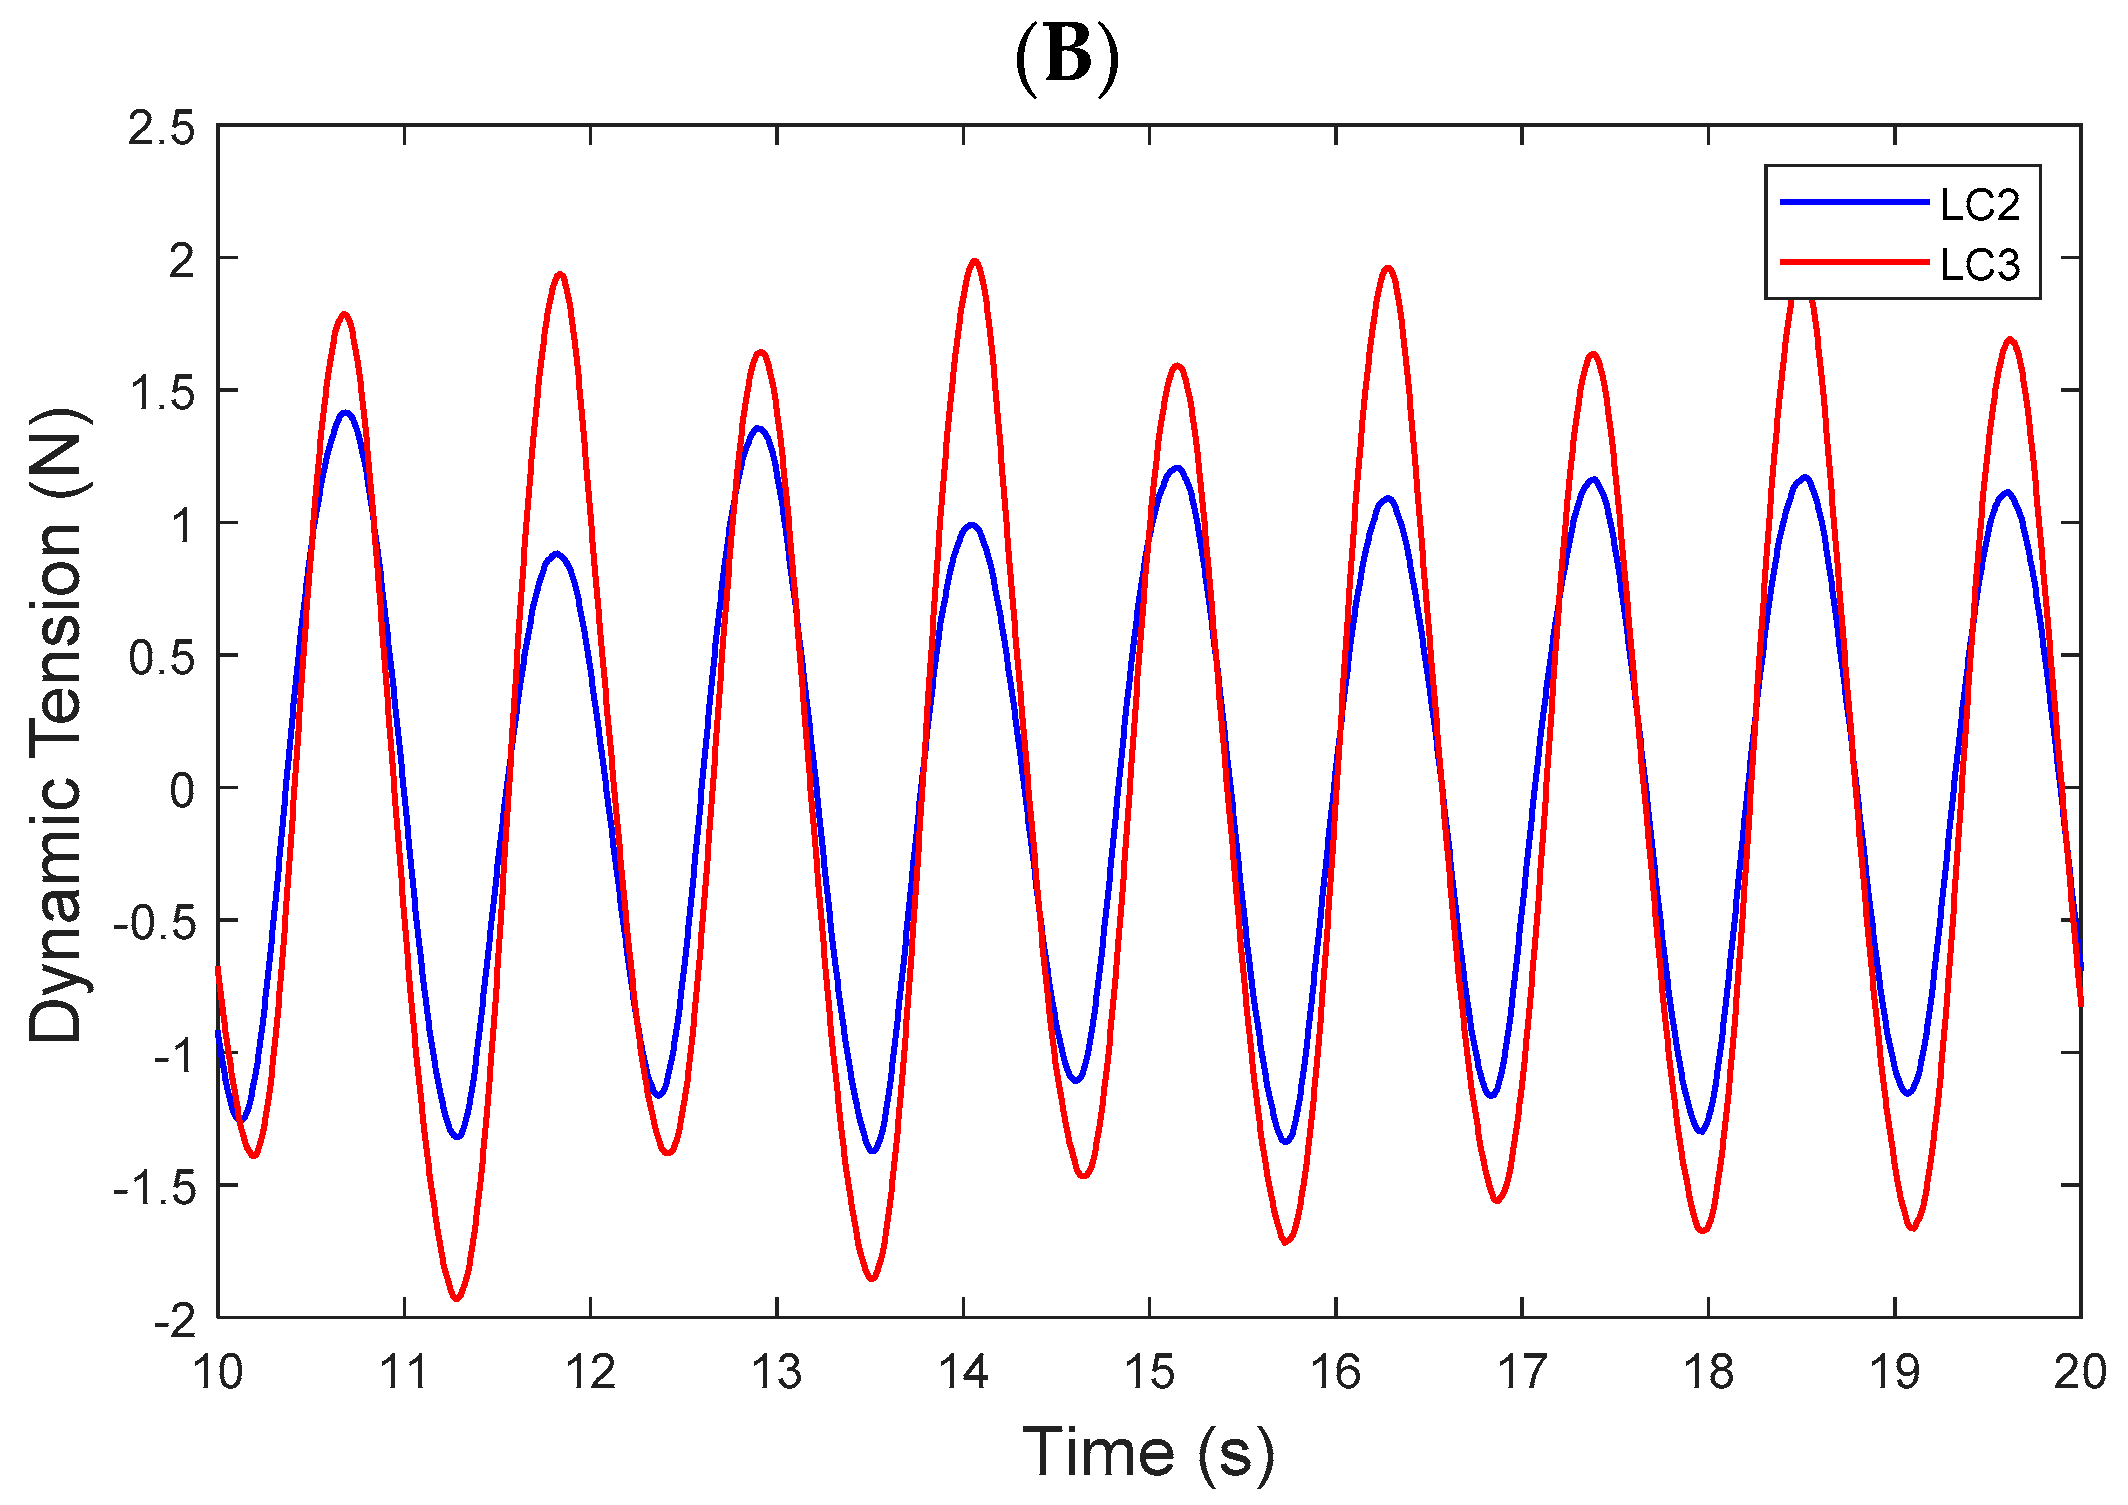
4.1. Time Series of Motion and Tendon Responses

Figure 11 shows the steady state motions of the model observed in condition 3 (no wind action). Overall, the tested TLPWT model exhibited typical motion responses to that of a generalised TLP with significant surge offsets along with stiff heave and pitch motions [41,43]. Moreover, there was an evidence of a potential coupling between multiple DOFs, particularly for heave and surge motions. This could be attributed to the relationship of offset and set-down for TLPs, based on their tethered nature [45]. Such a relationship will be discussed in detail thereafter in Section 4.3. There are larger surge motions in the positive direction as the model was constantly subjected to waves, which did not allow for even amplitude in both directions. This observation was also noticeable for the heave motion, with the magnitude of the downward motion proving to be more significant compared to the upward motion of the model. The pitch angles experienced were consistent, with the amplitude in the positive direction only slightly greater than that in the negative direction. Such observations in motion nonlinearities were anticipated as the nature of the physical wave was nonlinear as well. As expected, the magnitude of sway, roll and yaw motions was negligible in this case, as tests were only performed in head seas [35].
Figure 12 shows the time-series data of the dynamic tendon tension from each of the load cells using an example from condition 3 (no wind action). These graphs clearly show the excitation in the tendons from the model motions, with the forward (up-wave) tendon (LC3) experiencing the highest magnitudes for dynamic tension. The port and starboard tendons (LC1 and LC4) experienced almost similar magnitudes of tension; the variation among them can be attributed to the yaw motion of the model (Figure 11D). The aft (down-wave) tendon (LC2) experienced higher tension when compared to the port and starboard tendons, which showed relatively consistent tension fluctuations.

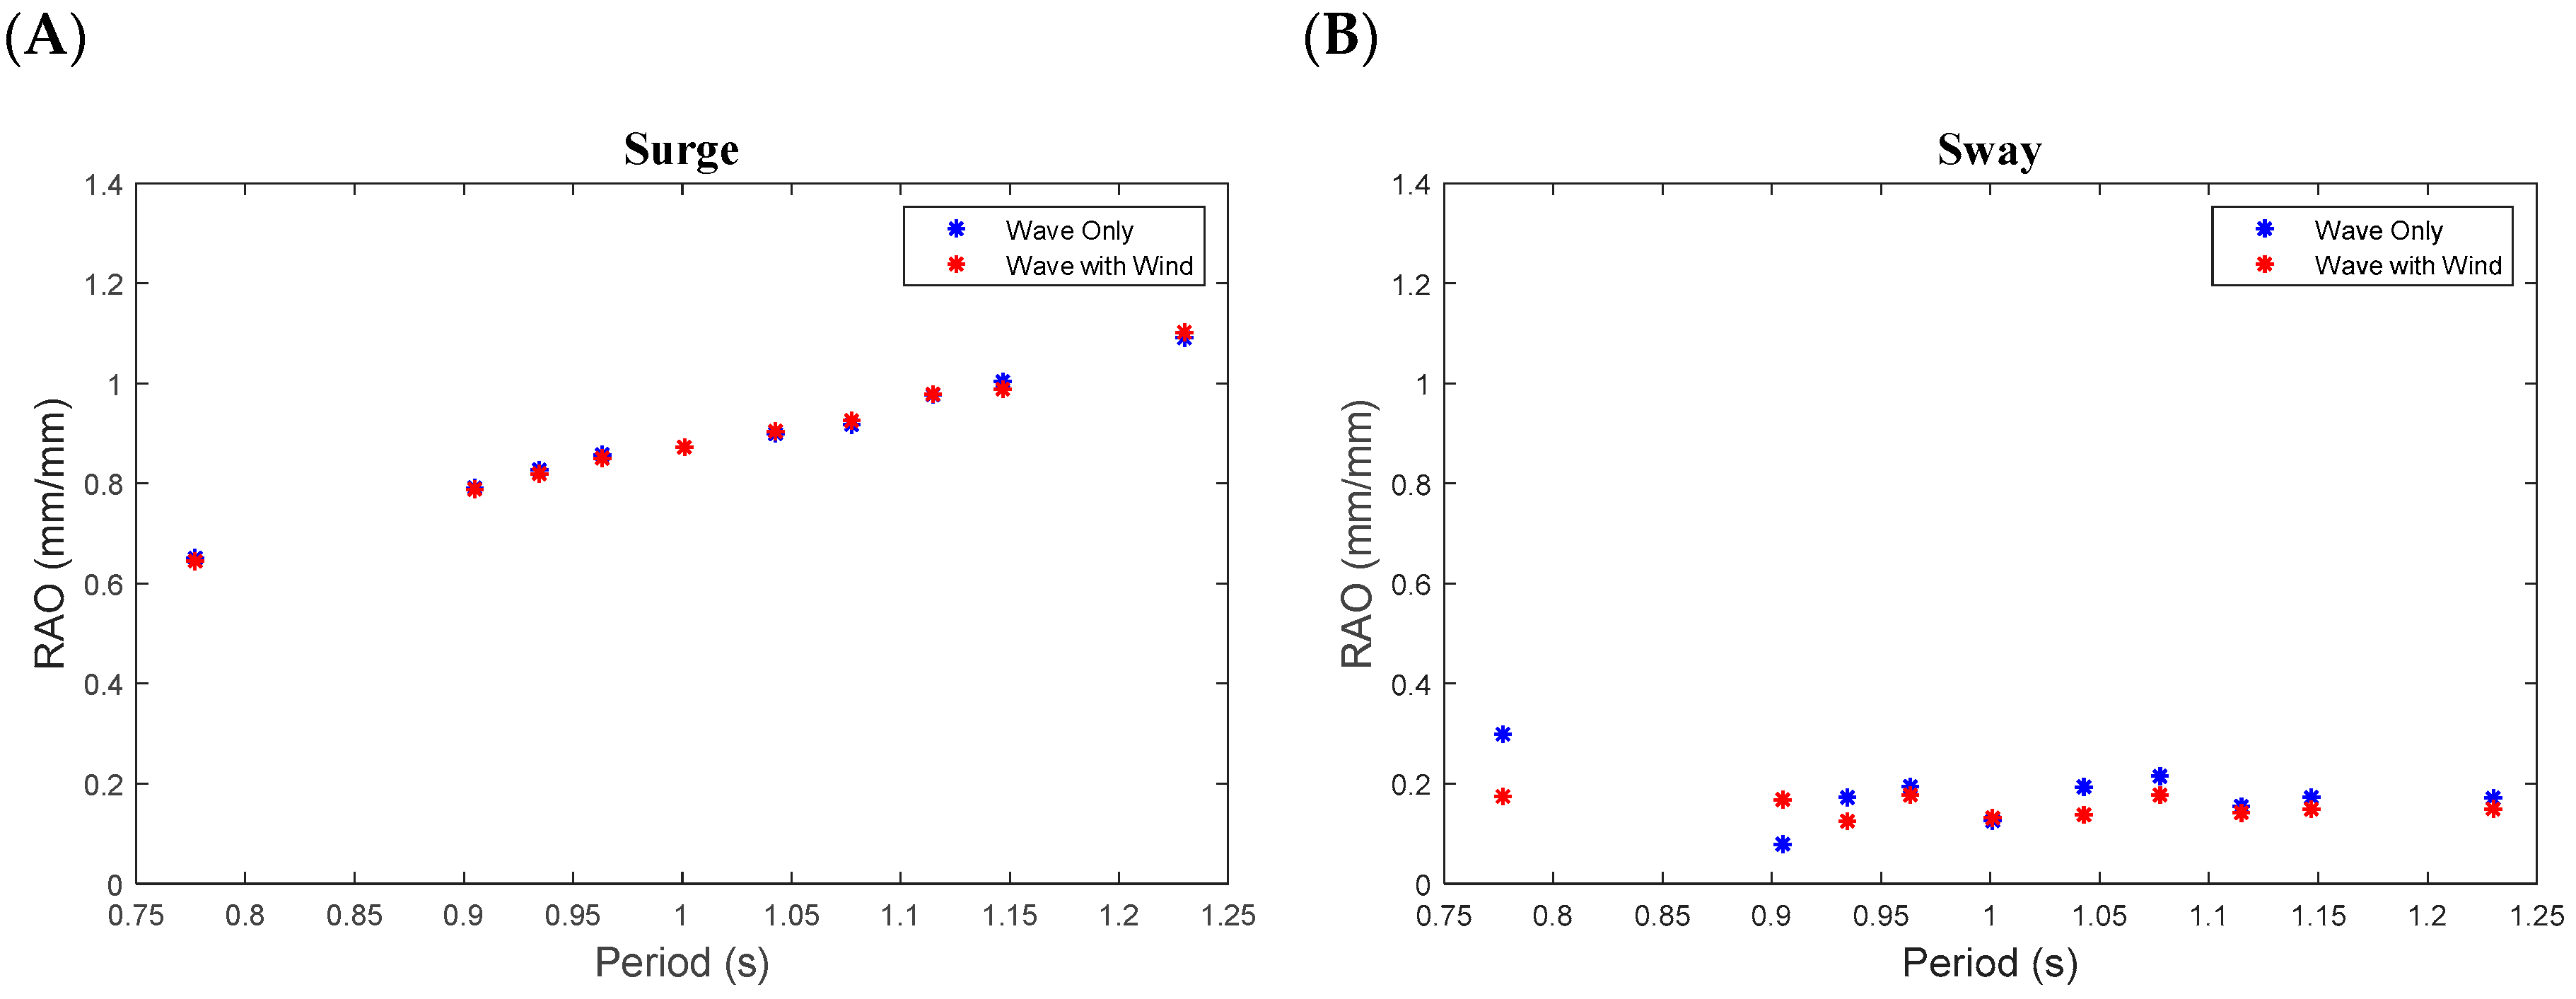
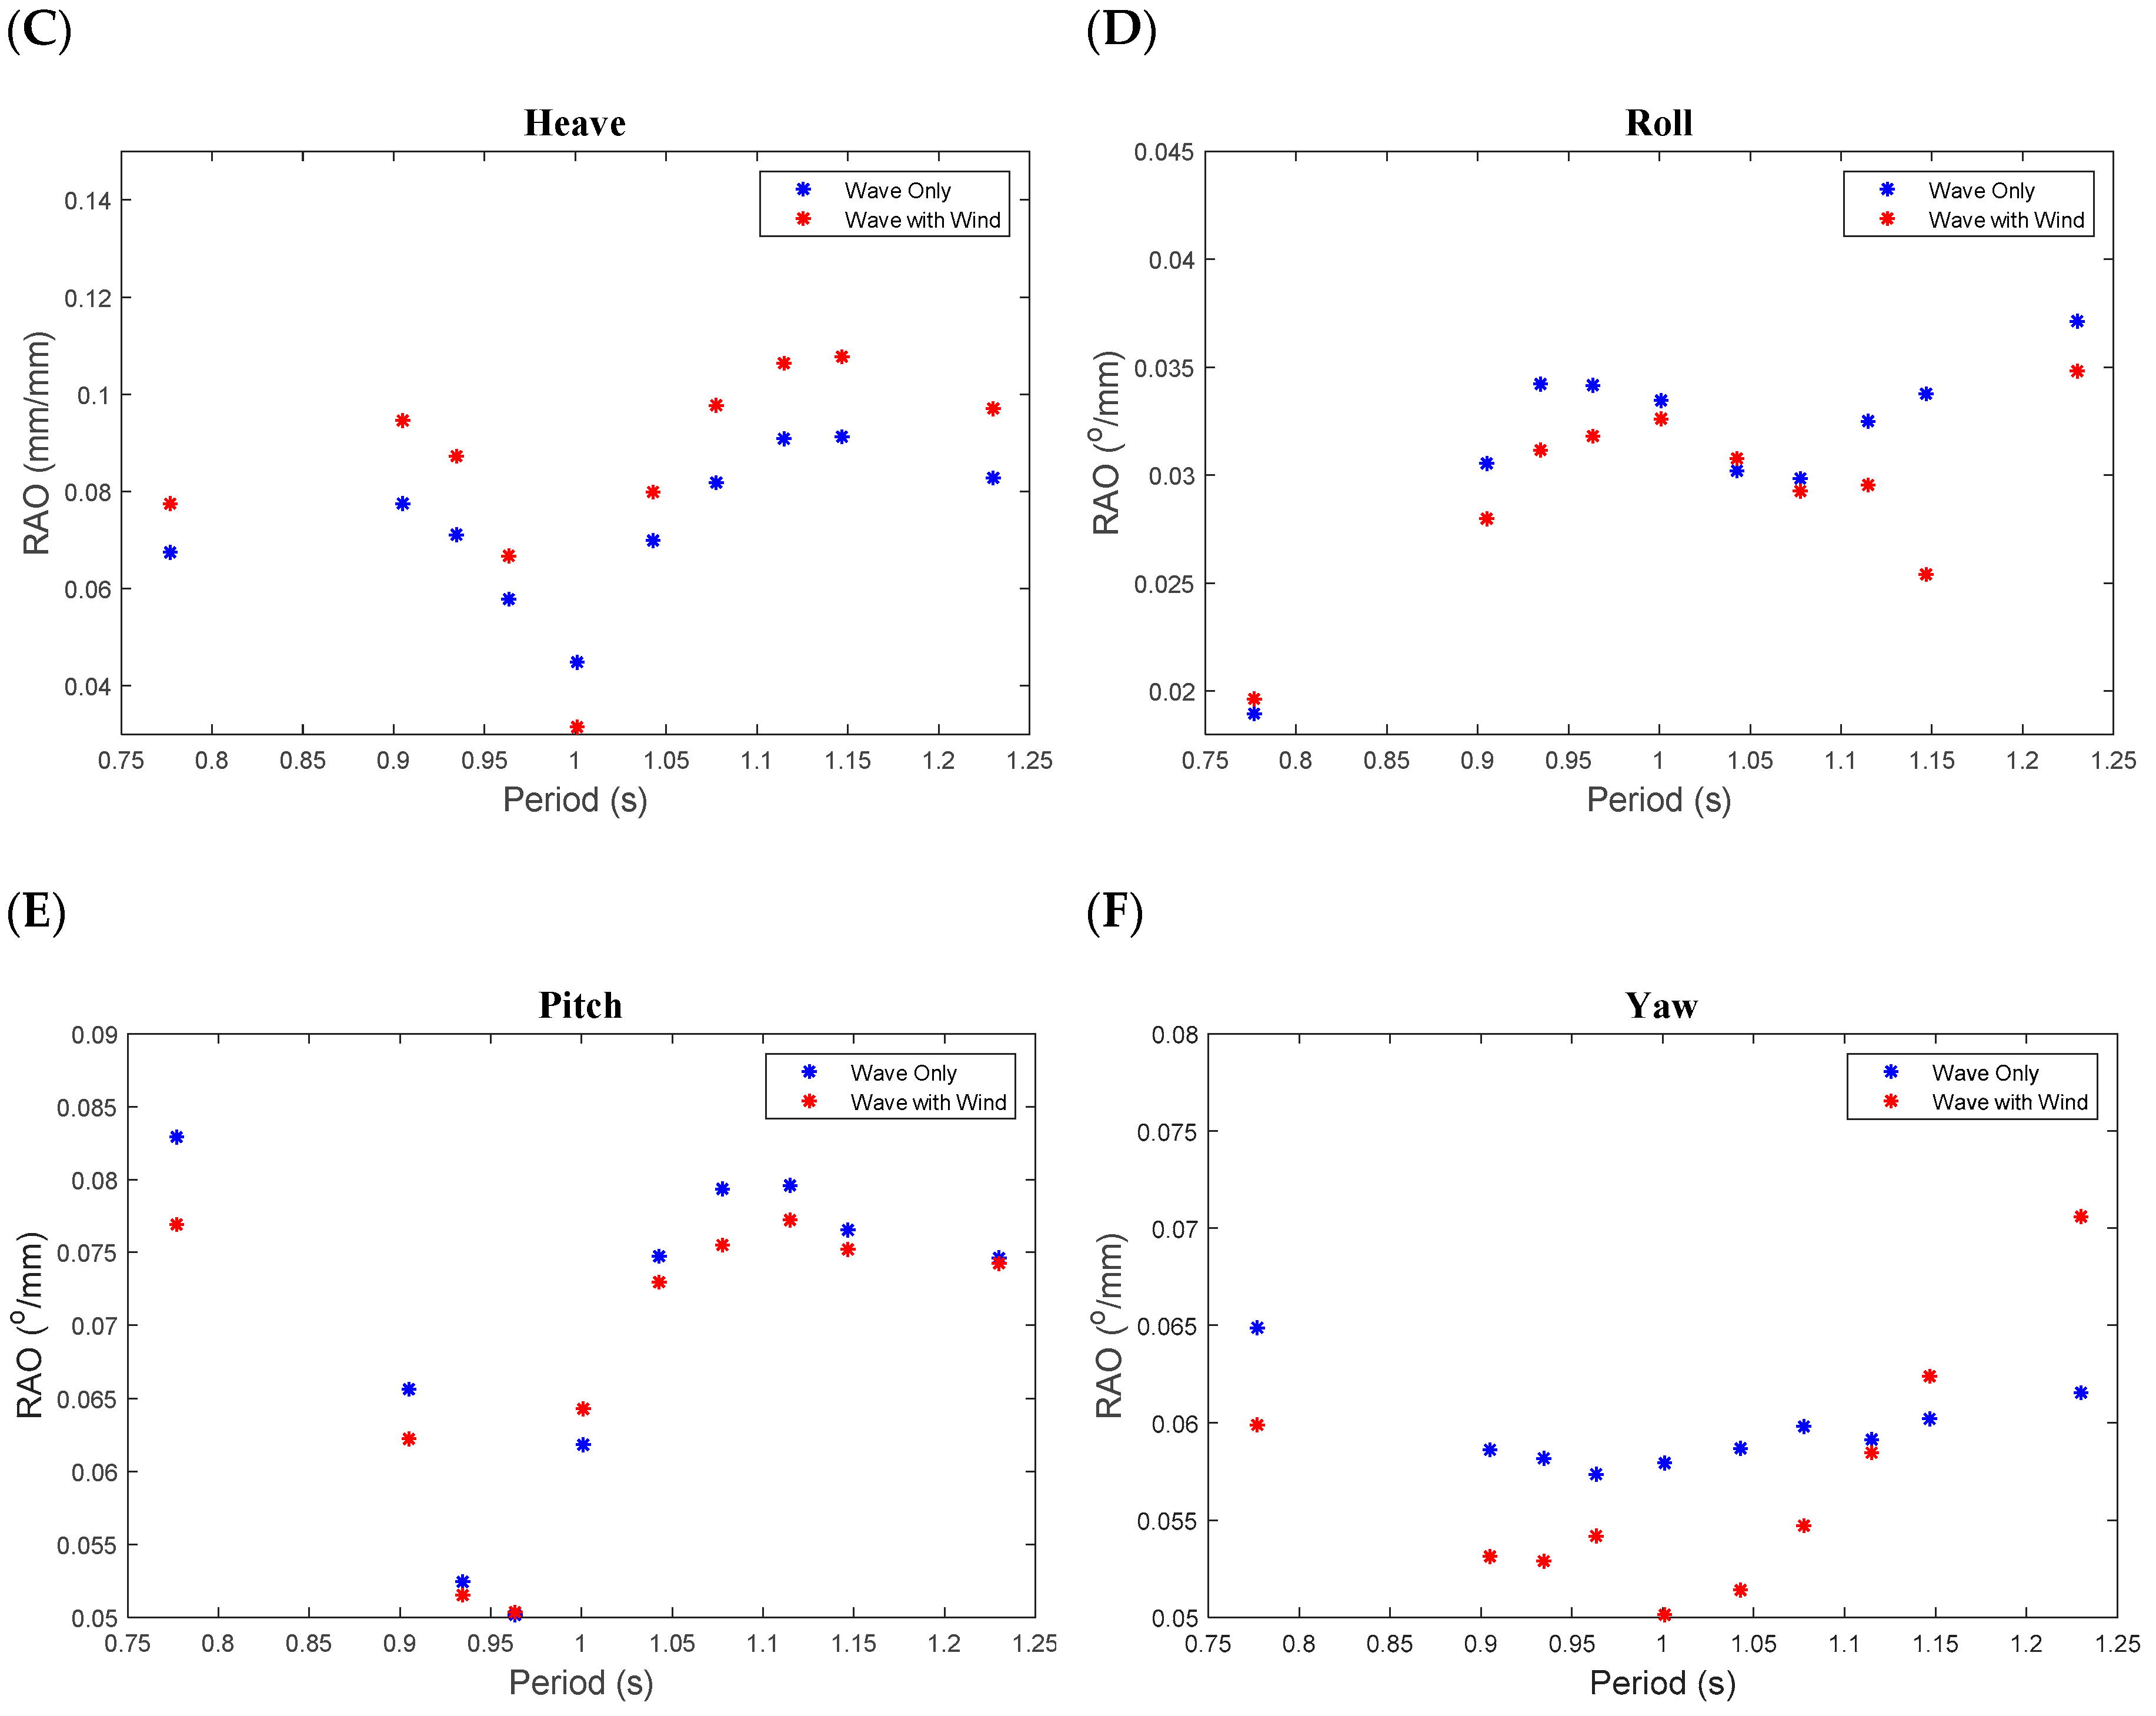
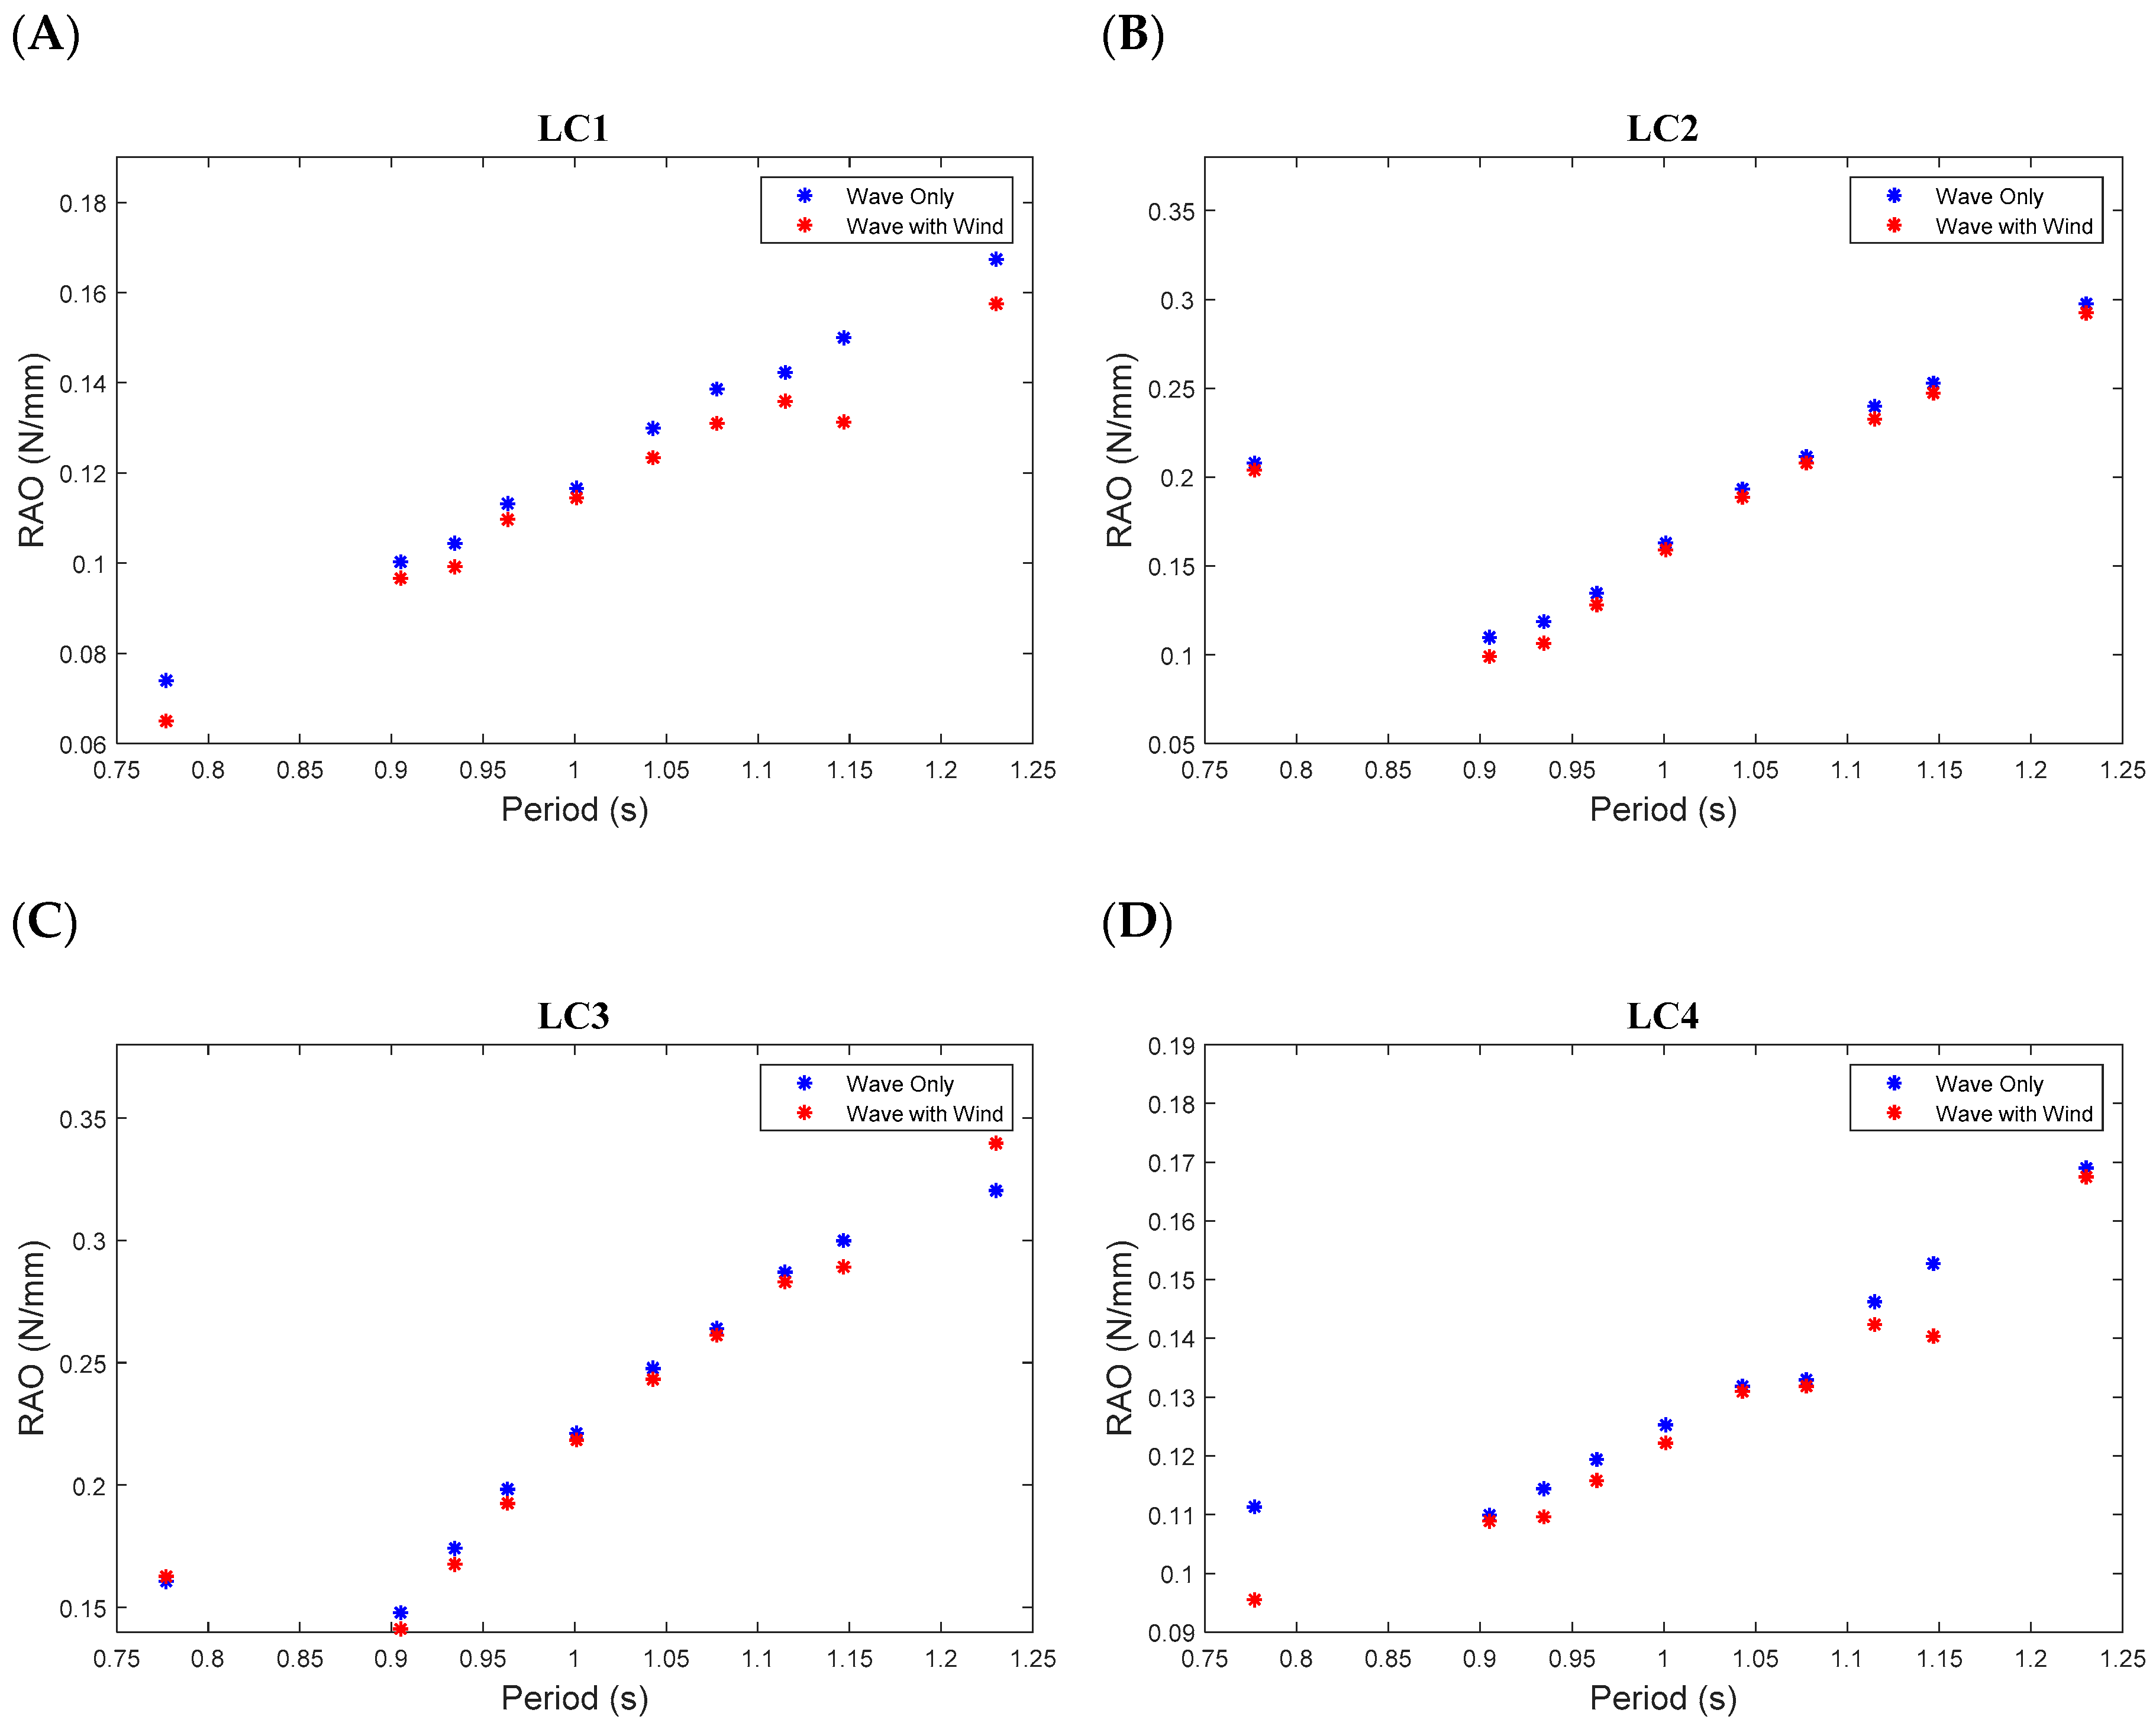
4.2. Response Amplitude Operators (RAOs)

Wave frequency Response Amplitude Operators (RAOs) of motion and tendon responses are discussed in this section. Figure 13 A–C show the translational RAOs for surge, sway and heave, respectively, whilst Figure 13 D–F show the rotational RAOs for roll, pitch, and yaw. FFT analysis was used for each run to find the RAOs at each wave frequency. As already mentioned, the wave and wind conditions tested for the analysis of the RAOs are based on EC3 [14] to represent an operational case. For the key motions of surge, heave, and pitch, there were some clear trends apparent from the ‘wave only’ and wind assisted runs. By studying the effect of wind, the magnitude of heave motion was found to increase due to wind forcing with an average increase of 13.1% for the tested conditions. The effects of natural periods on the motion amplitudes cannot be identified as the results obtained in Table 7 fall out of the tested range of 0.777–1.230. Furthermore, it should be stressed that it is unlikely that the maximum motions of the model were captured during these tests conducted in this study. A clearer picture would likely be obtained with further testing in a survivability sea state (Hmax ~ 1.86 Hs corresponding to the design return period) [36]. Analysing similar tests performed by Zamora–Rodriguez et al. [34], trends in surge results were basically comparable, with only minimal variation between each wind condition. An increase in heave motions with wind was also found to be similar, albeit to a different magnitude. The variations experienced in pitch were minimal, however were in a similar range when compared to Zamora–Rodriguez et al. [34].
The tendon RAOs were also evaluated for the same wind and wave conditions as the motion RAOs (Figure 14). Each LC was analysed for the maximum dynamic tension for each of the different wave periods, with clear trends being observed. Overall, it is noted that the dynamic tension in all tendons was lower for most of the wind assisted runs, whilst the largest dynamic tensions were experienced with the lower frequency waves. As expected, the RAOs of the port and starboard tendons (LC1 and LC4) were quite similar due to symmetry. Likewise, the maximum dynamic tensions of the model’s tendons were captured during these tests for a mild to moderate sea state. A testing in a survivability sea state test would likely provide such information. It should be noted that the RAOs of the surge motion and all tendon tensions follow a similar trend with a larger magnitude response to larger wave periods. However, these responses are also a function of tendon length and stiffness which should be considered when optimising and designing a mooring arrangement. The maximum magnitudes for these RAOs occurred at the longest wave period of 1.23 s tested (~ 13.0 s at full-scale) with Table 10 outlining the values. As can be seen the wind had a negligible effect on the surge motion and slightly decreased the tendon tensions in all tendons except the forward/up-wave tendon (LC3). These findings were consistent with the results of Nihei and Fujioka [31] who stated that the wind effect decreases the dynamic response of the tendons in waves and wind coexisting field.

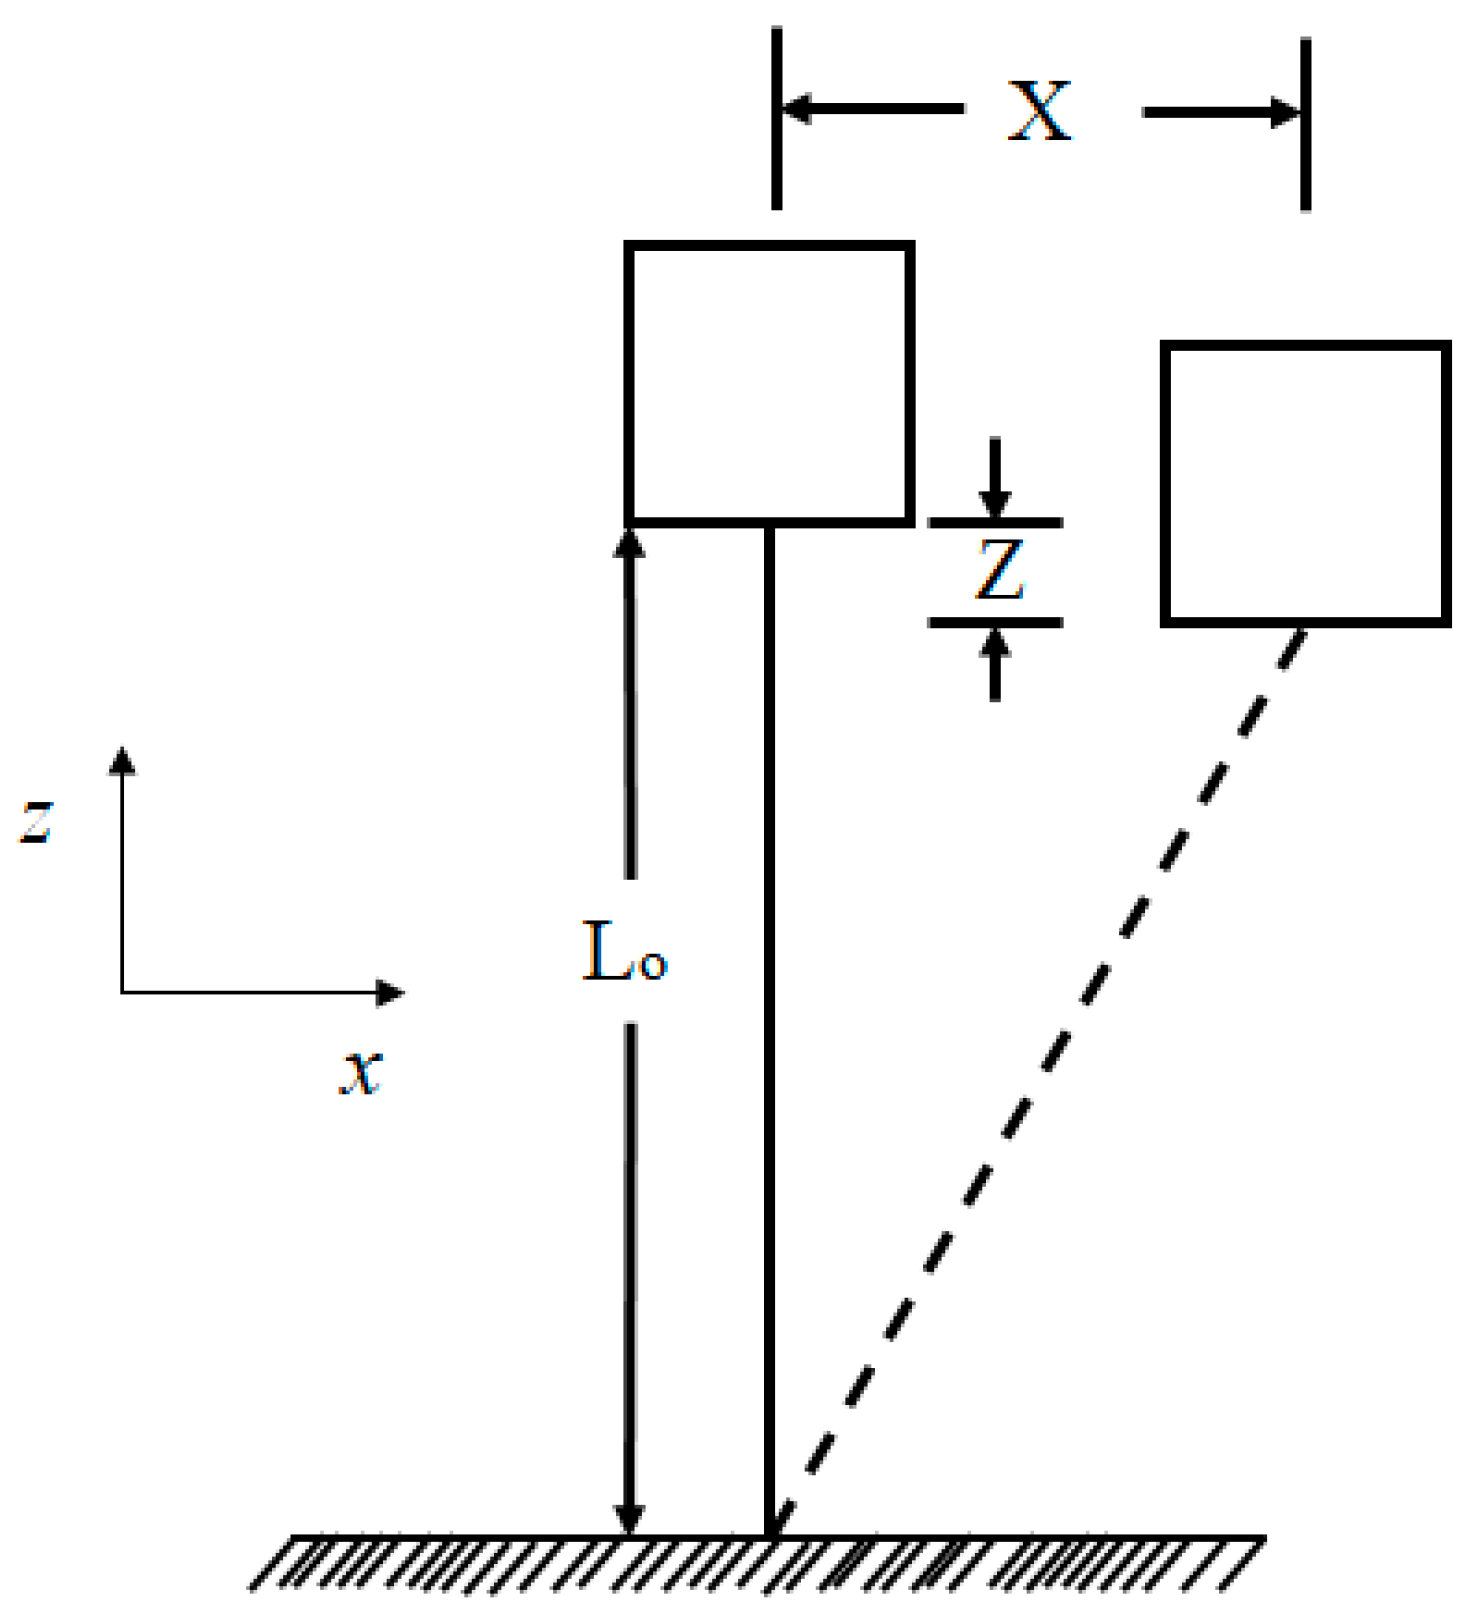
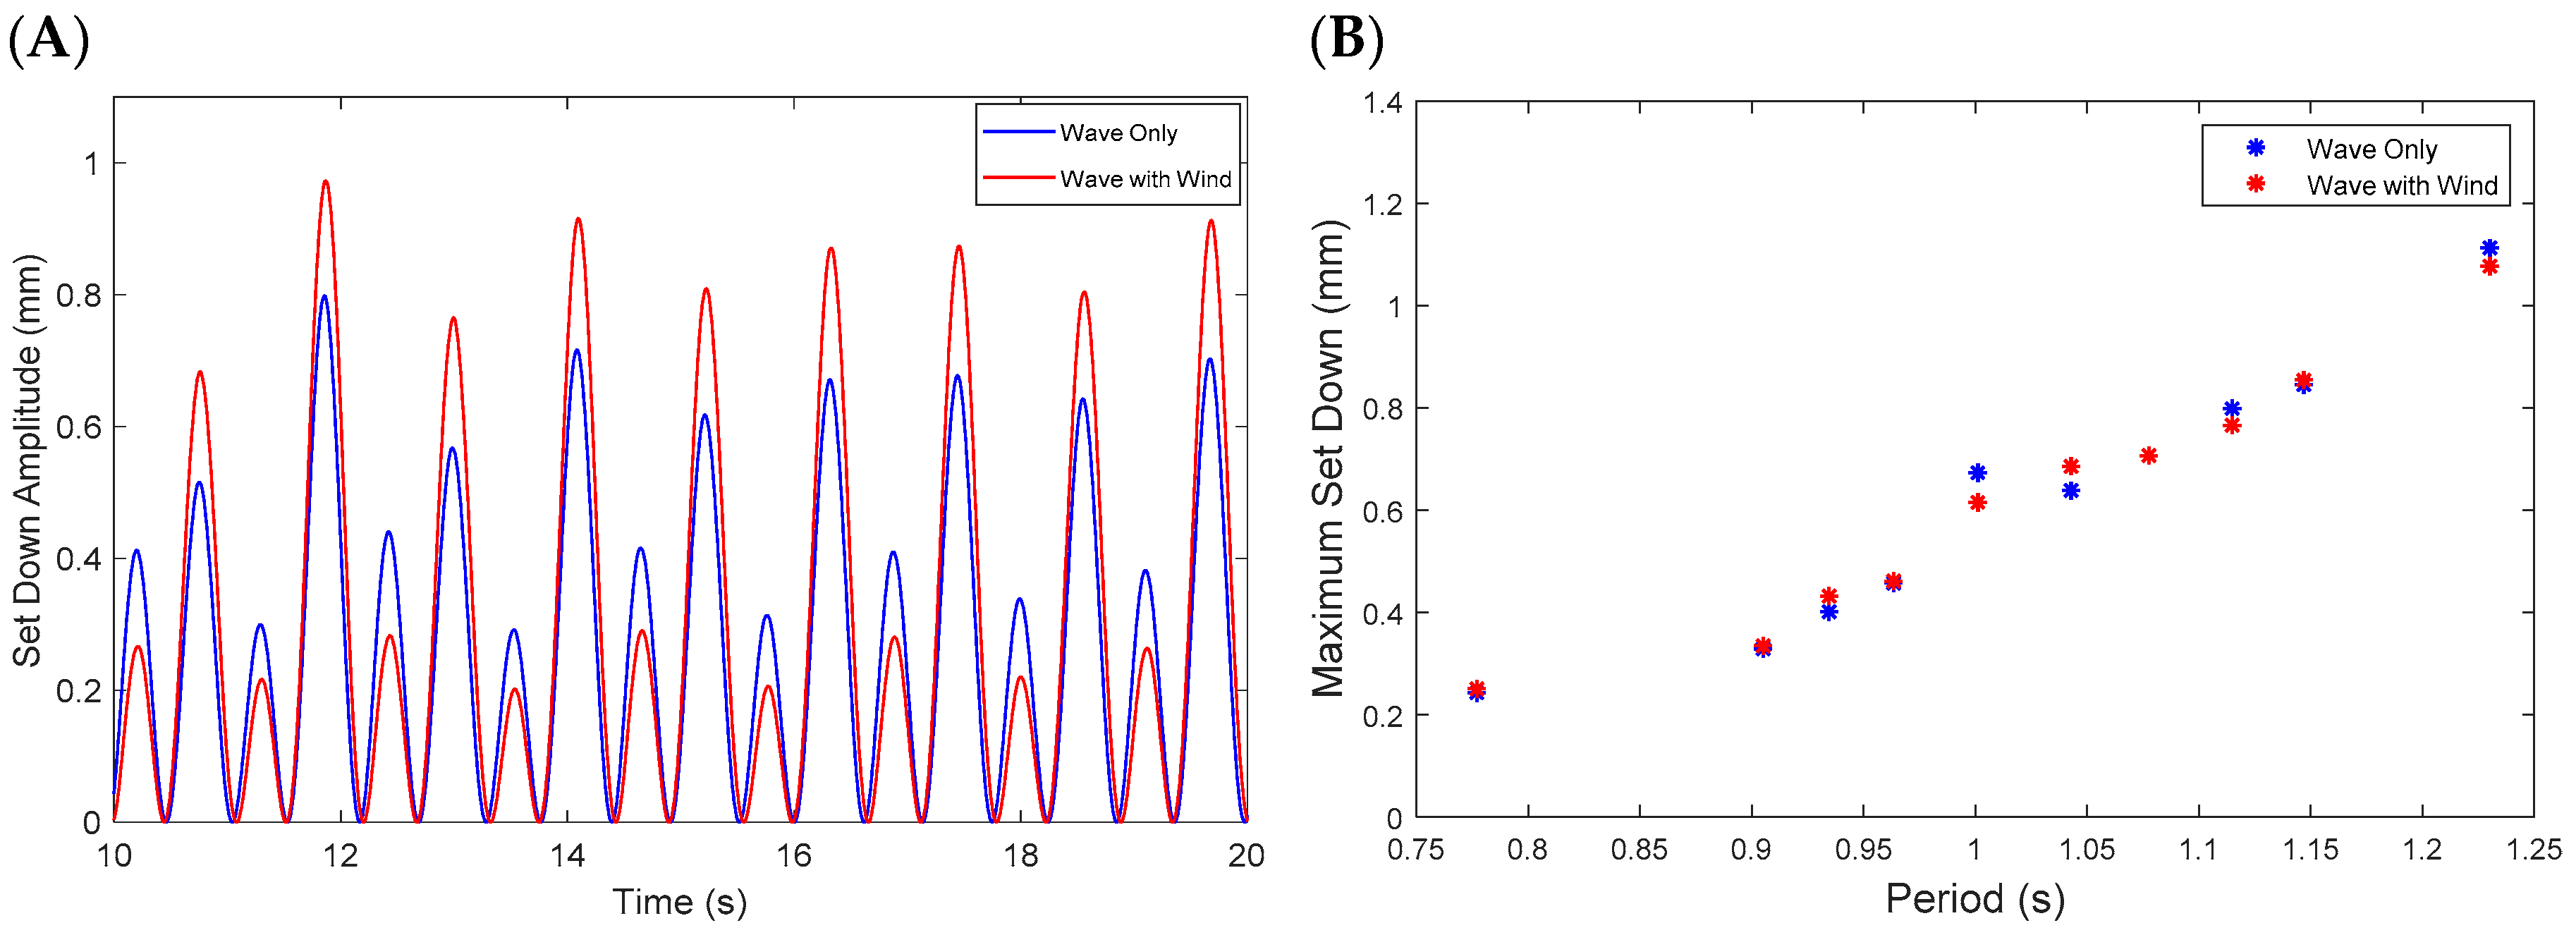
4.3. Model’s Offset Versus Set-Down

An analysis of how offset and set-down correlate under changing wind and wave conditions was performed. For a TLP, the kinematic coupling between the horizontal surge/sway motions and the vertical heave motions results in the so-called platform set-down [46]. The set-down refers to the vertical downward movement of the hull when the platform moves in its compliant modes (surge, sway and yaw). The relationship between offset and set-down changes depending on the input wave frequency, whilst wind loading can also have an effect. In this case, a mathematical formula developed by Demirbilek [45] can be used to evaluate the set-down based on the offset experienced by the model and the length of the tendons. By referring to the definition sketch shown in Figure 15, this relationship is given in equation (1) where Lo is the initial tendon length and X(t) is the surge motion time-series:
Z ( t ) = L o ( L o 2 X ( t ) 2 )
This was done with the assumption of zero pitch rotational motion while the platform is moving in the x-direction and neglecting the elongation in the tendon [43]. The magnitude of the set-down fluctuated during this set of tests as the model was moving back and forth. Overall, the magnitude of the set-down was minimal, likely due to the high stiffness of the tendons as discussed in Section 3.3. Figure 16A shows the set-down motion in the following wave direction i.e., wave travelling direction being greater than that in the opposite direction. This is due to the impact of the waves not allowing the structure to move equally in the opposite direction. Furthermore, the effect of wind was more pronounced in in the following wave direction than in the in the opposite direction. Figure 16B illustrates the differences experienced with and without wind acting on the structure as a function of wave period. The set-down followed the same trend as the surge motion with low frequency waves (long waves) inducing the most offset and contributing to the most set-down experienced by the model. By comparing the magnitudes of the offset and set-down (Figure 13A and Figure 16B), the ratio of Z/X was found to be 2–5%. Such findings can be useful in the calculation of tendon forces and in the calculation of responses in power take-off cables as well as the evaluation of the air gap of an FOWT system in accordance with the DNVGL-ST-0119 standard [46].

5. Conclusions and Recommendations

This paper describes model testing of a TLPWT model with non-rotating blades to better understand its motion and tendon responses when subjected to combined wind and unidirectional regular wave conditions. The turbine structure of the TLPWT model was closely based on the NREL 5 MW concept. The analysis of the measurements and observations of the model response enabled several general conclusions to be drawn as follows:
  • Several free decay tests were performed to evaluate the natural periods of the model in the key degrees of freedom including surge, heave, pitch, and yaw. The natural periods in the surge and pitch motions evaluated from the decay tests had a relatively close agreement to the theoretical values. Furthermore, the natural periods in the surge, heave, and pitch degrees of freedom were all outside the range of 6–20 s, whilst the yaw natural period fell inside this range. As the yaw control of the nacelle is typically used to orient the turbine towards the predominant wind direction, such a situation could lead to an increase in the yaw motion if excited by waves. Therefore, it is recommended to investigate the effect of yaw motion on the performance of a TLPWT.
  • The tested TLPWT model showed typical motion responses to that of generalised TLP systems with significant surge offsets along with stiff heave and pitch motions. The maximum magnitudes for the RAOs of surge motion and all tendons occurred at the longest wave period of 1.23 s (~13.0 s at full-scale) tested in this study.
  • There was evidence that static wind loading on the turbine structure had some impact on the motions and tendon response, particularly in the heave direction, with an average increase of 13.1% in motion magnitude for the tested wind conditions. The wind had a negligible effect on the surge motion and slightly decreased the tendon tensions in all tendons.
  • The results also showed the set-down magnitudes amounting to approximately 2–5% of the offset. Furthermore, the waves are the dominant factor contributing to the set-down of the TLPWT, with a minimal contribution from the static wind forcing.
  • As the environmental condition tested in this study is considered a mild to moderate sea state, it should be stressed that it is unlikely that the maximum motions and loads of the model were captured during these tests. A testing in a survivability sea state condition would likely provide such information. It is therefore recommended that further testing into the survivability of the TLPWT should be performed. Furthermore, the use of a drag plate instead of the static rotor tested in this study can be investigated in future studies, as the thrust distribution would be more uniform. The results of this study could be used for calibrating numerical tools such as CFD codes which can then be used for further investigations.

Author Contributions

Formal analysis, T.M.; investigation, T.M. and N.A.; supervision, N.A.; writing—original draft, T.M.; writing—review & editing, N.A.

Funding

This research received no external funding.

Acknowledgments

The authors would like to thank William Chia for his preliminary work conducted on the topics covered in this study along with thanks to Tim Lilienthal, Christopher Dunn, Uddish Singh, Darren Lee, and Thiban Subramaniam for assistance during the experimental setup, and Jock Ferguson for assistance in 3D printing the turbine model.

Conflicts of Interest

The authors declare no conflict of interest.

Abbreviations and Notations

AMCAustralian Maritime College
CFDComputational Fluid Dynamics
CVCoefficient of Variation (%)
DColumn diameter (m)
dWater depth (m)
ECEnvironmental Condition
FASTFatigue, Aerodynamics, Structures, and Turbulence
FFTFast Fourier Transform
FOWTFloating Offshore Wind Turbine
HWave height (m)
HmaxMaximum wave height (m)
HsSignificant wave height (m)
IxxMass Moment of Inertia about x-axis (kg·mm2)
IyyMass Moment of Inertia about y-axis (kg·mm2)
KBVertical distance measured from the model’s keel to the centre of buoyancy (m)
KGVertical distance measured from the model’s keel to the VCG (m)
LWave length (m)
LCLoad Cell
LoOriginal tendon length (m)
mMean value (vary)
MITMassachusetts Institute of Technology
MTBModel Test Basin
MWMega Watt
NRELNational Renewable Energy Laboratory
NRMSENormalised Root Mean Square Error
PSDPower Spectral Density (m2/Hz)
R2Correlation coefficient (-)
RAOResponse Amplitude Operator
tTime (s)
TWave period (s)
TLPTension Leg Platform
TnNatural period (s)
TpPeak period (s)
UMean wind speed (m/s)
VCGVertical Centre of Gravity
WPWave Probe
XHorizontal offset (m)
ZSet-down (m)
σStandard deviation (vary)

References

  1. Breton, S.-P.; Moe, G. Status, plans and technologies for offshore wind turbines in Europe and North America. Renew. Energy 2009, 34, 646–654. [Google Scholar] [CrossRef]
  2. IRENA. Renewable Capacity Statistics 2018; The International Renewable Energy Agency (IRENA): Abu Dhabi, UAE, 2018. [Google Scholar]
  3. Global Wind Energy Council (GWEC). Global Wind Report: Annual Market Update 2017. Available online: https://www.tuulivoimayhdistys.fi/filebank/1191-GWEC_Global_Wind_Report_April_2018.pdf (accessed on 31 December 2018).
  4. Wang, X.; Zeng, X.; Li, J.; Yang, X.; Wang, H. A review on recent advancements of substructures for offshore wind turbines. Energy Convers. Manag. 2018, 158, 103–119. [Google Scholar] [CrossRef]
  5. Arshad, M.; O’Kelly, B.C. Offshore wind-turbine structures: A review. Proc. Inst. Civ. Eng. Energy 2013, 166, 139–152. [Google Scholar] [CrossRef]
  6. Doherty, P.; Gavin, K. Laterally loaded monopile design for offshore wind farms. Proc. ICE-Energy 2011, 165, 7–17. [Google Scholar] [CrossRef]
  7. Sclavounos, P.; Tracy, C.; Lee, S. Floating offshore wind turbines: Responses in a seastate pareto optimal designs and economic assessment. In Proceedings of the ASME 2008 27th International Conference on Offshore Mechanics and Arctic Engineering, Estoril, Portugal, 15–20 June 2008; American Society of Mechanical Engineers: New York, NY, USA, 2008. [Google Scholar]
  8. Wang, C.; Utsunomiya, T.; Wee, S.; Choo, Y. Research on floating wind turbines: A literature survey. IES J. Part A Civ. Struct. Eng. 2010, 3, 267–277. [Google Scholar] [CrossRef]
  9. Matha, D. Model Development and Loads Analysis of an Offshore Wind Turbine on a Tension Leg Platform with a Comparison to Other Floating Turbine Concepts: April 2009; National Renewable Energy Lab. (NREL): Golden, CO, USA, 2009. [Google Scholar]
  10. Koo, B.J.; Goupee, A.J.; Kimball, R.W.; Lambrakos, K.F. Model tests for a floating wind turbine on three different floaters. J. Offshore Mech. Arct. Eng. 2014, 136, 020907. [Google Scholar] [CrossRef]
  11. Skaare, B.; Hanson, T.D.; Nielsen, F.G.; Yttervik, R.; Hansen, A.M.; Thomsen, K.; Larsen, T.J. Integrated Dynamic Analysis of Floating Offshore Wind Turbines. In Proceedings of the 2007 European Wind Energy Conference and Exhibition, Milan, Italy, 7–10 May 2007. [Google Scholar]
  12. Abdussamie, N.; Drobyshevski, Y.; Ojeda, R.; Thomas, G.; Amin, W. Experimental investigation of wave-in-deck impact events on a TLP model. Ocean Eng. 2017, 142, 541–562. [Google Scholar] [CrossRef]
  13. Hore, J.; Abdussamie, N.; Ojeda, R.; Penesis, I. Experimental investigation into the hydrodynamic performance of a TLP-OWC device. In Proceedings of the 28th International Ocean and Polar Engineering Conference, Sapporo, Japan, 10–15 June 2018. [Google Scholar]
  14. Bachynski, E.E.; Moan, T. Design considerations for tension leg platform wind turbines. Mar. Struct. 2012, 29, 89–114. [Google Scholar] [CrossRef]
  15. Sclavounos, P.; Lee, S.; DiPietro, J.; Potenza, G.; Caramuscio, P.; De Michele, G. Floating offshore wind turbines: tension leg platform and taught leg buoy concepts supporting 3-5 MW wind turbines. In Proceedings of the European Wind Energy Conference, Warsaw, Poland, 20–23 April 2010. [Google Scholar]
  16. Xu, N.; Zhang, J. Pitch/Roll Static Stability of Tension Leg Platforms. In Proceedings of the ASME 29th International Conference on Ocean, Offshore and Arctic Engineering, Shanghai, China, 6–11 June 2010; American Society of Mechanical Engineers: New York, NY, USA, 2010. [Google Scholar]
  17. Halkyard, J. Floating Offshore Platform Design, in Handbook of Offshore Engineering; Elsevier: Amsterdam, The Netherlands, 2005; pp. 419–661. [Google Scholar]
  18. Nihei, Y.; Iijima, K.; Murai, M.; Ikoma, T. A comparative study of motion performance of four different FOWT designs in combined wind and wave loads. In Proceedings of the ASME 2014 33rd International Conference on Ocean, Offshore and Arctic Engineering, San Francisco, CA, USA, 8–13 June 2014; American Society of Mechanical Engineers: New York, NY, USA, 2014. [Google Scholar]
  19. Chakrabarti, S.K. Offshore Structure Modeling; World Scientific: Singapore, 1994; Volume 9. [Google Scholar]
  20. Low, Y. Frequency domain analysis of a tension leg platform with statistical linearization of the tendon restoring forces. Mar. Struct. 2009, 22, 480–503. [Google Scholar] [CrossRef]
  21. Srinivasan, C.; Gaurav, G.; Serino, G.; Miranda, S. Ringing and springing response of triangular TLPs. Int. Shipbuild. Prog. 2011, 58, 141–163. [Google Scholar]
  22. Matsui, T.; Sakoh, Y.; Nozu, T. Second-order sum-frequency oscillations of tension-leg platforms: Prediction and measurement. Appl. Ocean Res. 1993, 15, 107–118. [Google Scholar] [CrossRef]
  23. Feng, W.H.; Hua, F.Y.; Yang, L. Dynamic analysis of a tension leg platform for offshore wind turbines. J. Power Technol. 2014, 94, 42–49. [Google Scholar]
  24. Nihei, Y.; Matsuura, M.; Murai, M.; Iijima, K.; Ikoma, T. New Design Proposal for the TLP Type Offshore Wind Turbines. In Proceedings of the ASME 2013 32nd International Conference on Ocean, Offshore and Arctic Engineering, Nantes, France, 9–14 June 2013; The American Society of Mechanical Engineers (ASME): Nantes, France, 2013. [Google Scholar]
  25. Jonkman, J.; Butterfield, S.; Musial, W.; Scott, G. Definition of a 5-MW Reference Wind Turbine for Offshore System Development; Technical Report No. NREL/TP-500-38060; National Renewable Energy Laboratory: Golden, CO, USA, 2009.
  26. Kimball, R.; Goupee, A.J.; Fowler, M.J.; de Ridder, E.-J.; Helder, J. Wind/wave basin verification of a performance-matched scale-model wind turbine on a floating offshore wind turbine platform. In Proceedings of the ASME 2014 33rd International Conference on Ocean, Offshore and Arctic Engineering, San Francisco, CA, USA, 8–13 June 2014; American Society of Mechanical Engineers: New York, NY, USA, 2014. [Google Scholar]
  27. Tracy, C.C.H. Parametric Design of Floating Wind Turbines; Massachusetts Institute of Technology: Cambridge, MA, USA, 2007. [Google Scholar]
  28. Oguz, E.; Clelland, D.; Day, A.H.; Incecik, A.; López, J.A.; Sánchez, G.; Almeria, G.G. Experimental and numerical analysis of a TLP floating offshore wind turbine. Ocean Eng. 2018, 147, 591–605. [Google Scholar] [CrossRef]
  29. Jonkman, J.M. Dynamics Modeling and Loads Analysis of an Offshore Floating Wind Turbine; Technical Report NREL/TP-500-41958; National Renewable Energy Laboratory: Golden, CO, USA, 2008.
  30. Bachynski, E.E. Design and Dynamic Analysis of Tension Leg Platform Wind Turbines. Ph.D. Thesis, Norwegian University of Science and Technology, Trondheim, Norway, March 2014. [Google Scholar]
  31. Nihei, Y.; Fujioka, H. Motion characteristics of TLP type offshore wind turbine in waves and wind. In Proceedings of the ASME 2010 29th International Conference on Ocean, Offshore and Arctic Engineering, Shanghai, China, 6–11 June 2010; American Society of Mechanical Engineers: New York, NY, USA, 2010. [Google Scholar]
  32. Martin, H.R.; Kimball, R.W.; Viselli, A.M.; Goupee, A.J. Methodology for wind/wave basin testing of floating offshore wind turbines. J. Offshore Mech. Arct. Eng. 2014, 136, 020905. [Google Scholar] [CrossRef]
  33. Zhao, Y.; Yang, J.; He, Y. Preliminary design of a multi-column TLP foundation for a 5-MW offshore wind turbine. Energies 2012, 5, 3874–3891. [Google Scholar] [CrossRef]
  34. Zamora-Rodriguez, R.; Gomez-Alonso, P.; Amate-Lopez, J.; De-Diego-Martin, V.; Dinoi, P.; Simos, A.N.; Souto-Iglesias, A. Model scale analysis of a TLP floating offshore wind turbine. In Proceedings of the ASME 2014 33rd International Conference on Ocean, Offshore and Arctic Engineering, San Francisco, CA, USA, 8–13 June 2014; American Society of Mechanical Engineers: San Francisco, CA, USA, 2014. [Google Scholar]
  35. Hansen, A.M.; Laugesen, R.; Bredmose, H.; Mikkelsen, R.; Psichogios, N. Small scale experimental study of the dynamic response of a tension leg platform wind turbine. J. Renew. Sustain. Energy 2014, 6, 053108. [Google Scholar] [CrossRef]
  36. DNV. Recommended Practice DNV-RP-C205: Environmental Conditions and Environmental Loads; DNV: Oslo, Norway, 2010. [Google Scholar]
  37. Chia, C.K.W. Experimental Investigation into Extreme Wave Impact on a TLP Offshore Wind Turbine. In National Centre for Maritime Engineering & Hydrodynamics; University of Tasmania: Launceston, Australia, 2017. [Google Scholar]
  38. Banks, M.; Abdussamie, N. The response of a semisubmersible model under focused wave groups: Experimental investigation. J. Ocean Eng. Sci. 2017, 2, 161–171. [Google Scholar] [CrossRef]
  39. Groves, B.; Abdussamie, N. Generation of rogue waves at model scale. J. Ocean Eng. Sci. 2019, in press. [Google Scholar] [CrossRef]
  40. Qualysis. Qualisys Motion Tracking System. 2018. Available online: https://www.qualisys.com/ (accessed on 31 December 2018).
  41. Chakrabarti, S.K. Hydrodynamics of Offshore Structures; WIT Press: Southampton, UK, 1987. [Google Scholar]
  42. Naess, A.; Moan, T. Stochastic Dynamics of Marine Structures; Cambridge University Press: Cambridge, UK, 2012. [Google Scholar]
  43. Abdussamie, N.; Ojeda, R.; Drobyshevski, Y.; Thomas, G.; Amin, W. Dynamic behaviour of a TLP in waves: CFD versus model tests. In Proceedings of the 28th International Ocean and Polar Engineering Conference, Sapporo, Japan, 10–15 June 2018. [Google Scholar]
  44. Abdussamie, N. Towards Reliable Prediction of Wave-in-Deck Loads and Response of Offshore Structures. Ph.D. Thesis, University of Tasmania, Launceston, Australia, June 2016. [Google Scholar]
  45. Demirbilek, Z. Design formulae for offset, set down and tether loads of a tension leg platform (TLP). Ocean Eng. 1990, 17, 517–523. [Google Scholar] [CrossRef]
  46. DNVGL. Floating Wind Turbine Structures—Standard—DNVGL-ST-0119; DNV.GL: Høvik, Norway, 2018. [Google Scholar]
Figure 1. Constructed TLPWT model (A), experimental setup (B).
Jmse 07 00056 g001
Figure 2. Plan view of external pontoon configuration (A) and profile view of tendon arrangement (B).
Jmse 07 00056 g002
Figure 3. Plan view of TLPWT experimental setup (not to scale).
Jmse 07 00056 g003
Figure 4. Wave height data measured at 5.8 m away from the wavemaker and at different distances from the basin side wall.
Jmse 07 00056 g004
Figure 5. Measured wave elevation time history at WP2 (A), PSD for wave elevation time history (B) and comparisons with wave theory (C).
Jmse 07 00056 g005
Figure 6. Anemometer recording locations for wind speed calibration.
Jmse 07 00056 g006
Figure 7. Recorded wind speeds for each test location.
Jmse 07 00056 g007
Figure 8. Free decay test results for surge motion (A), yaw motion (B), heave motion (C) and pitch motion (D).
Jmse 07 00056 g008
Figure 9. Time history of wave elevation at WP2 and the selected time window for data analysis.
Jmse 07 00056 g009
Figure 10. Time history of wave elevations, dynamic tensions and surge motions for five repeated runs.
Jmse 07 00056 g010aJmse 07 00056 g010b
Figure 11. Time history of model motions recorded for condition 3: surge motion (A), sway motion (B), heave motion (C), yaw motion (D), pitch motion (E) and roll motion (F).
Jmse 07 00056 g011aJmse 07 00056 g011b
Figure 12. Time history of dynamic tendon tension measured by load cells for condition 3: LC1 and LC4 (A) and LC2 and LC3 (B).
Jmse 07 00056 g012aJmse 07 00056 g012b
Figure 13. Motion response amplitude operators for each degree of freedom: Surge RAO (A), sway RAO (B), heave RAO (C), roll RAO (D), pitch RAO (E) and yaw RAO (F).
Jmse 07 00056 g013aJmse 07 00056 g013b
Figure 14. Dynamic tendon tension response amplitude operators for each tendon: LC1 RAO (A), LC2 RAO (B), LC3 RAO (C), LC4 RAO (D).
Jmse 07 00056 g014
Figure 15. Definition sketch for offset and set-down relationship.
Jmse 07 00056 g015
Figure 16. Comparison of set-down time history for condition 3 (A) and maximum set-down experienced for all conditions (B).
Jmse 07 00056 g016
Table 1. ‘As constructed’ parameters of TLP hull.
ParameterPlannedTested Model-ScaleReference for Planned Full-Scale Values
Full-ScaleModel-Scale
Hull column diameter18.00 m160.71 mm160.00 mmBachynski and Moan [14]
Hull column height52.60 m469.64 mm600.00 mmBachynski and Moan [14]
Draft47.89 m427.59 mm500.00 mmMatha [9]
Freeboard5.00 m44.64 mm100.00 mmMatha [9]
Pontoon length18.00 m160.71 mm160.00 mmBachynski and Moan [14]
Pontoon width2.40 m21.42 mm21.70 mmBachynski and Moan [14]
Pontoon height2.40 m21.42 mm21.70 mmBachynski and Moan [14]
Hull structural mass--2.63 kg-
Ballast mass--1.82 kg-
Total pre-tension--5.11 kg-
Volumetric displacement11.80 × 107 m38.44 × 106 mm31.04 × 107 mm3Bachynski and Moan [14]
Water depth150.00 m1.34 m0.90mBachynski and Moan [14]
Table 2. ‘As constructed’ parameters of the scaled NREL 5 MW turbine.
ParameterPlannedTested Model-ScaleReference for Planned Full-Scale Values
Full-ScaleModel-Scale
Tower height90.00 m803.00 mm800.00 mmMatha [9]
Tower bottom diameter6.00 m53.50 mm53.30 mm
Tower top diameter3.87 m34.50 mm34.50 mm
Hub height90.00 m803.00 mm800.00 mm
Rotor hub diameter3.00 m26.70 mm35.00 mm
Rotor diameter126.00 m1.12 m1.13 m
Overhang5.00 m44.60 mm45.00 mm
Blade length61.50 m549.00 mm550.00 mm
Tower mass3.47 × 105 kg247.00 g246.00 g
Nacelle mass2.40 × 105 kg171.00 g170.00 g
Rotor mass1.10 × 103 kg78.20 g160.00 g
Table 3. Summary of component materials and masses.
Model ComponentMaterialMass (g)
Hull cylinderPolyvinyl Chloride (PVC)1890
External pontoonsTimber72.00 (each)
Bottom and top capsPolyvinyl Chloride (PVC)173.00 (each)
BallastLead1866.00
TurbinePLA plastic576.00
Qualisys probes-50.00
Tendon lines7-Strand, coated steel wire-
Table 4. Summary of mass and inertia parameters of the TLPWT model.
ParameterValueUnit
Vertical Centre of Gravity (KG)0.29m
Vertical Centre of Buoyancy (KB)0.24m
Mass Moment of Inertia about x-axis, Ixx9.71 × 105kg·mm2
Mass Moment of Inertia about y-axis, Iyy9.79 × 105kg·mm2
Mass Moment of Inertia about z-axis, Izz3.26 × 104kg·mm2
Table 5. Environmental condition to be tested.
ParameterFull-ScaleModel-Scale
Significant wave height, Hs (m)4.400.039
Peak wave period, Tp (s)10.601.00
Mean wind speed at hub, U (m/s)18.001.70
Table 6. Experimental test matrix for regular waves.
ConditionH (m)T (s)ConditionH (m)H/Hs (-)T (s)
10.0391.230110.0250.6411.000
21.147120.0300.769
31.115130.0350.897
41.078140.0401.026
51.043150.0451.154
61.000160.0501.282
70.963170.0551.410
80.935180.0601.539
90.905190.0651.667
100.777200.0701.795
Table 7. Comparison between theoretical and obtained natural periods, with full-scale equivalent values.
Degree of FreedomPredicted Tn (s)Measured Tn (s)Full-Scale Equivalent Tn (s)
Surge2.1132.07821.99
Heave0.2130.2562.71
Pitch0.2430.2602.75
Yaw0.6750.5866.20
Table 8. Results of repeatability analysis for wave only runs.
RunWP2 (mm)LC3 (N)Qualisys, X (mm)
MaxMinMaxMinMaxMin
Run 122.24−20.731.41−1.3316.14−18.19
Run 222.26−20.771.44−1.3616.46−18.23
Run 322.47−20.751.42−1.3316.34−18.23
Run 422.50−20.751.42−1.3716.39−18.14
Run 522.36−20.861.44−1.3816.18−18.48
Mean, m22.37−20.771.43−1.3516.30−18.25
Standard deviation, σ 0.120.050.010.020.140.13
CV (%)0.540.240.701.480.860.71
NRMSE (%)0.470.220.881.550.750.65
R2 (-)0.99260.97450.9978
Table 9. Results of repeatability analysis for wave with wind runs.
RunWP2 (mm)LC3 (N)Qualisys, X (mm)
MaxMinMaxMinMaxMin
Run 122.61−20.641.36−1.4615.38−18.92
Run 222.52−20.551.39−1.5615.29−19.29
Run 322.33−20.751.38−1.4815.33−19.29
Run 422.63−20.571.43−1.6615.11−18.90
Run 522.48−20.501.36−1.4915.33−19.18
Mean, m22.55−20.601.38−1.5315.28−19.12
Standard deviation, σ 0.120.100.030.080.100.19
CV (%)0.530.492.175.230.650.99
NRMSE (%)0.500.421.894.790.610.91
R2 (-)0.99970.99930.9994
Table 10. Maximum RAO values of the TLPWT model at T = 1.23 s.
RAO ParameterMax RAO (Wave Only)Max RAO (Wave and Wind)Wind Effect
Surge motion1.091 mm/mm1.102 mm/mm1.0%
LC10.167 N/mm0.158 N/mm−6.0%
LC20.298 N/mm0.292 N/mm−2.0%
LC30.320 N/mm0.340 N/mm6.0%
LC40.169 N/mm0.168 N/mm−1.0%

