Article

Damage-Softening Model and Shear Behavior of Geosynthetic–Calcareous Sand Interface Based on Large-Scale Monotonic Shear Tests


1
School of Urban Construction and Safety Engineering, Institute of Engineering Disaster Prevention and Mitigation, Hubei University of Education, Wuhan 430205, China
2
State Key Laboratory of Geomechanics and Geotechnical Engineering Safety, Institute of Rock and Soil Mechanics, Chinese Academy of Sciences, Wuhan 430071, China
*
Authors to whom correspondence should be addressed.
These authors contributed equally to this work.
J. Mar. Sci. Eng. 2026, 14(9), 836; https://doi.org/10.3390/jmse14090836
Submission received: 18 March 2026 / Revised: 22 April 2026 / Accepted: 28 April 2026 / Published: 30 April 2026

Abstract

Geosynthetics-reinforced soil technology represents an innovative reinforcement method for calcareous sand foundations and revetment engineering in coral reef areas. The interaction response at the reinforced soil interface directly influences the safety and stability of reinforced soil structures. However, research on the interaction mechanisms between geosynthetics and calcareous sand interfaces remains insufficient. Therefore, this paper investigates the effects of different normal stresses and various interface types on the shear characteristics of the geosynthetics–calcareous sand interface through a series of large-scale monotonic direct shear tests. By integrating statistical damage theory and accounting for the influence of residual strength, we establish the constitutive relation for interface damage. The results indicate that the shear stress–displacement curves for both the geosynthetics–calcareous sand interface and the unreinforced calcareous sand exhibit softening behavior. Furthermore, the relationship between the interface shear modulus and horizontal displacement for the geogrid–calcareous sand and unreinforced calcareous sand adheres to a power function model, while the relationship for the geotextile–calcareous sand follows a logarithmic function model. In the structural design of geosynthetics-reinforced calcareous sand, it is crucial to consider the influence of residual shear strength on structural stability. This study proposes a statistical damage constitutive model that accounts for the strain-softening characteristics of the geosynthetics–calcareous sand interface, while also considering the impact of residual strength. The findings provide a theoretical basis for the stability analysis of geosynthetics-reinforced calcareous sand structures in coral reefs with significant engineering implications for island reef construction, coastal development, and bank slope protection projects.

1. Introduction

Calcareous sand is widely distributed in tropical marine environments at low latitudes, including the South China Sea, the Red Sea, the Persian Gulf, the Hawaiian Islands, and the coastlines of Australia, India, and Saudi Arabia. It is primarily deposited from the skeletal remains and shell debris of marine organisms, with calcium carbonate as its main component, which provides a certain bearing capacity and strength [1]. Calcareous sand, as a key building material and foundation in island reef engineering, has garnered significant attention due to its widespread availability and ease of acquisition. However, calcareous sand found in the South China Sea exhibits high porosity, irregular particle shapes, and elevated calcium carbonate content, which can result in particle breakage under certain stress levels [2,3,4,5,6]. These characteristics pose substantial risks to the structural performance of geotechnical engineering projects on island reefs. Therefore, it is crucial to improve the mechanical properties of this material.
Geosynthetics-reinforced soil technology involves integrating geosynthetics into soil to create reinforced soil composites. This method effectively disperses and transfers stress through mechanisms such as friction, embedding, and occlusion between the geosynthetics and the soil, thereby enhancing the deformation modulus of the reinforced soil and limiting excessive deformation. Consequently, this leads to improved bearing capacity and enhanced foundation stability [7,8,9,10,11,12,13,14]. Regarding the mechanics and deformation mechanisms of geosynthetics-reinforced calcareous sand, several scholars have explored this topic through triaxial testing [9,10,13,14,15,16]. Their investigations primarily focused on the key factors influencing the mechanical behavior of geosynthetics-reinforced calcareous sand. They discovered that the incorporation of geogrids or geotextiles into calcareous sand enhances both the peak strength and strain during failure while significantly reducing post-peak shear strength loss. Although triaxial tests provide a viable method for investigating the reinforced soil interface by accurately simulating the actual stress state of the sample, the interaction mechanisms and mechanical properties of the geosynthetics-reinforced soil interface are inherently complex [7]. Therefore, a comprehensive and in-depth study of the interface characteristics of reinforced calcareous sand necessitates more than solely relying on triaxial testing.
The direct shear test is a robust method for investigating the interaction mechanisms between reinforcement and soil [17,18,19,20,21]. The behavior of the reinforced soil interface significantly affects the safety and stability of reinforced soil structures [22,23,24,25]. Currently, a substantial body of research has been published regarding the interfacial shear properties of reinforced terrigenous sand [26,27,28,29,30,31,32,33]. For example, He et al. [30] established a hyperbolic model based on the findings from large-scale direct shear tests, which characterizes the nonlinear relationship between shear stress and displacement at the reinforcement–soil interface and proposed an approximate calculation formula. Furthermore, several scholars have developed theoretical models to elucidate the softening or hardening behavior of the reinforced soil interface. Esterhulzen et al. [26] and Seo et al. [27] introduced a combined model to represent the interfacial shear stress-displacement-softening behavior, which primarily includes the peak strength envelope, the residual strength envelope, and the relationship between the residual factor and displacement ratio. While these combined theoretical models can partially reflect the characteristics of interfacial shear behavior, they do not directly characterize interfacial shear damage behavior. Notably, there is still a limited number of studies on the interaction mechanisms between geosynthetics and the calcareous sand interface [34,35,36,37,38], leaving the shear damage behavior of the geosynthetics-calcareous sand interface unclear.
Numerous studies demonstrate that the fundamental principles of damage mechanics can effectively characterize the shear behavior response of the reinforcement–soil interface [39,40,41,42,43]. Pal & Wathugala [39] introduced an elastoplastic constitutive model for the geosynthetics-soil interface, grounded in the concept of the disturbed state, which captures the essential characteristics of the interface response, including dilatancy, hardening, and softening. Zhang et al. [40] developed an enhanced elastic-plastic damage model to describe both the monotonic and cyclic behavior of the interface between geotextile and gravel soil, accurately representing the stress-strain relationship. Kwak et al. [41] proposed a new disturbance function parameter, based on the fundamental principles of the conceptual constitutive model of the disturbed state, to describe the chemical degradation of the geosynthetics–soil interface under dynamic conditions. Chang & Feng [42] established a constitutive model based on the disturbed state concept to describe the shear behavior of the geosynthetics interface under both static and dynamic conditions. Currently, most researchers primarily focus on developing combined models that address the nonlinear shear characteristics of the geosynthetics-terrigenous siliceous sand interface. However, theoretical studies concerning the complete process of shear deformation at the reinforced soil interface, grounded in the fundamental principles of damage mechanics, remain limited. Furthermore, theoretical investigations into the constitutive model of the geosynthetics-calcareous sand interface are notably sparse.
In this study, a series of large-scale monotonic direct shear (MDS) tests were conducted to analyze the variations in interfacial shear stress-displacement and interfacial shear modulus of calcareous sand, both with and without reinforcement, under varying normal stresses. Additionally, statistical damage theory was introduced, to establish a comprehensive characterization model for the shear deformation of the geosynthetics-calcareous sand interface, while accounting for the influence of residual strength. The findings of this research provide a theoretical basis for the safety and stability analysis of geosynthetics-reinforced calcareous sand structures on coral reefs, offering significant reference value for coastal zone development, island reef construction, and bank slope protection.

2. Materials and Methods

2.1. Materials

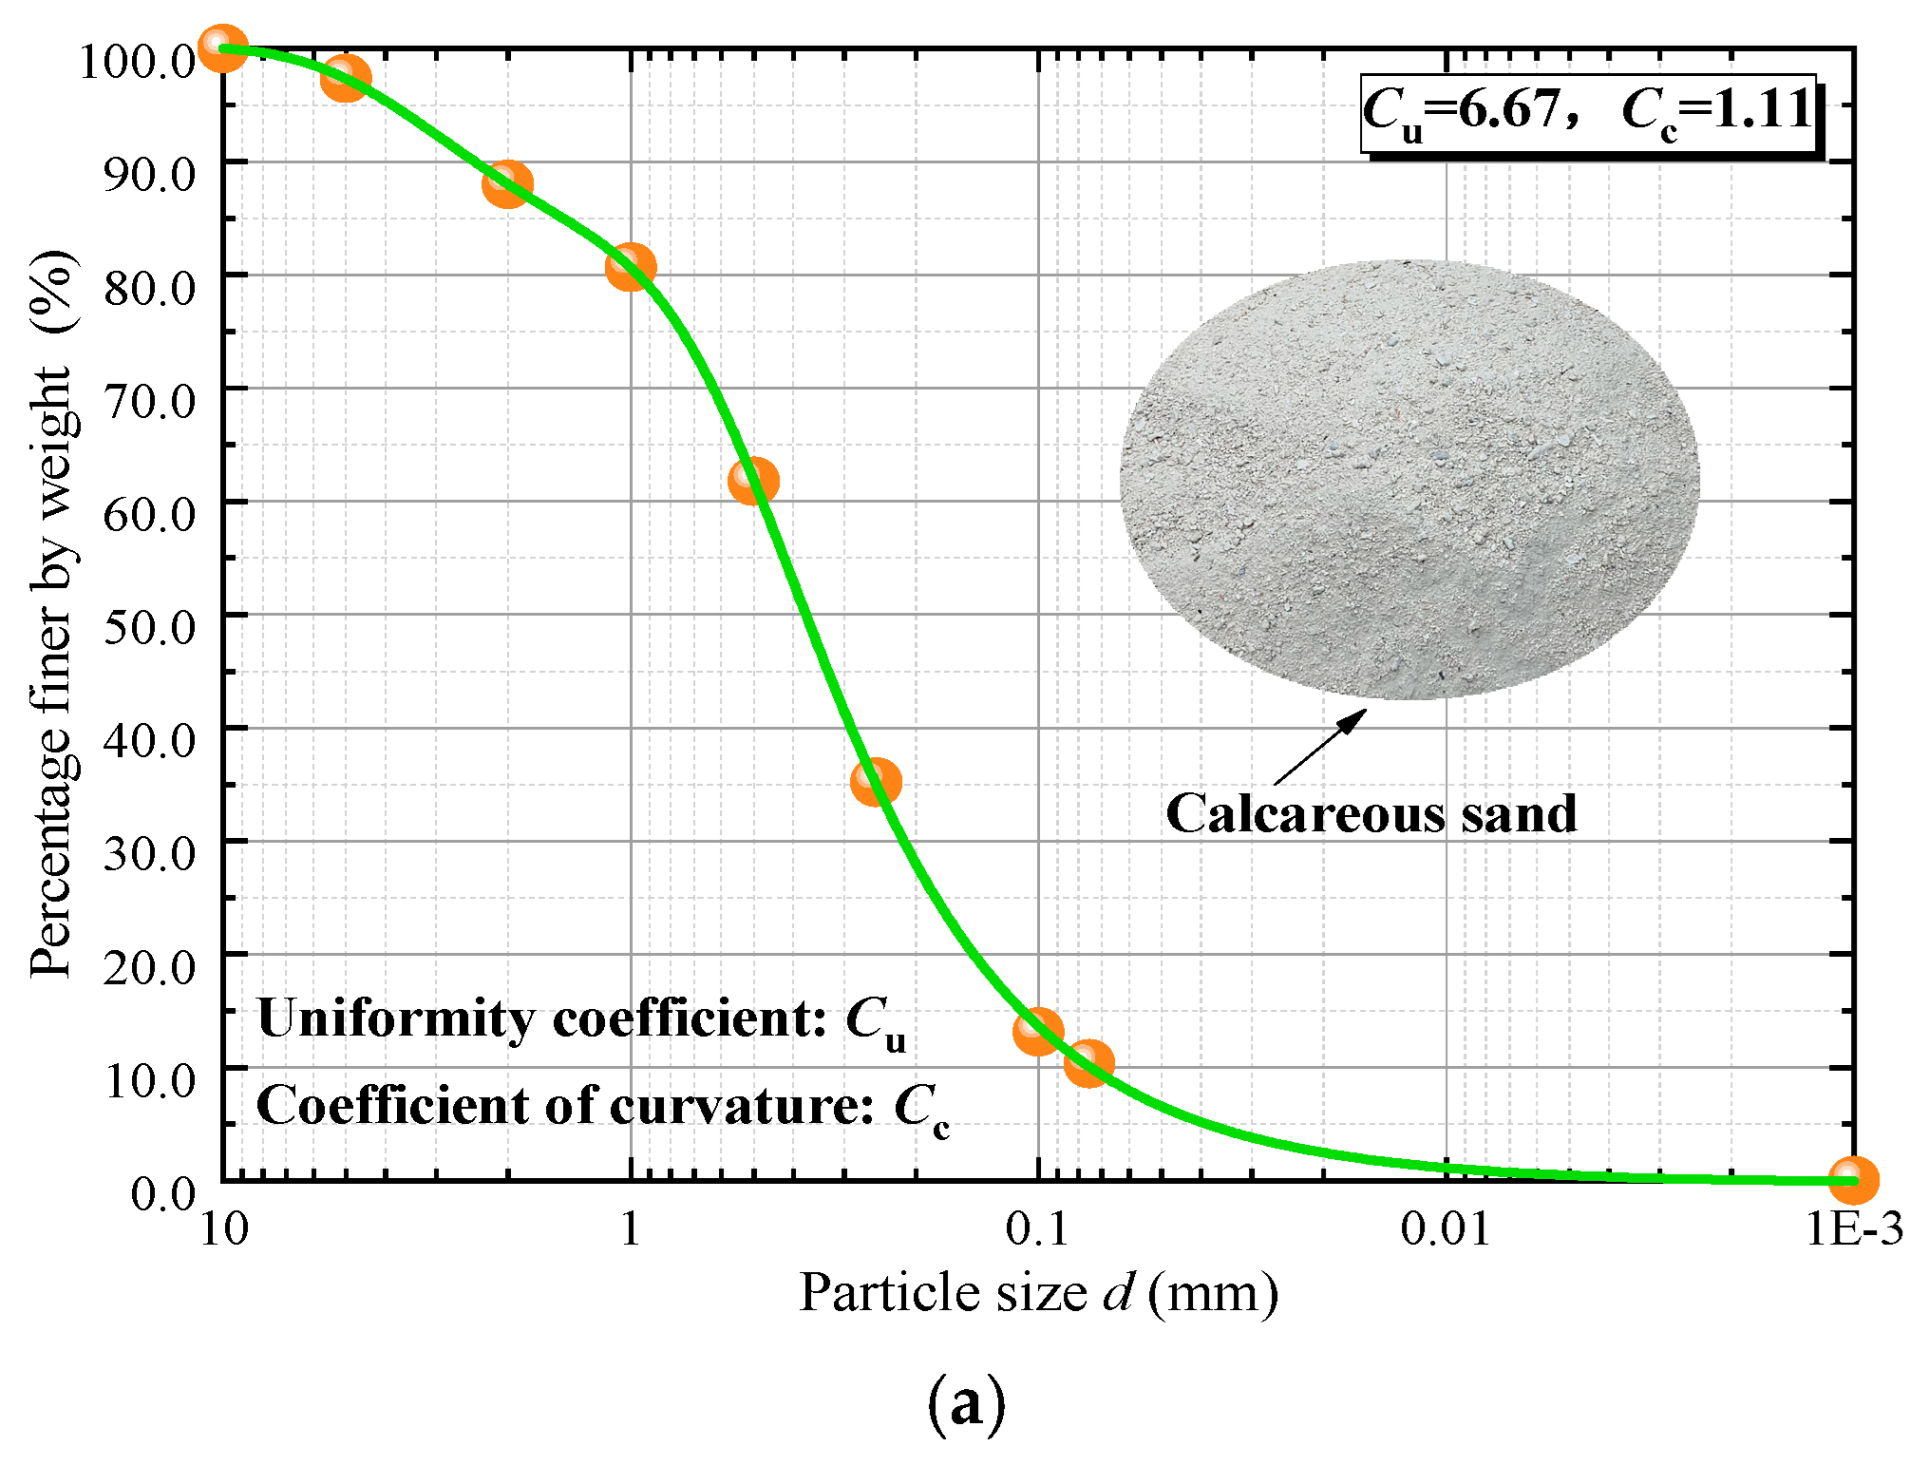
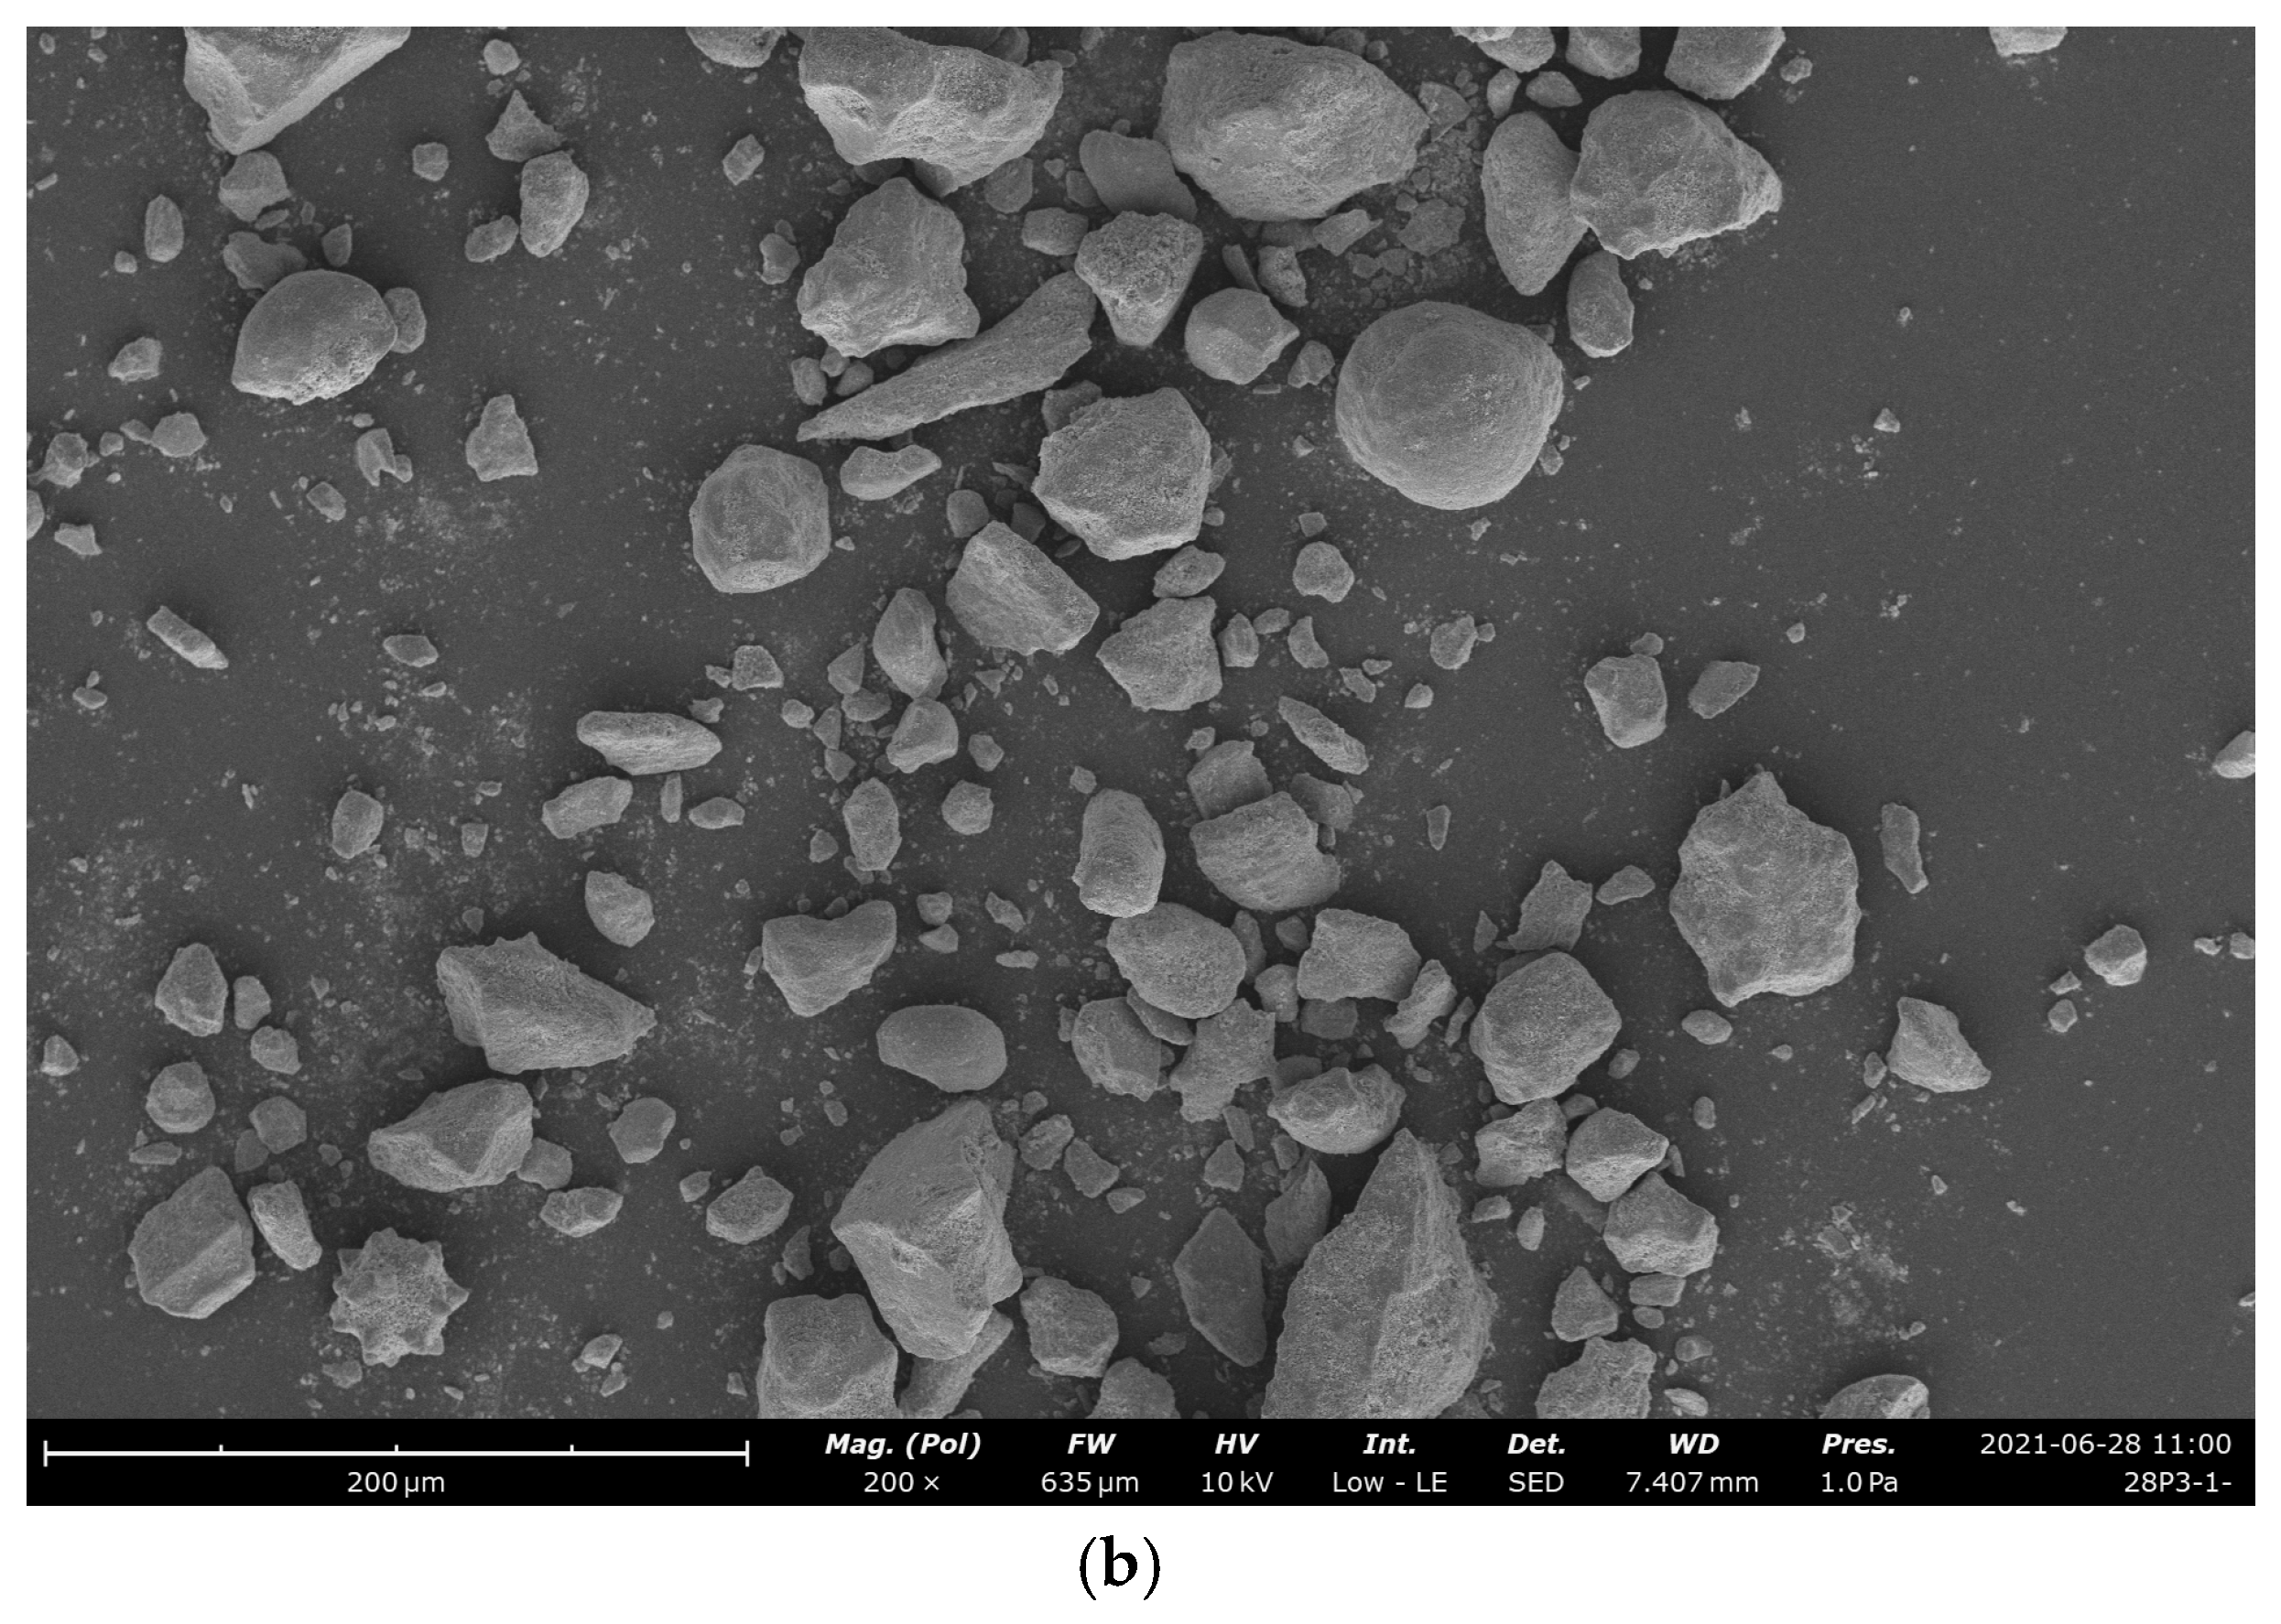
In this study, the filler utilized in the laboratory tests is calcareous sand obtained from a coral reef in the South China Sea. Particle analysis of the calcareous sand filler was conducted in accordance with ASTM D5321 [44], and the resulting particle size distribution curve is presented in Figure 1. The physical properties of the filler are characterized by an effective particle size of d10 = 0.0735 mm, d30 = 0.2 mm, and a restricted particle size of d60 = 0.49 mm. The coefficient of curvature (Cc) is measured at 1.11, while the uniformity coefficient (Cu) is 6.67. These parameters indicate that the filler exhibits good continuity and uniform gradation, with the particle size predominantly concentrated in the range of 0.01 mm to 10 mm. Additionally, the maximum dry density of the filler is recorded at 1.68 g/cm3.
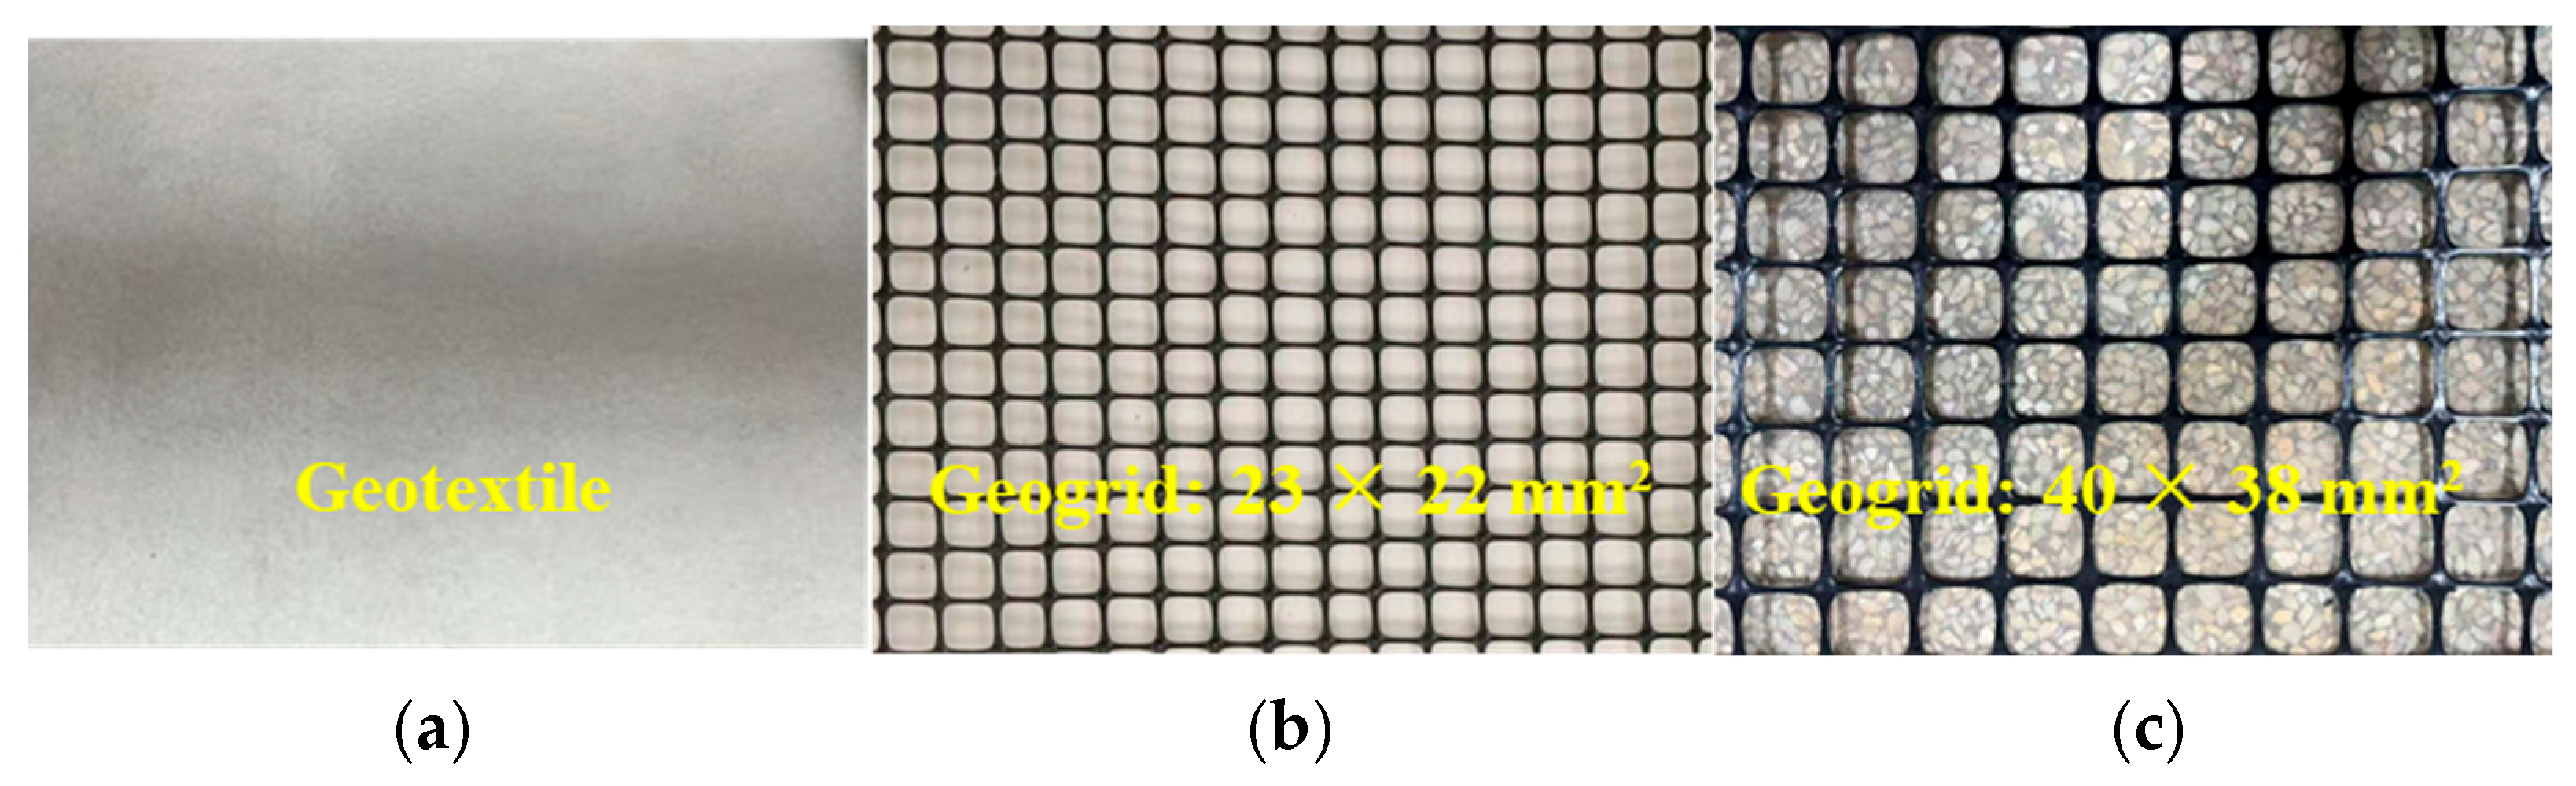
In this study, nonwoven geotextile and two types of geogrids are employed as interface reinforcement materials (Figure 2). The ultimate tensile strength of the geotextile (Figure 2a) is 7.4 kN/m, with an elongation of 63% (Figure 2a). One type of geogrid features a small mesh and low strength, characterized by a mesh size of 23 mm × 22 mm (Figure 2b) and an ultimate tensile strength of 15.7 kN/m. The other geogrid exhibits a larger mesh and higher strength, with a mesh size of 40 mm × 38 mm (Figure 2c) and an ultimate tensile strength of 40 kN/m for the longitudinal ribs. The mechanical properties of the geogrid and geotextile were evaluated through a wide tensile test (ASTM D4595, 2011) [45]. The technical specifications of the geogrid and geotextile are summarized in Table 1 and Table 2, respectively.

2.2. Test Apparatus

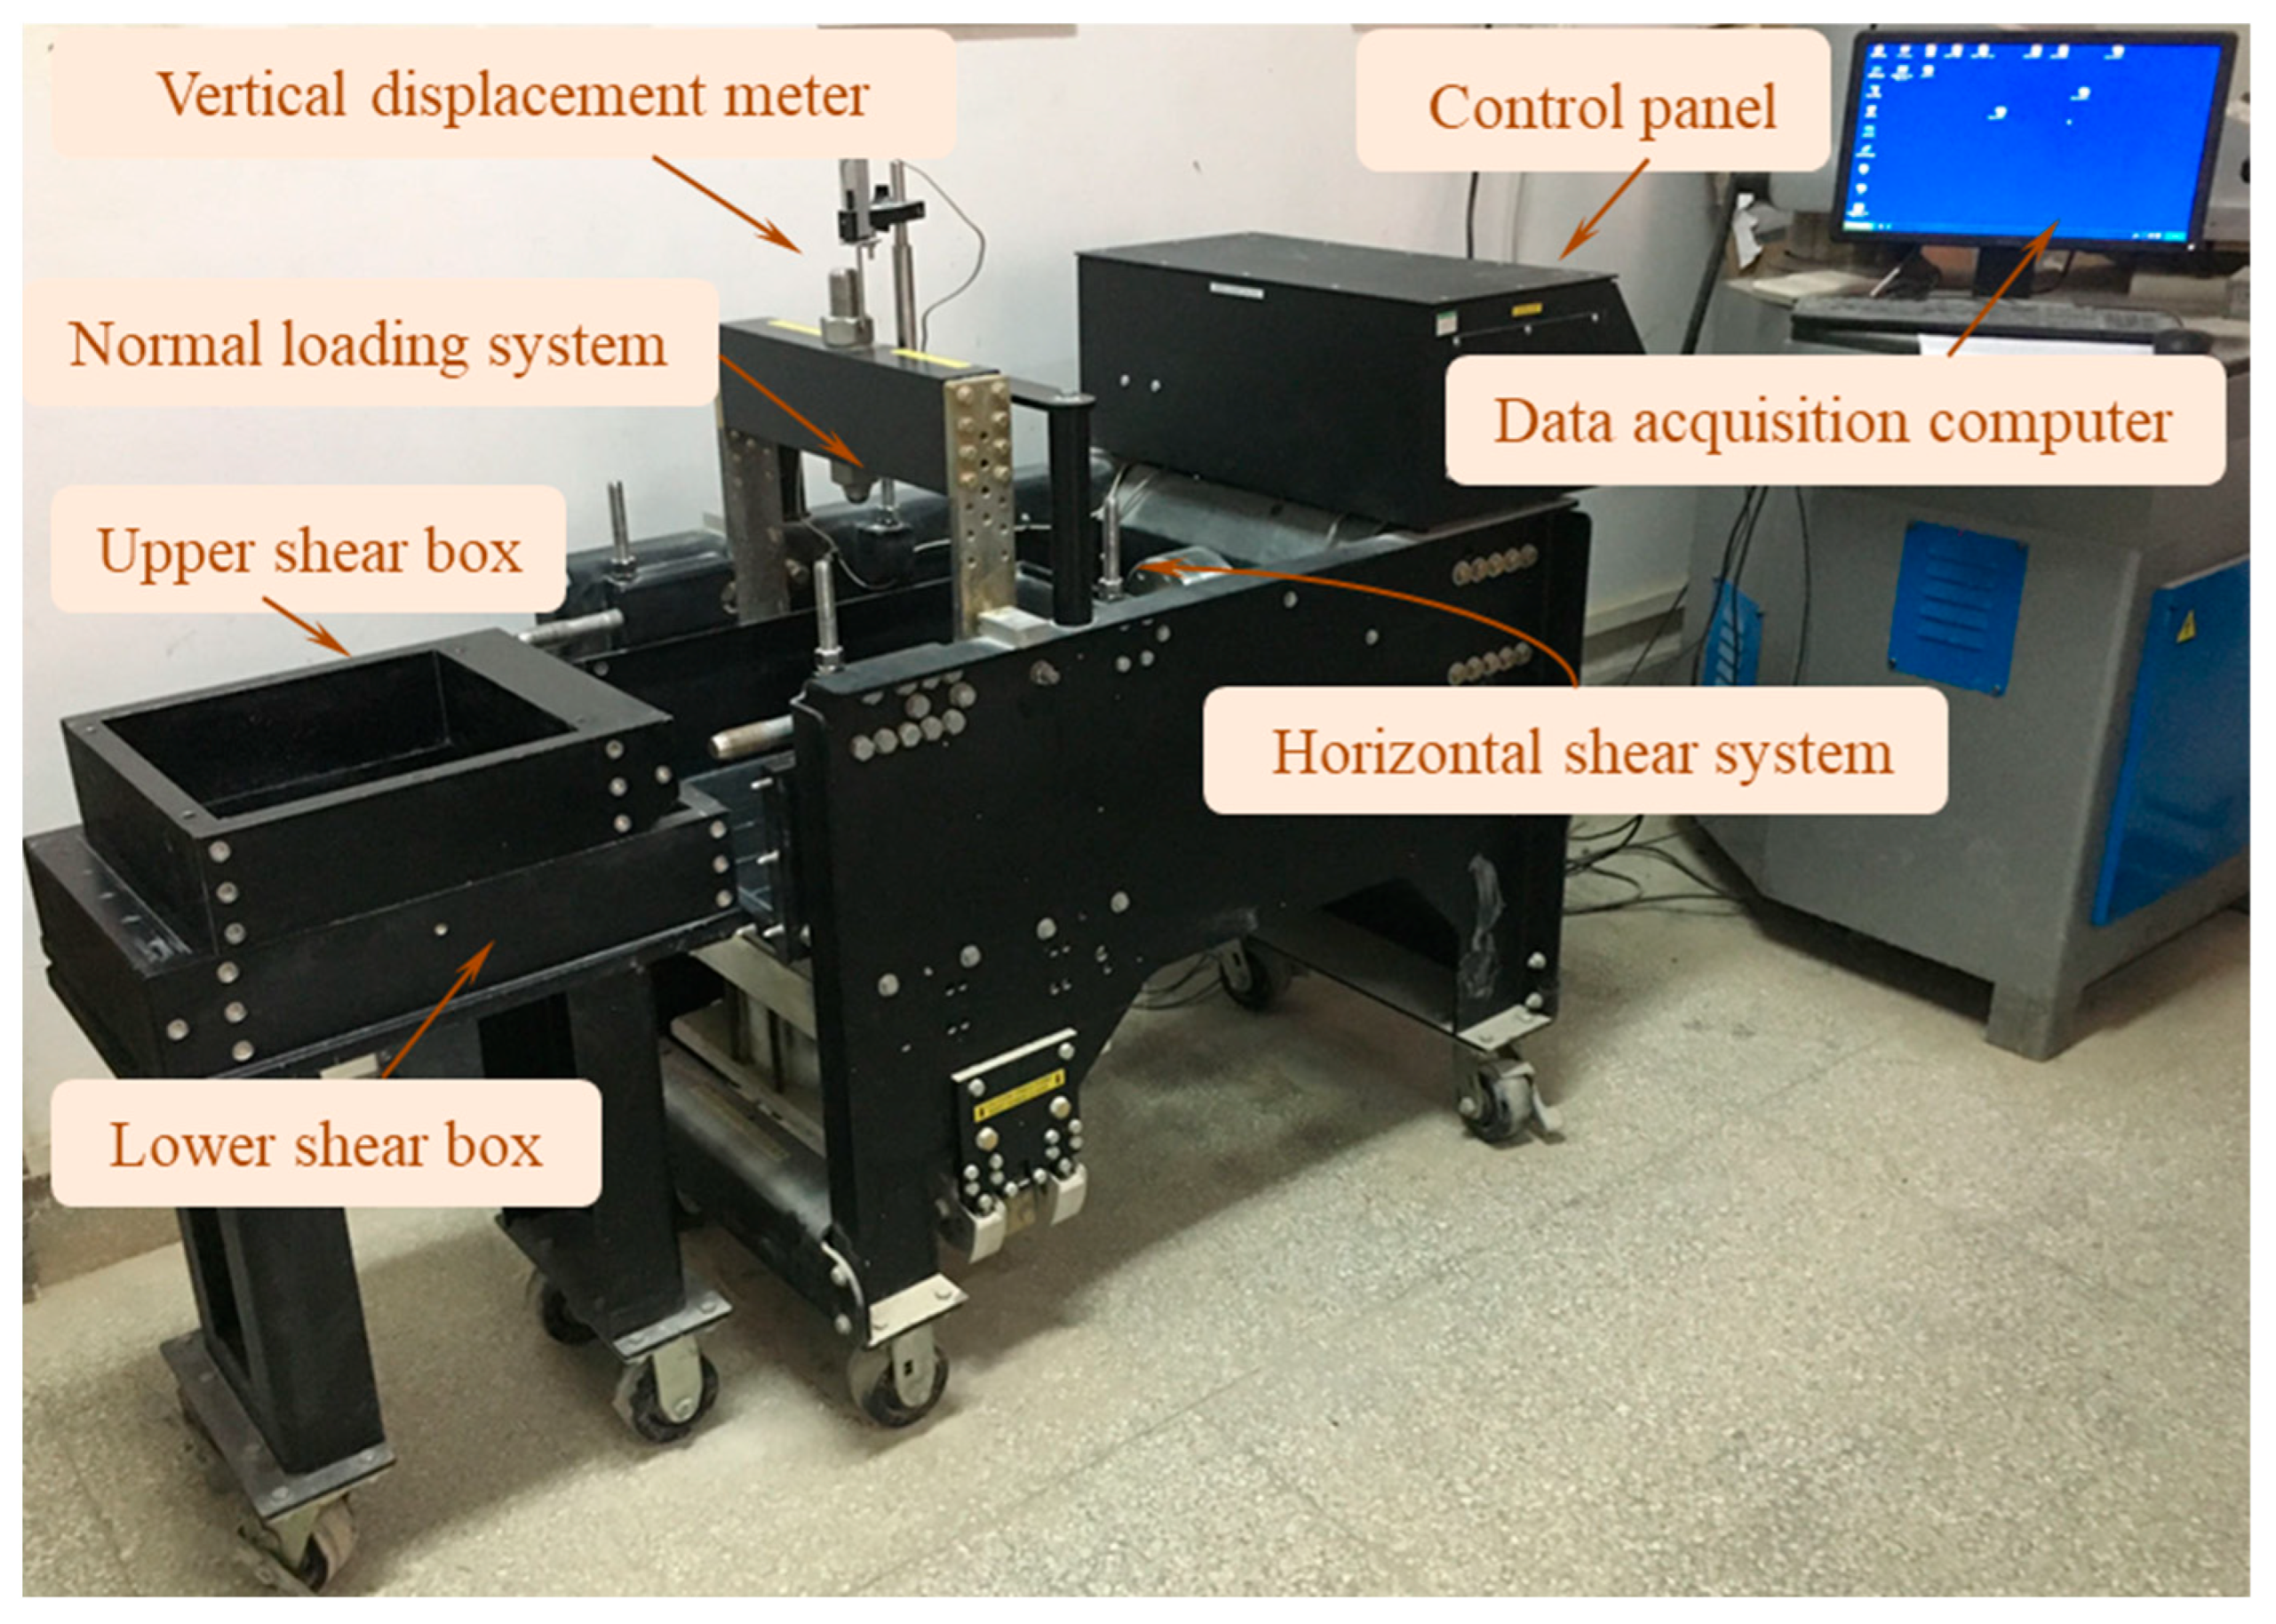
In this study, the Shear Trac III model direct shear apparatus was utilized for large-scale direct shear testing, as illustrated in Figure 3. This apparatus comprises three primary components: a normal pressurization system, a horizontal shearing system, and a control and data acquisition system. It operates based on a closed-loop feedback control architecture that incorporates an all-electric electromechanical servo/micro-stepping drive. A servo motor is employed to apply horizontal shear force, while parameters such as shear displacement, shear rate, and normal stress are configured through the control system. The acquisition system facilitates real-time monitoring of test data. The shear box dimensions are as follows: the upper section measures 305 mm (length) × 305 mm (width) × 100 mm (height), while the lower section measures 406 mm (length) × 305 mm (width) × 100 mm (height). The lower shear box is designed to be 100 mm longer than the upper box to ensure a constant contact area throughout the shearing process. This design choice minimizes test errors associated with a reduction in the sample area.
In accordance with ASTM D5321 [44], the minimum dimensions of the shear box for the direct shear test of the geosynthetics–sand interface should be 300 mm × 300 mm. This dimension is equivalent to 15 times the D85 of the coarse soil utilized in the test or at least 5 times the mesh opening size of the geosynthetics employed. The D85 value for calcareous sand is 1.82 mm, while the maximum mesh size of the geogrid is 40 × 38 mm2, thereby satisfying the requirements outlined in ASTM D5321 [44].
In this study, a displacement control test is employed to conduct a monotonic direct shear test. During the experiment, the upper shear box remains stationary while the lower shear box is displaced horizontally in the direction of shear. The movement of the lower shear box is regulated by a series of gears driven by a high-precision motor. Both horizontal and vertical displacements are measured using Linear Variable Differential Transformers (LVDTs), with measurement ranges of 50 mm for vertical displacement and 100 mm for horizontal displacement. The test data is automatically acquired, recorded, and processed using specialized software (DS4 Software Module).

2.3. Test Program and Method

In this study, MDS tests were conducted at a relative density of 90% under four normal stresses (σn = 25 kPa, 50 kPa, 75 kPa, and 100 kPa) and across four different types of interfaces (i.e., URCS, GT-CS, GG-CS-1, and GG-CS-2). This approach systematically investigates the reinforcement effect of various geosynthetics and examines the influence of normal stress on interface shear characteristics. These normal stresses are selected in conjunction with the stress levels in the reinforced calcareous sand structure, as well as previous studies on the shear characteristics of calcareous sand [39]. The yield point stress of calcareous sand in the South China Sea, as reported by Xu et al. [5], ranges from 1.6 to 2 MPa. In this study, the normal stress applied is significantly lower than this yield stress range. Additionally, Chen et al. [36] have indicated that the particle breakage rates of both reinforced and unreinforced coral sand are quite similar, and that the use of geogrids in coral sand has minimal impact on the particle breakage rate. Consequently, the effect of particle breakage in calcareous sand is not considered in this research.
The shear rate was 1 mm/min, and the maximum horizontal displacement in all tests was 50 mm, as highlighted in ASTM D5321 [44] and EN ISO 12957-1 [46]. Each experiment was replicated twice under the same conditions to ensure test reproducibility and consistency. A total of 16 sets of MDS tests were carried out, and the test scheme followed in this study is as given in Table 3. All the calcareous sand samples were placed in an oven and dried at a temperature of 105–110 °C for 24 h. After drying, the samples were removed from the oven, allowed to cool to room temperature, and subsequently weighed to determine their dry calcareous sand mass. The representative dried samples were then tested for relative density according to ASTM D698-07 (2007) [47] to obtain both the maximum and minimum dry density. Based on the relative density and the volume of the shear box, the required filler quality for the monotonic shear test presented in this paper is adjusted to ensure a consistent filler density in both the upper and lower shear boxes.
Indeed, when preparing samples for the MDS test, it is crucial to maintain consistency in the operational steps to minimize testing errors. The MDS test was conducted following these five steps:
(a)
Apply Vaseline to the inner walls of both the upper and lower shear boxes, and then slide the lower shear box out along the linear guide rail.
(b)
Place the soil samples into the lower shear box in layers. Weigh an equal amount of calcareous sand for each layer and compact them sequentially to ensure a consistent density across all shear samples.
(c)
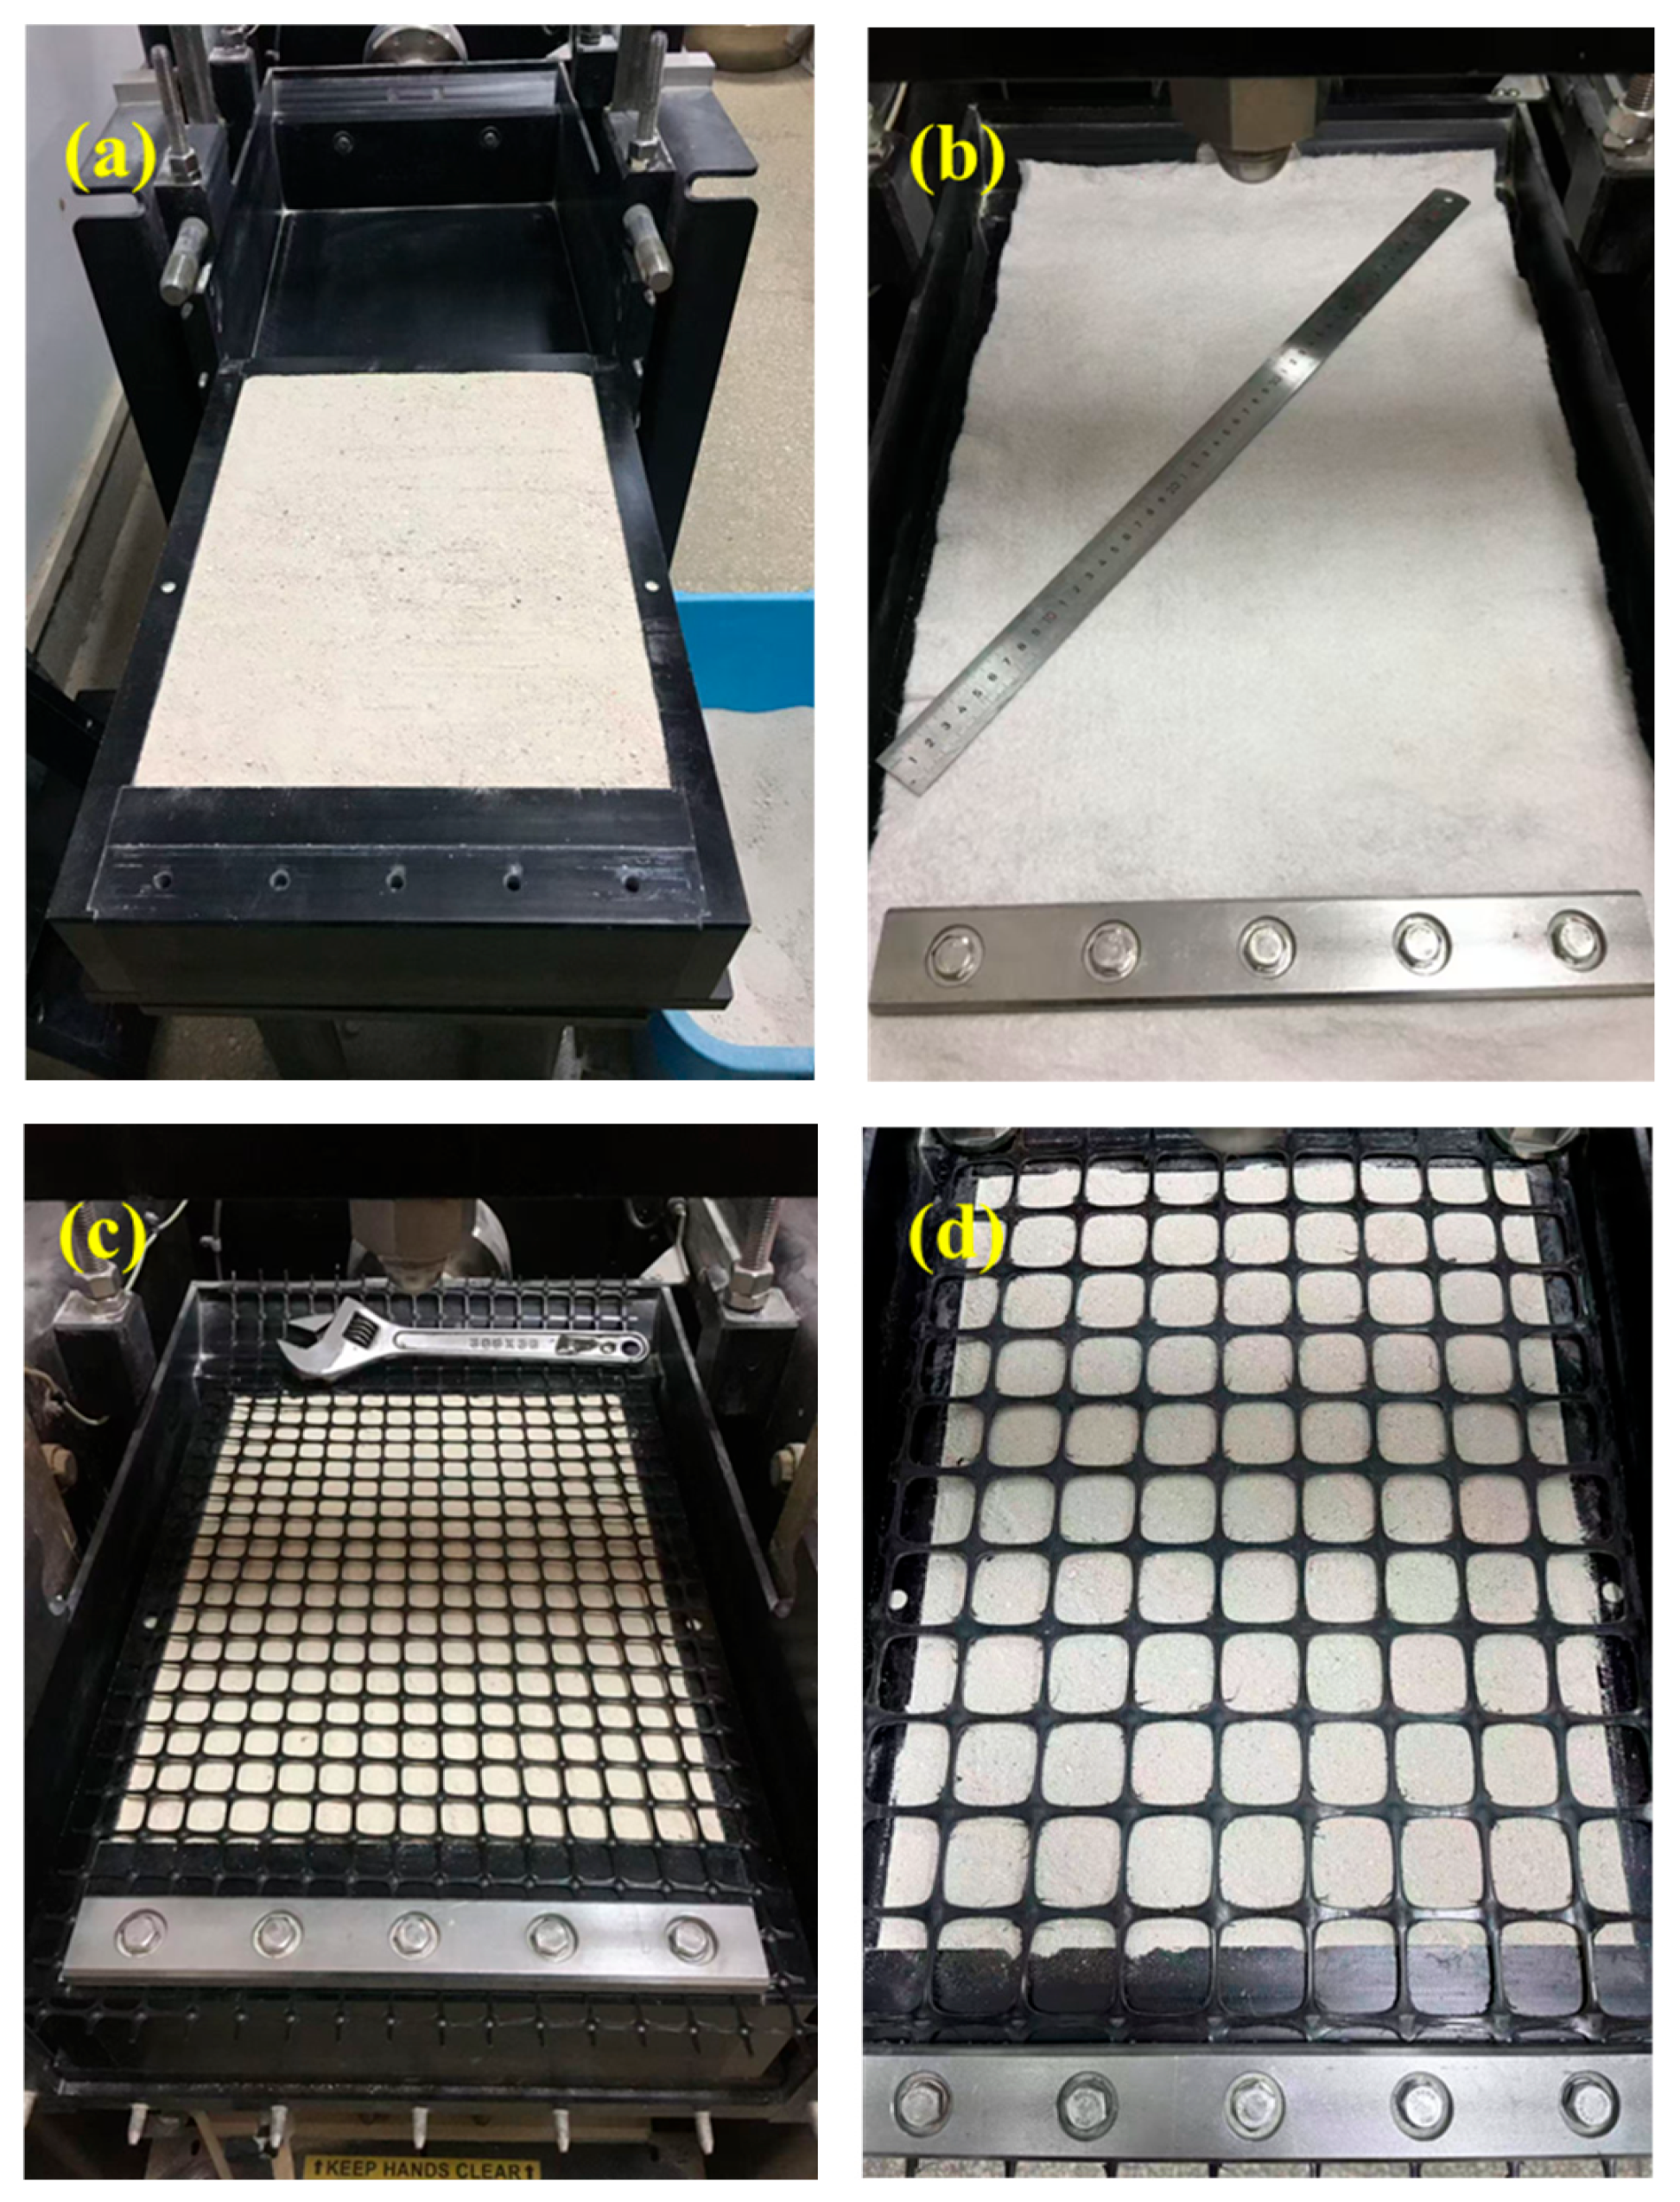
After packing the lower shear box, place the geogrid or geotextile on its surface and secure it using tools such as bolts and steel blocks. This ensures that the geogrid or geotextile remains stationary relative to the lower shear box during the shearing process. Refer to Figure 4 for the arrangement of test materials within the lower shear box.
(d)
Push the lower shear box into the equipment along the guide rail. Position the upper shear box directly above the lower shear box and utilize the same filling method applied to the lower shear box to ensure consistent compactness.
(e)
Position the vertical loading plate atop the upper shear box and securely tighten the bolts of all instrument components.
(f)
Finally, set the test parameters and turn on the direct shear apparatus.

3. Results and Analysis

3.1. Shear Stress and Displacement Behavior

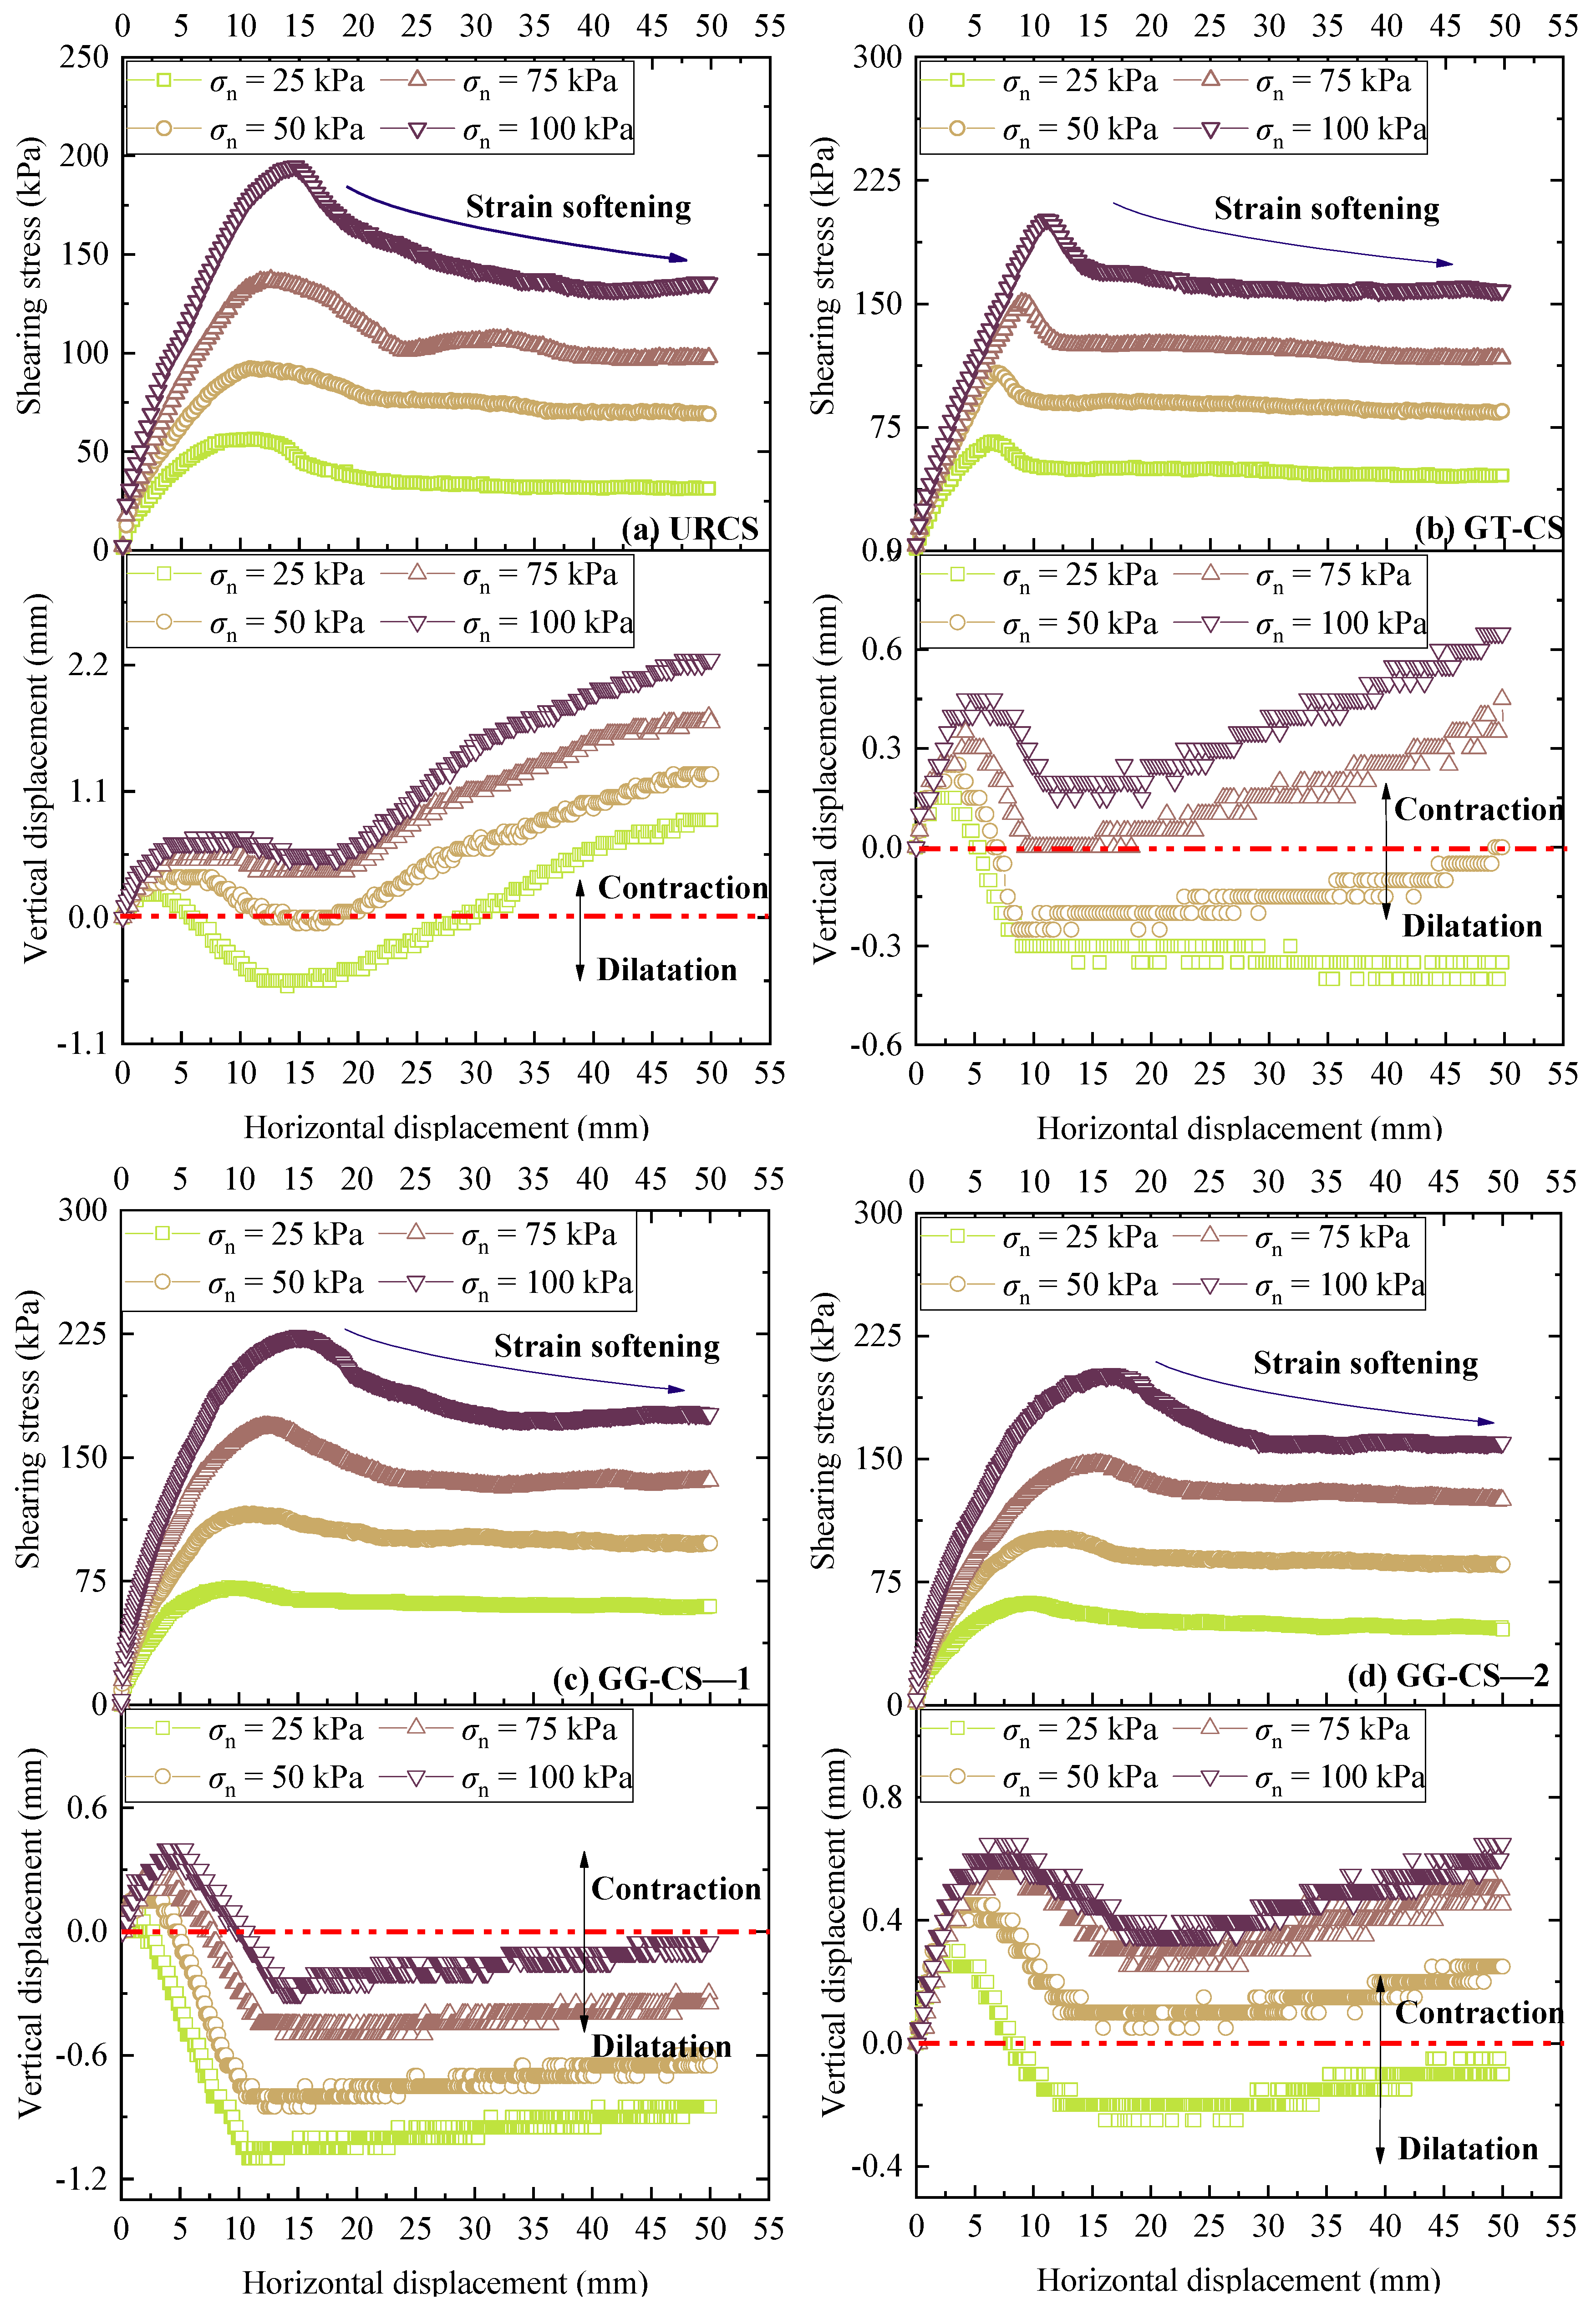
Figure 5 shows the relationship curves of the interfacial shear stress, horizontal displacement and vertical displacement under different normal stresses.
(1) The shear stress–displacement curves for the four interface types (URCS, GT-CS, GG-CS-1, and GG-CS-2) demonstrate softening characteristics. This softening effect becomes increasingly pronounced with a higher normal stress; however, the developmental trends of the shear stress–displacement curves vary among the different interfaces. The primary observations are as follows: In the initial phase of the test, the shear stress increases linearly with shear displacement. Subsequently, the shear stress transitions into a nonlinear growth phase, characterized by a gradual reduction in the growth rate. After reaching peak shear stress, the shear stress exhibits varying degrees of softening. Finally, the system enters the residual stage, during which the shear stress stabilizes despite further increases in horizontal displacement. This phenomenon is analogous to findings reported by Esterhuizen et al. [26], Seo et al. [27], Anubhav & Basudhar [48,49], and Kommanamanchi et al. [33]. Anubhav & Basudhar [49] propose that the stress softening of the geotextile–sand interface during shearing is influenced by normal stress. Esterhuizen et al. [26] employed the normalized shear stress, Sn, and introduced a displacement-softening model to characterize the nonlinear relationship between the shear stress and displacement following the peak value, effectively capturing the softening characteristics of the interface strength between the reinforcement and soil.
(2) The interface type and normal stress significantly influence the interface shear strength, encompassing both the peak shear stress and residual shear stress. Under identical conditions at the reinforcement–soil interface, a positive correlation exists between the interfacial shear strength and normal stress. In comparing the shear stress–displacement curves of geogrid–calcareous sand and unreinforced calcareous sand, it is observed that the geotextile–calcareous sand achieves peak shear stress at an earlier stage. The peak shear stress is noted within the horizontal displacement ranges of 11.1–14.6 mm (URCS), 6.4–11.1 mm (GT-CS), 9.1–15 mm (GG-CS-1), and 9.7–16.7 mm (GG-CS-2), respectively. Liu et al. [28] indicated that the shear strength of the geogrid–sand interface in the direct shear mode is considerably higher than that of the geotextile–sand interface. Furthermore, Bacas et al. [29] found that the shear mechanism of the soil–geomembrane (GM) interface is dependent on the normal stress. Manohar & Anbazhagan [31] noted that the types of geosynthetics, including geogrids and geotextiles, significantly impact the enhancement in shear strength.
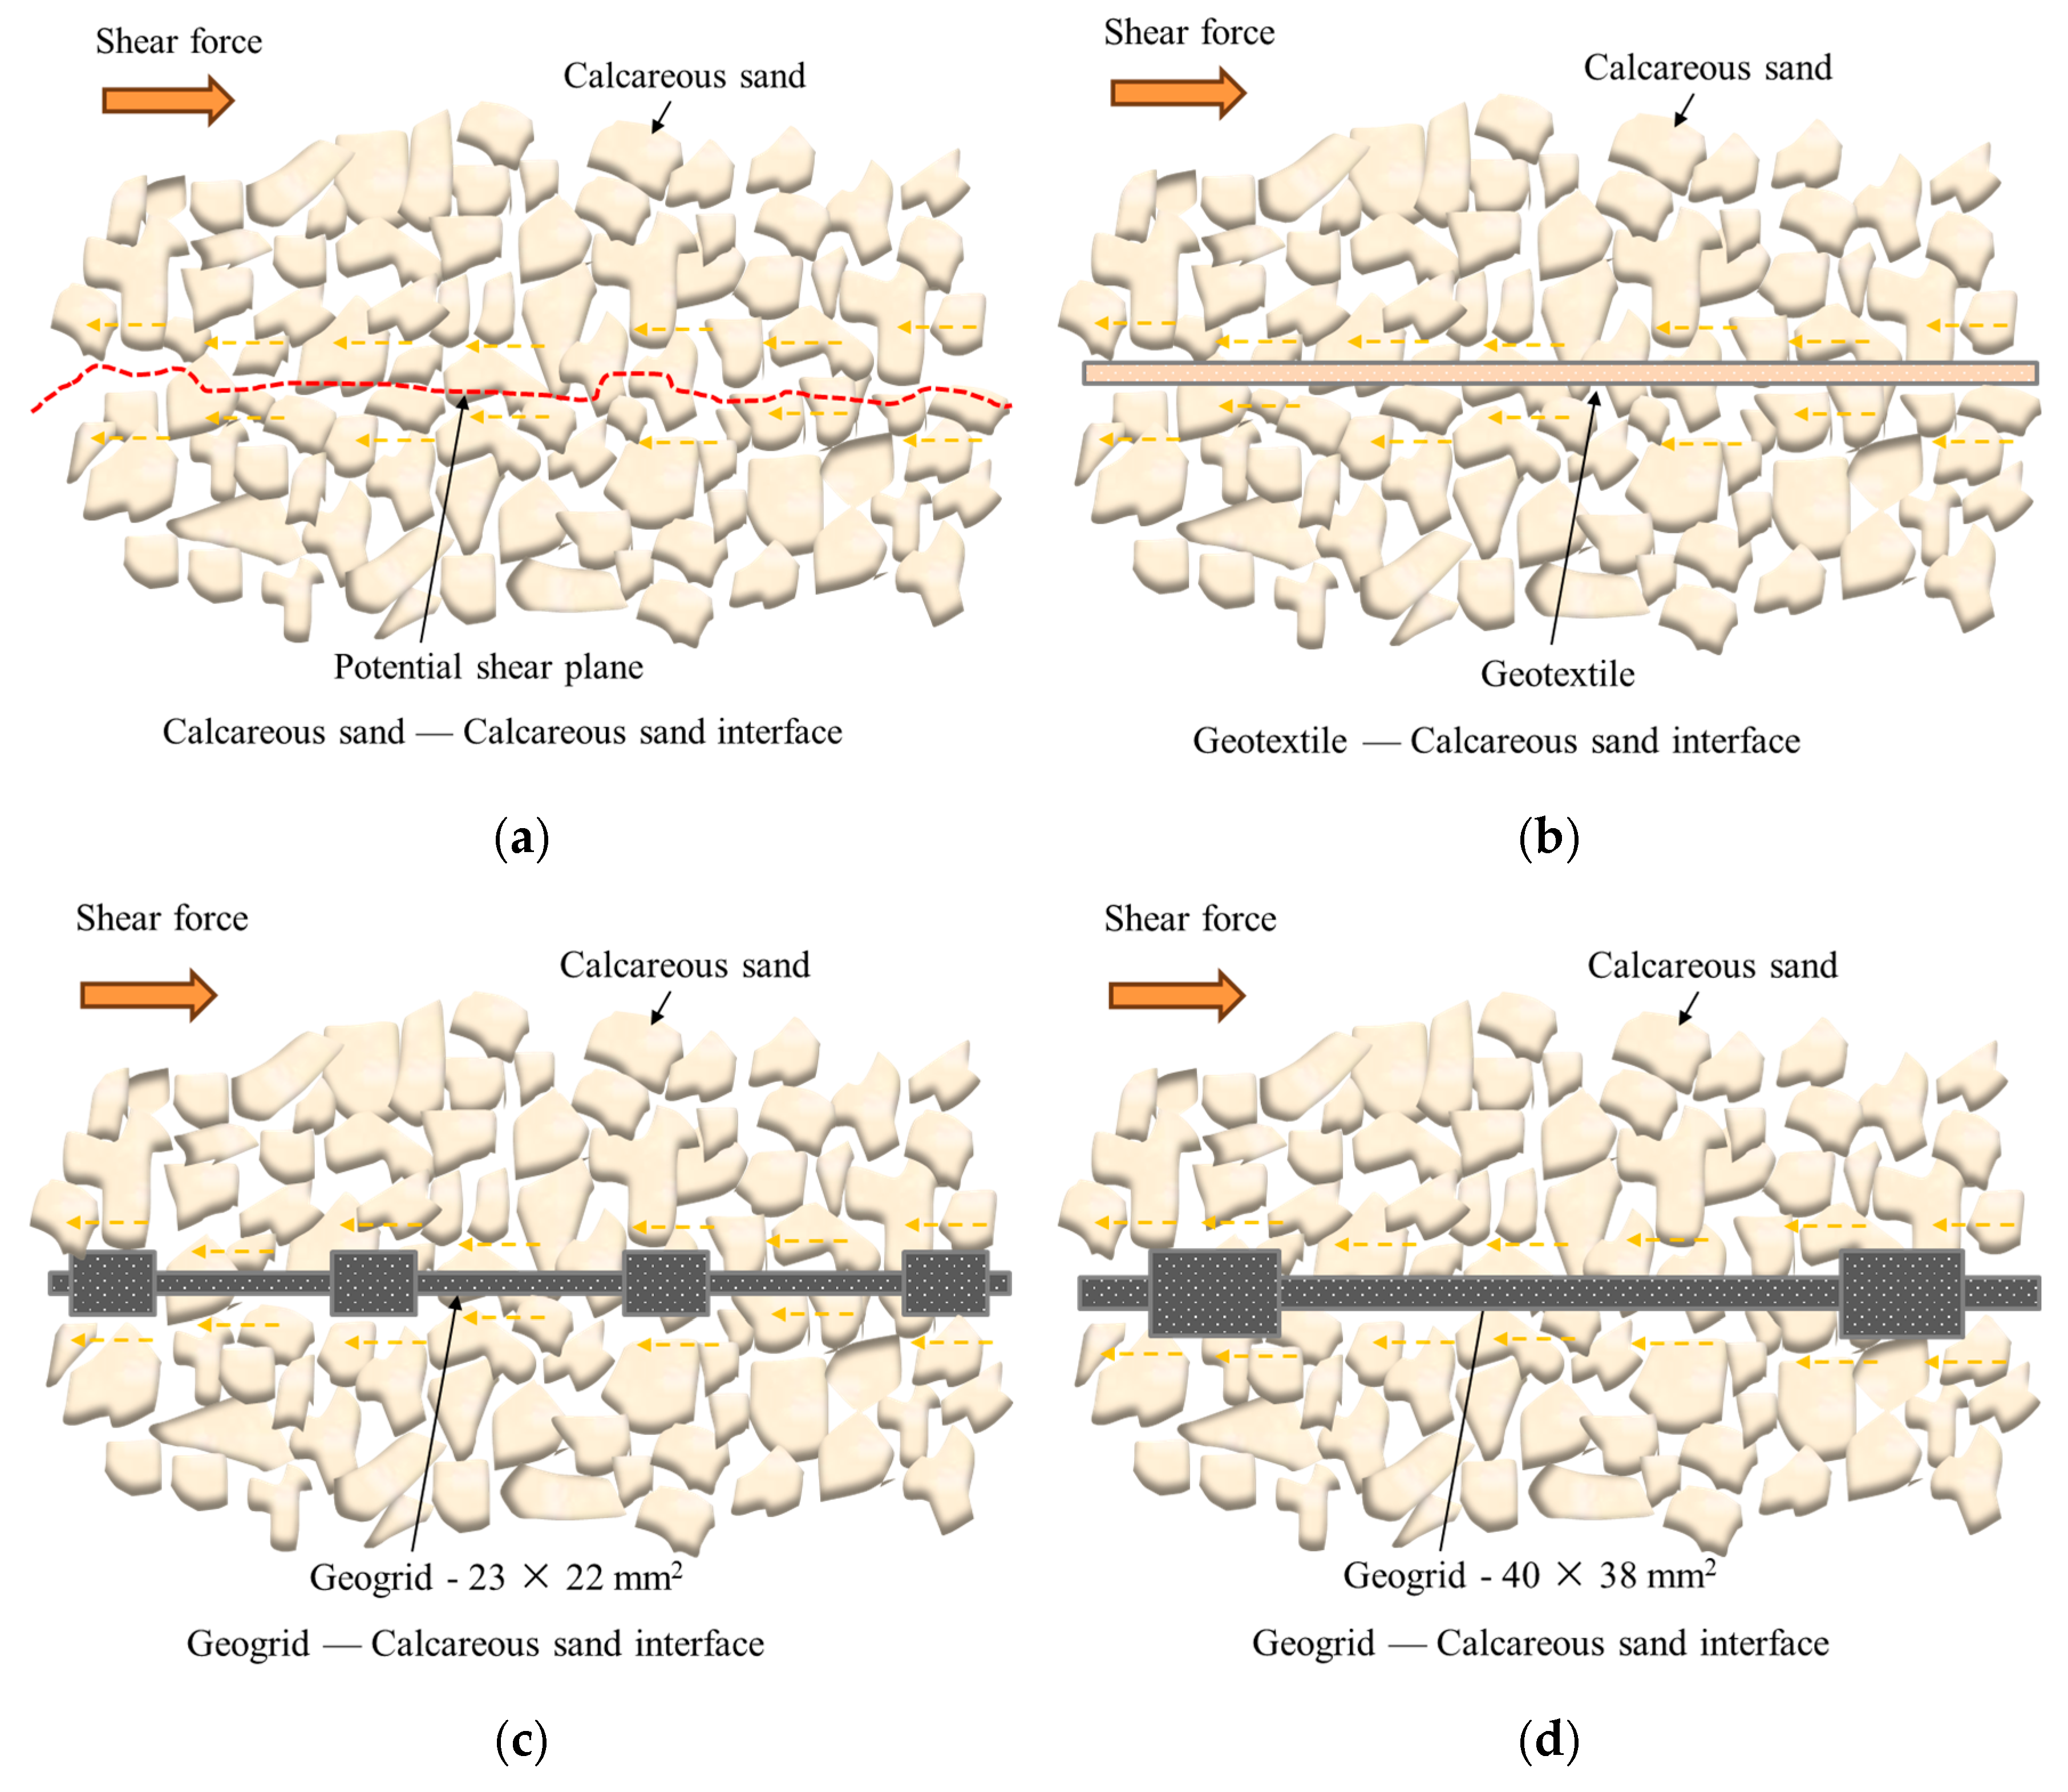
The observed phenomenon arises from the transmission mode of interfacial shear stress, which is closely linked to the properties of geogrids and geotextiles, as well as the presence or absence of reinforcement (see Figure 6). In the absence of reinforcement, the interfacial shear strength is predominantly derived from the occlusion and embedding of calcareous sand particles (Figure 6a). Conversely, when reinforcement is present, the interfacial shear strength between the geogrid and calcareous sand is comprised of three components: the friction and interlocking between calcareous sand particles at the openings of the geogrid mesh, the passive lateral resistance offered by the transverse ribs of the geogrid, and the friction exerted by calcareous sand particles on the surfaces of both the longitudinal and transverse ribs. The first two components are primarily responsible for the enhancement in interfacial shear strength (Figure 6c,d). In contrast, the geotextile lacks openings (as illustrated in Figure 6b), which inhibits the mutual friction and interparticle locking of calcareous sand within the upper and lower shear boxes, thereby imposing friction solely through the geotextile surface. Palmeira [7] noted that the interaction mechanisms between geosynthetics and sand are highly complex and depend on the types and properties of both the geosynthetics and the soil.
(3) The dilatancy characteristics of the interface between geosynthetics, such as geogrids and geotextiles, and calcareous sand are significantly influenced by normal stress and the type of reinforcement employed. Under four distinct interface conditions, the trends observed in the interface dilatancy curves exhibit inconsistencies. As the normal stress increases, the dilatancy curve for the URCS interface transitions from contraction–dilation–contraction to shear contraction. In contrast, the dilatancy curves for the GT-CS interface and the GG-CS-2 interface evolve from contraction–dilation to contraction, while the GG-CS-1 interface consistently maintains a contraction–dilation type. Furthermore, the characteristics of geosynthetics, such as the grid size and the surface roughness of geotextiles, interact with calcareous sand particles, thereby influencing the macroscopic dilatancy at the interface between the reinforcement and the soil. For instance, significant dilatancy is observed near the interface at low normal stress due to particle occlusion. Conversely, under high normal stress, the macropores undergo further compression, while smaller particles fill the pores of the particle skeleton. This results in a reduction in the interface volume as the corners of the particles experience wear.
Combining critical state soil mechanics with interfacial shear theory, this study reveals that the essence of interfacial dilatancy arises from the competing effects of particle occlusion dilatancy and compaction-crushing shear shrinkage. Additionally, the evolution of the dilatancy curve is closely linked to the degree to which the soil approaches the critical state and the structural evolution of the interfacial shear zone. The type of reinforcement, characterized by the grid size and geotextile roughness, determines the specific shape and stress sensitivity of the dilatancy curve by modulating the interlocking strength at the interface, the structure of the shear band, and the constraints on particle movement. Variations in the interfaces of different reinforcement bars are attributed to differences in interlocking capacity. Specifically, the GG-CS-1 interface consistently exhibits shear dilatancy behavior, while the URCS interface shows the most significant evolution (transitioning from contraction–dilation–contraction to shear contraction). In contrast, the GT-CS and GG-CS-2 interfaces shift to shear dilatancy behavior as the normal stress increases.

3.2. Interface Shear Modulus

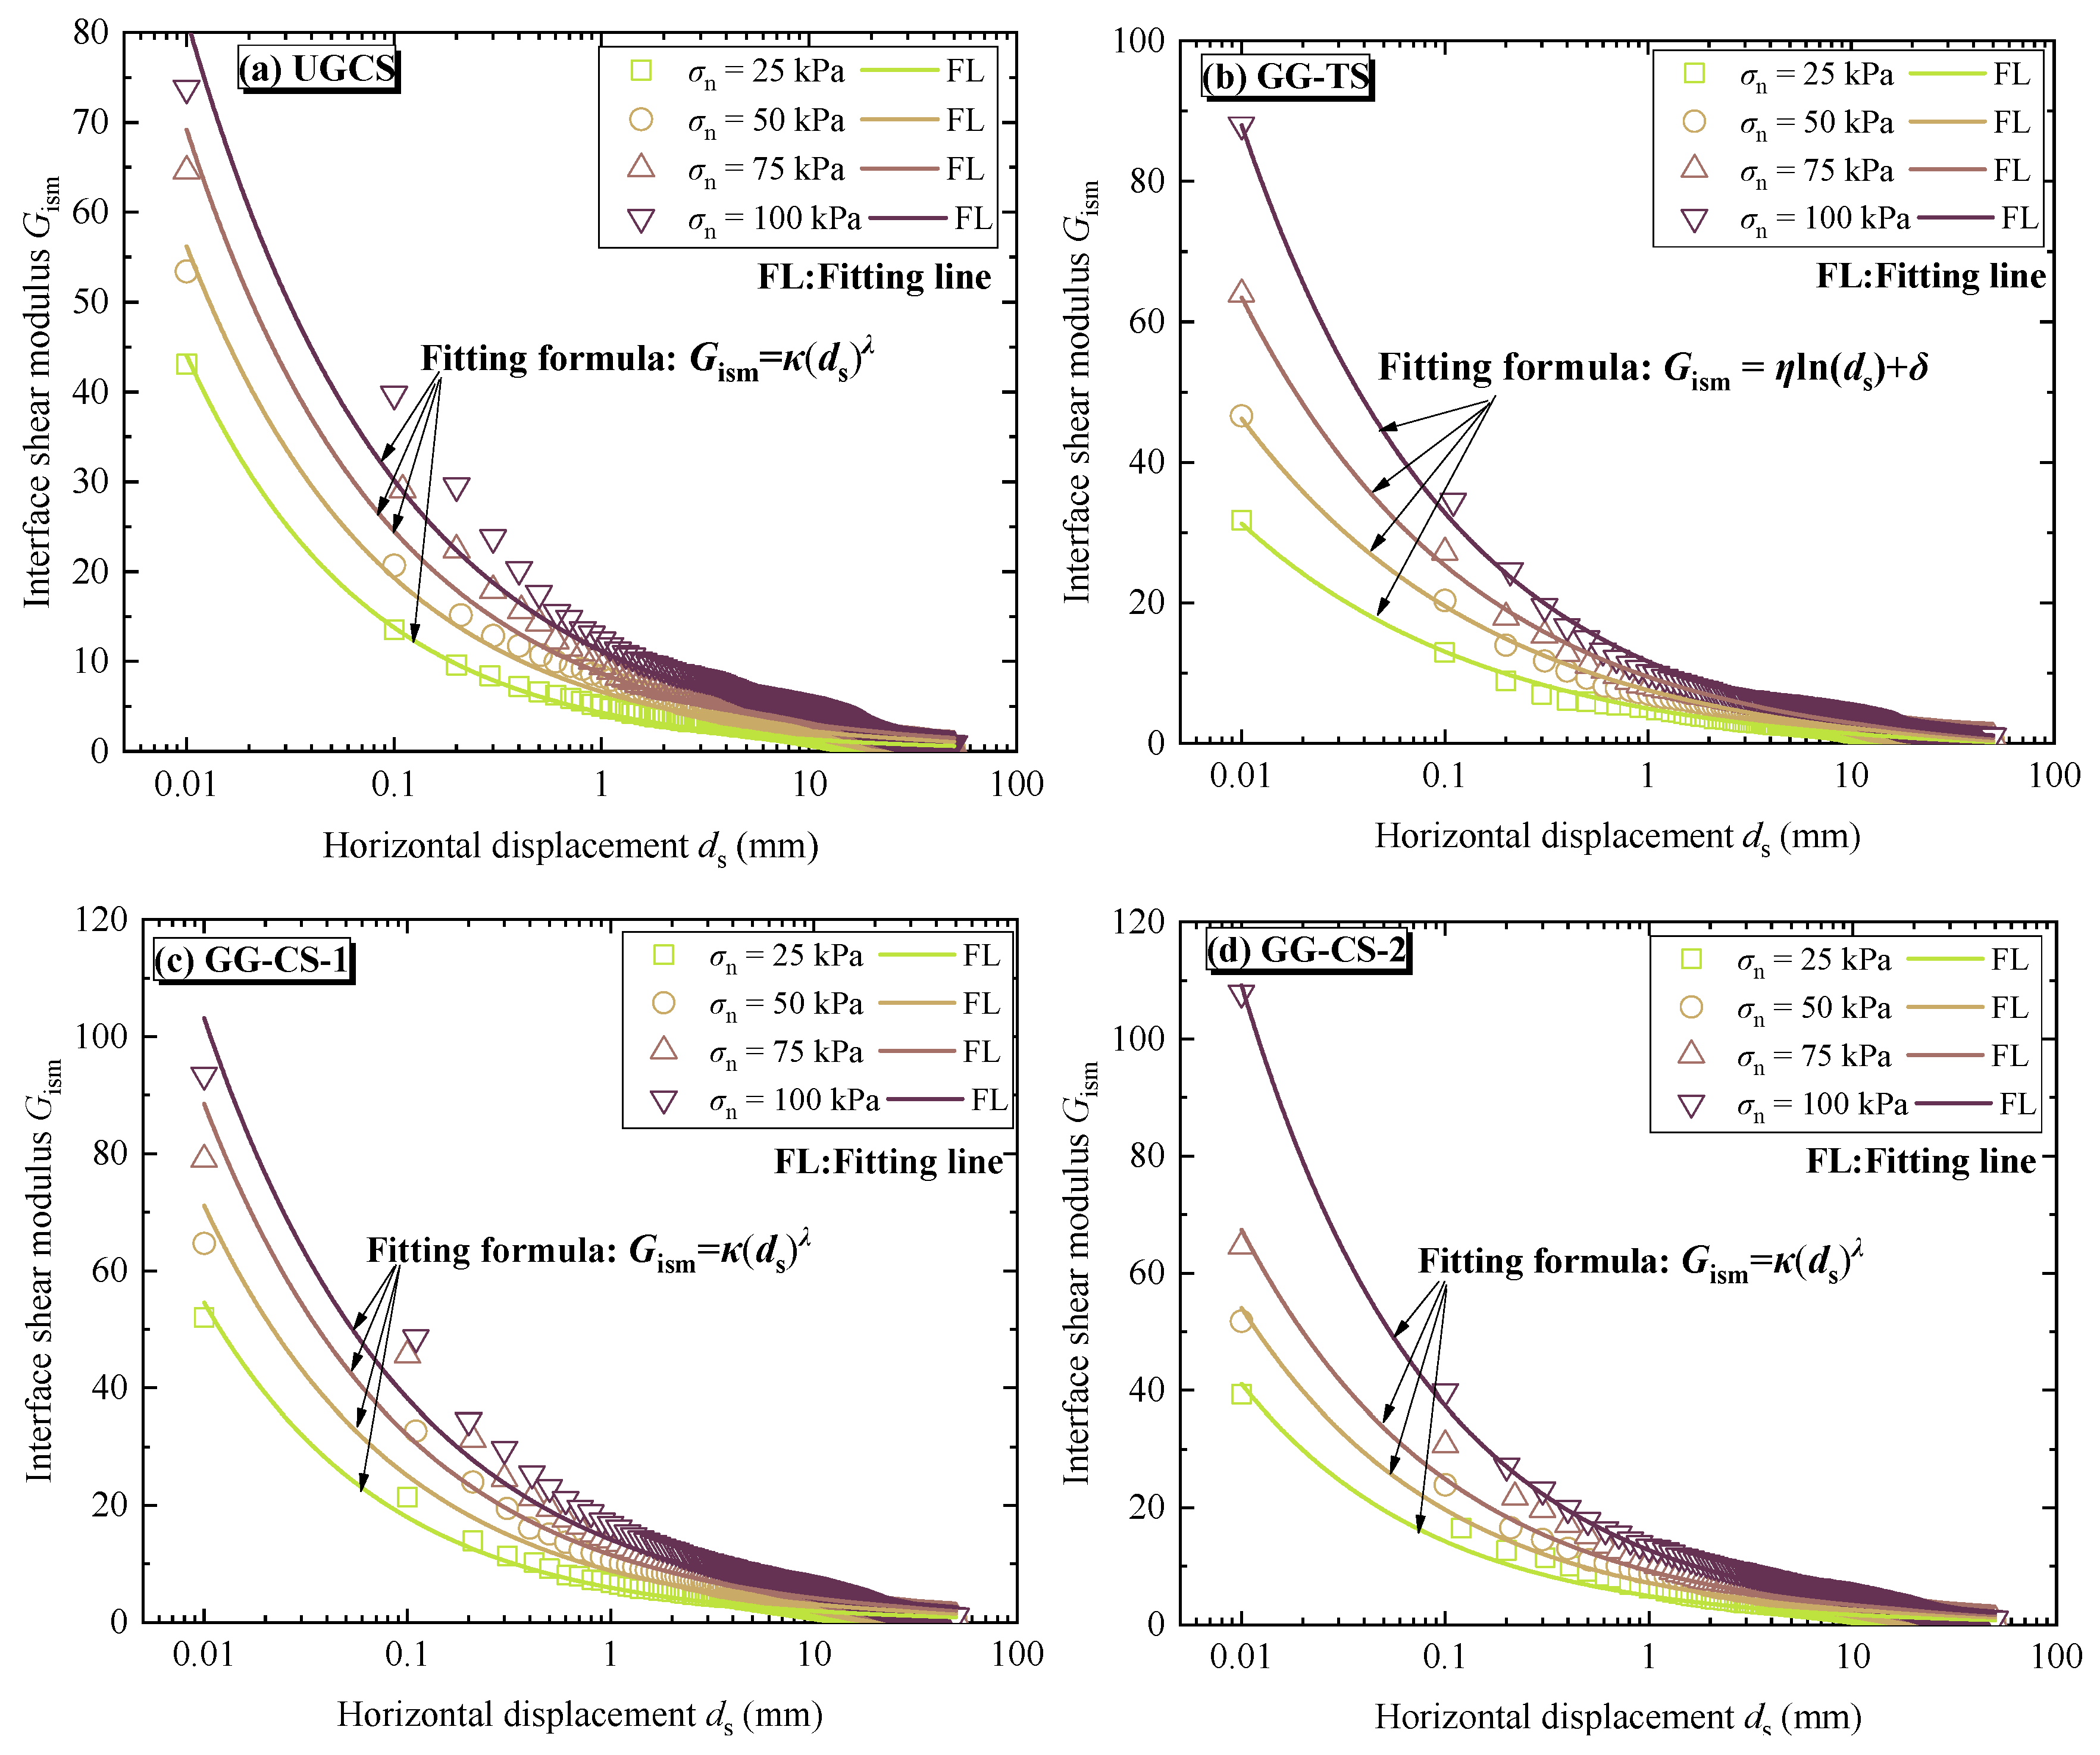
To further investigate the interface shear characteristics of geogrid-reinforced calcareous sand (GRCS), the ratio of shear stress ( τ ) to shear strain ( ε d s ) has been defined as the interface shear modulus (Gism) in Equation (1). This modulus quantifies the interface’s resistance to shear deformation. Figure 7 illustrates the relationship between Gism and shear displacement (ds) under varying normal stresses. The fitting formulas relating Gism to ds for unreinforced calcareous sand (URCS), the geogrid–calcareous sand interface (GG-CS-1 and GG-CS-2), and the geotextile–calcareous sand interface (GT-CS) are presented in Equations (2) and (3), respectively.
G i s m = τ ε d s
G i s m = κ d s λ
G i s m = η ln d s + δ
where τ is the interface shear stress (kPa), εds is the shear strain (%), εds = ds/l, l = 0.305 m, and κ, λ, η, and δ are fitting parameters. The value of R2 for all models surpasses 0.9, and the mathematical expressions of the selected models achieve a high degree of fitting accuracy. This demonstrates that the power function model is reliable for the Gism-ds fitting curves of GG-CS-1, GG-CS-2, and URCS. In contrast, the logarithmic function is effective for the Gism-ds fitting curve of GT-CS. The interface shear modulus has a maximum value in the initial shear stage, declines with the increase in shear displacement, and eventually approaches a stable value. For example, under various normal stresses, the interface shear modulus of GT-CS decreases by 95.0% (σn = 25 kPa), 94.4% (σn = 50 kPa), 94.3% (σn = 75 kPa), and 94.9% (σn = 100 kPa) respectively, in the range of 0.01 mm to 10.0 mm. Meanwhile, the interface shear modulus of GG-CS-1 drops by 95.9% (σn = 25 kPa), 94.6% (σn = 50 kPa), 93.9% (σn = 75 kPa), and 93.3% (σn = 100 kPa), respectively. The higher the normal stress, the greater the interface shear modulus and the larger the interface resistance to shear deformation.
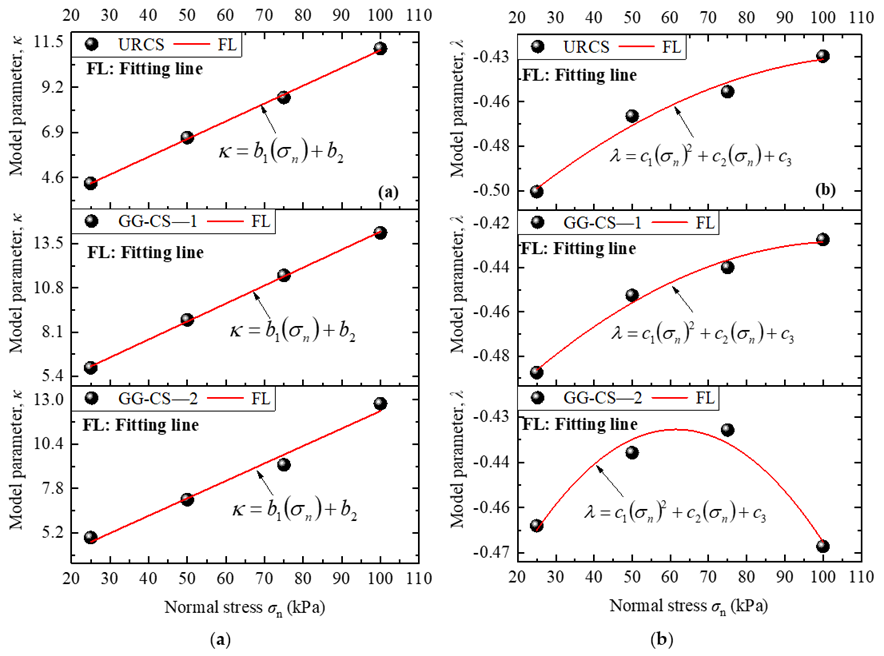
In addition, the model parameters κ and λ reflect a rising trend with the increase in normal stress, although the degree of influence varies considerably (Figure 8). Both the model parameters κ and λ, with or without reinforcement, are represented by a linear function model (Equation (4)) and a parabolic function model (Equation (5)), respectively.
κ = b 1 σ n + b 2
λ = c 1 σ n 2 + c 2 σ n + c 3
By substituting Equations (4) and (5) into Equation (2), the Gism expressions of geogrid-reinforced calcareous sand (GT-CS and GG-CS-1) and unreinforced calcareous sand (URCS) subjected to various normal stresses are as follows:
G i s m = b 1 σ n + b 2 d s c 1 σ n 2 + c 2 σ n + c 3
where b1, b2, c1, c2, and c3 are all model parameters (Table 4).
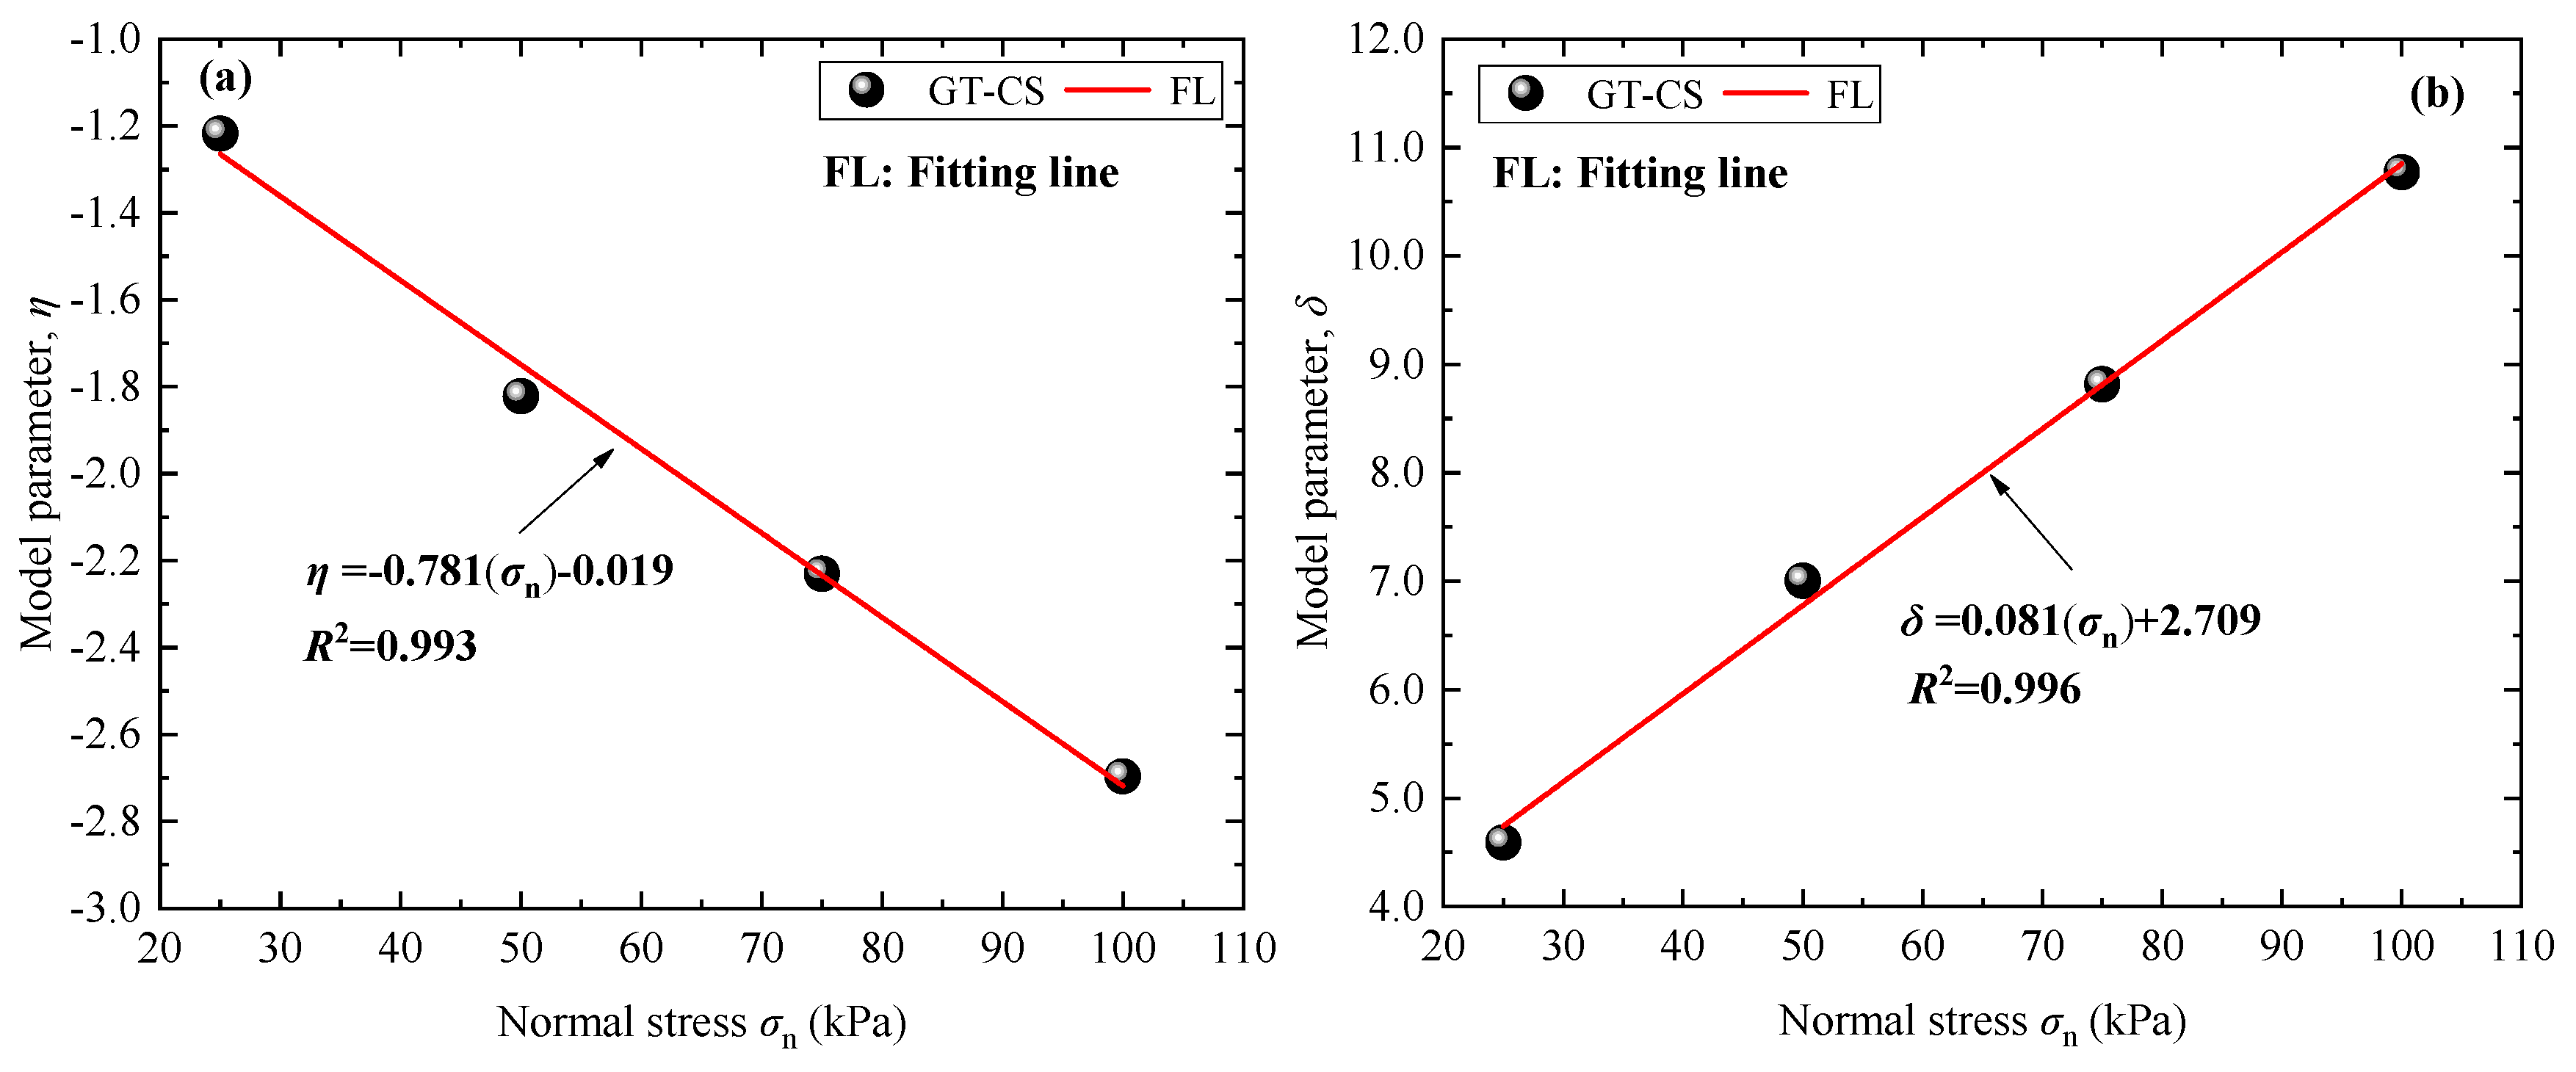
With the growth in normal stress, the model parameters η and δ depict an attenuation trend, while δ shows a progressive increase trend (Figure 9). In the context of the geotextile–calcareous sand interface, the relationship between the model parameters η and δ, and the normal stress σn can be represented by a logarithmic function model.
η = 0.781 σ n 0.019
δ = 0.081 σ n + 2.709
By substituting Equations (7) and (8) into Equation (3), the Gism expression of geotextile-reinforced calcareous sand under different normal stresses is as follows.
G i s m = ( 0.781 σ n + 0.019 ) ln d s + 0.081 σ n + 2.709
In conclusion, the power function model effectively represents the relationship between the interface shear modulus and shear displacement of geogrid—calcareous sand, as well as unreinforced calcareous sand. Conversely, a logarithmic model accurately depicts the relationship for geotextile—calcareous sand. The results indicate that the interface shear modulus is predominantly influenced by the normal stress, interface type, and shear displacement.

4. Statistical Constitutive Model of Interface Damage Softening of GRCS

Several scholars utilized the segmentation model to describe the shear behavior of the reinforced soil interface. Esterhuizen et al. [26], Seo et al. [27], and Anubhav & Basudhar [48], for instance, divided the shear stress–displacement curve into a pre-peak stage and post-peak stage based on the softening behavior of the shear stress–displacement curve at the interface of geomembrane–clay and geomembrane/geotextile–sand. The pre-peak and post-peak models as nonlinear constitutive models of the reinforced soil interface are proposed to describe the pre-peak and post-peak characteristics of the interface, but this model cannot directly represent the shear damage behavior of the interface. However, most researchers employ the curve fitting method to characterize the interface stress–strain relationship, and the physical significance of the model parameters is unclear. To date, statistical damage theory that relies on damage mechanics and statistical strength methods is widely used in simulating the stress–strain relationship of geotechnical materials, and it can more accurately depict the strain-softening characteristics of geotechnical materials [50,51,52].

4.1. Interface Damage Model Establishment

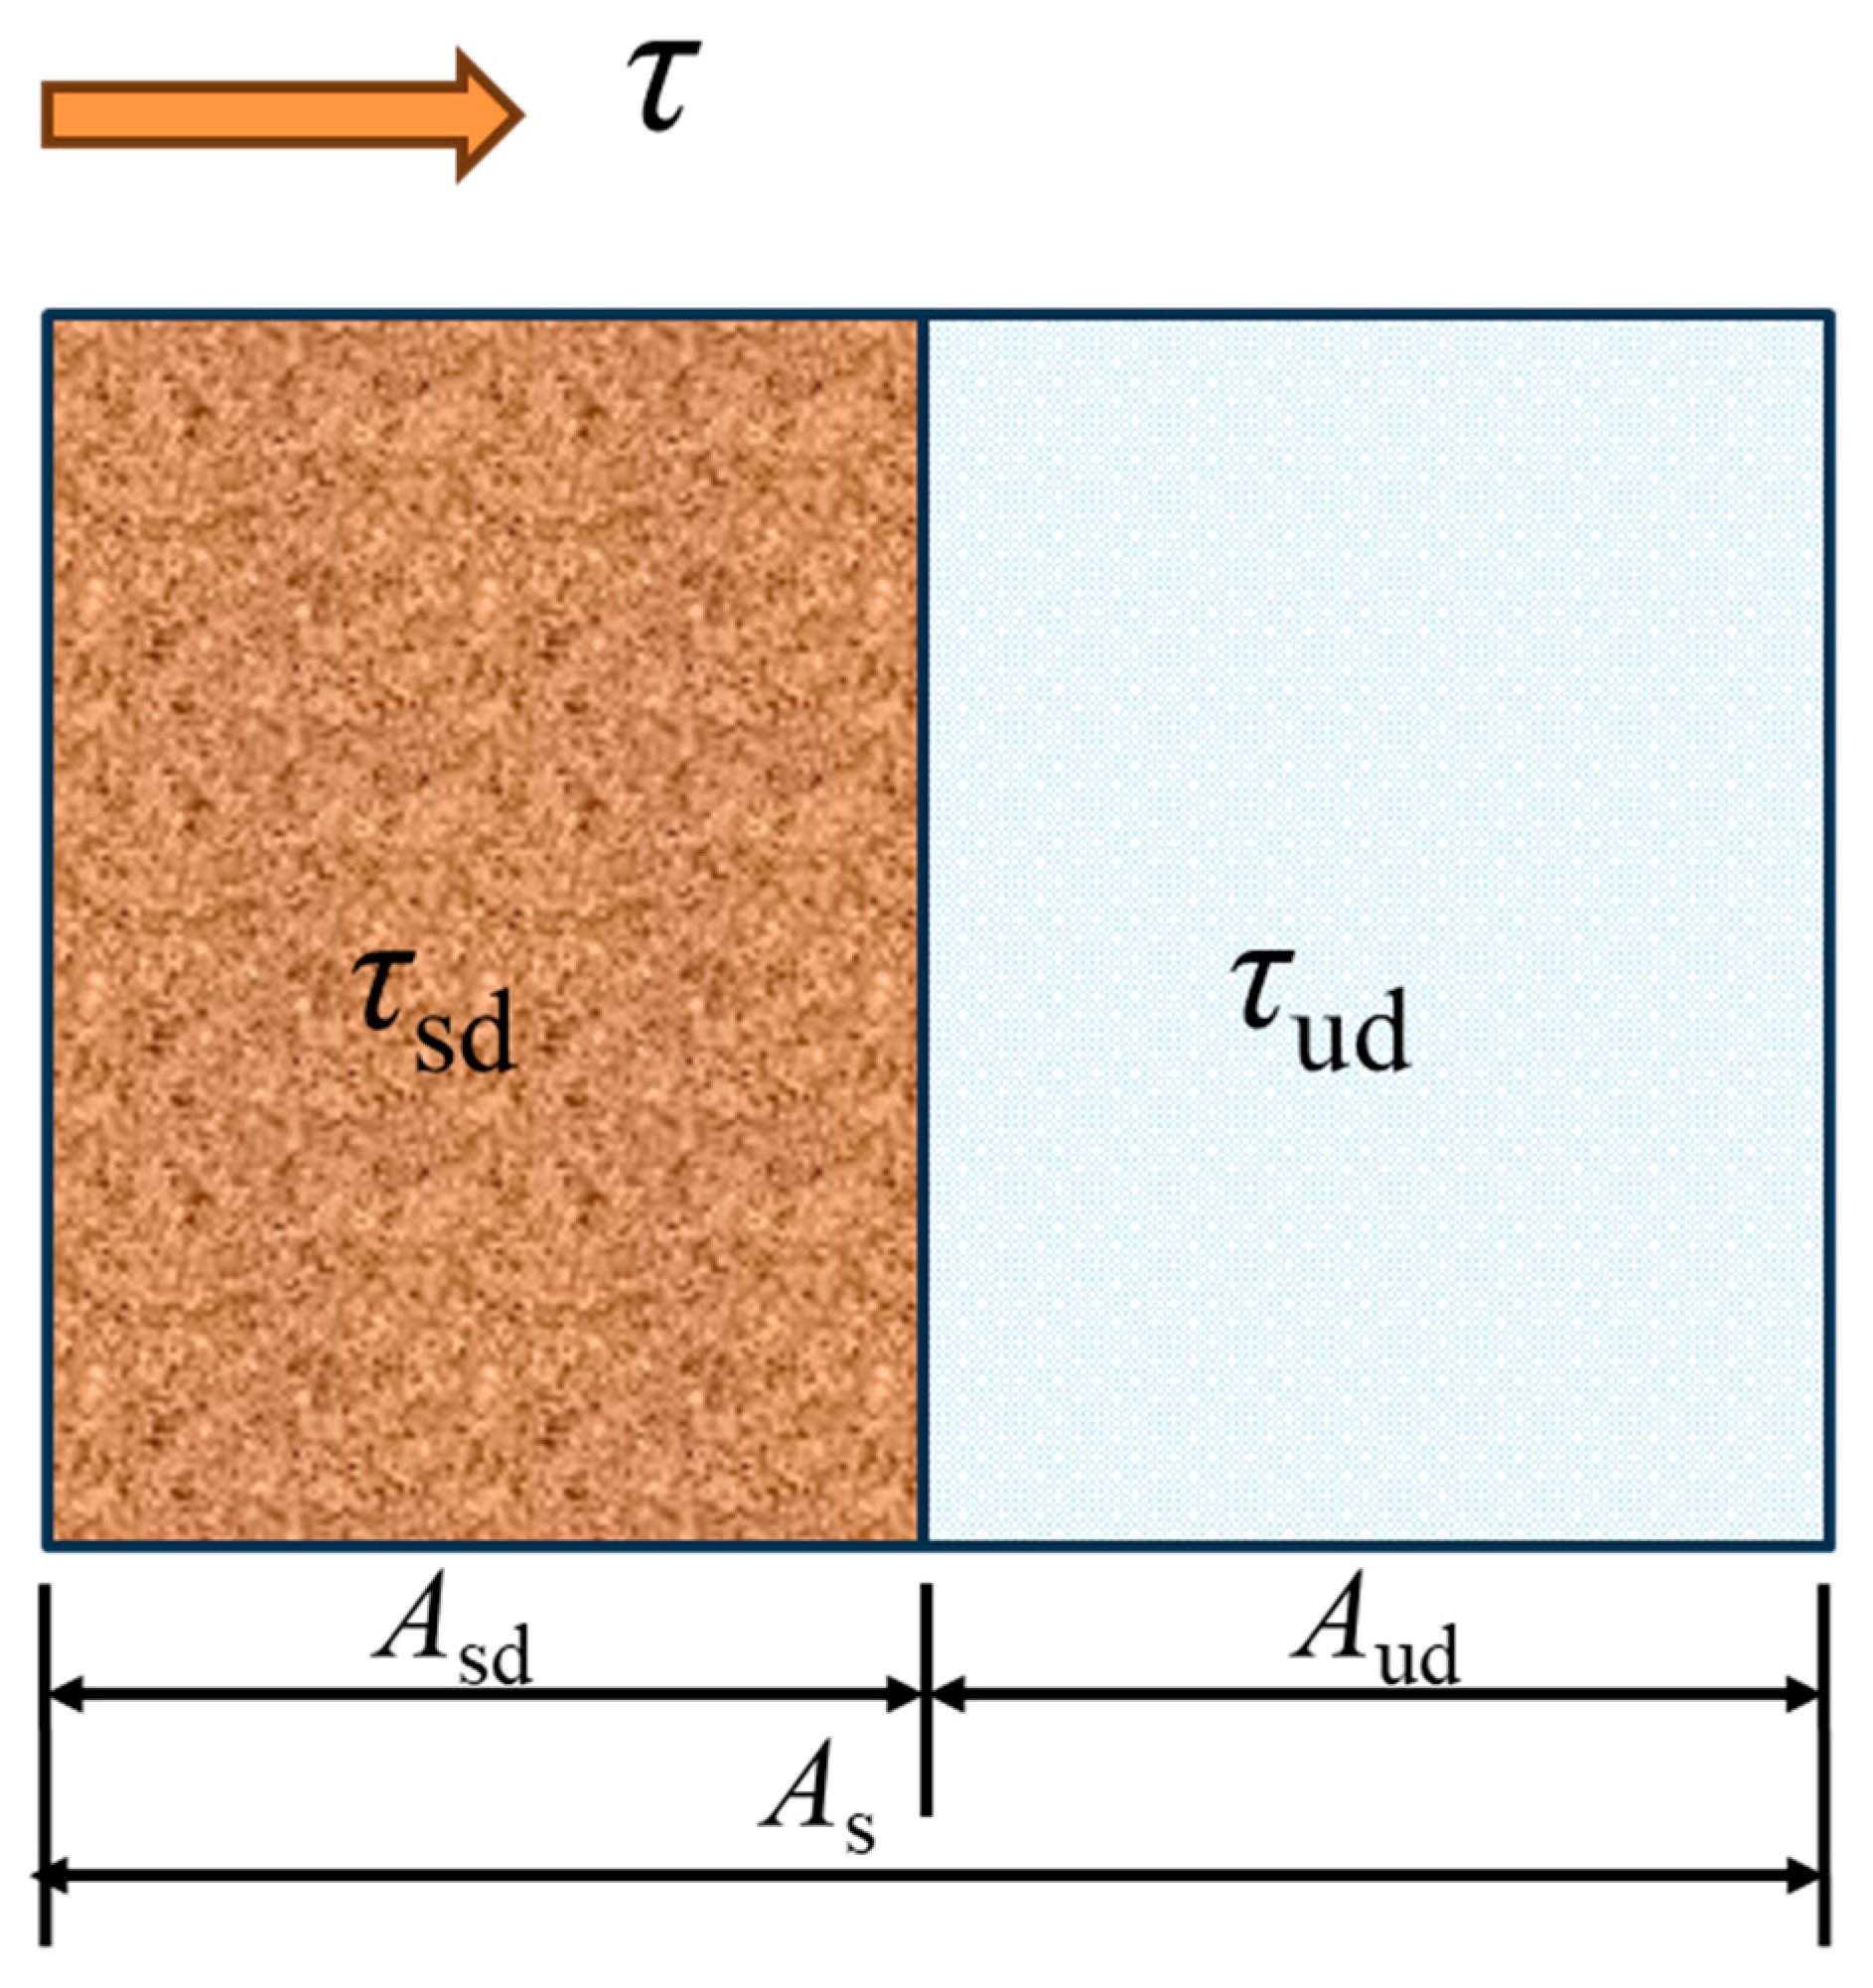
The irreversibility of interface shear strain behavior is attributed to the filling of, reduction in, and even disappearance of large pores in calcareous sand caused by the wear and rearrangement of calcareous sand particles near the interface. This paper aims to introduce statistical damage theory, widely used in geotechnical engineering, for simulating the process of the interface shear deformation of reinforced soil to develop a constitutive model that can adequately describe the shear-softening characteristics of the GRCS interface. It is assumed that the reinforced soil interface under normal stress is composed of shear and non-shear damage (Figure 10), and the two parts of the materials jointly bear the normal stress. As is the total shear area, Aud is the undamaged area, and Asd is the shear-damaged area.
A s = A u d + A s d
The damage variable (D) is the ratio of the shear damage area to the total shear area.
D = A s d A s
The force balance relationship of the interface between reinforcement and soil can be obtained.
τ A s = τ u d A u d + τ s d A s d
where D is the shear damage variable, representing the damage degree of the element of the calcareous sand sample on the shear plane. It ranges from 0 to 1, corresponding to intact and completely damaged states. τ is the shear stress on the total shear area, τud is the shear stress on the undamaged area, and τsd is the shear stress on the shear-damaged area. As the interface shear strength complies with the friction strength criterion, the development of shear strength can be expressed by the evolution of the strength index. By combining Equations (10)–(12), the interface shear stress relationship can be derived.
τ = τ u d 1 D + τ s d D
τ u d = c u d + σ n tan φ u d
τ s d = c s d + σ n tan φ s d
In addition, the evolution of the shear modulus (G) is depicted by Equation (16).
G = 1 D G u d + D G s d
where cud and φud are the interface’s cohesion and friction angle without damage, expressed by the interface cohesion and friction angle of unreinforced calcareous sand. csd and φsd are the interface’s cohesion and friction angle under complete damage. Gud is the shear modulus without damage, often known as the initial shear modulus, while Gsd is the shear modulus of complete damage.
According to Equation (13), τ = τsd is the interface residual strength when the reinforcement—soil interface is in the state of complete shear damage (D = 1), and τsd is the interface residual strength, which does not vary as the deformation increases. In other words, the force exerted on the micro-element of calcareous sand filler in the damaged area reflects the mechanical properties of the soil at the macroscopic stage of fragmentation. Figure 5 illustrates that during the strain-softening phase of the shear stress—displacement curve for geosynthetic—calcareous sand, a relatively stable residual strength is maintained beyond the peak failure point, as indicated by the analytical findings. The shear damage model developed in this study captures the deformation evolution characteristics associated with the residual strength stage of the reinforced soil interface. For the interface element of undamaged calcareous sand filler, the shear stress–strain relationship is assumed to adhere to the linear elastic formula presented in Equation (17).
τ u d = G u d ε u d
where Gud, ɛud is the undamaged area’s shear modulus and shear strain. Because the shear test cannot directly determine the relationship curve between the shear stress and shear strain, the shear strain is defined in this study as the ratio of the shear displacement to shear plane length [53]. According to strain coordination, the strain of the damaged area is equal to that of the undamaged region under any stress state (including loading and unloading), and the shear strain (ɛ) of the shear plane has the following relationship with the shear strain (ɛud) of the undamaged area and shear strain (ɛsd) of the damaged area.
ε = ε u d = ε s d
The residual strength of the geotechnical medium is crucial for the stability of geotechnical structural systems, including slopes and foundations. Neglecting the residual strength of the medium can lead to a reduced safety factor. In conjunction with the analysis results presented in Section 3.1, the impact of the interface residual strength is incorporated into the damage model of the geosynthetic–calcareous sand interface (i.e., τsd = τr). Consequently, Equation (19) is applicable.
τ = G u d ε 1 D + τ r D
The analysis methods used in this study to construct the damage evolution model of the geosynthetic—calcareous sand interface were adopted from Cao et al. [50], Li et al. [51], and Huang et al. [52]. The shear damage variable was assumed to be a function of the shear strain. The two-parameter Weibull distribution function describes the damage growth in the shear area.
D = f ε = 1 exp ε n m
where 0 ≤ D ≤ 1, 0 ≤ ɛ, m, and n are Weibull distribution parameters. During the shear process, when the ɛ grows from 0, the shear damage variable, which represents the deterioration in the interface shear strength, also increases from 0, indicating that the damage develops along with the whole shear process (Equation (20)). It shows that Equation (20) is consistent with the improved interface shear damage model of reinforced soil (Equation (19)). A constitutive model is obtained using Equations (19) and (20) and considering the influence of the interface residual strength on the statistical strength theory of interface damage softening of geosynthetic—calcareous sand as follows:
τ = G u d ε τ r exp ε n m + τ r

4.2. Determination of Model Parameters

In this paper, the statistical damage constitutive model of the geosynthetics–calcareous sand interface includes four parameters (Gud, τr, m, and n) with definite physical significance. Gud is the undamaged shear modulus, τr is the interface residual strength, and m and n are the model parameters of shear damage variables. The interface shear stress–displacement curve determines τr, and Gud takes the slope of the initial linear part of the shear stress–displacement curve (ɛ = 0), i.e., the initial shear modulus, which is defined by Equation (22).
G u d = d τ d ε
Referring to the analysis methods of Cao et al. [49] and Li et al. [50], the values of parameters m and n are determined based on the characteristics of the horizontal displacement curve of the interfacial shear stress. As previously mentioned, the curve exhibits pronounced strain-softening characteristics (see Figure 5), indicating the presence of a peak point. At this peak, where shear stress reaches its maximum (ɛ = ɛp), the increment in shear stress is zero.
d τ d ε = 0
τ p = G u d ε p τ r exp ε p n m + τ r
where ɛp is the shear strain corresponding to the peak shear stress. From Equations (23) and (24), we can derive the calculation formulas for parameters m and n. Specifically, by differentiating τp(εp) and using dτp/dεp = 0, we obtain the extremum condition. Substituting the peak stress experimental values τp, max and εp allows us to first calculate m; subsequently, we can determine n using the peak strain εp.
n = m G u d ε p τ r ε p m 1 G u d 1 m
m = G u d ε p G u d ε p τ r ln τ p τ r G u d ε p τ r

4.3. Validation of Constitutive Model

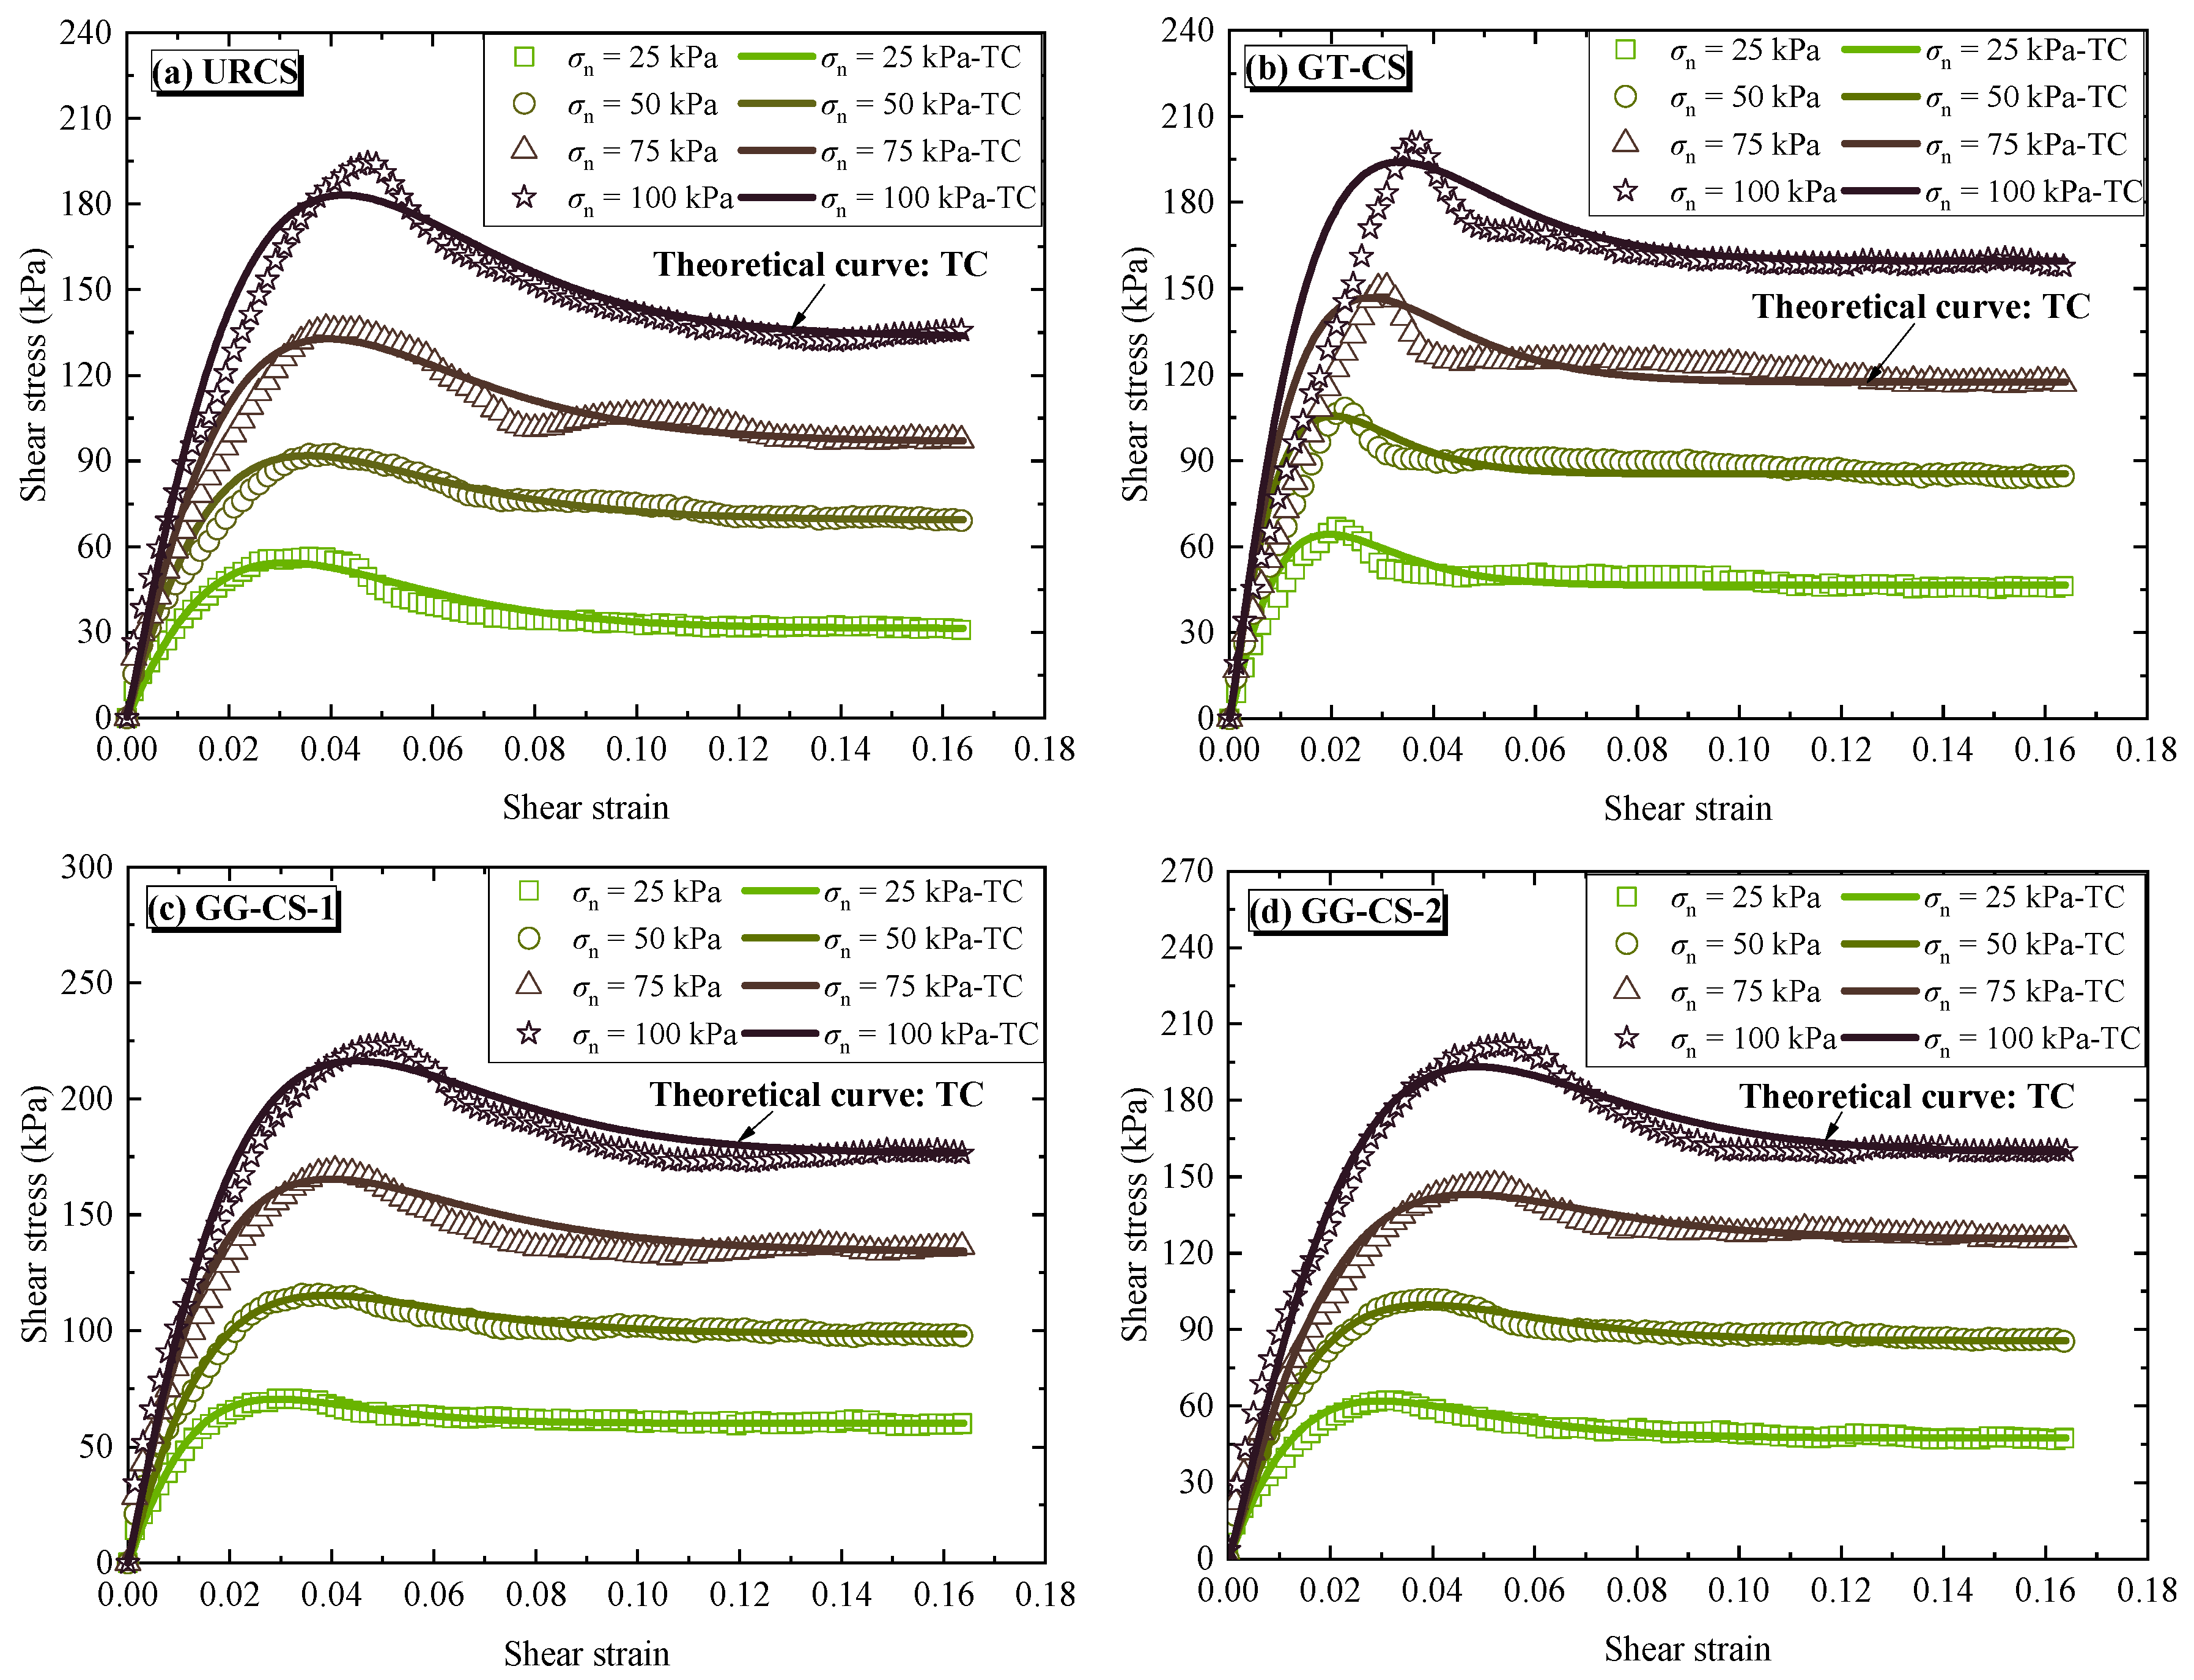
According to the shear stress–shear displacement curve (see Figure 5), the shear stress and shear strain curves under different normal stresses can be obtained, and the test curve data can be sorted and calculated to obtain the model parameters (i.e., Gud, τr, m and n), as shown in Table 5. The model parameters are substituted into Equation (21) to obtain the theoretical prediction curve of the damage model proposed in this study, and the theoretical prediction curve of the model is compared with the test result curve, as shown in Figure 11. The curve comparison results demonstrate that the theoretical predictions of the model are in good agreement with the experimental results, and can reflect the strain-softening characteristics in the shear process. Nevertheless, compared with GT-CS, the interface damage model theoretical predictions of GG-CS-1, GG-CS-2, and URCS are more consistent with the experimental results. This difference is primarily attributed to the varying transfer modes of the interface shear stress between geogrid–calcareous sand and geotextile–calcareous sand.

5. Discussion

This paper analyzes the stage characteristics of the shear-softening deformation of the reinforced soil interface under a monotonic direct shear test. It introduces statistical damage theory and establishes the constitutive model of the geogrid–calcareous sand interface based on the results obtained from the monotonic direct shear test presented in Section 3.1. Furthermore, the paper verifies the rationality of the proposed model.
The comparative analysis between the test results and the model calculation results demonstrates that the statistical damage mechanics model effectively captures the shear-softening behavior characteristics of the geogridcalcareous sand interface. However, at normal stresses of 75 kPa and 100 kPa, the fitting of the shear behavior of the interface between the geotextile and calcareous sand is relatively weak. The model takes into account the influence of residual strength; furthermore, the damage constitutive model is characterized by a limited number of parameters, clear physical significance, and ease of determination.
The constitutive model of the reinforced soil interface presented in this paper is grounded in the theoretical framework of rock damage mechanics. Consequently, the shear behavior evolution of the reinforced soil interface, incorporating various types of reinforcement materials, cannot be fully and accurately characterized. Additionally, the model overlooks the impact of the shear deformation of the geogrid, which is a crucial factor influencing the interaction mechanism of the reinforcement–soil interface. Therefore, developing a damage constitutive model for the geosynthetics–calcareous sand interface that accounts for the deformation of reinforcement is a vital direction for future research.

6. Conclusions

To investigate the shear characteristics of the interface between geosynthetics and calcareous sand, a series of large-scale monotonic direct shear tests were conducted. The variations in shear stress–displacement and shear modulus at the geogrid–calcareous sand and geotextile–calcareous sand interfaces were analyzed. Based on the test results, the damage constitutive relationship of the geosynthetics–calcareous sand interface is discussed. The main conclusions are as follows:
  • The shear stress–displacement curves of the interface, regardless of reinforcement, demonstrate softening characteristics. As the normal stress increases, the softening effect becomes more pronounced. However, the developmental trends of the shear stress–displacement curves under varying conditions are not entirely consistent. Both the type of interface and the level of normal stress significantly influence the shear strength.
  • The dilatancy characteristics of the geosynthetics–calcareous sand interface are significantly influenced by the normal stress and the type of reinforcement employed. As the normal stress increases, the dilatancy curve of the URCS interface transitions from a pattern of shear contraction–dilation–shear contraction to a pattern of shear contraction. In contrast, the dilatancy curves of the GT-CS interface and the GG-CS-2 interface evolve from a shear contraction–dilation pattern to a shear contraction pattern. Notably, the dilatancy curve of the GG-CS-1 interface consistently maintains a contraction–dilation pattern throughout.
  • The relationship between the shear modulus and horizontal displacement at the geogrid–calcareous sand interface (GG-CS-1, GG-CS-2) and the unreinforced calcareous sand (URCS) is described by a power function model. In contrast, the relationship between the shear modulus and horizontal displacement of the GT-CS interface adheres to a logarithmic function model.
  • A statistical damage constitutive model has been established to characterize the strain-softening behavior at the interface between geosynthetics and calcareous sand, and its validity has been verified. This model incorporates the influence of residual strength and effectively captures the entire shear deformation process at the interface between reinforcement and basement (or something like that). The damage constitutive model consists of four parameters, each of which has a clear physical interpretation and can be easily determined.
This study not only enhances the application of interface damage mechanics theory in reinforced soil within calcareous sand engineering but also offers both theoretical and experimental support for the selection and optimization of geosynthetics in coastal engineering.

Author Contributions

Conceptualization, L.X. and X.W.; methodology, L.X.; software, L.X.; validation, L.X., X.W. and R.W.; formal analysis, L.X. and R.W.; investigation, L.X.; resources, L.X.; data curation, L.X. and X.W.; writing—original draft preparation, L.X.; writing—review and editing, L.X.; visualization, L.X. and X.W.; supervision, L.X. and J.Z.; project administration, L.X.; funding acquisition, L.X. All authors have read and agreed to the published version of the manuscript.

Funding

This work was supported by the Chinese National Natural Science Foundation (Grant No. 42407246), Start-up Funds for Talent Introduction and Scientific Research in Hubei University of Education (Grant No. 20200288).

Data Availability Statement

Some or all data, models, or code that support the findings of this study are available from the corresponding author upon reasonable request.

Acknowledgments

The authors appreciate the detailed checks and questions from the reviewers, which provide great help for the improvement of this article.

Conflicts of Interest

The authors declare no conflict of interest.

References

  1. Xu, L.J.; Wang, X.Z.; Wang, R.; Zhu, C.Q.; Liu, X.P. Physical and mechanical properties of calcareous soils: A review. Mar. Georesour. Geotechnol. 2022, 40, 751–766. [Google Scholar] [CrossRef]
  2. Wang, X.; Liu, J.Q.; Cui, J.; Wang, X.Z.; Shen, J.H.; Zhu, C.Q. Particle breakage characteristics of a foundation filling material on island-reefs in the South China Sea. Constr. Build. Mater. 2021, 306, 124690. [Google Scholar] [CrossRef]
  3. Lv, Y.R.; Li, X.; Wang, Y. Particle breakage of calcareous sand at high strain rates. Powder Technol. 2020, 366, 776–787. [Google Scholar] [CrossRef]
  4. Wang, X.Z.; Wang, X.; Jin, Z.C.; Zhu, C.Q.; Wang, R.; Meng, Q.S. Investigation of engineering characteristics of calcareous soils from fringing reef. Ocean Eng. 2017, 134, 77–86. [Google Scholar] [CrossRef]
  5. Xu, L.J.; Wang, R.; Xu, D.S.; Wang, X.Z.; Meng, Q.S.; Zhu, C.Q. Review of particle breakage measurement methods for calcareous sand. Adv. Civ. Eng. 2022, 2022, 6477197. [Google Scholar] [CrossRef]
  6. Chen, X.; Shen, J.H.; Wang, X.; Yao, T.; Xu, D.S. Effect of saturation on shear behavior and particle breakage of coral sand. J. Mar. Sci. Eng. 2022, 10, 1280. [Google Scholar] [CrossRef]
  7. Palmeira, E.M. Soil–geosynthetic interaction: Modelling and analysis. Geotext. Geomembr. 2009, 27, 368–390. [Google Scholar] [CrossRef]
  8. Dos Santos, A.P.S.; Consoli, N.C.; Baudet, B.A. The mechanics of fibre-reinforced sand. Geotechnique 2010, 60, 791–799. [Google Scholar] [CrossRef]
  9. Goodarzi, S.; Shahnazari, H. Strength enhancement of geotextile-reinforced carbonate sand. Geotext. Geomembr. 2019, 47, 128–139. [Google Scholar] [CrossRef]
  10. Rezvani, R. Shearing response of geotextile-reinforced calcareous soils using monotonic triaxial tests. Mar. Georesour. Geotechnol. 2019, 38, 238–249. [Google Scholar] [CrossRef]
  11. Yoo, C.; Abbas, Q. Laboratory investigation of the behavior of a geosynthetic encased stone column in sand under cyclic loading. Geotext. Geomembr. 2020, 48, 431–442. [Google Scholar] [CrossRef]
  12. Esen, A.F.; Woodward, P.K.; Laghrouche, O.; Čebašek, T.M.; Brennan, A.J.; Robinson, S.; Connolly, D.P. Full-scale laboratory testing of a geosynthetically reinforced soil railway structure. Transp. Geotech. 2021, 28, 100526. [Google Scholar] [CrossRef]
  13. Ding, X.M.; Luo, Z.G.; Ou, Q. Mechanical property and deformation behavior of geogrid reinforced calcareous sand. Geotext. Geomembr. 2022, 50, 618–631. [Google Scholar] [CrossRef]
  14. Hakimelahi, N.; Bayat, M.; Ajalloeian, R.; Nadi, B. Effect of woven geotextile reinforcement on mechanical behavior of calcareous sands. Case Stud. Constr. Mater. 2023, 18, e02014. [Google Scholar] [CrossRef]
  15. Chen, J.F.; Akosah, S.; Ma, C.; Gidigasu, S.S. Large-scale triaxial tests of reinforced coral sand with different grain size distributions. Mar. Georesour. Geotechnol. 2023, 41, 544–554. [Google Scholar] [CrossRef]
  16. Li, N.; Wu, Y.; Zhang, X.L.; Zhou, F.L.; Chen, P.S.; Liu, Z.J.; Liang, X.C.; Yoshimoto, N. Effect of geotextile reinforcement on the mechanical behavior of marine calcareous sand retrieved from South China sea. Bull. Eng. Geol. Environ. 2026, 85, 81. [Google Scholar] [CrossRef]
  17. Vieira, C.S.; Lopes, M.L.; Caldeira, L.M. Sand-geotextile interface characterisation through monotonic and cyclic direct shear tests. Geosynth. Int. 2013, 20, 26–38. [Google Scholar] [CrossRef]
  18. Nye, C.J.; Fox, P.J. Dynamic shear behavior of a needle-punched geosynthetic clay liner. J. Geotech. Geoenviron. Eng. 2007, 133, 973–983. [Google Scholar] [CrossRef]
  19. Cen, W.J.; Bauer, E.; Wen, L.S.; Wang, H.; Sun, Y.J. Experimental investigations and constitutive modeling of cyclic interface shearing between HDPE geomembrane and sandy gravel. Geotext. Geomembr. 2019, 47, 269–279. [Google Scholar] [CrossRef]
  20. Cen, W.J.; Wang, H.; Yu, L.; Rahman, M.S. Response of high-density polyethylene geomembrane–sand interfaces under cyclic shear loading: Laboratory investigation. Int. J. Geomech. 2020, 20, 04019166. [Google Scholar] [CrossRef]
  21. Liu, F.; Ying, M.; Yuan, G.; Wang, J.; Gao, Z.; Ni, J. Particle shape effects on the cyclic shear behaviour of the soil–geogrid interface. Geotext. Geomembr. 2021, 49, 991–1003. [Google Scholar] [CrossRef]
  22. Moraci, N.; Cardile, G.; Gioffrè, D.; Mandaglio, M.C.; Calvarano, L.S.; Carbone, L. Soil geosynthetic interaction: Design parameters from experimental and theoretical analysis. Transp. Infrastruct. Geotechnol. 2014, 1, 165–227. [Google Scholar] [CrossRef]
  23. Han, J.; Jiang, Y.; Xu, C. Recent advances in geosynthetic-reinforced retaining walls for highway applications. Front. Struct. Civ. Eng. 2018, 12, 239–247. [Google Scholar] [CrossRef]
  24. Chen, J.F.; Gu, Z.A.; Rajesh, S.; Yu, S.B. Pullout behavior of triaxial geogrid embedded in a transparent soil. Int. J. Geomech. 2021, 21, 04021003. [Google Scholar] [CrossRef]
  25. Xu, L.J.; Wang, R.; Chen, J.F.; Wang, J.Q.; Xu, D.S.; Meng, Q.S. Pullout behavior of geogrid reinforcement in calcareous sand. Eur. J. Environ. Civ. Eng. 2024, 28, 1945–1967. [Google Scholar] [CrossRef]
  26. Esterhuizen, J.J.B.; Filz, G.M.; Duncan, J.M. Constitutive behavior of geosynthetic interfaces. J. Geotech. Geoenviron. Eng. 2001, 127, 834–840. [Google Scholar] [CrossRef]
  27. Seo, M.W.; Park, I.J.; Park, J.B. Development of displacement-softening model for interface shear behavior between geosynthetics. Soils Found. 2004, 44, 27–38. [Google Scholar] [CrossRef]
  28. Liu, C.N.; Zornberg, J.G.; Chen, T.C.; Ho, Y.H.; Lin, B.H. Behavior of geogrid-sand interface in direct shear mode. J. Geotech. Geoenviron. Eng. 2009, 135, 1863–1871. [Google Scholar] [CrossRef]
  29. Bacas, B.M.; Cañizal, J.; Konietzky, H. Frictional behaviour of three critical geosynthetic interfaces. Geosynth. Int. 2015, 22, 355–365. [Google Scholar] [CrossRef]
  30. He, Z.J.; Mo, H.Q.; Siga, A.; Zou, J. Research on the parameters of nonlinear hyperbolic model for clay-geogrid interfaces based on large scale direct shear tests. Transp. Geotech. 2019, 18, 39–45. [Google Scholar] [CrossRef]
  31. Manohar, D.R.; Anbazhagan, P. Shear strength characteristics of geosynthetic reinforced rubber-sand mixtures. Geotext. Geomembr. 2021, 49, 910–920. [Google Scholar] [CrossRef]
  32. Xu, D.S.; Yan, J.M.; Liu, Q. Behavior of discrete fiber-reinforced sandy soil in large-scale simple shear tests. Geosynth. Int. 2021, 28, 598–608. [Google Scholar] [CrossRef]
  33. Kommanamanchi, V.; Mahopatra, P.K.; Duddu, S.R.; Mutha, A.; Chennarapu, H. Large-scale direct shear testing for assessing interfacial parameters of natural and recycled sand with geosynthetic reinforcements. Constr. Build. Mater. 2024, 442, 137598. [Google Scholar] [CrossRef]
  34. Xu, L.J.; Wang, R.; Xu, D.S.; Wang, J.Q.; Wang, X.Z.; Meng, Q.S. Interface shear behavior of geogrid-reinforced calcareous sand under large-scale monotonic direct shear. Int. J. Geosynth. Ground Eng. 2022, 8, 66. [Google Scholar] [CrossRef]
  35. Xu, L.J.; Wang, R.; Liu, Q.B.; Chen, J.F.; Wang, X.Z.; Meng, Q.S. Effect of particle size distribution on monotonic direct shear characteristics of geotextile/geogrid-calcareous sand interface. Appl. Ocean Res. 2023, 137, 103601. [Google Scholar] [CrossRef]
  36. Chen, J.F.; Liu, Z.N.; Gu, Z.A.; Zhu, Y.; Gao, J.L. Large-scale direct shear test of the interface between coral sand and geogrid. Appl. Ocean Res. 2024, 153, 104219. [Google Scholar] [CrossRef]
  37. Chao, Z.; Zhou, J.; Shi, D.; Zheng, J. Particle size effect on the mechanical behavior of coral sand–geogrid interfaces. Geosynth. Int. 2025, 32, 774–790. [Google Scholar] [CrossRef]
  38. Luo, Z.G.; Ding, X.M.; Ou, Q.; Zhang, L.; Zhang, T. Investigation of shear mechanical behaviors of geogrid-coral sand interfaces. Geosynth. Int. 2025, 32, 625–641. [Google Scholar] [CrossRef]
  39. Pal, S.; Wathugala, G.W. Disturbed state model for sand–geosynthetic interfaces and application to pull-out tests. Int. J. Numer. Anal. Methods Geomech. 1999, 23, 1873–1892. [Google Scholar] [CrossRef]
  40. Zhang, G.; Wang, L.P.; Zhang, J.M. Monotonic and cyclic modeling of interface between geotextile and gravelly soil. Int. J. Numer. Anal. Methods Geomech. 2010, 34, 1346–1361. [Google Scholar] [CrossRef]
  41. Kwak, C.W.; Park, I.J.; Park, J.B. Evaluation of disturbance function for geosynthetic–soil interface considering chemical reactions based on cyclic direct shear tests. Soils Found. 2013, 53, 720–734. [Google Scholar] [CrossRef]
  42. Chang, J.Y.; Feng, S.J. A constitutive model for geosynthetic interfaces considering nonlinear softening behavior. Comput. Geotech. 2022, 143, 104633. [Google Scholar] [CrossRef]
  43. Yu, P.; Liu, H.H.; Geng, L.; Wang, S.; Yu, Y.; Zhu, C.H.; Yang, Q.; Liu, H.J.; Guan, Y. Softening/Hardening damage model and numerical implementation of seabed silt-steel interface in yellow river underwater delta. J. Mar. Sci. Eng. 2023, 11, 1415. [Google Scholar] [CrossRef]
  44. ASTM D5321; Standard Test Method for Determining the Coefficient of Soil and Geosynthetic or Geosynthetic and Geosynthetic Friction by the Direct Shear Method. ASTM International: West Conshohocken, PA, USA, 2008.
  45. ASTM D4595; Standard Test Method for Tensile Properties of Geotextiles by the Wide-Width Strip Method. ASTM International: West Conshohocken, PA, USA, 2011.
  46. EN ISO 12957-1; Geosynthetics—Determination of Friction Characteristics—Part 1: Direct Shear Test. European Committee for Standardization: Brussels, Belgium, 2005.
  47. ASTM D698-07; Standard Test Methods for Laboratory Compaction Characteristics of Soil Using Standard Effort. ASTM International: West Conshohocken, PA, USA, 2007.
  48. Anubhav; Basudhar, P.K. Modeling of soil–woven geotextile interface behavior from direct shear test results. Geotext. Geomembr. 2010, 28, 403–408. [Google Scholar] [CrossRef]
  49. Anubhav; Basudhar, P.K. Interface behavior of woven geotextile with rounded and angular particle sand. J. Mater. Civ. Eng. 2013, 25, 1970–1974. [Google Scholar] [CrossRef]
  50. Cao, W.G.; Zhao, H.; Li, X.; Zhang, Y.J. Statistical damage model with strain softening and hardening for rocks under the influence of voids and volume changes. Can. Geotech. J. 2010, 47, 857–871. [Google Scholar] [CrossRef]
  51. Li, X.; Cao, W.G.; Su, Y.H. A statistical damage constitutive model for softening behavior of rocks. Eng. Geol. 2012, 143, 1–17. [Google Scholar] [CrossRef]
  52. Huang, S.; Liu, Q.; Cheng, A.; Liu, Y. A statistical damage constitutive model under freeze-thaw and loading for rock and its engineering application. Cold Reg. Sci. Technol. 2018, 145, 142–150. [Google Scholar] [CrossRef]
  53. Kim, D.; Ha, S. Effects of particle size on the shear behavior of coarse grained soils reinforced with geogrid. Materials 2014, 7, 963–979. [Google Scholar] [CrossRef] [PubMed]
Figure 1. Calcareous sand samples. (a) Particle size distribution curve of calcareous sand in the South China Sea; (b) the scanning electron microscope micrograph of calcareous sand.
Jmse 14 00836 g001aJmse 14 00836 g001b
Figure 2. Geosynthetics used in monotonic shear test in this paper include geotextiles and geogrids with different mesh sizes. (a) Geotextile; (b) geogrid: 23 × 22 mm2; (c) geogrid: 40 × 38 mm2.
Jmse 14 00836 g002
Figure 3. Physical drawing of shear direct testing device (including normal/horizontal loading system, shear box, and control panel).
Jmse 14 00836 g003
Figure 4. Layout schematic diagram of lower shear box. (a) URCS: unreinforced calcareous sand; (b) GT-CS: geotextile–calcareous sand; (c) GG-CS-1: geogrid (23 × 22 mm2)–calcareous sand; (d) GG-CS-2: geogrid (40 × 38 mm2)–calcareous sand.
Jmse 14 00836 g004
Figure 5. Relationship between shear stress and shear displacement.
Jmse 14 00836 g005
Figure 6. Interaction mechanism of geosynthetics–calcareous sand interface. (a) URCS; (b) GT-CS; (c) GG-CS-1; (d) GG-CS-2.
Jmse 14 00836 g006
Figure 7. Relationships between Gism and ds of interface.
Jmse 14 00836 g007
Figure 8. Relationship of fitting parameters (URCS, GG-CS-1, and GG-CS-2) to normal stress. (a) κ; (b) λ.
Jmse 14 00836 g008
Figure 9. Relationship of fitting parameters (GT-CS) to normal stress. (a) η; (b) δ.
Jmse 14 00836 g009
Figure 10. Micro-mechanical analysis of interface element.
Jmse 14 00836 g010
Figure 11. Comparison between theoretical and test curves.
Jmse 14 00836 g011
Table 1. Basic physical and mechanical parameters of the geotextile.
PropertiesBreaking Strength (kN/m)Puncture Resistance (kN)Tensile Elongation
(%)
Mass per Unit Area
(g/m2)
Thickness
(mm)
GT-CS7.40.9632002.0
Notes: GT-CS: geotextile–calcareous sand.
Table 2. Basic physical and mechanical parameters of two kinds of geogrids.
Mechanical ParametersGG-CS-1GG-CS-2
Ultimate strength of longitudinal ribs (kN/m)15.740
Ultimate strength of transverse ribs (kN/m)12.240
Longitudinal rib thickness (mm)1.23.0
Transverse rib thickness (mm)0.81.0
Longitudinal rib width (mm)2.02.0
Transverse rib width (mm)2.84.0
Mesh size (mm2)22 × 2338 × 40
Node size (mm2)4.0 × 4.05.0 × 5.0
Notes: GG-CS-1: geogrid (23 × 22 mm2)–calcareous sand; GG-CS-2: geogrid (40 × 38 mm2)–calcareous sand.
Table 3. Testing programs.
Interface Typeσn (kPa)Shear Rate (mm/min)Dr (%)IPSD
URCS25/50/75/1001.090Cu = 6.67, Cc = 1.11
GT-CS25/50/75/1001.090Cu = 6.67, Cc = 1.11
GG-CS-125/50/75/1001.090Cu = 6.67, Cc = 1.11
GG-CS-225/50/75/1001.090Cu = 6.67, Cc = 1.11
Notes: σn: normal stress; Dr: relative density; IPSD: index of particle size distribution; URCS: unreinforced calcareous sand; GT-CS: geotextile–calcareous sand; GG-CS-1: geogrid (23 × 22 mm2)–calcareous sand; GG-CS-2: geogrid (40 × 38 mm2)–calcareous sand.
Table 4. Fitting parameters.
Interface Typesκλ
b1b2R2c1c2c3R2
URCS0.0902.0500.999−8.63 × 10−60.002−0.5480.980
GG-CS-10.1103.2590.999−7.58 × 10−60.002−0.5180.988
GG-CS-20.1022.1290.982−2.18 × 10−50.003−0.5150.958
Notes: URCS: unreinforced calcareous sand; GG-CS-1: geogrid (23 × 22 mm2)–calcareous sand; GG-CS-2: geogrid (40 × 38 mm2)–calcareous sand.
Table 5. Parameters of damage model under different normal stresses.
Interface TypesNormal Stress (kPa)Model Parameters
Gud (MPa)τr (kPa)mn
URCS253.34031.41.2380.0278
504.72069.41.1580.0254
755.98096.81.2530.0310
1007.410133.51.3360.0350
GT-CS255.82046.591.2750.0156
508.74085.371.2680.0146
759.130117.41.2490.0197
1009.650159.51.2760.0237
GG-CS-1254.01060.01.2020.0188
505.01098.51.1450.0238
757.4001341.1220.0257
1008.120176.11.2590.0318
GG-CS-2253.78047.51.1570.0209
504.21085.61.2280.0251
754.810125.51.2780.0303
1006.290159.41.3740.0362
Notes: URCS: unreinforced calcareous sand; GT-CS: geotextile–calcareous sand; GG-CS-1: geogrid (23 × 22 mm2)–calcareous sand; GG-CS-2: geogrid (40 × 38 mm2)–calcareous sand.
Disclaimer/Publisher’s Note: The statements, opinions and data contained in all publications are solely those of the individual author(s) and contributor(s) and not of MDPI and/or the editor(s). MDPI and/or the editor(s) disclaim responsibility for any injury to people or property resulting from any ideas, methods, instructions or products referred to in the content.