Article

Effect of Trailing-Edge Thickening on Aerodynamic and Flow-Field Characteristics of Wind Turbine Airfoil


by
Xiaobo Zheng
*,
Peng Qin
and
Sheng Xu
School of Green Energy and Energy Storage, Lanzhou University of Technology, Lanzhou 730050, China
*
Author to whom correspondence should be addressed.
J. Mar. Sci. Eng. 2026, 14(6), 555; https://doi.org/10.3390/jmse14060555
Submission received: 9 January 2026 / Revised: 10 March 2026 / Accepted: 11 March 2026 / Published: 16 March 2026
(This article belongs to the Topic Advances in Wind Energy Technology: 2nd Edition)

Abstract

The trailing-edge design of a wind turbine airfoil is critical for balancing the aerodynamic performance and structural robustness of a wind turbine blade. In this paper, the S809 airfoil and its blunt trailing-edge variant, the S809-100 airfoil, are taken as the research objects. The aerodynamic and flow-field characteristics of both airfoils are analyzed by computational fluid dynamics, which is validated by U.S. National Renewable Energy Laboratory experiments and wind tunnel particle image velocimetry. The results show that the S809-100 airfoil achieves a higher lift coefficient across the entire angle of attack ( α ) range 0–18°, with a superior lift-to-drag ratio within 8–12°. Three distinct states of aerodynamic response are identified for both airfoils, based on time series and spectral features of lift and drag coefficients, and flow-field structures: steady convergence state, periodic fluctuation state, and irregular fluctuation state. The two airfoils differ significantly in aerodynamic response transition with respect to α : for the S809 airfoil, the aerodynamic response remains in a steady convergence state up to α = 16 ° before shifting to a periodic fluctuation state, while for the S809-100 airfoil, it exhibits a periodic fluctuation state from α = 0 ° and transitions to an irregular fluctuation state beyond α = 14.2 ° . This difference stems from trailing-edge thickening, which induces flow unsteadiness in the S809-100 airfoil. This shift in the aerodynamic response from the periodic fluctuation state to the irregular fluctuation state is attributed to the transition from single-frequency large-scale vortex shedding to a multi-scale vortex interaction, confirmed via spectral and flow-field analyses. This study focuses on the correlated flow structures of wind turbine airfoils and deepens the understanding of unsteady aerodynamic responses; the combined analysis of enhanced aerodynamic performance and induced unsteady fluctuation due to trailing-edge thickening offers a valuable reference for wind turbine blade design.

1. Introduction

Accelerated by the global clean energy transition, wind energy has emerged as a cornerstone technology for ensuring energy security and achieving climate goals [1]. Its compelling environmental and efficiency advantages have made it one of the most dynamic sectors in the renewable energy landscape. In particular, offshore wind energy holds paramount significance for marine engineering and offshore energy development, as it harnesses vast, stable offshore wind resources critical to deploying next-generation large-scale wind turbines. This potential is underscored by rapid global deployment: as evidenced by the Global Wind Energy Council [2], the installed capacity has reached 83 GW worldwide, supplying clean power to over 73 million households. However, the aerodynamic performance and stability of these large-scale turbines under complex offshore conditions are fundamentally governed by the design of their blade airfoil sections.
As the primary aerodynamic component of a wind turbine blade, the airfoil directly governs the system’s efficiency, power output, and stability, making its optimization a cornerstone of wind turbine design. Among various optimization methods, trailing-edge thickening has attracted considerable attention due to its superior effect. Consequently, maximizing the aerodynamic performance of blades while meeting structural requirements has become a critical design challenge, which has driven the development of blunt trailing-edge (BTE) airfoils. The BTE modification enhances aerodynamic performance, yielding higher lift and lift-to-drag ratios compared to sharp trailing-edge airfoil counterparts [3,4,5,6,7,8]. Beyond aerodynamic gains, the BTE modifications also offer structural benefits that enable meeting wind turbine structural requirements with minimal compromise to aerodynamic efficiency [9].
Recently, Pei et al. [10] employed wind tunnel experiments and numerical simulations to study the NWT600 airfoil and observed that increased trailing-edge thickness enhanced flow attachment on the airfoil surface, leading to notable improvements in the maximum lift coefficient and lift-to-drag ratio. Numerical studies by Zhang et al. [11] on S-series airfoils developed by the U.S. National Renewable Energy Laboratory (NREL) further revealed that BTE profiles can improve aerodynamic performance, with the improvement level closely correlating with the airfoil’s relative camber. In addition to symmetric BTE configurations, Liu et al. [12] explored the effects of asymmetric trailing-edge thickness modifications and proposed drag reduction methods including serrations, slotted designs, and their combination, highlighting that refined trailing-edge configurations (BTE and drag reduction structures) can further optimize aerodynamic efficiency. Beyond on the inherent aerodynamic merits of BTE airfoils themselves, research has further extended to their practical application in wind turbines. Ni et al. [13] studied the self-starting characteristics of BTE-equipped H-type vertical axis wind turbines, finding a power coefficient increase of up to 70% at low tip speed ratios compared with the original sharp trailing-edge design. Yang et al. [14] conducted numerical simulations of an optimized laminar BTE airfoil in the NREL Phase VI wind turbine blade, which effectively suppresses flow separation and notably enhances the turbine’s output power. Collectively, these studies substantiate that trailing-edge thickening can significantly improve the aerodynamic performance of wind turbine airfoils. It should be noted that wind turbine performance is governed by multi-scale aerodynamics (sectional airfoil behavior, three-dimensional spanwise effects, and wake interactions). Although improved section performance does not automatically guarantee superior overall turbine performance, airfoil aerodynamics remains the fundamental input for widely used engineering prediction frameworks (e.g., blade element-based models), and unsteady airfoil response is recognized as an important source of load fluctuations in wind turbines [15,16].
To summarize, numerous experimental studies have been conducted on the steady aerodynamic performance of BTE airfoils in wind turbines. However, previous studies have largely overlooked the influence of trailing-edge thickening from the perspective of unsteady aerodynamic response. Moreover, the dynamic correlation between unsteady aerodynamic forces and the evolution of key flow structures remains inadequately explored, resulting in a limited understanding of how trailing-edge thickening affects unsteady aerodynamics. To address these gaps, this study investigates the effect of trailing-edge thickening on the aerodynamic and flow-field characteristics of the S809 airfoil from multiple perspectives, namely the time series, mean values, fluctuation intensity, and frequency spectrum of the aerodynamic coefficients and the correlated flow-field structures.

2. Materials and Methods

2.1. Blunt Trailing-Edge Airfoil

The airfoil model adopted in this study is the S809 airfoil, developed by the NREL. This airfoil is representative and widely utilized in wind turbine applications, known for its high aerodynamic efficiency, insensitivity to leading-edge roughness, and excellent adaptability to complex environmental conditions [17,18,19].
To obtain its BTE variant, the baseline S809 profile was symmetrically thickened aft of a specified chordwise location. The non-dimensional coordinates (normalized by the airfoil chord length C ) of the modified airfoil and its baseline are denoted by ( x , y ) and ( x 0 , y 0 ) , respectively, where x , x 0 [ 0,1 ] . The resulting geometry is defined by the following piecewise relation [20]:
x = x 0 y = y 0 0 x x t x = x 0 y = y 0 ± δ 2 x x t 1 x t n x t < x 1
The increment distribution of power law thickness with the exponent n = 2 is applied symmetrically to the upper and lower surfaces of the baseline profile, starting from a prescribed chordwise location x t = 0.21 and extending to the trailing edge at x = 1 . The non-dimensional trailing-edge thickness is δ = 0.10 , for which this BTE variant is named S809-100. It should be noted that δ = 0.10 was not obtained through a dedicated airfoil shape optimization, but was selected as a representative blunt trailing-edge thickness commonly used in prior investigations [20,21,22]. The profiles of the S809 and S809-100 airfoils are shown in Figure 1.

2.2. Experimental Setup

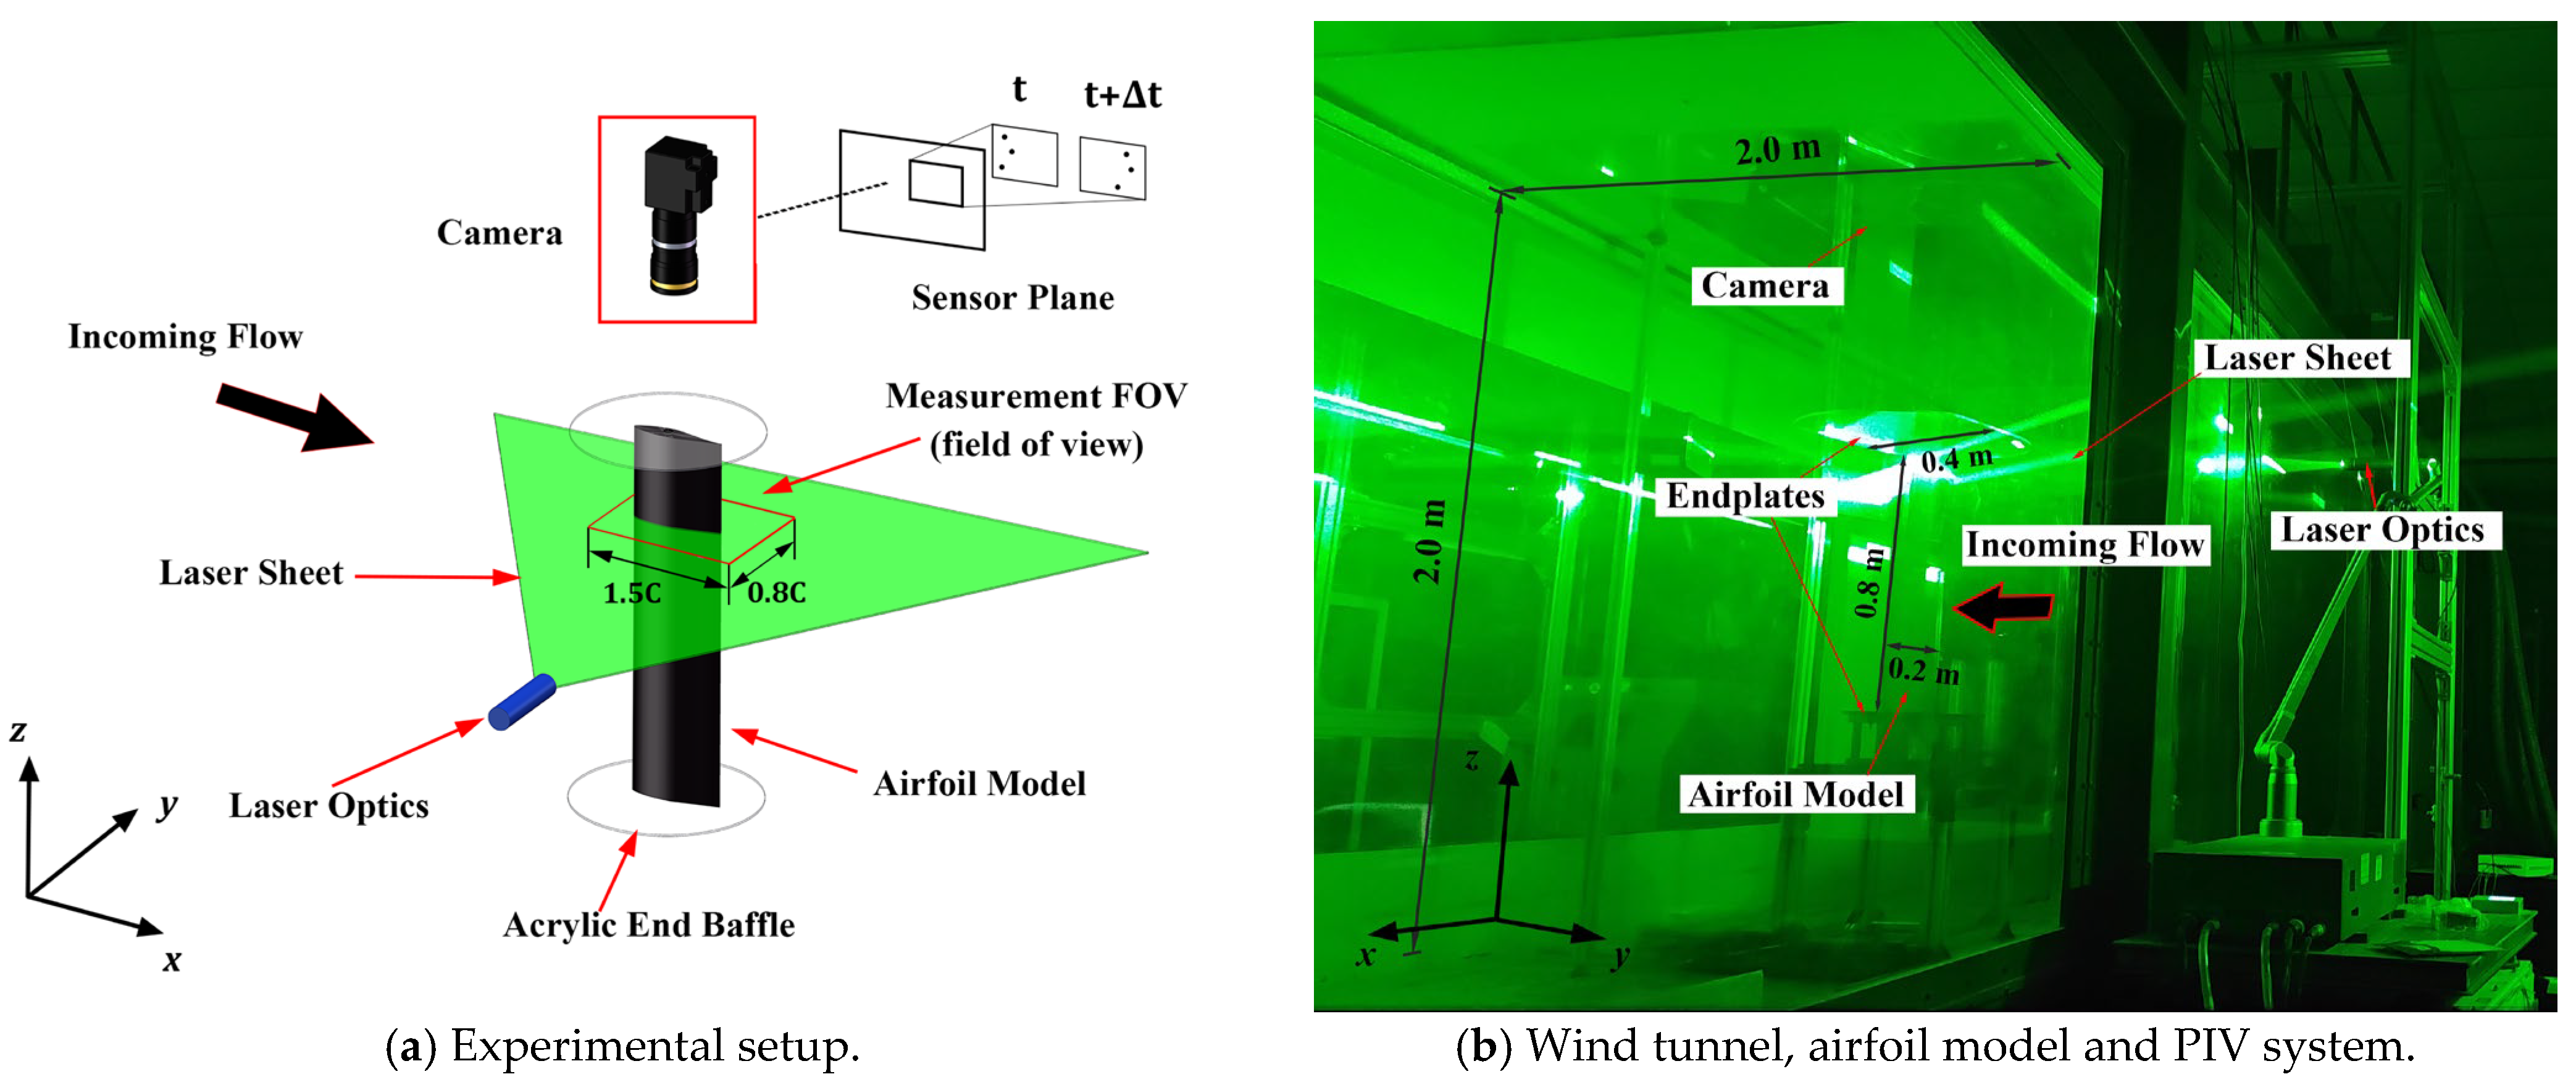
The experimental setup is schematically shown in Figure 2. A Revealer particle image velocimetry (PIV) system (HF Agile Device Co., Ltd., Hefei, Anhui, China) was employed to investigate the flow fields around S809 and S809-100 airfoils in a direct-flow wind tunnel at Lanzhou University of Technology. The wind tunnel’s test section is 17   m long with a cross-sectional area of 2.0 m × 2.0 m , a maximum design velocity of 35 m / s , and a background turbulence intensity of approximately 1%. Experiments were conducted at a freestream velocity of U = 10   m / s (freestream turbulence intensity: 1%, chord-based Reynolds number R e = 1.37 × 10 5 ). The three-dimensional airfoil models (chord length C = 0.2 m, span L = 0.8   m ) were precision-machined from aluminum alloy via computer numerical control milling. The model surface was polished with the average peak-to-valley roughness height no larger than 1.6 micrometers, followed by anodization to a black finish to minimize laser reflection during PIV measurements. To ensure flow two-dimensionality, circular transparent acrylic endplates (diameter 2 C ) were installed at both ends of the models, with the maximum blockage ratio maintained below 4% to minimize wall interference.
A high-speed double-frame CMOS camera (resolution: 4800 × 3400 pixels) was positioned 3 C above the model, and the 1.5 C × 0.8 C measurement plane was illuminated by a horizontal linear laser sheet emitted from the airfoil’s pressure side. After confirming a uniform distribution of seeding particles in the field of view, flow fields were recorded at a sampling rate of 10   H z , with an inter-frame time interval of 0.023   m s , for 50   s per recording, yielding 500 instantaneous flow fields for analysis. The velocity fields were obtained using a three-pass multi-grid cross-correlation algorithm, with a final interrogation window size of 32 × 32 pixels and a 50% overlap in both the streamwise and transverse directions. Image calibration yielded a spatial resolution of 0.052   m m / p x , resulting in a final vector spacing of 0.832   m m . Posterior analysis of the simulated flow fields showed that the dominant frequencies yield ratios with the PIV sampling rate of 10 Hz that are not simple fractions, thus inherently avoiding phase-locking. For the PIV measurements, as the sample size increased to 400, the maximum deviation relative to the peak-to-peak amplitude of the corresponding vorticity field decreased to 3.1%, indicating that statistical convergence was achieved with 500 flow realizations. Based on the sub-pixel displacement estimation and the timing uncertainty of the synchronizer, the combined measurement uncertainty of the instantaneous velocity was determined to be 0.23 m/s. In addition, the statistical uncertainty of the averaged velocity components remained below 0.20 m/s across the PIV measurements.

2.3. Numerical Methods and Settings

In order to provide references for the wind turbines at the blade-section level, the unsteady aerodynamic performance and flow fields of S809 and S809-100 airfoils with the same Reynolds number R e = 1.37 × 10 5 were studied by performing two-dimensional computational fluid dynamics (CFD) simulations based on Simcenter STAR-CCM+ (internal version: 19.06.008, Siemens Digital Industries Software, Plano, Texas, USA). The Reynolds number R e , based on the freestream velocity U and the airfoil chord length C , is defined as follows:
R e = ρ U C μ
where the air density ρ = 1.225   k g / m 3 , the freestream velocity U = 10   m / s , the chord length C = 0.2   m , and the dynamic viscosity of air μ = 1.79 × 10 5   P a · s . In the simulations, two-dimensional unsteady Reynolds-averaged Navier–Stokes (URANS) equations were solved:
U j ¯ x j = 0
U i ¯ t + U j ¯ U i ¯ x j = 1 ρ P ¯ x i + v 2 U i ¯ x j 2 u i u j ¯ x j
where x i denotes the spatial coordinate in the i-direction, t is time, U i ¯ and u i are the mean and fluctuating velocity components, respectively, ρ is the fluid density, P is the pressure, v is the kinematic viscosity, and u i u j ¯ is the Reynolds stress tensor. Turbulence closure was achieved using the k ω SST (Shear Stress Transport) model.
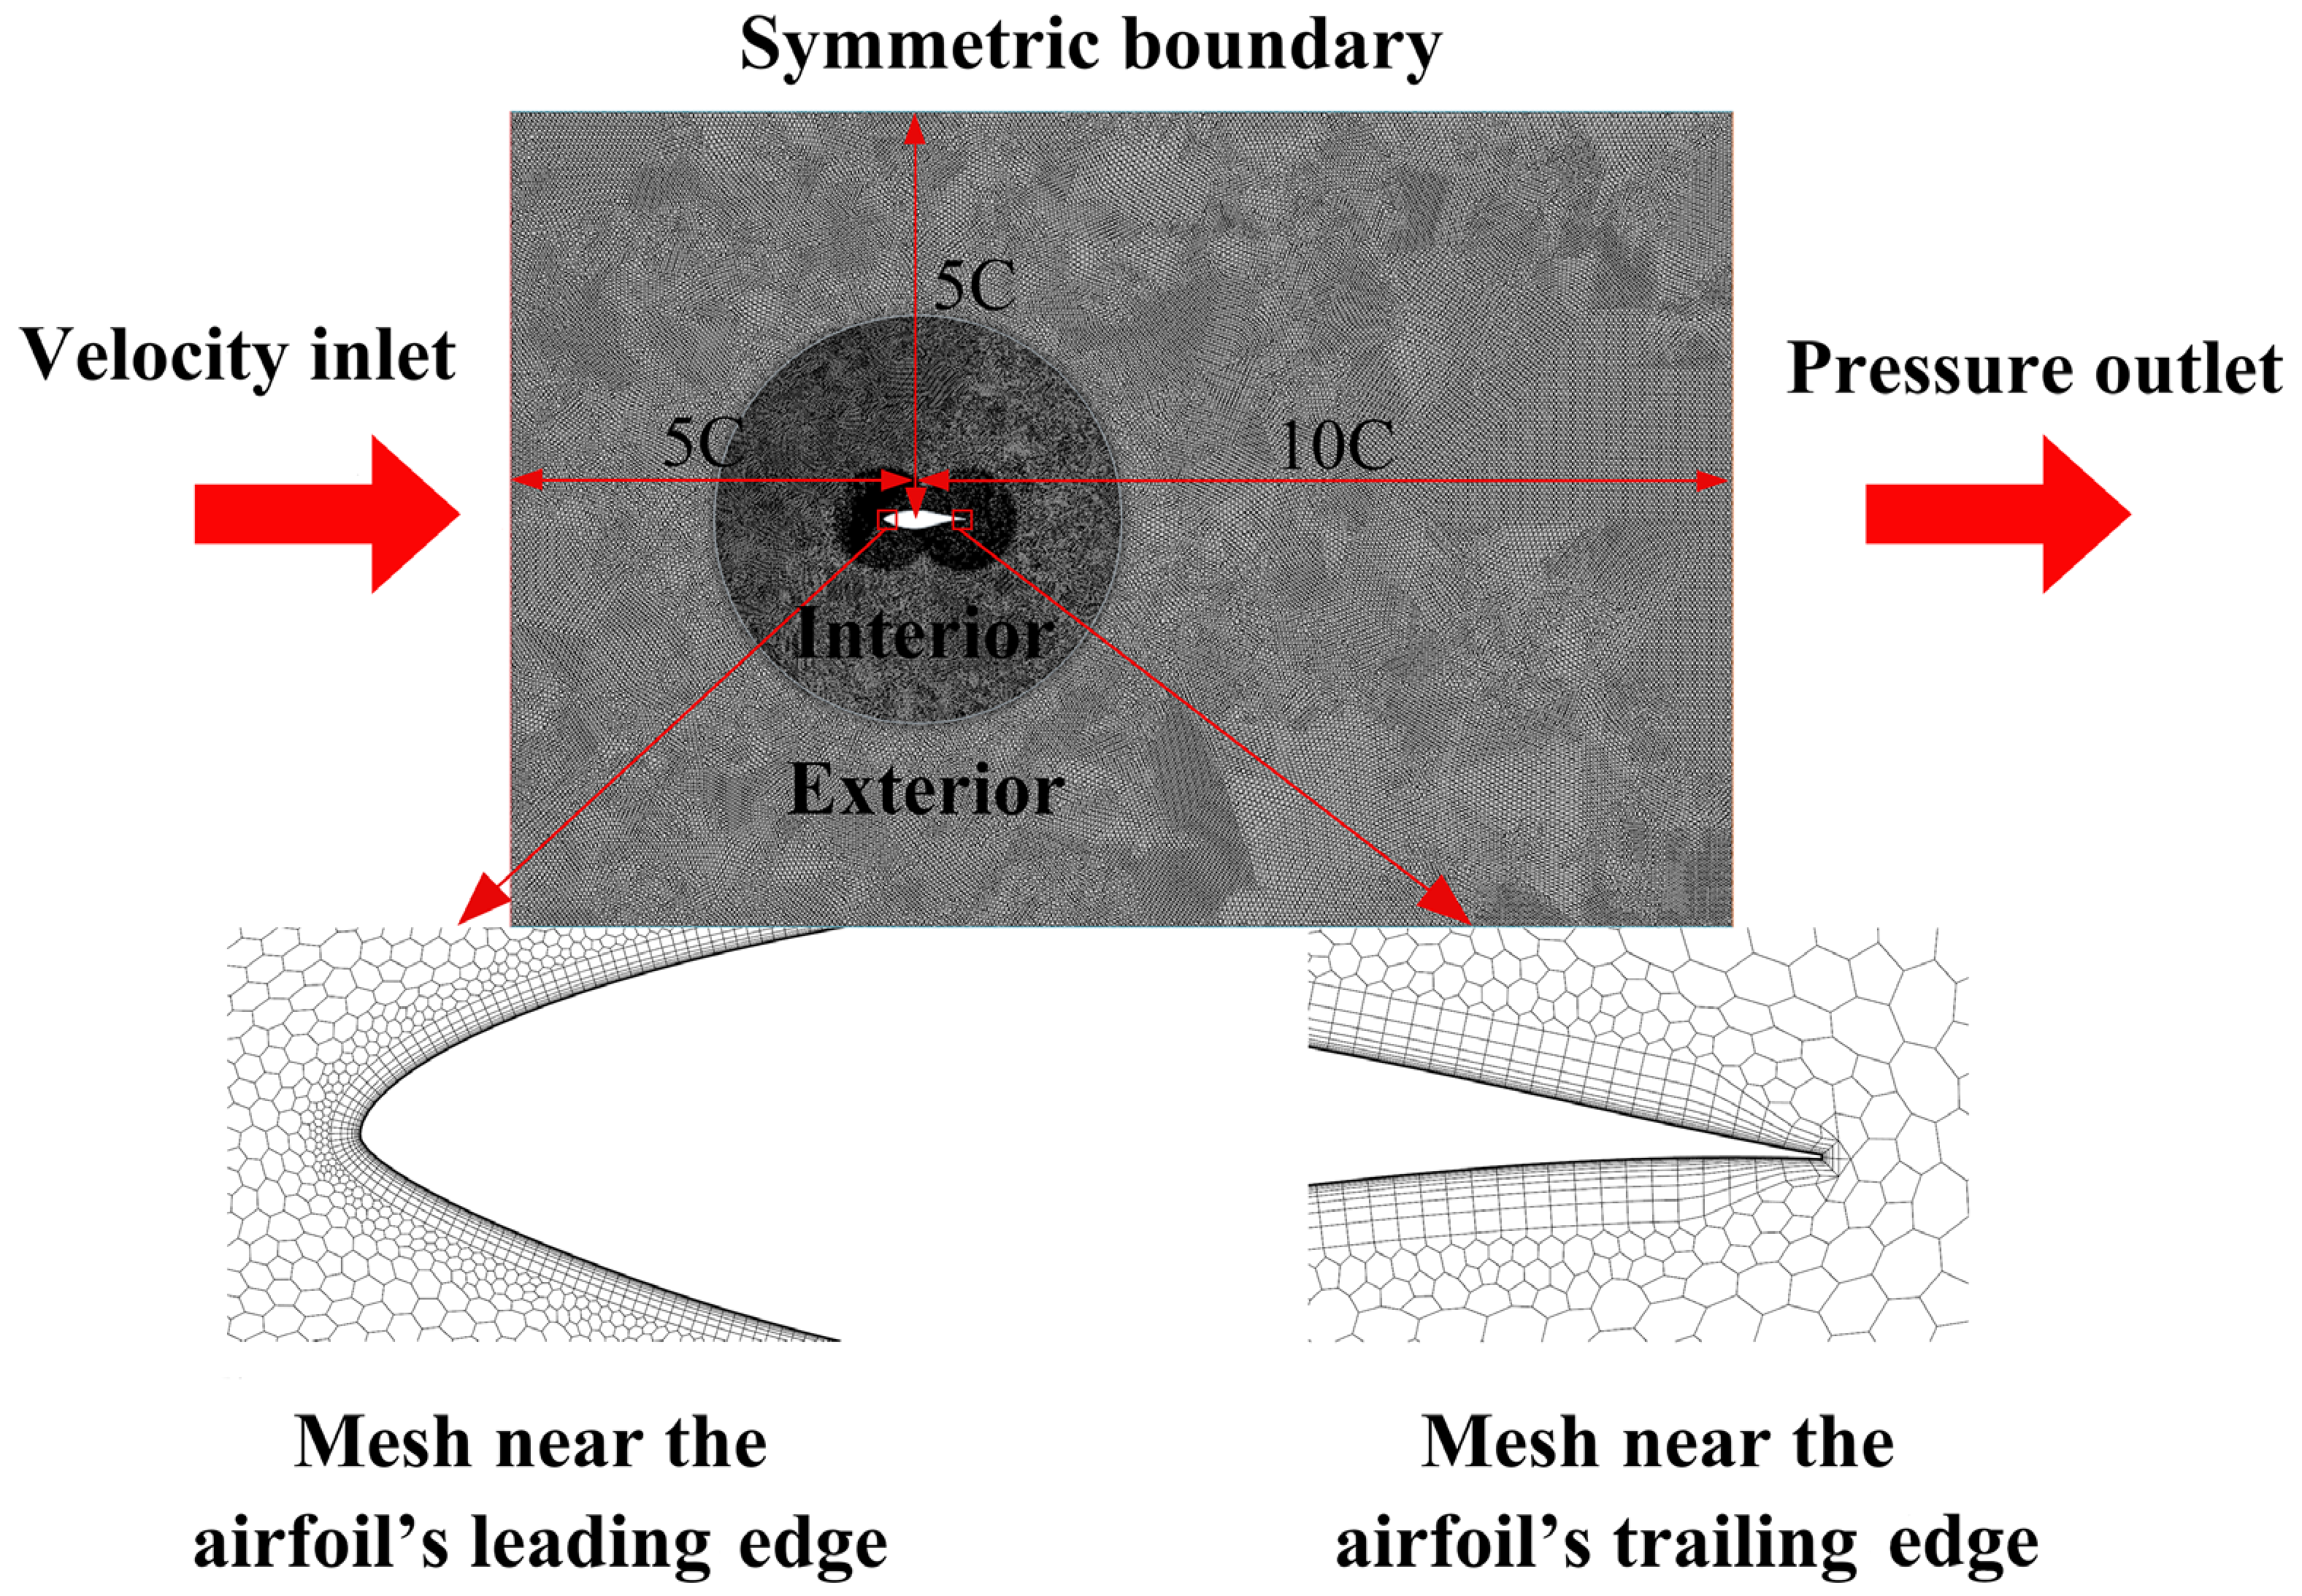
Figure 3 illustrates the computational domain, boundary conditions, and mesh used in the simulations. A non-dimensional coordinate system ( X / C , Y / C ) was adopted, with its origin ( 0,0 ) fixed at the airfoil centroid. Here, X denotes the streamwise direction aligned with the freestream, and Y the normal (cross-stream) direction. The domain is rectangular, measuring 15 C × 10 C . The airfoil was positioned such that its centroid lies at X / C = 0 with the inlet at X / C = 5 , the outlet at X / C = 10 , and the lateral boundaries at Y / C = ± 5 . Boundary conditions were set as follows: velocity inlet at the left boundary, pressure outlet at the right, symmetry on the top and bottom sides, and a no-slip wall on the airfoil surface. At the inlet, turbulence was specified using the intensity-and-viscosity-ratio method, with a freestream turbulence intensity of 0.01 and a turbulent viscosity ratio of 10. The same specification was used to initialize the turbulence field. The y + wall treatment was adopted to adaptively assign the turbulence quantities at the airfoil wall boundary. The governing equations were discretized in space using the finite volume method. An unstructured [23,24] polygonal mesh was employed for the spatial discretization of the computational domain. A circular region of diameter 5 C around the airfoil was refined, with a mesh size ratio of 1:2 between this inner zone and the outer domain. A sliding interface between the zones allowed the angle of attack to be varied from 0 ° to 18 ° . To resolve the boundary layer, 20 prism layers were generated on the airfoil surface with a growth rate of 1.2 and a total thickness of 0.0025   m , ensuring y + < 1 . The streamwise cell length along the surface was about 1 × 10 3   m . Local refinement zones with a diameter of 0.12 C were placed at the leading and trailing edges, where the mesh size was reduced to 2.0 × 10 3   m to capture detailed flow structures. For the S809 airfoil with a sharp trailing edge, a small geometric truncation was applied at the trailing-edge tip, with a truncated thickness of 0.00042 C , to prevent the generation of negative-volume cells. This small truncation had a negligible influence on the aerodynamic performance and was consistent with the experimental model. Mesh diagnostics confirmed that the maximum skewness angle of the cells was 48.79 degrees. The grid was topologically valid with no concave cells, and the least-squares mesh quality exceeded 0.5 for 99.6% of the cells.
The discretized governing equations were solved with a pressure-based segregated solver coupled with the SIMPLE algorithm. For temporal discretization, a second-order implicit scheme was employed with a fixed time step of t = 0.001   s and 20 inner iterations per time step. The resulting convective Courant–Friedrichs–Lewy (CFL) numbers were found with the maximum value of 1.4 in the mainstream and 4.8 in the prism layers. Each case was simulated for a total physical time of 4 s. To eliminate initial transients, the first 0.75 s was discarded as flushing time, and time-averaging was subsequently performed over the interval from 2 s to 4 s, after the aerodynamic coefficients had reached statistical stationarity with the sample size-related maximum deviation less than 1.5% of the averaged value.

2.4. Verification and Validation

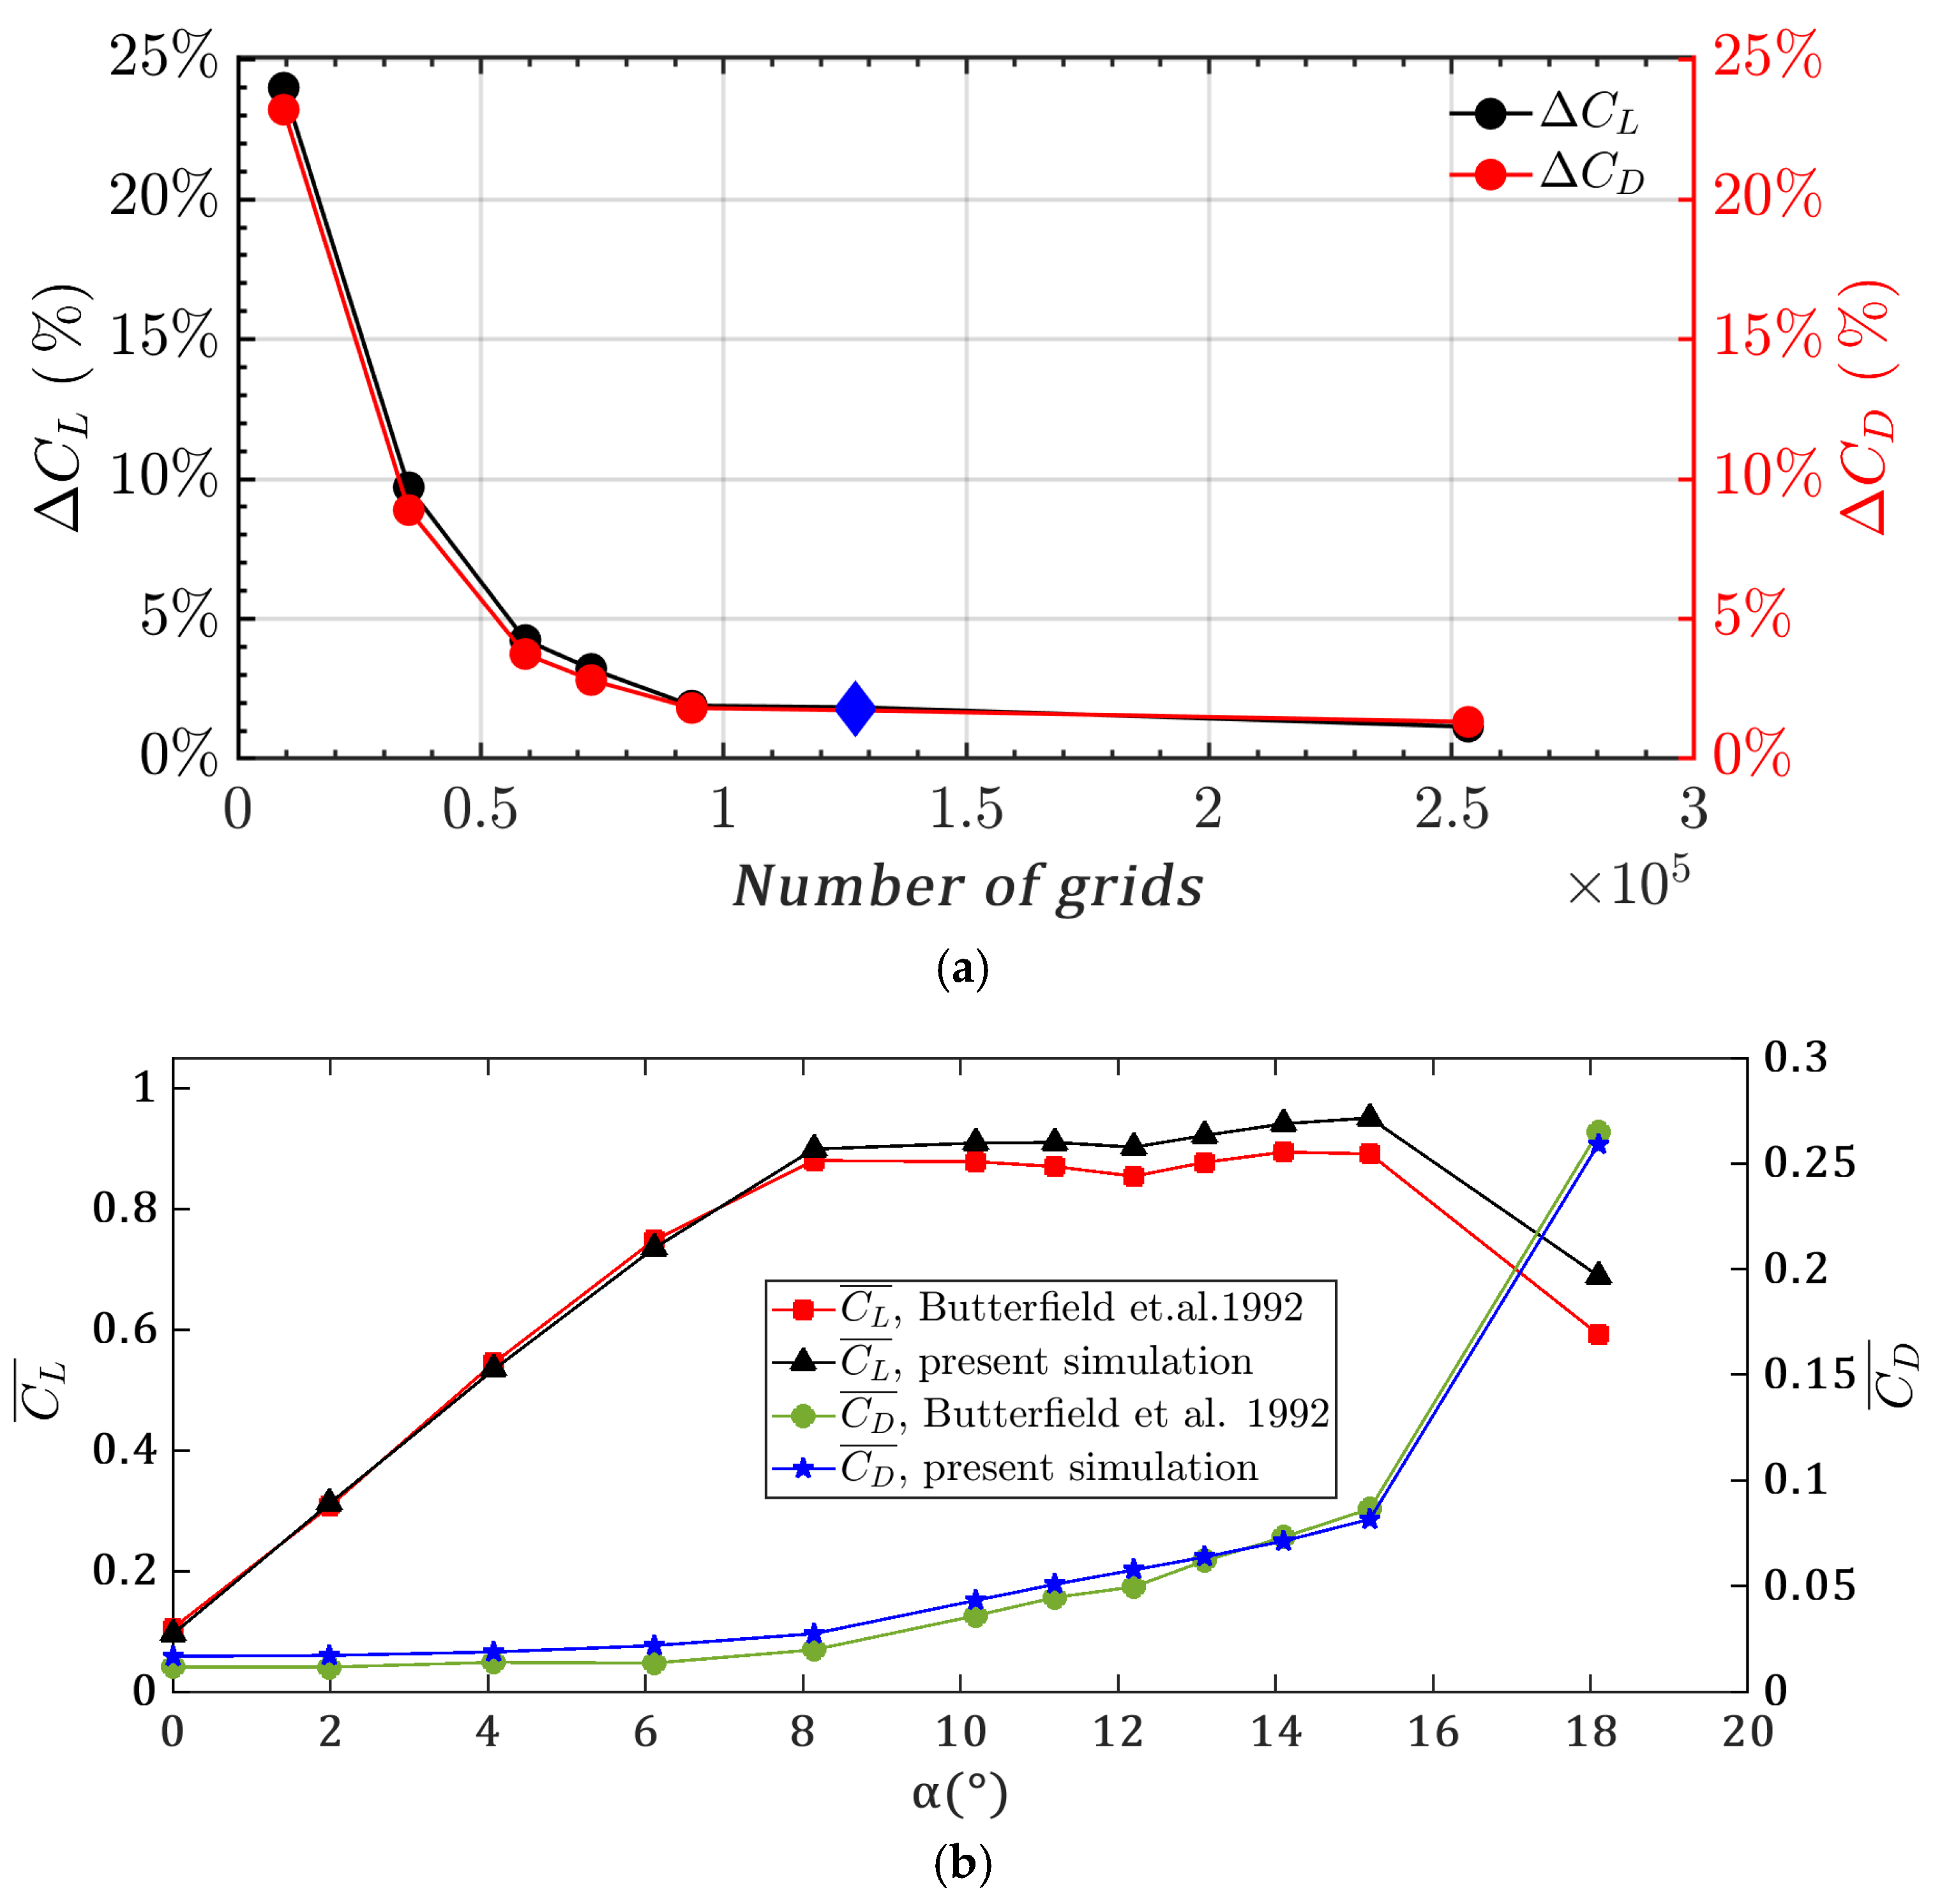
A grid-independence study was conducted for the S809 airfoil at R e = 1.37 × 10 5 and α = 18 ° . The results are presented in Figure 4a. The time-averaged lift and drag coefficients, C L ¯ and C D ¯ , became weakly sensitive to further grid refinement when the total cell count reached approximately 1.27 × 10 5 . Taking the finest mesh with 4.81 × 10 5 cells as the reference, the relative differences of the selected mesh were 1.8% for C L ¯ and 1.7% for C D ¯ , defined as follows:
C L ¯ = C L ¯ C L , r e f ¯ C L , r e f ¯ × 100 %
C D ¯ = C D ¯ C D , r e f ¯ C D , r e f ¯ × 100 %  
To validate the accuracy of the numerical simulations, the S809 airfoil was simulated at a Reynolds number of R e = 3.0 × 10 5 across various angles of attack, and the results were compared with the experimental data reported by Butterfield et al. [18]. As shown in Figure 4b, the simulated averaged lift and drag coefficients exhibit a variation trend with the angle of attack that is consistent with the experimental measurements. The averaged drag coefficient shows good overall agreement, while the averaged lift coefficient agrees well at low angles of attack ( α 8 ° ). The maximum deviation occurs at α = 15.2 ° , with a relative error not exceeding 9.1%.
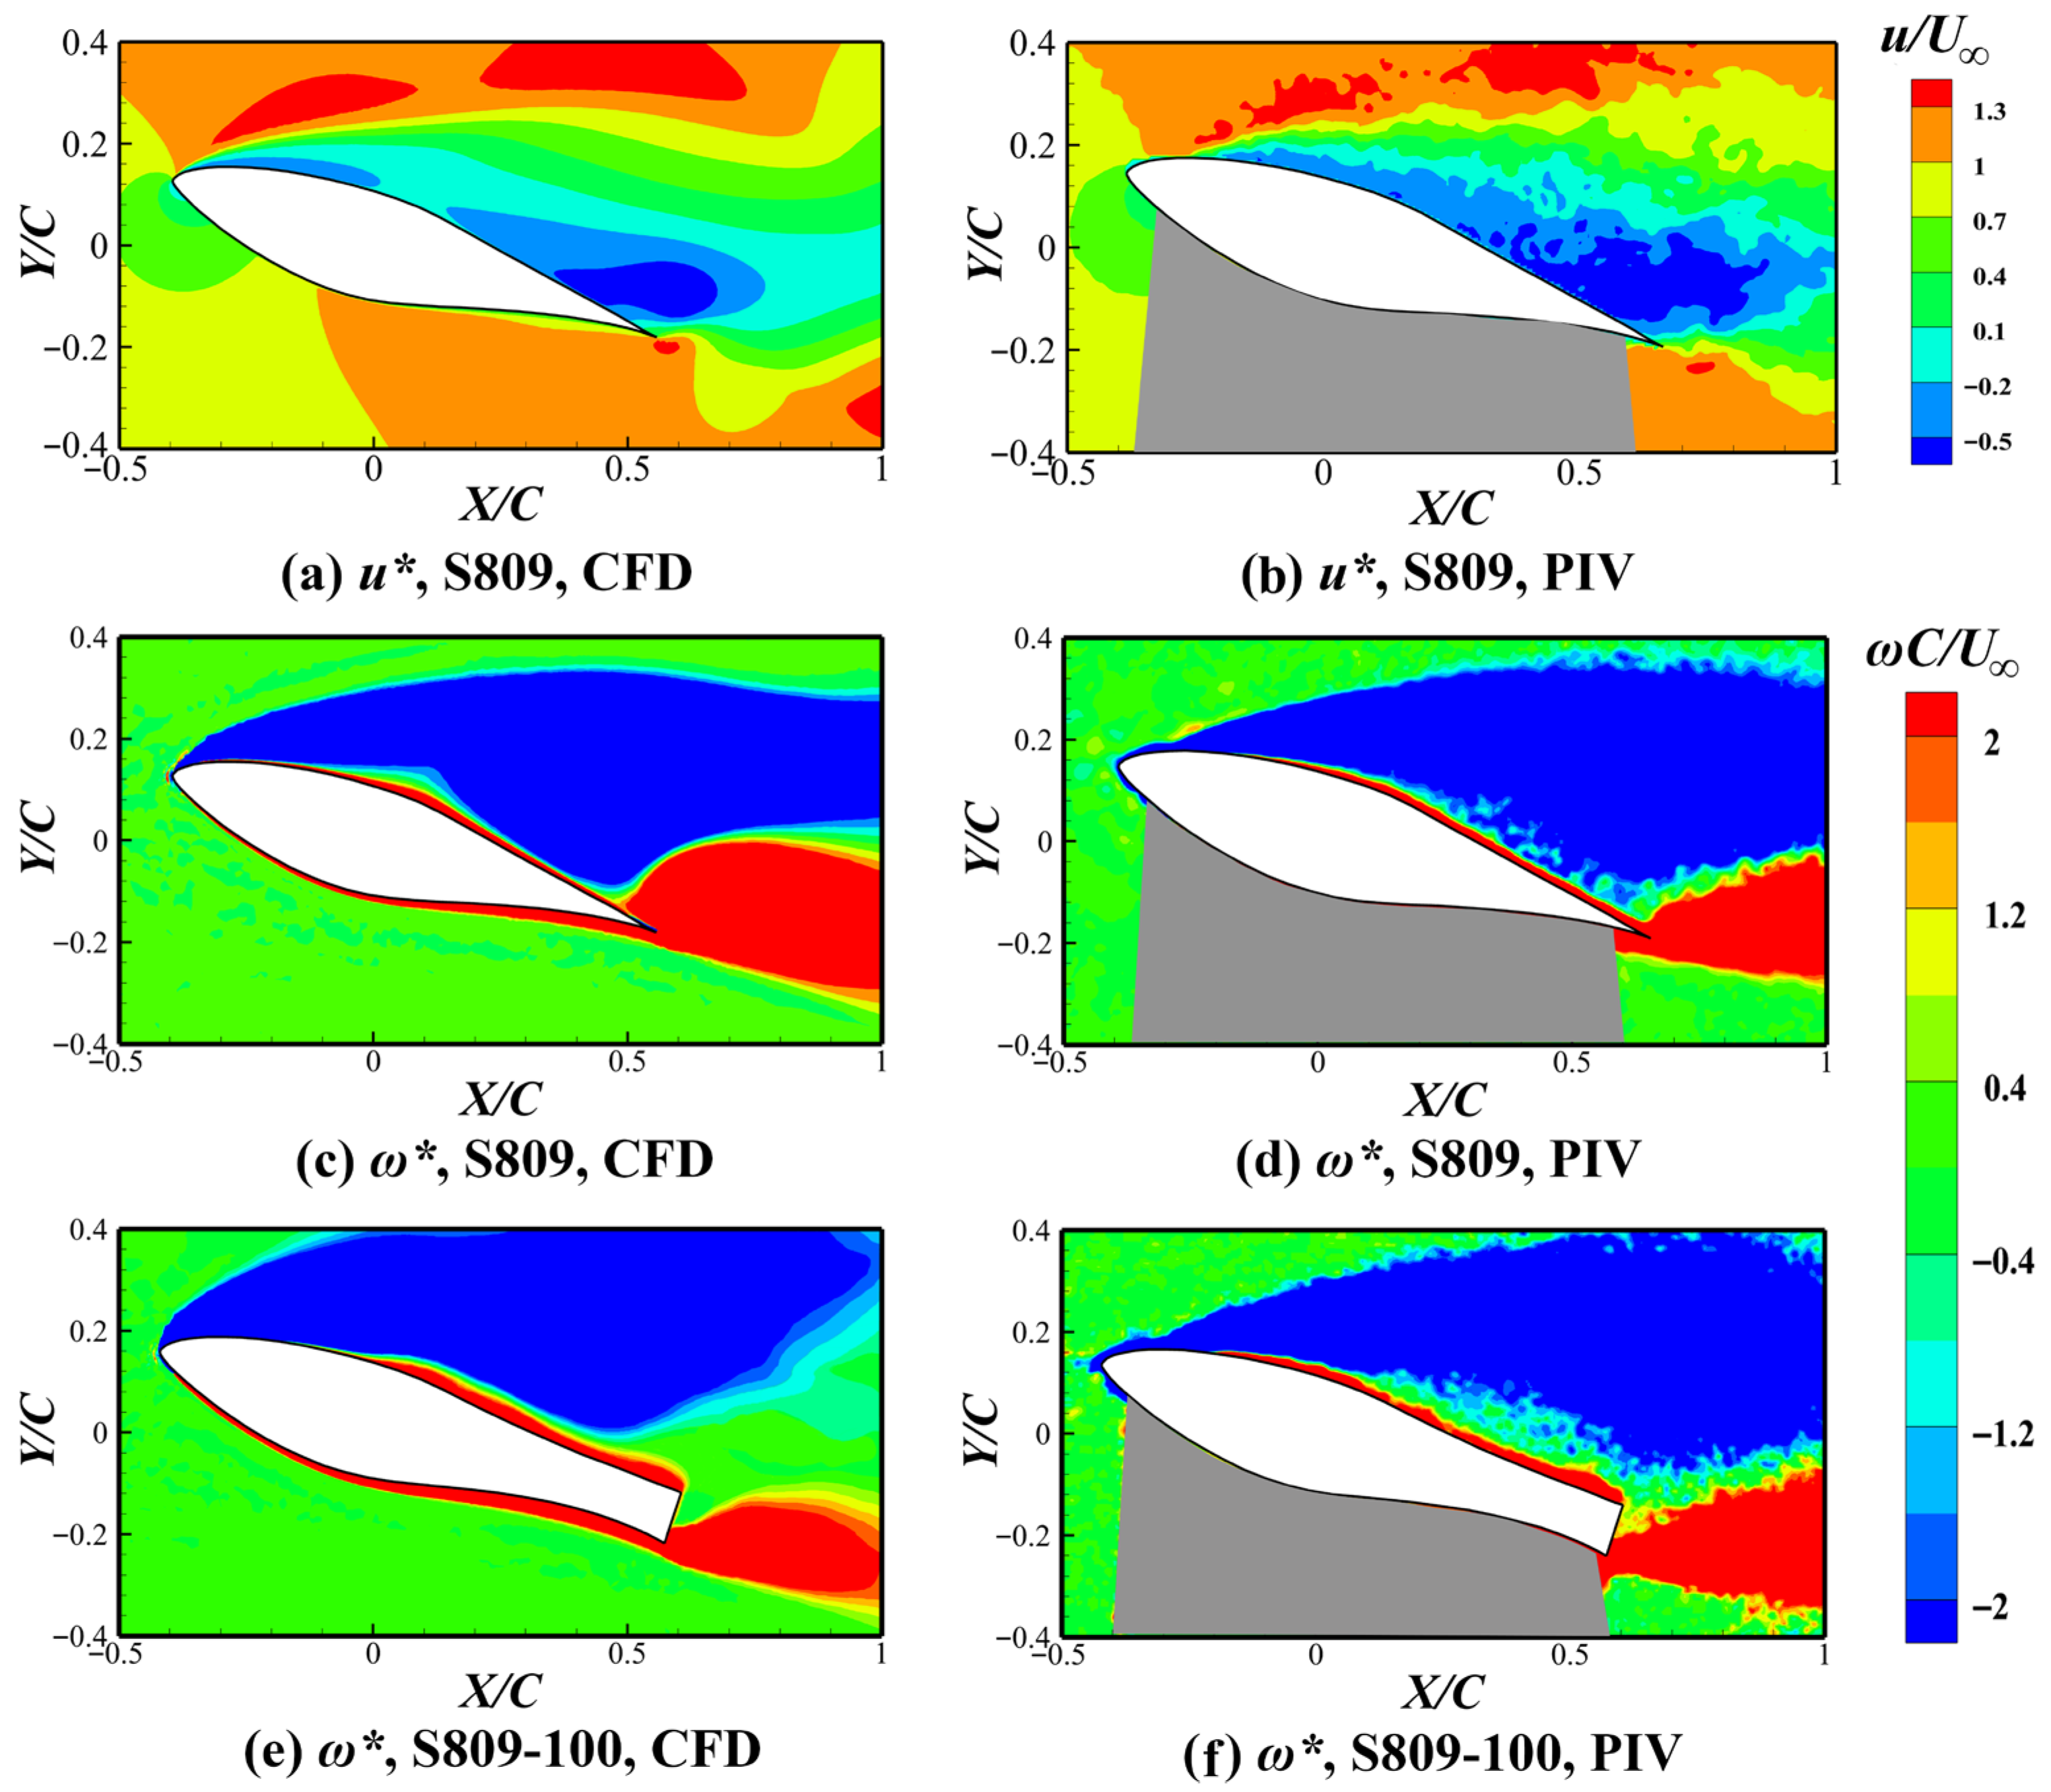
The unsteady flow characteristics of the S809 and S809-100 airfoils at large angles of attack constitute a core focus of this study. To ensure the reliability of subsequent unsteady flow analyses, the instantaneous velocity fields and averaged vorticity fields were investigated via unsteady CFD simulations, with the obtained results validated against corresponding PIV experimental data. Figure 5 includes both dimensionless instantaneous velocity ( u ) and dimensionless averaged vorticity ( ω * ) fields for the S809 and S809-100 airfoils at α   =   18 ° . u was defined using the freestream velocity U :
u = u U
while ω * was defined using the chord length C and U :
ω * = ω C U
The instantaneous velocity fields for the S809 airfoil, shown in Figure 5a,b, consistently exhibit the dominant flow separation features, including suction-side separation and the associated near-wake velocity-deficit region. This consistency demonstrates that URANS modeling captures the key unsteady flow structures observed experimentally. The averaged vorticity fields of both airfoils are presented in Figure 5c–f. For the S809 airfoil, clockwise-rotating negative vorticity (blue) attaches to the leading edge and extends over a large area above the suction surface. A thin layer of concentrated counterclockwise-rotating positive vorticity (red) attaches to both the suction and pressure surfaces, subsequently shedding from the trailing edge and forming an extended region in the near wake. The S809-100 airfoil exhibits a qualitatively similar mean vorticity field topology. Despite some discrepancies at the boundaries of the positive and negative vorticity regions—likely attributable to the inherent limitations of URANS in resolving small-scale flow features—the overall flow structure topology shows good agreement between the CFD and PIV results.

3. Results and Discussion

To investigate the effect of trailing-edge thickening on the aerodynamic and flow-field characteristics of the S809 airfoil, we compared it with its BTE variant, S809-100. CFD simulations were conducted to characterize key properties from multiple perspectives, including the time series, statistical values, and frequency spectrum of the aerodynamic coefficient and corresponding flow fields.

3.1. Time Series of Lift and Drag Coefficients

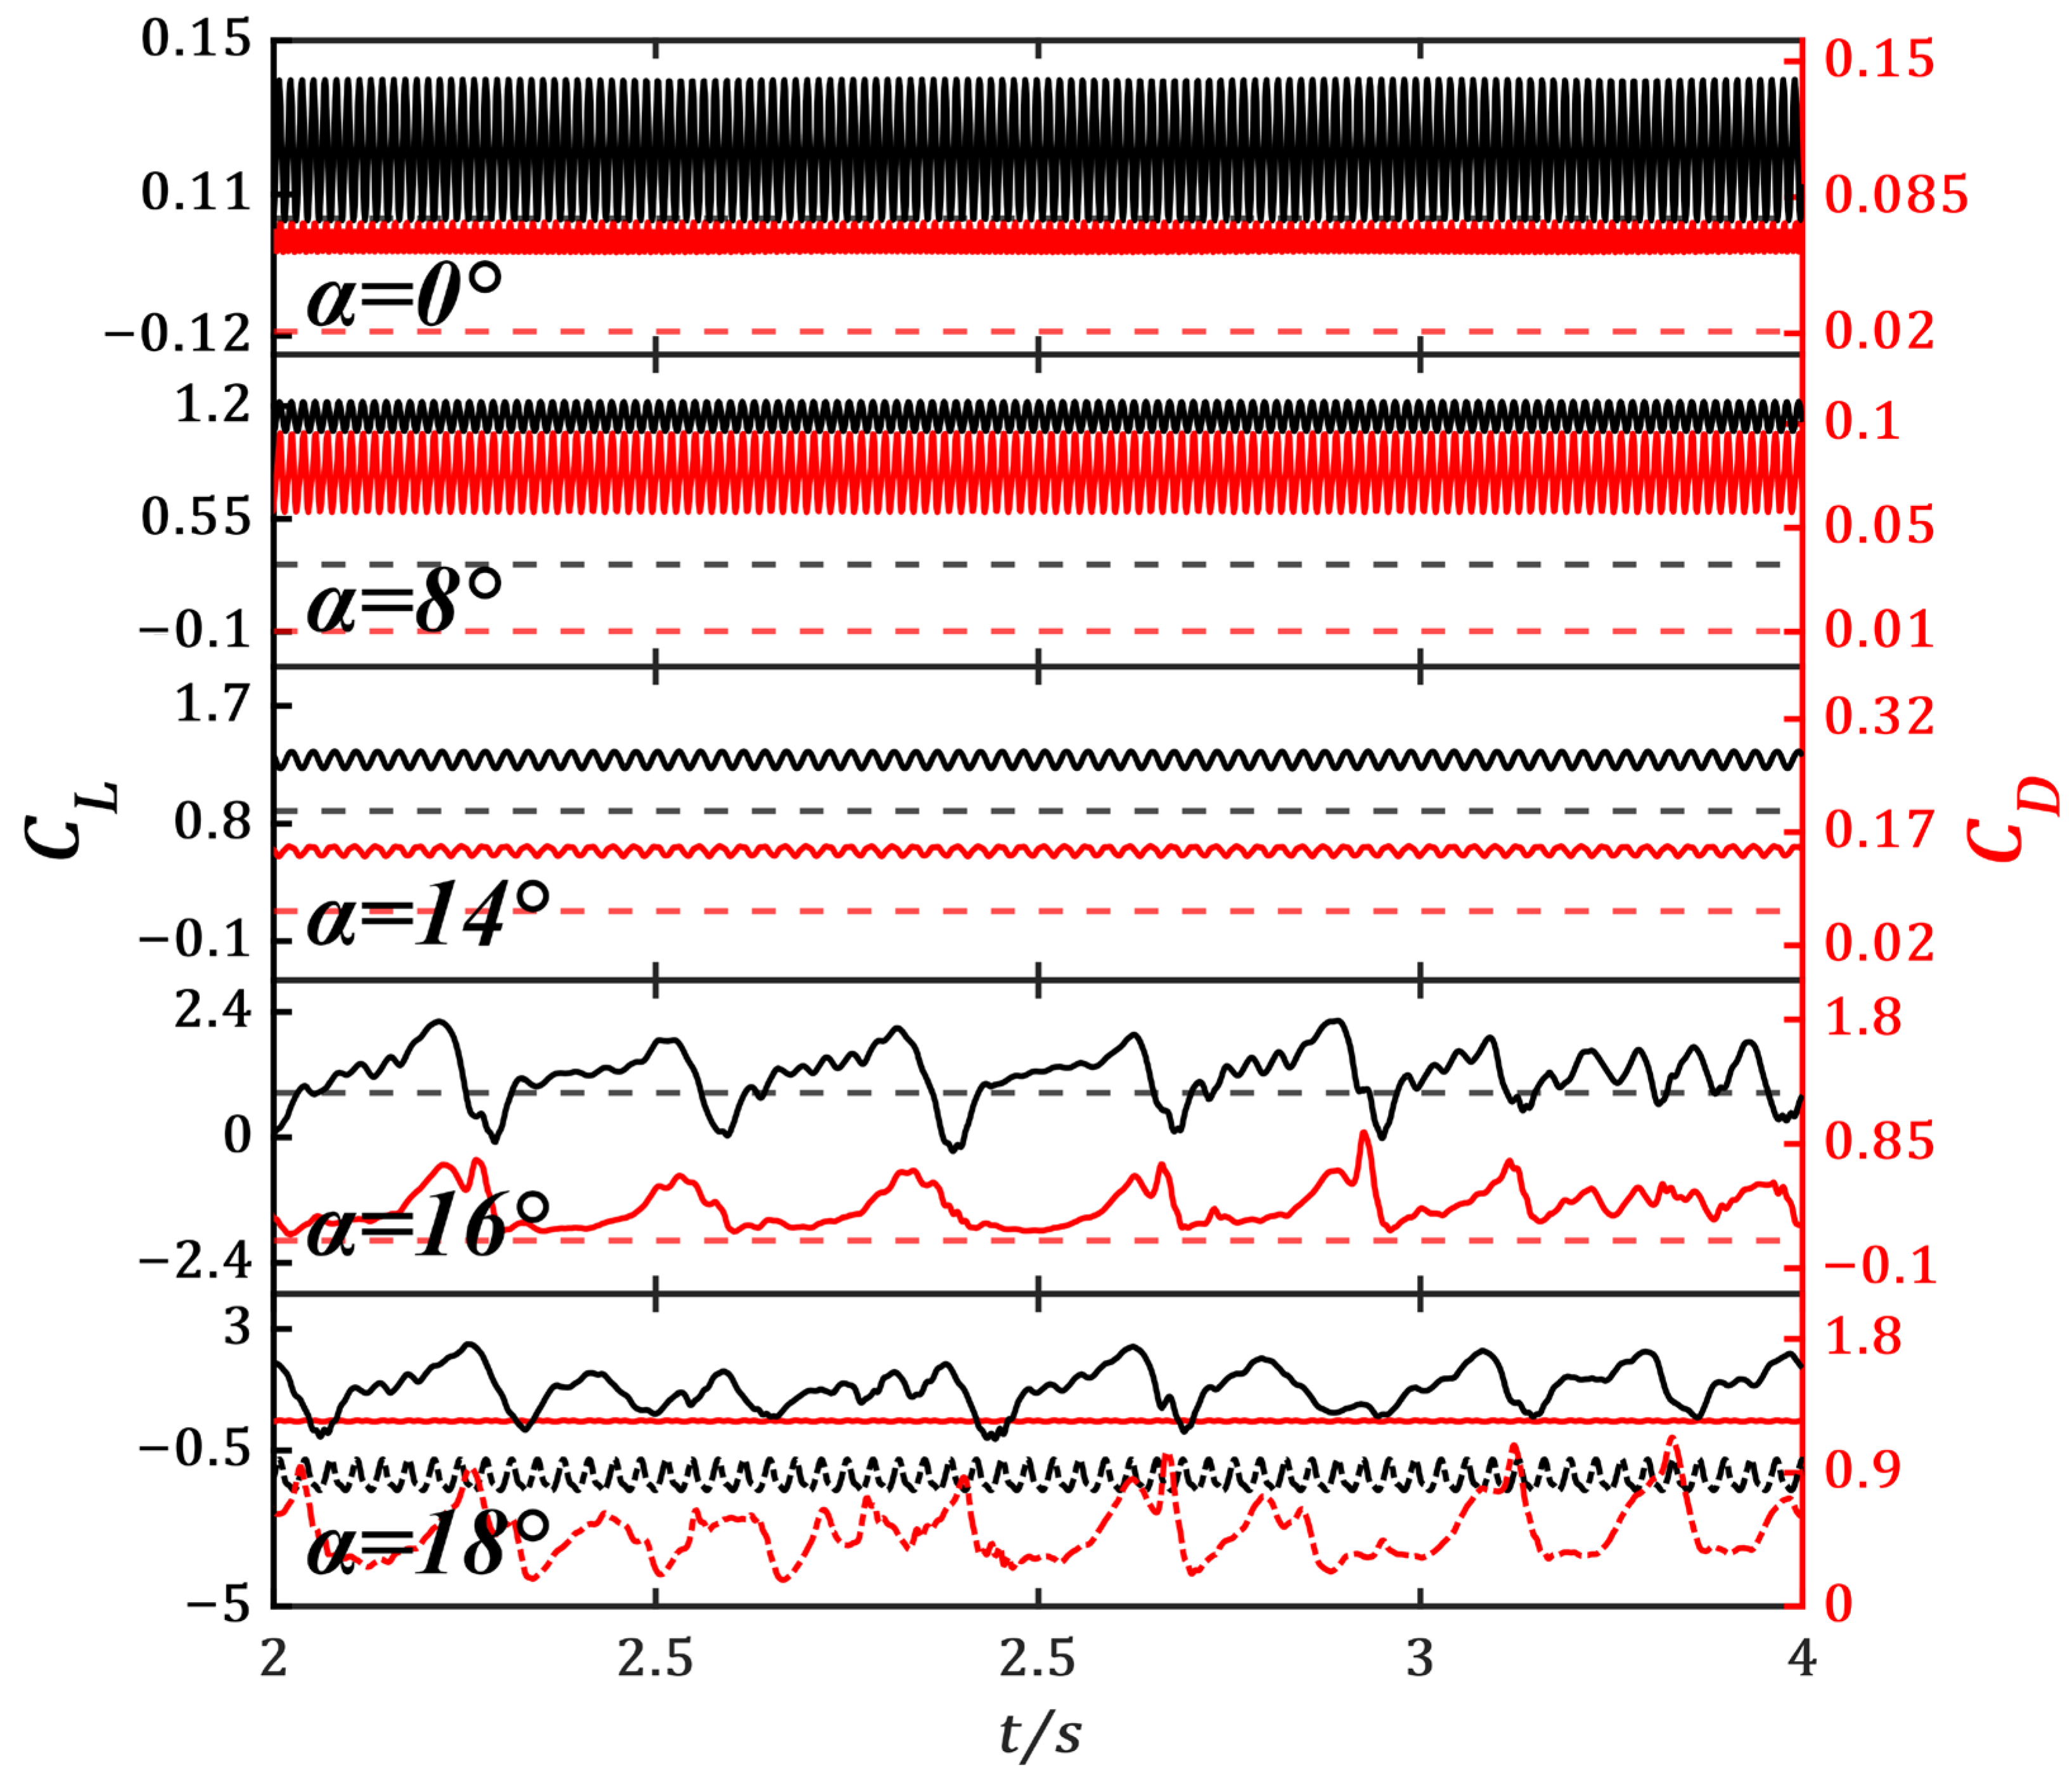
The time series of lift and drag coefficients ( C L and C D ) of the S809 and S809-100 airfoils are analyzed in this section. As shown in Figure 6, for the S809 airfoil, C L and C D curves remain in a steady convergence state at 0 ° , 8 ° , 14 ° ,   a n d   16 ° , converging to constant mean values, while at α = 18 ° , the curves shift to regular, sinusoidal-like oscillations with uniform amplitude and frequency, confirming the transition to a periodic fluctuation state. In contrast, the S809-100 airfoil exhibits distinct behavior: C L and C D curves show sustained periodic oscillations at 0 ° , 8 ° , a n d   14 ° , aligning with the periodic fluctuation state within 0 ° α 14.2 ° . Meanwhile, at α = 16 °   a n d   18 ° , the curves lose periodicity and manifest as a superposition of multiple irregular rise-and-fall waveforms, signifying strong unsteadiness, and the peak-to-peak range of C L at α = 18 ° is nearly 9 times that of the S809 airfoil.
Specifically, for the S809-100 airfoil, the C L and C D time series exhibit sustained periodic fluctuations across 0 ° α 14 ° , with both amplitude and frequency decaying as the angle of attack increases. This concurrent reduction reflects a lengthening of the vortex-shedding period and a weakening of vortex intensity [25,26,27]. Consequently, the spectral characteristics and corresponding flow-field structures are analyzed in the following sections.
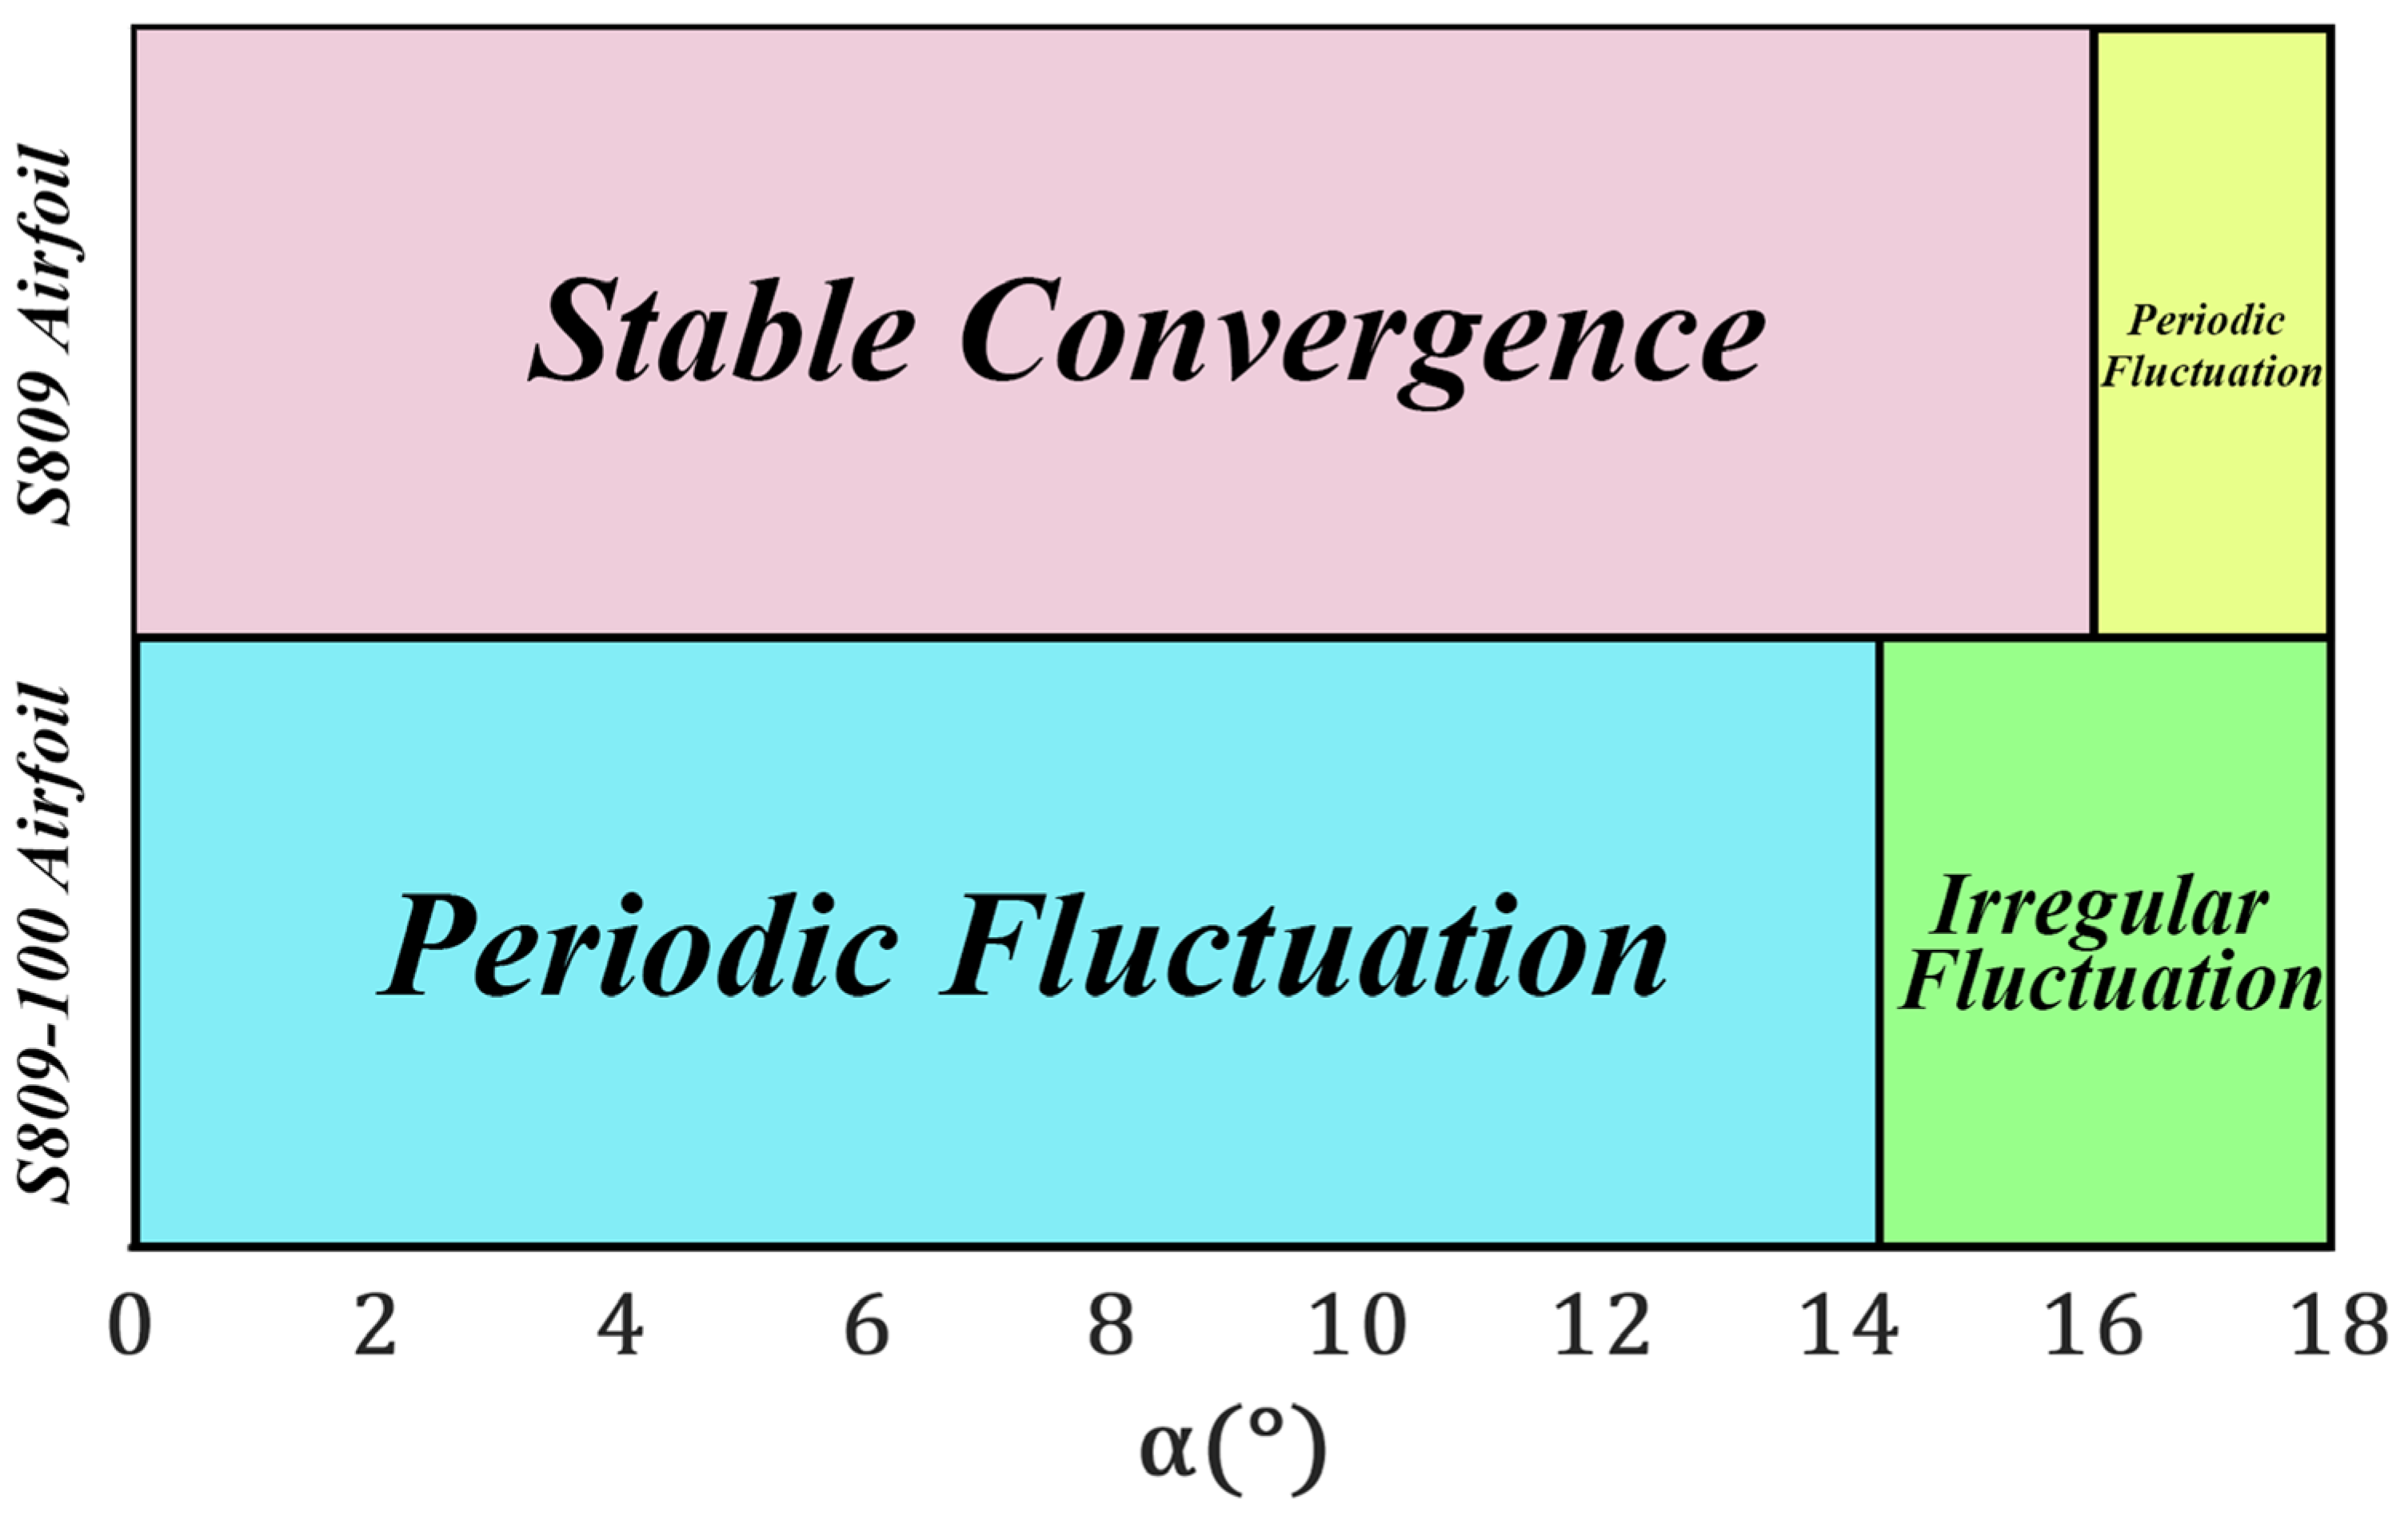
Based on these key properties, three distinct states of aerodynamic response are identified for both airfoils, as shown in Figure 7: steady convergence state, periodic fluctuation state, and irregular fluctuation state. For the S809 airfoil, a steady convergence state is exhibited within the range of 0 ° α 16 ° , and a periodic fluctuation state is exhibited within 16.2 ° α 18 ° . For the S809-100 airfoil, a periodic fluctuation state is exhibited within 0 ° α 14.2 ° , and an irregular fluctuation state is exhibited within 14.3 ° α 18 ° .

3.2. Statistical Values of Lift and Drag Coefficients

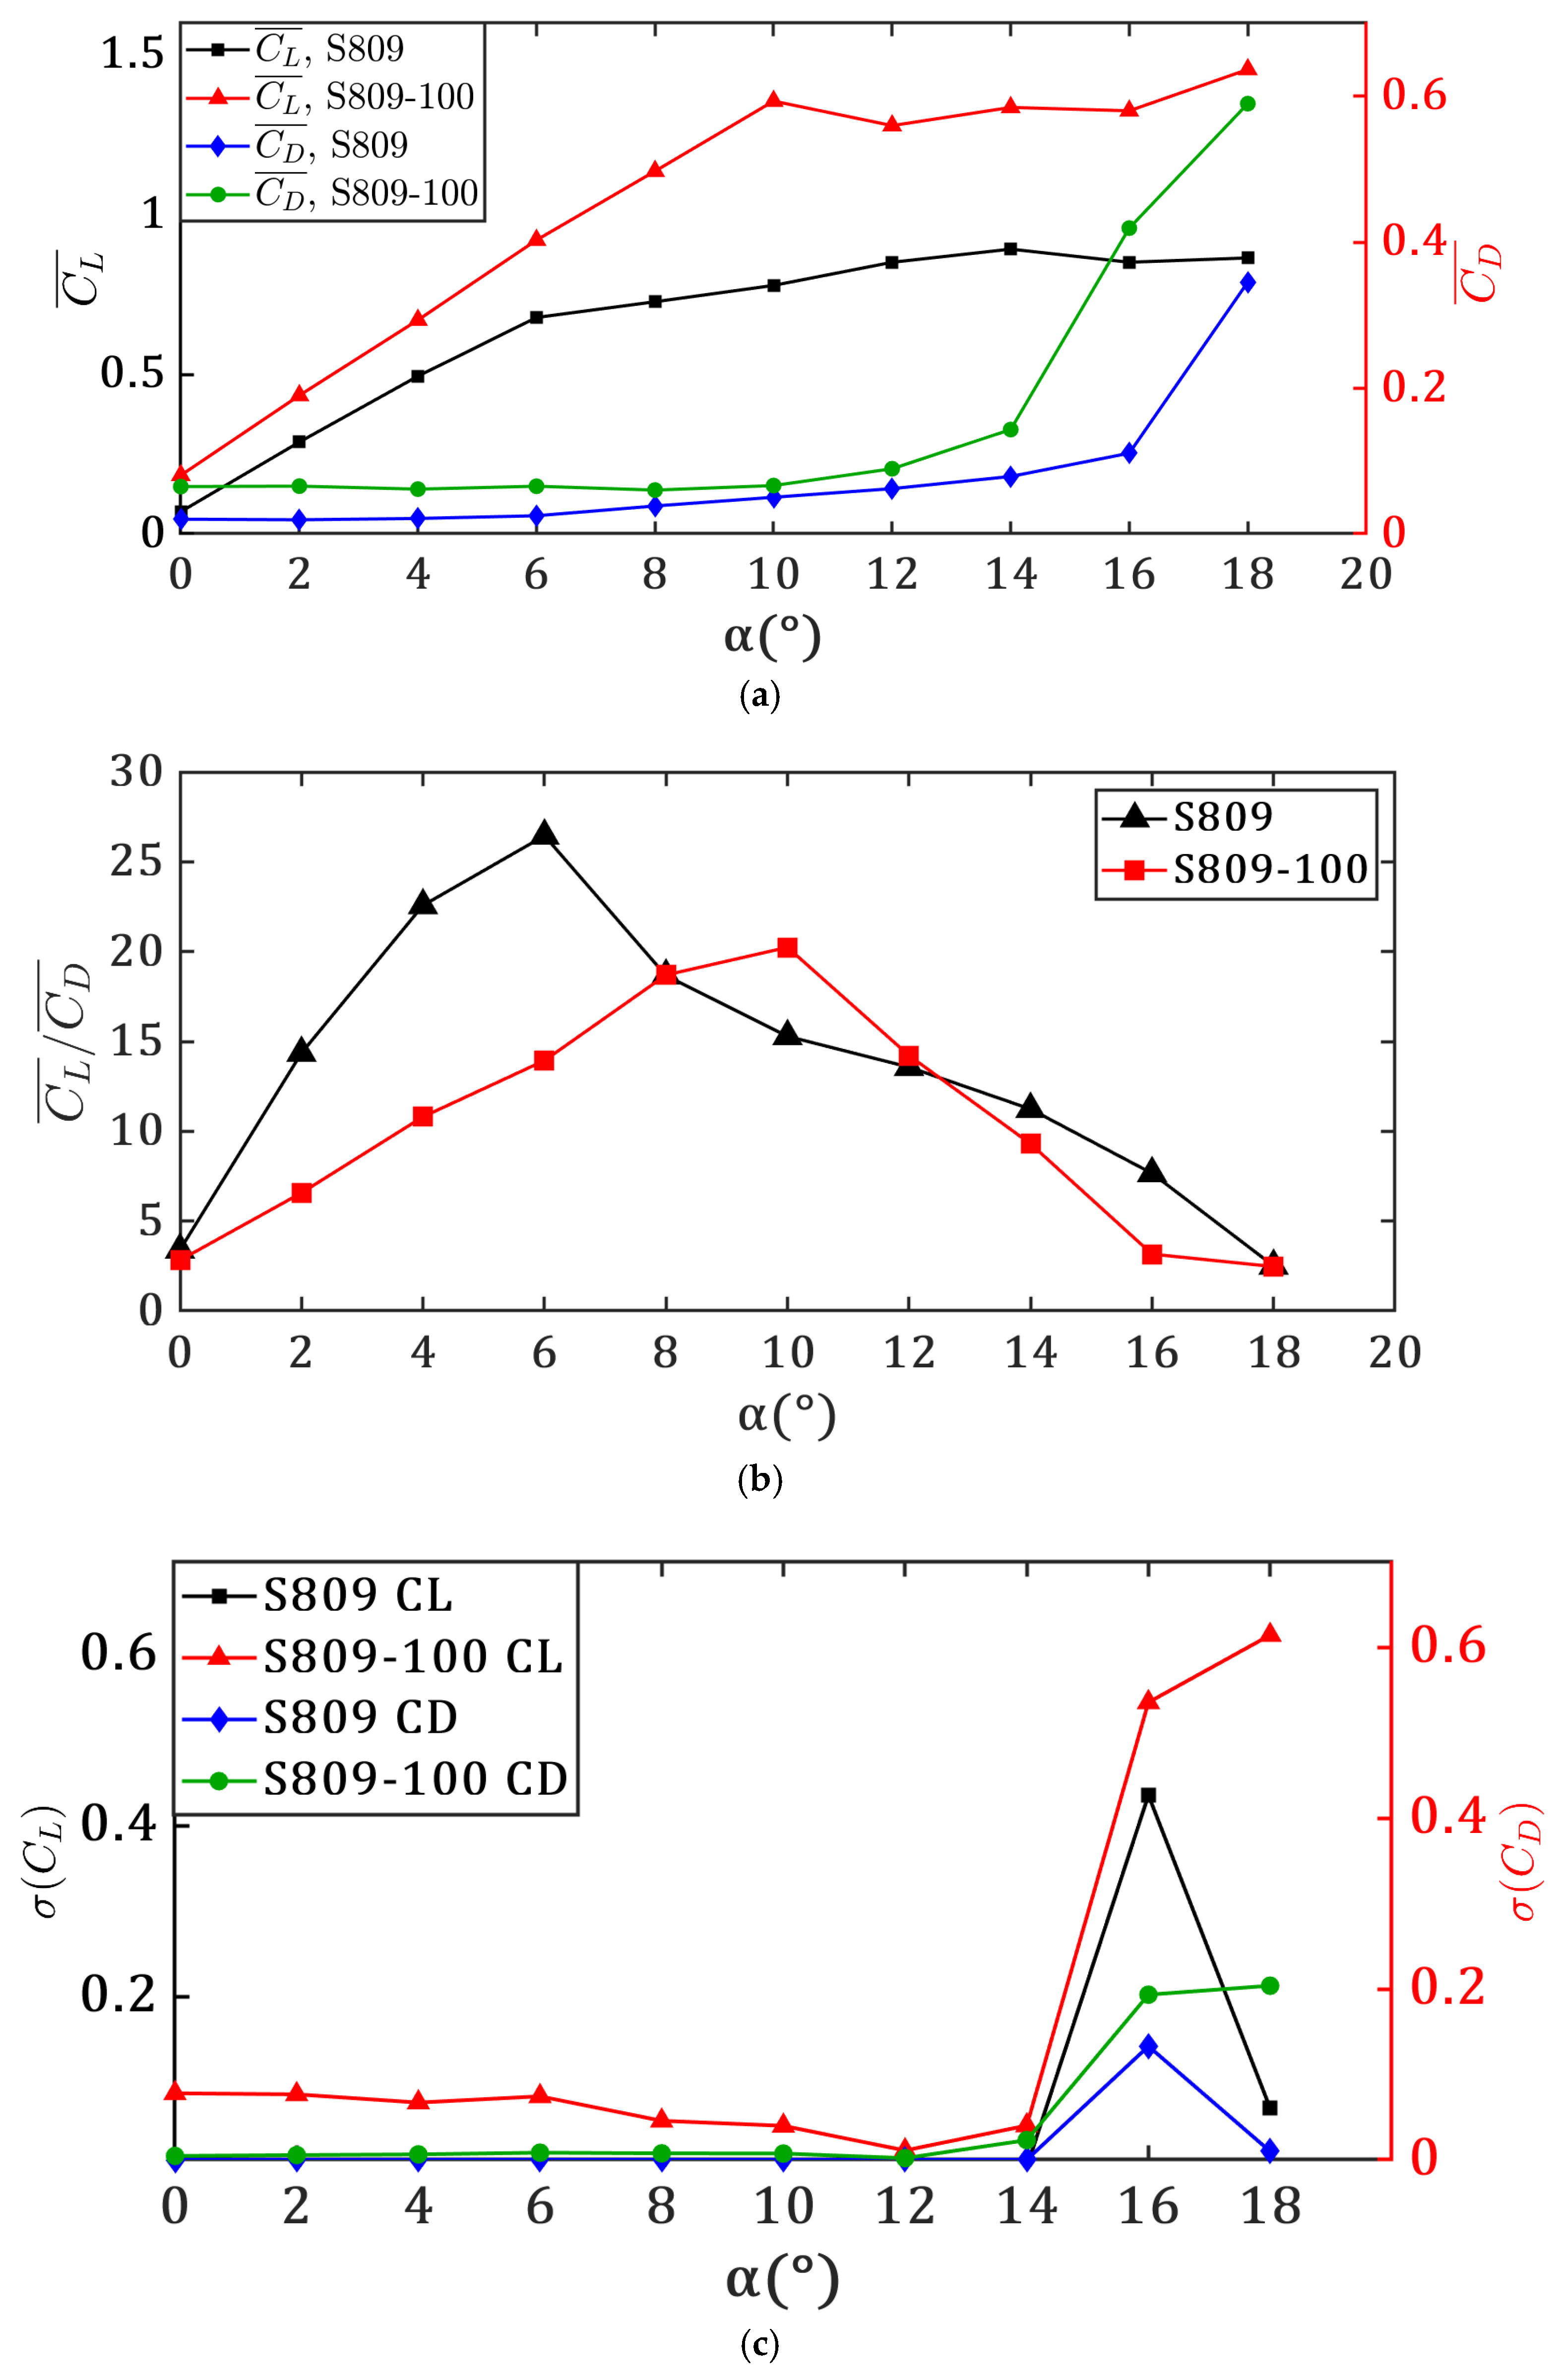
The averaged aerodynamic performances of the S809 and S809-100 airfoils are shown in Figure 8, including the averaged lift and drag coefficients ( C L ¯ and C D ¯ , Figure 8a) and averaged lift-to-drag ratios ( C L ¯ / C D ¯ , Figure 8b).
As observed in Figure 8a, across the simulated α range, the C L ¯ values of the S809 and S809-100 airfoils exhibit similar trends, as do the C D ¯ values. For the S809 airfoil, C L ¯ exhibits a linear increase within 0 α 6 , followed by a more gradual rise until α = 14 ° , where it attains its maximum. Beyond 14 ° , C L ¯ shows little variation with increasing α . In contrast, the C L ¯ of the S809-100 airfoil increases linearly up to α = 10 ° . At this angle, the C L ¯ of the modified airfoil reaches a value 1.74 times that of the baseline S809—the maximum ratio observed. At α > 10 ° , the C L ¯ of S809-100 also plateaus. Notably, across the range 8 ° α 18 ° , the C L ¯ of the S809-100 airfoil remains significantly higher than that of the S809 airfoil.
Regarding C D ¯ , both airfoils show a similar trend: a gradual increase followed by a sharp rise. The primary difference is that the sharp rise occurs earlier for the S809-100 airfoil. When 0 ° α 14 ° , the C D ¯ values of the two airfoils are very close. The C D ¯ of the S809 airfoil rises sharply at α = 16 ° , whereas this transition happens at α = 14 ° for the S809-100 airfoil. At α = 16 ° , the C D ¯ of S809-100 reaches a maximum that is 3.77 times that of S809.
For the S809 airfoil, as observed in Figure 8b, C L ¯ / C D ¯ appears to exhibit a nearly linear increase for 0 ° α 6 ° , whereas that of the S809-100 airfoil shows an approximately linear growth trend across the wider range 0 ° α 10 ° , but at a notably slower rate. Although the S809-100 airfoil yields a lower lift-to-drag ratio than S809 at 0 ° α 8 ° and 12 ° α 18 ° , the ratio drops to only 41% of the baseline value at α = 16 ° . It nonetheless demonstrates superior performance within the typical operating range of wind turbines ( 8 ° α 12 ° ). At α = 10 ° , its C L ¯ / C D ¯ attains 132.4% of that of the S809 airfoil.
Figure 8c presents the standard deviations of the lift and drag coefficients, σ ( C L ) and σ ( C D ) , for S809 and S809-100 airfoils as functions of α , reflecting the unsteadiness of the aerodynamics.
For 0 ° α 12 ° , both σ ( C L ) and σ ( C D ) remain at low levels ( σ < 0.1 ), corresponding to a steady convergence state. When 12 ° α 16 ° , the standard deviation of lift σ ( C L ) and the standard deviation of drag σ ( C D ) increase gradually and then rise sharply from α = 14 ° onward, indicating a marked increase in flow unsteadiness. Within 16 ° α 18 ° , the two airfoils exhibit distinctly different dynamic responses. For the S809 airfoil, the aerodynamic fluctuations decay rapidly, with σ ( C L ) dropping to 0.069 and σ ( C D ) to 0.010. In contrast, the S809-100 airfoil undergoes sustained and intensifying stall oscillations, reaching peak values of σ ( C L ) = 0.623 and σ ( C D ) = 0.204 .
These results demonstrate that although the BTE design introduces more severe aerodynamic fluctuations under deep-stall conditions, its inherent advantage in structural load-carrying capacity offers a potential trade-off for engineering applications at extreme angles of attack.

3.3. Frequency Spectrum of Lift Coefficient

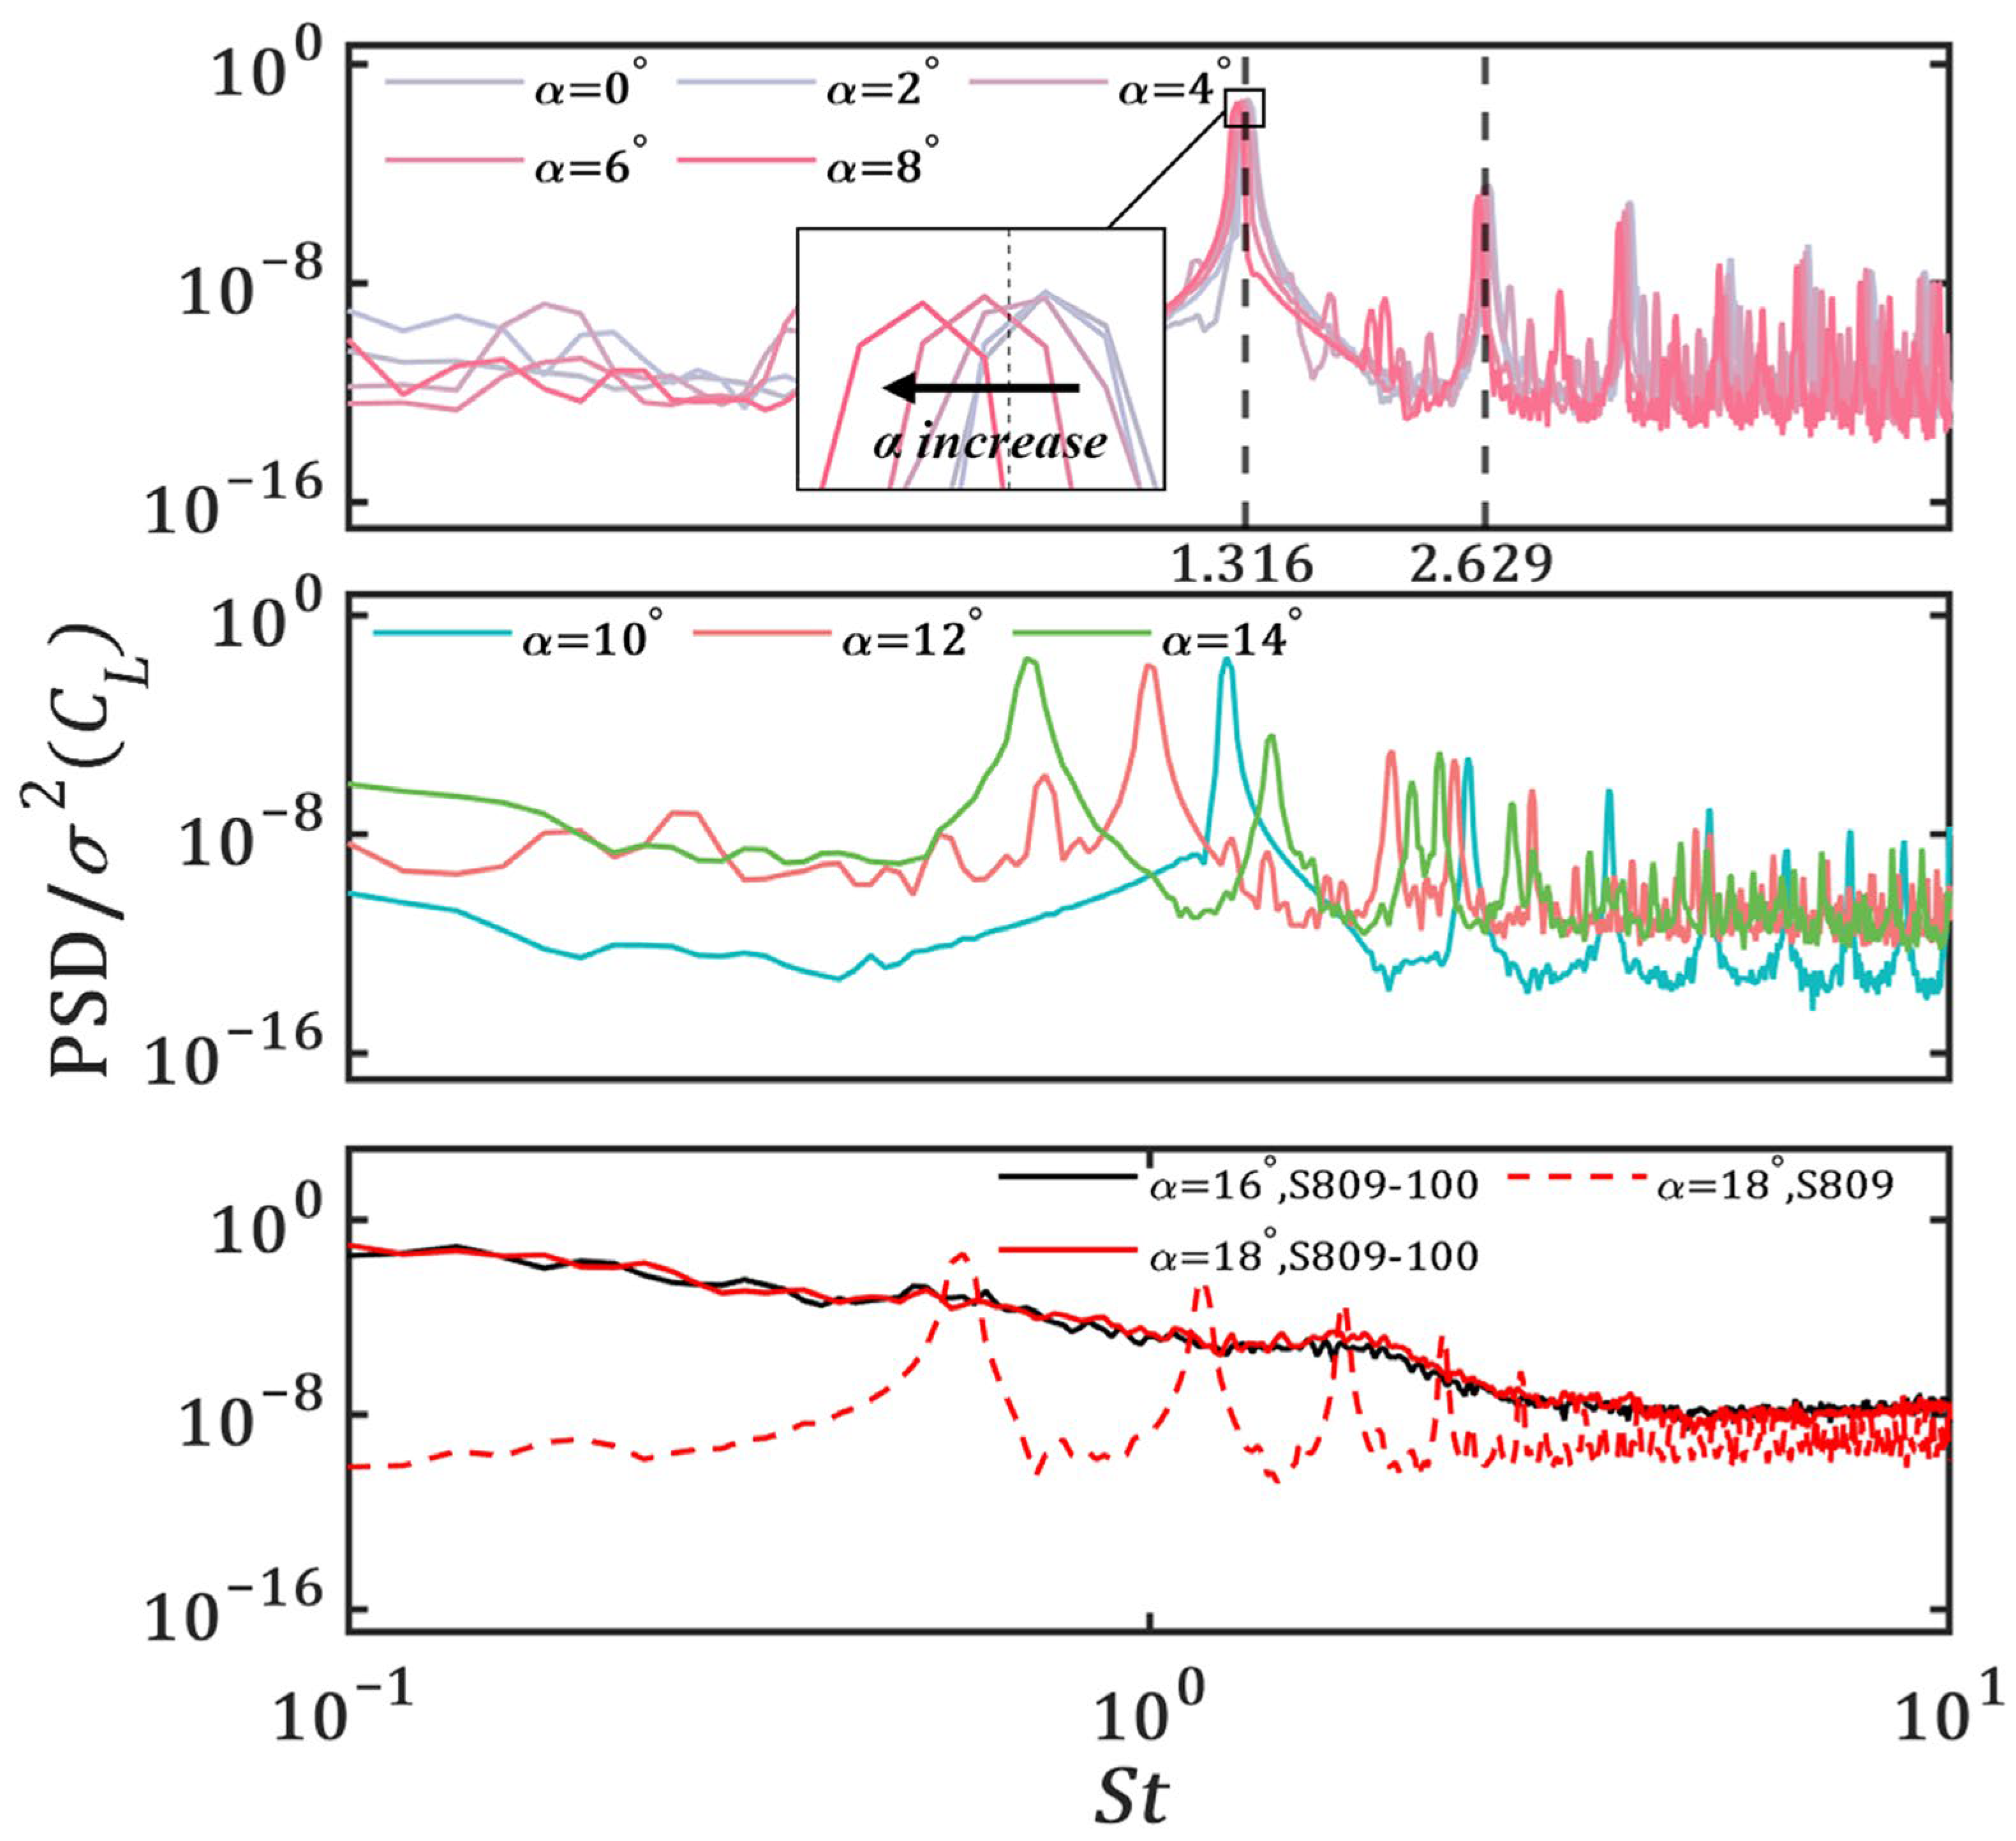
Based on the analysis of the lift and drag coefficient time series for S809 and S809-100 airfoils at various α , representative flow conditions were selected for power spectral density (PSD) analysis of the lift coefficient C L using Welch’s method. The S809-100 airfoil was analyzed in both its periodic fluctuation regime ( 0 ° α 14 ° ) and its irregular fluctuation regime ( α = 16 ° and 18 ° ), while the S809 airfoil was analyzed in its steady convergence regime ( 0 ° α 16 ° ) and its periodic fluctuation state at α = 18 ° . The frequency f was dimensionless according to the chord length C and the freestream velocity U , allowing us to obtain the Strouhal number S t , which characterizes the dominant frequency of unsteady aerodynamic fluctuations:
S t = f · C U
The PSD results are presented in Figure 9, which is divided into three subplots corresponding to distinct states of aerodynamic response: the top subplot spans 0 ° α 8 ° , the middle subplot covers 10 ° α 14 ° , and the bottom subplot compares α = 16 ° (S809-100 airfoil) for both airfoils. For 0 ° α 8 ° , the normalized PSD curves P S D / σ 2 ( C L ) of the S809-100 airfoil consistently exhibit a well-defined and multi-peak structure: the primary peak corresponds to S t 1 1.316 , and the second harmonic corresponds to S t 2 2.629 . The power of higher harmonics is at least two orders of magnitude lower than that of the primary peak, indicating that the C L fluctuation is dominated by the fundamental frequency with only weak high-frequency disturbances.
Notably, as α increases, (evident in the top to middle subplots), the S t of the primary peak gradually decreases (see Figure 9’s top subplot). For 10 ° α 14 ° (middle subplot), S t 1 shifts toward lower values, the primary PSD peak broadens, and the relative energy of high-frequency harmonics increases. This trend, which is most pronounced within 10 ° α 14 ° , reflects both a prolongation of the vortex generation–shedding cycle and a gradual rise in flow nonlinearity.
In the irregular fluctuation regime (bottom subplot), the S809 100 airfoil at α = 16 ° exhibits a fragmented, broadband PSD spectrum lacking distinct peaks, consistent with unstructured aerodynamic fluctuations. In contrast, the S809 airfoil at α = 18 ° retains a relatively sharp primary peak—despite a lower PSD magnitude—in alignment with its periodic fluctuation state. These spectral distinctions reveal differing unsteady mechanisms between the two airfoils: the blunt trailing edge of S809-100 amplifies boundary-layer separation at moderate-to-high α , promoting a transition toward irregular flow, whereas the standard trailing edge of S809 sustains more organized vortex shedding even at α = 18 ° .
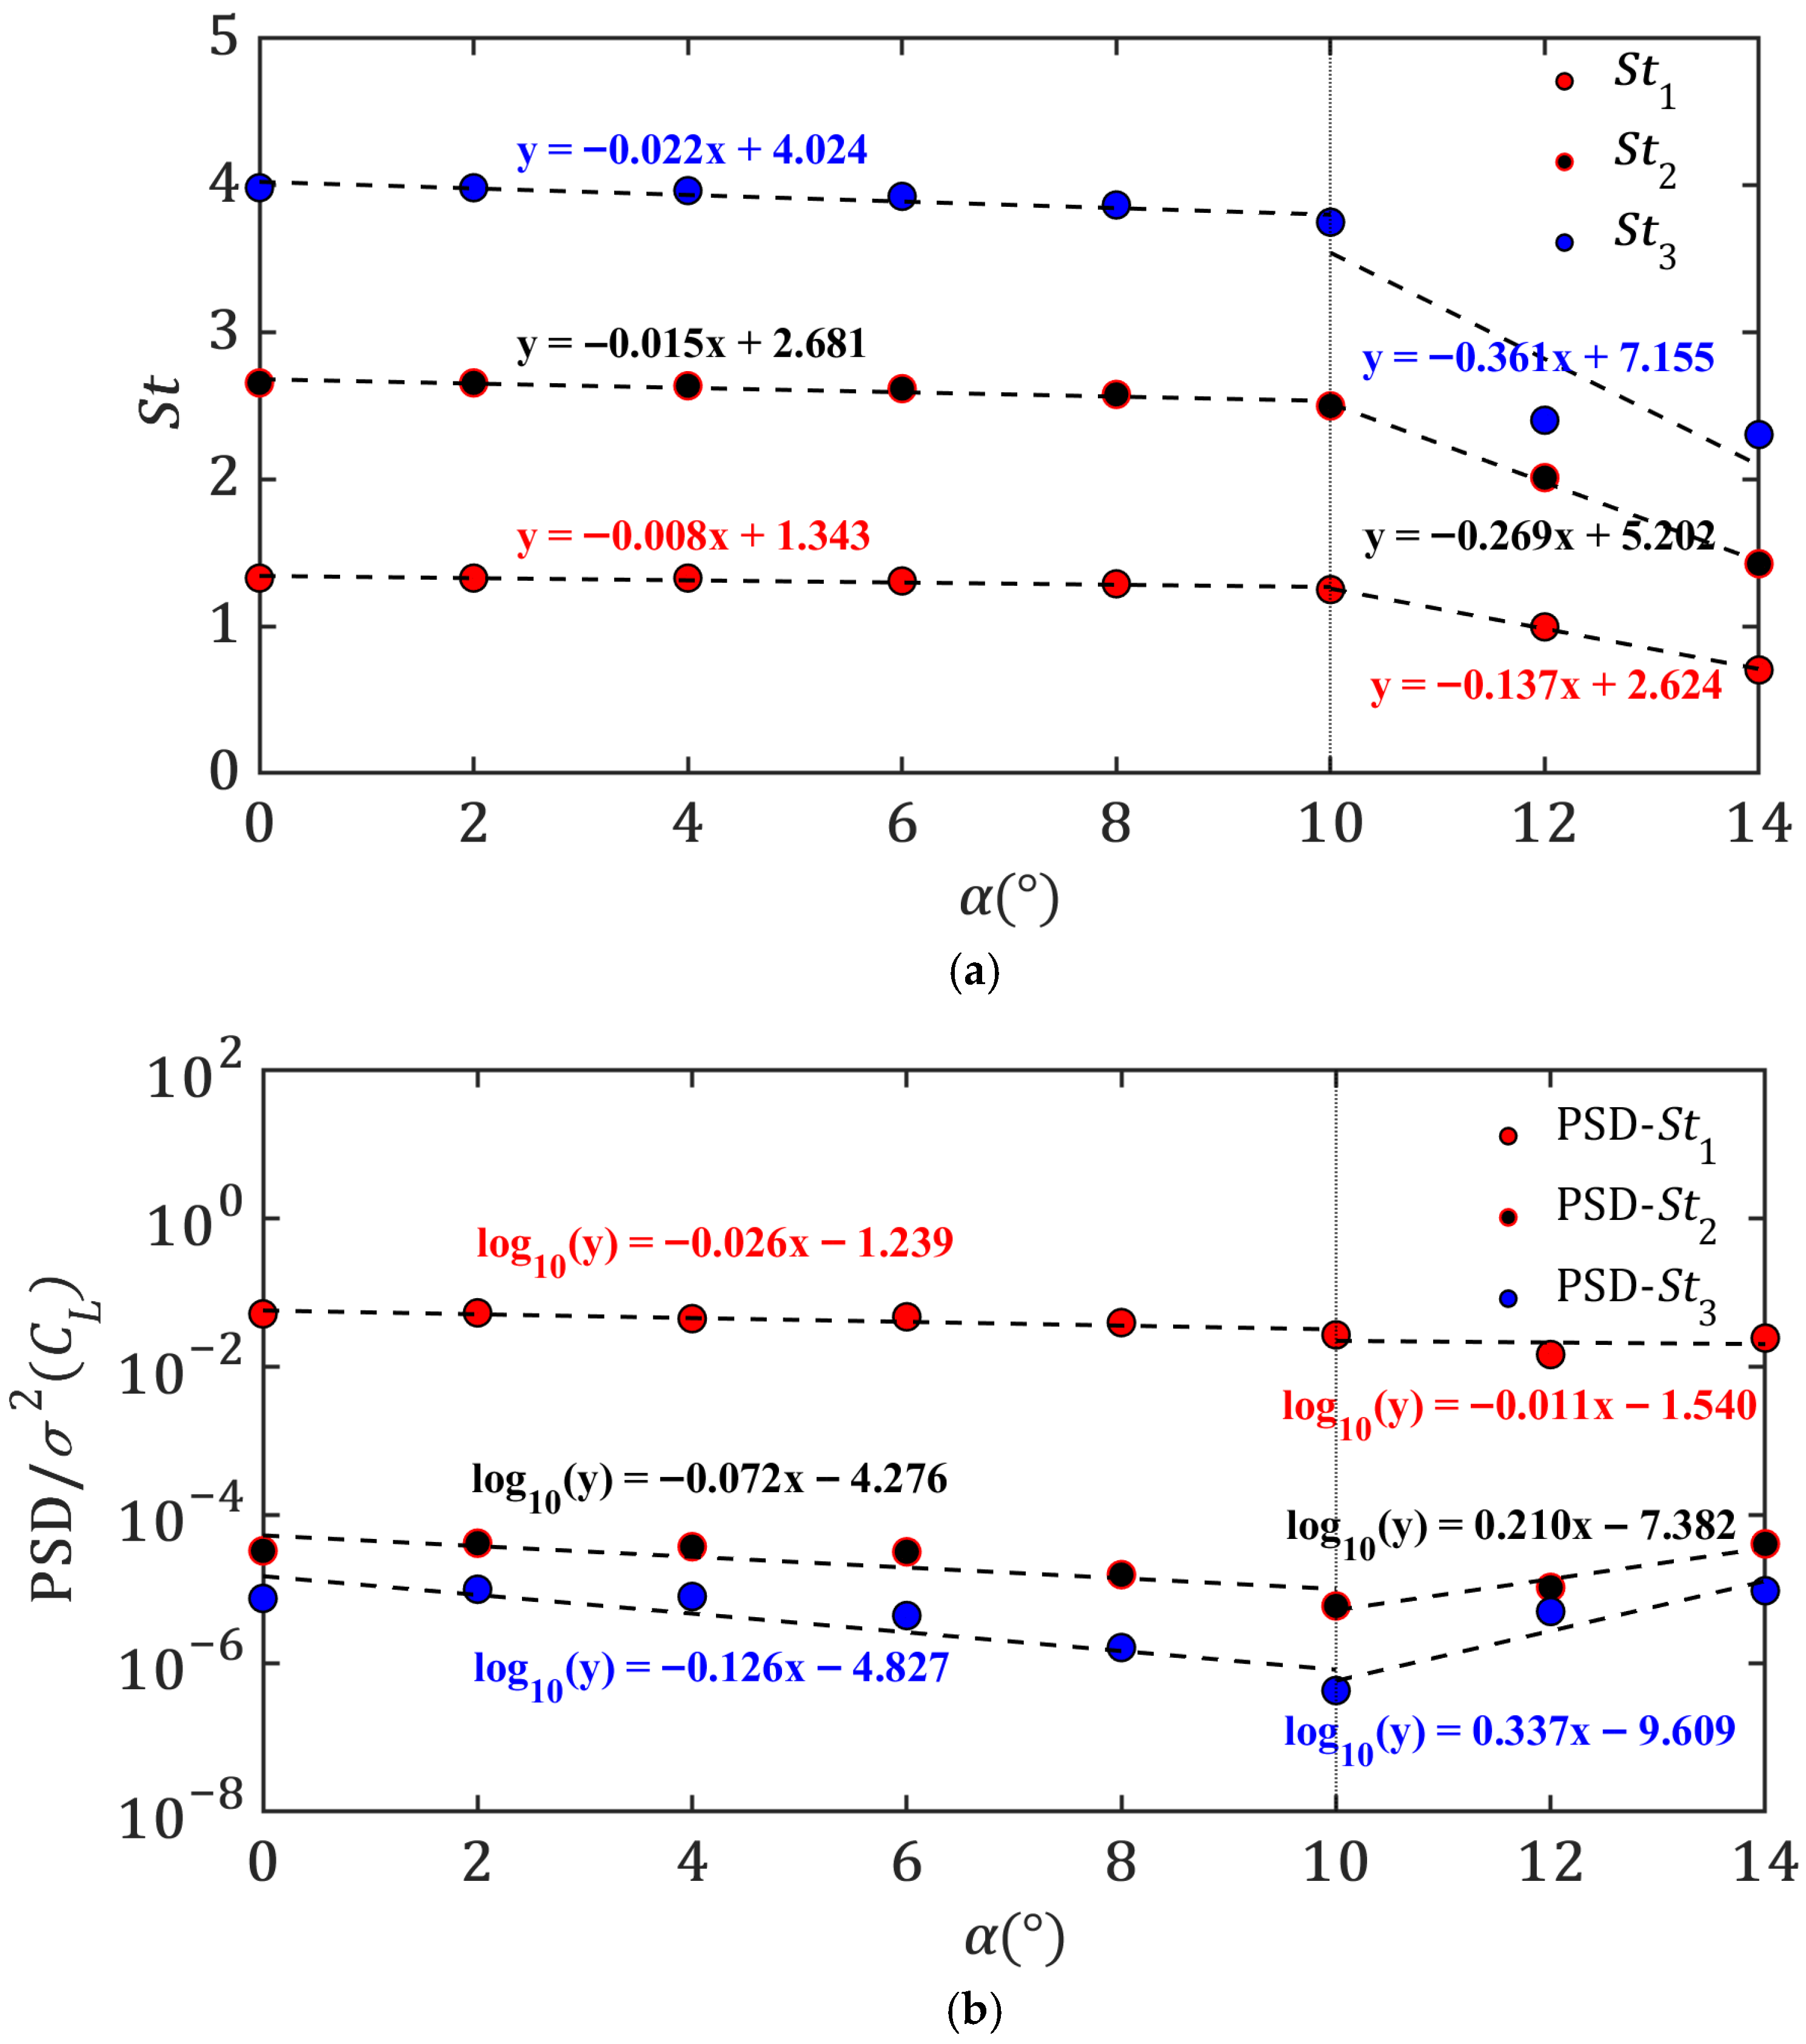
The spectral characteristics of the S809-100 airfoil across its periodic fluctuation regime ( 0 ° α 14 ° ) are presented in Figure 10a,b, based on the preceding Welch’s method PSD analysis of C L fluctuations. These figures quantify both the dominant fluctuation frequencies and their corresponding energy distributions.
Figure 10a shows the variation in the Strouhal number ( S t = f C / U , Equation (4)) with α . For 0 ° α 8 ° , the values of S t 1 (fundamental frequency) and S t 2 (second harmonic) remain relatively stable, as indicated by the shallow slopes of their linear fits (e.g., −0.022 for S t 1 ). This stability implies that the vortex-shedding cycle driving the C L fluctuations is largely insensitive to α in this range—consistent with the regular periodic behavior observed in the C L time series. For 10 ° α 14 ° , the fitting slopes steepen markedly (e.g., −0.36 for S t 1 ), resulting in a pronounced decrease in the dominant S t ( S t 1 ). This decrease reflects a prolonged vortex generation–shedding cycle, caused by enhanced boundary-layer separation at higher α , which lowers the dominant frequency of the unsteady fluctuations.
Complementing the frequency characterization, Figure 10b displays the normalized power spectral density ( P S D / σ 2 ( C L ) ) of the C L fluctuations as a function of α . Within 0 ° α 8 ° , the PSD peaks sharply at S t 1 (∼10−2), whereas higher-order harmonics (e.g., S t 2 , S t 3 ) are suppressed by at least two orders of magnitude (∼10−4 for S t 2 ). This confirms that the C L fluctuations are dominated by a single periodic mode with only weak high-frequency perturbations—a signature of low flow nonlinearity. For 10 ° α 14 ° , the peak PSD at S t 1 decreases, while the linear fit slope for the S t 2 -associated PSD changes from negative to positive (+0.210). This shift signals a growing relative energy contribution from high-frequency harmonics and a gradual increase in flow nonlinearity as α approaches the irregular fluctuation regime.
Together, the two figures provide a complementary interpretation of the airfoil’s unsteady behavior: Figure 10a defines the frequency content of the C L fluctuations through S t , and Figure 10b quantifies the energy distribution across these frequencies through PSD. They delineate a clear transition within the periodic regime. At low α , the flow is regularly periodic (stable S t and concentrated PSD at the fundamental mode). At moderate α , a transitional state emerges, characterized by decreasing S t and a more dispersed PSD with rising harmonic energy, indicating escalating flow complexity.

3.4. Flow Fields

3.4.1. Steady Convergence State for S809 Airfoil

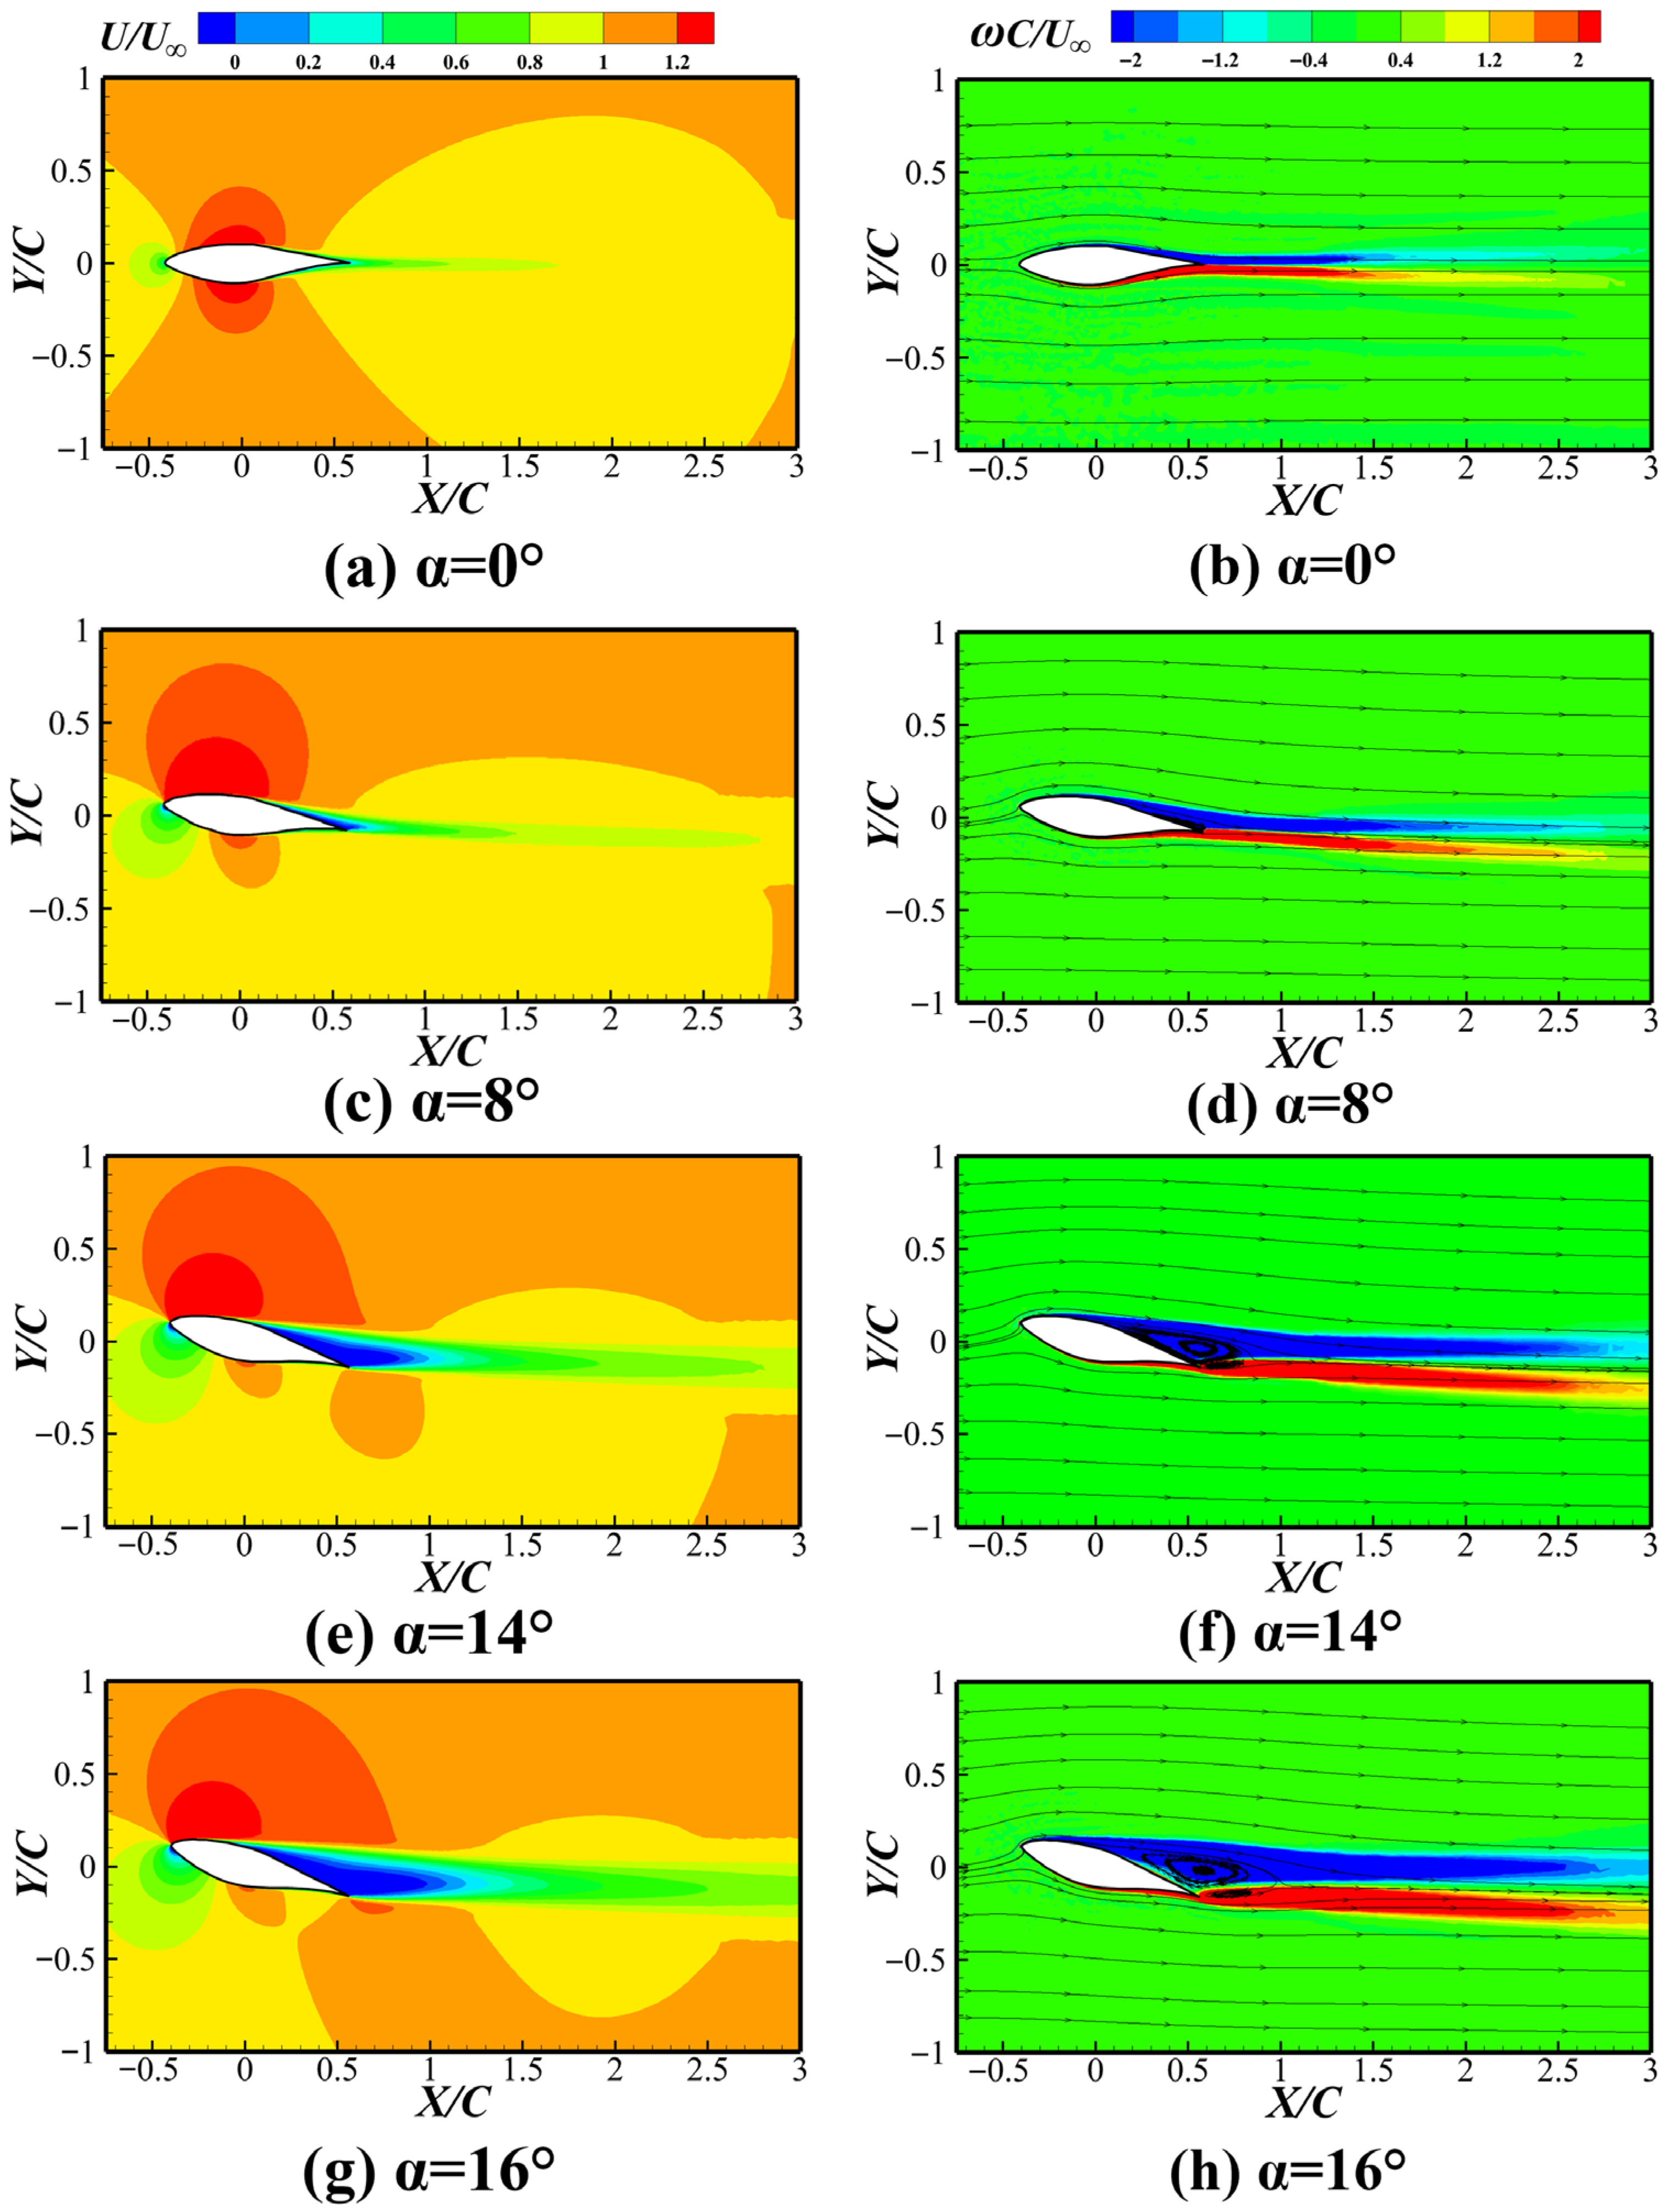
To explore the flow structures corresponding to the lift and drag coefficients in the steady convergence, periodic fluctuation, and irregular fluctuation states, the spatial distributions of the flow fields around the S809 and S809-100 airfoils are analyzed in this section. Figure 11 presents the time-averaged velocity and vorticity fields for the S809 airfoil under steady convergence conditions ( α   =   0 ° ,   8 ° ,   14 ° , and 16 ° ), where the left column shows the velocity magnitude field ( U / U ) and the right column shows the vorticity field ( ω C / U ) with the streamlines.
For 0 ° α 16 ° , the lift and drag coefficient time series of the S809 airfoil converge to their mean values (Figure 7). Correspondingly, the surrounding flow evolves into a time-independent steady state. In this steady convergence regime, the core flow structure comprises a pair of wall-bounded vorticity layers with opposite rotational directions: a clockwise (blue) layer originating from the suction side ( Y / C > 0 ) and a counterclockwise (red) layer from the pressure side ( Y / C < 0 ). These two layers extend downstream in the velocity-deficit wake, sustained by fluid shear.
For 0 ° α 8 ° , the flow remains fully attached to both surfaces, with streamlines closely following the airfoil contour without significant separation or deflection—indicating a fully attached boundary layer. This flow pattern leads to the previously observed linear behavior of the lift coefficient with the angle of attack. This is also evidenced by the time-averaged velocity contours, in which no distinct low-speed recirculation pocket is observed on either side of the airfoil and the wake deficit remains relatively mild and smoothly distributed downstream. The vorticity intensity on both surfaces is uniformly distributed and relatively low, while the paired vorticity layers maintain coherence, extending continuously up to approximately 1.4 C downstream. This further confirms the well-developed and highly stable nature of the flow within this angle range.
When 14 ° α 16 ° , the flow exhibits the characteristic coexistence of attached flow and local separation. A stable clockwise separation vortex forms near the trailing edge on the suction side, while a smaller, flatter counterclockwise separation vortex emerges on the pressure side. As α increases, the vortex core expands substantially and the separation point migrates upstream, which directly results in a rapid decrease in the growth rate of C L ¯ with α . Consistent with the vorticity-based observation, the time-averaged velocity contours show an increasingly pronounced low-speed region adjacent to the suction side, while the downstream velocity-deficit region becomes stronger and broader compared with lower angles of attack. Notably, although distinct separation vortices are present on both surfaces, they remain highly stable in both spatial and temporal domains, without periodic shedding. This flow characteristic aligns perfectly with the steady convergence state of the force coefficients, collectively indicating that the flow is in a critically stable condition prior to static stall.

3.4.2. Periodic Fluctuation State for S809-100 Airfoil

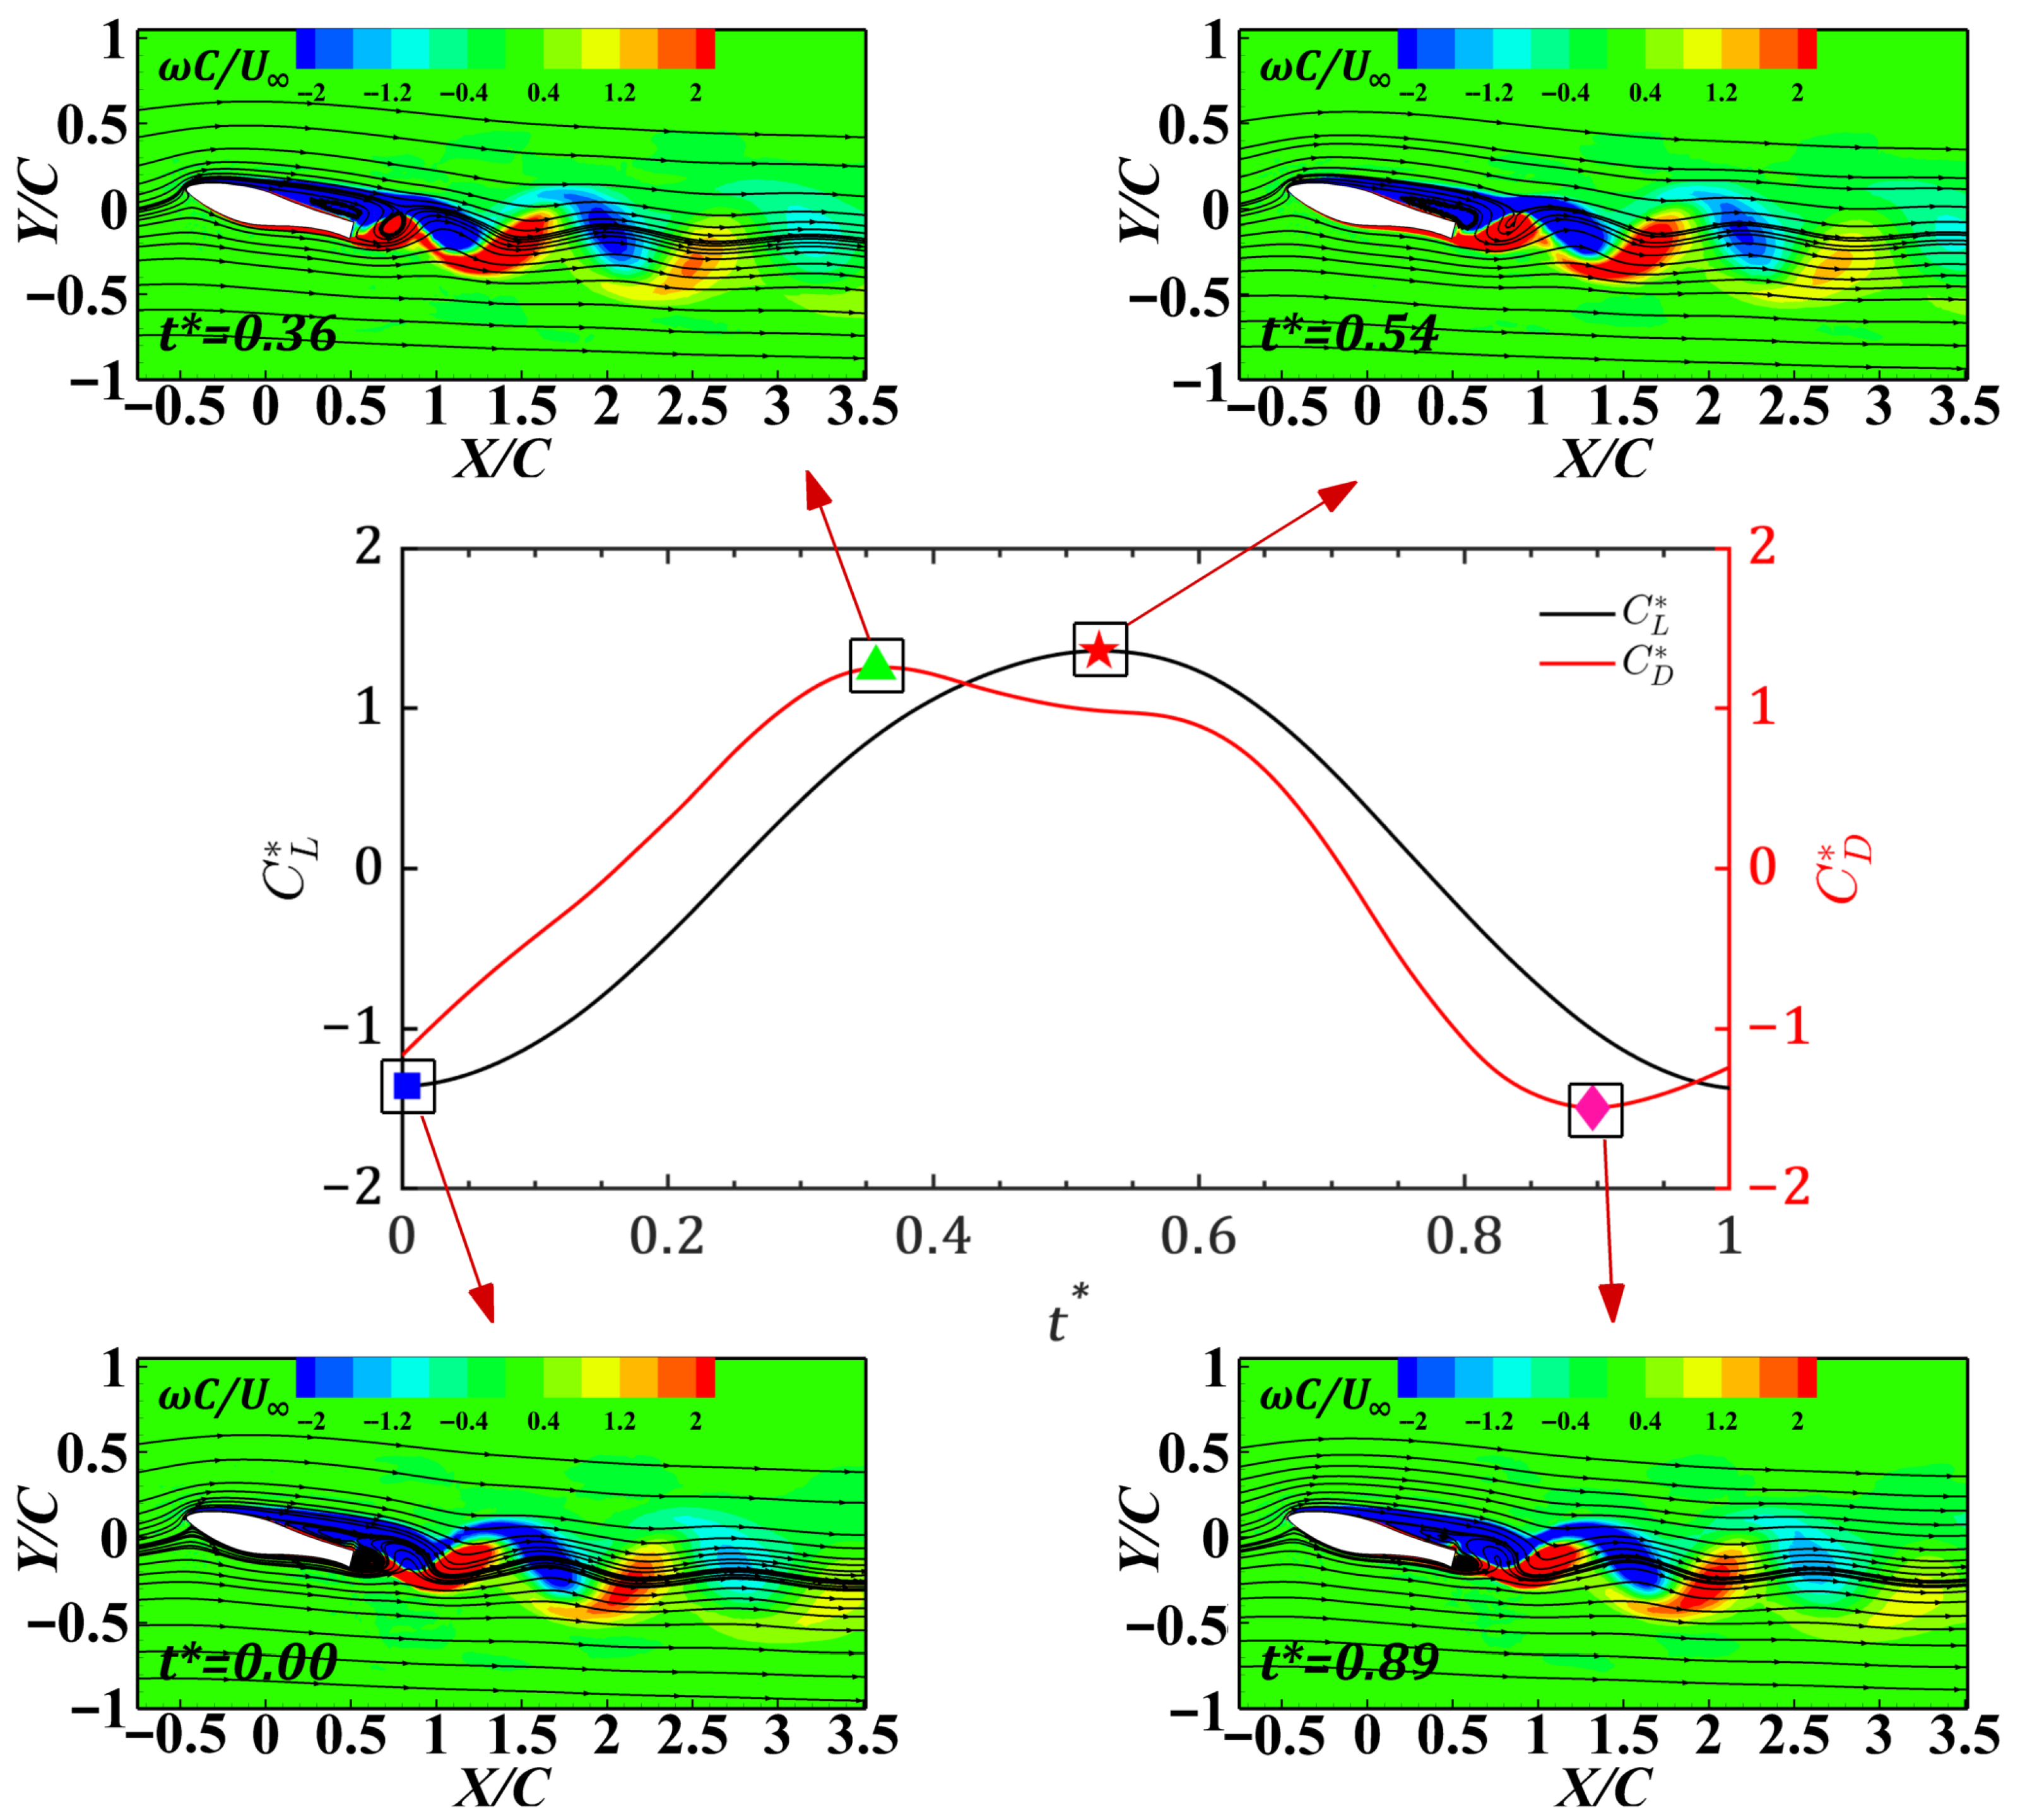
Based on the analysis in Section 2.1, the lift and drag coefficients of the S809-100 airfoil exhibit sustained periodic fluctuations for α = 0 ° and 14 ° (representative extreme values within the periodic fluctuation regime) after a statistically steady state is achieved. This section presents an analysis focusing on the dominant fluctuation period T —identified from the power spectral density (PSD) of the lift coefficient—and investigates the instantaneous flow fields corresponding to characteristic phase points within a single fluctuation cycle.
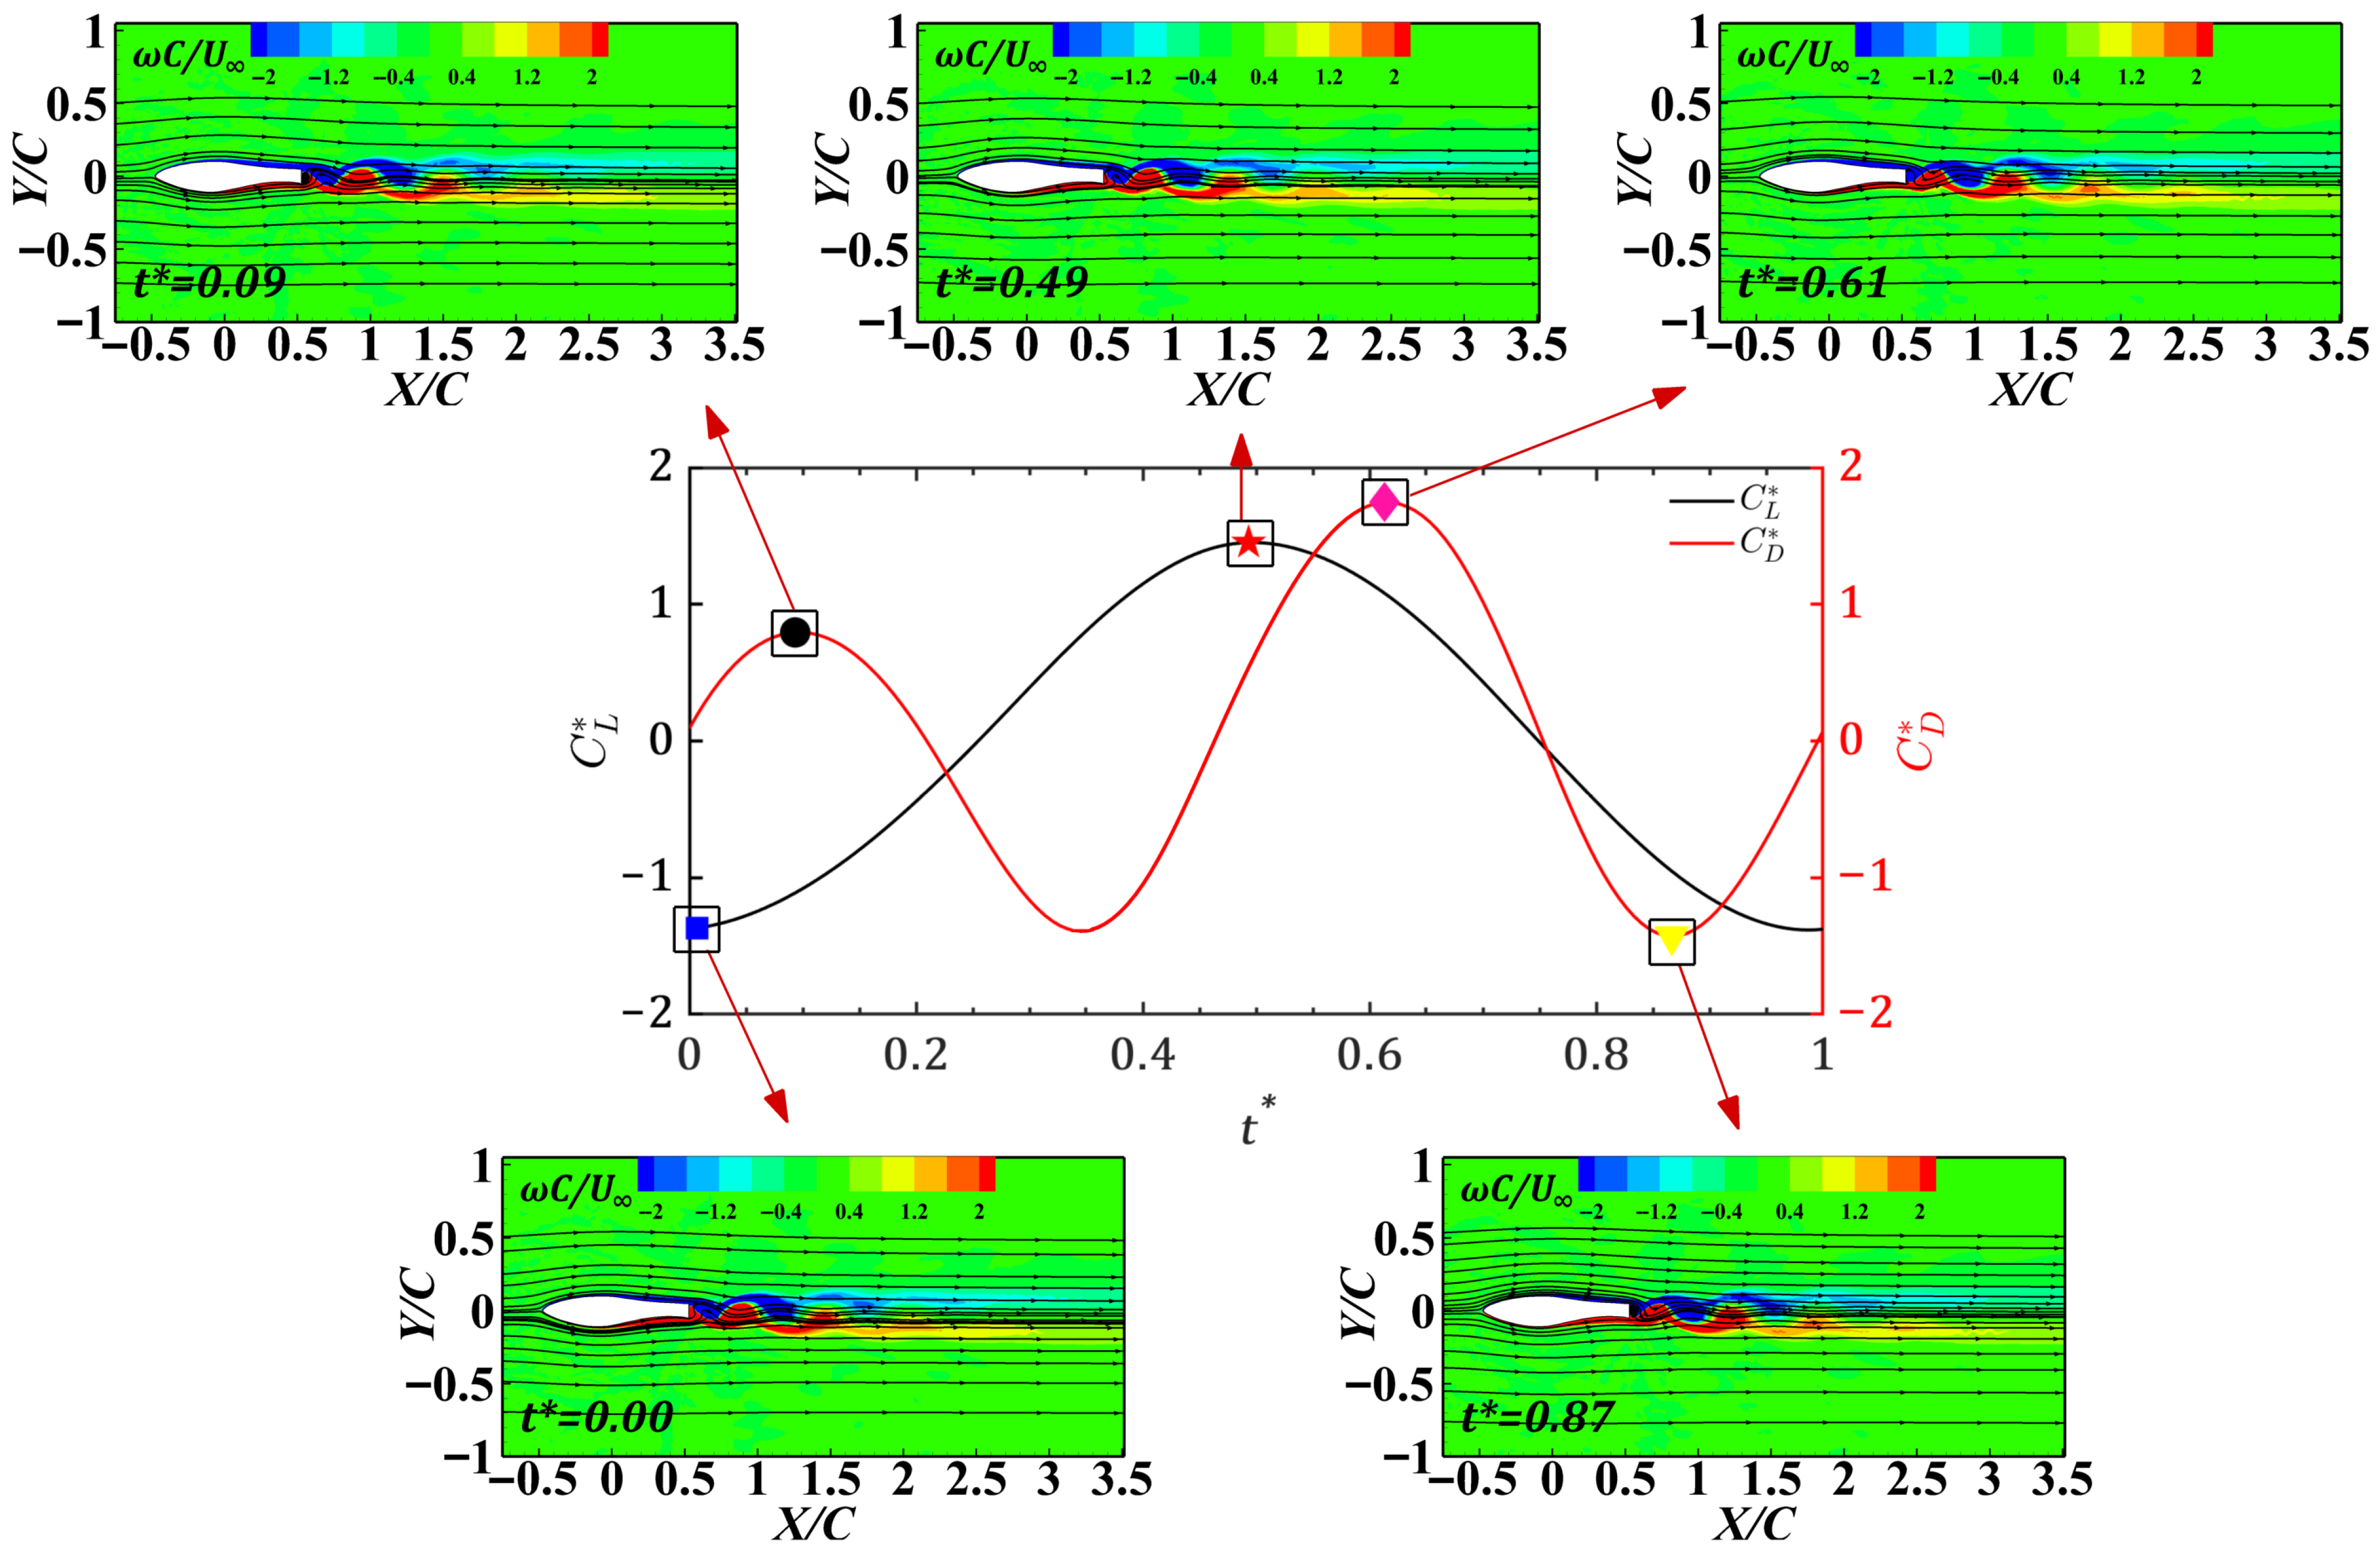
Figure 12 presents the lift and drag coefficient curves, together with the flow-field evolution at characteristic instants for α = 0 ° . The horizontal axis represents the dimensionless time t * , which is defined as follows:
t * = t t 0 T
where t denotes the actual physical time, t 0 denotes the reference starting time of a cycle, and T is the dominant fluctuation period determined from the PSD analysis. The vertical axis denotes the dimensionless lift and drag coefficients (defined as C L * and C D * ):
C L * = C L C L ¯ σ C L
C D * = C D C D ¯ σ C D
At α = 0 ° , C L * exhibits nearly harmonic oscillation, rising from a minimum to a maximum and then returning to the initial level. C D * exhibits a double-peaked structure. This periodic aerodynamic fluctuation stems from regular vortex shedding at the trailing edge. Although the flow remains predominantly attached to both surfaces, alternating positive and negative vorticity layers are generated and shed from the trailing edge, evolving into meandering vorticity layers with energy decaying downstream [28,29,30]. Specifically, at the C L * minimum ( t / T = 0.00 ), the flow at the trailing edge is dominated by a negative vorticity layer, resulting in the formation of a clockwise-rotating vortex. At the C D * maximum (when t / T = 0.61 ), the flow at the trailing edge is dominated by a positive vorticity layer, manifesting as a counterclockwise-rotating vortex. The periodic generation and shedding of this pair of alternately rotating vortices constitutes the physical mechanism driving the fluctuations in C L * and C D * .
Figure 13 presents the lift and drag coefficient curves, together with the flow-field evolution at characteristic instants for α = 14 ° . At α = 14 ° , C L * also exhibits nearly harmonic oscillation, whereas C D * exhibits an asymmetric profile that rises more rapidly than it decays, with superimposed high-frequency oscillations during the decay phase. This indicates a pronounced increase in flow nonlinearity.
The periodic aerodynamic fluctuation at this angle of attack originates from flow separation near the airfoil’s maximum thickness region. Analysis of the flow-field evolution reveals that the periodic lift variation is governed by two coupled vortex dynamic mechanisms:
 (i)
A clockwise-rotating vortex (negative vorticity) that remains attached to the upper-surface trailing edge, establishing the primary high-energy, low-pressure environment for lift.
(ii)
An alternately shedding counterclockwise-rotating vortex (positive vorticity), whose relative position critically modulates the instantaneous lift.
Specifically, at the C L * minimum ( t / T = 0.00 ), the counterclockwise vortex is positioned close to the trailing-edge tip, partially disrupting the main flow. When C L * reaches its maximum ( t / T = 0.54 ), this vortex has developed and moved downstream. The strong low-pressure region of its core then synergizes with the attached clockwise vortex, creating an enhanced suction effect [31] that drives the lift peak. The more complex behavior of the C D * arises from the asymmetric life cycle of this vortex pair and its interaction with secondary flow structures.

3.4.3. Fluctuating Flow States for S809 and S809-100 Airfoils at α = 18 °

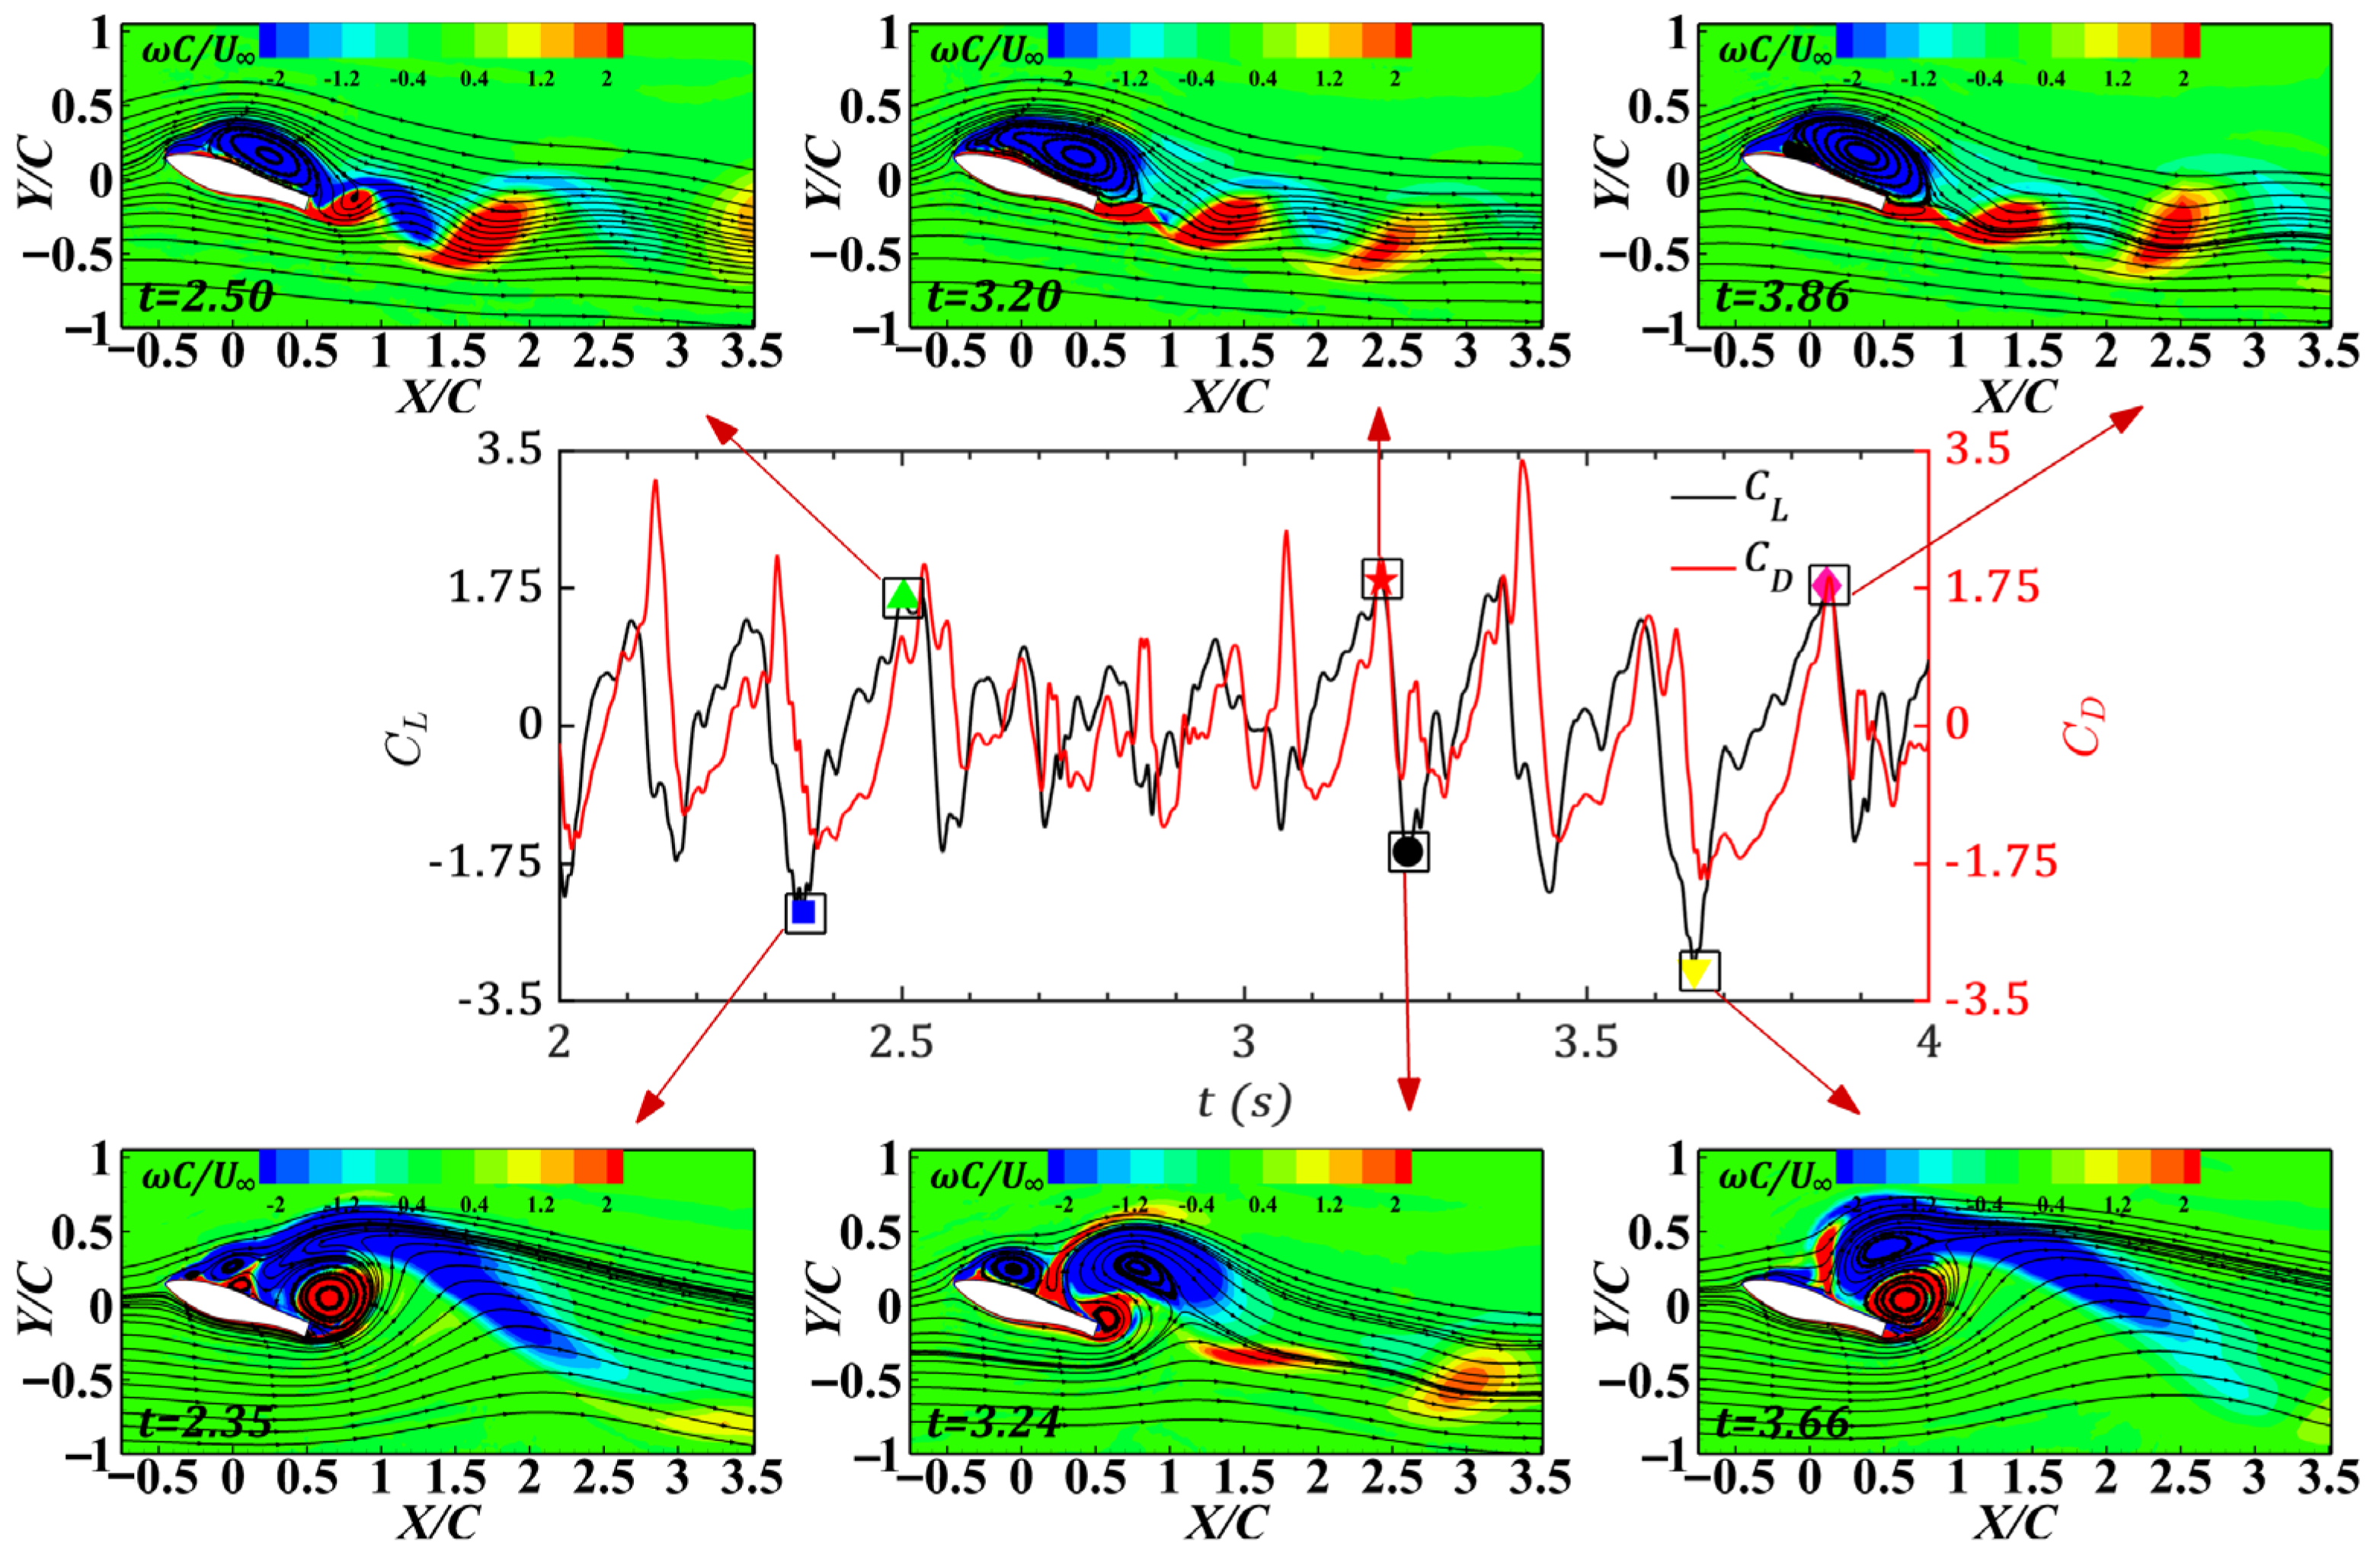
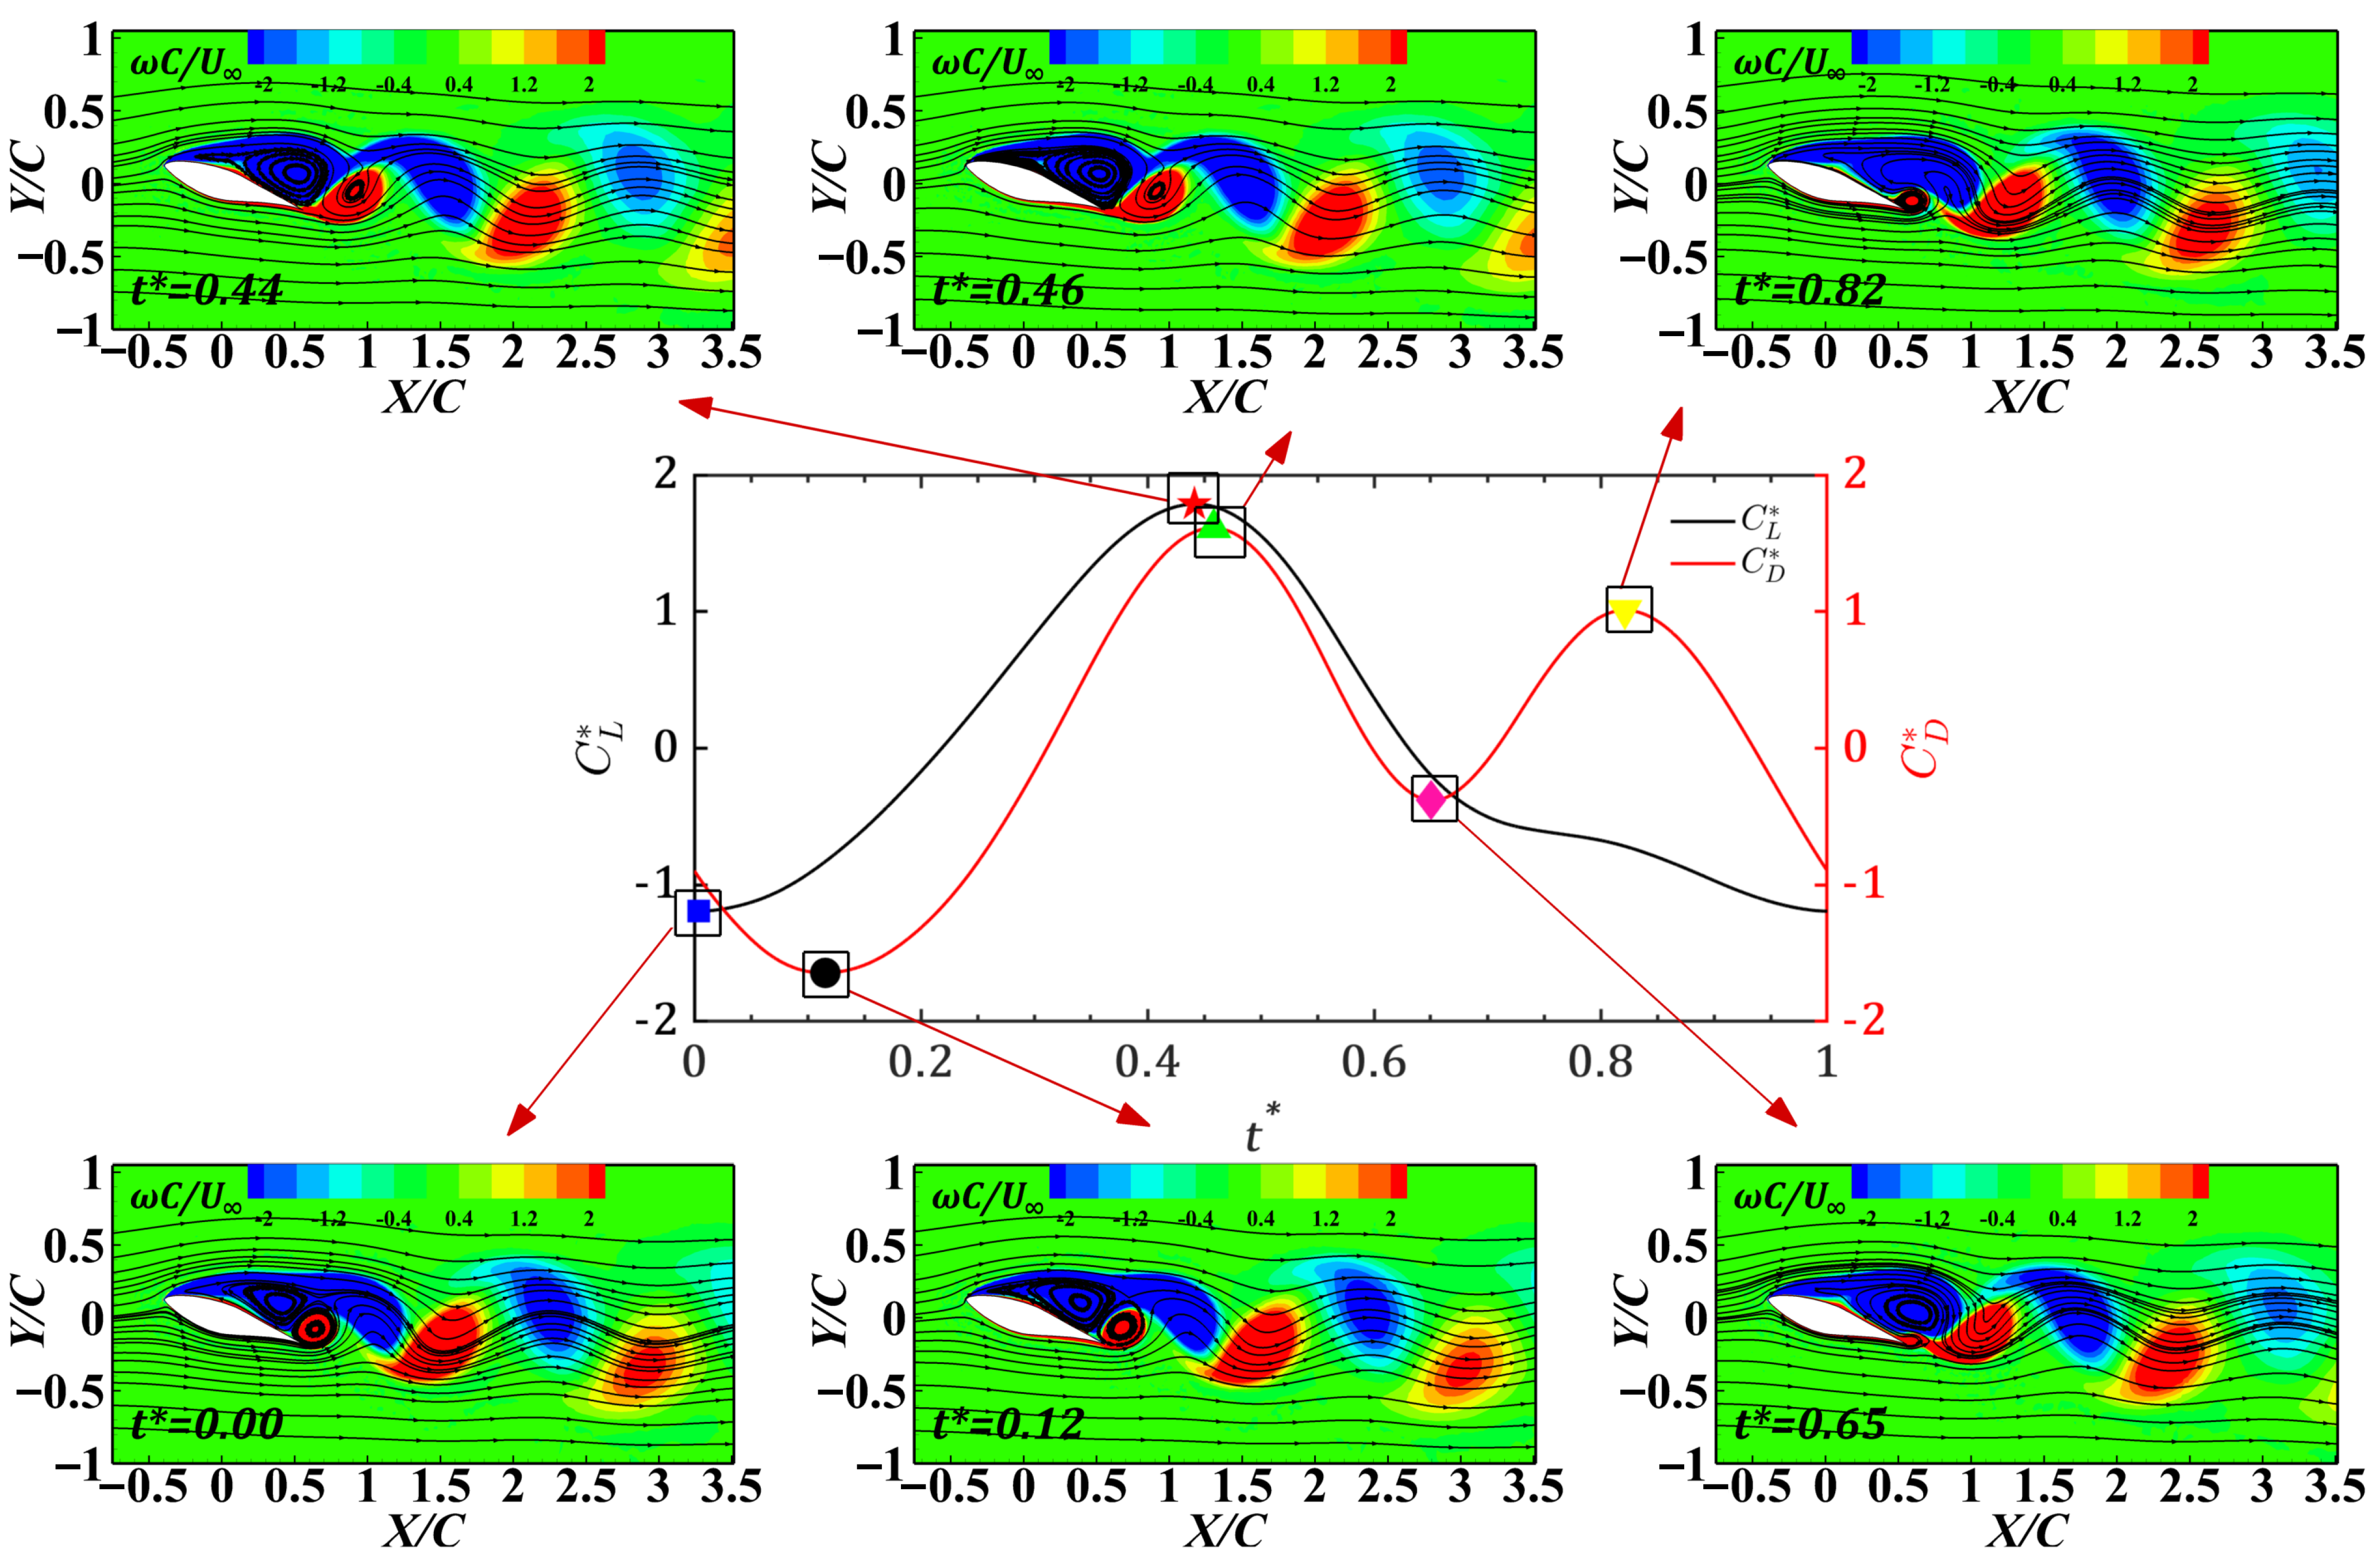
Based on the analysis presented in Section 2.2, two distinct instability modes are identified at an angle of attack of 18 ° : periodic fluctuation for the baseline S809 airfoil and irregular fluctuation for the S809-100 airfoil. To elucidate the underlying flow physics responsible for this difference, their flow-field structures are compared in this section. For the baseline S809 airfoil, the phase-averaged lift and drag coefficients are analyzed in conjunction with instantaneous flow snapshots at characteristic phases, as shown in Figure 14. In contrast, for the S809-100 airfoil, where phase averaging is not applicable, a segment of the raw time history of the force coefficients (from 2 s to 4   s ) and representative instantaneous flow fields are employed for comparison (see Figure 15).
At α = 18 ° , the C L * of the S809 airfoil exhibits an asymmetric quasi-periodic fluctuation. This fluctuation is characterized by a more rapid rise than decay, with high-frequency disturbances superimposed on the decaying branch. Concurrently, C D * displays a distinct double-peaked structure.
The flow evolution within one characteristic cycle is detailed as follows. At the C L * minimum ( t / T = 0.00 ), the upper-surface clockwise vortex remains connected to the downstream negative vorticity layer and is closely attached to the counterclockwise vortex at the trailing-edge tip. At the C L * peak ( t / T = 0.44 ), the clockwise vortex becomes fully developed, while the counterclockwise vortex has shed downstream and significantly weakened. Subsequently, at the trough between the two C D * peaks ( t / T = 0.65 ), the clockwise vortex detaches from the upper surface; concurrently, the previously shed counterclockwise vortex dissipates as a new counterclockwise vortex begins to emerge from the trailing edge. Finally, around the second C D * peak ( t / T = 0.82 ), the clockwise vortex has largely dissipated, and the nascent counterclockwise vortex at the trailing edge experiences rapid growth, marking the initiation of a new cycle.
At α = 18 ° , the lift and drag time series of the S809-100 airfoil exhibit irregular fluctuations. To elucidate the underlying transient flow mechanisms, the segment of the normalized lift coefficient C L * and normalized drag coefficient C D * time series between t = 2   s and 4   s , along with the instantaneous flow fields at its characteristic instants, is analyzed (Figure 15). This curve consists of multiple irregular fluctuation units. Although these units lack strict periodicity, they share a common structure characterized by a rise phase accompanied by high-frequency disturbances, followed by an approximately linear decay phase after reaching the peak. Such a unit is defined herein as a “pseudo-cycle”.
The analysis of instantaneous flow fields at key pseudo-cycle phases, specifically the local maximum ( t = 2.50   s ,   3.20   s ,   3.86   s ) and local minimum ( t = 2.35   s ,   3.24   s ,   3.66   s ), reveals a direct correlation between instantaneous lift variations and systematic flow structure evolution.
The flow field at a pseudo-cycle maximum is typically dominated by a relatively simple structure: a large, clockwise-rotating vortex (negative vorticity layer) on the upper surface. The high-energy vorticity concentrated on the upper surface and near the trailing edge creates strong low-pressure suction, which is the direct cause of the instantaneous lift peak. Concurrently, the positive vorticity layer attached to the trailing edge dissipates into the wake. In stark contrast, the flow field at a pseudo-cycle minimum corresponds to highly complex and disordered structures, featuring intense interactions of multi-scale vortices. For example, at t = 2.35   s and 3.66   s , the upper-surface negative vorticity layer exhibits an elongated “wake-like” structure, while a new counterclockwise vortex develops downstream of the trailing edge. At t = 3.24   s , two clockwise vortices, separated by a “filament-like” positive vorticity layer, coexist near the leading and trailing edges on the upper surface. This multi-vortex, interfering configuration disrupts a stable pressure distribution, causing the lift to drop to a valley. These multi-scale flow features are consistent with the modal analysis conclusions for the deep-stall flow field of the S809 airfoil [32].
The foregoing analysis demonstrates that the irregular fluctuation of the S809-100 airfoil is essentially a superposition of multiple pseudo-cycles. Its flow field undergoes random, non-convergence switching between a relatively ordered state dominated by a single primary vortex and a disordered state of multi-vortex interaction. This flow state switching behavior, driven by intense multi-scale vortex interference, aligns with the unsteady flow dynamics documented in previous studies [33,34,35], and directly accounts for the non-periodic nature of the aerodynamic response.

4. Conclusions

This study presents a comparative analysis of the aerodynamic and flow-field characteristics of the baseline S809 airfoil and its blunt trailing-edge variant, the S809-100 airfoil, through CFD simulations and PIV validation. The key findings are summarized as follows.
  • The S809-100 airfoil demonstrates a consistently higher averaged lift coefficient than the S809 airfoil across the entire angle of attack range ( 0 ° α 18 ° ), with a maximum increase of 74% at α = 10 ° . Although accompanied by a rise in the averaged drag coefficient, the increase in the averaged lift coefficient yields a superior lift-to-drag ratio within the typical range of the angle of attack, 8 ° α 12 ° , for wind turbine operation, peaking at 32.4% larger than the baseline at α = 0 ° .
  • Three characteristic states of aerodynamic responses are identified for both airfoils: steady convergence, periodic fluctuation, and irregular fluctuation. The S809 airfoil maintains a steady convergence state up to α = 16 ° before transitioning to periodic fluctuation at α = 18 ° . In contrast, the S809-100 airfoil exhibits periodic fluctuation even at α = 0 ° and evolving into irregular fluctuation beyond α = 14.2 ° . Trailing-edge thickening enhances the unsteadiness of the aerodynamic responses at small α and the non-periodicity at large α .
  • Power spectral density analysis and flow-field visualization clarify the physical mechanism behind the aerodynamic behaviors. In the case of the sharp trailing edge, the flow remains steady until α = 16 ° , and periodic vortex shedding appears in the flow beyond this angle, characterized by a single dominant Strouhal number and large-scale vortex street in the near wake. Trailing-edge thickening induces periodic flow unsteadiness from α = 0 ° , which deteriorates beyond α = 14.2 ° due to the multi-scale vortex interaction with broadband power spectra.
These findings underscore the dual role of trailing-edge thickening in both enhancing aerodynamic performance and introducing complex unsteady dynamics, providing a valuable reference for the design and analysis of modern wind turbine blades. Beyond the performance-oriented analysis, the present results also suggest two fundamental insights that may help inform both the understanding and modeling of dynamic stall for blunt trailing-edge airfoils.
First, by elucidating how trailing-edge thickening precipitates a premature transition of the aerodynamic response state—from steady convergence to periodic and ultimately irregular fluctuations—this study reveals that trailing-edge thickening introduces a more complex spatiotemporal evolution of flow structures. Such complexity may significantly influence the onset and development of dynamic stall hysteresis. Building upon this physical insight, the observed spectral characteristics and unsteady flow mechanisms provide a phenomenological basis for refining existing dynamic stall models, including those based on the IAG, Snel, and Beddoes–Leishman frameworks [36,37]. The documented variations in dominant Strouhal numbers, the transition from single-frequency to broadband spectral energy, and the emergence of pseudo-cycles under irregular fluctuations—all closely associated with trailing-edge thickening—offer valuable references for calibrating key model parameters. Specifically, trailing-edge thickness can be incorporated as an influential geometric parameter to inform the adjustment of time constants, vortex-shedding characteristics, and state switching thresholds in these models. By linking the aerodynamic response of wind turbine airfoils to the unsteady features relevant to dynamic stall, this work contributes to bridging the gap between fundamental airfoil aerodynamics and the development of high-fidelity engineering prediction tools for wind turbine applications.

Author Contributions

Conceptualization, X.Z. and P.Q.; methodology, X.Z. and P.Q.; software, P.Q. and S.X.; validation, P.Q. and S.X.; formal analysis, X.Z. and P.Q.; investigation, X.Z. and P.Q.; resources, X.Z.; data curation, X.Z. and P.Q.; writing—original draft preparation, P.Q. and S.X.; writing—review and editing, X.Z. and P.Q.; visualization, P.Q. and X.Z.; supervision, X.Z.; project administration, X.Z.; funding acquisition, X.Z. All authors have read and agreed to the published version of the manuscript.

Funding

This research was funded by the National Natural Science Foundation of China (Grant No. 12302298), the Observation and Research Station of Zhoushan Tidal Energy, Ministry of Natural Resources (Grant No. ZSTE2024KB02), the Science and Technology Program of Gansu Province of China (Grant Nos. 26JRRA505/25CXGA054), the Hongliu Excellent Young Talent Support Program and the Young Faculty Interdisciplinary Research Cultivation Program of Lanzhou University of Technology (Grant Nos. LUTHLYQ23ZXB/LUTXKJC25003).

Data Availability Statement

Data is contained within the article.

Conflicts of Interest

The authors declare no conflicts of interest.

Abbreviations

The following abbreviations are used in this manuscript:
CFDComputational fluid dynamics
PIVParticle image velocimetry
BTEBlunt trailing edge
NRELNational Renewable Energy Laboratory
PSDPower spectral density
x Non-dimensional streamwise coordinates
y Non-dimensional transverse coordinates
S t Strouhal number
α Angle of attack, °
C Airfoil chord length, m
U Freestream velocity, m/s
R e Reynolds number
u Instantaneous velocity, m/s
u * Dimensionless instantaneous velocity
UTime-averaged velocity, m/s
ω Time-averaged vorticity, s 1
ω Dimensionless time-averaged vorticity
t Time, s
t Dimensionless time
T Period, s
f Frequency, s 1
C L Lift coefficient
C D Drag coefficient
σ ( C L ) Standard deviation of lift coefficient
σ ( C D ) Standard deviation of drag coefficient
C L Standardized lift coefficient
C D Standardized drag coefficient
C L ¯ Relative difference of C L
C D ¯ Relative difference of C D

References

  1. Sueyoshi, T.; Mo, F.; Wang, D.D. Sustainable development of countries all over the world and the impact of renewable energy. Renew. Energy 2022, 184, 320–331. [Google Scholar] [CrossRef]
  2. Global Wind Energy Council (GWEC). Global Offshore Wind Report 2025; Global Wind Energy Council: Brussels, Belgium, 2025; Available online: https://www.gwec.net/reports/globalwindreport (accessed on 25 June 2025).
  3. Tanner, M. A method for reducing the base drag of wings with blunt trailing edge. Aeronaut. Q. 1970, 23, 11. [Google Scholar] [CrossRef]
  4. Ramjee, V.; Tulapurkara, E.G.; Balabaskaran, V. Experimental and theoretical study of wings with blunt trailing edges. J. Aircr. 1986, 23, 349–352. [Google Scholar] [CrossRef]
  5. Fuglsang, P.; Antoniou, I.; Dahl, K.S.; Aagaard Madsen, H. Wind Tunnel Tests of the FFA-W3-241, FFA-W3-301 and NACA 63-430 Airfoils; Risoe-R No. 1041(EN); Risø National Laboratory: Roskilde, Denmark, 1998. [Google Scholar]
  6. Law, S.P.; Gregorek, G.M. Wind Tunnel Evaluation of a Truncated NACA 64-621 Airfoil for Wind Turbine Applications; NASA Report No. 6443460; NASA: Washington, DC, USA, 1987.
  7. Sato, J.; Sunada, Y. Experimental research on blunt trailing-edge airfoil sections at low Reynolds numbers. AIAA J. 1995, 33, 2295–2301. [Google Scholar] [CrossRef]
  8. Baker, J.P.; Mayda, E.A.; Van Dam, C.P. Experimental analysis of thick blunt trailing-edge wind turbine airfoils. J. Sol. Energy Eng. 2006, 128, 422–431. [Google Scholar] [CrossRef]
  9. Jackson, K.J.; Zuteck, M.D.; Van Dam, C.P.; Standish, K.J.; Berry, D. Innovative design approaches for large wind turbine blades. Wind Energy 2005, 8, 141–171. [Google Scholar] [CrossRef]
  10. Pei, Z.; Xu, H.-Y.; Deng, L.; Li, L.-X. Influence of the blunt trailing-edge thickness on the aerodynamic characteristics of the very thick airfoil. Wind 2023, 3, 439–458. [Google Scholar] [CrossRef]
  11. Zhang, X.; Wang, G.G.; Zhang, M.J.; Li, W. Effect of relative camber on the aerodynamic performance improvement of asymmetrical blunt trailing-edge modification. J. Eng. Thermophys. 2017, 26, 514–531. [Google Scholar] [CrossRef]
  12. Liu, H.P.; Yu, W.; Yan, R.J.; Xu, P.; Wang, Q. Influence of the modification of asymmetric trailing-edge thickness on the aerodynamic performance of a wind turbine airfoil. Renew. Energy 2020, 147, 1623–1631. [Google Scholar] [CrossRef]
  13. Ni, Z.M.; Kong, Z.Y.; Sun, X.J. Enhancing the self-starting capability and power performance of a H-type vertical axis wind turbine with blunt trailing-edge airfoil via blowing. Ocean Eng. 2026, 343, 123335. [Google Scholar] [CrossRef]
  14. Yang, H.; Yin, P.H.; Qin, K.; Huang, D.G. Efficiency Analysis of 3D Wind Turbine Blade Performance Based on Blunt Trailing Edge Airfoil Blade. J. Mech. Eng. 2023, 59, 123–130. [Google Scholar] [CrossRef]
  15. Sørensen, J.N. Aerodynamic Aspects of Wind Energy Conversion. Annu. Rev. Fluid Mech. 2011, 43, 427–448. [Google Scholar] [CrossRef]
  16. Wang, T.; Tian, L.; Zhong, W.; Wang, L.; Zhu, C. Aerodynamic research progress in wind energy I: Wind turbine aerodynamic characteristics. Acta Aerodyn. Sin. 2022, 40, 1–21. [Google Scholar] [CrossRef]
  17. Tangler, J.L.; Somers, D.M. NREL Airfoil Families for HAWTs; NREL/TP-442-7109; National Renewable Energy Laboratory: Golden, CO, USA, 1995.
  18. Butterfield, C.P.; Musial, W.P.; Simms, D.A. Combined Experiment Phase I Final Report; National Renewable Energy Laboratory: Golden, CO, USA, 1992.
  19. Al-Ttowi, A.; Mohammed, A.N.; Al-Alimi, S.; Zhou, W.; Saif, Y.; Ismail, I.F. Computational fluid dynamics (CFD) investigation of NREL phase VI wind turbine performance using various turbulence models. Processes 2024, 12, 1994. [Google Scholar] [CrossRef]
  20. Standish, K.J.; van Dam, C.P. Aerodynamic Analysis of Blunt Trailing Edge Airfoils. J. Sol. Energy Eng. 2003, 125, 479–487. [Google Scholar] [CrossRef]
  21. Jeng, J.H.; Kim, S.H. CFD investigation on the flatback airfoil effect of 10 MW wind turbine blade. J. Mech. Sci. Technol. 2018, 32, 2089–2097. [Google Scholar] [CrossRef]
  22. Ma, L.J.; Cheng, J.; Guang, D.; Cao, R.J. Parametric research on influence of trailing edge’s thickness to aerodynamic performance for wind turbine airfoils. Acta Energiae Solaris Sin. 2010, 31, 1060–1067. [Google Scholar]
  23. Wang, T.; Sun, Z.; Yao, J. An efficient and robust fracture-grid and fracture-fracture intersection detection method for polygon fractures in unstructured polyhedral grids. Comput. Geotech. 2021, 134, 104125. [Google Scholar] [CrossRef]
  24. Sayed, M.A.; Kandil, H.A.; Shaltot, A. Aerodynamic analysis of different wind-turbine-blade profiles using finite-volume method. Energy Convers. Manag. 2012, 64, 541–550. [Google Scholar] [CrossRef]
  25. Lv, C.; Ye, X.; Wu, Y.; Cheng, W.; Li, C. Impact of trailing edge cracks on the aerodynamic performance and noise of offshore wind turbine airfoils. Phys. Fluids 2025, 37, 047135. [Google Scholar] [CrossRef]
  26. Abdalkarem, A.A.M.; Abdullah, A.F.; Sopian, K.; Haw, L.C.; Muzammil, W.K.; Wong, K.H. The effect of trailing-edge wedge-tails on the aerodynamic characteristics of wind turbine airfoil. IOP Conf. Ser. Mater. Sci. Eng. 2023, 1278, 012011. [Google Scholar] [CrossRef]
  27. Abdelghany, E.S.; Sarhan, H.H.; Alahmadi, R.; Farghaly, M.B. Study the effect of winglet height length on the aerodynamic performance of horizontal axis wind turbines using computational investigation. Energies 2023, 16, 5138. [Google Scholar] [CrossRef]
  28. Zheng, X.B.; Pröbsting, S.; Wang, H.L.; Li, Y. Characteristics of vortex shedding from a sinusoidally pitching hydrofoil at high Reynolds number. Phys. Rev. Fluids 2021, 6, 084702. [Google Scholar] [CrossRef]
  29. Wang, H.L.; Zheng, X.B.; Pröbsting, S.; Hu, C.H.; Wang, Q.; Li, Y. An unsteady RANS simulation of the performance of an oscillating hydrofoil at a high Reynolds number. Ocean. Eng. 2023, 274, 114097. [Google Scholar] [CrossRef]
  30. Zheng, X.B.; Wang, H.L.; Xu, W.H.; Gao, Z.T.; Leng, J.; Li, Y. Aerodynamic response of vertical-axis wind turbine foil to different vortex shedding patterns. Acta Aerodyn. Sin. 2023, 41, 26–34. [Google Scholar] [CrossRef]
  31. Özden, M.; Genç, M.S.; Koca, K. Passive flow control application using single and double vortex generator on S809 wind turbine airfoil. Energies 2023, 16, 5339. [Google Scholar] [CrossRef]
  32. Verma, S.; Hemmati, A. Characterization of bifurcated dual vortex streets in the wake of an oscillating foil. J. Fluid Mech. 2022, 945, A7. [Google Scholar] [CrossRef]
  33. Kang, X.W.; Li, B.; Guo, W.G. Aerodynamic characteristics analysis of the small unmanned aerial vehicle’s airfoil at low Reynolds numbers. J. Nav. Aviat. Univ. 2017, 32, 443–446. [Google Scholar] [CrossRef]
  34. Cheng, J.F.; Zhang, C.H.; Peng, A.X.; Shi, Z.W. Experimental study of pitching airfoil flow structure based on TR-PIV. J. Nav. Aviat. Univ. 2024, 39, 492–500. [Google Scholar] [CrossRef]
  35. Zheng, X.B.; Jiang, N. The spatial-temporal evolution of coherent structures in log law region of turbulent boundary layer. Acta Mech. Sin. 2015, 31, 16–24. [Google Scholar] [CrossRef][Green Version]
  36. Bangga, G.; Parkinson, S.; Collier, W. Development and validation of the IAG dynamic stall model in state-space representation for wind turbine airfoils. Energies 2023, 16, 3994. [Google Scholar] [CrossRef]
  37. Holierhoek, J.G.; de Vaal, J.B.; van Zuijlen, A.H.; Bijl, H. Comparing different dynamic stall models. Wind Energy 2013, 16, 139–158. [Google Scholar] [CrossRef]
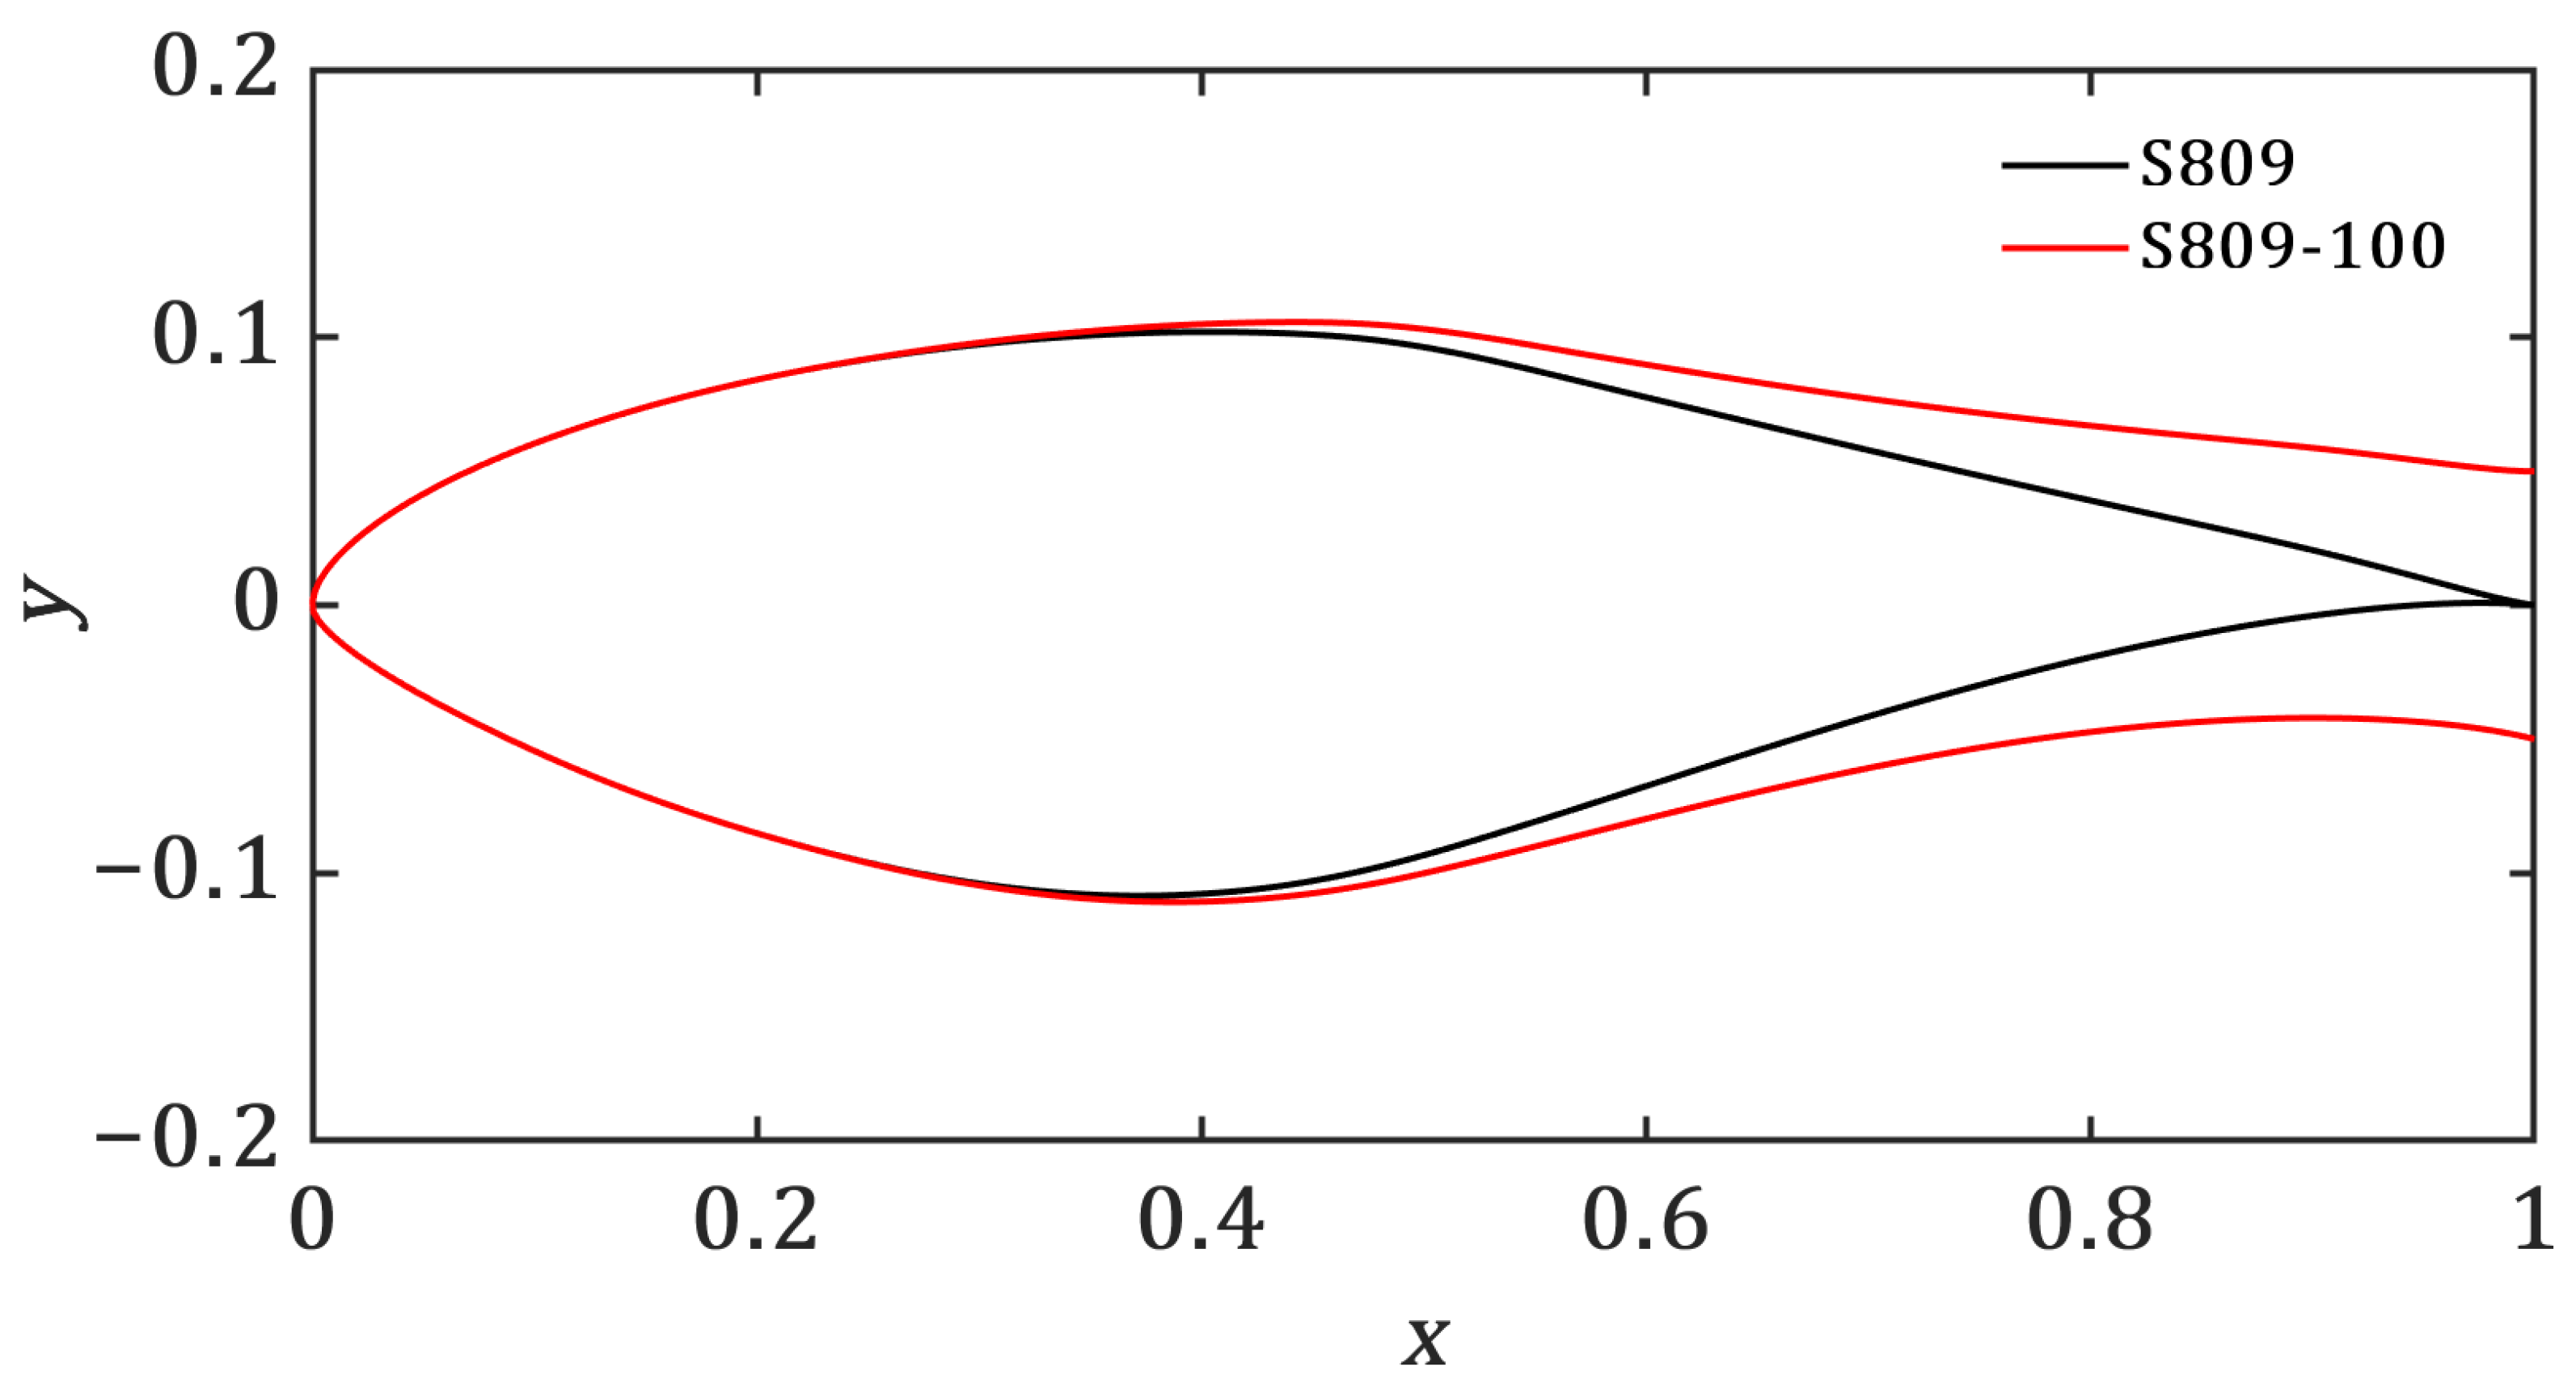
Figure 1. Profiles of S809 and S809-100 airfoils.
Jmse 14 00555 g001
Figure 2. Experimental setup schematic and apparatus photograph.
Jmse 14 00555 g002
Figure 3. Computational domain, boundary conditions, and mesh settings.
Jmse 14 00555 g003
Figure 4. Comprehensive numerical verification and validation. (a) Grid independence verification with the adopted mesh scheme in blue diamonds. (b) C L ¯ and C D ¯ accuracy validation against measurements by Butterfield et al. [18].
Jmse 14 00555 g004
Figure 5. Dimensionless instantaneous velocity u and averaged vorticity ω * field validation for two airfoils at α = 18 ° .
Jmse 14 00555 g005
Figure 6. Time series of C L and C D for S809 and S809-100 airfoils. C L in black; C D in red; dashed line for S809 airfoil; solid line for S809-100 airfoil. All five subfigures share same horizontal axis.
Jmse 14 00555 g006
Figure 7. State classification of aerodynamic response for S809 and S809-100 airfoils.
Jmse 14 00555 g007
Figure 8. Comparison of aerodynamic performance between S809 and S809-100 airfoils. (a) C L ¯ and C D ¯ versus α . (b) C L ¯ / C D ¯ versus α . (c) σ ( C L ) and σ ( C D ) versus α .
Jmse 14 00555 g008
Figure 9. P S D / σ 2 ( C L ) versus S t for S809-100 at α = 0 ° to 18 ° and S809 at α = 18 ° .
Jmse 14 00555 g009
Figure 10. Characteristics of power spectral density peaks of C L for S809-100 airfoil. (a) S t versus α . (b) P S D / σ 2 ( C L ) versus α .
Jmse 14 00555 g010
Figure 11. Steady velocity and vorticity fields of S809 airfoil.
Jmse 14 00555 g011
Figure 12. C L * and C D * versus   t over one cycle, and correlated instantaneous vorticity fields of S809-100 airfoil ( α = 0 ° ).
Jmse 14 00555 g012
Figure 13. C L * and C D * versus t over one cycle, and correlated instantaneous vorticity fields of S809-100 airfoil ( α = 14 ° ).
Jmse 14 00555 g013
Figure 14. C L * and C D * versus t over one cycle, and correlated instantaneous vorticity fields of S809 airfoil ( α = 18 ° ).
Jmse 14 00555 g014
Figure 15. C L and C D versus t , and correlated instantaneous vorticity fields of S809-100 airfoil ( α = 18 ° ).
Jmse 14 00555 g015
Disclaimer/Publisher’s Note: The statements, opinions and data contained in all publications are solely those of the individual author(s) and contributor(s) and not of MDPI and/or the editor(s). MDPI and/or the editor(s) disclaim responsibility for any injury to people or property resulting from any ideas, methods, instructions or products referred to in the content.