Article

Rupture Velocity Acceleration and Slip Partitioning Along an Oceanic Transform Fault: The 2025 Mw 7.6 Cayman Trough Earthquake


1
School of Earth Sciences, China University of Geosciences, Wuhan 430074, China
2
School of Mathematics and Physics, China University of Geosciences, Wuhan 430074, China
3
China Aero Geophysical Survey & Remote Sensing Center for Natural Resources, Beijing 100083, China
*
Author to whom correspondence should be addressed.
J. Mar. Sci. Eng. 2026, 14(5), 479; https://doi.org/10.3390/jmse14050479
Submission received: 31 December 2025 / Revised: 25 February 2026 / Accepted: 26 February 2026 / Published: 2 March 2026
(This article belongs to the Special Issue Advances in Ocean Plate Motion and Seismic Research)

Abstract

On 8 February 2025, an Mw 7.6 strike-slip earthquake ruptured the Swan Islands Transform Fault in the northern Caribbean near its junction with the Mid-Cayman Spreading Center, providing an important offshore case for investigating rupture dynamics along oceanic transform faults. In this study, we jointly apply teleseismic high-frequency back-projection and low-frequency finite-fault full-waveform inversion to image the multi-scale spatiotemporal evolution of the rupture process. Back-projection results reveal a two-stage rupture characterized by an initial sub-shear propagation lasting approximately 20 s, followed by rapid acceleration to supershear velocities of ~5–6 km/s and westward propagation over ~80–100 km. Finite-fault inversion shows that coseismic slip is primarily concentrated within ~20 km west of the epicenter, with a peak slip of ~5.6 m and an overall rupture duration of ~40 s. Comparison between high-frequency radiation and low-frequency slip indicates that the most seismic moment was released during the early slow rupture stage, whereas the later fast-propagating segment produced enhanced high-frequency energy but relatively small slip. These observations reveal a pronounced along-strike complementary relationship between slip amplitude and rupture speed, suggesting a transition in rupture dynamics controlled by variations in fault strength, fracture energy, and/or geometric complexity. By combining high-frequency back-projection with low-frequency finite-fault inversion, we obtain a more complete view of the rupture process of offshore earthquakes, which helps clarify rupture propagation characteristics, including supershear behavior, along oceanic transform faults.

1. Introduction

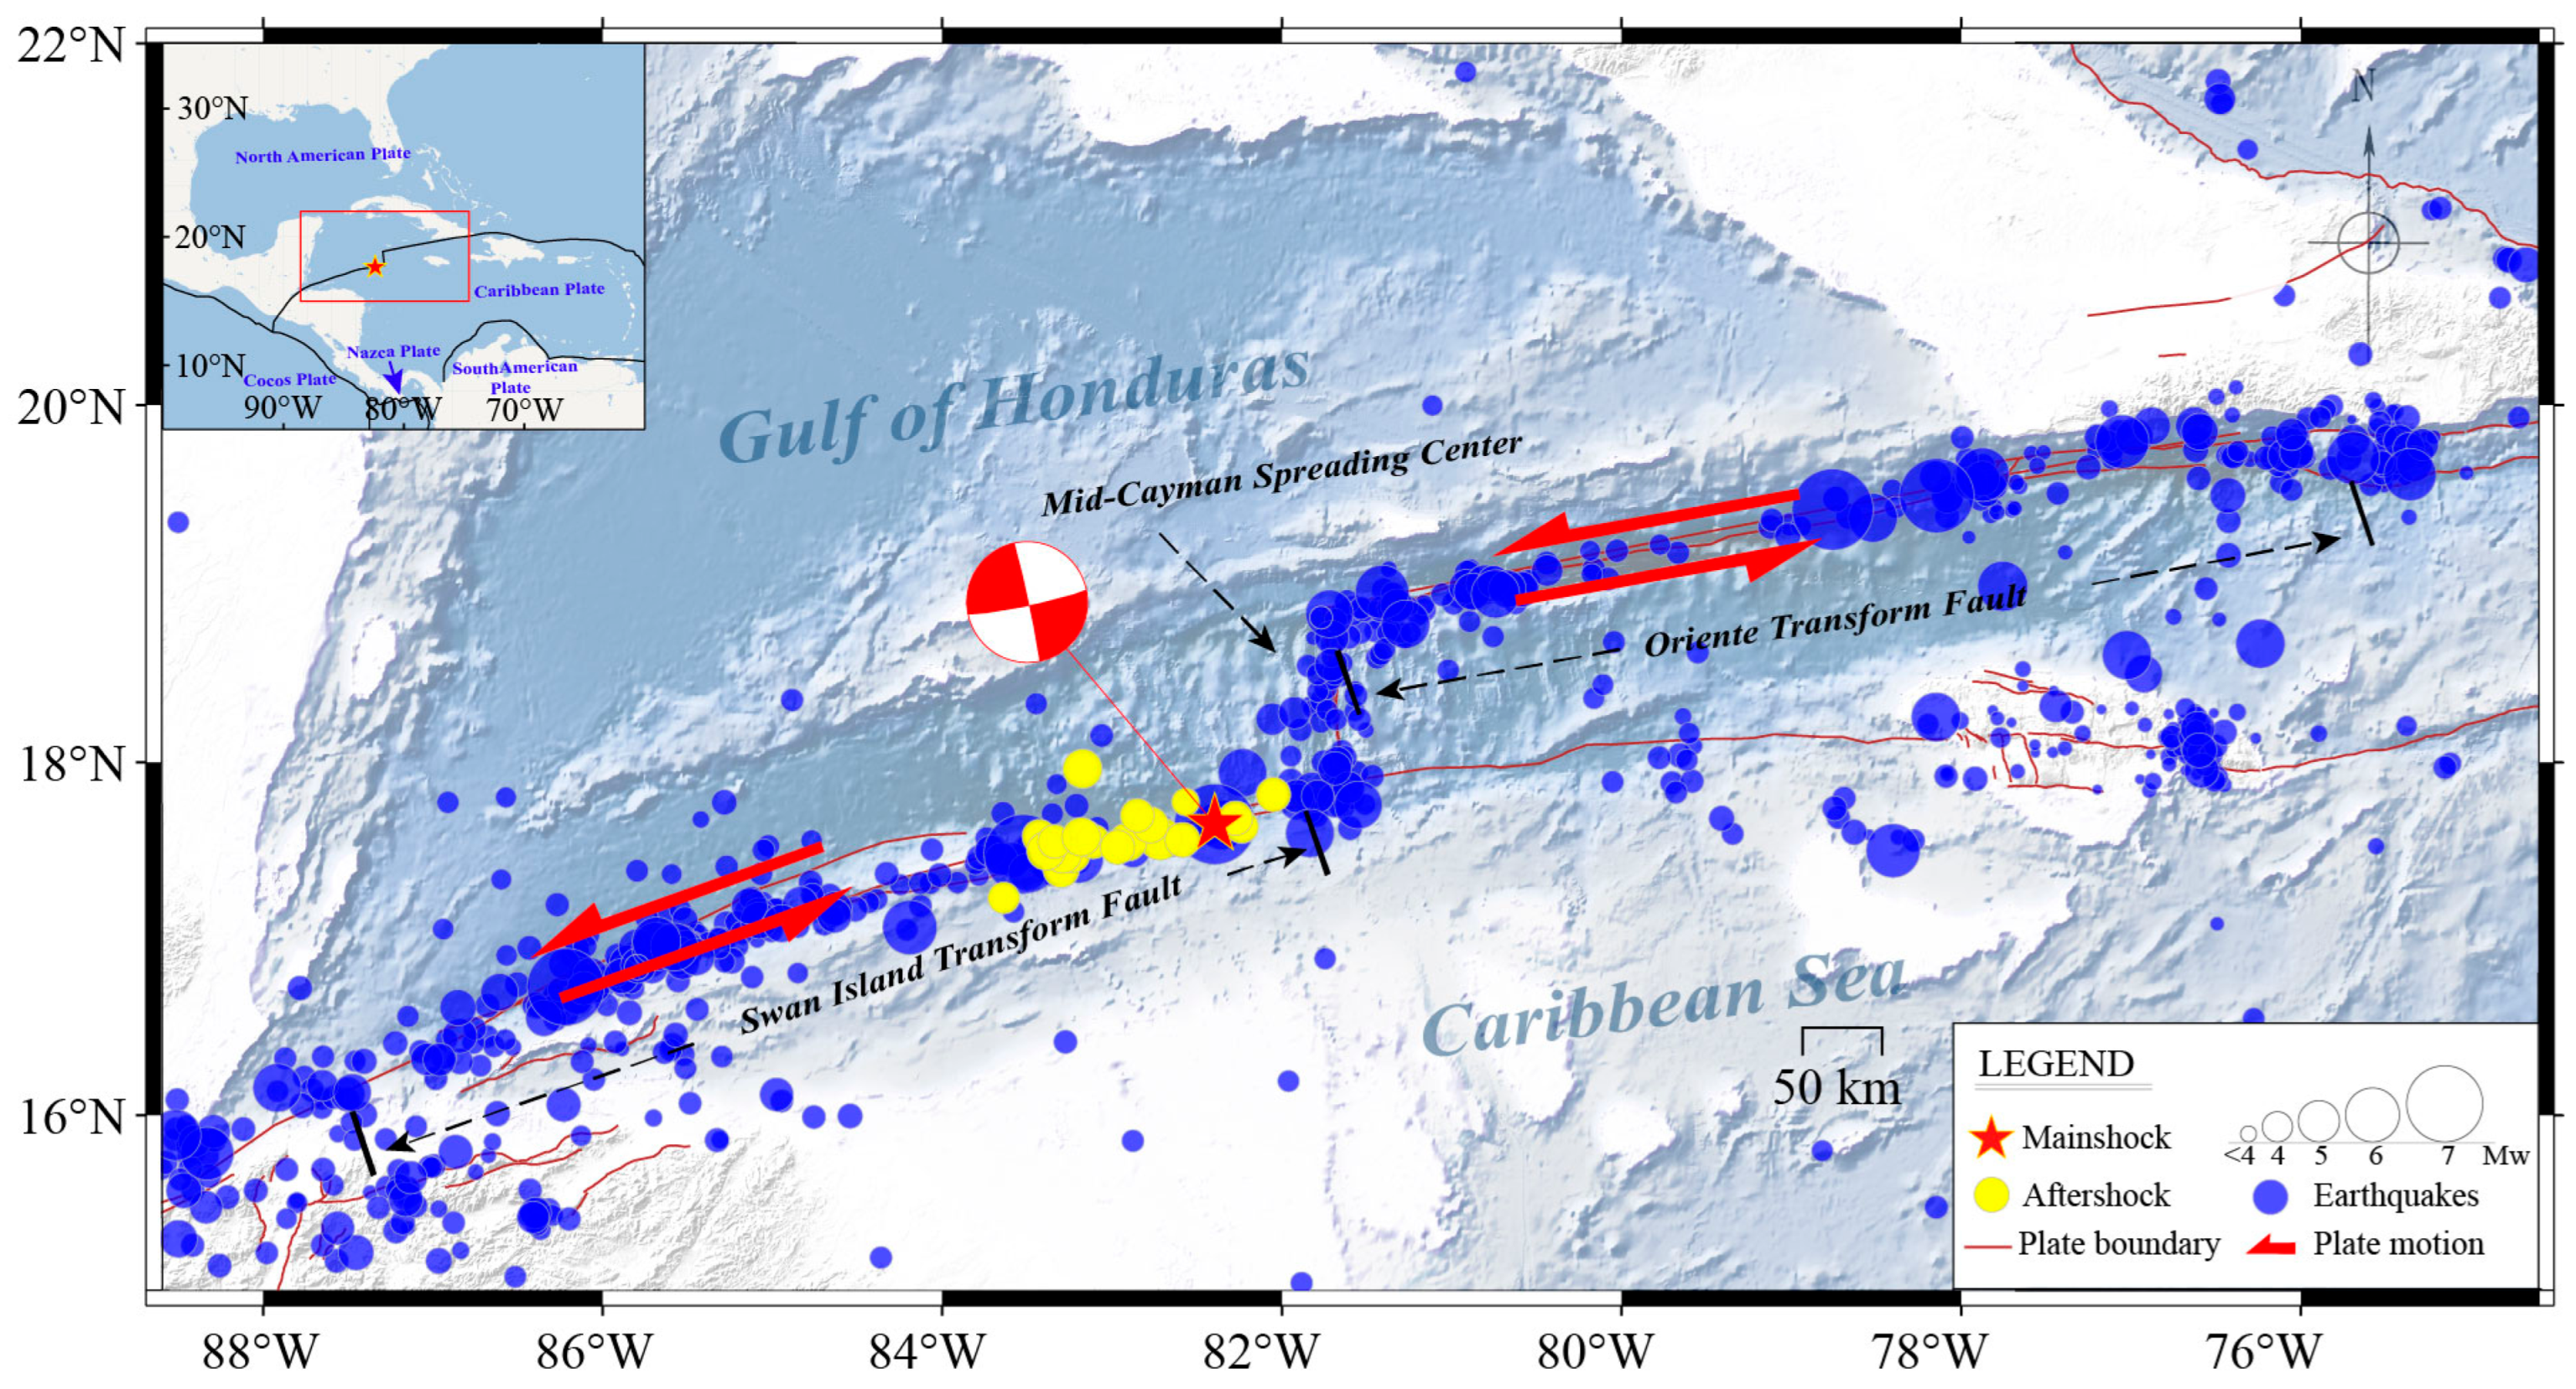
On 8 February 2025, a large Mw 7.6 strike-slip earthquake occurred in the northern Caribbean, with its epicenter located within the Cayman Trough transform fault system, the primary plate boundary between the North American and Caribbean plates (Figure 1). Geodetic and geological studies indicate that the two plates undergo left-lateral relative motion at a rate of approximately 15–20 mm/y [1,2]. Against this long-term tectonic background, the plate boundary has historically hosted multiple large strike-slip earthquakes, including the 1976 Mw 7.5 Guatemala earthquake, the 2020 Mw 7.7 Jamaica–Cuba earthquake, and other major events along adjacent fault segments [3,4], highlighting its substantial seismic hazard.
The northern Caribbean plate boundary consists of several key tectonic units, including the Swan Islands Transform Fault, the Mid-Cayman Spreading Center, and the Oriente Transform Fault (Figure 1). The Mid-Cayman Spreading Center connects the two strike-slip faults, featuring predominantly normal faulting nearly perpendicular to the transform fault trend, with an ultra-slow seafloor spreading rate of ~15 mm/yr, forming one of the world’s deepest oceanic basins [5,6,7,8]. Collectively, these structures create a geometrically complex and kinematically diverse plate boundary system, accommodating relative motion through strike-slip, extension, and localized compression.
The 2025 Mw 7.6 earthquake occurred on the eastern segment of the Swan Islands Transform Fault, near its junction with the Mid-Cayman Spreading Center (Figure 1). Although the Cayman Trough is often interpreted as a large releasing step or pull-apart basin, geological and geophysical studies indicate that the transform fault system is highly segmented, with pronounced releasing and restraining bends along the Swan Islands fault [5,9,10]. In left-lateral strike-slip systems, restraining bends typically correspond to localized compressional deformation and elevated stress accumulation, with mechanical strength significantly higher than surrounding segments, making them potential nucleation or rupture-arrest zones for large earthquakes [10,11].
Compared with continental strike-slip faults such as Saging Fault [12], earthquake-related deformation can be effectively measured and extensively investigated through earthquake geological surveys and spaceborne geodetic observation techniques [13,14]; large earthquakes on oceanic transform faults remain relatively understudied, largely due to their offshore location and sparse near-field observations. Consequently, key scientific questions remain regarding the rupture duration, rupture speed, and the influence of fault geometric complexity on rupture propagation. In this context, teleseismic imaging techniques provide an essential approach for investigating the rupture process of such events.
In this study, we combine high-frequency teleseismic back-projection with low-frequency finite-fault inversion to systematically investigate the rupture process of the 2025 Mw 7.6 Cayman Trough earthquake. Back-projection is employed to resolve the spatiotemporal evolution of high-frequency seismic radiation and rupture propagation, while finite-fault inversion constrains the low-frequency coseismic slip distribution and moment release. By jointly analyzing rupture duration, rupture speed, and slip characteristics, we aim to elucidate how the geometric complexity of the Swan Islands Transform Fault and its proximity to the Mid-Cayman Spreading Center control rupture behavior, providing new insights into the seismogenic mechanisms and associated hazard of oceanic transform faults.

2. Back-Projection Analysis

2.1. Data and Processing

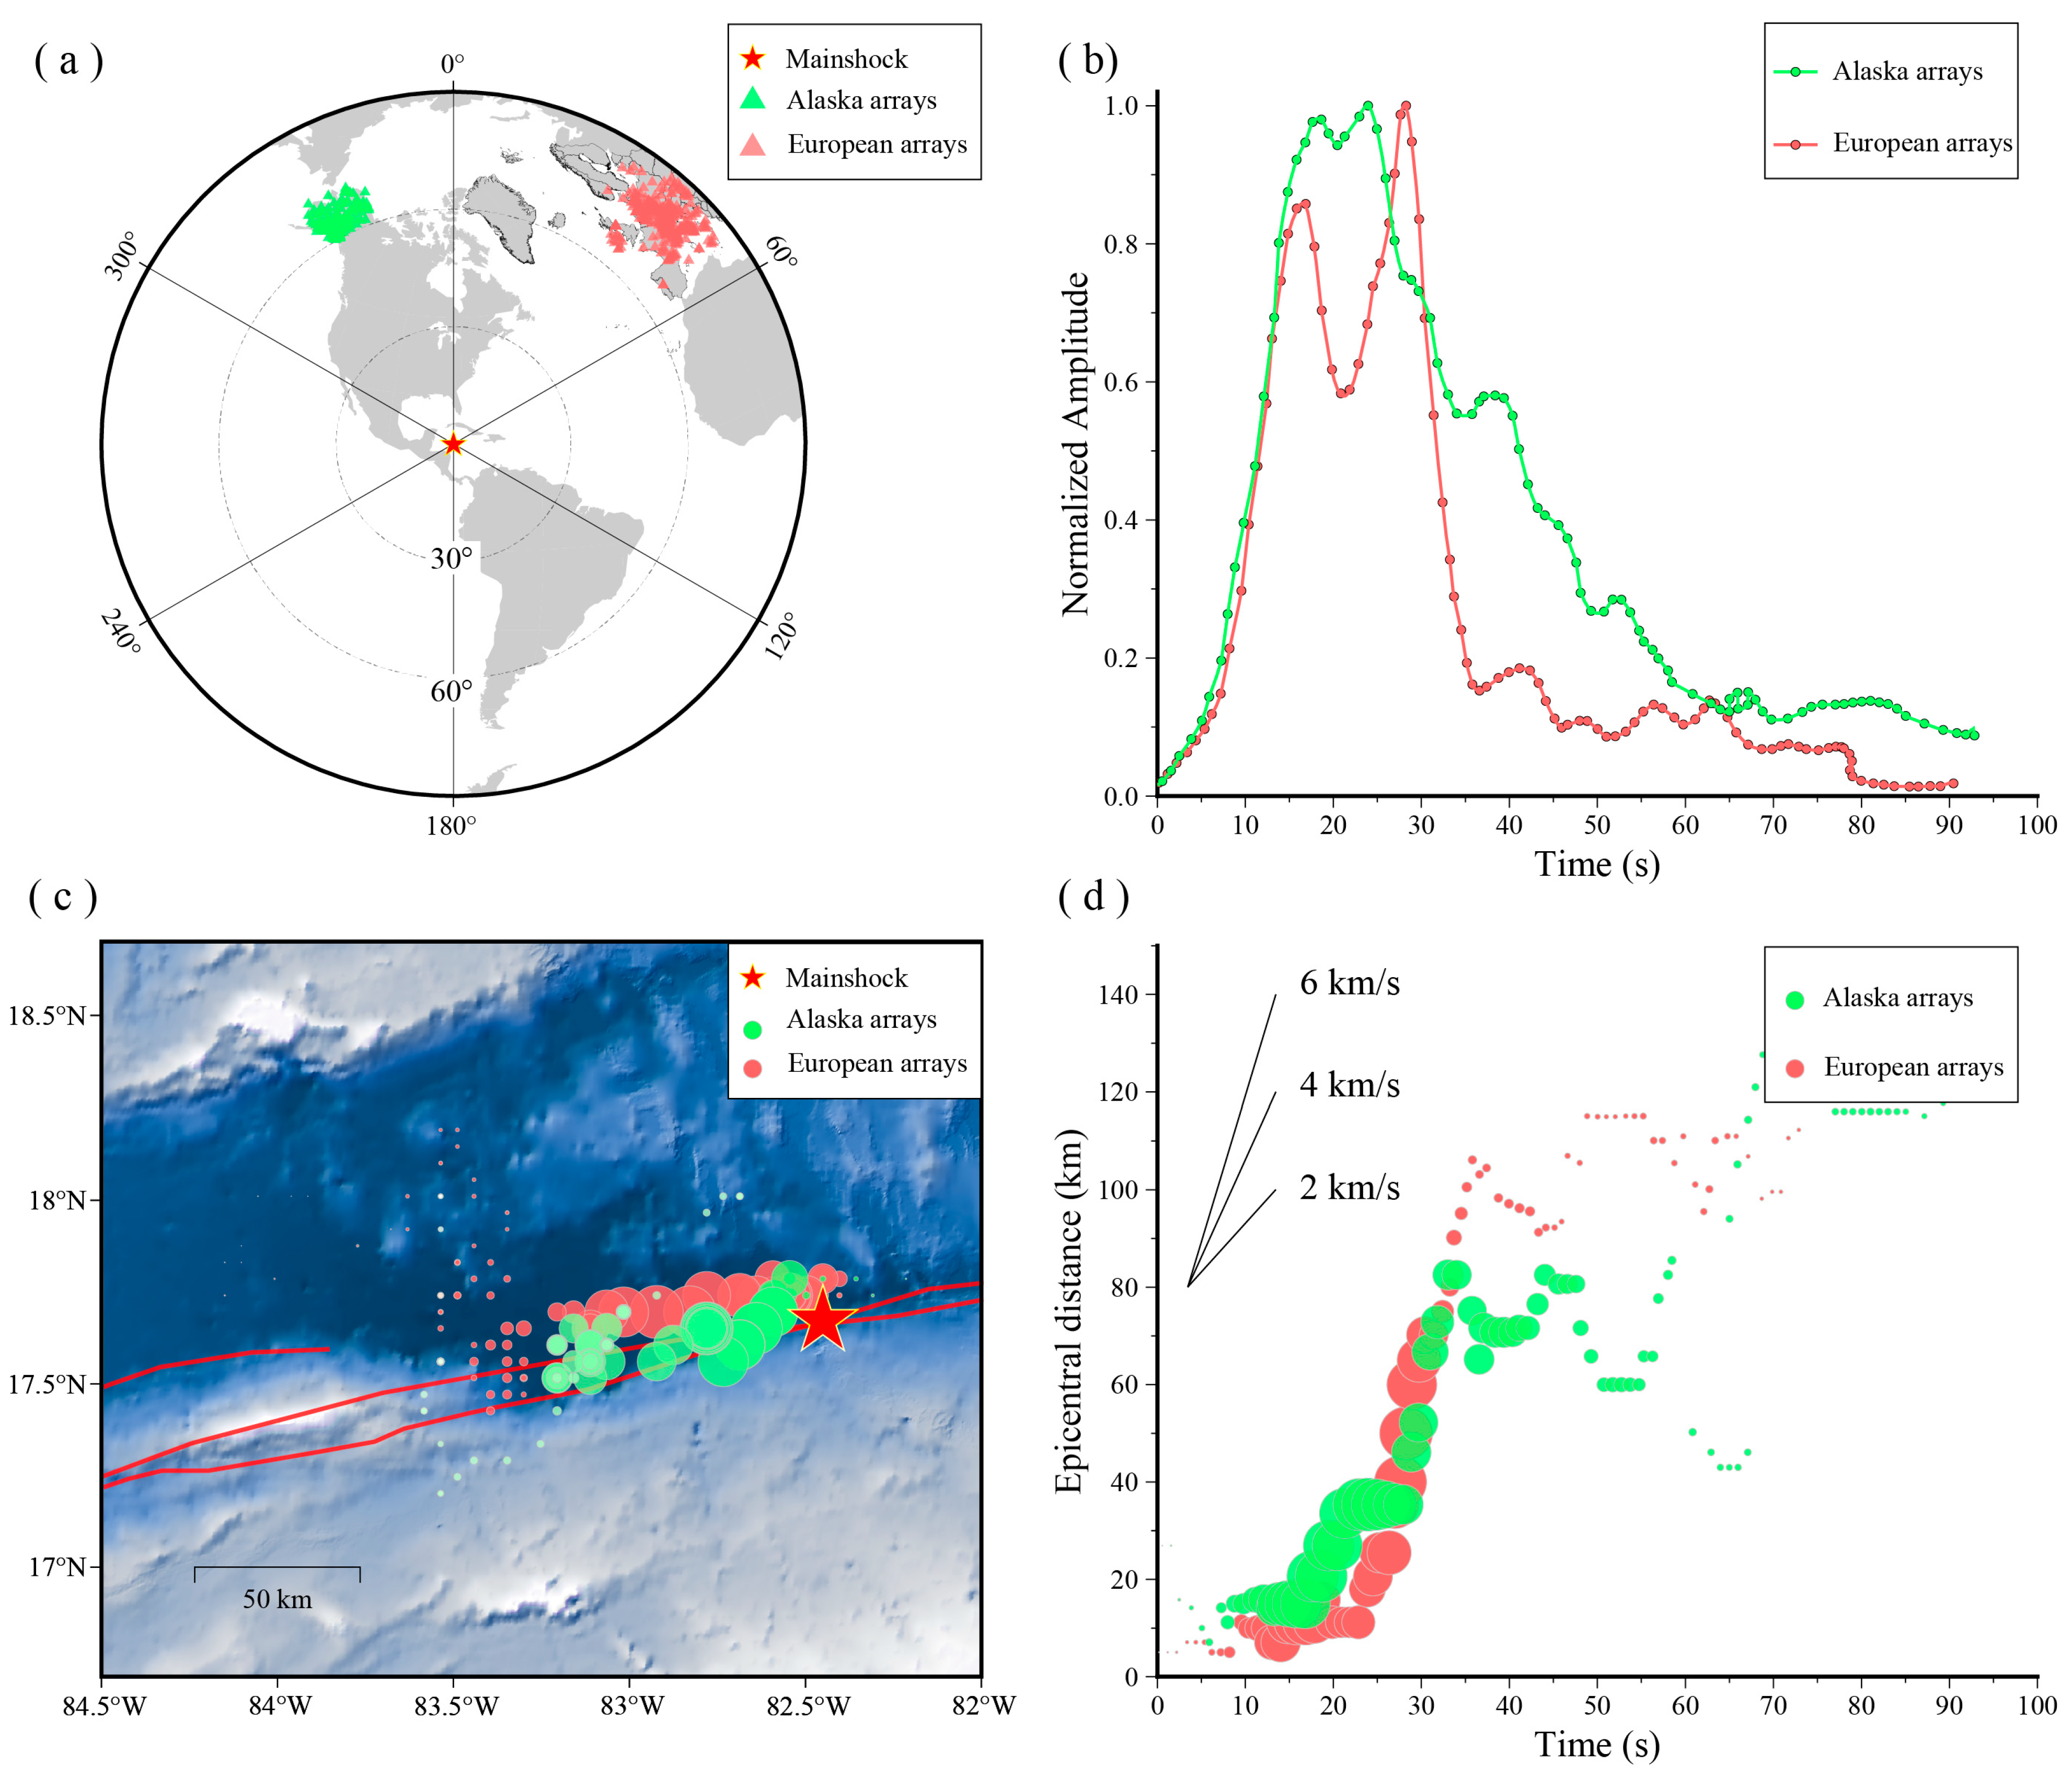
We applied teleseismic back-projection (BP) to investigate the rupture process of the 8 February 2025 Mw 7.6 Cayman Trough earthquake [15]. Waveforms from the European and Alaska seismic arrays were used, providing complementary azimuthal coverage and dense station distribution (epicentral distances and azimuths: Alaska array 60–75°, −36–17°; European array 60–85°, 21–64°). This setup enables robust imaging of high-frequency radiation emitted from the rupture front and thus achieves detailed imaging of the earthquake rupture process, leading to new insights from case studies of a series of recent earthquakes [16,17,18,19,20].

2.2. Back-Projection Method

The back-projection method maps high-frequency seismic energy by summing time-shifted waveforms on a predefined source grid.
Following Wang et al. [16], waveforms were preprocessed by removing the instrument response and applying a 0.5–2.0 Hz bandpass filter, which is sensitive to high-frequency radiation near the rupture front. For teleseismic observations, direct P-wave arrivals were used to compute theoretical travel times from each grid point to each station [21]. To correct for travel-time errors induced by local heterogeneities beneath each station, we computed station corrections via cross-correlation using the first 6 s of the direct P-wave. Stations with low correlation coefficients were excluded to ensure coherent stacking of the waveforms. After applying station corrections and theoretical travel times, waveforms were stacked within sliding time windows.
In this study, we used a 10 s time window with a 1 s sliding step, resulting in 100 consecutive windows. The stacking amplitude for each window was defined as the squared sum of the stacked waveforms, enhancing coherent energy while suppressing noise. The resulting amplitudes were projected onto the source grid to determine the spatiotemporal distribution of high-frequency radiation. To account for apparent time shifts caused by rupture directivity, we applied corrections following Krüger and Ohrnberger (2005) [17], ensuring consistency of rupture evolution across different arrays.

2.3. Back-Projection Results

As shown in Figure 2, back-projection results from the European and Alaska arrays are highly consistent, indicating robust imaging. Both arrays reveal that the rupture propagated predominantly westward along the Swan Islands Transform Fault, with a total duration of ~40–50 s and a rupture length of 80–100 km.
The rupture evolution exhibits a clear two-stage pattern:
  • The initial ~20 s corresponds to a sub-shear phase, with an average rupture speed of ~1 km/s.
  • In the subsequent stage, the rupture accelerates significantly, reaching supershear speeds of ~5–6 km/s.
According to the CRUST1.0 model [22], the S-wave velocity at the source depth (~10 km) is ~2.55 km/s. The later-stage rupture clearly exceeds this shear-wave velocity, satisfying the classical supershear rupture criterion, where the rupture front velocity exceeds the local S-wave speed [23,24]. Therefore, the 2025 Cayman Trough earthquake underwent a transition from an initial sub-shear phase to a subsequent supershear stage, highlighting significant temporal variation in the rupture dynamics along the Swan Islands Transform Fault.

3. Finite-Fault Inversion

To further constrain the low-frequency coseismic slip distribution and moment release of the 8 February 2025 Mw 7.6 Cayman Trough earthquake, we conducted finite-fault inversion (FFI) using broadband teleseismic P-waveforms from the Global Seismographic Network (GSN) based on the MuDpy framework [25]. MuDpy, developed as an improvement on classical finite-fault inversion, introduces regularization constraints, time-window segmentation, and moment tensor parameterization to enhance stability and reproducibility.
Guided by the back-projection results, we constructed a finite-fault model along the strike of the Swan Islands Transform Fault, discretized into 27 × 4 subfaults (5 km × 4 km each). The source-time function (STF) for each subfault was represented by a triangular function with a half-duration of 1.5 s, and slip variations over time were constrained using four consecutive time windows to improve temporal resolution. To increase inversion robustness, we applied a priori rupture speed constraints informed by back-projection: an initial maximum Vr of 1 km/s for the first ~20 s within ~20 km of the rupture front, and another higher maximum Vr of 6 km/s in later stages [26].

3.1. Data and Method

Teleseismic P-waveforms at epicentral distances of 30–90° were used for waveform fitting. Each waveform was corrected for instrument response, filtered, and time-aligned. Slip and rupture initiation times for each subfault were solved via least-squares fitting of observed waveforms to synthetic waveforms generated for each subfault using the corresponding moment tensor [21,27,28].

3.2. Inversion Results

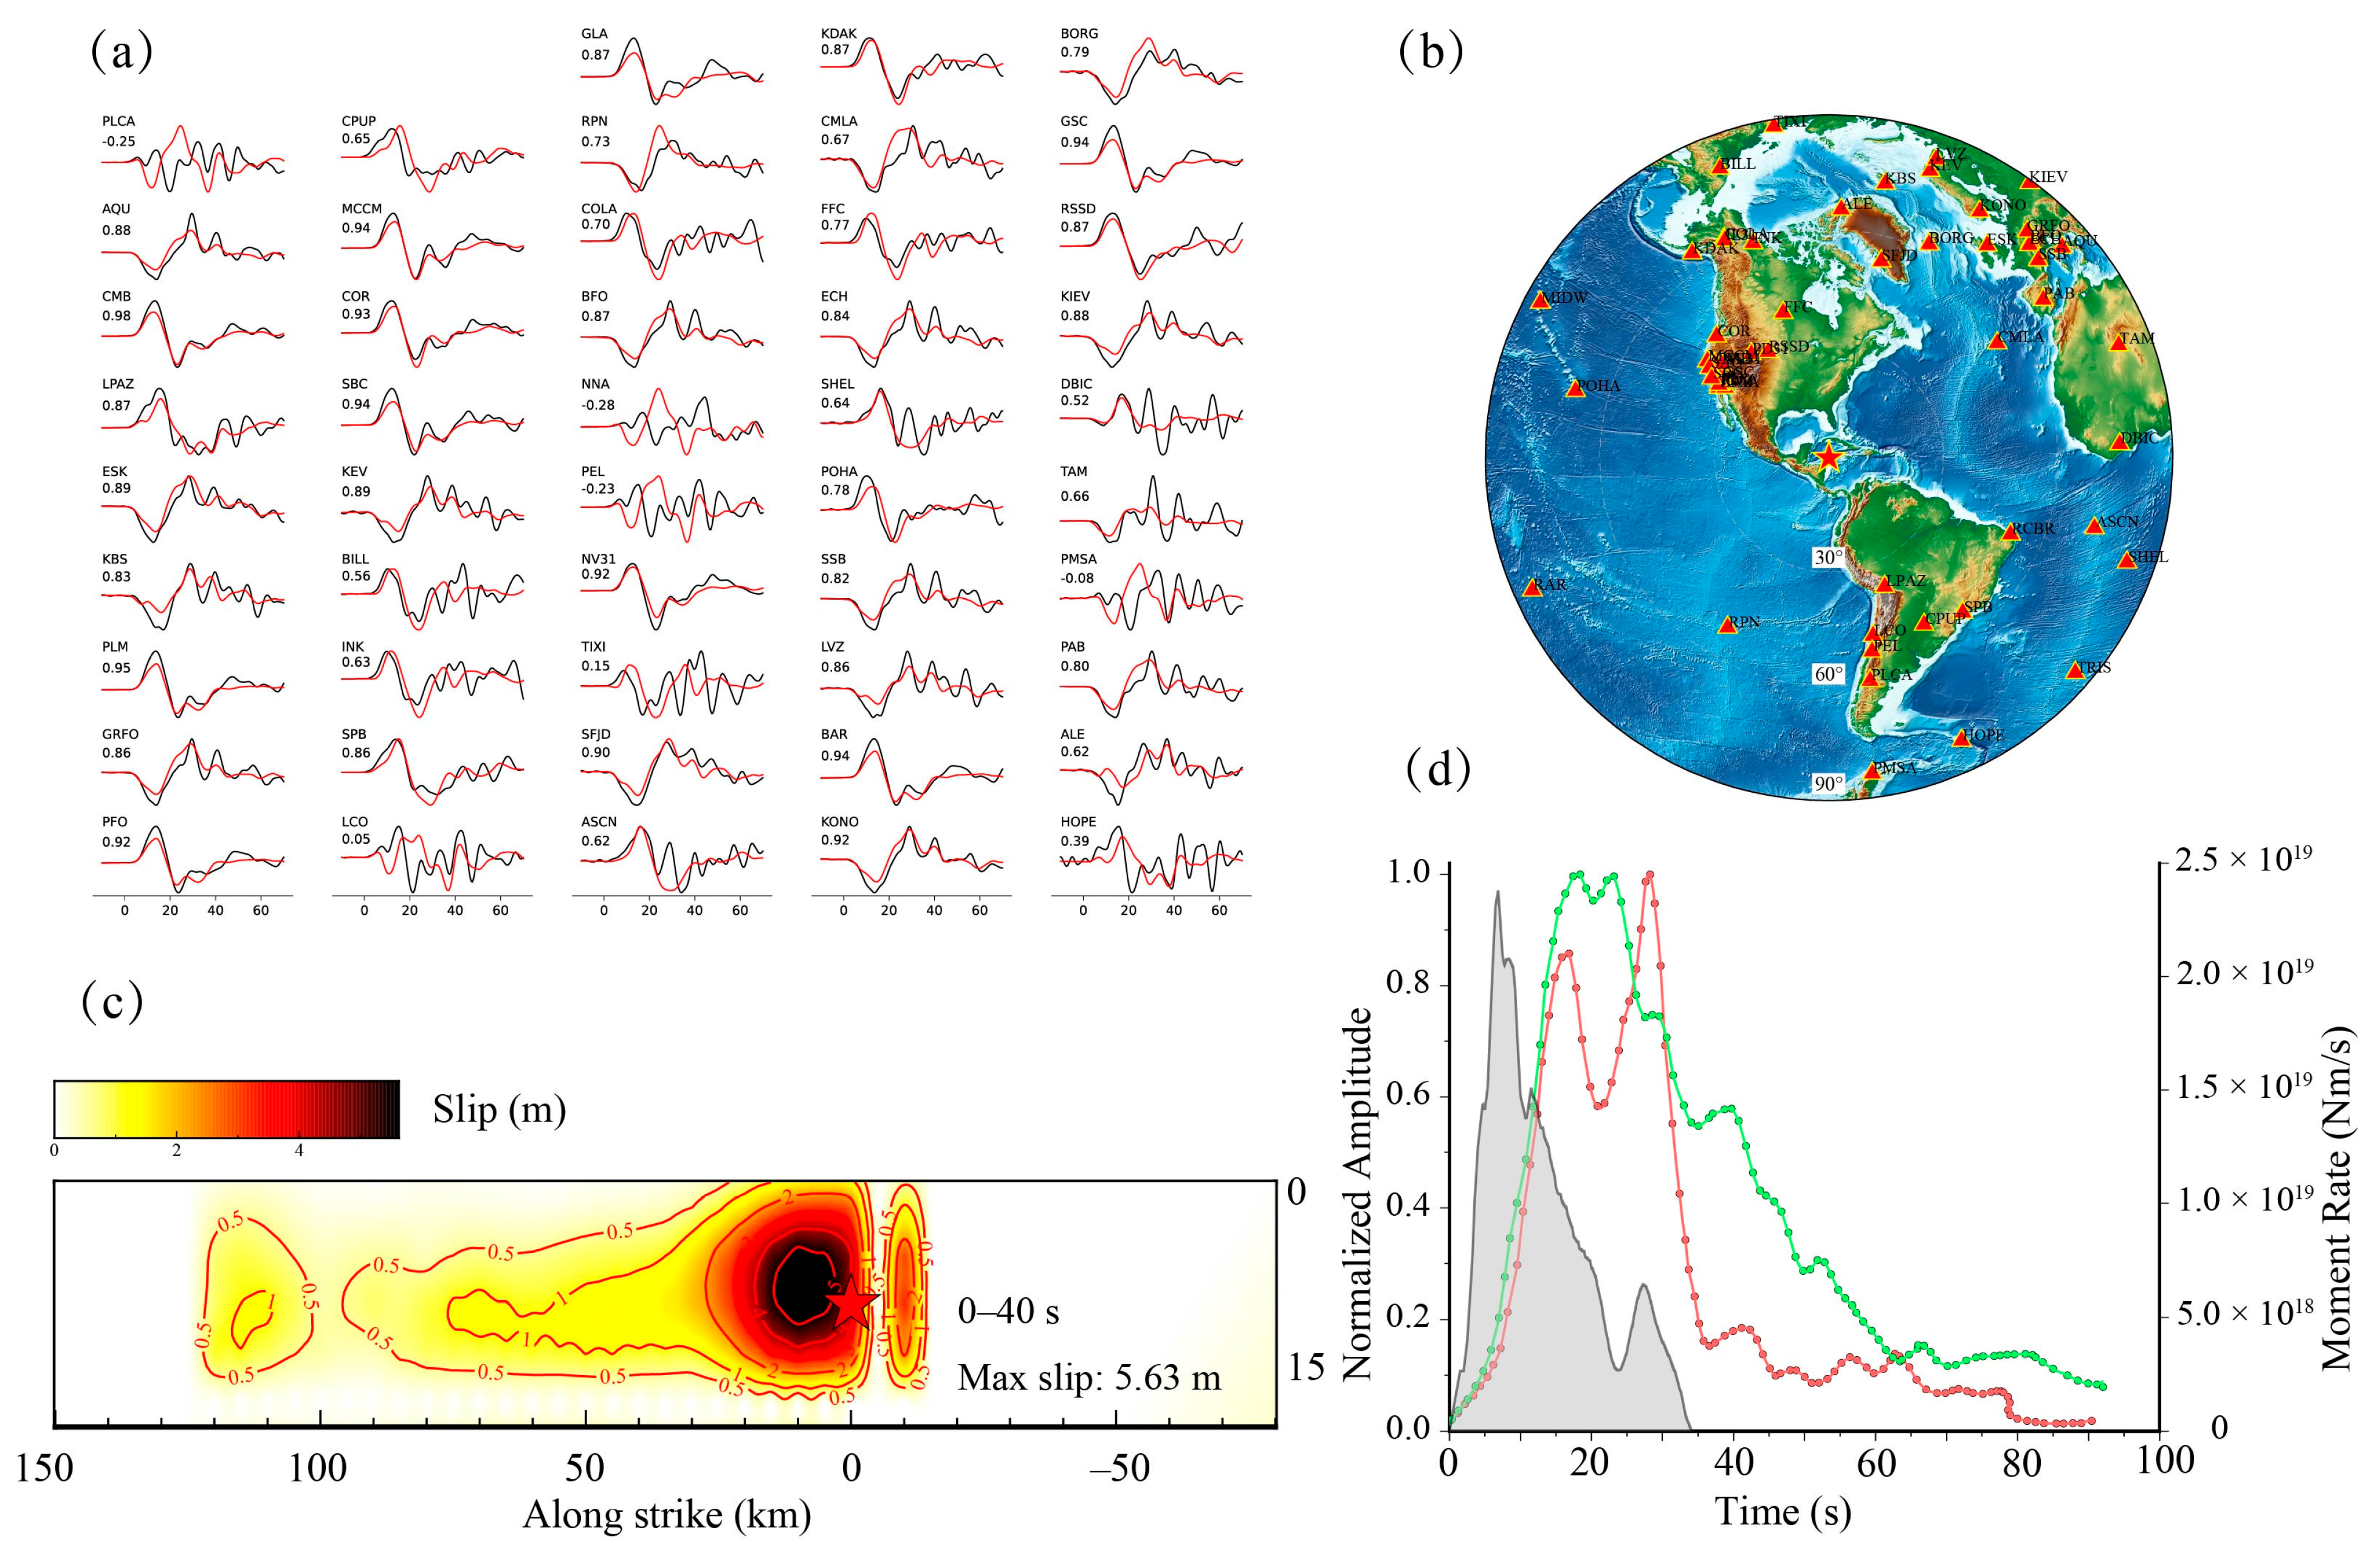
The FFI successfully reproduces the observed teleseismic P-waveforms (Figure 3a,b). The final slip distribution (Figure 3c) shows a maximum slip of ~5.6 m, concentrated within ~20 km west of the epicenter, indicating that the seismic moment release occurred primarily in the shallow main fault segment. The STF derived from FFI (Figure 3d, gray curve) peaks at ~10 s, with an overall rupture duration of ~40 s. Comparison with the back-projection results (red and green curves, European and Alaska arrays, respectively) indicates that high-frequency energy peaks later (~20 s), suggesting that low-frequency slip dominates the early rupture stage.

3.3. Spatiotemporal Rupture Evolution

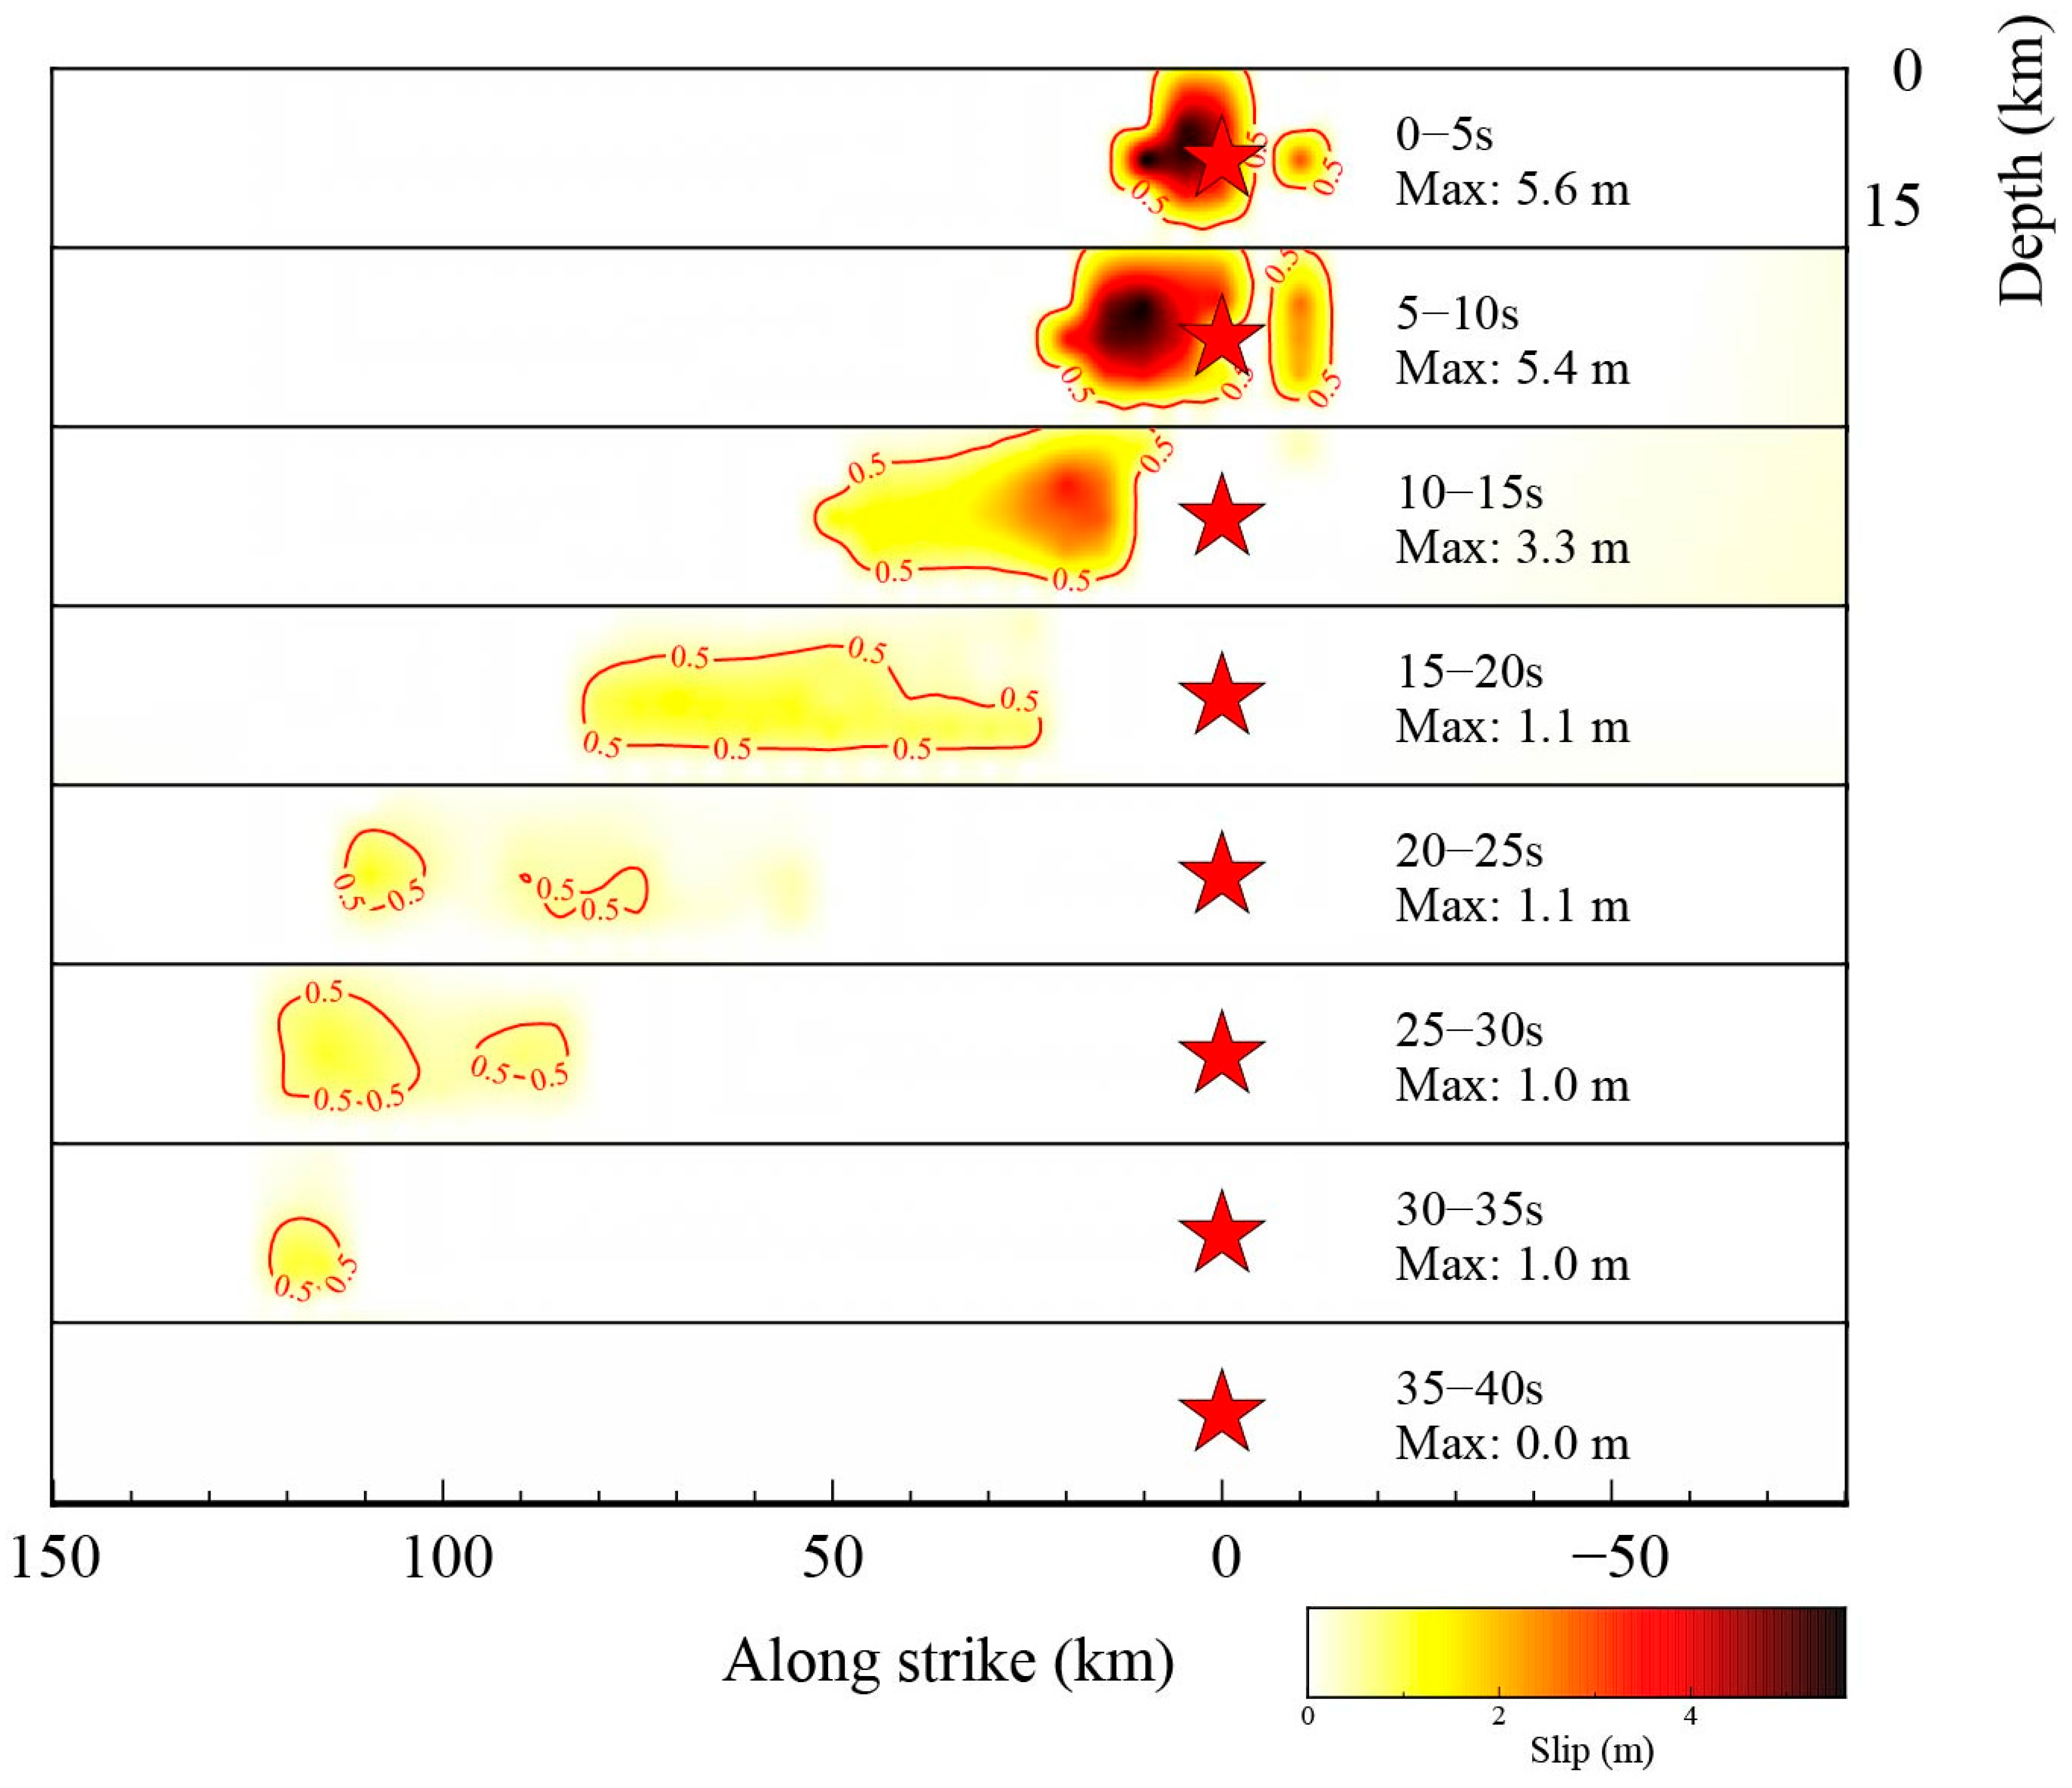
Figure 4 presents rupture snapshots at successive 5 s intervals. During 0–5 s, rupture initiates near the epicenter with maximum slip 5.6 m and propagates ~10 km westward. Between 5 and 10 s, the rupture advances another ~10 km with peak slip 5.4 m. From 10 to 15 s, maximum slip decreases to 3.3 m while the rupture front reaches ~50 km west. Between 15 and 20 s, slip further reduces (~1.1 m), and the rupture front extends to ~80 km. During 20–30 s, rupture propagation slows, with maximum slip decreasing from ~1.1 m to ~1.00 m and the rupture front reaching ~110 km west. After 30 s, maximum slip amplitudes drop below ~1 m, and rupture arrests at ~120 km west of the epicenter. The inferred rupture speed ranges from ~1 km/s for the initial stage to ~6 km/s for the later stage, indicating a similar accelerating process as shown in the back-projection results.

4. Discussion

Our finite-fault inversion reveals a clear along-strike trade-off between slip amplitude and rupture speed. The largest slip (~5 m) is concentrated within ~20 km of the hypocenter, where rupture velocity is slow (~1 km/s). West of this zone, rupture accelerates to 5–6 km/s over a ~100 km segment but produces comparatively modest slip. Such spatial anti-correlation is consistent with global observations indicating that rupture velocity can be inversely related to stress-drop-related source properties [29].
This behavior can be interpreted within the framework of energy balance at the rupture front. Rupture speed depends on the ratio between the available driving energy (linked to prestress and elastic properties) and the fracture energy dissipated during rupture, including breakdown work and off-fault damage. Variations in this ratio can explain the full spectrum of rupture velocities: higher driving stress or lower effective fracture energy promotes faster propagation, whereas higher fracture energy slows rupture [30]. The hypocentral high-slip patch may therefore represent a mechanically strong nucleation or asperity region, where elevated breakdown work, geometric complexity, or material heterogeneity increases energy dissipation and limits rupture speed, even though substantial slip ultimately accumulates once weakening is fully activated. Improved sub-seafloor velocity constraints would help further quantify these effects [31].
The rapid but low-slip western segment may reflect a transition from crack-like rupture near the hypocenter to pulse-like rupture during fast propagation. Crack-like rupture is associated with long slip duration and large final slip, whereas pulse-like rupture involves short slip duration and rapid restrengthening. Self-healing slip pulses, predicted by rate-and-state friction models [32] and supported by laboratory and theoretical studies [33], can propagate efficiently while limiting accumulated slip because the fault heals quickly behind the rupture front. In this regime, high rupture speed is compatible with modest slip due to shortened rise time.
Overall, the rupture evolution suggests a cascading process: an initial slow, high-slip nucleation phase redistributes stress and dynamically loads adjacent segments, followed by rapid propagation through a mechanically favorable corridor. Importantly, large slip and fast rupture need not coincide spatially. Slip reflects the time-integrated history of weakening at a point, whereas rupture speed reflects the instantaneous energy balance at the rupture tip. Future inversions incorporating spatially variable rise time and explicit testing of crack-like versus pulse-like models will help determine whether the fast segment is governed by short-duration, self-healing slip dynamics [34].

5. Conclusions

We investigated the rupture characteristics of the 8 February 2025 Mw 7.6 Cayman Trough earthquake through a joint analysis of teleseismic back-projection and finite-fault inversion. The rupture advanced predominantly westward along the Swan Islands Transform Fault and exhibited clear changes in propagation behavior over the course of the event. An initially slow rupture phase, lasting approximately 20 s with a velocity of ~1 km/s, transitioned into a rapidly propagating segment that reached velocities of 5–6 km/s, exceeding the local shear-wave speed. Slip distribution inferred from waveform inversion indicates that deformation was strongly localized near the hypocentral region, with the largest slip (~5.6 m) confined to a narrow zone within ~20 km west of the epicenter. In contrast, the later portion of the rupture extended farther along strike but was associated with much smaller slip. The temporal correspondence between rupture kinematics and frequency-dependent radiation shows that the majority of the seismic moment was released during the early, slower phase, whereas the acceleration stage was marked by enhanced high-frequency energy despite limited additional slip.
These observations document a clear along-strike complementarity between rupture speed and slip amplitude, reflecting systematic changes in rupture behavior along the fault. Such contrasts likely arise from spatial variations in fault properties, including strength, fracture energy, and geometric or structural complexity. By integrating high-frequency and low-frequency seismic constraints, this study provides a refined depiction of rupture evolution for an offshore strike-slip earthquake and contributes to a better understanding of supershear rupture processes along oceanic transform faults.

Author Contributions

Conceptualization, H.Z., D.W.; methodology, H.Z., D.W., Y.P. and Z.W., software, H.Z.; formal analysis, H.Z.; investigation, H.Z.; writing—original draft preparation, H.Z.; writing—review and editing, D.W., Y.P., Z.W., Z.Z., K.G. and Y.Y.; visualization, H.Z., Z.Z. and S.T.; supervision, D.W. All authors have read and agreed to the published version of the manuscript.

Funding

This research was supported by the National Key Research and Development Project of China grant 2023YFC3007303 (D.W.), the National Natural Science Foundation of China (NSFC) grants 42330309 (D.W.), 41874062 (D.W.), and 41922025 (D.W.).

Data Availability Statement

The seismic waveform and earthquake source data supporting the findings of this study were obtained from the EarthScope Consortium Wilber3 system and are publicly available at https://ds.iris.edu/wilber3 (accessed on 9 December 2025).

Acknowledgments

All seismic data were downloaded through the EarthScope Consortium Wilber3 system (https://ds.iris.edu/wilber3, last accessed 9 December 2025). The Earthquake Catalog data were obtained from the U.S. Geological Survey (USGS; https://earthquake.usgs.gov/earthquakes/, accessed on 9 December 2025). Figures were generated using the Generic Mapping Tools (GMT) version 6.5. Finite-fault inversions were performed following the methodology of Melgar et al. [25].

Conflicts of Interest

The authors declare no conflicts of interest.

References

  1. Calais, É.; Symithe, S.; de Lépinay, B.M.; Prépetit, C. Plate boundary segmentation in the northeastern Caribbean from geodetic measurements and Neogene geological observations. Comptes Rendus-Géosci. 2016, 348, 42–51. [Google Scholar] [CrossRef]
  2. Peirce, C.; Grevemeyer, I.; Hayman, N.W.; Van Avendonk, H.J.A. Active ocean–continent transform margins: Seismic investigation of the Cayman Trough-Swan Island ridge-transform intersection. Geophys. J. Int. 2022, 229, 1604–1627. [Google Scholar] [CrossRef]
  3. Plafker, G. Tectonic aspects of the Guatemala earthquake of 4 February 1976. Science 1976, 193, 1201–1208. [Google Scholar] [CrossRef]
  4. Calais, E.; Delouis, B.; Ampuero, J.-P.; Bao, H.; Courboulex, F.; Deschamps, A.; De Lépinay, B.; Monfret, T.; Meng, L.; Xu, L.; et al. The 28 January 2020, Mw7. 7, Cayman Trough/Oriente Fault, Supershear Earthquake Rupture. Seismica 2025, 4, 1815. [Google Scholar] [CrossRef]
  5. Rosencrantz, E.; Mann, P. SeaMARC II mapping of transform faults in the Cayman Trough, Caribbean Sea. Geology 1991, 19, 690–693. [Google Scholar] [CrossRef]
  6. Leroy, S.; Mauffret, A.; Patriat, P.; Mercier de Lépinay, B. An alternative interpretation of the Cayman trough evolution from a reidentification of magnetic anomalies. Geophys. J. Int. 2000, 141, 539–557. [Google Scholar] [CrossRef]
  7. Connelly, D.P.; Copley, J.T.; Murton, B.J.; Stansfield, K.; Tyler, P.A.; German, C.R.; Van Dover, C.L.; Amon, D.; Furlong, M.; Grindlay, N.; et al. Hydrothermal vent fields and chemosynthetic biota on the world’s deepest seafloor spreading centre. Nat. Commun. 2012, 3, 620. [Google Scholar] [CrossRef]
  8. Hayman, N.W.; Grindlay, N.R.; Perfit, M.R.; Mann, P.; Leroy, S.; de Lépinay, B.M. Oceanic core complex development at the ultraslow spreading Mid-Cayman Spreading Center. Geochem. Geophys. Geosyst. 2011, 12, AG02. [Google Scholar] [CrossRef]
  9. Mann, P.; Calais, E.; Ruegg, J.; DeMets, C.; Jansma, P.E.; Mattioli, G.S. Oblique collision in the northeastern Caribbean from GPS measurements and geological observations. Tectonics 2002, 21, 1057. [Google Scholar] [CrossRef]
  10. Mann, P. Global catalogue, classification and tectonic origins of restraining- and releasing bends on active and ancient strike-slip fault systems. Geol. Soc. Lond. Spec. Publ. 2007, 290, 13–142. [Google Scholar] [CrossRef]
  11. Sibson, R.H. Earthquakes and rock deformation in crustal fault zones. Annu. Rev. Earth Planet. Sci. 1986, 14, 149. [Google Scholar] [CrossRef]
  12. Chen, W.; Wu, J.; Rao, G.; Li, X.; Chen, L.; Peng, Y.; Zhang, Z.; Yi, M.; Sun, Y. Rapid Post-Earthquake Impact and Recovery Assessment: The 2025 M w 7.7 Myanmar Earthquake. J. Earth Sci. 2025, 36, 2380–2386. [Google Scholar] [CrossRef]
  13. Bai, C.; Xu, W.; Zhao, L.; Sun, K.; Xie, L. 3D coseismic deformation and fault slip model of the 2023 Kahramanmaraş earthquake sequence constrained by GPS, ALOS-2 and Sentinel-1 data. J. Earth Sci. 2025, 36, 812–822. [Google Scholar] [CrossRef]
  14. Zhang, P.-Z. A review on active tectonics and deep crustal processes of the Western Sichuan region, eastern margin of the Tibetan Plateau. Tectonophysics 2013, 584, 7–22. [Google Scholar] [CrossRef]
  15. Wang, D.; Mori, J. Rupture process of the 2011 off the Pacific coast of Tohoku Earthquake (M w 9.0) as imaged with back-projection of teleseismic P-waves. Earth Planets Space 2011, 63, 17. [Google Scholar] [CrossRef]
  16. Wang, D.; Kawakatsu, H.; Mori, J.; Ali, B.; Ren, Z.; Shen, X. Backprojection analyses from four regional arrays for rupture over a curved dipping fault: The Mw 7.7 24 September 2013 Pakistan earthquake. J. Geophys. Res. Solid Earth 2016, 121, 1948–1961. [Google Scholar] [CrossRef]
  17. Krüger, F.; Ohrnberger, M. Tracking the rupture of the M w = 9.3 Sumatra earthquake over 1150 km at teleseismic distance. Nature 2005, 435, 937–939. [Google Scholar] [CrossRef]
  18. Ishii, M.; Shearer, P.M.; Houston, H.; Vidale, J.E. Extent, duration and speed of the 2004 Sumatra–Andaman earthquake imaged by the Hi-Net array. Nature 2005, 435, 933–936. [Google Scholar] [CrossRef]
  19. Yao, H.; Shearer, P.M.; Gerstoft, P. Subevent location and rupture imaging using iterative backprojection for the 2011 Tohoku M w 9.0 earthquake. Geophys. J. Int. 2012, 190, 1152–1168. [Google Scholar] [CrossRef]
  20. Vera, F.; Tilmann, F.; Saul, J. A decade of short-period earthquake rupture histories from multi-array back-projection. J. Geophys. Res. Solid Earth 2024, 129, e2023JB027260. [Google Scholar] [CrossRef]
  21. Kennett, B.L.N.; Engdahl, E.R. Traveltimes for global earthquake location and phase identification. Geophys. J. Int. 1991, 105, 429–465. [Google Scholar] [CrossRef]
  22. Laske, G.; Masters, G.; Ma, Z.; Pasyanos, M. Update on CRUST1.0—A 1-degree global model of Earth’s crust. Geophys. Res. Abstr. 2013, 15, 2658. [Google Scholar]
  23. Andrews, D. Rupture propagation with finite stress in antiplane strain. J. Geophys. Res. 1976, 81, 3575–3582. [Google Scholar] [CrossRef]
  24. Bizzarri, A.; Spudich, P. Effects of supershear rupture speed on the high-frequency content of S waves investigated using spontaneous dynamic rupture models and isochrone theory. J. Geophys. Res. Solid Earth 2008, 113, B05304. [Google Scholar] [CrossRef]
  25. Melgar, D.; Fan, W.; Riquelme, S.; Geng, J.; Liang, C.; Fuentes, M.; Vargas, G.; Allen, R.M.; Shearer, P.M.; Fielding, E.J. Slip segmentation and slow rupture to the trench during the 2015, Mw8. 3 Illapel, Chile earthquake. Geophys. Res. Lett. 2016, 43, 961–966. [Google Scholar] [CrossRef]
  26. Razafindrakoto, H.N.; Mai, P.M.; Genton, M.G.; Zhang, L.; Thingbaijam, K.K.S. Quantifying variability in earthquake rupture models using multidimensional scaling: Application to the 2011 Tohoku earthquake. Geophys. J. Int. 2015, 202, 17–40. [Google Scholar] [CrossRef][Green Version]
  27. Kikuchi, M.; Kanamori, H. Inversion of complex body waves-II. Phys. Earth Planet. Inter. 1986, 43, 205–222. [Google Scholar] [CrossRef]
  28. Tocheport, A.; Rivera, L.; Chevrot, S. A systematic study of source time functions and moment tensors of intermediate and deep earthquakes. J. Geophys. Res. Solid Earth 2007, 112, B07311. [Google Scholar] [CrossRef]
  29. Chounet, A.; Vallée, M.; Causse, M.; Courboulex, F. Global catalog of earthquake rupture velocities shows anticorrelation between stress drop and rupture velocity. Tectonophysics 2018, 733, 148–158. [Google Scholar] [CrossRef]
  30. Weng, H.; Ampuero, J.-P. Integrated rupture mechanics for slow slip events and earthquakes. Nat. Commun. 2022, 13, 7327. [Google Scholar] [CrossRef]
  31. Chen, G.; Li, J.; Chen, J.; Du, R.; Liu, Y.; Qi, Y.; Li, C.F.; Huang, X. High-Precision Sub-Seafloor Velocity Building Based on Joint Tomography and Deep Learning on OBS Data in the South China Sea. J. Earth Sci. 2025, 36, 830–834. [Google Scholar] [CrossRef]
  32. Beeler, N.M.; Tullis, T.E. Self-healing slip pulses in dynamic rupture models due to velocity-dependent strength. Bull. Seismol. Soc. Am. 1996, 86, 1130–1148. [Google Scholar] [CrossRef]
  33. Lu, X.; Lapusta, N.; Rosakis, A.J. Pulse-like and crack-like ruptures in experiments mimicking crustal earthquakes. Proc. Natl. Acad. Sci. USA 2007, 104, 18931–18936. [Google Scholar] [CrossRef] [PubMed]
  34. Ampuero, J.P.; Rubin, A.M. Earthquake nucleation on rate and state faults–Aging and slip laws. J. Geophys. Res. Solid Earth 2008, 113, B01302. [Google Scholar] [CrossRef]
Figure 1. Seismicity and tectonic setting of the source region of the 8 February 2025 Mw 7.6 Cayman Trough earthquake. Blue circles indicate historical earthquakes with magnitudes ≥ 2.5 recorded between 1 January 1900 and 8 February 2025, while yellow circles represent aftershocks with magnitudes ≥ 2.5 occurring between 8 February 2025 and 8 August 2025, based on the USGS earthquake catalog. Circle sizes are scaled according to earthquake magnitude. The red star marks the epicenter of the mainshock as determined by the USGS. Red thin lines delineate plate boundaries, and red arrows denote the relative plate motion between the North American and Caribbean plates. Major tectonic structures, including the Swan Islands Transform Fault, the Mid-Cayman Spreading Center, and the Oriente Transform Fault, are labeled for reference.
Jmse 14 00479 g001
Figure 2. Teleseismic back-projection analysis of the 8 February 2025 Mw 7.6 Cayman Trough earthquake. (a) Distribution of seismic stations used in the analysis. Red circles: European array; green circles: Alaska array; red star: USGS epicenter. (b) Source time functions derived from stacked amplitudes. Red/green lines: European/Alaska arrays, showing relative energy release. (c) Spatiotemporal evolution of the rupture front. Red/green circles: locations of maximum stack amplitude; red star: epicenter. (d) Rupture speed along the fault derived from time–distance slopes. Red/green circles: European/Alaska arrays. Note: Initial slow rupture (~1 km/s) in the first 20 s, followed by acceleration to supershear speeds (~5–6 km/s).
Jmse 14 00479 g002
Figure 3. Finite-fault inversion results of the 8 February 2025 Mw 7.6 Cayman Trough Earthquake. (a) Observed (black) and synthetic (red) teleseismic P-waveforms used in the inversion, showing good waveform fitting across the Global Seismographic Network (GSN). (b) Distribution of teleseismic stations employed in the inversion, with epicentral distances ranging from 30° to 90°. Red triangles denote station locations, and the red star marks the USGS-determined epicenter. (c) Final slip distribution obtained from finite-fault inversion. Maximum cumulative slip reaches ~5.6 m, primarily concentrated within ~20 km west of the epicenter. (d) Source-time functions (STFs) derived from different methods. Gray curve: STF from finite-fault inversion, showing a dominant peak at ~10 s and overall rupture duration of ~40 s. Red and green curves: high-frequency back-projection results from the European and Alaska arrays, peaking later (~20 s) and decaying gradually.
Jmse 14 00479 g003
Figure 4. Spatiotemporal snapshots of rupture propagation from finite-fault inversion along the Swan Islands Transform Fault. Red star: epicenter; red thin lines: slip contours of 0.5 m. Snapshots are shown at successive 5 s intervals.
Jmse 14 00479 g004
Disclaimer/Publisher’s Note: The statements, opinions and data contained in all publications are solely those of the individual author(s) and contributor(s) and not of MDPI and/or the editor(s). MDPI and/or the editor(s) disclaim responsibility for any injury to people or property resulting from any ideas, methods, instructions or products referred to in the content.