Article

Analysis and Evaluation of the Impact of Sea-Level Rise on Storm Surges in the Guangdong–Hong Kong–Macao Greater Bay Area

1
South China Sea Marine Forecast and Hazard Mitigation Center, Ministry of Natural Resources (MNR), Guangzhou 510310, China
2
Key Laboratory of Marine Environmental Survey Technology and Application, Ministry of Natural Resources (MNR) & Nansha Islands Coral Reef Ecosystem National Observation and Research Station, Guangzhou 510300, China
3
School of Marine Sciences, Southern Marine Science and Engineering Guangdong Laboratory (Zhuhai), Sun Yat-sen University, Zhuhai 519082, China
4
South China Sea Ecological Center, Ministry of Natural Resources (MNR), Guangzhou 510300, China
*
Authors to whom correspondence should be addressed.
J. Mar. Sci. Eng. 2026, 14(4), 330; https://doi.org/10.3390/jmse14040330
Submission received: 17 December 2025 / Revised: 29 January 2026 / Accepted: 3 February 2026 / Published: 9 February 2026
(This article belongs to the Section Physical Oceanography)

Abstract

Sea-level rise (SLR), a climate hazard driven by global warming, poses a severe threat to low-lying coastal regions when combined with strong typhoons and storm surges, endangering human lives and socio-economic development. The Guangdong–Hong Kong–Macao Greater Bay Area (GBA) is a core strategic zone for China’s economic development and is increasingly affected by such compound hazards, exacerbating its storm-related disasters amid climate change. Here, we analyze long-term observational data from the GBA using mathematical statistics and simulation methods to address these climate-related challenges. This study predicts future scenarios of extreme water levels in the Guangdong–Hong Kong–Macao Greater Bay Area (GBA), aiming to assess the hazard posed by storm surge disasters under varied sea-level rise (SLR) scenarios. The findings indicate that, under future climate projections, both the extreme water levels in the GBA and the hazard of storm surge disasters in its floodplain areas will exhibit a significant upward trend—with the degree of hazard amplification positively correlated with the magnitude of SLR. This study provides a scientific basis to improve the accuracy of extreme water-level prediction, supporting more reliable short-term early flood warnings. It also offers guidance for optimizing SLR-adapted coastal zone spatial planning, guiding the layout of storm surge control projects and land use in high-hazard areas. Additionally, our results fill a gap in the literature on the SLR’s impact in the GBA and support decision-makers in the GBA in building climate resilience and mitigating disaster hazards.

1. Introduction

Typhoon disasters are occurring at increasing rates [1,2,3]. Characterized by intense winds, high waves, and significant destructive power, they have become one of the most severe natural disasters impacting the GBA. Research on the characteristics of typhoon-induced storm surges in the GBA [4] began in the 1980s [5,6]. Leveraging historical tidal level data from 1949 to 1980, He Hongju [7] conducted a preliminary exploration of the features and underlying mechanisms of storm surges in the Pearl River Estuary. Following this, Lu Ruxiu and colleagues [8,9,10] leveraged historical tidal level datasets to study the patterns of maximum storm surge amplification in the Pearl River Estuary and the characteristics of longitudinal storm surge amplification. Additionally, numerous researchers have turned their attention to individual typhoons that land in the Greater Bay Area, conducting detailed discussions of both the characteristics of the storm surges induced by these typhoons and the impacts they have [11,12,13]. Notably, with the ongoing advancement of numerical simulation technology, numerical models have been widely applied to unravel the mechanisms underlying storm surge effects [14,15,16,17].
Driven by global warming, sea-level rise (SLR) [18] is a critical hazard, characterized by its relatively slow rate of progression. This sluggishness often leads to their neglect in short-term risk assessment frameworks. However, when SLR interacts synergistically with other coastal hazards (such as storm surges) to trigger disasters, these hazards pose severe threats to human livelihoods, ecological security, and socio-economic development in low-lying coastal areas. Storm surges are recognized as one of the most destructive natural hazards, posing significant risks to low-lying coastal regions [19,20,21,22,23,24]. This combination has led to a notable increase in the frequency and severity of storm surge disasters, with far-reaching implications for socio-economic activities and human well-being. Against this backdrop, the potential impact of SLR on storm surges has become a core focus of marine scientific inquiry [25,26,27]. Zhao et al. [28] performed a simulation study to examine the influence of SLR on storm surges in the Yangtze River Estuary. Their results indicated that the extent to which SLR amplifies storm surges is relatively limited; instead, shifts in astronomical tides serve as the primary factor driving fluctuations in storm surge water levels. Ma et al. [29] conducted a comprehensive analysis of how SLR and changes in typhoon intensity affect storm surge dynamics and wave behavior along the Qingdao coast. They pointed out that in shallow nearshore zones, tides, storm-surge amplification, and wave responses are relatively sensitive to SLR, whereas distinct response patterns were observed within Jiaozhou Bay and along open coastlines. Zhang Min et al.’s [30] research on storm surge amplification in the Beibu Gulf showed that astronomical tides and the maximum drag force of typhoon wind fields are key determinants of high water levels, accounting for approximately 70% and 30%, respectively, of the highest recorded water levels. Furthermore, Hu Yaohui et al. [31] found that SLR not only alters astronomical tide levels but also affects peak water levels in storm surges, thereby creating new challenges for optimizing coastal flood control measures. With the advances in sea-level observations and modeling, recent progress has enabled SLR at different locations worldwide to be better explained and attributed [32,33,34,35,36,37,38].
Due to global climate warming, the global mean sea-level rise is exhibiting an accelerating upward trend, with the melting of polar ice caps identified as the primary driver. The global sea-level rise (SLR) rate between 1993 and 2023 has been quantified at 3.4 ± 0.3 mm/year [39]. Looking forward, as anthropogenic climate change persists, the GMSL is projected to continue rising, substantially amplifying the risk of extreme water-level events in numerous coastal zones worldwide. Notably, in Chinese marine territories in the northwestern Pacific Ocean, the SLR rate exhibits a more pronounced upward trajectory, reaching 4.0 mm/year—exceeding the concurrent global average. During the same observational window, the SLR rate in the South China Sea was recorded at 3.8 mm/year [40]. It has been established with high confidence that the GMSL rise throughout the 20th century outpaced that of any other century over the past three millennia. Findings from the Sixth Assessment Report (AR6) of the Intergovernmental Panel on Climate Change (IPCC) reveal that, relative to the 1995–2014 baseline period, under the low-emission scenario (SSP1-1.9), the global mean sea level is projected to rise by 0.18 m (95% CI: 0.15–0.23 m) by 2050 and by 0.38 m (0.28–0.55 m) by 2100; under the high-emission scenario (SSP5-8.5), the corresponding values are 0.23 m (0.20–0.29 m) and 0.77 m (0.63–1.01 m) by 2050 and 2100, respectively [24]. When ice sheet dynamics—a major source of uncertainty—are considered, the global mean sea-level rise (SLR) could potentially reach 2.0 m by 2100 and 5.0 m by 2150 under a high-emission scenario. Beyond this century, the increase in global mean sea level is projected to continue for centuries, primarily driven by two interconnected processes: the ongoing thermal expansion of seawater due to deep-ocean heat uptake and persistent mass loss from the Greenland and Antarctic ice sheets [33]. This prolonged SLR will profoundly increase the frequency of extreme sea-level events along most coastlines. By 2100, over half of the world’s tide gauge locations are projected to experience what was once considered a 1-in-100-year extreme event on an annual basis or even more frequently [40].
The GBA is a coastal and estuarine region characterized by low-lying, flat terrain and a well-developed river network. The combined effects of sea-level rise (SLR) and typhoon-induced storm surges exacerbate flooding risks in this low-elevation coastal zone [30]. As an economically advanced and densely populated area, the Pearl River Estuary is particularly vulnerable to storm surges generated by tropical cyclones originating in the northwest Pacific Ocean, posing significant threats to local safety. Historical observations reveal that the SLR rate in the GBA has surpassed both the global average and the mean along China’s coast, with notable acceleration in recent decades [41]. Under a high greenhouse gas emission scenario, projections indicate that by 2100, the mean sea level in Hong Kong could rise by 0.78 m (range: 0.57–1.08 m) relative to the 1995–2014 baseline [42]. Similarly, Ding et al. [43] investigated sea level variations over a period exceeding 40 years using tide gauge records from two stations located on the Hong Kong side of the Pearl River Estuary. Macao may experience a sea-level rise of 0.65–1.18 m relative to the 1986–2005 reference level [42]. Their findings indicate that since the beginning of the 20th century, the sea level in Hong Kong has risen at a rate of 1.90 mm/yr, while exhibiting multi-scale fluctuations on temporal scales ranging from several months to several decades. More recent analyses have further quantified these trends. For instance, studies [44] focusing on Victoria Harbor—the Hong Kong segment of the Pearl River Estuary—revealed a sea-level rise rate of 2.60 mm/yr between 1950 and 2011. Employing satellite-derived data at a 1° × 1° spatial resolution, Shi et al. [45] reported a higher rate of sea-level increase in the Pearl River Estuary, estimated at 3.00 ± 0.50 mm/yr between 1993 and 2006. Consistent with these observations, records from six tide gauge stations within the estuary indicate an accelerated sea-level rise from 1960 to 2006, a phenomenon largely attributed to global warming. In a related study, You Dawei et al. [46] examined relative sea-level changes in the Pearl River Estuary over a nearly 30-year span (1980–2008), identifying a statistically significant upward trend with a rate of 2.60 mm/yr. By leveraging the correlation between sea-level variations in the Pearl River Delta (PRD) region and global mean sea-level (GMSL) changes, studies have estimated that a 1.0 m rise in GMSL would lead to an approximate 1.3 m (range: 1.25–1.46 m) increase in sea level across the PRD [47]. Future projections further suggest that the SLR rate in the GBA will likely exceed the global and coastal averages in China by 20–30% [48]. In recent years, core cities within the Pearl River Estuary have faced growing natural hazard risks associated with SLR. Typhoon-triggered storm surges and high waves have caused severe damage to coastal infrastructure and resulted in considerable economic losses. Notably, tropical cyclones and the SLR represent the most critical climate-related risks for the GBA under ongoing global warming. As a result, the GBA is expected to become a key region for research on extreme weather and climate events [49].
Therefore, it is particularly important to evaluate storm surges and their correlation with SLR in the coastal areas of the Pearl River Estuary [48]. This is not only beneficial for understanding the current hazard level of storm surge disasters but also of great significance for formulating effective disaster reduction strategies and improving the adaptability of coastal areas. However, relevant research remains limited in the Pearl River Estuary, where storm surges occur frequently and sea levels are rising significantly.
Given the complex coastline morphology and distinctive marine dynamic environment of the GBA, this study first employed statistical models to quantify how SLR alters the return periods of storm surges at tide gauge stations. Subsequently, we constructed a coupled model of SLR, typhoon-induced storm surges, and astronomical tides, incorporating the nonlinear coupling effects among the three factors to systematically assess the spatiotemporal heterogeneity of storm surge inundation under multiple sea-level rise scenarios—each corresponding to representative typhoon intensities. By rigorously investigating the synergistic effects of sea-level rise and storm surges, this study delivers actionable technical insights for coastal management authorities to formulate scientifically grounded and spatially targeted disaster prevention and mitigation strategies. The findings thereby contribute to strengthening the GBA’s integrated capacity for marine disaster hazard reduction and provide a robust technical foundation for safeguarding lives and property in coastal communities, as well as for advancing the sustainable development of the marine economy.

2. Materials and Methodology

2.1. Study Area

The GBA is a national-level strategic development zone in China, conceived as a world-class city cluster, an international hub for science and technology innovation, and a pivotal gateway for the country’s opening-up initiative. Encompassing 11 cities across Guangdong, Hong Kong, and Macao in the Pearl River Delta, the GBA spans approximately 56,000 km2 [5]. Based on the collected land elevation data and coastal seawalls, areas with a coastal elevation below 10 m account for approximately 13% of the total area. Coastal seawalls in the GBA exhibit considerable heterogeneity in their design return period standards, spanning from 10 to 1000 years for extreme marine events. Specifically, seawalls designed for the 50-year, 30-year, 20-year, 100-year, and 200-year return periods account for approximately 32.5%, 26.2%, 22.3%, 12.0%, and 5.0% of the total linear length of seawalls, respectively. It synergizes the manufacturing strengths of the Chinese mainland, Hong Kong’s global financial and trade services, and Macao’s distinctive role as a platform for Portuguese-speaking countries, forming a dynamic socio-economic ecosystem [5]. As of 2023, the GBA is home to over 86 million people and boasts a GDP exceeding USD 2 trillion, accounting for nearly 10% of China’s total GDP. Its long-term objective is to evolve into a “globally influential world-class bay area and city cluster” by 2035 [39,50,51]. However, the region, particularly the Pearl River Estuary, faces persistent threats from tropical cyclone-induced storm surges originating in the northwest Pacific, which endanger human safety, critical infrastructure, and coastal ecosystems.
Figure 1 shows the locations of tide gauge stations in the GBA. The data from the tide gauge stations in the GBA were sourced from the relevant departments of the Ministry of Natural Resources and the Ministry of Water Resources of the People’s Republic of China. Long-term tidal level records were obtained from six stations: gk (Gangkou), cw (Chiwan), ns (Nansha), dh (Dahu), sz (Sanzhao), and hs (Hushan). Float-type tide gauges have been deployed at tide gauge stations with a sampling interval of one minute. To date, these stations have remained unaffected by erosion or deposition processes in the surrounding topography and geomorphology, ensuring the reliability of the collected data. Analysis indicates that the tidal regime in the GBA is characterized as irregular semidiurnal, with a mean tidal range of 1.0 to 1.5 m. Then, the records, with observation periods spanning 23 to 61 years, were analyzed to characterize the tidal regime. Tidal characteristic parameters and annual maximum value series were extracted from quality-controlled 1 min in situ-measured data. The estimated future SLR (possible range of change; Table 1) was derived from the IPCC Sixth Assessment Report.

2.2. Methodology

2.2.1. Statistical Model

The standard approach for determining the total tidal level at a tide gauge station (or port) for a given return period is to apply the extreme-value frequency analysis method using the Gumbel distribution [52,53,54] or the Pearson Type-III (P-III) distribution [55,56,57,58]. According to the design guide for the coastal levee project of Guangdong province, for stations in tidal estuary areas influenced by runoff, the Pearson Type III distribution curve is recommended for calculating tidal levels with a specified return period [59]. In this study, the P-III distribution, commonly used in hydrological engineering, was used to analyze the hydrological frequency fitting line [42]. Based on this, the extreme water levels at each tidal station in the GBA under different SLR scenarios were calculated and analyzed. Firstly, the empirical frequency points were calculated from historical observation data. Then, the mean value, the standard deviation coefficient, and the deviation coefficient of the P-III distribution curve were obtained using the moment method, and the best-fitting curve was obtained. The mathematical expectation formula selected was P = m n + 1 × 100%, where P is the empirical frequency, m is the serial number of measured observations from largest to smallest, and n is the total number of items in the series. The probability density function of the P-III distribution is
f ( H ) = β α Γ ( α ) H α 1 e β H
where H represents the annual extreme tide-level series; α v , β represents the shape and scale parameter of the frequency curve; and Γ ( α ) represents the gamma function.
The parameters are calculated as follows:
α = 4 C s 2
β = 2 H ¯ C v C S ¯
where H ¯ , C v , and   C s represent the mean of the annual extreme tide-level series and the deviation coefficient, respectively. These can be calculated according to the following formula based on the tide-level observation data:
H ¯ = 1 n i = 1 n H i
C v = ( K i 1 ) 2 n 1
C s = ( K i 1 ) 3 ( n 3 ) C v 3
where K i = H i / H ¯ is the modulus ratio coefficient. In addition, the “return period” is often used in place of “frequency”, with the relationship defined as T = 1/P, where T is the return period (in years) and P is the frequency of events.
Climate change and sea-level rises may increase the intensity and frequency of storm surges, yet quantifying this impact remains difficult. For this reason, in a number of storm surge-related studies under the context of climate change, it is typically assumed that the intensity and occurrence frequency of storm surges are statistically stationary [54,56,60,61,62]. A similar approach is adopted in this study: we hold that the intensity and frequency of storm surges remain unchanged across all scenarios, i.e., the impacts of climate change and sea-level rise on their intensity and frequency are not considered. Accordingly, the extreme water levels across various scenarios can be approximated as a linear superposition of the current extreme water levels and the sea-level rise magnitudes under different RCP scenarios.
Future extreme sea level (ESL) is mainly calculated by superimposing sea-level rise (SLR, Table 1) on the annual extreme tide-level series of the tide gauge stations (STs). ESL is quantified using the following formula [54]:
ESL = SLR + ST
Although the SLR in the study area is higher than the global mean sea-level rise (GMSLR), the latter, as an internationally accepted benchmark dataset validated by multiple models, provides long time series and standardized projection data across multiple scenarios. It can serve as a baseline for analyzing sea-level changes in the study area and can be further corrected for local factors. Meanwhile, adopting this dataset ensures comparability of the research methodology with global studies in the same field and enhances the generalizability and reproducibility of the conclusions. Therefore, this study uses GMSLR projection data for analysis.

2.2.2. Numerical Model

Although the statistical analysis results in the previous section have revealed the impact of SLR on the return period to a certain extent, they ignore the nonlinearity between the two. To address this limitation, this chapter adopts a numerical modeling approach. We create a sea-level rise–typhoon storm surge–astronomical tide coupling model to analyze the impact of sea-level rise on the storm surge inundation.
This study employed the ADCIRC model (a Parallel Advanced Circulation Model for Oceanic, Coastal, and Estuarine Waters) (Kolar, R.L., 1994) [63] to analyze the impact of sea-level change on storm surges in the Guangdong–Hong Kong–Macao Greater Bay Area. The model and its governing equations [63] will not be elaborated herein; for specific details, please refer to the author’s previously published articles or the official ADCIRC website.
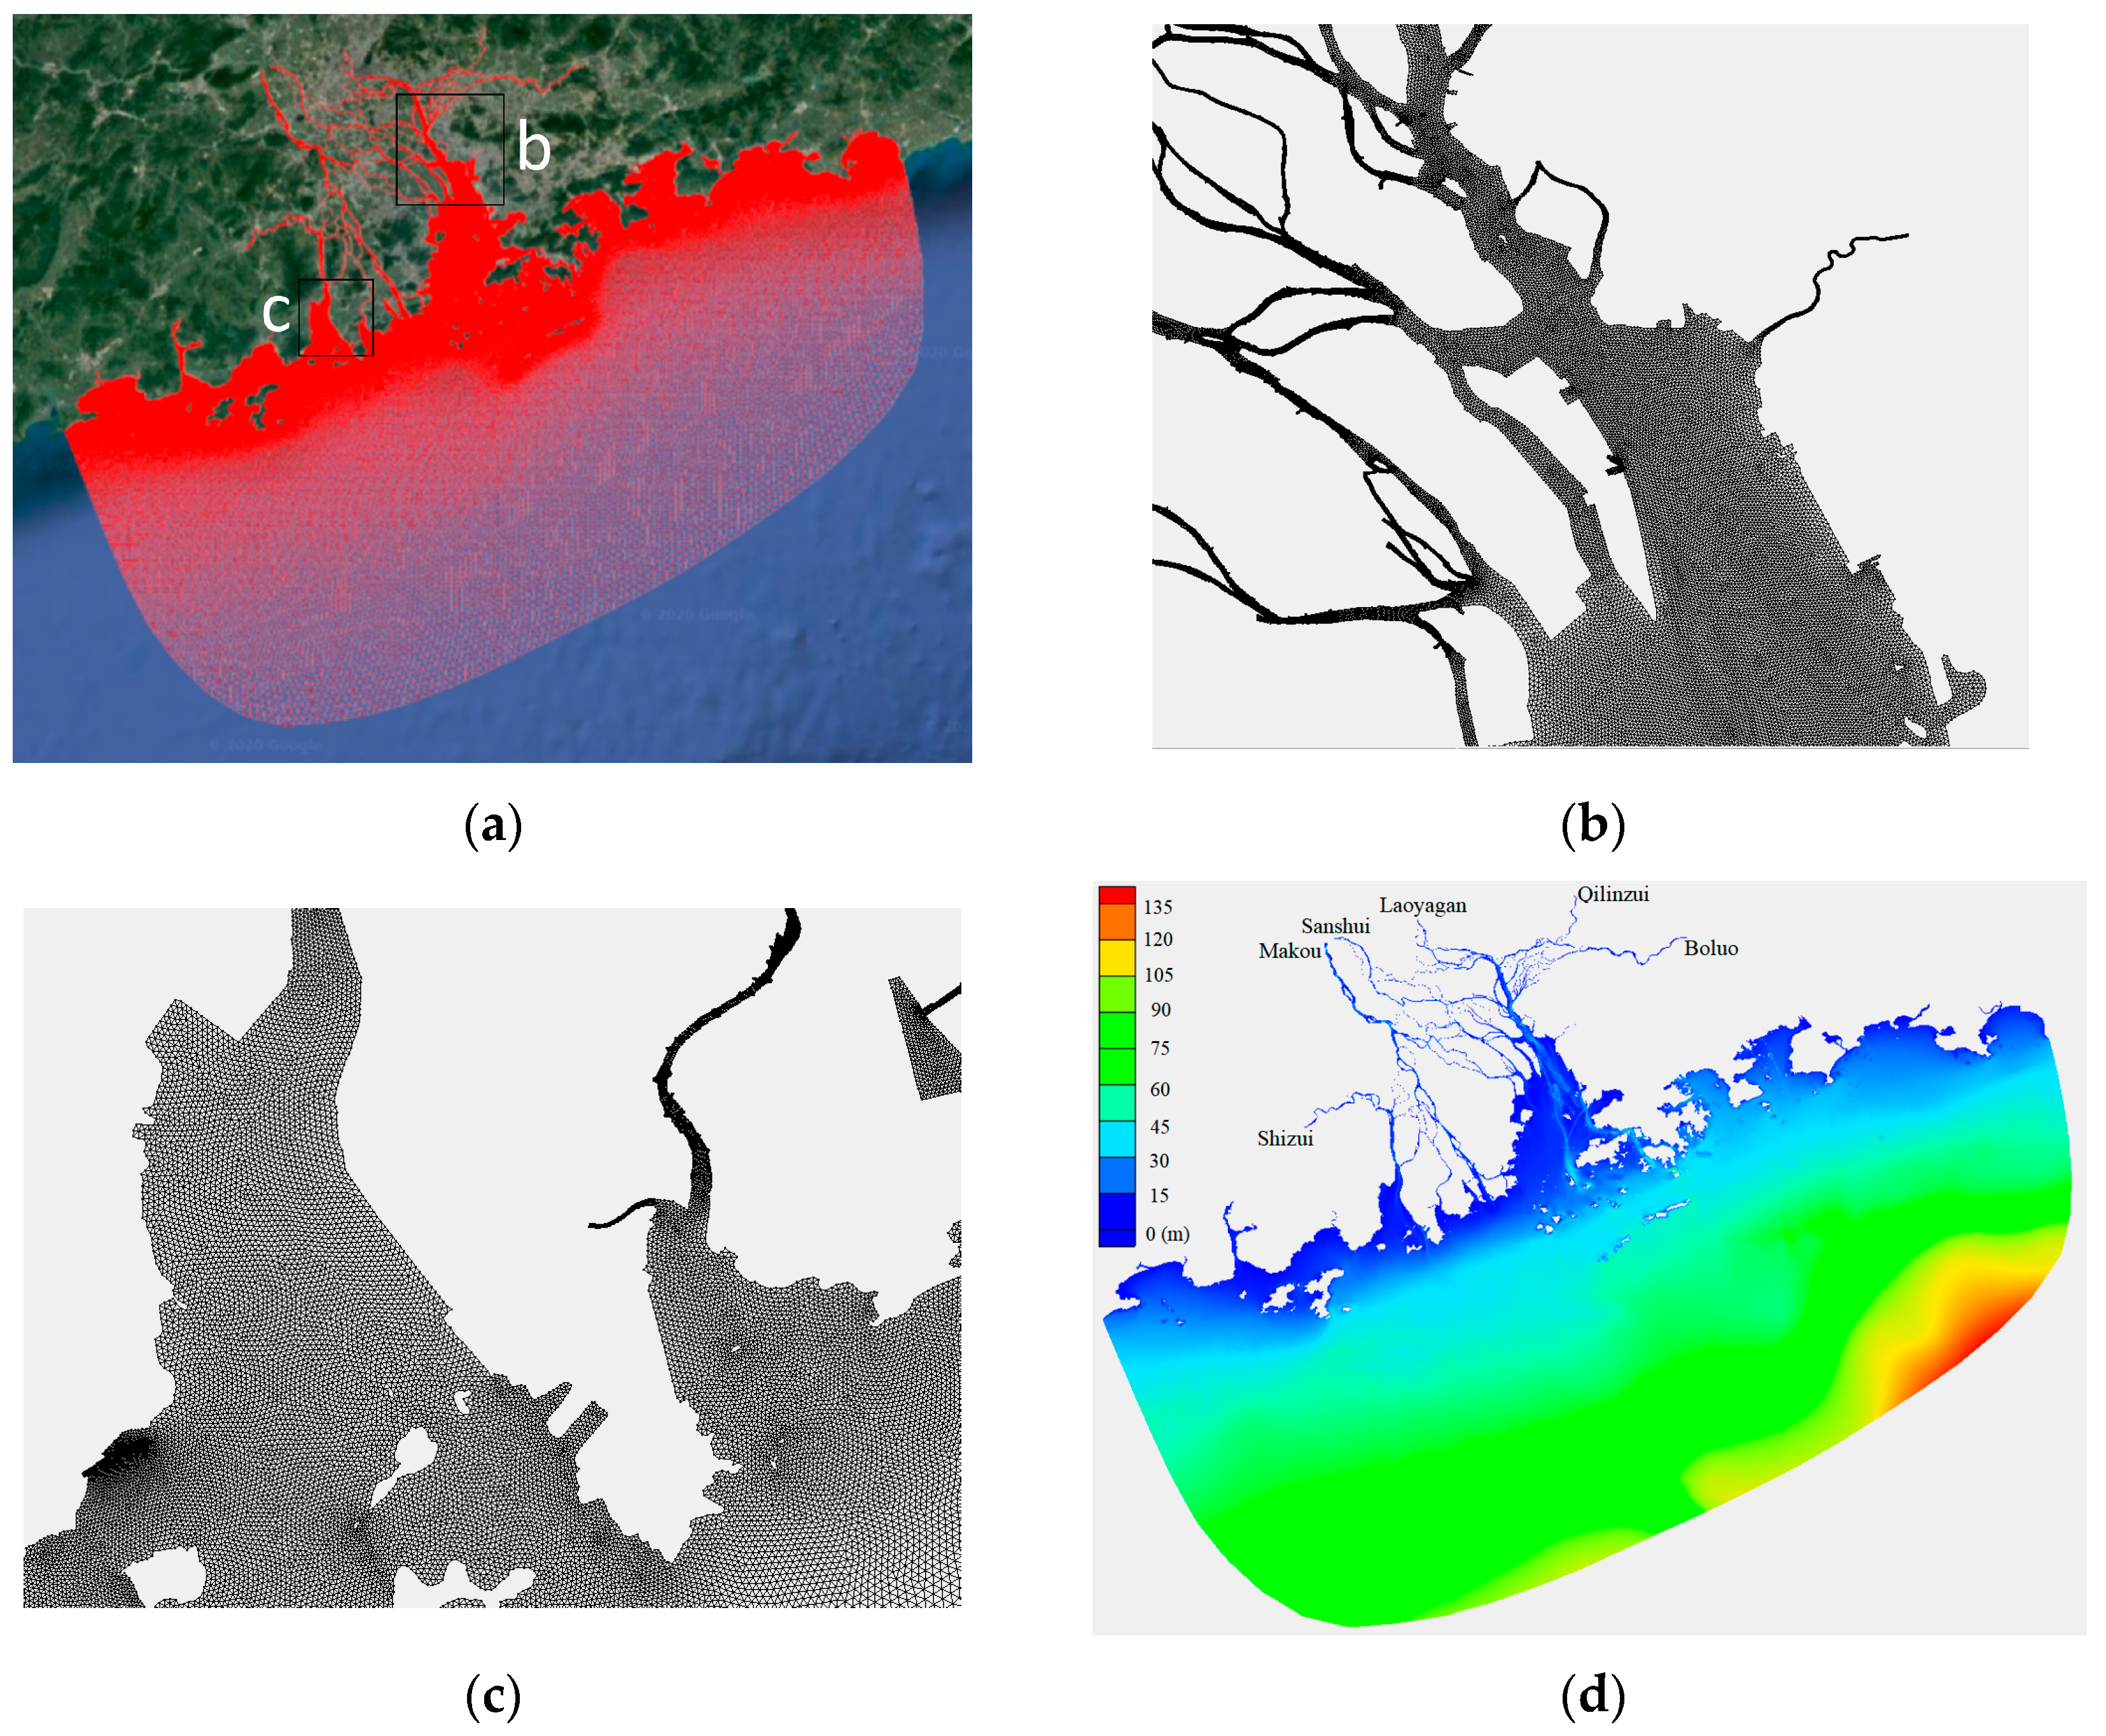
Model Domain and Mesh Generation
The model domain (Figure 2) covers the Pearl River Network River Area and Pearl River Estuary Area, with its northern boundary extending to Shizui, Makou, Sanshui, Laoyagang, Qilinzui, and Boluo; eastern boundary reaching Jieshi Bay; western boundary extending to Hailing Island; and southern boundary approaching the vicinity of the 100 m water depth contour line. The domain spans approximately 400 km east–west and 350 km north–south.
The number of grids and grid resolution settings have an inverse effect on the model’s computational accuracy and efficiency. With more grids, higher computational accuracy can be achieved, but computational efficiency will inevitably decrease; conversely, fewer grids fail to achieve the same level of precision. Therefore, the local refinement technique for triangular grids is adopted to set different grid resolutions in different regions: the resolution of the open boundary in the outer sea is approximately 3–4 km, the grid resolution in the offshore area is no less than 500 m, the grid resolution in the estuary area is no less than 300 m, and the grid resolution within the river network is no less than 100 m. The relatively low resolution in the outer sea reduces the model’s computational load. At the same time, grid refinement along the coast and at estuary mouths improves the fit of the shoreline and topography.
The topographic and bathymetric data within the simulation domain were first converted to a unified datum (mean sea level) and then interpolated onto the grid nodes to obtain the bathymetric topography of the computational domain.
Water Levels at the Open Boundary
The total water level is used for the water-level open boundary. This total water-level boundary is formed by superimposing the storm surge and astronomical tide boundaries. Among these, the astronomical tide is represented by 11 major tidal constituents: M2, S2, N2, K2, K1, O1, P1, Q1, MS4, M4, and M6 [64]. The harmonic constants were derived from the FES2014 global tidal model. This dataset features a base grid resolution of approximately 1/16° (about 7 km), with an enhanced resolution of up to 1/32° (around 3.5 km) in coastal and polar regions, achieved through localized grid refinement techniques. The storm surge boundary is obtained from the operational storm surge model for marine areas developed by the South China Sea Marine Forecast and Hazard Mitigation Center [58].
Model Validation
Storm surge events that caused significant water-level rises at long-term tide gauge stations in GBA water (Typhoon Hagupit [No. 0814] and Typhoon Mangkhut [No. 1822]) were selected for storm surge hindcast simulation. The typhoon parameters used in the hindcast were derived from the Best Typhoon Track Dataset [65] released by the National Meteorological Center of China.
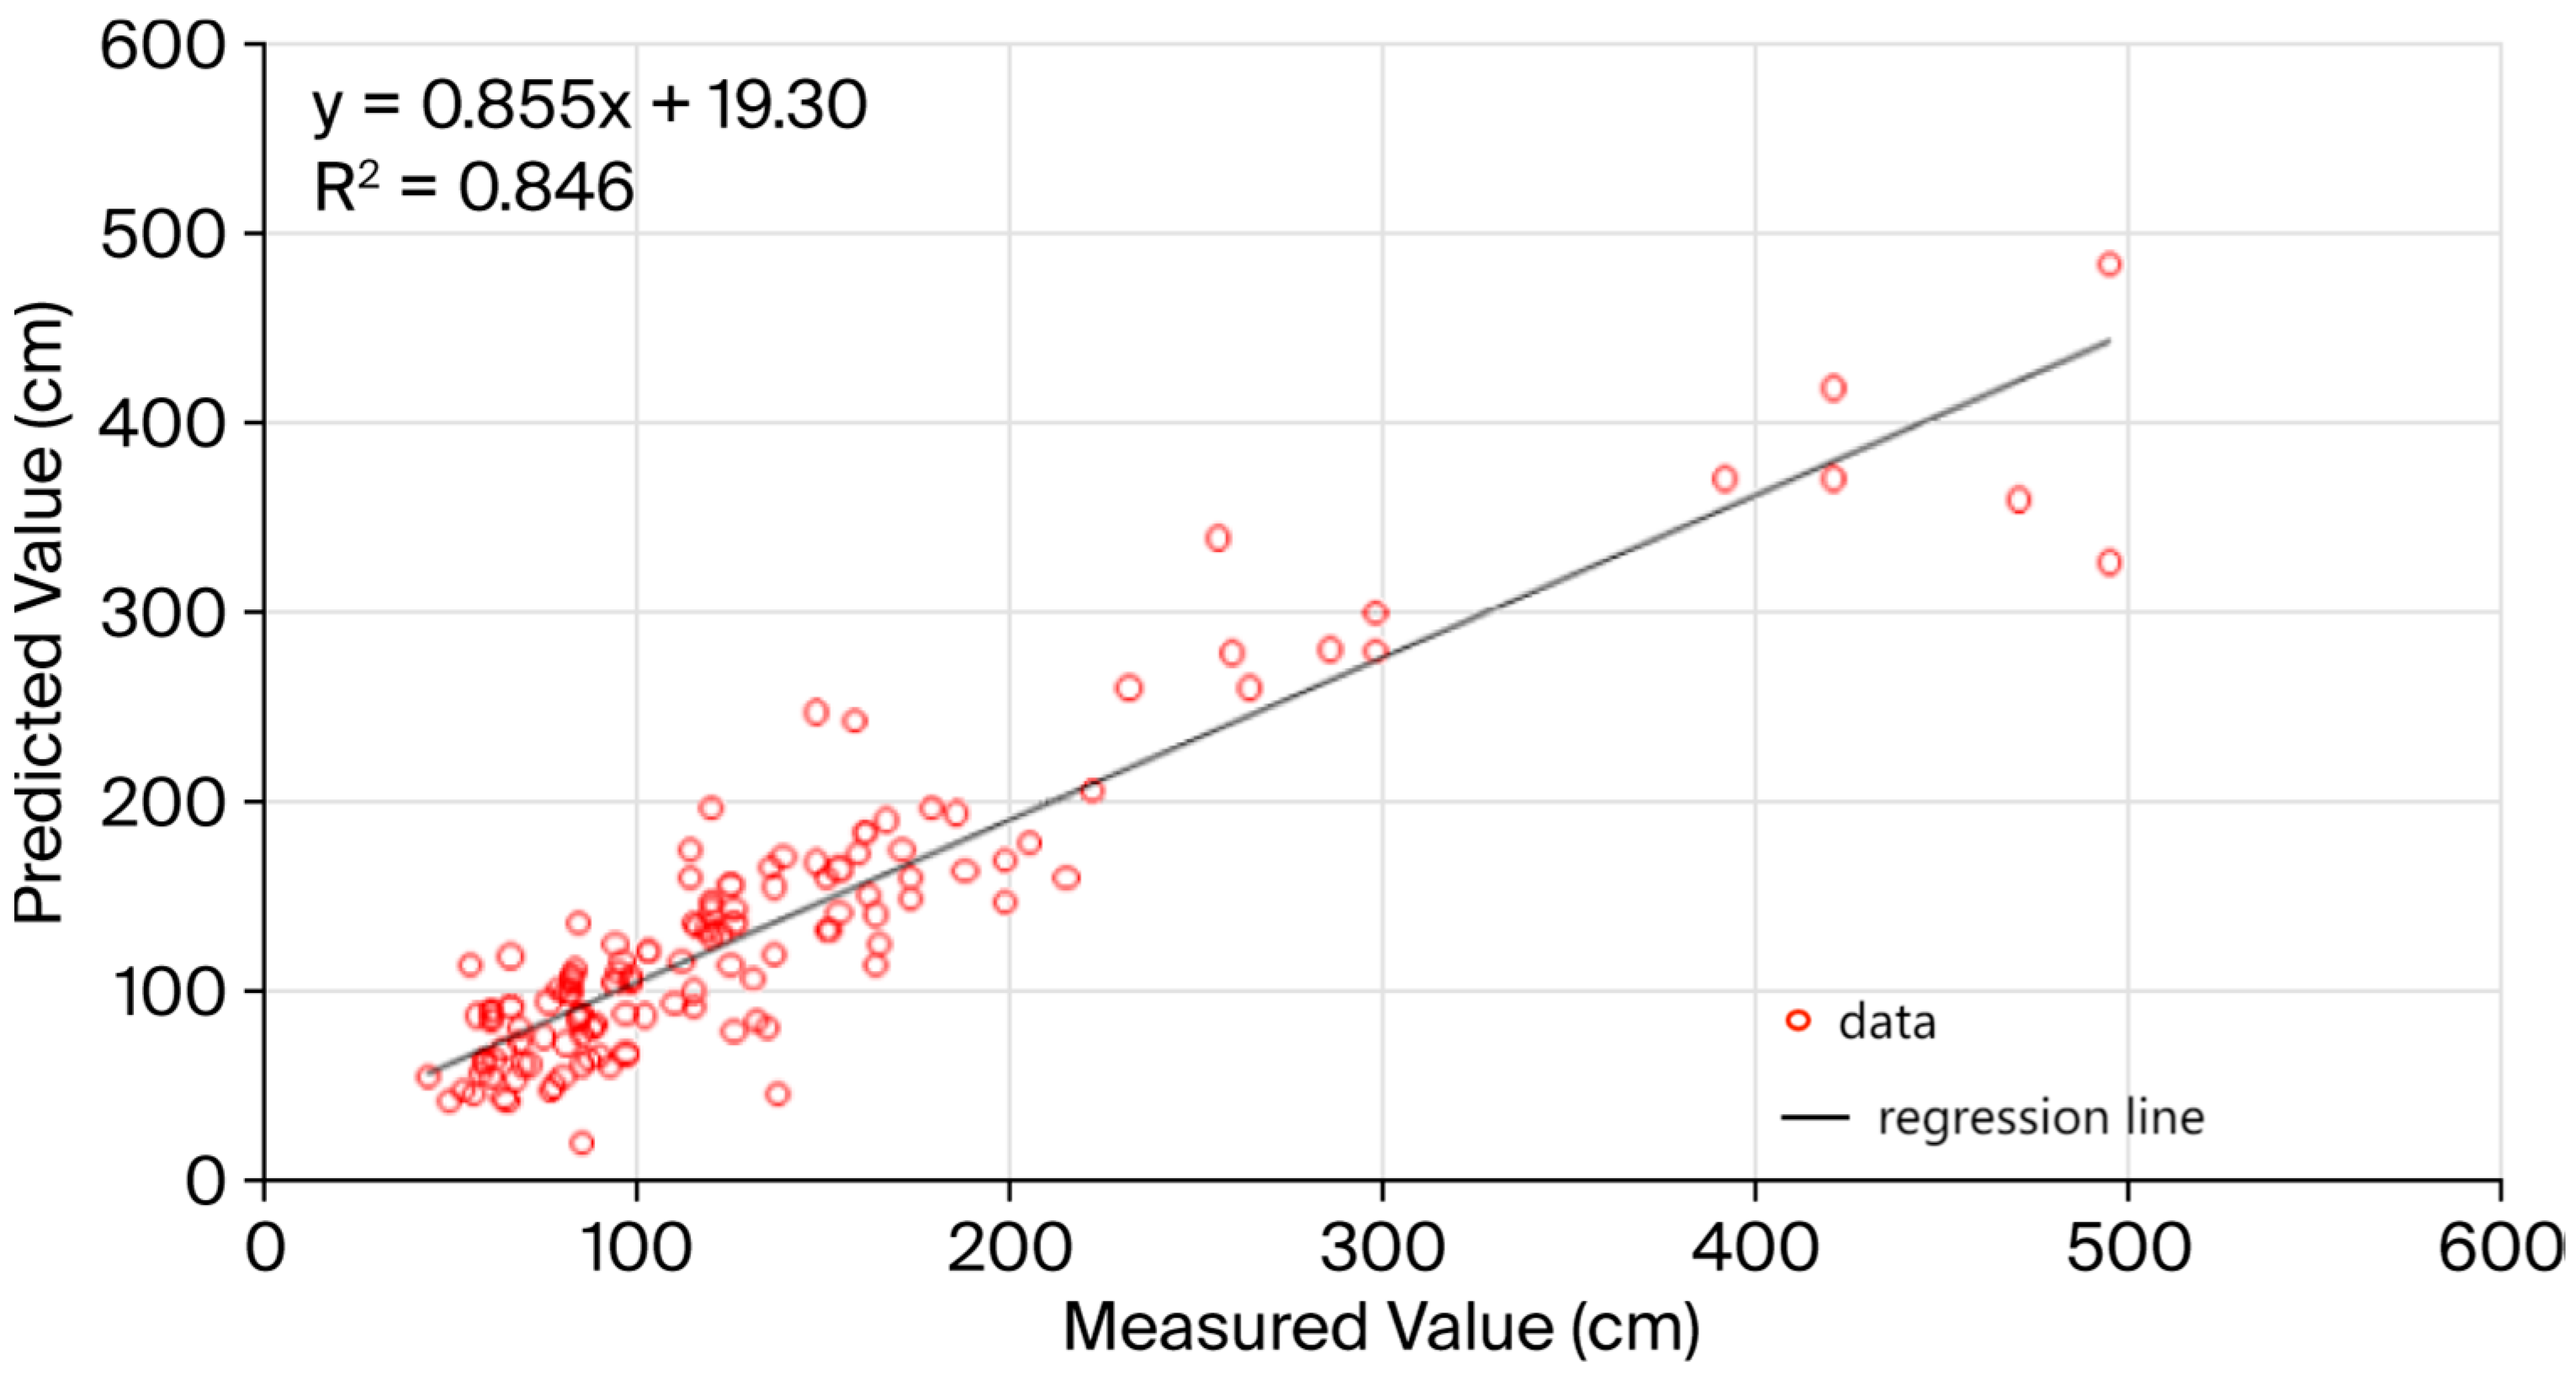
A comparison (Figure 3) between the observed data and hindcast results shows that the simulated storm surge processes for these two typhoons are generally consistent with the observed trends, and the relative water-level error is less than 15%. Detailed information on the typhoon events and the complete results of the simulation validation can be found in the previously published academic papers by the author of this study.
Typhoon Model
In storm-surge modeling, deriving typhoon wind and pressure fields is a critical component. The wind field within the typhoon’s influence domain is a vector superposition of two distinct components. The first component is the typhoon-centered symmetric wind field. Here, wind vectors cross isobars and deflect leftward, forming a 20° inflow angle. Its wind speed is proportional to the gradient wind. The second component is the background wind field, whose magnitude is assumed to be a function of the typhoon’s translational velocity. Multiple standard approaches exist for representing such background wind fields. For the purposes of this study, the Jelesnianski model (Jelesnianski, 1966) [66] was adopted. This model, which characterizes both wind and pressure fields, has been widely employed by our research center for operational forecasting. For the corresponding calculation formulas [58,63], please refer to the author’s previously published articles.

3. Results and Discussion

3.1. Prediction of Extreme Water Level and Return Period Under Different Sea-Level Rise Scenarios

To project future variations in extreme water levels within the GBA, this study analyzed historical observational data from six tide gauge stations in the GBA. Specifically, the magnitude of sea-level change at each tide gauge station was estimated under distinct SLR scenarios.
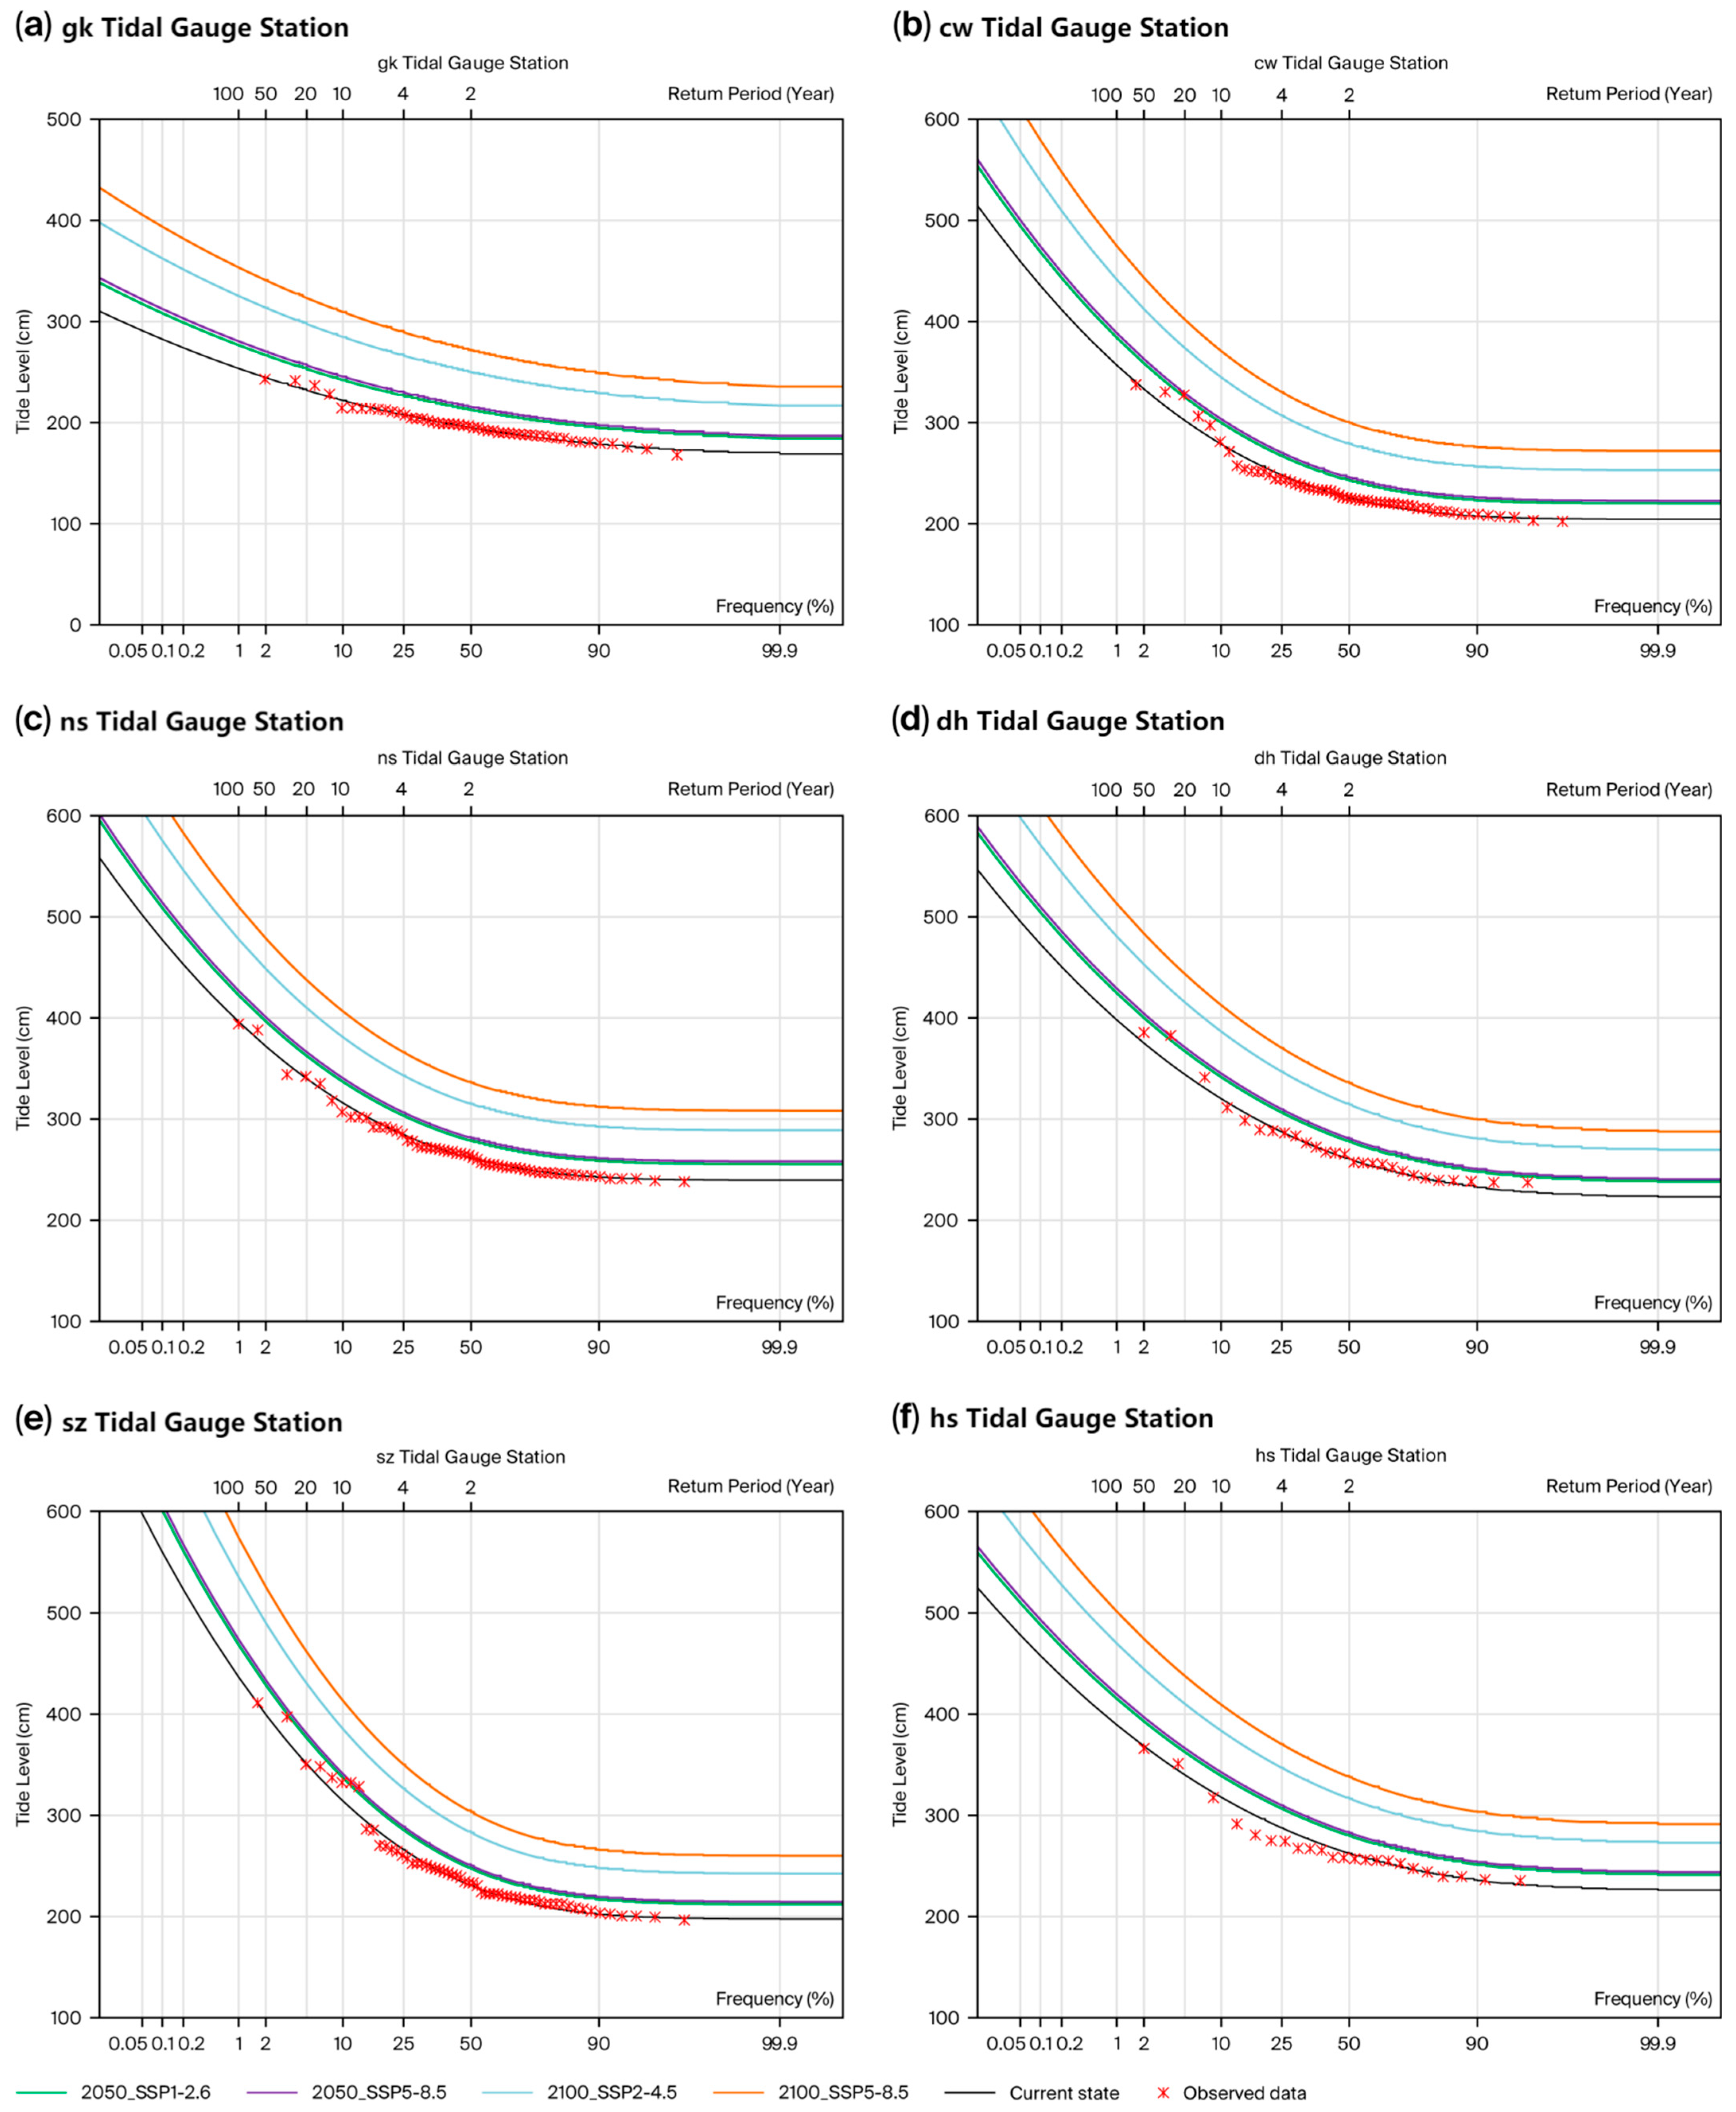
As depicted in Figure 4, the frequency curves of annual extreme water levels were derived via a fitting analysis using the P-III hydrological probability distribution model—a classic, widely adopted tool in coastal hydrology for the frequency quantification of extreme hydrological phenomena. Notably, the elevation of extreme water levels exhibits a logarithmic–linear correlation with their corresponding return periods; this relationship is consistent with the statistical regularity of extreme coastal hydrological processes documented in the existing literature.
The extreme water-level values and their associated return periods for the six tide gauge stations in the GBA under the aforementioned SLR scenarios are presented in Table 2 and Table 3, providing foundational quantitative data for subsequent hazard assessment.
Analysis of current extreme water levels indicates that the 50-year return period event is 244 cm at the GK station, compared to 333 cm to 400 cm at the other five stations (Table 2). Under the SSP5-8.5 scenario, these levels are projected to rise to 266.7 cm at GK and 362–434 cm at the other stations by 2050, and further increase to 340.7 cm and 443–525 cm, respectively, by 2100.
A similar pattern is observed for the 100-year return period. The present level at GK is 254 cm, while the other stations experience levels between 357 cm and 437 cm. By 2050, under SSP5-8.5, the 100-year level at GK is projected to reach 280.5 cm, and the range for the other stations is forecast to be 384–468 cm. By 2100, these values are expected to rise to 353.5 cm and 474–574 cm at GK and the other five stations, respectively.
Under the SSP5-8.5 scenario, the return periods associated with current extreme water levels are projected to shorten significantly. By 2050, the current 50-year event will correspond to a 9-year event at the GK station and a 21–28-year event at the other stations. By 2100, this reduction becomes even more pronounced; what is now a 50-year event will become an annual (1.0-year) event at GK and a 6–14-year event elsewhere. Similarly, the current 100-year extreme water level is projected to decrease to a 16.9-year event at GK and a 39–53-year event at the other stations by 2050. By 2100, it will further reduce to a 3–8-year return period across the other five stations.
Projected trends indicate a pronounced increase in the hazard of extreme water levels across the GBA, highlighting a heightened vulnerability to coastal flooding in the future.

3.2. Analysis of the Impact of Sea-Level Rise on the Hazard of Storm Surge Inundation

3.2.1. Selection of the Least Favorable Path for Typhoons

At around 17:00 on 16 September 2018, Super Typhoon Mangkhut made landfall near Haiyan Town, Taishan City, Guangdong Province. At the time of landfall, the maximum wind force near its center reached Level 14 (on the Beaufort scale), making it the strongest typhoon to land in China in 2018. The typhoon data were sourced from the Best Track Dataset of the China Meteorological Administration (CMA) Tropical Cyclone Data Center. The dataset has a temporal resolution of 6 h, which was reduced to 3 h during the 24 h period preceding landfall and throughout the system’s duration over land in China [67]. The economy of Guangdong Province was affected by the combined effects of the storm surge and nearshore waves induced by Typhoon Mangkhut, resulting in direct economic losses of CNY 2.370 billion (Chinese yuan). The maximum observed storm surge along the coast was 339 cm, which occurred at the Sanzao station in the GBA. The highest recorded water levels at the Hengmen, Huizhou, and Sanzao stations in the GBA exceeded their historical maxima [67,68,69].
Typhoons affecting the GBA were collected and analyzed. Following the Technical Guidelines for Storm Surge Disaster Hazard Assessment and Zoning, key typhoon parameters along the worst-case track were determined, including central pressure, maximum wind radius, maximum sustained wind speed, translation speed and direction, and ambient sea level pressure (Table 4).
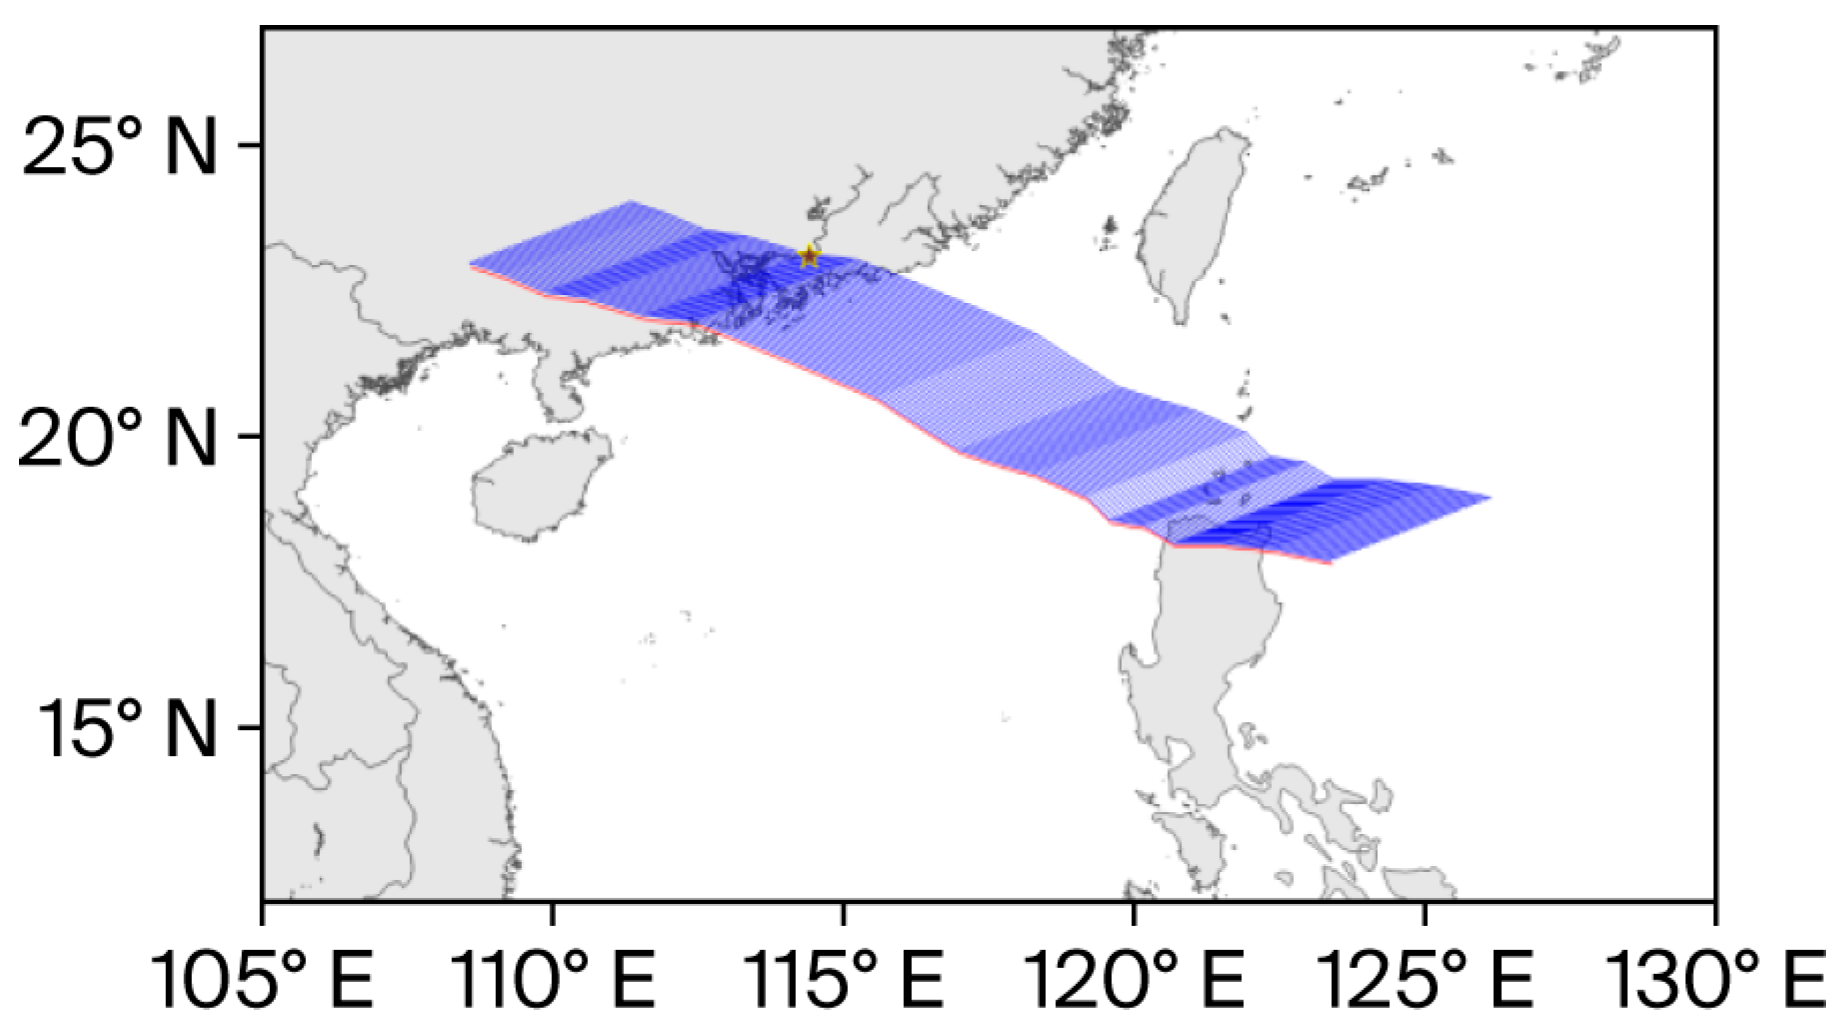
Furthermore, based on the track of Super Typhoon Mangkhut (No. 1822), which significantly impacted the GBA, multiple parallel typhoon tracks were generated by shifting the original path laterally by increments of 0.25 times the maximum wind radius. This set of tracks provides complete coverage of the coastal segments of the GBA, as illustrated in Figure 5.

3.2.2. Hazard Assessment Under Different SLR Scenarios

Using the collected topographic and shoreline data along with the constructed typhoon track ensemble, we developed a storm surge inundation model for the Greater Bay Area waters based on the numerical model outlined in Section 2.2.2. The model simulates inundation scenarios under current conditions and various sea-level rise projections, enabling a comparative statistical analysis of storm surge impacts and thereby facilitating a thorough assessment of sea-level rise hazards to storm surge inundation.
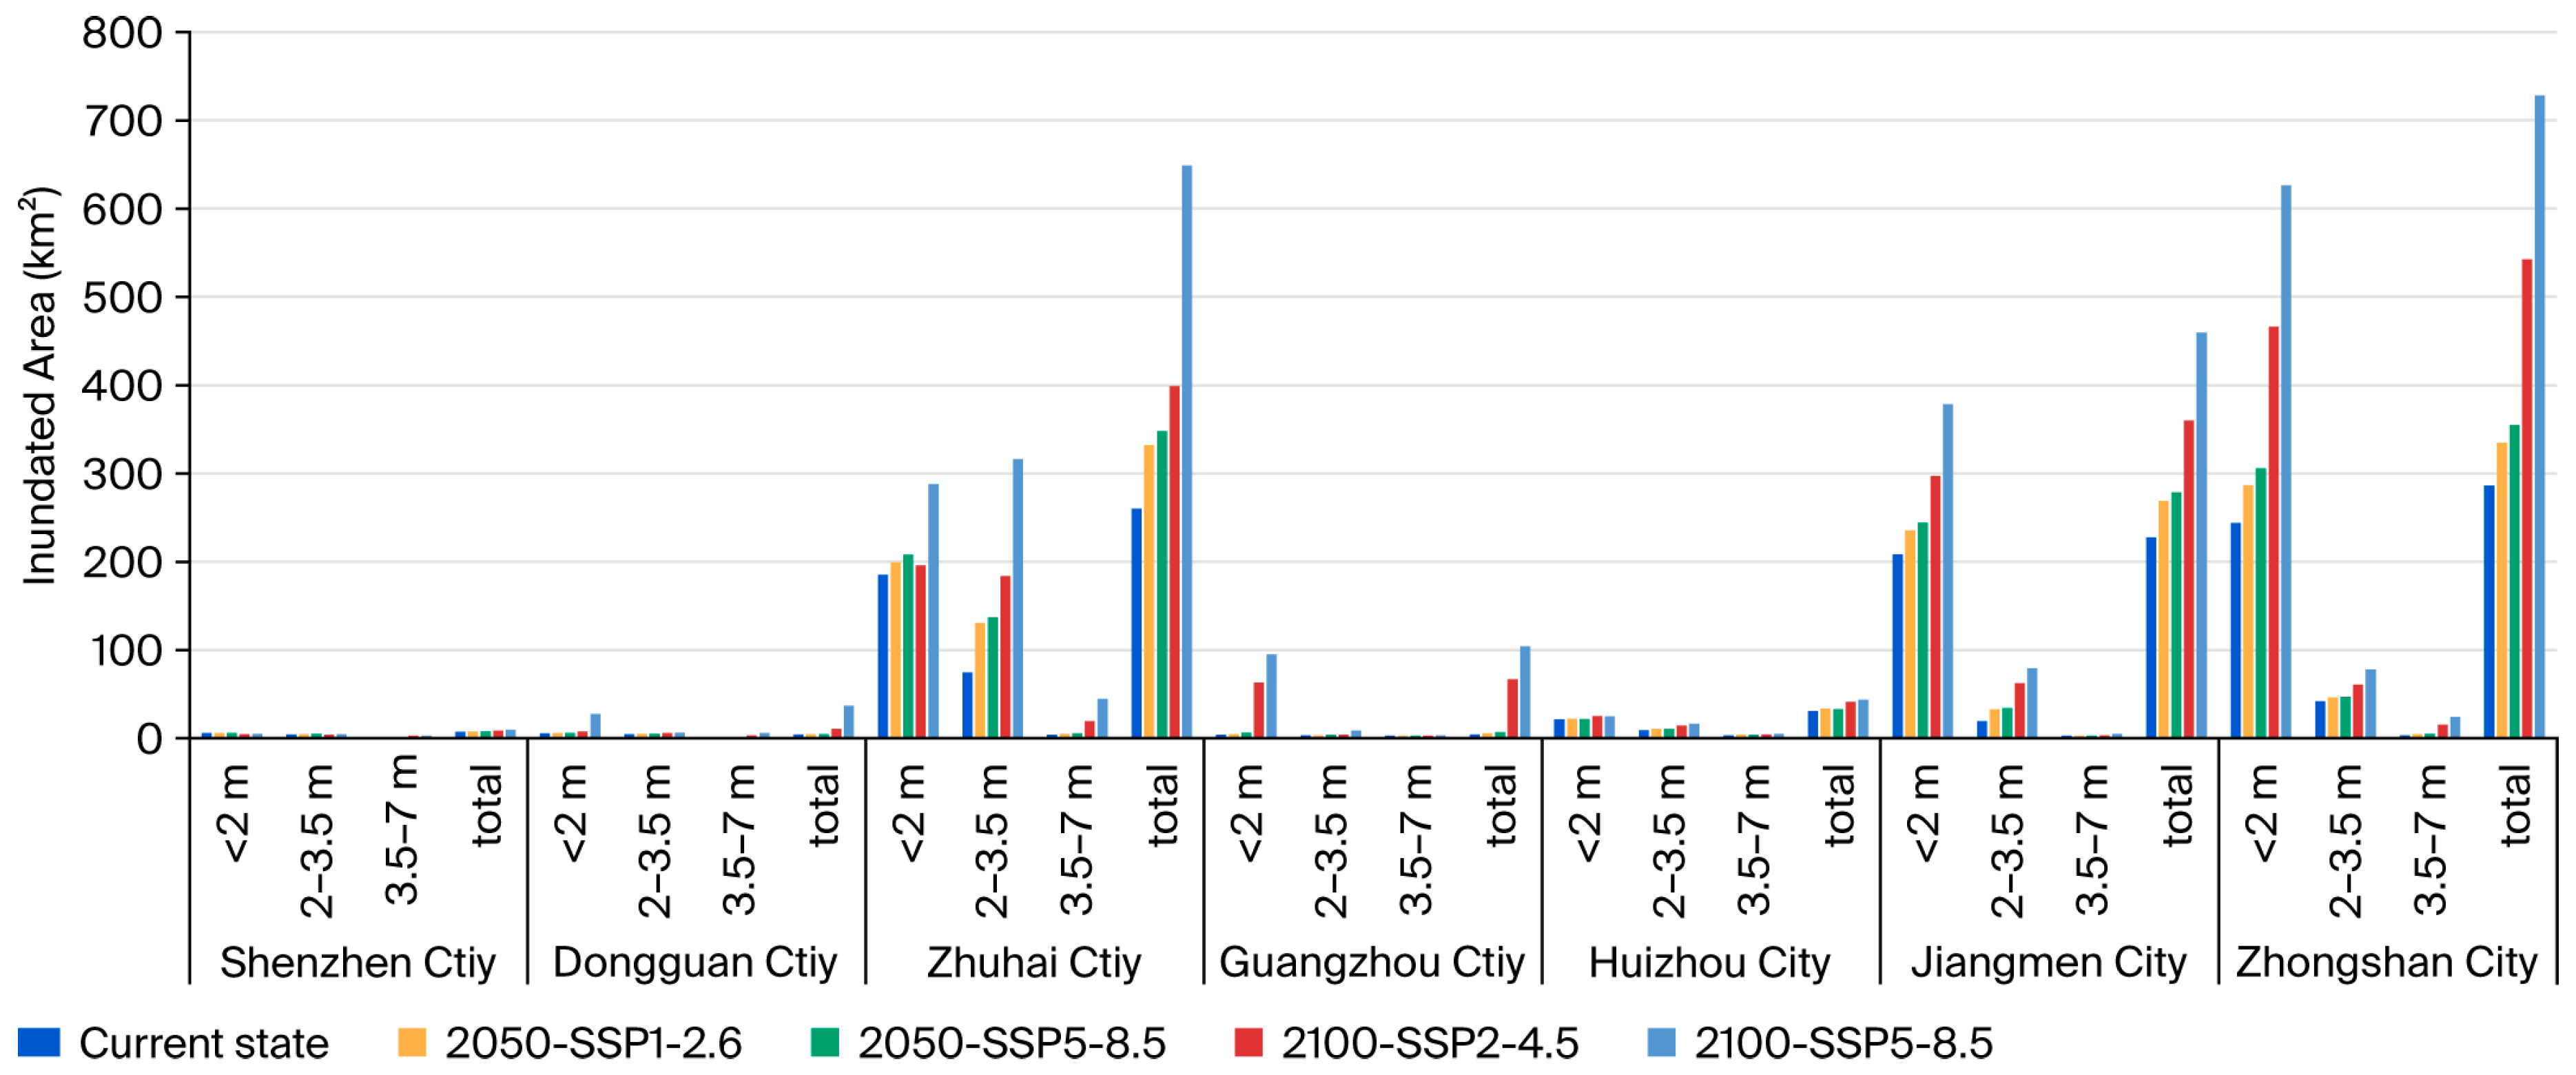
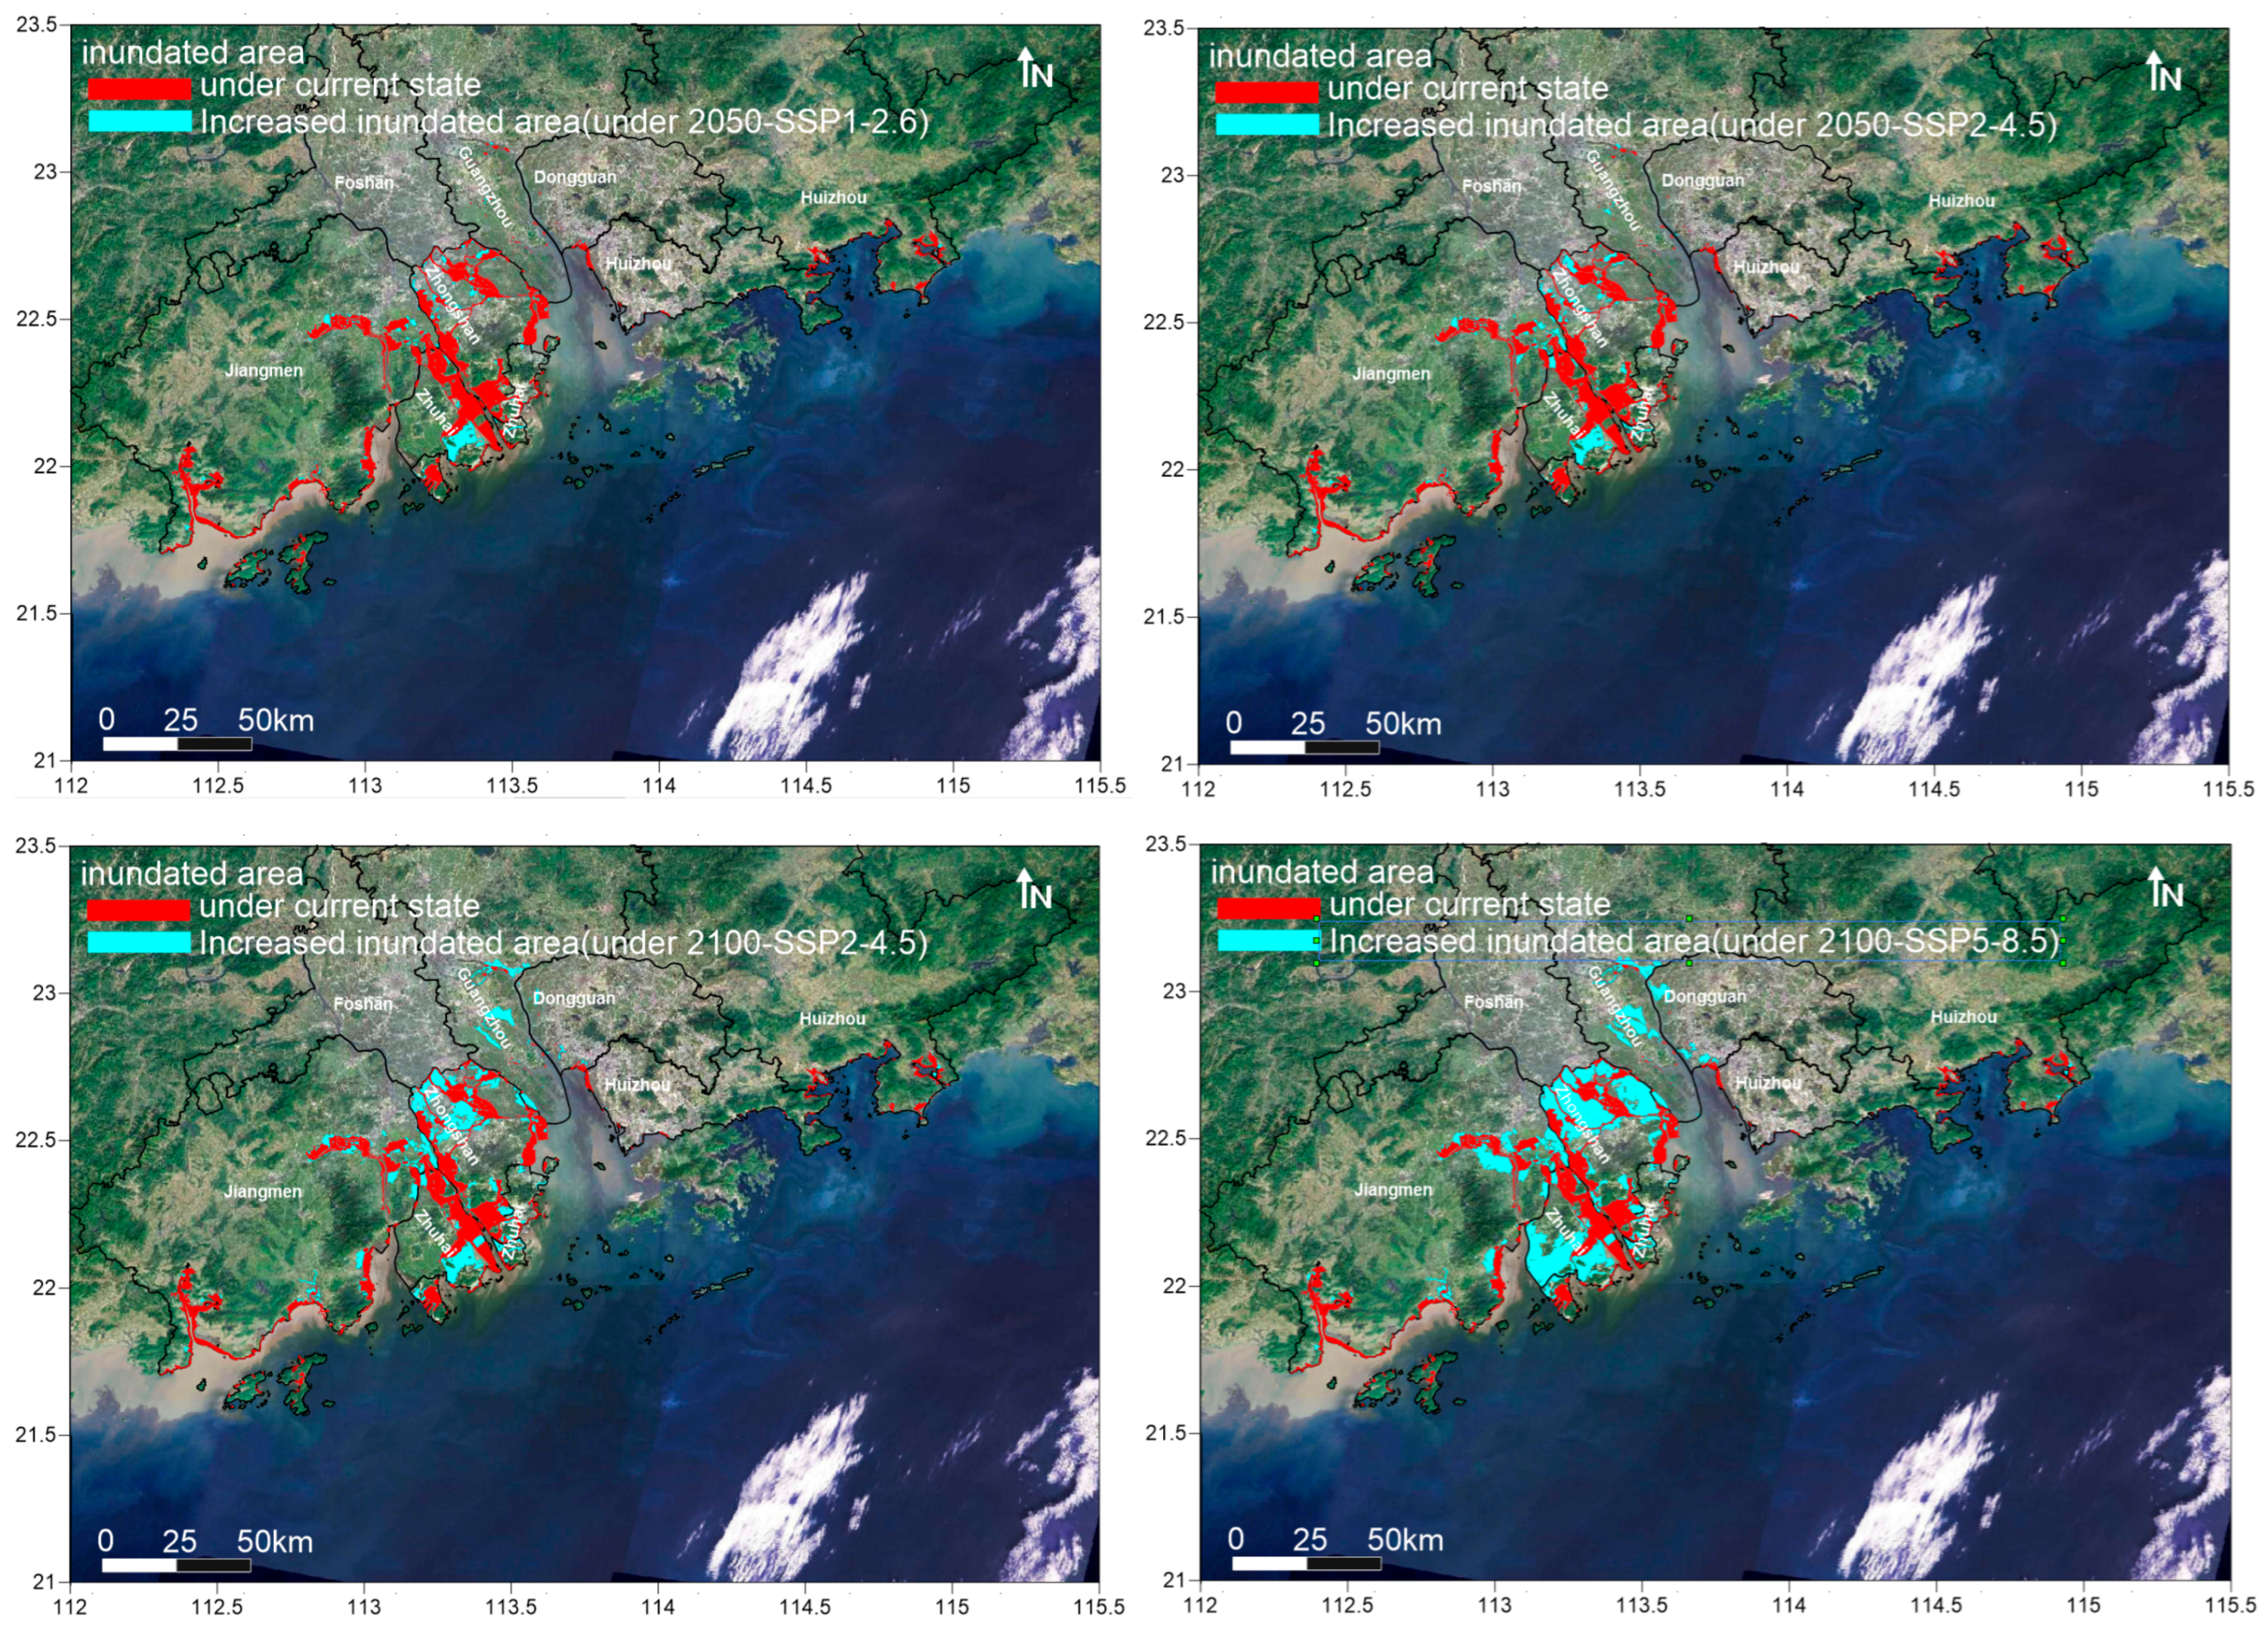
Based on current conditions, the distribution of storm surge inundation areas across coastal cities in the Guangdong–Hong Kong–Macao–Greater Bay Area (GBA) is illustrated in Figure 6 (red zones), with a total inundation area of 286.073 km2. Although this study used a hypothetical typhoon track ensemble, the simulated inundation scenarios effectively reflect historical typhoon-induced inundation patterns. Specifically, the inundation areas simulated under the current scenario fully encompass the storm surge regions observed during the impacts of Typhoon Hato (201713) and Typhoon Mangkhut (201822) [20], which verifies the credibility of the simulation results in this study. Meanwhile, sea-level rise risk assessment results for the GBA from the Guangdong Marine Science Data Sharing Platform [70] were collected for comparison. The spatial distribution trend of inundation areas in this study is generally consistent with that of the platform’s results, but the total inundation area calculated herein is significantly smaller. This discrepancy is attributed to the difference in typhoon intensity parameters adopted: this study utilized a typhoon track ensemble with a minimum central pressure of 950 hPa and a maximum central wind speed of 46 m/s, whereas the platform’s results are based on typhoon tracks with a minimum central pressure of 883–890 hPa and a maximum central wind speed of 75–86 m/s.
The assessment results indicate that under current sea level conditions, a typhoon storm surge induced by a 950 hPa tropical cyclone would pose varying degrees of inundation hazard to coastal cities within the GBA. Zhongshan, Zhuhai, and Jiangmen have the largest areas at hazard, each exceeding 200 km2. In contrast, Shenzhen and Dongguan show no inundation depths greater than 3.5 m. The areas with water depths exceeding 3.5 m are less than 0.01 km2 in Guangzhou and Jiangmen, while they measure 0.781 km2 in Zhuhai and 0.534 km2 in Zhongshan. At the district/county level, significant inundation (>3.5 m) is projected in Jinwan and Xiangzhou Districts (Zhuhai), Nansha District (Guangzhou), Huidong County and Huiyang District (Huizhou), Xinhui District (Jiangmen), and Zhongshan City. Overall, these districts and cities are identified as the most severely affected by the 950 hPa typhoon storm surge scenario (Figure 6).
SLR elevates the baseline water level for storm surges and increases the volume of water overtopping coastal defenses, thereby expanding the inundation area and intensifying disaster impacts across the GBA. Under various sea-level rise scenarios, the extent of the inundation hazard increases consistently with rising sea levels. Under the 2100-SSP5-8.5 scenario (with a projected sea-level rise of 77 cm), the inundation area is twice that under current conditions. By 2100, under the high-emission scenario (SSP5-8.5), the increase in inundated area will exceed 100 km2 in Zhongshan, Zhuhai, and Jiangmen, while Guangzhou will experience an increase of nearly 100 km2. The manifestation of the inundation hazard varies spatially across the region (Figure 7). Cities like Guangzhou, Zhongshan, Zhuhai, and Jiangmen have seen a marked increase in inundated areas. In other cities, including Dongguan, Huizhou, and Shenzhen, although the increase in area extent may be relatively modest, the total volume of overtopping water rises significantly, accompanied by a pronounced expansion of areas with deeper inundation. This indicates that these urban areas also face a heightened hazard of storm surge disasters, albeit through different hydrological pathways.
Under different sea-level rise (SLR) scenarios, the 50-year and 100-year extreme water levels at monitoring stations across the GBA are projected to occur much more frequently by 2050 and 2100, leading to a substantial increase in coastal hazard posed by storm surge disasters. This implies that SLR effectively reduces the protective capacity of existing coastal dikes. As the defense capacity of dikes declines, the threat posed by marine disasters to protected areas behind them becomes more severe—an effect that intensifies with greater SLR.
SLR also contributes to an expansion of inundated areas, though the spatial distribution of the hazard is heterogeneous. Cities such as Guangzhou, Zhongshan, Zhuhai, and Jiangmen exhibit a marked increase in inundation extent. In contrast, cities like Dongguan, Huizhou, and Shenzhen may experience relatively modest changes in overall inundated area. Nevertheless, these areas face a significant rise in the total volume of overtopping water and a pronounced expansion of zones with deeper inundation depths, resulting in an overall heightened hazard of storm surge disasters.

4. Conclusions and Discussion

This study utilizes historical observational data from tide gauge stations and appropriate calculation methods to analyze changes in extreme water levels and their return periods under projected future sea level change scenarios. Under different climate scenarios (RCP4.5 and RCP8.5), by the middle and end of the 21st century, extreme water levels of the current 50-year and 100-year return periods recorded at tide gauge stations in the GBA will become significantly more frequent, with a marked increase in their hazard intensity. This indicates that sea-level rise exerts a substantial impact on changes in extreme water levels. Meanwhile, a coastal inundation model was employed to simulate storm surge disasters under various sea-level rise projections. The results show that storm surge inundation areas expand significantly with increasing sea levels; under the 2100-SSP5-8.5 scenario (with a projected sea-level rise of 77 cm), the inundation area is twice that under current conditions.
The impacts of sea-level rise on extreme water levels and inundation areas demonstrate that the significant shortening of return periods for extreme water levels will lead to a substantial increase in coastal disaster hazards in the region.
The GBA is not just an economic zone but a model of regional cooperation that combines China’s institutional advantages, market vitality, and global resources, playing a pivotal role in China’s new development pattern and global economic governance. This study focuses on the frequent threats of tropical cyclone-induced storm surges and accelerating SLR in the GBA and the Pearl River Estuary—hazards that pose severe challenges to local human safety, infrastructure integrity, and coastal ecosystem stability. Against this backdrop, targeted coping strategies are systematically proposed. The key conclusions are summarized as follows:
First, optimizing the coastal sea-level observation network and strengthening early warning systems are foundational to mitigating SLR and storm-surge hazards in the study area. Given the distinct high-incidence periods of major hazards (e.g., saltwater intrusion from September to April, storm surges from June to November, and coastal floods from May to November), enhancing the observation capacity in critical zones such as the Pearl River Estuary—while ensuring the long-term, stable operation of key stations—enables comprehensive assessment of sea levels, astronomical tides, and weather systems. This, in turn, lays a scientific basis for accurate early warning systems and timely responses to extreme marine events.
Second, dynamic, adaptive coastal planning and management are essential to reducing SLR-related hazards at their source. Incorporating SLR hazard into urban physical examinations and planning evaluations, and dynamically adjusting plans in response to real-world changes, ensures that coastal development aligns with long-term climate trends. Additionally, refining coastal building setback line measures—by accounting for the superimposed impacts of typhoon storm surges, high waves, coastal erosion, and SLR—coupled with stricter management of construction within setback zones, effectively minimizes the exposure of human settlements and infrastructure to marine disasters.
Third, multi-dimensional SLR hazard prevention and control, integrating engineering protection, ecological synergy, and hazard classification, enhances the long-term resilience of the GBA and Pearl River Estuary. Classifying disaster hazard areas/targets and installing high-hazard warning signs can enable targeted governance of critical hazard points, while incorporating medium- and long-term SLR projections into the design and verification of coastal defense facilities and large marine projects (using a “phased advancement” strategy) ensures that this infrastructure can be adapted to future climate changes. Furthermore, integrating SLR considerations into the full cycle of coastal ecological protection and restoration projects—such as combining shoreline restoration with engineering measures (breakwaters, submerged breakwaters, spur dikes) and constructing coastal wetland and mangrove ecosystems—achieves the dual benefits of ecological conservation and disaster reduction, improving the sustainability of coastal resilience.
The coping strategies proposed in this study are tailored to the unique hazard characteristics (e.g., overlapping high-incidence periods of multiple disasters) and development needs of the GBA and Pearl River Estuary. They emphasize a balance among urban development, ecological protection, and disaster resilience and provide actionable guidance for local governments to formulate coastal adaptation plans. Future research could further refine these strategies by incorporating more granular regional data (e.g., localized SLR projections) and exploring cross-border coordination mechanisms to better address the trans-regional nature of marine disasters in the GBA.
The analysis results of this study have two uncertainties. First, uncertainties caused by the complexity of the regional dynamic environment: The GBA is influenced by multiple dynamic factors such as Pearl River runoff, Lingding Ocean tidal wave propagation, and the near-shore circulation. The nonlinear disturbance of sea-level rise on regional dynamic processes is difficult to fully capture using models, and different shore sections (such as estuary areas and open shore sections) have different responses to sea-level rise and storm surges, which may lead to deviations in the spatial differentiation results of hazard assessment. Second, uncertainties in regional differentiation of sea-level rise rate and amplitude: Global sea-level rise shows an overall trend, but at the regional scale, it is affected by factors such as terrain subsidence (such as soft soil foundation subsidence in the Pearl River Estuary), ocean dynamic adjustment (such as the tidal wave convergence effect of the Lingding Ocean), and local climate anomalies (such as regional precipitation and runoff changes). There is significant spatial heterogeneity in the rise rate and amplitude. This study uses a unified sea-level rise scenario (0.19–0.77 m) to cover the entire Pearl River Estuary area, but does not fully consider the differences in the rise amplitude of different shore sections (such as estuary areas, open shore sections, and artificial filling areas), which may lead to deviations in the spatial differentiation results of storm surge inundation range in numerical simulation, and thereby affect the accuracy of regional storm surge hazard assessment.
Meanwhile, there remains room for further improvement in the analytical methodologies adopted in this study. Specifically, historical observational data from tide gauge stations and the calculation method for the return periods of future extreme water levels are employed to analyze the variations in extreme water levels and their return periods under future sea level change scenarios. In addition, a mathematical modeling approach is used to couple sea-level rise magnitudes, tidal dynamics, and typhoon processes to analyze storm surge overtopping and inundation variations under different sea level change scenarios. These analyses reflect, to a certain extent, the changes in the hazard of future extreme water-level events (in terms of return periods and inundation areas) under different climate scenarios. However, the limitations of return-period calculations based on short-term datasets, as well as the potential changes in the intensity of future tropical cyclones, have not been fully considered. Accordingly, it is necessary to incorporate these two aspects into subsequent projections and analyses to improve the comprehensiveness of this study.

Author Contributions

Conceptualization, J.Z.; Validation, D.X., B.X. and C.L.; Data curation, W.X. and C.L.; Writing—original draft, J.Z.; Writing—review & editing, J.Z., W.X., D.X., J.D. and P.Z.; Visualization, B.X.; Funding acquisition, P.Z. All authors have read and agreed to the published version of the manuscript.

Funding

This research was funded by Science and Technology Development Foundation of South China Sea Bureau, Ministry of Natural Resources of P. R. China (230101, 23YD03 and 240104). Junjie Deng is supported by the National Natural Science Foundation of China, China (Grant No. 42476152).

Data Availability Statement

The observational data involved are subject to national confidentiality regulations and are not available upon request. For further inquiries regarding the numerical simulation results, please con-tact the authors.

Conflicts of Interest

The authors declare no conflict of interest.

References

  1. Fang, J.; Liu, W.; Yang, S.; Brown, S.; Nicholls, R.J.; Hinkel, J.; Shi, X.; Shi, P. Spatial-temporal changes of coastal and marine disasters risks and impacts in Mainland China. Ocean Coast. Manag. 2017, 139, 125–140. [Google Scholar] [CrossRef] [Scilit]
  2. Shi, X.; Han, Z.; Fang, J.; Jun, T.; Guo, Z.; Sun, Z. Assessment and zonation of storm surge hazards in the coastal areas of China. Nat. Hazards 2019, 100, 39–48. [Google Scholar] [CrossRef] [Scilit]
  3. Shi, X.; Liu, S.; Yang, S.; Liu, Q.; Tan, J.; Guo, Z. Spatial-temporal distribution of storm surge damage in the coastal areas of China. Nat. Hazards 2015, 79, 237–247. [Google Scholar] [CrossRef] [Scilit]
  4. State Council of the People’s Republic of China. Outline Development Plan for the Guangdong-Hong Kong-Macao Greater Bay Area; People’s Publishing House: Beijing, China, 2019; Available online: https://baike.so.com/doc/27163557-28556315.html (accessed on 20 February 2020).
  5. Ye, R.; Ge, J.; Zhang, W.; Zhao, H. Statistical analysis on impact from tropical cyclone on Guangdong-Hong Kong-Macao Greater Bay Area. Water Resour. Hydropower Eng. 2020, 51, 37–43. [Google Scholar] [CrossRef]
  6. Luo, Z.; Huang, B.; Qiu, J.; Tan, C.; Huang, G. Spatio-temporal distribution characteristics and influencing mechanisms of storm surge in Guangdong, Hong Kong and Macao Greater Bay Area. Water Resour. Prot. 2022, 38, 72–79. [Google Scholar] [CrossRef]
  7. He, H. Characteristics and analysis of storm surge in the Pearl River Estuary. Pearl River 1981, 2, 34–51. (In Chinese) [Google Scholar]
  8. Lu, R.; Ye, J. The research on the law of the maximum rising-stage due to the typhoon surge in the Pearl River Estuary. Pearl River 1982, 28–31. Available online: https://www.cnki.com.cn/Article/CJFDTotal-ZSDZ198202002.htm (accessed on 27 March 2025). (In Chinese)
  9. Shi, J.; Wang, Y.; Yu, B.; Lin, S.; Xia, Z. Longitudinal characteristics of storm surge in the Pearl River Estuary. Mar. Forecast. 2000, 17, 47–51. (In Chinese) [Google Scholar]
  10. Wang, Y.; Shi, J.; Yu, B.; Xia, Z. Analysis of the upstream going tropical storm surge along the Pearl River. Mar. Sci. Bull. 1998, 17, 10–16. (In Chinese) [Google Scholar]
  11. Chen, S.; Feng, Y. Analysis of storm surge (8309). Guangdong Water Resour. Hydropower 1985, 24–34. Available online: https://kns.cnki.net/kcms2/article/abstract?v=zE0--Q1IihSQeZOBMdeaFJWQtg7r1_mc_E9P0WH3L1nbVF8Tq26s0TV3nB68KlbhB-S86hESFMs8boHzTg58DLV0zjpl1tn7572Nh_oH3U-Ti4Q3WHwopPdPK601wZwbqEs-KibriRIi1o2P6P9mg_P2oWSah2CF&uniplatform=NZKPT (accessed on 27 March 2025). (In Chinese)
  12. Ma, J.; Hu, J. Analysis and summary of storm surge in 2003 and their forecast. Mar. Forecast. 2004, 21, 78–85. (In Chinese) [Google Scholar]
  13. Liu, S.; Chen, Y.; Tan, Y. Storm surge simulation and characteristic analysis during typhoon “Mangkhut” 2018 in the Pearl River Estuary. Mar. Forecast. 2021, 38, 12–20. [Google Scholar] [CrossRef]
  14. Liu, R.; Zhu, Q.; Ni, P. Numerical simulation of storm surge process in Pearl River Estuary. Guangdong Water Resour. Hydropower 2018, 6–10. Available online: https://kns.cnki.net/kcms2/article/abstract?v=zE0--Q1IihTqHqMgfDxV48wDv9PyN-VcEk4_u3N4h-oWBfHYhOkcNEAa30ESrPsrzmvGKqOOhKo8RUJ4GtpNdRjXgm47MuEu8U85or4xjUPktNsDGFUTCOzLhF4E14j4ff9l5JE2ffj48bJ1KedX1wyl82Ip0hGs83rLueHIQls=&uniplatform=NZKPT (accessed on 27 March 2025). (In Chinese)
  15. Pan, C.; Zheng, J.; Wu, X.; Chen, G. Research progress of ocean waves forecasting method. J. Hohai Univ. (Nat. Sci.) 2021, 49, 394–400. [Google Scholar] [CrossRef]
  16. Luo, Z.; Huang, B.; Chen, X.; Tan, C.; Qiu, J.; Huang, G. Effects of wave current interaction on storm surge in the Pearl River Estuary: A case study of Super Typhoon Mangkhut. Front. Mar. Sci. 2021, 8, 692359. [Google Scholar] [CrossRef] [Scilit]
  17. Pan, M.; Yang, F.; Jing, L.; Luo, Z.; Wang, Q.; Kong, J. Dynamic mechanism of salinity intrusion in Modaomen Waterway during typhoon” Nesa” transit. Water Resour. Prot. 2019, 35, 42–48. [Google Scholar] [CrossRef]
  18. Zhi, L.; Gou, M.; Li, X.; Bai, J.; Cui, B.; Zhang, Q.; Wang, G.; Bilal, H.; Abdullahi, U. Effects of Sea Level Rise on Land Use and Ecosystem Services in the Liaohe Delta. Water 2022, 14, 841. [Google Scholar] [CrossRef] [Scilit]
  19. Fang, J.; Yin, J.; Shi, X.; Fang, J.; Du, S.; Liu, M. A review of compound flood hazard research in coastal areas. Adv. Clim. Change Res. 2021, 17, 317–328. [Google Scholar] [CrossRef]
  20. Jia, N.; Liu, Q.; Shi, X.; Zhao, M.; Liu, S.; Yang, Y. Comparative analysis of the impact of typhoon storm surge disaster and the disaster-causing difference between typhoon “Hato” (1713) and “Mangkhut” (1822) based on field survey. Mar. Forecast. 2022, 39, 94–99. [Google Scholar] [CrossRef]
  21. He, F.; Hu, H.; Dong, G.; Xu, H. Compound Flooding Simulation and Prediction of Future Recurrence in Shanghai Downtown Area. J. Catastrophology 2020, 35, 93–98, 134. [Google Scholar] [CrossRef]
  22. Xu, L.; Cui, S.; Wang, X.; Tang, J.; Nitivattananon, V.; Ding, S.; Nguyen, M.N. Dynamic risk of coastal flood and driving factors: Integrating local sea level rise and spatially explicit urban growth. J. Clean. Prod. 2021, 321, 129039. [Google Scholar] [CrossRef] [Scilit]
  23. Zeng, Z.; Lai, C.; Wang, Z.; Chen, Y.; Chen, X. Future sea level rise exacerbates compound floods induced by rainstorm and storm tide during super typhoon events: A case study from Zhuhai, China. Sci. Total Environ. 2024, 911, 168799. [Google Scholar] [CrossRef] [Scilit]
  24. Zeng, Z.; Yang, F.; Wu, X.; Wang, Z.; Lai, C.; Wu, X.; Chen, X. Study on flood and inundation law under different encounter scenarios of extreme storms and spring tides in northern part of Hengqin Island, Zhuhai City. Water Resour. Prot. 2015, 41, 42–50. [Google Scholar] [CrossRef]
  25. Mousavi, M.E.; Irish, J.L.; Frey, A.E.; Olivera, F.; Edge, B.L. Global warming and hurricanes: The potential impact of hurricane intensification and sea level rise on coastal flooding. Clim. Change 2011, 104, 575–597. [Google Scholar] [CrossRef] [Scilit]
  26. Arns, A.; Wahl, T.; Dangendorf, S.; Jensen, J. The impact of sea level rise on storm surge water levels in the northern part of the German Bight. Coast. Eng. 2015, 96, 118–131. [Google Scholar] [CrossRef] [Scilit]
  27. Zhao, C.J.; Ge, J.Z.; Ding, P.X. Impact of Sea Level Rise on Storm Surges around the Changjiang Estuary. J. Coast. Res. 2014, 68, 27–34. [Google Scholar] [CrossRef] [Scilit]
  28. Ma, Y.Y.; Wu, Y.J.; Shao, Z.X.; Cao, T.; Liang, B. Impacts of sea level rise and typhoon intensity on storm surges and waves around the coastal area of Qingdao. Ocean Eng. 2022, 249, 110953. [Google Scholar] [CrossRef] [Scilit]
  29. Zhang, M.; Jie, M.; Dai, Z. Impacts of sea-level rise on storm surge in the Beibu Gulf: A case study on Typhoon Son-Tinh in 2012. Mar. Sci. Bull. 2021, 40, 309–318. [Google Scholar] [CrossRef]
  30. Hu, Y.; Wang, Z.; Zhang, J.; Wu, Y. Influence of Sea Level Rise on Storm Surges in the Pearl River Estuary. Pearl River 2025, 46, 1–9. [Google Scholar] [CrossRef]
  31. 2023 China sea level bulletin, Ministry of Natural Resources of the People’s Republic of China. 2024. Available online: https://gi.mnr.gov.cn/202404/t20240429_2844012.html (accessed on 27 March 2025). (In Chinese)
  32. Bilskie, M.V.; Hagen, S.C.; Alizad, K.; Medeiros, S.C.; Passeri, D.L.; Needham, H.F.; Cox, A. Dynamic simulation and numerical analysis of hurricane storm surge under sea level rise with geomorphologic changes along the northern Gulf of Mexico. Earths Future 2016, 4, 177–193. [Google Scholar] [CrossRef] [Scilit]
  33. Neumann, J.E.; Emanuel, K.; Ravela, S.; Ludwig, L.; Kirshen, P.; Bosma, K.; Martinich, J. Joint effects of storm surge and sea-level rise on US Coasts: New economic estimates of impacts, adaptation, and benefits of mitigation policy. Clim. Change 2015, 129, 337–349. [Google Scholar] [CrossRef] [Scilit]
  34. Yin, J. Rapid Decadal Acceleration of Sea Level Rise along the U.S. East and Gulf Coasts during 2010–22 and Its Impact on Hurricane-Induced Storm Surge. J. Clim. 2023, 36, 4511–4529. [Google Scholar] [CrossRef] [Scilit]
  35. Fasullo, J.T.; Gent, P.R.; Nerem, R.S. Sea level rise in the CESM large ensemble: The role of individual climate forcings and consequences for the coming decades. J. Clim. 2020, 33, 6911–6927. [Google Scholar] [CrossRef] [Scilit]
  36. Hamlington, B.D.; Gardner, A.S.; Ivins, E.; Lenaerts, J.T.M.; Reager, J.T.; Trossman, D.S.; Zaron, E.D.; Adhikari, S.; Arendt, A.; Aschwanden, A.; et al. Understanding of contemporary regional sea-level change and the implications for the future. Rev. Geophys. 2020, 58, e2019RG000672. [Google Scholar] [CrossRef] [Scilit] [PubMed]
  37. Harvey, T.C.; Hamlington, B.D.; Frederikse, T.; Nerem, R.S.; Piecuch, C.G.; Hammond, W.C.; Blewitt, G.; Thompson, P.R.; Bekaert, D.P.S.; Landerer, F.W.; et al. Ocean mass, sterodynamic effects, and vertical land motion largely explain US coast relative sea level rise. Commun. Earth Environ. 2021, 2, 233. [Google Scholar] [CrossRef] [Scilit]
  38. Wang, J.; Church, J.A.; Zhang, X.; Chen, X. Reconciling global mean and regional sea level change in projections and observations. Nat. Commun. 2021, 12, 990. [Google Scholar] [CrossRef] [Scilit] [PubMed]
  39. IPCC. AR6 Synthesis Report: Climate Change 2023; Intergovernmental Panel on Climate Change (IPCC): Geneva, Switzerland, 2023; Available online: https://www.fao.org/family-farming/detail/zh/c/1654262/ (accessed on 27 March 2025).
  40. Song, L.; Wu, S.; Ding, Y.; Luo, Y.; Zhang, J. (Eds.) Evolution of Climate and Ecological Environment in China: 2021; Science Press: Beijing, China, 2021; ISBN 978-7-03-069782-0. [Google Scholar]
  41. Hong Kong Observatory. Average Sea Level Projection Data of Hong Kong. Available online: https://www.hko.gov.hk/te/climate_change/projhkmslmedconfinfo.htm (accessed on 27 March 2025).
  42. Wang, L.; Huang, G.; Zhou, W.; Chen, W. Historical change and future scenarios of sea level rise in Macau and adjacent waters. Adv. Atmos. Sci. 2016, 33, 462–475. [Google Scholar] [CrossRef] [Scilit]
  43. Ding, X.; Zheng, D.; Chen, Y.; Chao, J.; Li, Z. Sea level change in Hong Kong from tide gauge measurements of 1954–1999. J. Geod. 2001, 74, 683–689. [Google Scholar] [CrossRef] [Scilit]
  44. Shi, X.; Chen, T.; Yu, K. Sea-level changes in Zhujiang estuary over last 40 years. Mar. Geol. Quat. Geol. 2008, 28, 127–134. [Google Scholar] [CrossRef]
  45. You, D.; Tang, C.; Deng, S.; Yang, H.; Sheng, D. The Characteristics of Sea Level Change around the Pearl River Estuary in Recent 15 Years and the related Severe Saline Water Intrusion. Guangdong Meteorol. 2009, 31, 4–5, 9. [Google Scholar] [CrossRef]
  46. Jia, P.; Zeng, Z.; Zhou, X. Guangdong-Hong Kong-Macao Greater Bay Area: Or will become a ‘special zone’ for extreme weather and climate research—Review of the First Hong Kong-Macao Greater Bay Area Academic Conference on Extreme Weather, Climate and Disaster Risk. Adv. Meteorol. Sci. Technol. 2020, 10, 149–151. [Google Scholar] [CrossRef]
  47. Kang, L.; Ma, L.; Liu, Y. Evaluation of farmland losses from sea level rise and storm surges in the Pearl River Delta region under global climate change. J. Geogr. Sci. 2016, 26, 439–456. [Google Scholar] [CrossRef] [Scilit]
  48. Song, L.; Wu, S.; Ding, Y.; Luo, Y.; Zhang, J. (Eds.) Regional Impact, Vulnerability and Adaptation. In Evolution of Climate and Ecological Environment in China: 2021; Science Press: Beijing, China, 2021; Volume 2, Part 2; ISBN 978-7-03-069782-0. [Google Scholar]
  49. National Bureau of Statistics of China. China Statistical Yearbook 2024; China Statistics Press: Beijing, China, 2024; ISBN 978-7-5230-0486-9. [Google Scholar]
  50. Guangdong Provincial Bureau of Statistics; National Bureau of Statistics Survey Office in Guangdong. Guangdong Statistical Yearbook 2024; China Statistics Press: Beijing, China, 2024; ISBN 978-7-5230-0461-6. [Google Scholar]
  51. Yin, X.F.; Wang, Y.J.; Zhang, T.T. The methods for calculating the extreme distribution and their applications in the Yellow River Mouth area. J. Oceanogr. Huanghai Bohai Seas 1990, 8, 9–15. (In Chinese) [Google Scholar]
  52. Wang, X.N. Storm Surge Disaster Risk Assessment and Impact Forecasting Research. Doctoral Dissertation, Wuhan University, Wuhan, China, 2016. Available online: https://kns.cnki.net/kcms2/article/abstract?v=zE0--Q1IihQSkvSfouO12lxZc9iH7IeTCWNtNnoVoAga_SdMpprNlZlfHkfoVqwms2NHzi6fqrutiknoqpOHGRnxOzl2D0qKR7QuosnasGcMOUMO9WwnxEgXC2U8NErcBXyYXgemwpbmn91h_ELdbPr2jI5Zf4IAXdZmOEGmfQR5BC6KhRYMtg==uniplatform=NZKPT (accessed on 27 March 2025).
  53. Zhuang, Y. Research on the Algorithm of Return Period Water Level and Its Spatial Distribution in the Coastal Area of China; Zhejiang Ocean University: Zhoushan, China, 2020. [Google Scholar] [CrossRef]
  54. Xu, W.; Cai, R. Impacts of sea level rise, strong typhoon and storm surge on extreme sea level in coastal waters of Xiamen and hazards estimation. Haiyang Xuebao 2021, 43, 14–26. [Google Scholar] [CrossRef]
  55. Liu, H.-K.; Li, L.; Song, Y.-G. Impact of Sea Level Rise on Design High Tide Level in Shanghai Coast. Water Resour. Power 2024, 42, 46–49, 121. [Google Scholar] [CrossRef]
  56. Zhuang, Y.; Ji, Q.; Zuo, J.; Li, Z.; Luo, F. Effects of Sea-Level Rise on the Recurrence Periods of Extreme Water Levels in Coastal Areas of China. Adv. Mar. Sci. 2021, 39, 20–29. [Google Scholar] [CrossRef]
  57. Zhu, Y.; Li, Z. Sea level variation and the effect to water level extreme distribution estimate in south China. Trans. Oceanol. Limnol. 2011, 04, 126–133. [Google Scholar] [CrossRef]
  58. Zhang, J.; Xu, W.; Xu, B.; Zhao, J.; Liang, C.; Zhang, W.; Deng, J. Application of GIS Spatial Analysis for the Assessment of Storm Surge Inundation Risks in the Guangdong–Macao–Hong Kong Great Bay Area. Water 2024, 16, 2554. [Google Scholar] [CrossRef] [Scilit]
  59. Design Guide for Coastal Leyee Project of Guangdong Province, Guangdong Provincial Bureau of Quality and Technical Supervision, DB44/T182-2004, ICS 93.160, P55, 15615-2004. Available online: https://www.doc88.com/p-6425053077454.html (accessed on 27 March 2025).
  60. Shaevitz, D.A.; Camargo, S.J.; Sobel, A.H.; Jonas, J.A.; Kim, D.; Kumar, A.; LaRow, T.E.; Lim, Y.; Murakami, H.; Reed, K.A.; et al. Characteristics of tropical cyclones in high-resolution models in the present climate. J. Adv. Model. Earth Syst. 2014, 6, 1154–1172. [Google Scholar] [CrossRef] [Scilit]
  61. Kopp, R.E.; Horton, R.M.; Little, C.M.; Mitrovica, J.X.; Oppenheimer, M.; Rasmussen, D.J.; Strauss, B.H.; Tebaldi, C. Probabilistic 21st and 22nd century sea-level projections at a global network of tide-gauge sites. Earths Future 2014, 2, 383–406. [Google Scholar] [CrossRef] [Scilit]
  62. Little, C.M.; Horton, R.M.; Kopp, R.E.; Oppenheimer, M.; Vecchi, G.A.; Villarini, G. Joint projections of US East Coast sea level and storm surge. Nat. Clim. Change 2015, 5, 1114–1120. [Google Scholar] [CrossRef] [Scilit]
  63. ADCIRC User’s Manual-V50. Available online: https://adcirc.org/ (accessed on 27 March 2025).
  64. Available online: https://www.aviso.altimetry.fr/en/data/products/auxiliary-products/global-tide-fes.html (accessed on 27 March 2025).
  65. The Best Track Dataset for Tropical Cyclone. Available online: http://tcdata.typhoon.org.cn/ (accessed on 27 March 2025).
  66. Jelesnianski, C.P. Numerical computations of storm surges without bottom stress. Mon. Weather Rev. 1966, 94, 379–394. [Google Scholar] [CrossRef] [Scilit]
  67. Bulletin of China Marine Disaster. Department of Marine Early Warning and Monitoring, Ministry of Natural Resources. 2018. Available online: https://www.mnr.gov.cn/sj/sjfw/hy/gbgg/zghyzhgb/ (accessed on 27 March 2025). (In Chinese)
  68. Bulletin of South China Sea Marine Disaster. Bureau of South China Sea, Ministry of Natural Resources. 2018. Available online: https://scs.mnr.gov.cn/scsbsjb/gbytj/201911/2869e63f324d4b9ea0e191237e17e389.shtml.https://nr.gd.gov.cn/xwdtnew/xwfbh/fbhsl/hyr/content/post_2739985.html (accessed on 27 March 2025). (In Chinese)
  69. Bulletin of Guangdong Marine Disaster. Department of Natural Resources of Guangdong Province. 2018. Available online: https://nr.gd.gov.cn/zwgknew/tzgg/gg/content/post_3186928.html (accessed on 27 March 2025). (In Chinese)
  70. Guangdong Marine Science Data Sharing Platform. Available online: http://gdod.scsio.ac.cn (accessed on 27 March 2025).
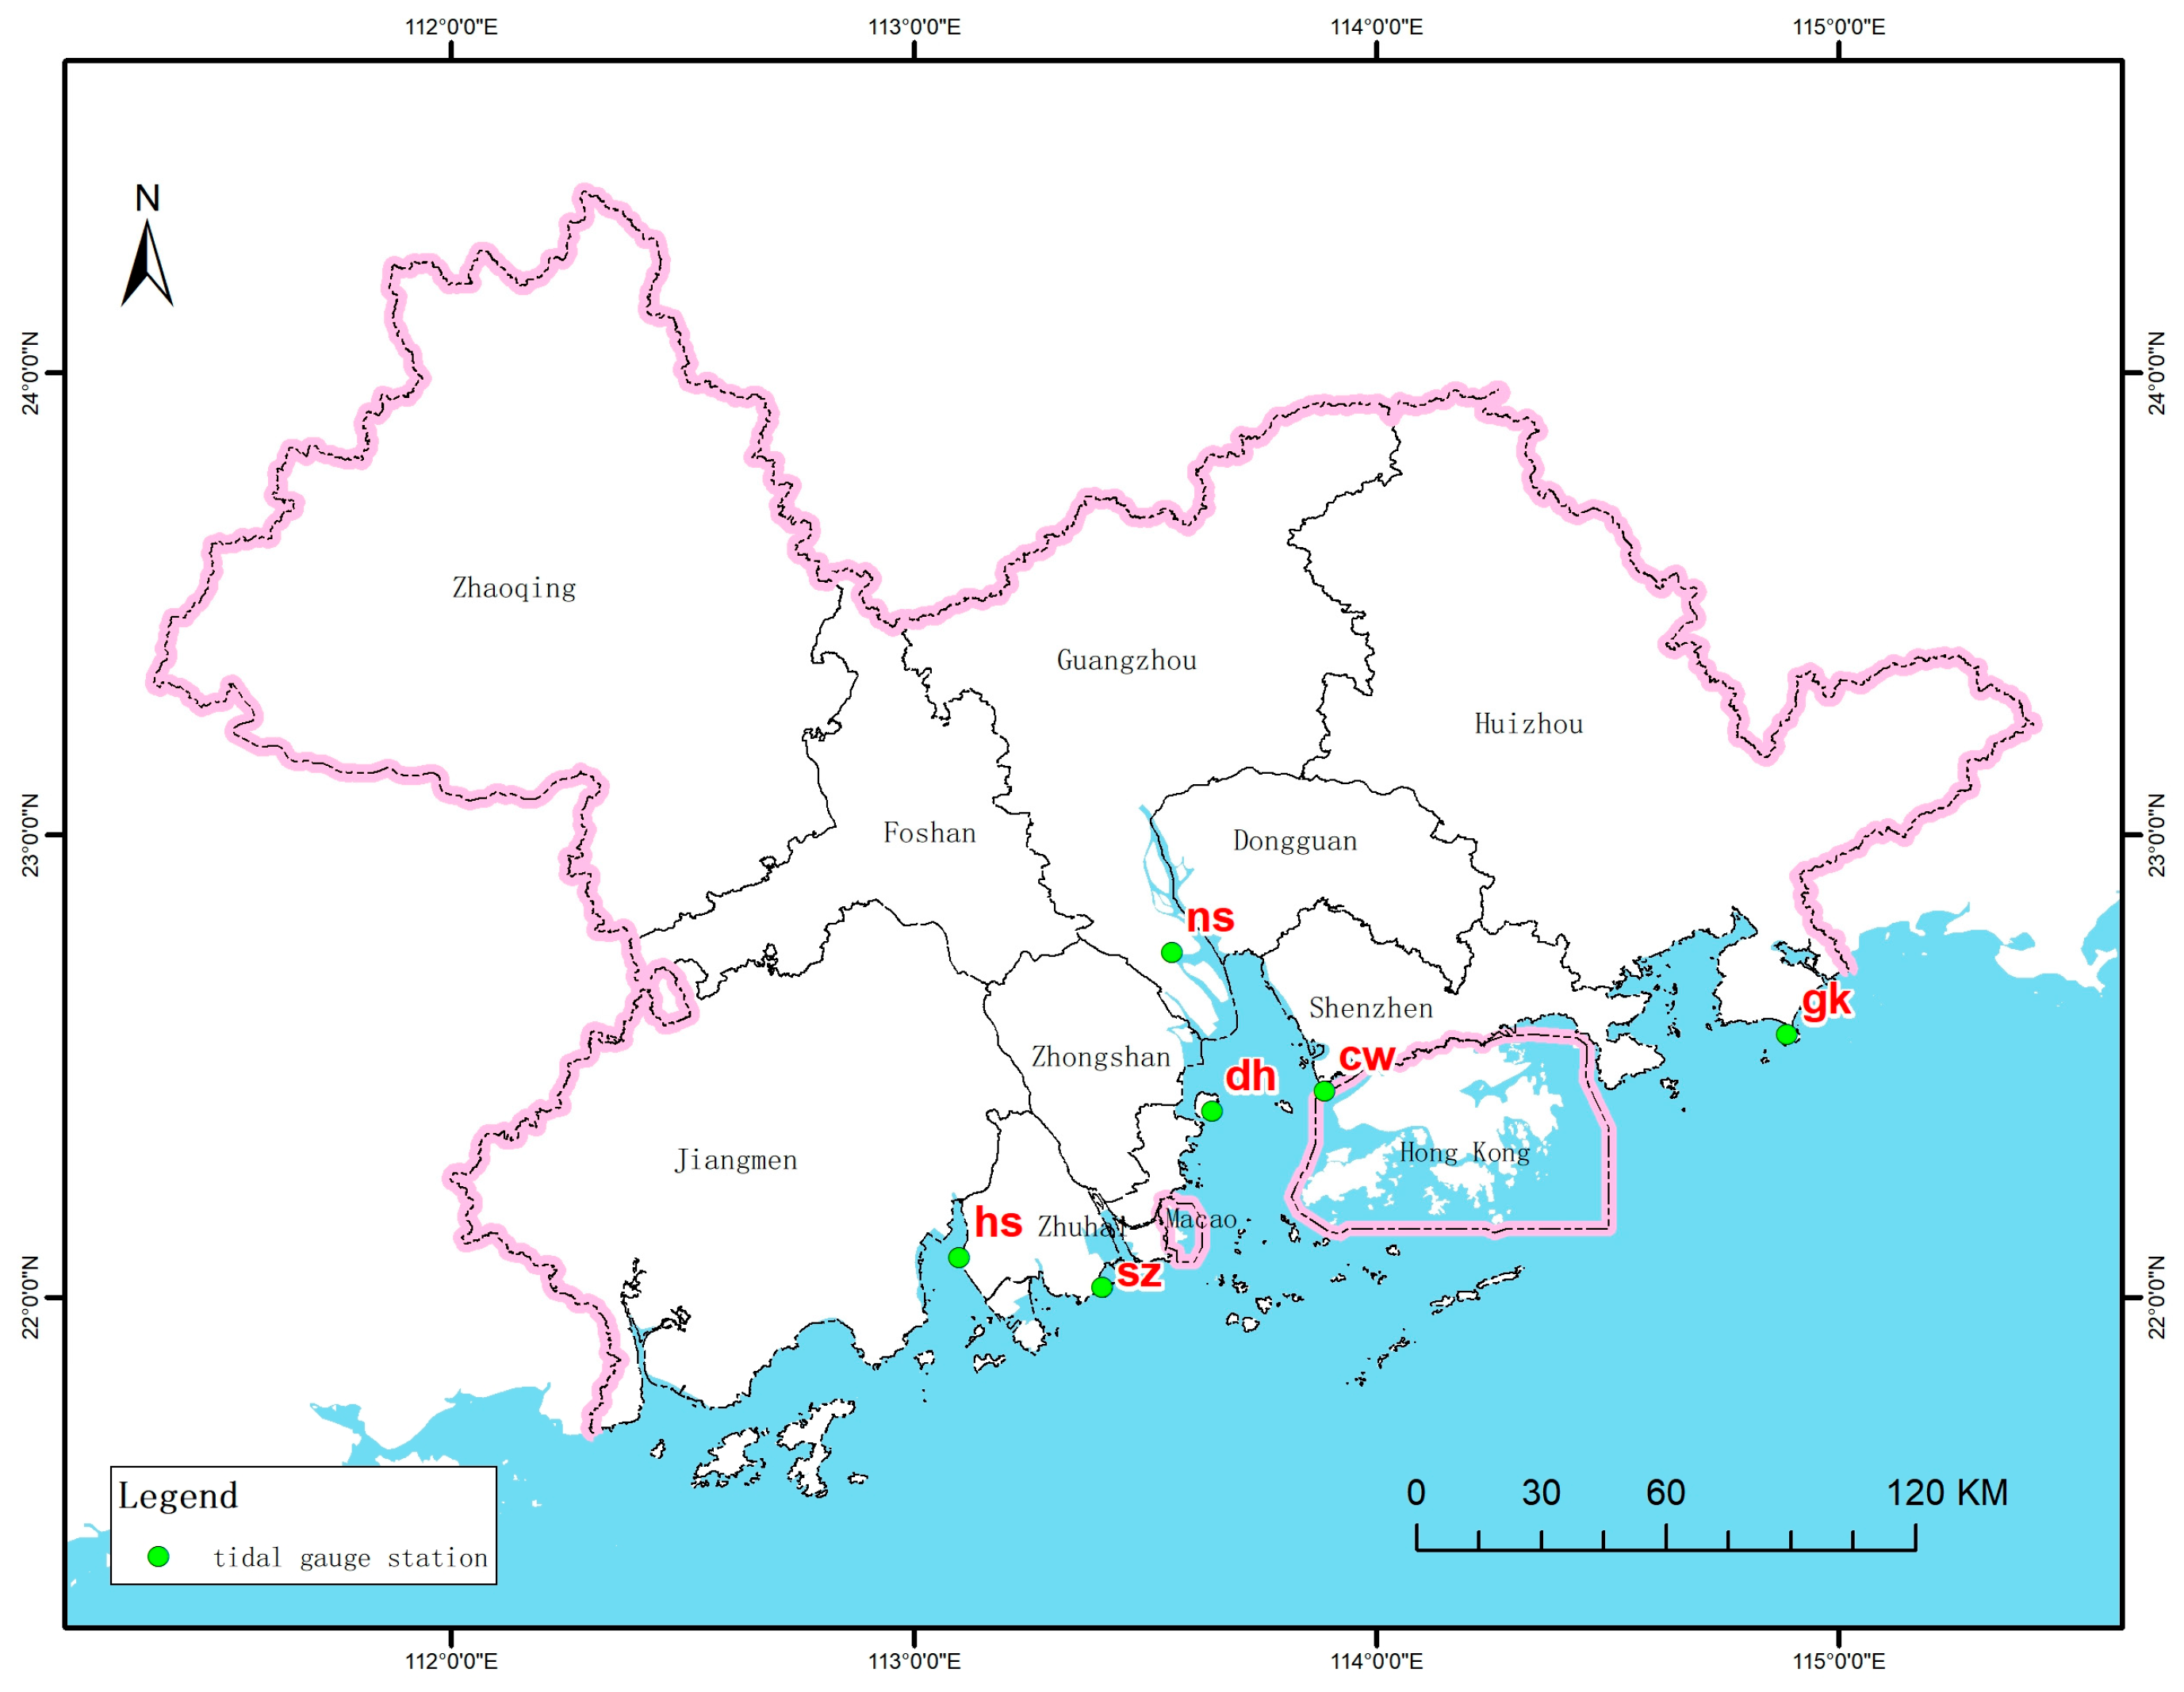
Figure 1. Locations of tide gauge stations in GBA.
Jmse 14 00330 g001
Figure 2. Grid discretization (ac) and bathymetric distribution (d) within the model domain.
Jmse 14 00330 g002
Figure 3. Simulation and predictive regression of maximum storm surge elevation.
Jmse 14 00330 g003
Figure 4. Future changes in extreme water-level events and return periods of tidal stations in the GBA under different SLR scenarios.
Jmse 14 00330 g004
Figure 5. Unfavorable typhoon track set constructed based on Typhoon Mangkhut (No. 1822).
Jmse 14 00330 g005
Figure 6. Inundation hazard analysis of typhoon storm surges in the GBA.
Jmse 14 00330 g006
Figure 7. Spatial distribution of storm surge inundation extents for cities in the GBA under different SLR scenarios.
Jmse 14 00330 g007
Table 1. Global sea-level rise projections (IPCC6) [39].
YearScenario NameGlobal Sea-Level Rise (cm)
2050SSP1-2.6 (Sustainability, Low Emissions)19 (16–25)
SSP5-8.5 (Fossil-Fueled Development, Very High Emissions)21 (18–26)
2100SSP2-4.5 (Middle of the Road, Intermediate Emissions)56 (44–76)
SSP5-8.5 (Fossil-Fueled Development, Very High Emissions)77 (63–102)
Table 2. Changes in extreme water levels over 50- and 100-year return periods at each tidal station under different SLR scenarios (unit: cm).
Tide Gauge StationReturn Period (a)Current State20502100
ssp2-2.6SSP5-8.5ssp2-4.5SSP5-8.5
gk50244266.7270.4313.6340.7
cw50333358.6362.8412.3443.3
ns50372396.6 400.7 448.6 478.7
dh50375400.1404.1452.9483.4
sz50400428.7 433.6 490.2 525.8
hs50368392.8396.8444.4474.3
gk100254276.6280.5325.3353.5
cw100357384388.5441.5474.7
ns100396422.5 426.9 477.9 509.9
dh100398424.6429480.6513.1
sz100437468.5 473.8 535.6 574.5
hs100389415.2419.5469.8501.4
Table 3. Changes in return periods of extreme water levels at GBA tidal stations under different SLR scenarios (unit: a).
Tide Gauge StationCurrent Return Period (a)20502100
ssp2-2.6ssp5-8.5ssp2-4.5ssp5-8.5
gk5011.391.61.0
cw502522.37.54.2
ns502623.284.5
dh502522.47.64.4
sz5030.328.112.58.2
hs5023.521.16.73.8
gk10021.216.92.31.2
cw100484313.57.4
ns1004944147.8
dh10047.542.113.17.2
sz10057.853.222.214.1
hs10044.439.511.56.1
Table 4. Parameters for constructing unfavorable typhoons in the GBA.
Minimum Central Pressure (hPa)950
Radius of Maximum Wind (km)36
Maximum Wind Speed (m/s)47
Moving Speed (km/h)15
Sea-Level Pressure (hPa)1008
Disclaimer/Publisher’s Note: The statements, opinions and data contained in all publications are solely those of the individual author(s) and contributor(s) and not of MDPI and/or the editor(s). MDPI and/or the editor(s) disclaim responsibility for any injury to people or property resulting from any ideas, methods, instructions or products referred to in the content.