1. Introduction
Rim-driven propellers (RDPs) represent an innovative propulsion concept in which the conventional hub and shaft are eliminated. In recent years, RDPs have regained considerable attention from an energy-efficiency perspective, in conjunction with the ongoing electrification of ship propulsion systems and the growing interest in integrated electric propulsion. Originally proposed by Kort [
1] in the 1940s, the rim-driven propulsion concept was difficult to realize at the time due to technological limitations. However, recent advances in power electronics and control technologies have enabled its practical implementation and commercial development [
2].
From a hydrodynamic standpoint, RDPs share several characteristics with ducted propellers, including the suppression of tip vortices and thrust enhancement through flow acceleration within the duct. Nevertheless, clear differences arise from their distinct driving mechanisms and associated hydrodynamic features. In RDPs, the electric motor must be accommodated inside the rim, which imposes significant constraints on the duct cross-sectional geometry. In addition, the gap flow between the rim and the duct generates complex flow structures and additional viscous losses [
3,
4,
5,
6]. While classical duct theory established by Kerwin et al. [
7] and more recent CFD-based shape optimization studies [
8,
9] have provided valuable insights into ducted propeller design, these approaches generally assume sufficient geometric freedom. Such assumptions are not directly applicable to RDPs, where duct shape modification is inherently restricted by the drivetrain configuration. Furthermore, although various efforts have been made to mitigate rotor–stator interaction effects and gap losses [
10,
11,
12,
13], these approaches have not directly addressed the control of viscous boundary layer separation occurring at the trailing edge of the duct.
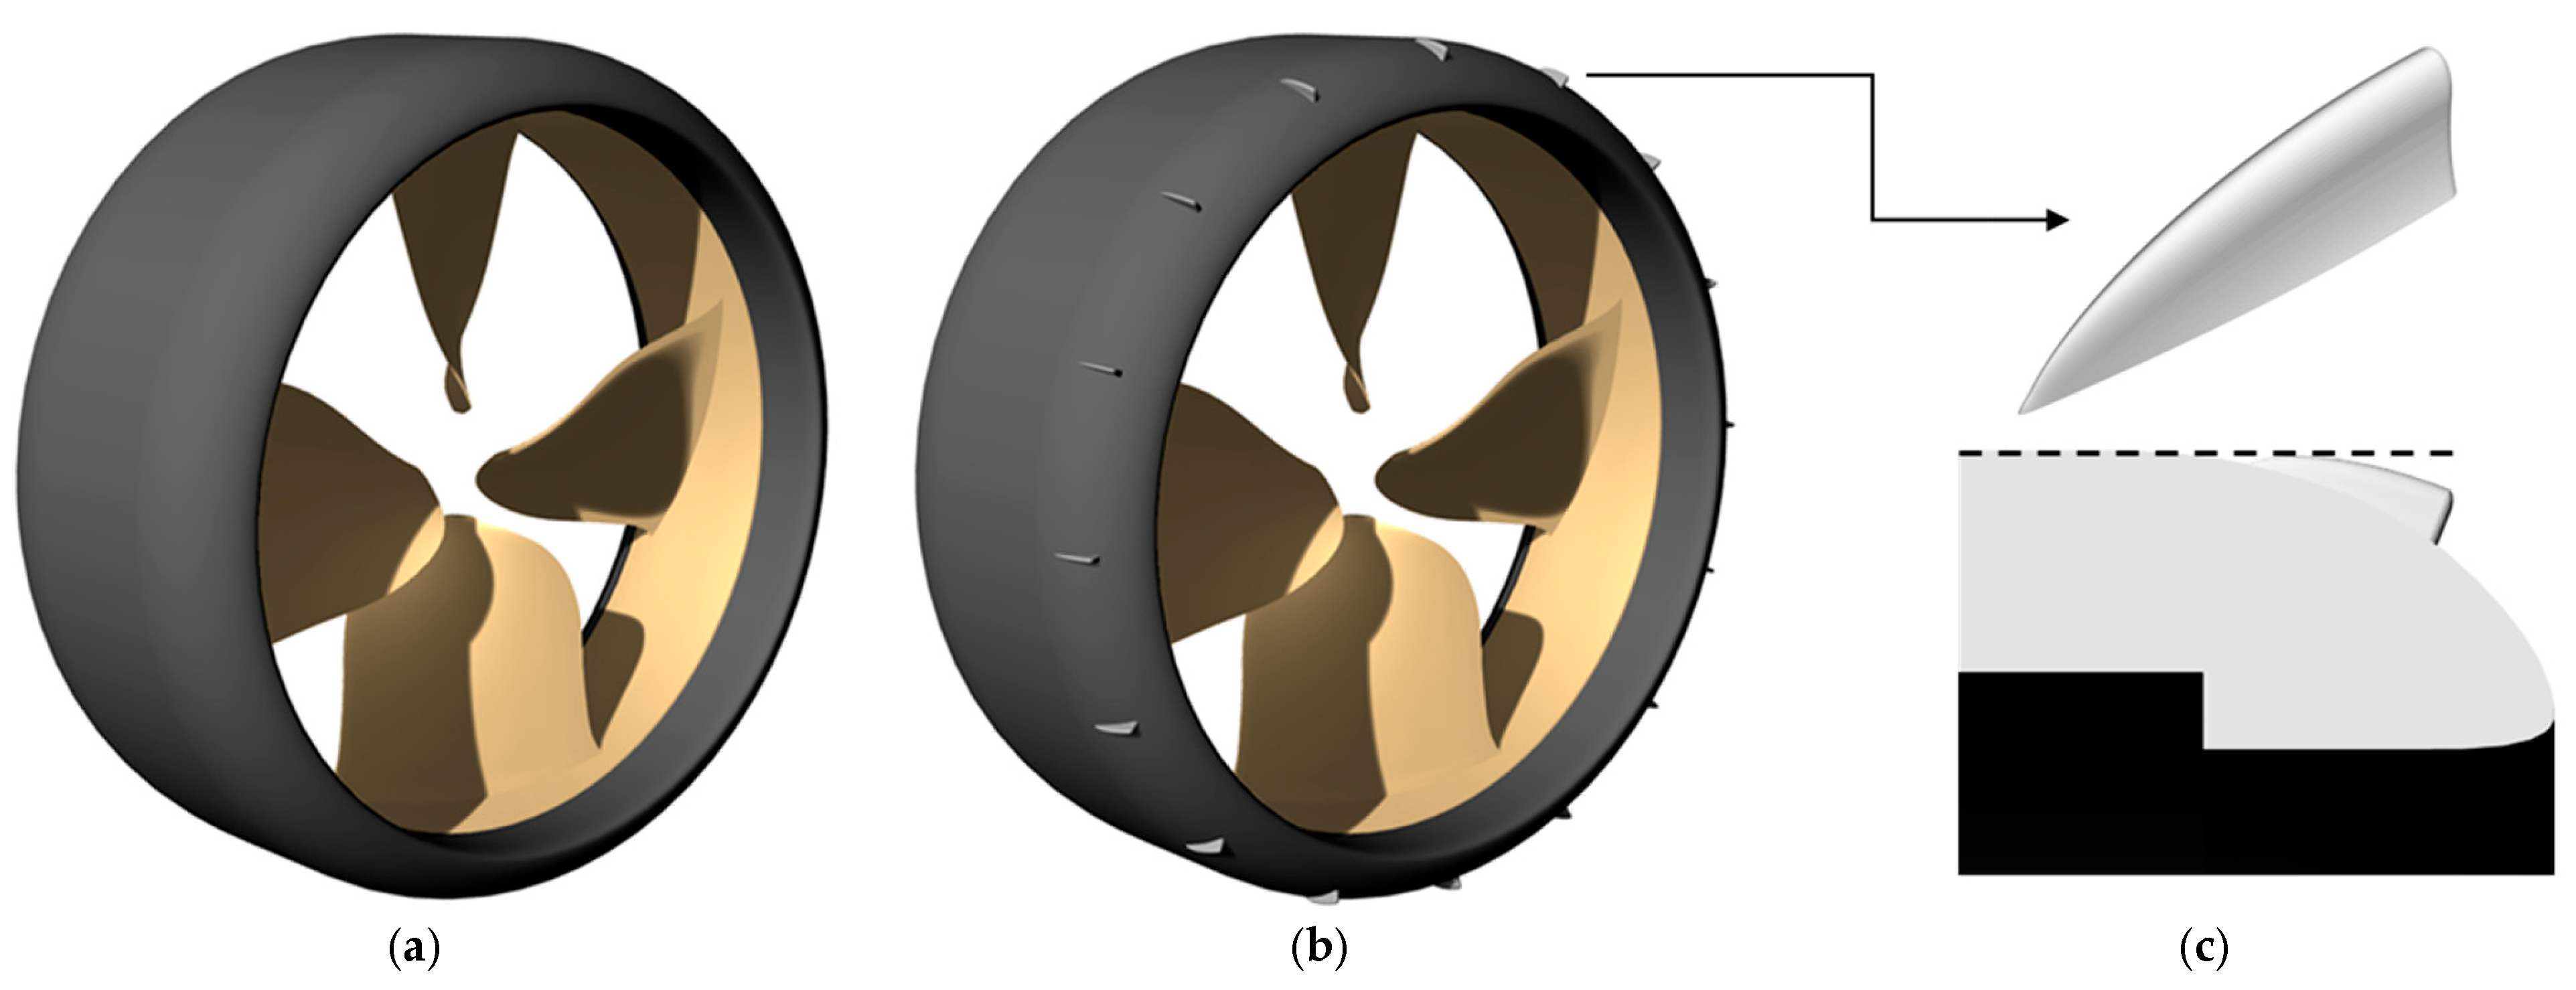
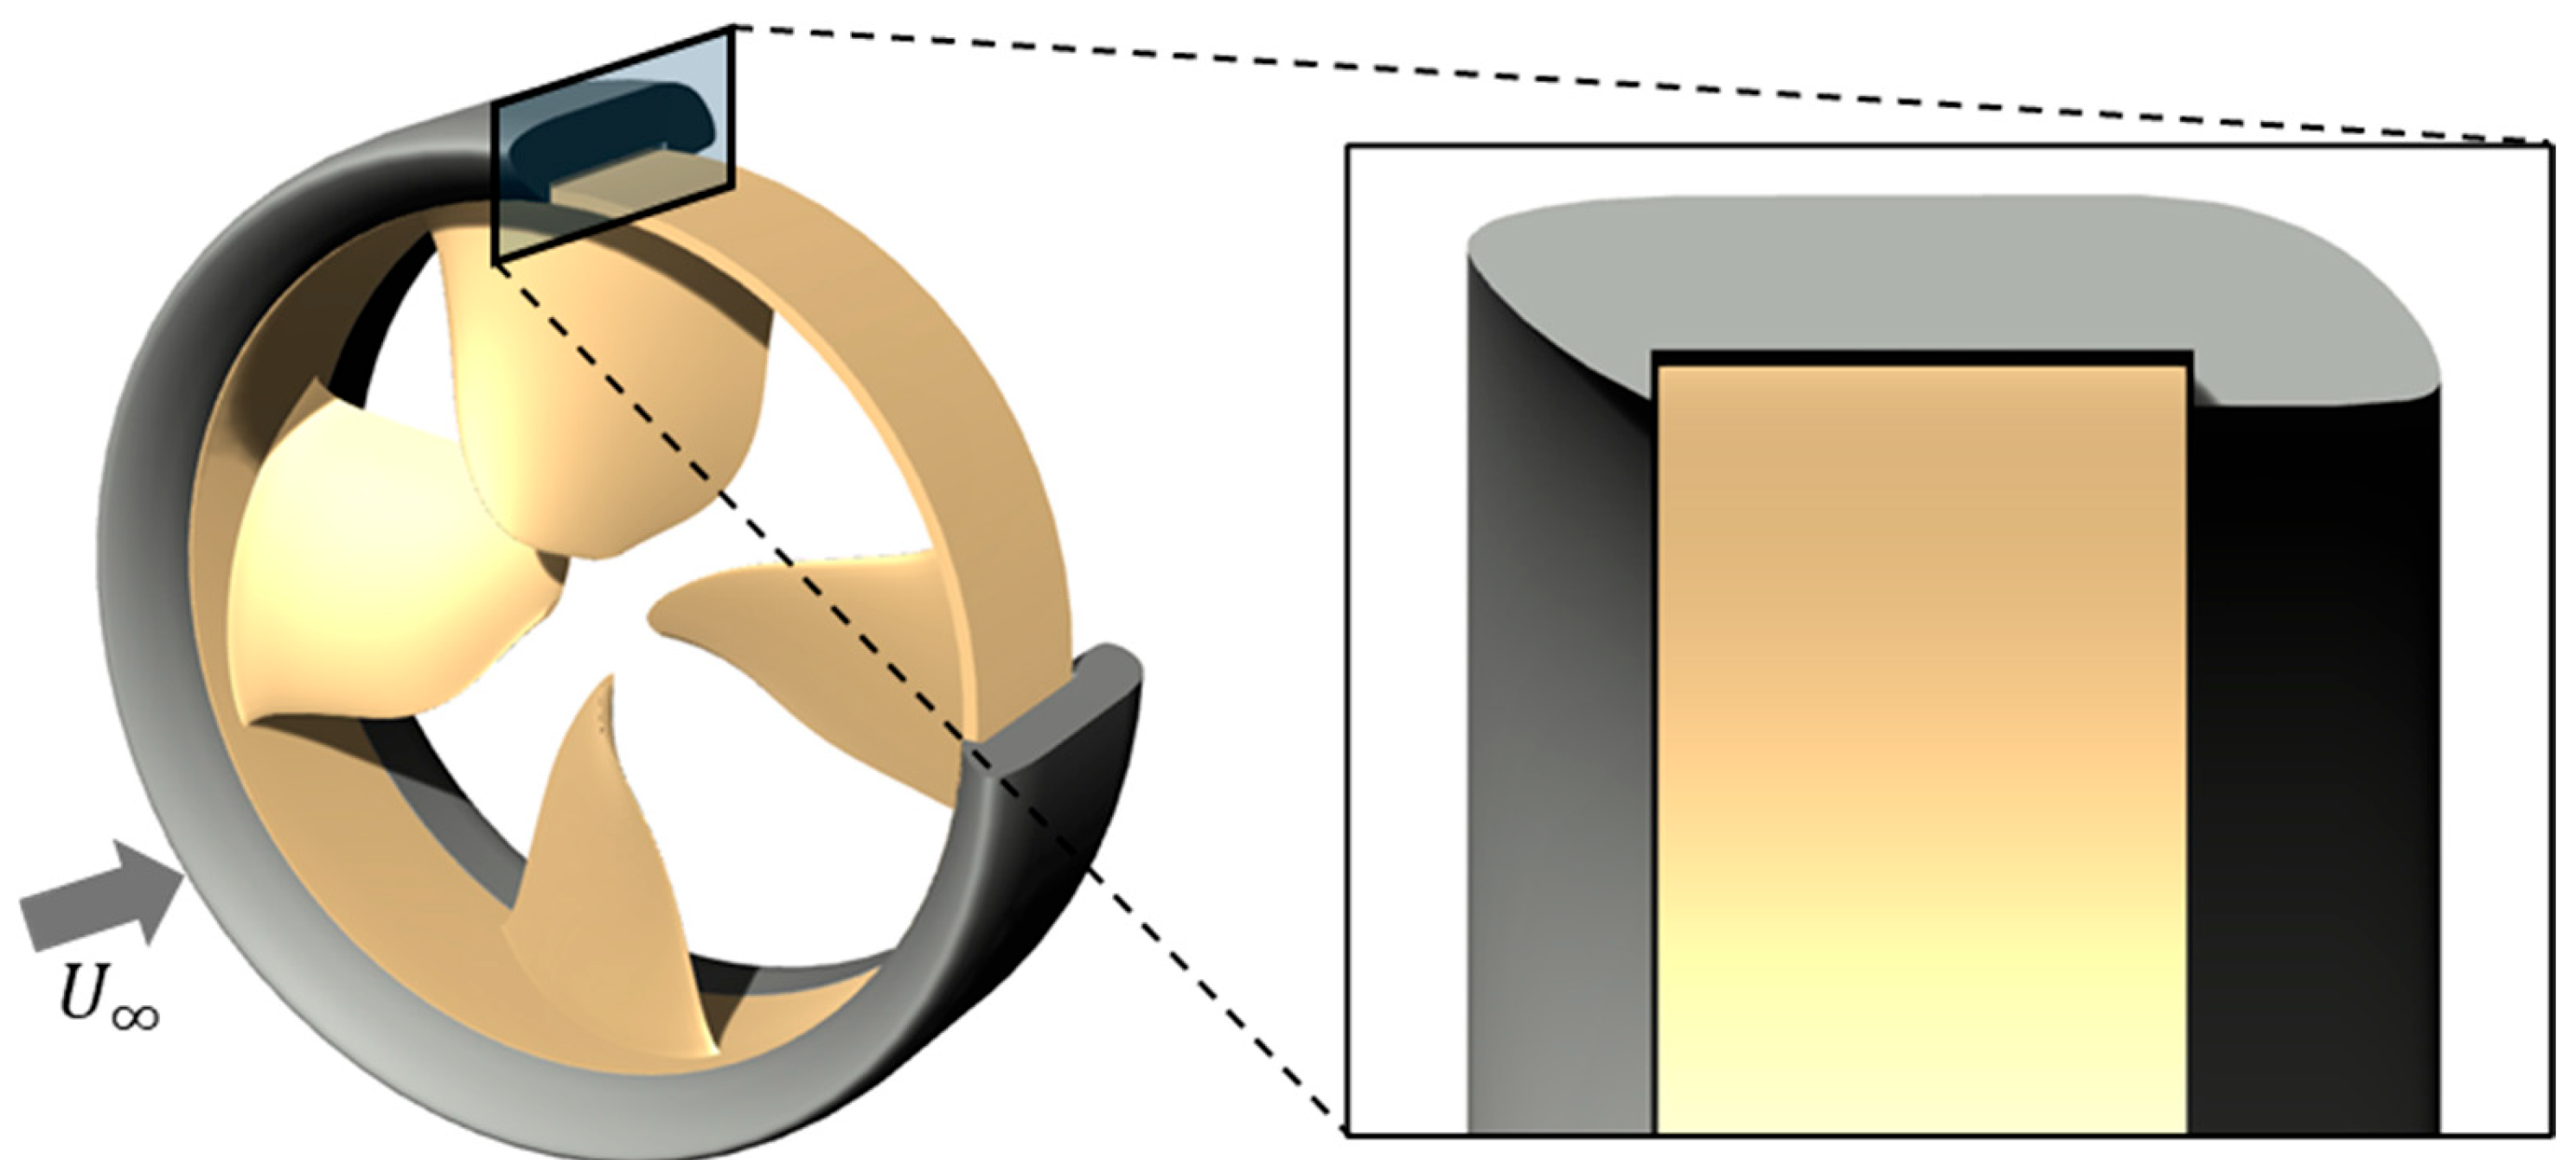
In this context, the present study explores the application of vortex generators (VGs) as an alternative flow control strategy for improving the performance of RDP ducts under structural constraints. VGs delay boundary layer separation by generating streamwise vortical motions that enhance near-wall mixing and help maintain attached flow under adverse pressure gradients. Their fundamental principles were systematically established in the field of aerospace engineering, where VGs were developed and applied as practical devices for separation control. McCullough et al. [
14] provided clear experimental evidence that small surface-mounted elements can delay turbulent separation and improve overall aerodynamic performance. Complementary studies by Peridier et al. [
15] and Smith et al. [
16] further showed that coherent near-wall vortical structures promote transport and mixing within the boundary layer by lifting low-momentum fluid away from the wall and enhancing exchange with the outer flow. This provides a physical basis for using VGs to deliberately generate streamwise vortical motions and increase mixing efficiency, which in turn supports separation delay. Lin [
17] provided a comprehensive review of low-profile VGs and their boundary layer control mechanisms. Godard and Stanislas [
18] further investigated the shape optimization of passive VGs in decelerating flows and identified key design parameters governing their effectiveness.
These concepts have subsequently been extended to marine applications. Brizzolara and Calcagno [
19] demonstrated that wedge-shaped VGs applied to ship roll fin stabilizers not only increased maximum lift but also significantly reduced cavitation and associated noise. Brandner and Walker [
20] experimentally investigated the hydrodynamic performance of VGs in water, with particular attention to cavitation inception. Mewis and Guiard [
21] developed the Mewis duct, incorporating internal fins to homogenize the wake flow, and successfully demonstrated its industrial applicability. Huang et al. [
22] showed that hull-mounted VGs can mitigate propeller–hull vortex cavitation and reduce pressure fluctuations.
Despite this extensive body of research, no published studies have reported the application of vortex generators to the duct surface of rim-driven propellers, particularly for shaftless RDP configurations, with the objective of performance enhancement. In RDPs, the duct typically has a large thickness-to-chord ratio to provide sufficient space for the motor, which increases susceptibility to boundary layer separation near the trailing edge. Such separation reduces thrust and lowers the efficiency of the overall propulsor. Accordingly, the present study numerically investigates the feasibility of controlling boundary layer behavior and reducing viscous losses by applying vortex generators to the duct surface of RDPs, while explicitly accounting for structural constraints that restrict duct shape modification.
Potential-flow-based methods such as the Boundary Element Method (BEM) [
23,
24] have been widely and successfully used for marine propeller analysis and can be regarded as complementary to CFD approaches. However, since the present study addresses localized boundary layer separation control and three-dimensional viscous flow behavior induced by vortex generators near the duct surface, a RANS-based CFD method is adopted to explicitly account for viscous effects.
CFD methodologies in marine propeller research have progressively expanded across different propulsor types. In the field of open propellers, Watanabe et al. [
25] incorporated cavitation models into CFD simulations, while Gaggero et al. [
26] systematically compared RANS and panel methods, concluding that panel methods are well-suited for design and optimization, whereas RANS approaches are more appropriate for high-fidelity performance assessment. These studies also demonstrated the capability of CFD to quantitatively predict the inception, development, and evolution of tip vortex cavitation in both open and ducted propellers. To further enhance numerical fidelity, Kim et al. [
27] applied a fully unstructured mesh-based viscous flow solver [
28] to accurately compute and validate the flow field around propellers.
In the context of ducted propellers, Bhattacharyya et al. [
29] combined RANS-based CFD with model-scale experiments to systematically analyze scale effects for propellers equipped with different duct geometries, identifying duct–propeller interaction, flow separation, and transition phenomena as key mechanisms governing variations in thrust, torque, and efficiency. Joung et al. [
30] subsequently presented a CFD-based optimization study focusing on duct and rim configurations.
The CFD techniques established for open and ducted propellers have more recently been extended to rim-driven propellers, which represent a relatively new propulsion concept. CFD-based performance analysis and design studies for RDPs have been increasingly reported in recent years. For example, Yakovlev et al. [
31] presented a CFD-based design and performance assessment of a rim-driven thruster and compared hub-type and hubless configurations with experimental measurements, demonstrating the applicability of CFD-driven approaches to RDP development. Song et al. [
32] later showed that the presence of a hub induces flow acceleration near the centerline and generates hub vortices that degrade efficiency and showed through CFD analysis that hubless RDPs possess inherently higher efficiency potential. These findings were further extended through the application of CFD-based optimization algorithms to RDP design [
33,
34]. Nevertheless, despite these active research efforts, attempts to control the flow or improve performance by applying vortex generators to shaftless RDPs have not yet been reported.
Against this background, the present study employs RANS-based CFD simulations to analyze the hydrodynamic effects of vortex generators applied to the duct of a rim-driven propeller, with explicit consideration of viscous phenomena. Numerical reliability is ensured through a grid convergence study based on the Grid Convergence Index (GCI). The study elucidates the physical mechanisms by which vortex generators delay boundary layer separation near the downstream end of the duct, enhance flow attachment, and promote pressure recovery. Particular emphasis is placed on demonstrating that these flow-control effects lead to consistent improvements in thrust and propulsive efficiency across the entire range of advance ratios, without imposing a significant torque penalty. Through this analysis, the study aims to show that vortex generators constitute a practical and effective performance-enhancement strategy for RDP designs in which geometric modification of the duct is severely constrained.
The remainder of this paper is organized as follows:
Section 2 describes the geometric design strategy of the RDP model, including the duct and vortex generators, with particular emphasis on minimizing drag increase and delaying flow separation.
Section 3 presents the numerical methodology, including the governing equations, computational domain, boundary conditions, and rotating flow modeling approach.
Section 4 analyzes the flow characteristics induced by the application of vortex generators through velocity distributions, surface flow visualization, and pressure field analysis, and quantitatively evaluates the resulting improvements in open-water performance. Finally,
Section 5 summarizes the main conclusions of the study and outlines directions for future research.
3. Numerical Methods and Computational Setup
3.1. Numerical Model
The fluid flow is governed by the incompressible, Newtonian Navier–Stokes equations. Applying Reynolds averaging to these equations yields the Reynolds-Averaged Navier–Stokes (RANS) formulation. The continuity and momentum equations are expressed as follows:
where
means the mean velocity component and external body force in the Cartesian coordinate directions
.
is time,
is the mean pressure, and
is an external force. The density and dynamic viscosity of the fluid are denoted by
and
, respectively. For an incompressible flow, density is assumed to be constant. The term
represents the Reynolds stress tensor arising from turbulent velocity fluctuations. In this study, the Reynolds stress is modeled as a linear function of the mean strain rate based on the Boussinesq hypothesis. Consequently, Equation (2) can be rewritten as follows:
where
represents the eddy viscosity.
The RDP features a unique configuration in which the blade tips are directly attached to the rim, eliminating the tip clearance. This configuration induces strong velocity gradients and significant near-wall flow variations along the inner and outer surfaces of the duct. To accurately capture these complex flow characteristics, particularly separated flow around marine propellers [
39], the shear stress transport (SST)
turbulence model [
40] is employed. In this model, two additional transport equations for the turbulent kinetic energy
and the specific dissipation rate
, are solved to evaluate the eddy viscosity
. All numerical simulations were conducted using the commercial finite volume solver, STAR-CCM+ (ver. 2410) [
41].
3.2. Rotating Flow Description
The rim-driven propeller (RDP) represents a typical rotating flow problem, in which accurate modeling of the relative motion between rotating and stationary regions is essential for reliable prediction of the wake structure and propulsive performance. Accordingly, a rotational-frame-based numerical approach was adopted.
In the present study, the primary focus is on the relative comparison of time-averaged performance indicators under steady operating conditions, namely open-water characteristics. Accordingly, a steady-state multiple reference frame (MRF) approach was selected as the baseline computational framework, owing to its favorable balance between computational efficiency and convergence stability. For steady open-water operating conditions, the MRF approach is a practical and commonly adopted choice for propeller-type rotating flow simulations to obtain time-averaged performance metrics with reasonable computational cost. The MRF method introduces a rotating reference frame to model rotational effects without physically rotating the mesh, and it has been widely applied to the steady operating analysis of rotating machinery such as propellers, pumps, and turbines.
When the absolute velocity
of a material point
is defined in the inertial (stationary) reference frame, the corresponding relative velocity
observed in the rotating reference frame is defined as follows:
Here, denotes the translational velocity of the origin of the rotating reference frame with respect to the stationary frame, represents the angular velocity of the rotating frame, and is the position vector of the material point measured from the origin of the rotating reference frame. In other words, by separating the contributions of translational motion and rotational motion from the absolute velocity, the relative flow velocity in the rotating reference frame can be properly described.
The MRF formulation allows the originally unsteady rotational motion to be treated as a steady-state problem by transforming the governing equations from the stationary reference frame to the rotating reference frame, rather than explicitly resolving the time-dependent rotation in the inertial frame. As a result of this transformation, additional body force terms appear on the right-hand side of the momentum equations to account for the rotational effects. These body force terms can be expressed as follows:
Here, the source terms on the right-hand side in Equation (3) corresponding to the Coriolis force and the centrifugal force represent inertial effects arising in the rotating reference frame. These terms allow the rotational effects within the rotating region to be incorporated into the flow field without physically moving the computational mesh. Consequently, the MRF approach enables the inherently time-dependent rotational motion to be treated as a steady-state problem, providing improved numerical stability and computational efficiency. This makes the MRF method particularly suitable for problems that require repeated simulations under multiple operating conditions, such as preliminary performance evaluations in the design stage.
Meanwhile, propeller-flow predictions may vary depending on the rotating flow modeling strategy and the associated computational setup, including the definition of rotating and stationary regions [
42]. Therefore, the present study specifies the rotating sub-domain and the domain boundary conditions consistently with the MRF framework, as described in the next section.
3.3. Computational Domain and Mesh Setup
To accurately analyze the flow characteristics of the rim-driven propeller under open water conditions, the computational domain and mesh were configured as follows.
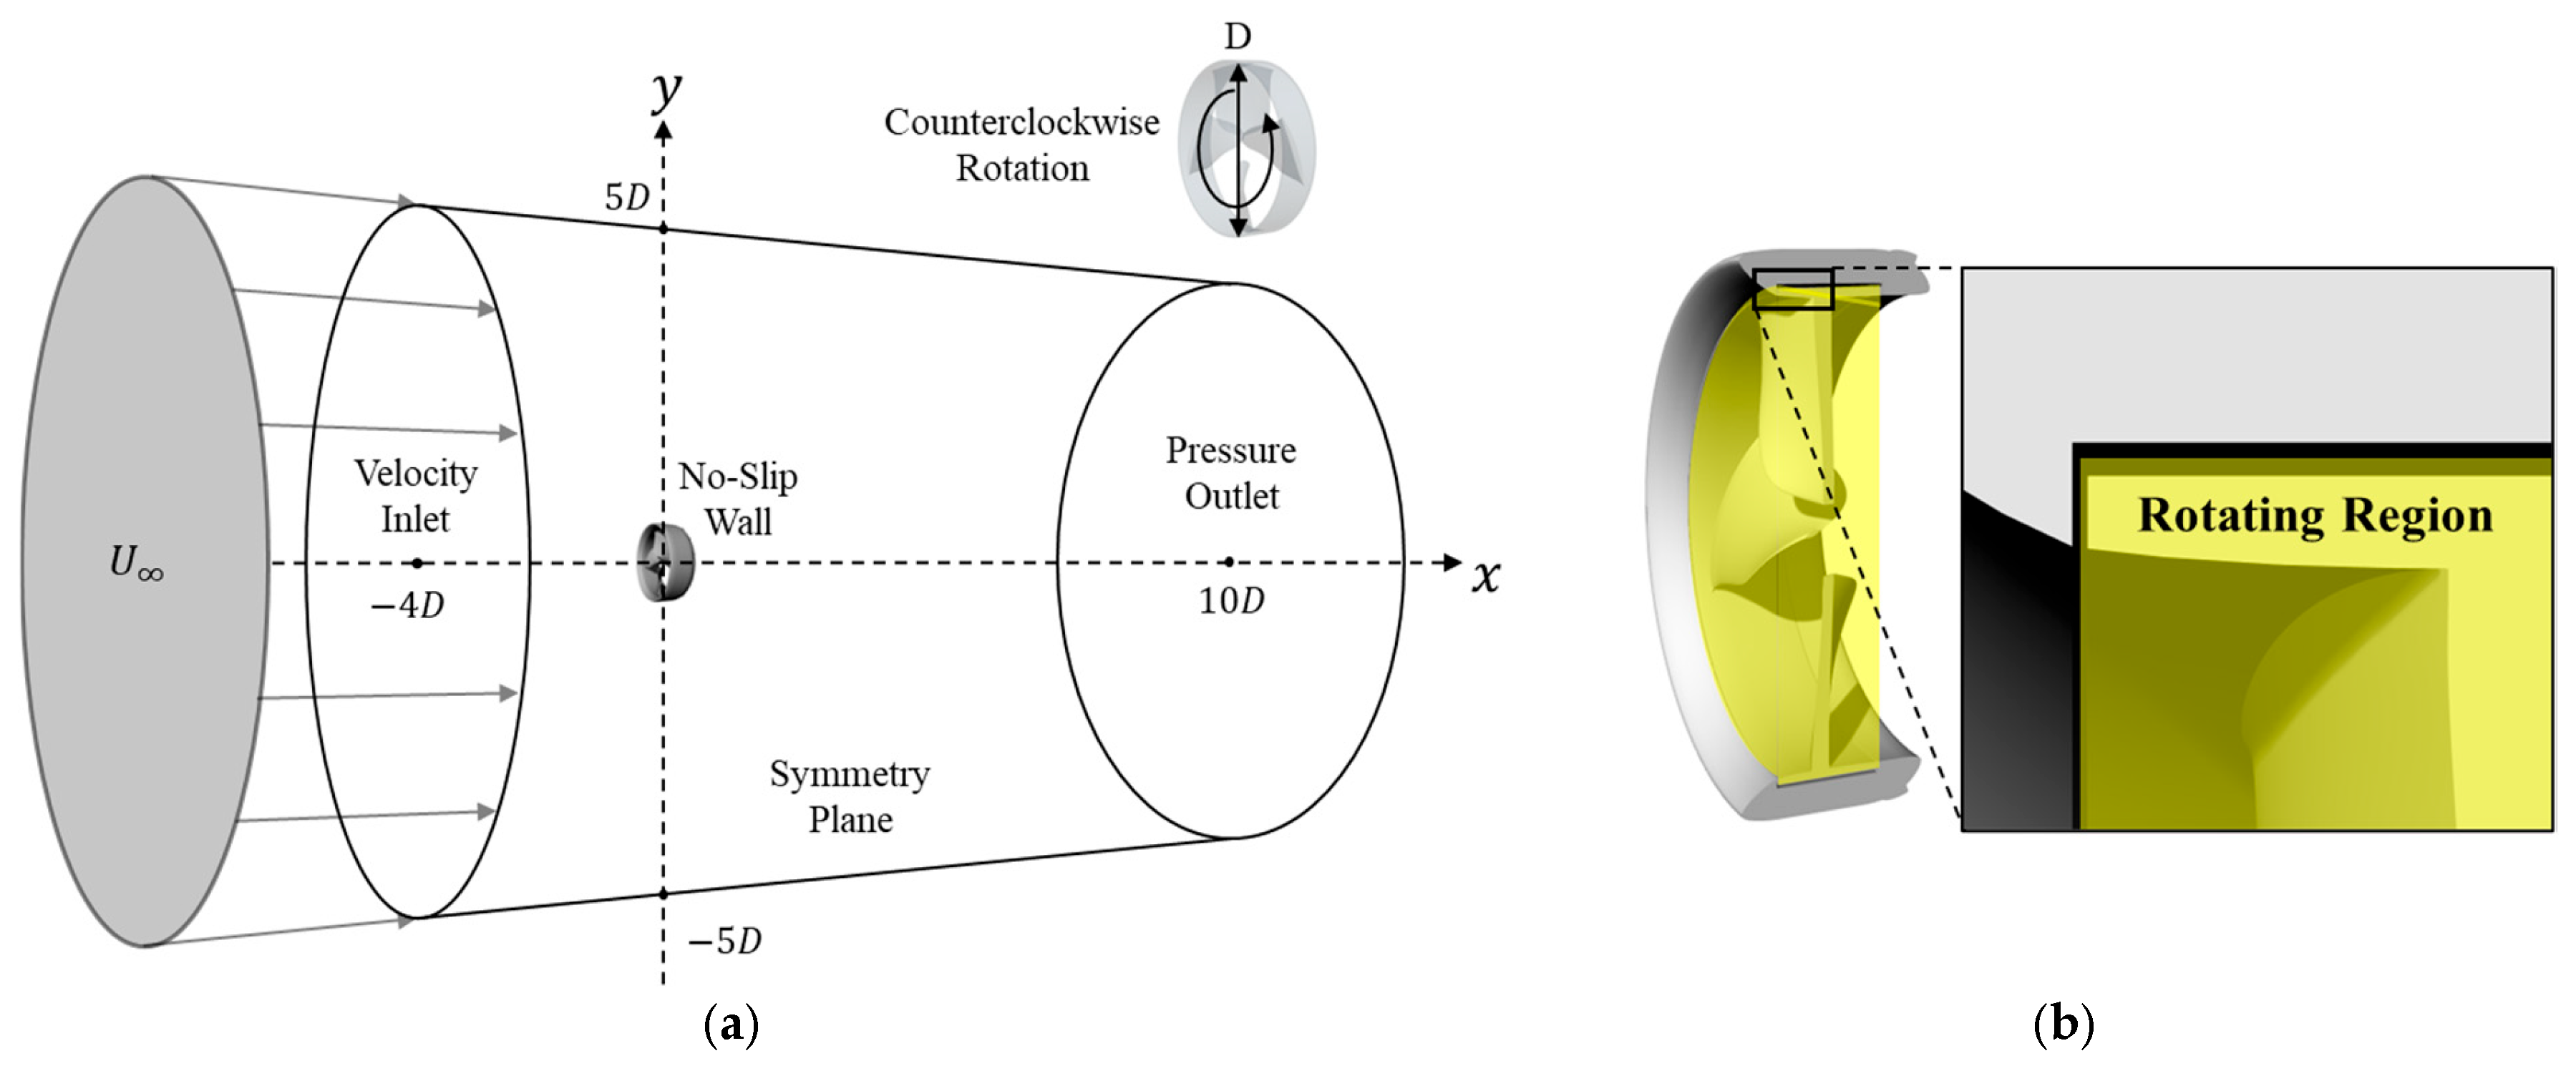
Figure 3 shows the computational domain, boundary conditions, and the zonal division employed in the simulation. The computational domain was defined as a cylindrical region with an overall length of 14D and a radius of 5D, where D denotes the propeller diameter. The inlet boundary was located 4D upstream of the propeller plane, while the outlet boundary was positioned 10D downstream to avoid artificial flow confinement and to allow sufficient development of the propeller wake. A uniform velocity inlet condition was applied at the upstream boundary, and the inlet speed was prescribed to satisfy the target advance ratio, defined as
, for a fixed rotational speed of
rps. A pressure outlet condition was imposed at the downstream boundary. The lateral boundaries of the domain were assigned symmetric conditions to prevent flow penetration in the normal direction. No-slip boundary condition was applied to all solid surfaces of the propulsor, including the blades, rim, and duct, to properly resolve the boundary-layer behavior.
The computational domain was divided into a stationary region and a rotating region. The rotating region was defined to enclose the blades and rim over the entire rotating radius, while the stationary region included the duct and the outer flow field. The interface between the two regions was located at half the clearance between the rim and duct, namely at the plane corresponding to half of the gap thickness, and the same interface location was used consistently in all cases [
38].
The computational mesh was generated based on a hybrid meshing strategy. The rotating region was defined to include only the blades and the inner portion of the rim to which the blades are attached. To ensure adequate resolution of geometric curvature and numerical stability in the rotating flow region, a polyhedral mesh was employed. The duct and the stationary outer region were meshed using trimmed cells, allowing efficient control of the overall mesh density while maintaining uniform development of the far-field flow.
To achieve an appropriate balance between near-wall resolution and computational efficiency, the dimensionless wall distance
was set to approximately 50. This value lies within the logarithmic layer region typically recommended for wall function treatment [
43]. This approach enables the viscous effects on the blade, rim, and duct surfaces to be adequately captured without fully resolving the entire boundary layer. Prism layers were applied to all solid surfaces to form smooth boundary-layer meshes, ensuring stable wall-function behavior throughout the duct and rim regions.
Since propeller flow predictions can be sensitive to mesh resolution and near-wall treatment, numerical reliability was assessed by examining the convergence of key performance indicators with systematic mesh refinement. The mesh convergence results are presented in the following section.
3.4. Mesh Convergence Study
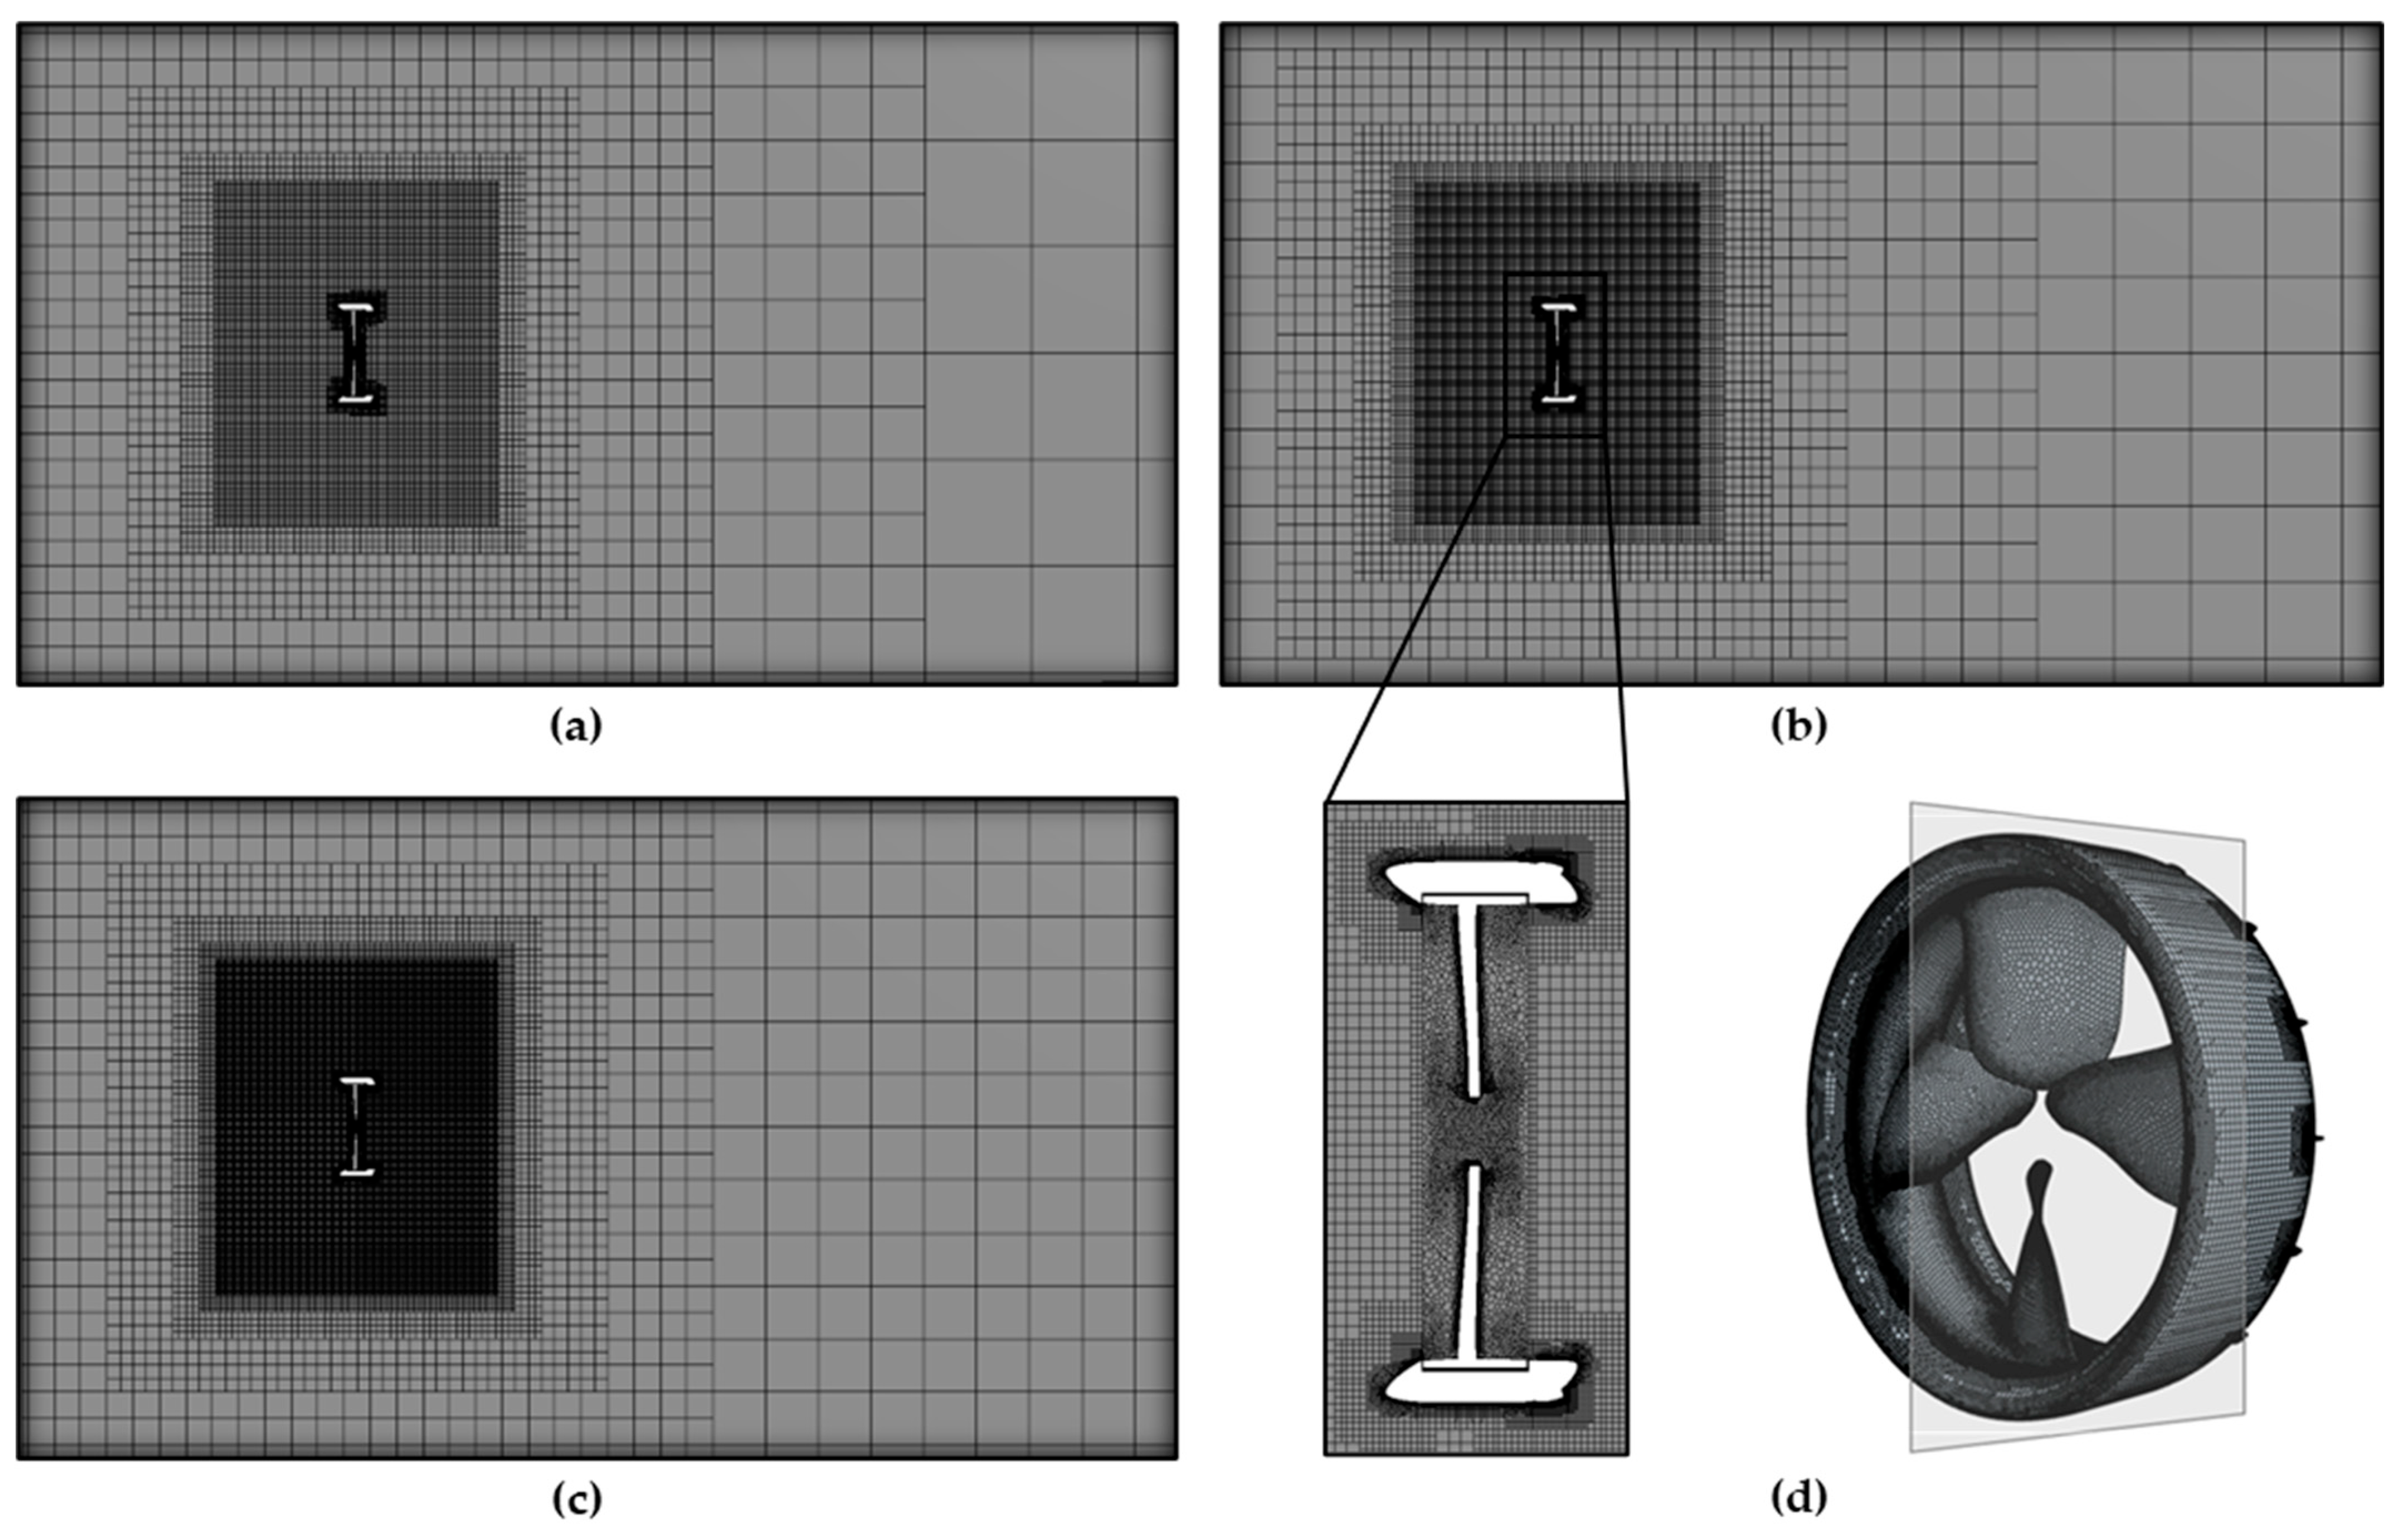
To investigate mesh convergence, three different mesh systems were constructed based on the same mesh topology, while varying only the base cell size.
Figure 4 presents cross-sectional views of the three mesh configurations, illustrating the effect of mesh refinement achieved by systematically changing the base size while maintaining an identical mesh structure.
In this study, the grid convergence and discretization uncertainty of the thrust coefficient
and torque coefficient
of the rim-driven propeller were quantitatively evaluated using the grid convergence index (GCI) method proposed by Roache [
44]. To this end, RANS simulations were performed on three systematically refined mesh systems
, and the mesh convergence behavior was analyzed based on the thrust coefficients
,
, and
obtained from each mesh. The grid refinement ratios and the representative grid size
were determined following the discretization uncertainty assessment procedure recommended by Celik et al. [
45]. The results showed that the thrust coefficient increased monotonically with mesh refinement, satisfying the fundamental prerequisite for the application of Richardson extrapolation and the GCI method. The thrust and torque coefficients are defined as follows.
This mesh convergence analysis is based on the fundamental assumption that the numerical solution follows an asymptotic error model in the sufficiently refined grid regime. Accordingly, the quantity of interest,
, is assumed to depend on the representative grid size
as follows:
where
denotes the exact (continuum) solution corresponding to an infinitely refined grid,
is a constant, and
represents the order of convergence. In the following analysis, the thrust coefficient
is selected as the quantity of interest
, as it is a primary indicator of propulsive performance.
The observed order of convergence
was evaluated
a posteriori based on the rate of change in the thrust coefficient with mesh refinement. Considering the non-uniform grid refinement ratios (
and
), the value of
was determined by numerically solving the generalized Richardson extrapolation equation that satisfies the solutions obtained on the three meshes.
This equation is obtained by eliminating the continuum solution and the coefficient C from the asymptotic error model, enabling a consistent estimation of the observed order of convergence even under non-uniform grid refinement ratios. As a result, the observed order of convergence for the thrust coefficient was evaluated as , indicating that the thrust coefficient converges very rapidly with mesh refinement. Such a relatively high order of convergence suggests that the present simulations have sufficiently entered the asymptotic convergence regime.
Using the observed order of convergence, the thrust coefficient on an infinitely refined grid,
, was estimated through Richardson extrapolation. By employing the solutions obtained on the finest mesh
and the next finer mesh
, the extrapolated infinite-grid solution was calculated as follows:
The extrapolated infinite-grid thrust coefficient was evaluated as , which differs from the finest-grid solution by only about 0.24%. This result quantitatively demonstrates that the fine-grid solution is already very close to the continuum solution.
The GCI based on the fine (1) and medium (2) mesh pair was calculated as follows:
Here, is a safety factor introduced to account for uncertainties in the estimation of discretization error, and a value of was adopted in accordance with the use of three mesh levels and the observed order of convergence. As a result, the GCI based on the fine-grid solution, , was evaluated to be approximately 0.30%, while the corresponding value based on the medium (2) and coarse (3) mesh pair, , was about 0.86%. These results indicate that the grid discretization uncertainty associated with the thrust coefficient predicted in this study is below 1%. In addition, the ratio between the two GCI values is in good agreement with the theoretically expected ratio, confirming that the grid convergence behavior is consistent.
Overall, the results of the mesh convergence analysis demonstrate that the numerical solutions for the thrust coefficient of the rim-driven propeller are sufficiently grid independent, with discretization uncertainties that are negligible from an engineering perspective. Accordingly, the thrust performance predictions presented in this study can be regarded as reliable for the performance assessment and design evaluation of rim-driven propellers. In addition, the same mesh convergence procedure and GCI assessment were applied to the torque coefficient, and the corresponding results, summarized in
Table 2, exhibit a comparable level of grid independence and discretization uncertainty to those obtained for the thrust coefficient.
4. Results and Physical Interpretation
4.1. Flow Separation Characteristics
In this section, the effect of vortex generator (VG) installation on delaying flow separation is quantitatively evaluated by analyzing the velocity distributions near the downstream end of the duct outer surface. Flow separation refers to the phenomenon in which fluid flowing along a wall decelerates due to viscous effects, detaches from the surface, and eventually forms regions of reverse flow. It is well known as one of the primary causes of performance degradation in propulsors.
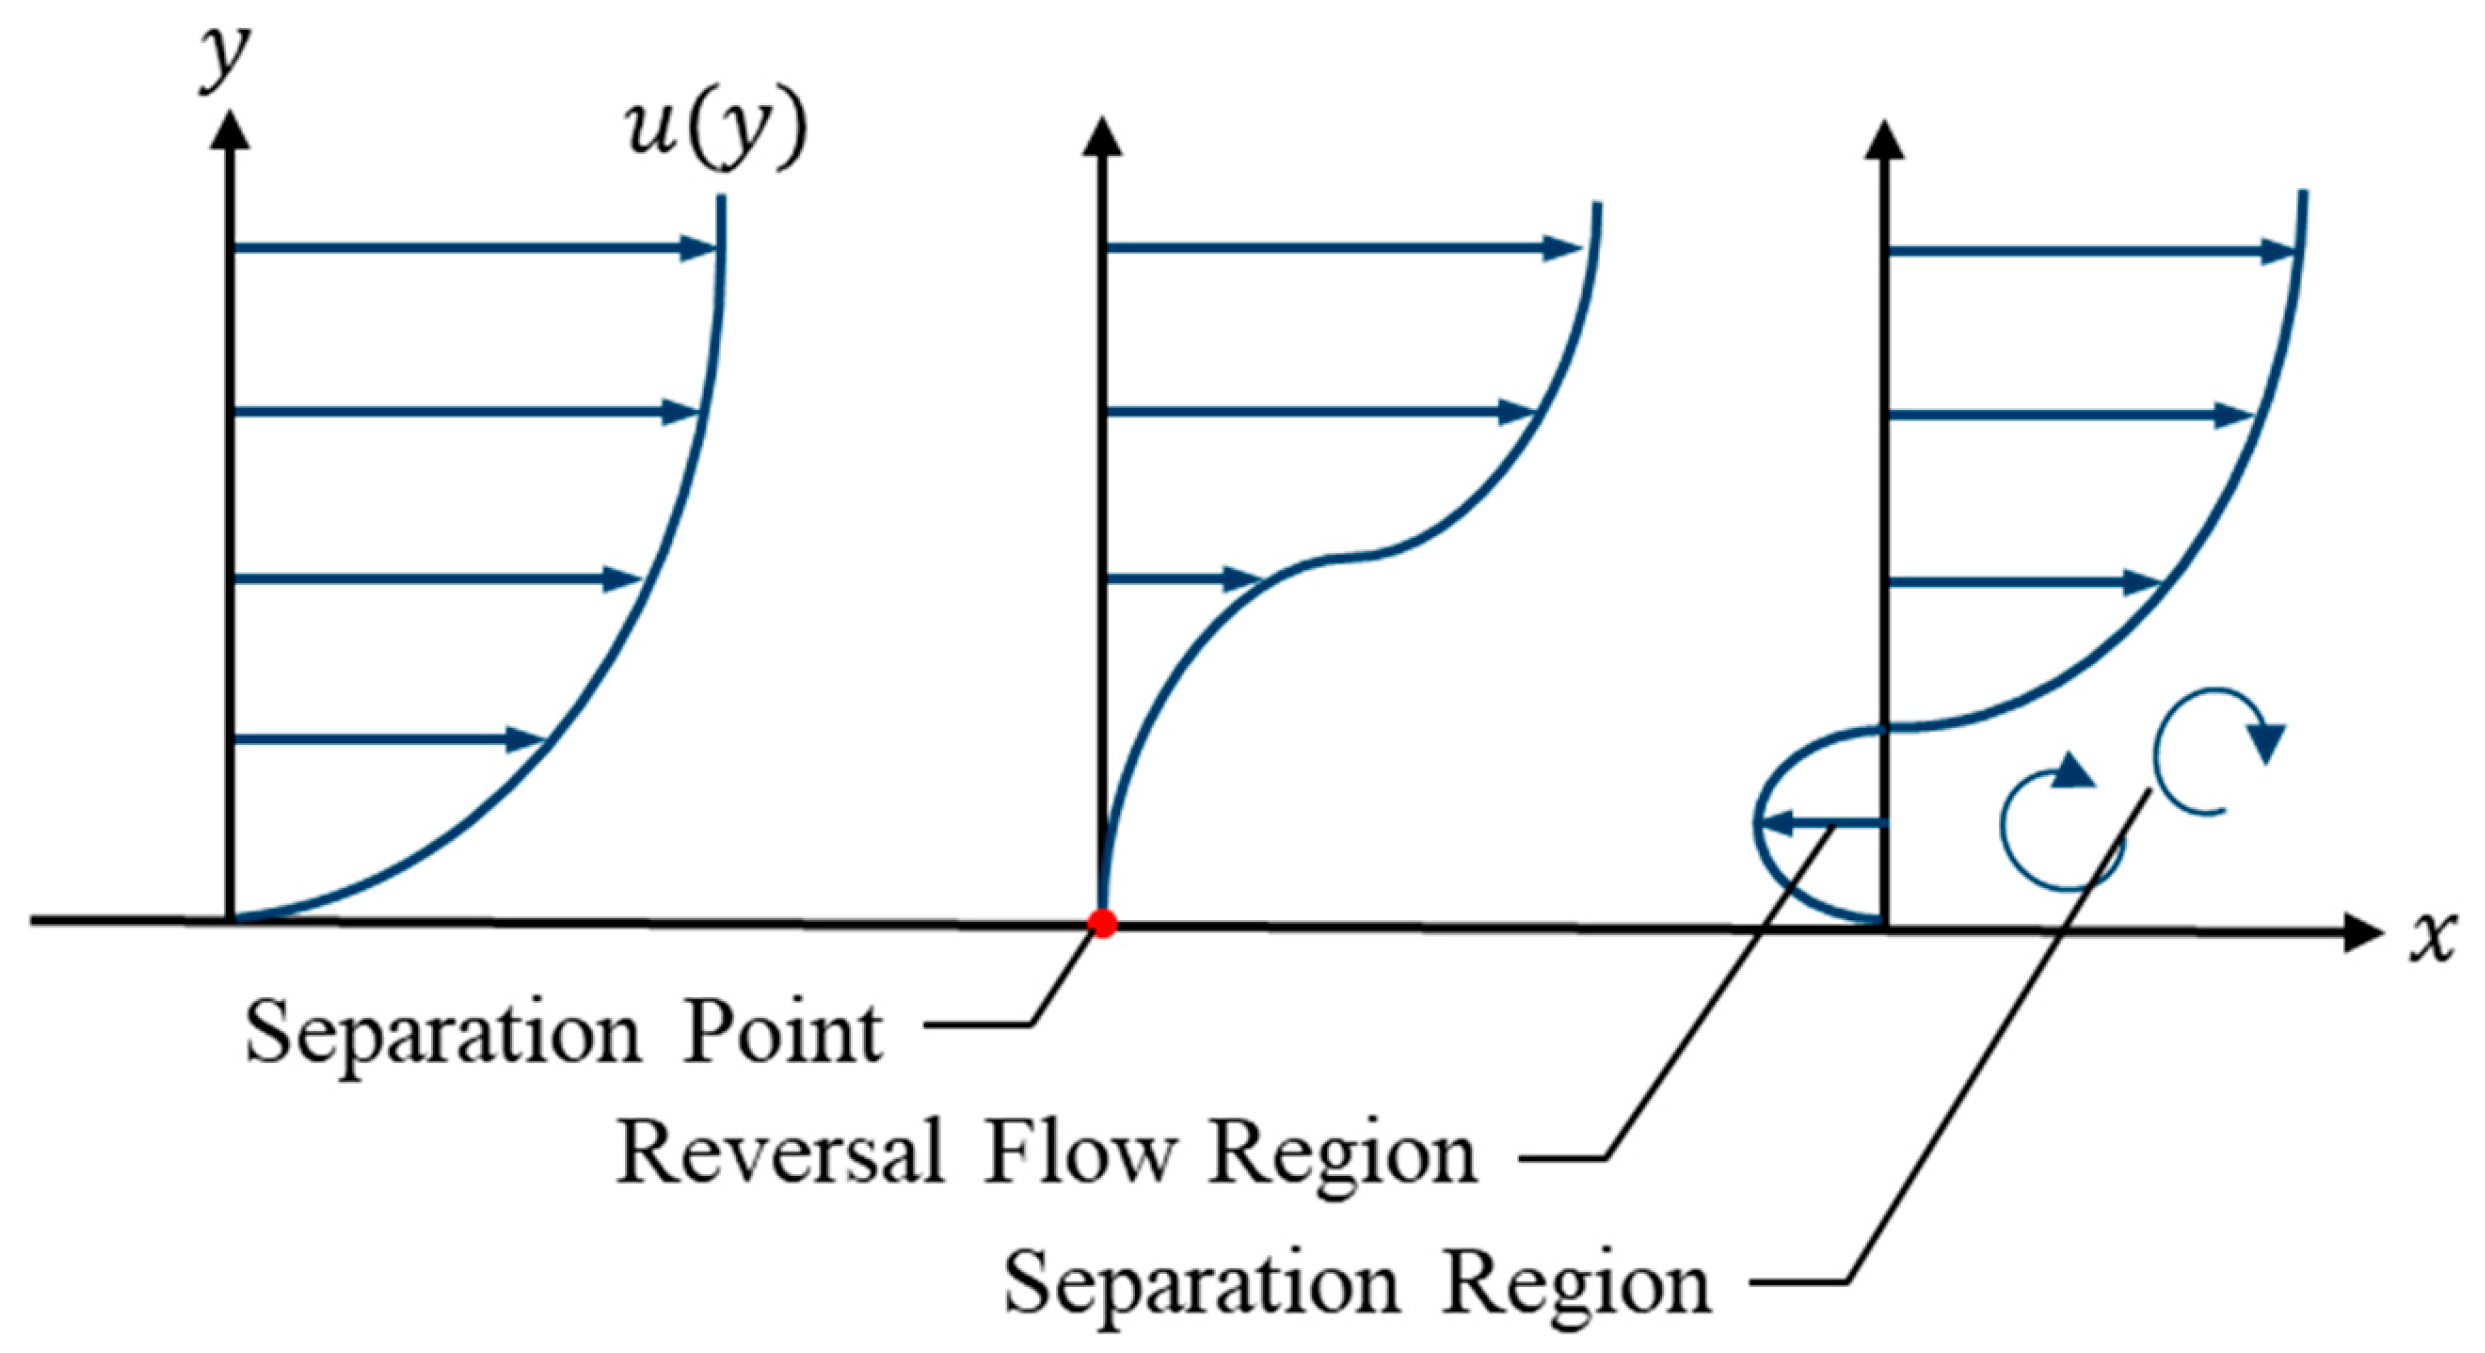
Figure 5 provides a conceptual illustration of the flow separation process, distinguishing the separation point where the velocity gradient becomes zero, the flow reversal region characterized by reversed flow, and the separation region where vortical structures are formed.
To identify flow separation in the actual flow field, the velocity distributions near the downstream end of the duct were examined.
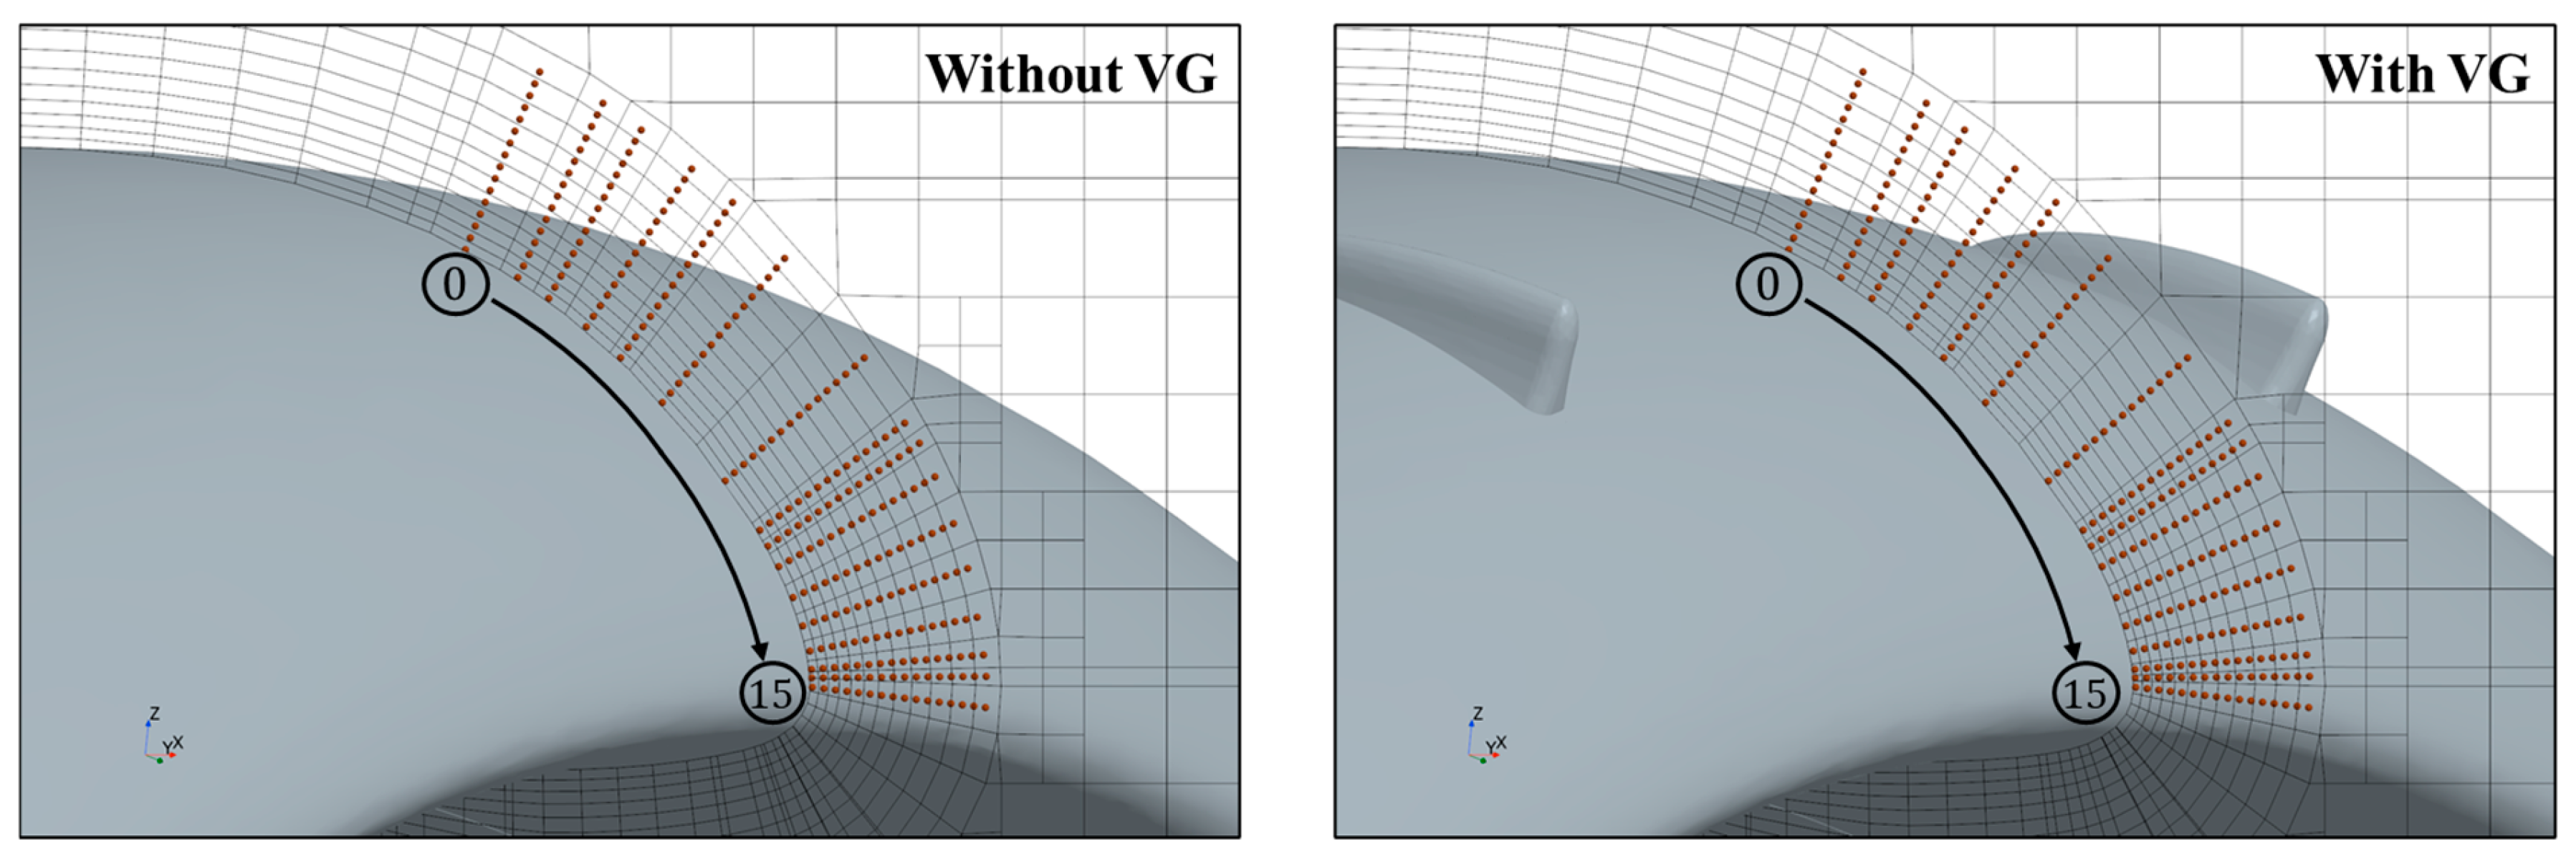
Figure 6 shows the locations of the velocity sampling points for the cases without and with vortex generators. Focusing on the downstream region of the duct where flow separation is most likely to occur, a total of 16 measurement locations (labeled 0–15) were defined along the outer surface of the duct, and sampling points were generated in the wall-normal direction at each location. The measurement locations were distributed along the flow direction, centered between adjacent vortex generators.
At each sampling location, velocity profiles were constructed based on the extracted wall-normal velocity components.
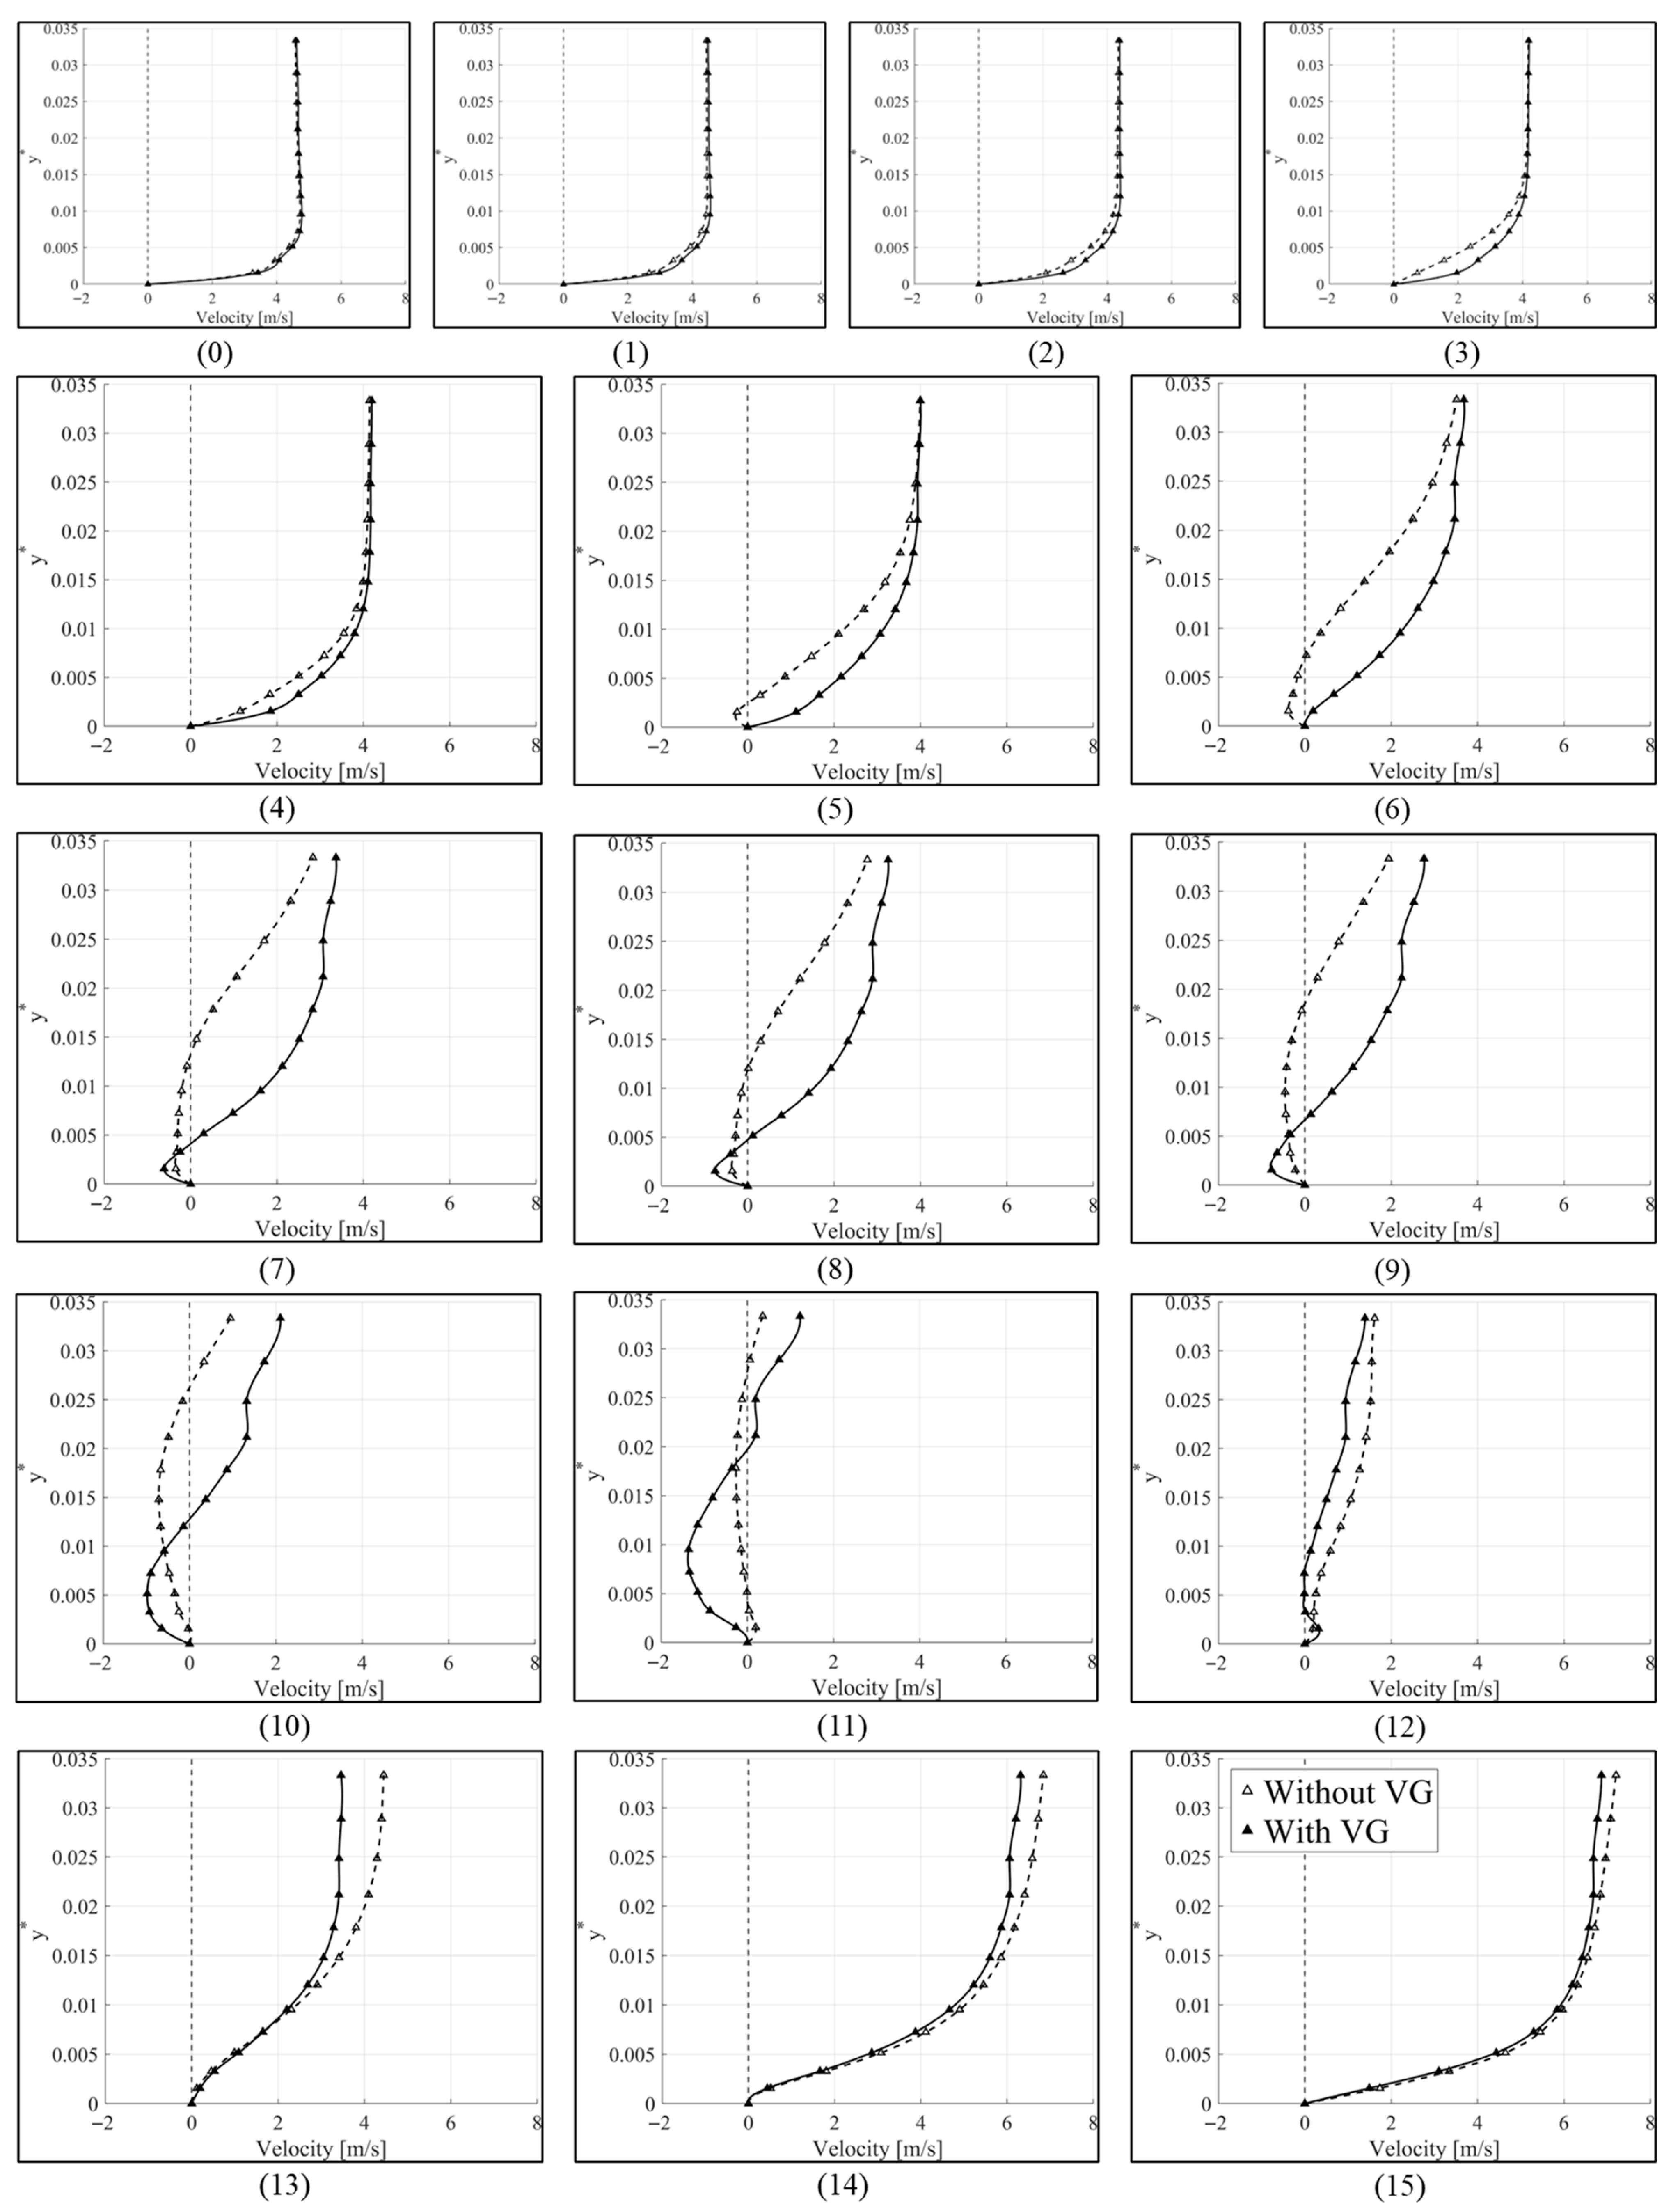
Figure 7 presents the velocity profiles at successive locations near the downstream end of the duct. The solid lines correspond to the case with vortex generators, while the dashed lines represent the case without vortex generators. All velocity profiles are plotted as a function of the nondimensional wall-normal coordinate
, defined as
, where
is the wall-normal distance from the duct outer surface and
is the propeller diameter.
This representation enables a step-by-step comparison of velocity decay along the streamwise direction, the onset of reverse flow, and the velocity recovery induced by the installation of vortex generators. When the velocity distributions at all 16 locations are considered collectively, the profiles in the upstream portion near the duct trailing edge (locations 0–4) remain relatively stable, with uniform velocities observed in the near-wall region. Beyond location (5), however, a noticeable reduction in near-wall velocity is observed, accompanied by a progressive flattening of the velocity gradient. This behavior can be interpreted as an indication of boundary-layer thickening and the onset of localized flow separation. Further downstream, distinct regions of reverse flow or very low velocity develop which are attributed to the strong adverse pressure gradient acting near the downstream end of the duct.
In contrast, when vortex generators are applied, the velocity reduction in the same region is mitigated, and both the extent and intensity of the reverse-flow region are significantly reduced. In particular, a more rapid velocity recovery is observed downstream of the separation region, along with a noticeable reduction in the non-uniformity of the velocity profiles. These trends indicate that the streamwise vortices generated by the vortex generators supply additional momentum to the boundary layer adjacent to the duct outer surface, thereby re-energizing the boundary layer and enhancing flow attachment.
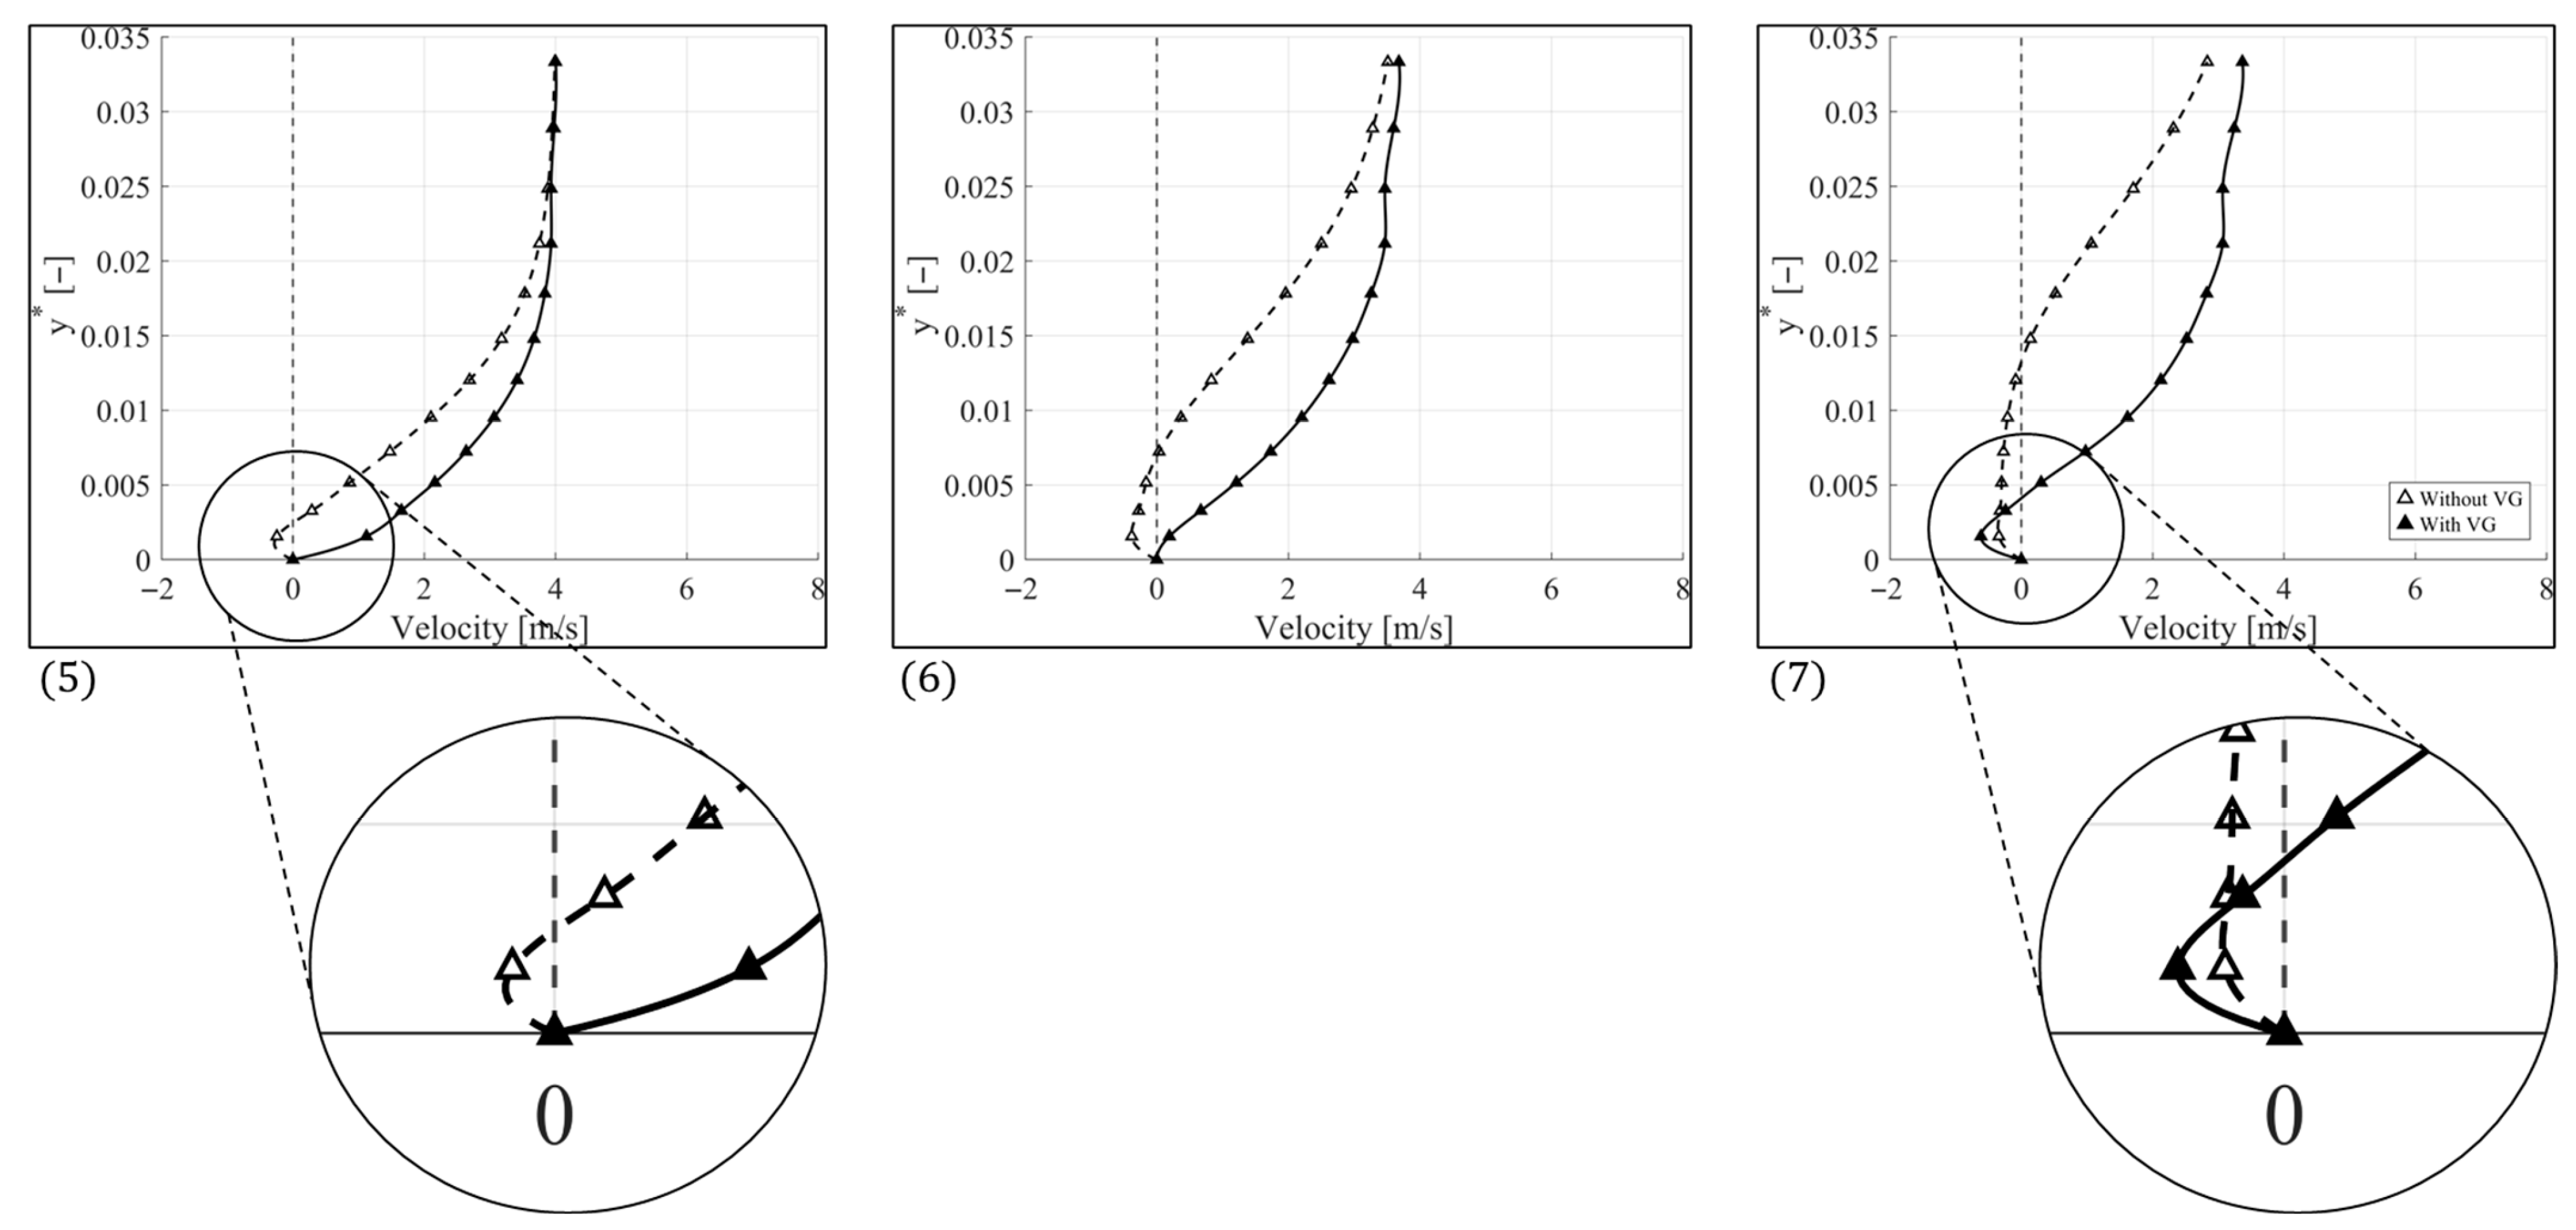
Next, the velocity distributions at monitoring points (5)–(7), where flow separation is observed, were examined in detail. These three locations are situated in the region near the downstream end of the duct where changes in the velocity field are most pronounced, making them well-suited for analyzing the onset and development of flow separation.
Figure 8 provides enlarged views of the velocity profiles at points (5)–(7), allowing a clear visualization of the local flow behavior at each location.
In the case without vortex generators, a sharp reduction in near-wall velocity is already observed at point (5), indicating the onset of flow separation, while distinct reverse flow develops at points (6) and (7), confirming the occurrence of fully separated flow. In contrast, when vortex generators are applied, the near-wall velocity is largely maintained at points (5) and (6), and flow separation is observed only at point (7). These results demonstrate that the installation of vortex generators enhances flow attachment near the downstream end of the duct and effectively delays the onset of flow separation. In particular, the vortices generated by the vortex generators supply additional momentum to the low-speed flow near the wall, thereby maintaining flow stability.
4.2. LIC-Based Visualization of Surface Shear Stress and Flow Separation
To qualitatively assess the flow evolution and separation characteristics along the outer surface of the duct, the Line Integral Convolution (LIC) technique was employed to visualize surface streamline patterns. LIC represents the velocity vector field as continuous line-texture patterns, enabling intuitive identification of flow directionality, boundary-layer behavior, and vortex formation. Consequently, this approach is particularly effective for clearly identifying the onset location of flow separation on the duct surface and for examining changes in the vortical structures that develop downstream of the separation region.
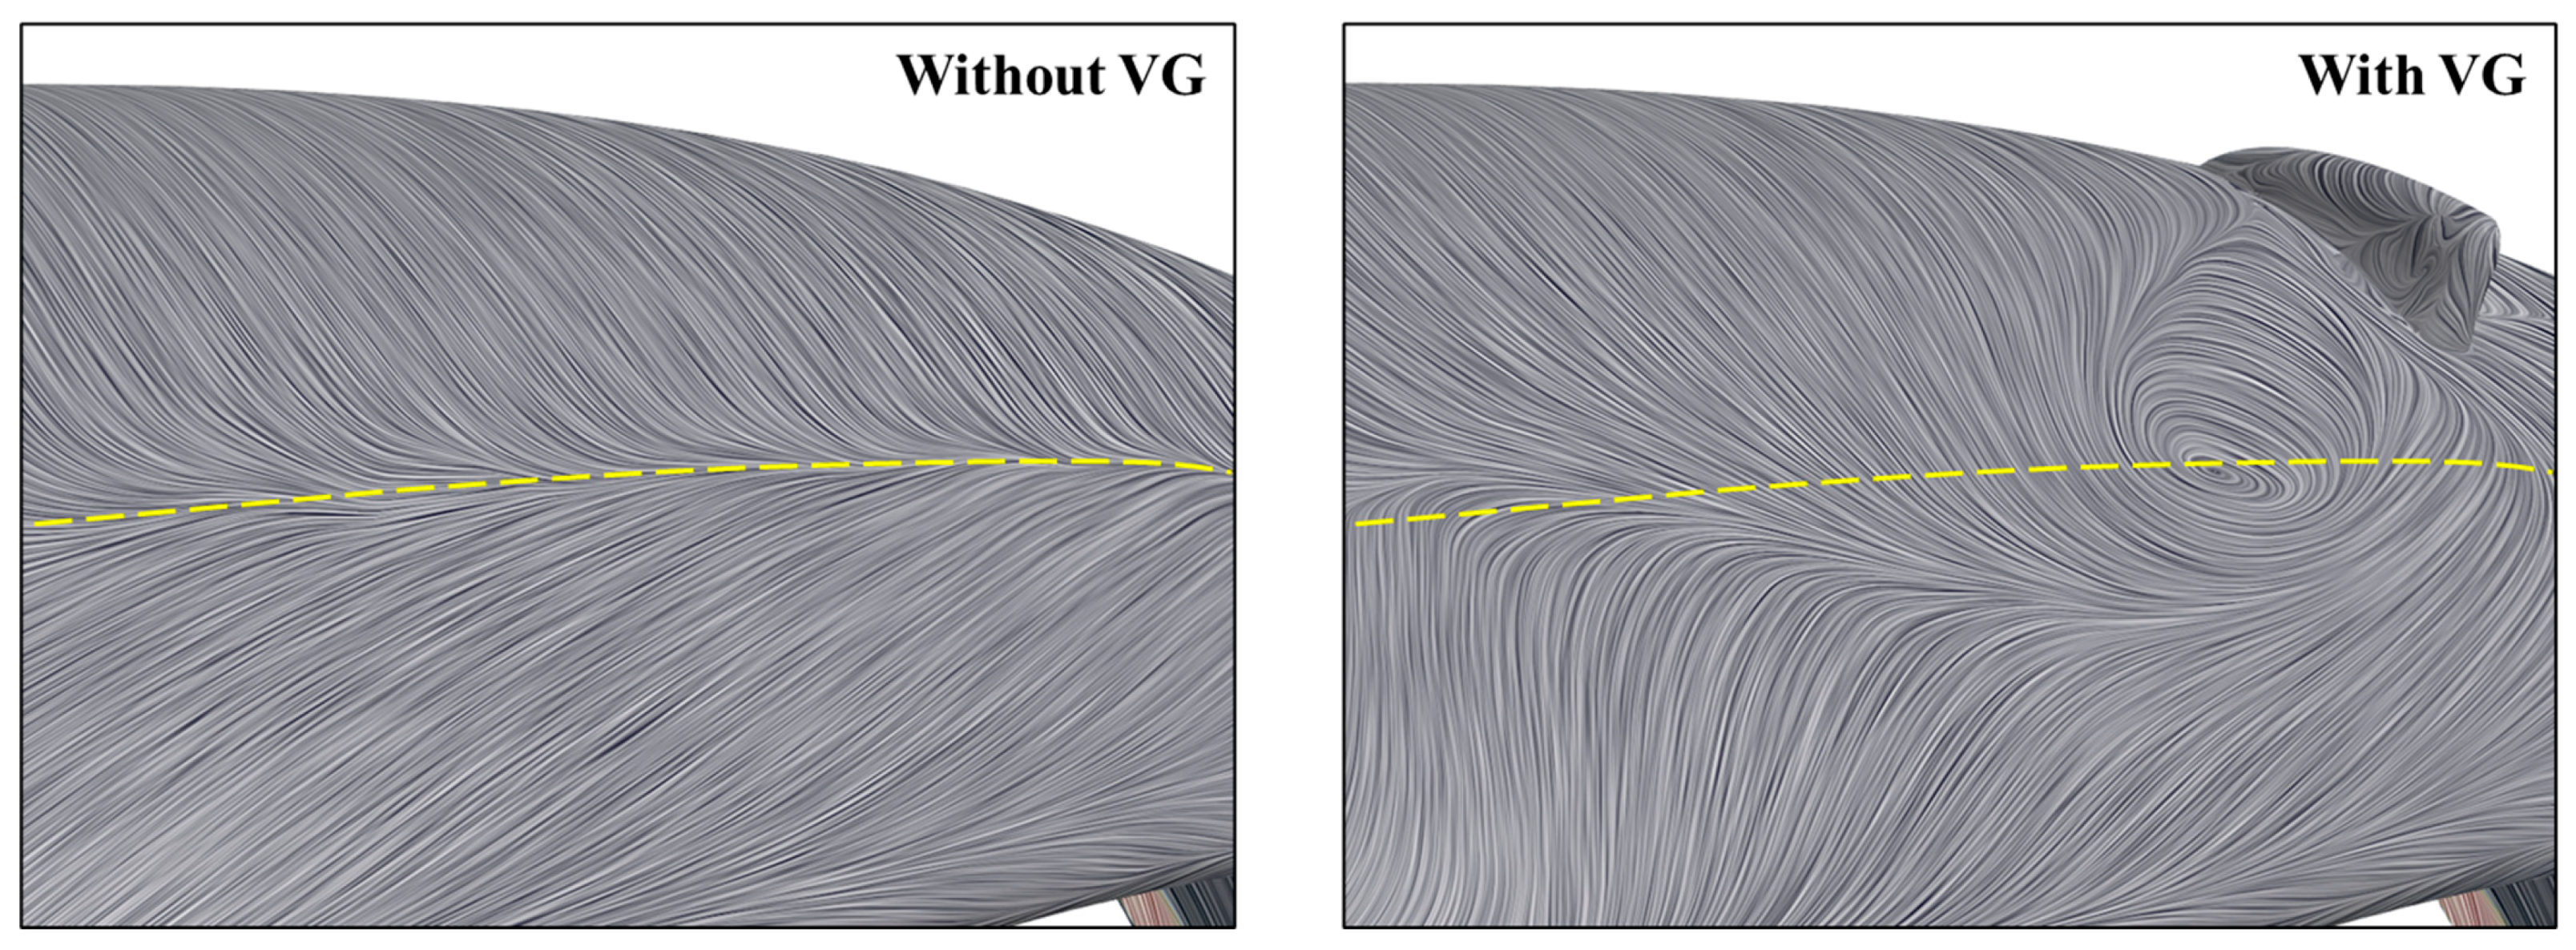
Figure 9 compares the LIC results on the duct surface near the downstream end for the cases without and with vortex generators at an advance ratio of
. The left panel corresponds to the case without vortex generators, while the right panel shows the VG-equipped case. The flow separation region identified in the case without vortex generators is indicated by a yellow dashed line. The same dashed line is overlaid on the VG-equipped result to enable a direct comparison of the change in separation location.
The results show that, in the absence of vortex generators, flow separation occurs at a relatively fixed location near the downstream end of the duct. In contrast, when vortex generators are applied, the onset of flow separation is shifted downstream relative to the reference dashed line. This behavior can be attributed to the streamwise vortices generated by the vortex generators, which supply additional momentum to the boundary layer near the duct outer surface, restore boundary-layer energy, and thereby enhance flow attachment, resulting in delayed separation.
4.3. Pressure Distribution and Recovery near the Duct Trailing Edge
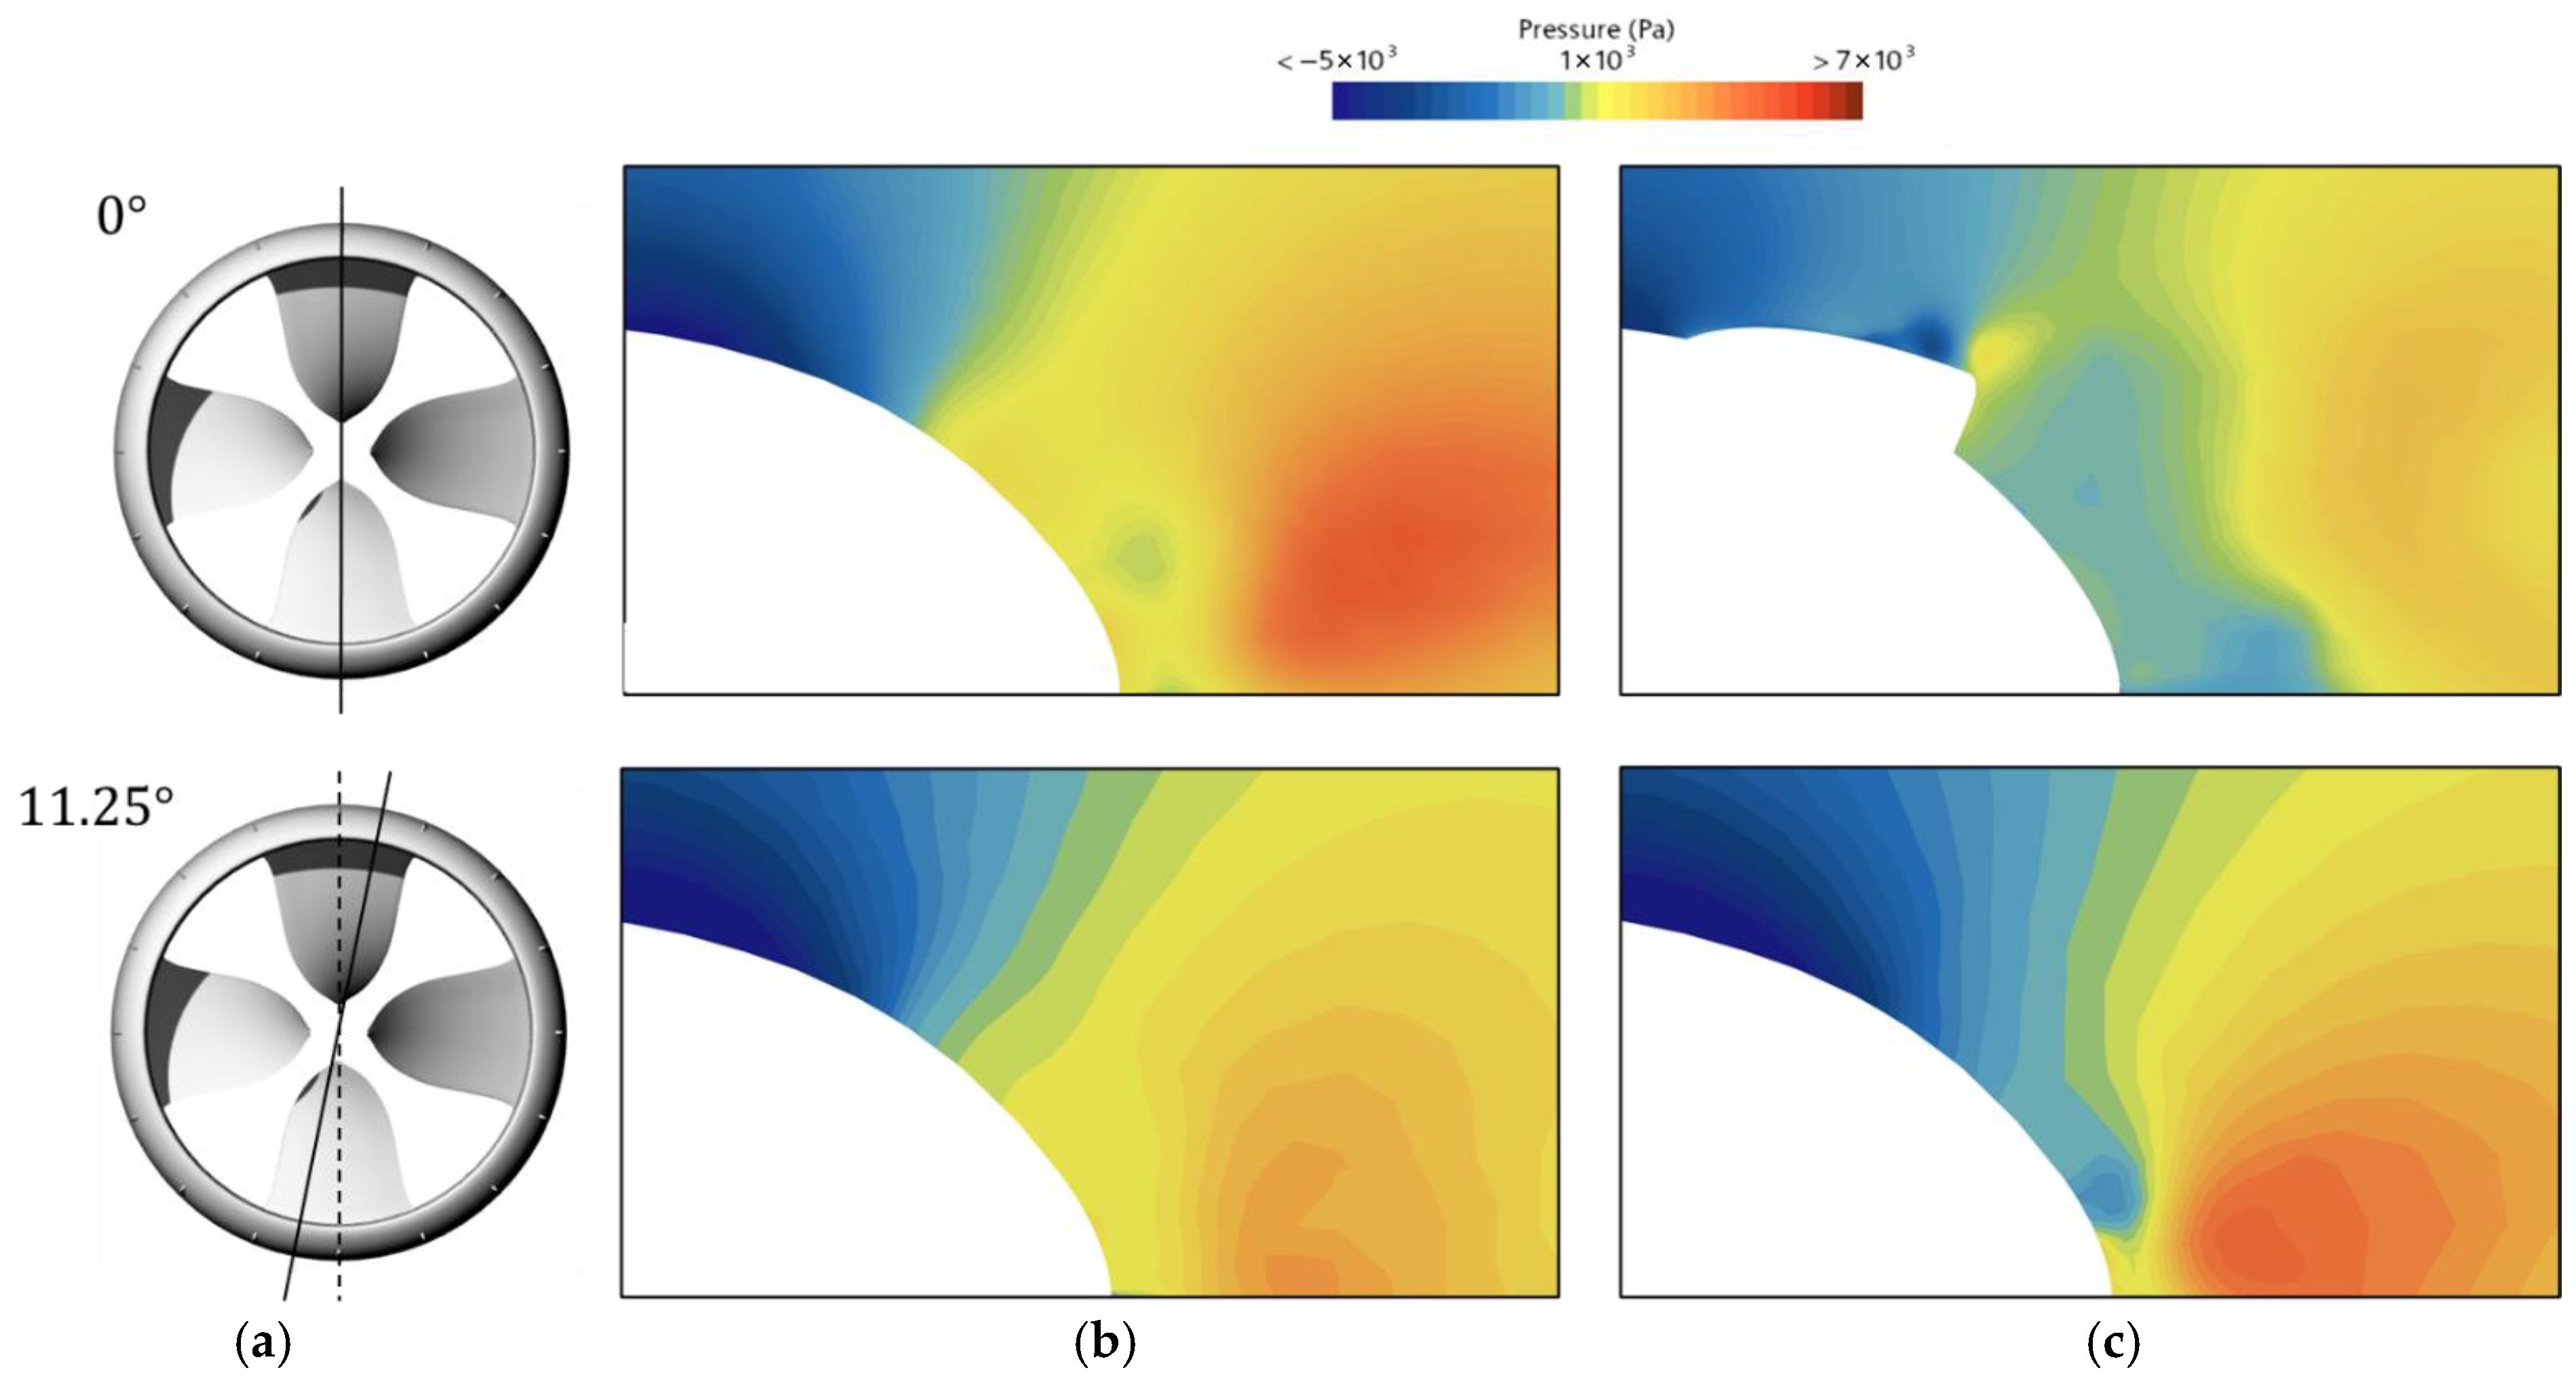
The pressure distribution was analyzed to qualitatively examine the changes in flow characteristics near the trailing edge of the duct induced by the installation of vortex generators. The analysis was performed at an advance ratio of
on two sectional planes: the first is the 0° plane obtained by cutting the duct along its midspan, and the second is the 11.25° plane passing between adjacent vortex generators.
Figure 10 presents a comparison of the pressure distributions on these sections for the cases without and with vortex generators.
On the 0° section, the case without vortex generators exhibits a relatively simple pressure distribution, whereas the VG-equipped case shows the formation of localized high- and low-pressure regions near the outer surface of the duct. These pressure variations are attributed to flow disturbances caused by the vortices generated by the vortex generators. On the 11.25° section, the case without vortex generators shows the development of an adverse pressure gradient at a relatively upstream location, leading to flow separation from the wall. In contrast, when vortex generators are applied, the onset of the adverse pressure gradient is delayed, and flow separation occurs further downstream. This behavior indicates that the vortices generated by the vortex generators supply additional kinetic energy to the low-momentum flow near the wall, thereby maintaining flow attachment. As a result, the installation of vortex generators has a positive effect on delaying flow separation and enhancing thrust performance.
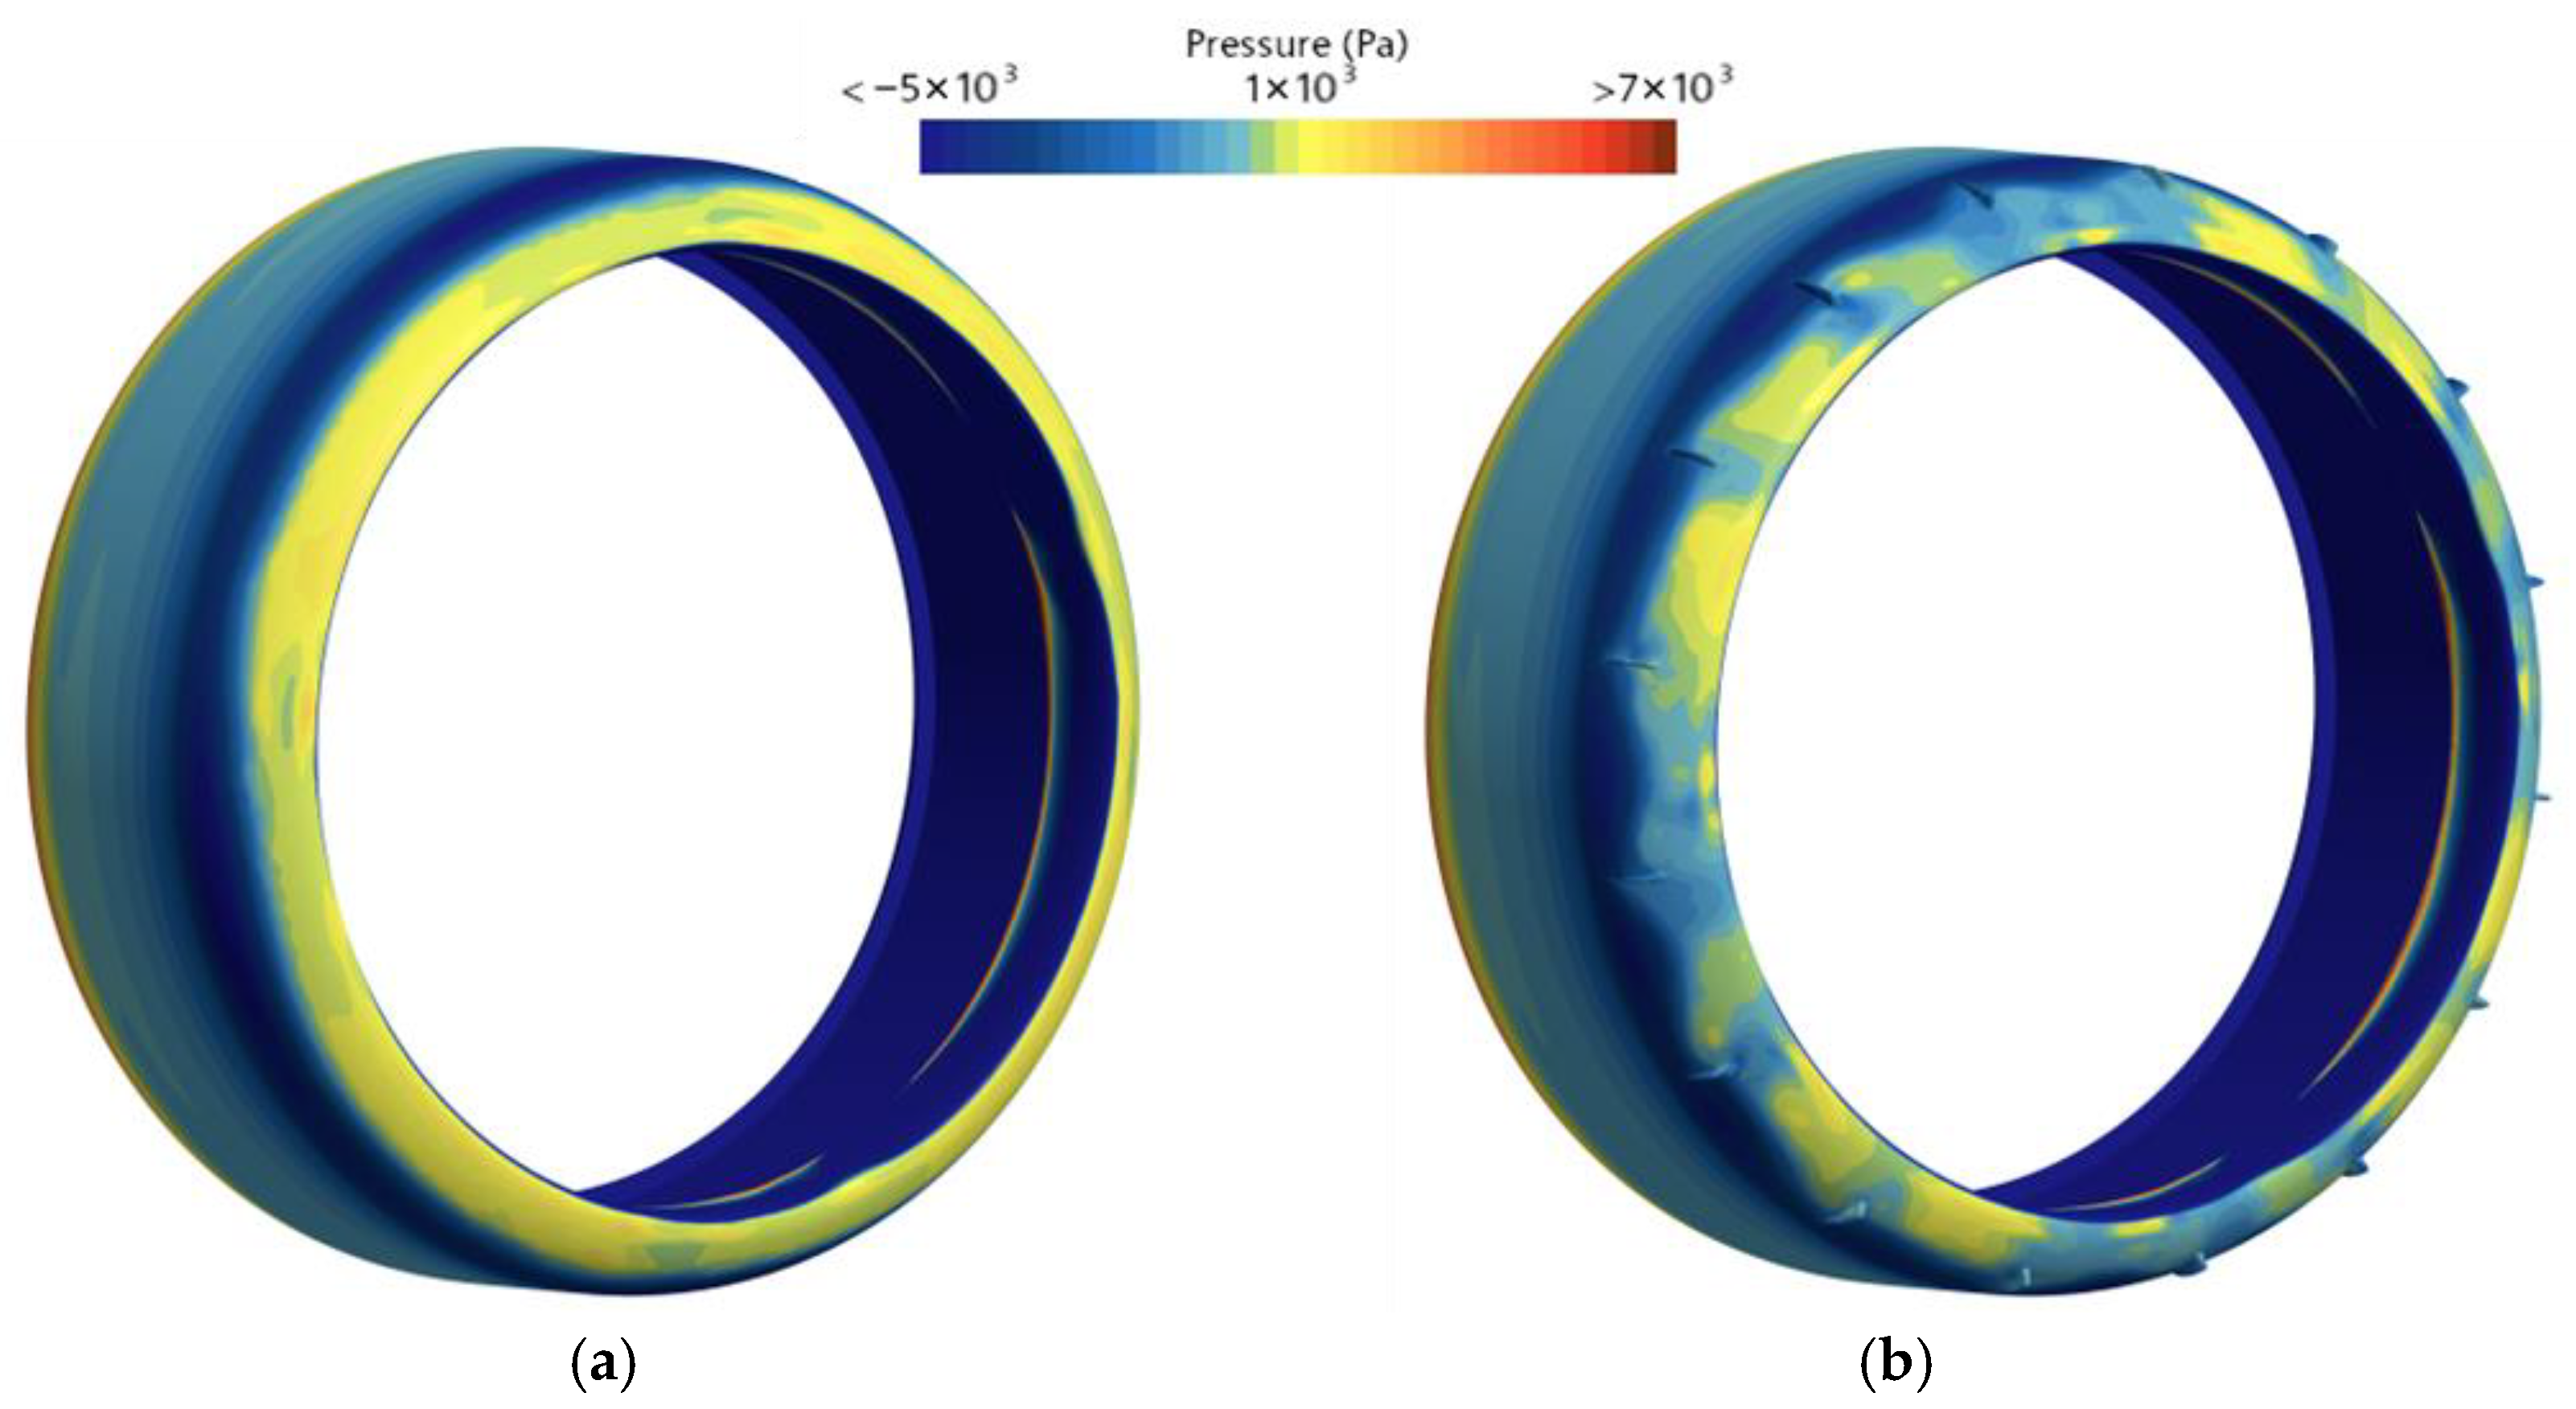
The pressure distribution on the downstream surface of the duct is shown in
Figure 11. The left panel presents the case without vortex generators, while the right panel corresponds to the VG-equipped case. In the absence of vortex generators, a relatively high-pressure region develops on the downstream side of the duct, which is associated with the early flow separation and incomplete pressure recovery identified earlier. In contrast, when vortex generators are applied, a broader region of lower pressure is formed at the same location. This behavior arises because the vortices generated by the vortex generators supply additional energy to the low-speed flow downstream of the duct, suppressing rapid flow expansion immediately after separation and promoting a more gradual pressure variation. Such flow stabilization ultimately enhances the pressure recovery characteristics around the duct and contributes positively to the overall thrust performance.
4.4. Wake Field Characterization
The physical mechanisms underlying the propulsion performance improvement induced by the introduction of vortex generators are discussed in this subsection.
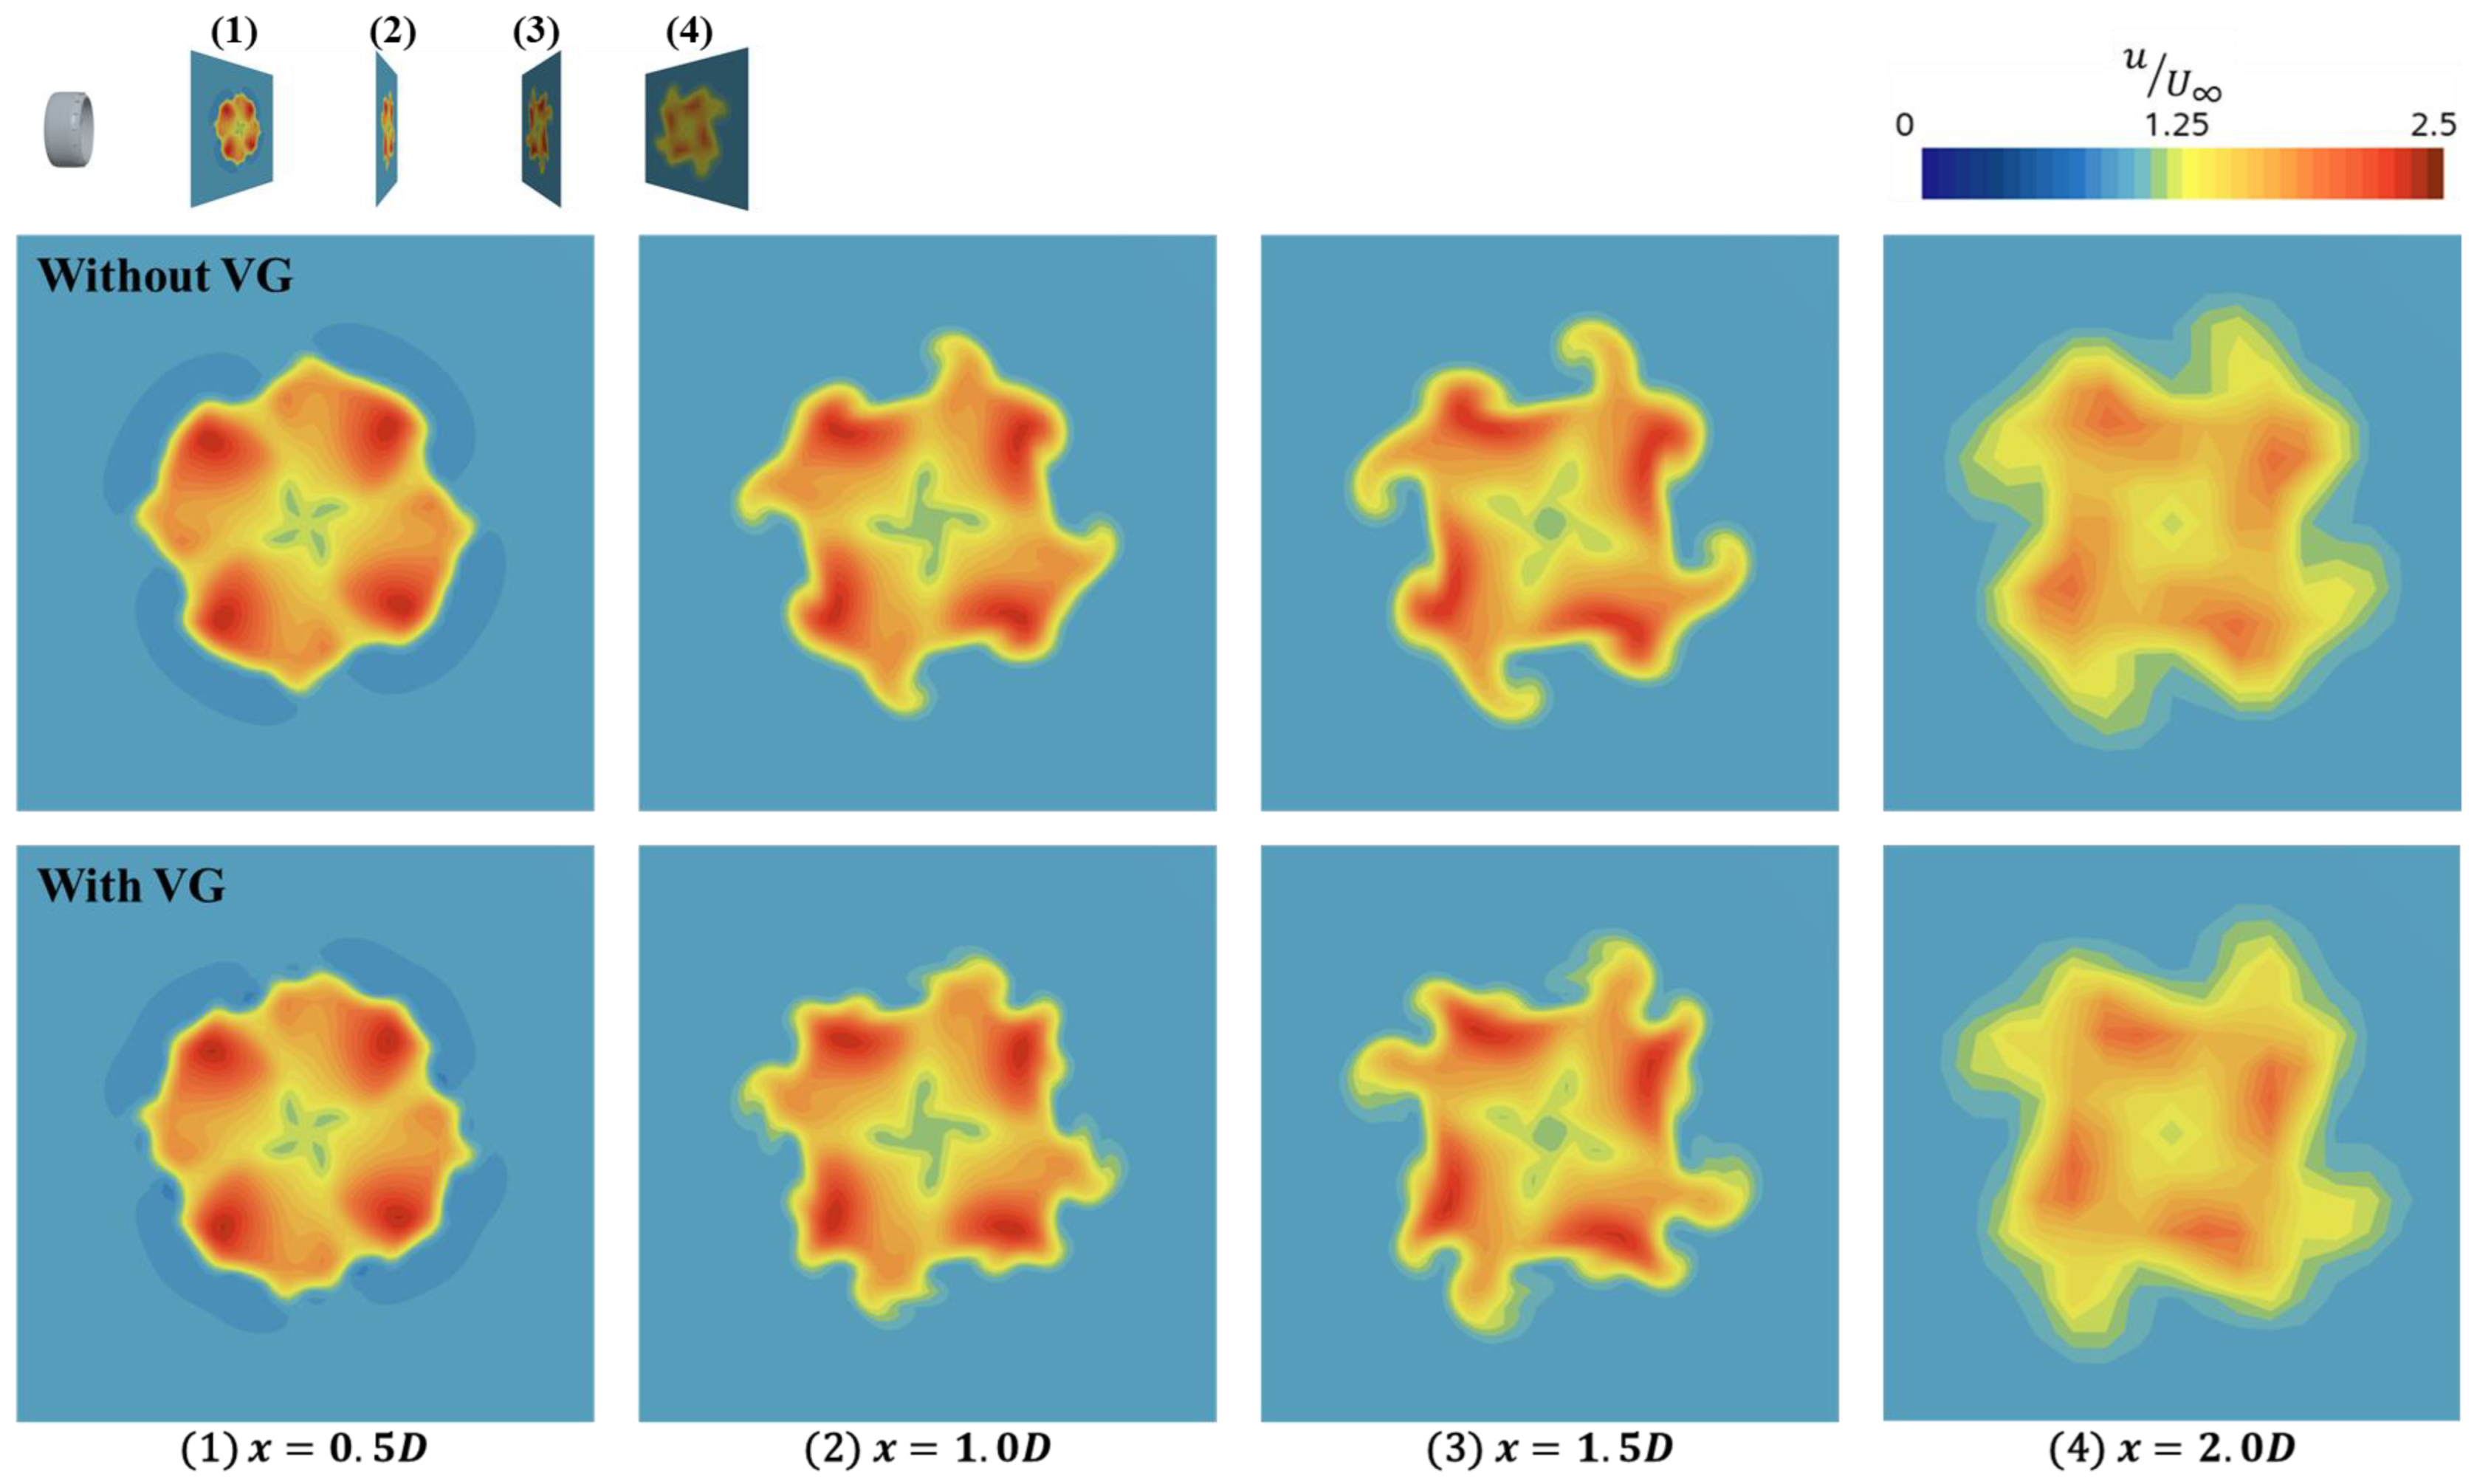
Figure 12 presents the distribution of the normalized axial velocity component at four downstream locations in the propeller wake. From the normalized sectional distributions with respect to the inlet velocity magnitude, it is observed that the case with VGs exhibits a noticeably expanded region of maximum axial velocity together with increased velocity intensity compared with the baseline configuration without VGs. This indicates that the flow region effectively accelerated by the propulsor becomes larger. Consequently, the modification of the wake velocity field supports the mechanism of enhanced thrust generation, as thrust is directly related to the increase in axial momentum between the upstream and downstream flow.
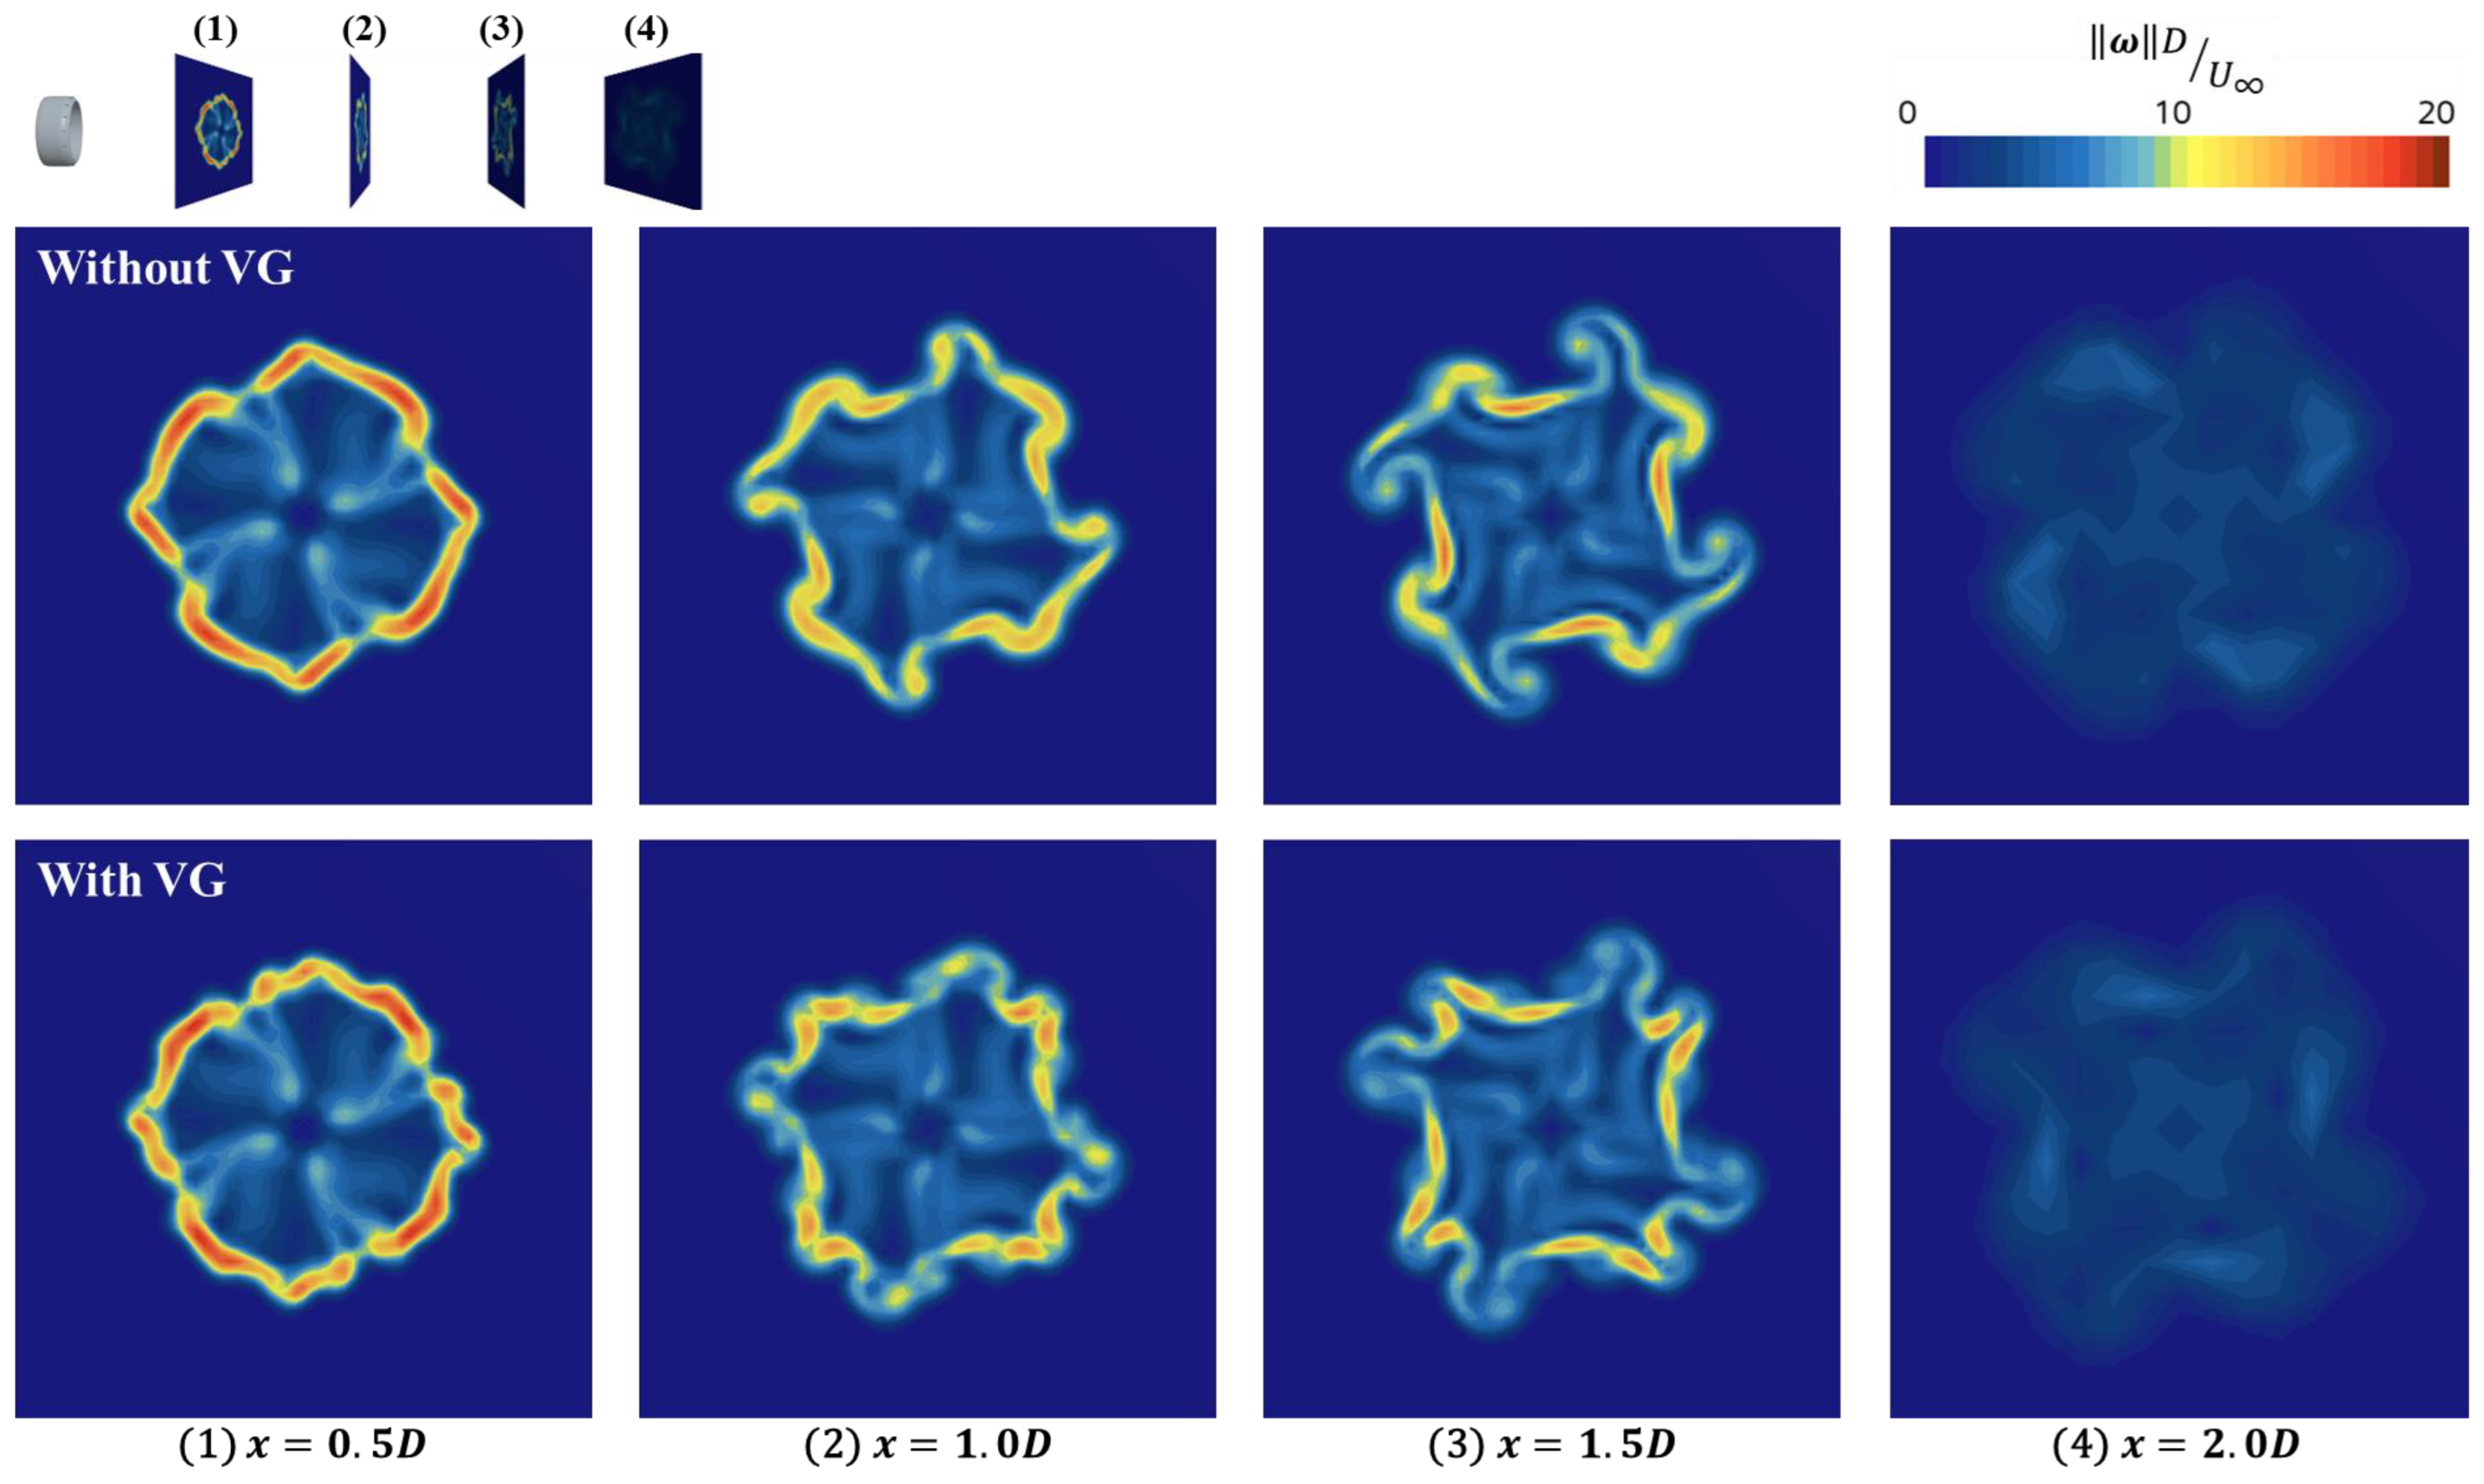
Figure 13 shows the distribution of the normalized vorticity magnitude in the wake. In the presence of VGs, the vorticity field displays finer-scale features and stronger spatial variability, indicating the formation of more complex vortical structures. This behavior can be interpreted as a result of the interaction between VG-induced small-scale vortices and the dominant large-scale vortical structures generated by the rim and rotor blades. The resulting multi-scale vortex dynamics is expected to enhance local mixing and alter near-wake momentum redistribution, which is consistent with the observed expansion and strengthening of the axial velocity field discussed above.
4.5. Open Water Performance Characteristics
To evaluate the open-water performance of the RDP, the thrust coefficient
, torque coefficient
, and propulsive efficiency
were examined as functions of the advance ratio.
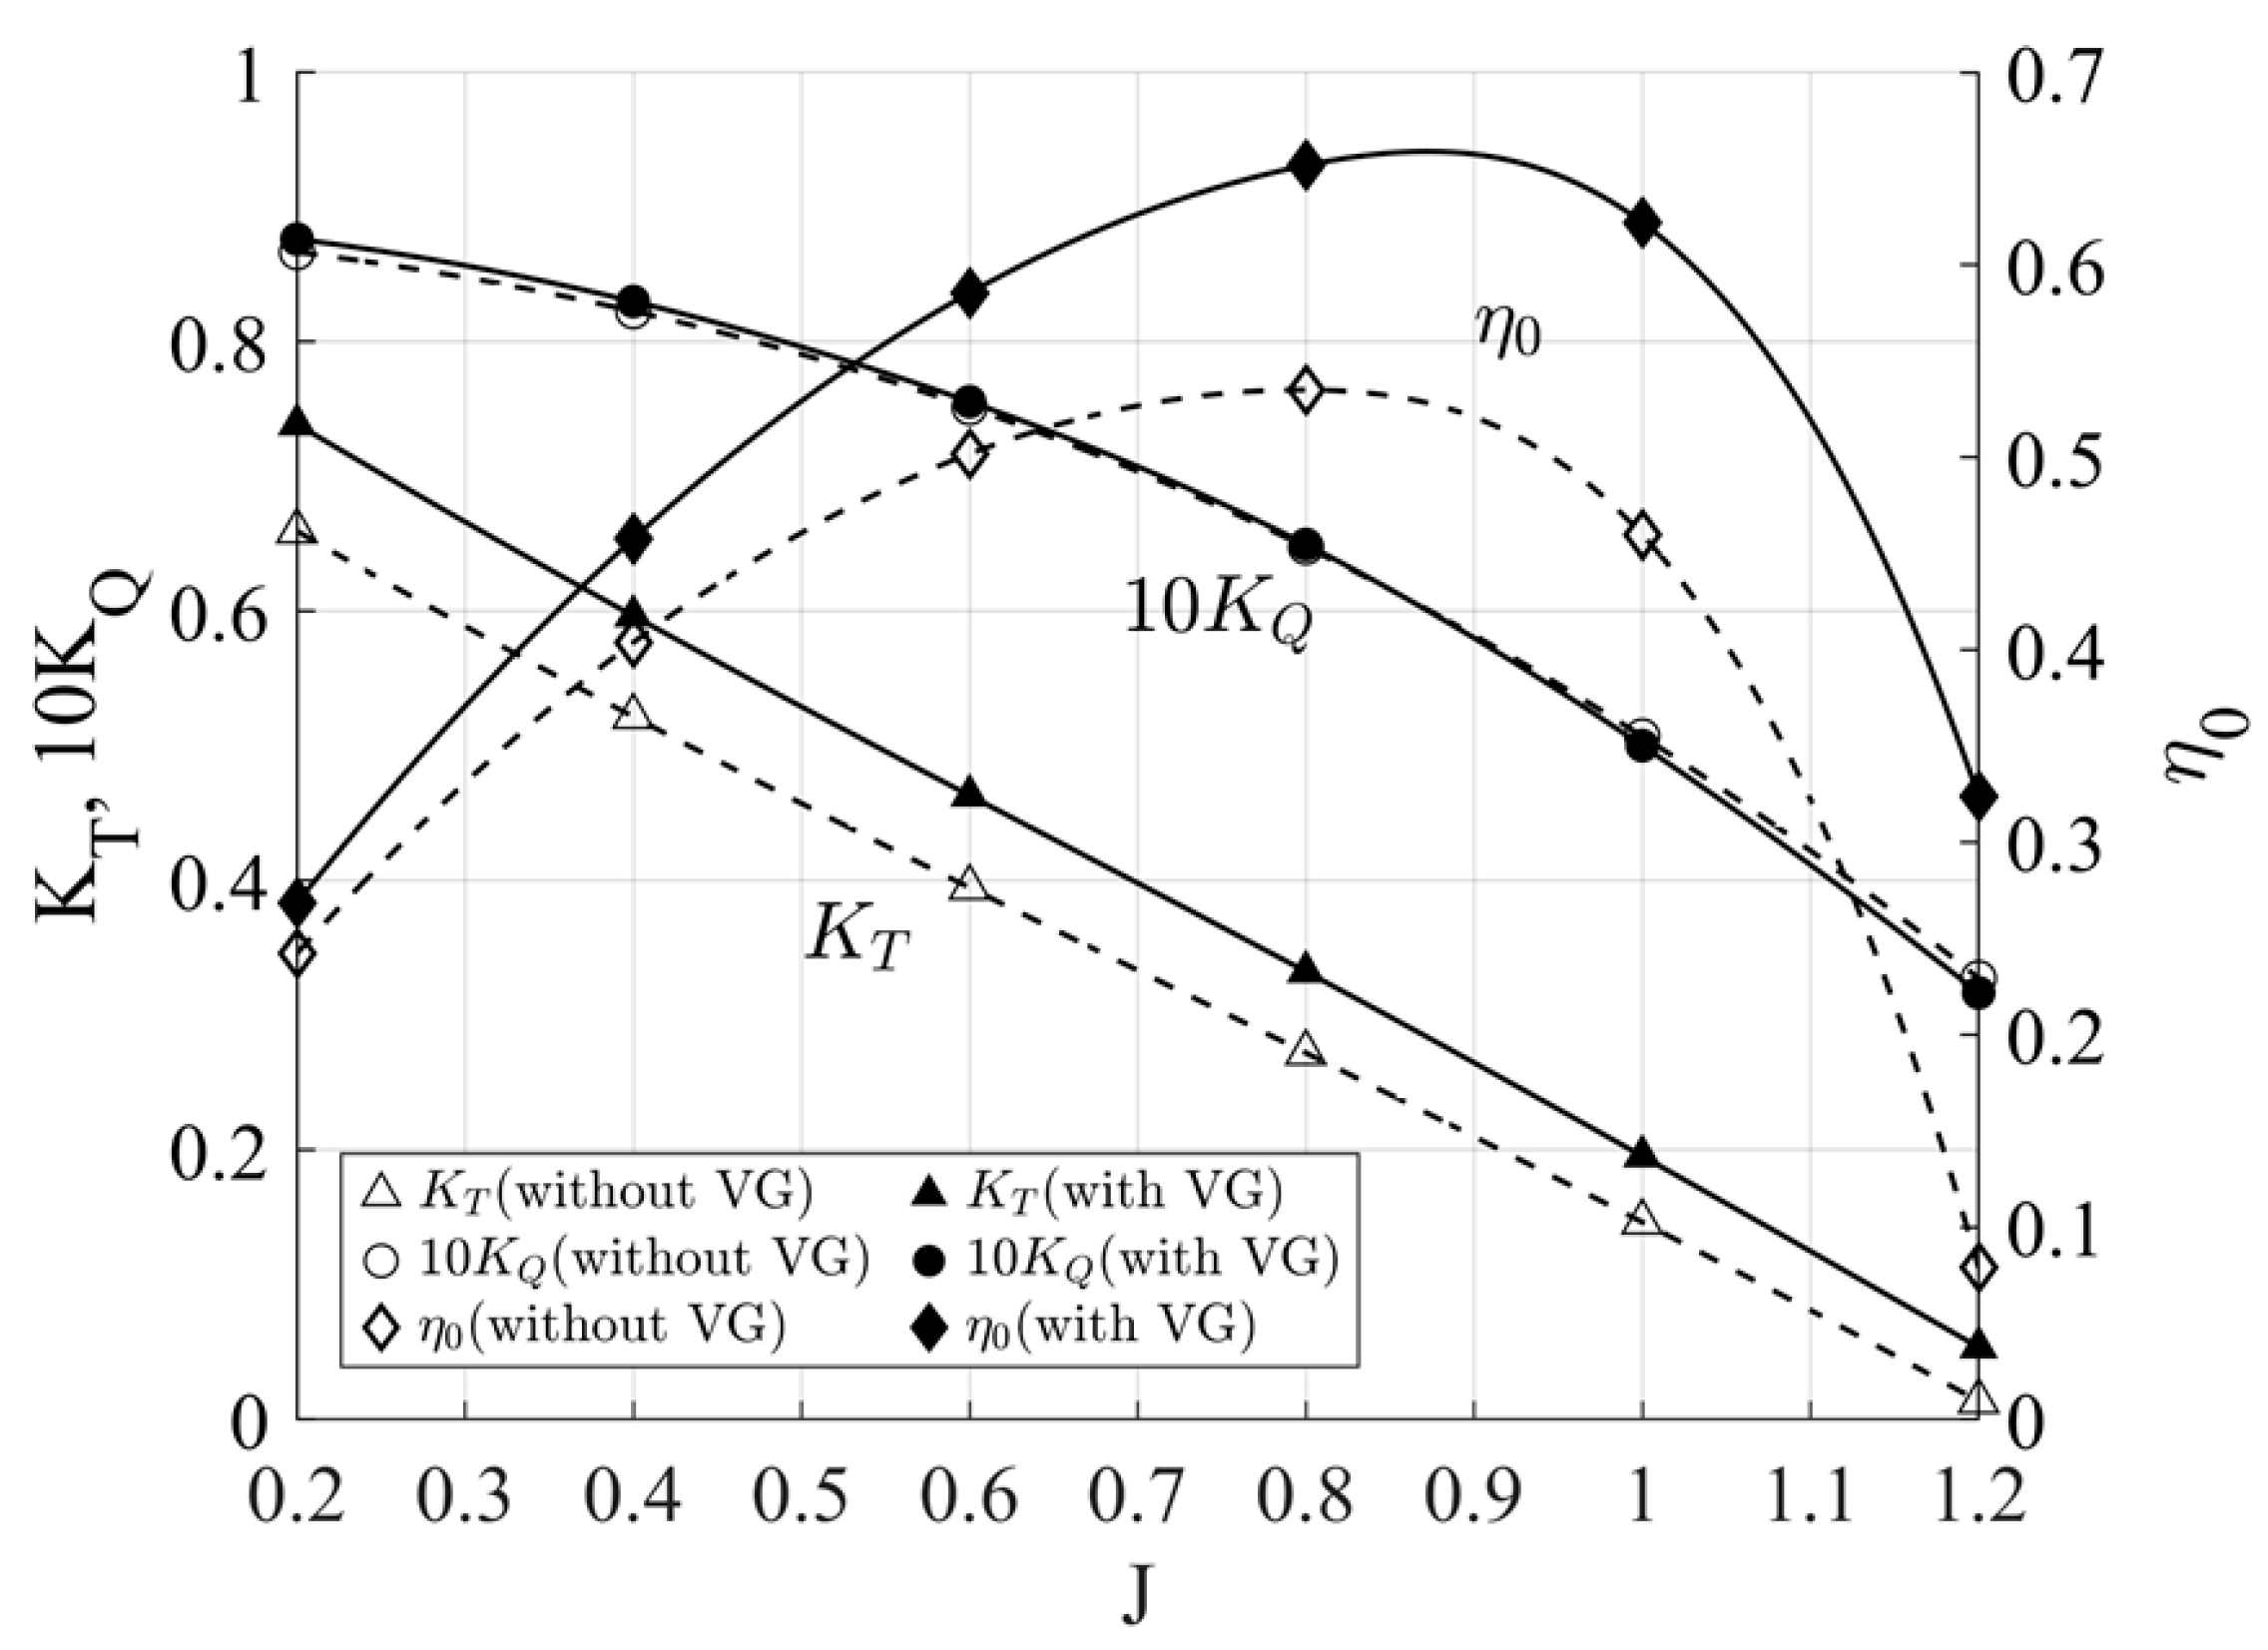
Figure 14 presents the propeller open-water (POW) curves for cases without and with vortex generators, where the black dashed lines denote the baseline configuration and the solid lines represent the VG-equipped configuration. The simulations were conducted at six discrete advance ratio conditions, and continuous performance curves were obtained by interpolating the computed results.
The results indicate that the installation of vortex generators leads to consistent improvements in both the thrust coefficient and propulsive efficiency over the entire range of advance ratios, while the torque coefficient exhibits only marginal changes and remains nearly constant. This trend suggests that the vortex generators effectively delay flow separation along the duct outer surface and enhance flow attachment, allowing higher thrust generation under the same rotational conditions. Consequently, the results demonstrate that the simple addition of vortex generators near the duct trailing edge can improve the forward propulsion performance of the RDP, highlighting their practical potential as an effective means for enhancing propulsive efficiency.
While the open-water performance curves presented in the previous section represent the total thrust of the RDP, obtained as the sum of the thrust contributions from the duct and the rotor, this section separates and analyzes the individual contributions of the duct and the rotor.
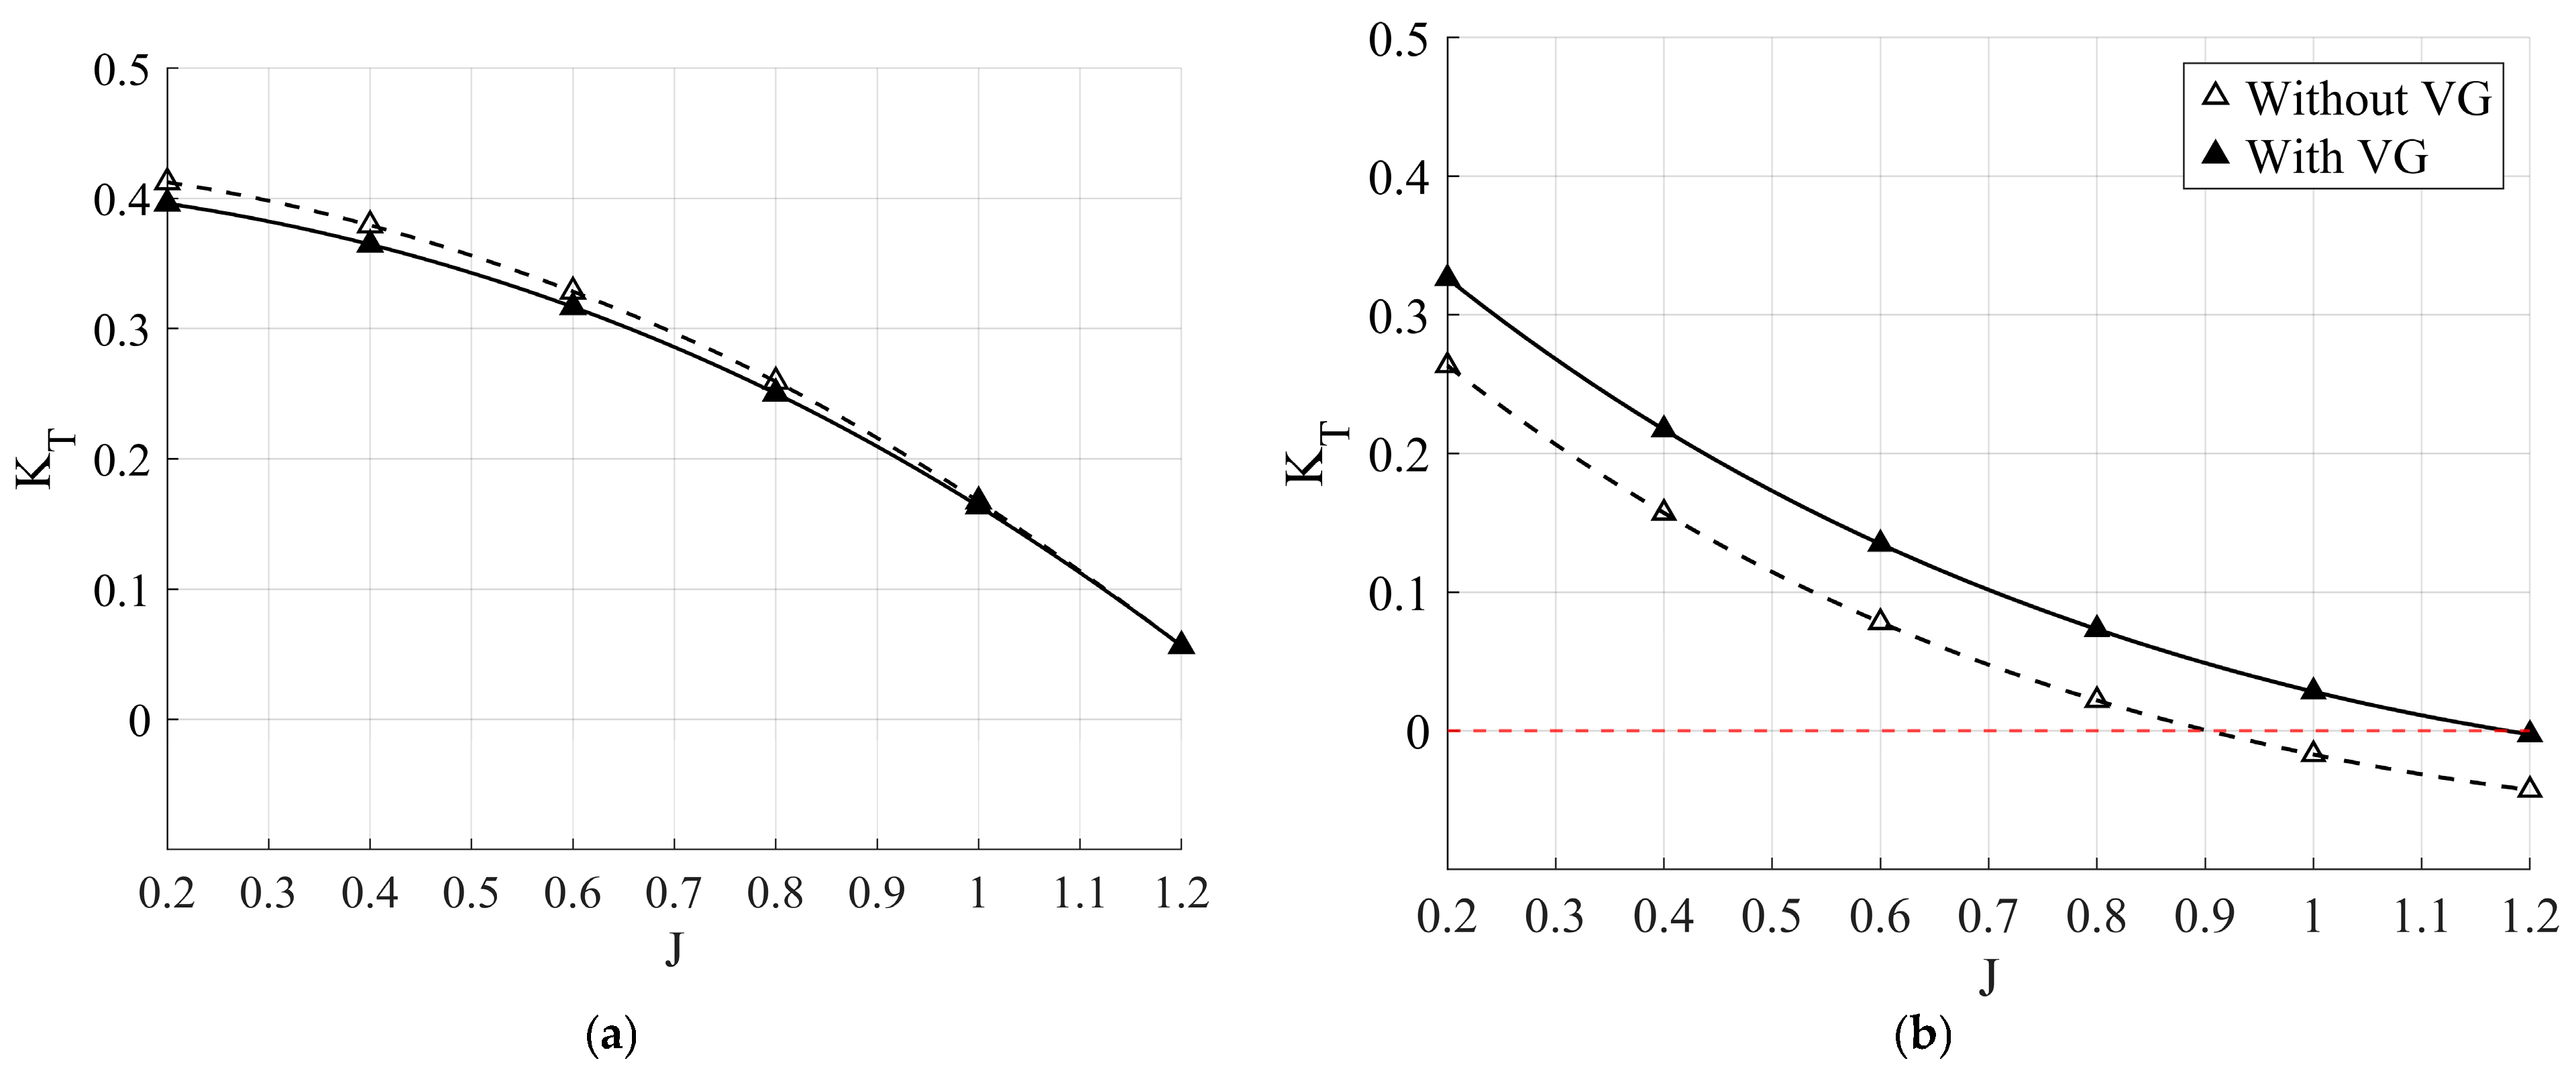
Figure 15 shows the variations in thrust coefficient with advance ratio for the rotor and the duct, respectively.
As observed in the rotor thrust coefficient results, the installation of vortex generators on the duct leads to a slight increase in the rotor thrust coefficient at low advance ratios. This behavior can be attributed to the increase in static pressure downstream of the duct induced by the vortex generators, which enhances the pressure difference between the upstream and downstream sides of the rotor blades, thereby increasing the axial thrust generated by the blades.
In the case of the duct thrust coefficient, the results show a gradual decrease in duct thrust with increasing advance ratio, with the thrust approaching zero in the high advance ratio regime. This trend is generally associated with the transition of the duct from producing positive thrust to acting as a source of drag, corresponding to negative thrust, at high advance ratios. However, when vortex generators are applied, the duct thrust coefficient remains higher over the entire range of advance ratios, and positive thrust is maintained even in the high advance ratio region. This improvement is attributed to the vortex generators installed near the duct trailing edge, which delay or reorganize the downstream flow separation and vortical structures, thereby reducing pressure losses at the duct exit and improving the static pressure distribution in the wake. As a result, flow attachment within the duct is preserved, leading to an increased pressure difference () across the rotor blades and, consequently, to an overall enhancement of propulsive performance.
5. Conclusions
In this study, the effectiveness of a flow control strategy using vortex generators (VGs) applied to the outer surface of the duct was systematically investigated for a rim-driven propeller (RDP), in which the freedom of design for duct shape optimization is inherently limited due to structural constraints. Numerical reliability was ensured through RANS-based simulations combined with a grid convergence study using the grid convergence index (GCI). A steady-state analysis based on the multiple reference frame (MRF) approach was employed, and the effects of VG installation on boundary-layer behavior and flow separation along the duct outer surface were evaluated through velocity profile analysis, line integral convolution (LIC) visualization, pressure field analysis, and wake distributions of normalized streamwise velocity and vorticity, both quantitatively and qualitatively. The results demonstrate that the vortex generators effectively delay boundary layer separation near the trailing edge of the duct and enhance flow attachment by supplying additional momentum to the low-speed flow adjacent to the duct outer surface.
These improvements in flow physics lead to enhanced pressure recovery characteristics downstream of the duct, resulting in increased duct thrust and consistent improvements in the overall thrust coefficient and propulsive efficiency across the entire range of advance ratios. Notably, the increase in torque coefficient due to the application of vortex generators remains marginal, indicating that the performance enhancement can be achieved without introducing significant additional rotational resistance. The findings of this study suggest that VG-based flow control, which can be implemented without modifying the duct geometry, represents a practical and effective approach for improving the propulsive performance of rim-driven propellers. Further studies focusing on the optimization of VG geometry and arrangement, as well as the assessment of noise and cavitation characteristics, are expected to further expand the applicability of this approach in the design and operation of RDP systems.





 ,
,