Article

Reservoir Heterogeneity and Vertical Differentiation of the Marine Shales in the Permian Gufeng Formation, Western Hubei, China: Insights from NMR and Micro-CT Analyses


1
Hubei Key Laboratory of Marine Geological Resources, China University of Geosciences, Wuhan 430074, China
2
School of Geosciences, Yangtze University, Wuhan 430100, China
*
Author to whom correspondence should be addressed.
J. Mar. Sci. Eng. 2026, 14(12), 1131; https://doi.org/10.3390/jmse14121131
Submission received: 12 May 2026 / Revised: 17 June 2026 / Accepted: 17 June 2026 / Published: 19 June 2026

Abstract

Reservoir effectiveness in marine shales is controlled not only by pore volume but also by pore-fluid occurrence, pore–throat connectivity, and mineral–organic matter coupling. In this study, the Permian Gufeng Formation shales from the Enshi area, western Hubei, South China, were investigated through an integrated analysis of total organic carbon (TOC), X-ray diffraction (XRD)-based mineral composition and lithofacies, low-field nuclear magnetic resonance (NMR), scanning electron microscopy (SEM), micro-computed tomography (Micro-CT), and entropy-weighted technique for order preference by similarity to an ideal solution (TOPSIS) evaluation. The TOC content ranges from 1.60% to 21.38% and shows clear vertical differentiation, with moderate but variable enrichment in the lower interval, reduced organic matter abundance in the middle interval, and pronounced organic enrichment in the upper interval. Mineral compositions demonstrate an upward transition from a mixed siliceous–carbonate system to a dominantly siliceous shale system. NMR results reveal strong heterogeneity in porosity, NMR-derived permeability, T2cutoff, bound-fluid saturation, and free-fluid saturation. Based on saturated and centrifuged T2 spectra, four descriptive reservoir response types were identified: short-T2-dominated micropore-bound response, intermediate-T2-dominated movable-fluid response, long-T2-enriched but low-efficiency response, and NMR-inferred enhanced mobility composite response. SEM observations show diverse pore types, including organic-matter-related pores, dissolution pores, interparticle pores, mineral-edge pores, pyrite intercrystalline pores, and local microfracture-like pores. Micro-CT results indicate that micrometer-scale pore bodies are commonly isolated, demonstrating that pore abundance or pore size alone cannot determine reservoir effectiveness. TOC mainly controls pore generation potential, whereas siliceous minerals, pore–throat connectivity, movable fluid proportion, and local fractures exert stronger controls on effective reservoir development. The most favorable reservoir responses are concentrated in the upper high-organic siliceous shale interval from A33 to A42, with local enhanced responses in A16 and A21. These results provide an integrated framework for evaluating reservoir heterogeneity and favorable intervals in complex marine shale systems.

1. Introduction

Marine shale reservoirs represent important unconventional hydrocarbon targets, characterized by multi-scale pore systems, pronounced lithological heterogeneity, and complex storage–flow mechanisms [1,2,3,4]. In contrast to conventional reservoirs, shale reservoir quality is not governed solely by pore volume alone; rather, it reflects the coupled effects of organic matter abundance, mineral composition, pore–throat architecture, and fluid occurrence state [5,6,7]. Therefore, effective reservoir evaluation requires an integrated assessment of geological attributes and petrophysical properties. Notably, intervals with substantial storage capacity may still be ineffective when pore connectivity is limited and the proportion of movable fluids is low [8,9,10].
In China, marine shale gas exploration has historically focused on the Wufeng–Longmaxi formations [11,12,13,14]. In recent years, stratigraphic intervals in the Middle–Upper Yangtze region have been explored [15,16,17,18]. Among these, the Middle–Upper Permian marine shales in western Hubei—particularly the Gufeng, Wujiaping and Dalong formations—have been recognized as promising successor targets [19,20,21]. Deposited in deep-water marine basin environments, these successions exhibit significant lateral and vertical facies variations [22,23]. The Gufeng Formation, in particular, developed under conditions of elevated primary productivity and anoxic–euxinic preservation, providing favorable geochemical conditions for source–reservoir development [22,24].
Recent investigations of Permian shales in western Hubei have advanced the understanding of regional geology, pore structure characteristics, organic matter enrichment, and fracability [20,25,26,27]. However, a critical gap remains for the Gufeng Formation in the Enshi area, where the vertical evolution of reservoir effectiveness is still poorly constrained. Previous studies have largely relied on single analytical approaches, which are insufficient to fully characterize the multiscale pore systems and their associated fluid behavior [28]. Existing evidence demonstrates that high pore volume does not necessarily correspond to high permeability. Instead, fluid flow is primarily controlled by pore–throat connectivity and the relative proportions of bound and movable fluids, while microfractures can enhance flow by connecting otherwise isolated pores [29,30,31]. Consequently, reservoir quality differentiation should be interpreted as the integrated result of pore generation, preservation, pore effectiveness, and fluid occurrence under multistage tectonic modification [27].
To address this complexity, a multi-method approach is essential. Nuclear magnetic resonance (NMR) provides direct constraints on pore-fluid occurrence and the proportion bound to movable fluids and enables an evaluation of effective pore–throat systems through T2 spectral analysis and centrifugation experiments [32,33]. In parallel, X-ray computed tomography (CT) allows for the three-dimensional visualization of larger pore structures and fractures, which is critical for distinguishing matrix-dominated effective reservoirs from fracture-enhanced intervals [34]. Accordingly, the integration of total organic carbon (TOC) analysis, mineralogical characterization, nuclear magnetic resonance (NMR) measurements, and computed tomography (CT) observations offers a robust framework for evaluating reservoir heterogeneity in marine shales [33,35].
This study focuses on marine shales of the Gufeng Formation in the Enshi area, western Hubei, based on a continuous vertical succession from Yinpoudong (YPD) section YPD-A2 to YPD-A49. By integrating TOC data, mineralogical compositions, NMR measurements, and CT observations, the objectives are to (1) characterize the vertical distribution of TOC, mineralogical features, and lithofacies; (2) evaluate reservoir properties and fluid occurrence using NMR parameters (T2 spectra, T2cutoff, and bound-fluid saturation); (3) identify the primary controlling factors reservoir heterogeneity; and (4) delineate the vertical stages of reservoir quality evolution to identify favorable intervals. The results provide improved insight into the heterogeneity of Permian marine shales in western Hubei and establish a scientific basis for sweet spot evaluation in complex shale systems. This study focuses on an onshore marine shale succession of the Gufeng Formation in the Enshi area. By integrating NMR, SEM, Micro-CT, TOC, and mineralogical data, the aim of this work is to characterize reservoir heterogeneity, pore-fluid occurrence, pore structure, and vertical differentiation in the Gufeng Formation shales. The integrated workflow provides a methodological reference for marine shale reservoir characterization, particularly in terms of pore structure, fluid mobility, and reservoir effectiveness.

2. Geological Setting

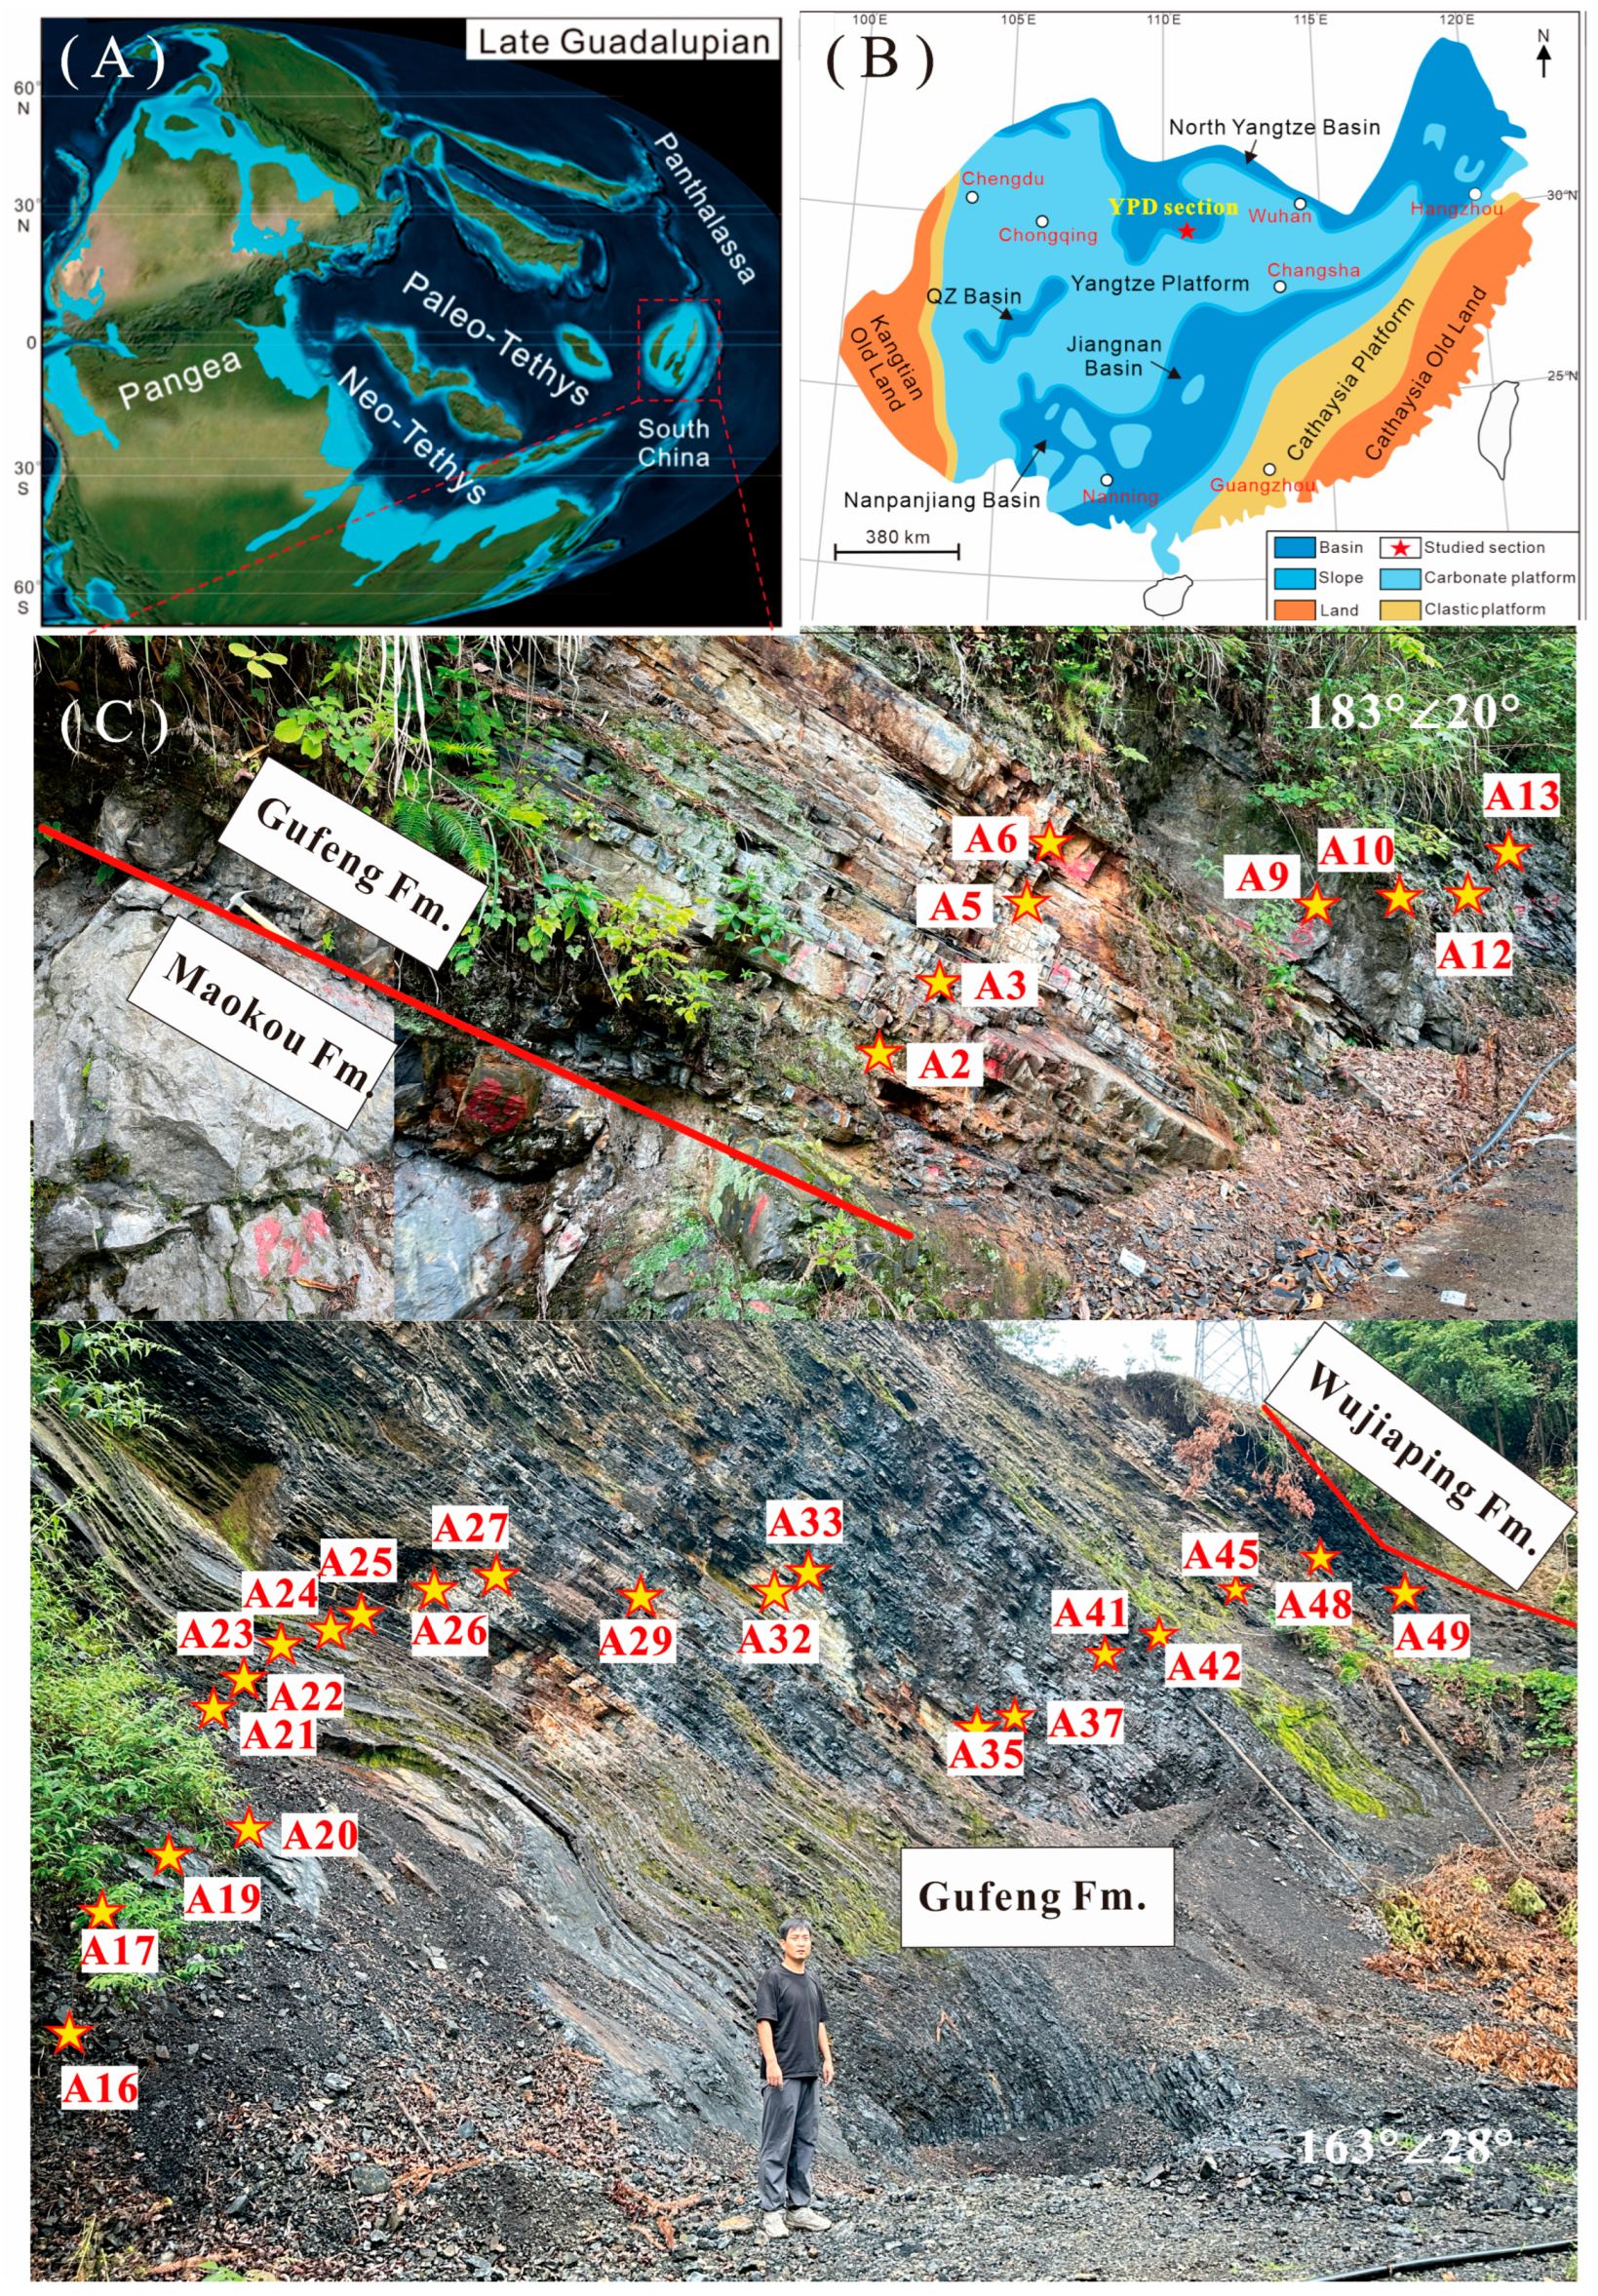
During the Middle Permian, the South China Block, comprising the Yangtze Block and the Cathaysia Block, was located near the equator and bordered the Paleo-Tethys Ocean to the west. Sedimentation within the Yangtze Craton was dominated by large-scale carbonate platform deposits, with deep-water to slope sediments developing along its northern and southern margins [17,24,36] (Figure 1A). The studied Yinpodong (YPD) section is located in Badong County, northern Enshi City, western Hubei Province, within the central Yangtze Craton (Figure 1B), at coordinates 109°51′27″ E and 30°26′37″ N.
The regional structural framework is characterized by folds and faults trending NNE–NE [38]. The Permian strata exposed in the area comprise, from bottom to top, the Middle Permian Liangshan, Qixia, Maokou and Gufeng formations, and the Upper Permian Longtan, Xiayao and Dalong formations. The Gufeng Formation occurs in the upper part of the Middle Permian succession and is composed mainly of siliceous mudstone and siliceous shale, with minor limestone. Distinct lithological is contrasts are observed between the Gufeng Formation and both its underlying Maokou Formation and overlying Wujiaping Formation [39,40]. The Maokou Formation is dominated by gray to dark gray thick-bedded limestone and dolomitic limestone, locally containing chert nodules. Its upper part also includes black siliceous rocks, referred to as the Gufeng Member of the Maokou Formation [39,40]. In contrast, the Wujiaping Formation consists predominantly of gray to grayish-yellow mudstone and limestone [41].
Previous studies have shown that the Permian marine shales in South China generally experienced high to over-mature thermal evolution [15,25,26]. In the Lower Yangtze area, the Gufeng Formation shale has reported Ro values of 1.24–1.99% and Tmax values of 339–518 °C, indicating a post-mature stage and dry gas window [15]. In western Hubei, the Gufeng–Dalong Formation shales from well HD1 show higher equivalent vitrinite reflectance values of 2.01–2.81%, with an average of 2.38%, suggesting a highly overmature stage dominated by dry gas generation [25]. Therefore, the Gufeng Formation shale in the Enshi area is considered to have undergone high to over-mature thermal evolution, which is favorable for gas generation and the development of secondary organic pores [25,26].

3. Samples and Methods

3.1. Sample Collection

A total of 30 shale samples from YPD-A2 to YPD-A49 were collected to investigate the vertical variation in organic geochemistry, mineralogical composition, lithofacies, and reservoir properties (Figure 1C). These samples represent a continuous vertical succession spanning from the lower to the upper parts of the Gufeng Formation.
To minimize the influence of surface weathering on the analysis results, all samples were carefully prepared by removing the weathered outer layer, and only the fresh interior portions were used for subsequent analyses. The samples were wire-cut into cylindrical specimens with dimensions of 2.5 × 5.0 cm for nuclear magnetic resonance (NMR) measurements, and 0.5 × 1 cm for Micro-CT analysis. The remaining material was crushed and ground to 200 mesh for total organic carbon and mineralogical analyses.

3.2. Methodology

3.2.1. Total Organic Carbon Analysis

TOC was measured to evaluate organic matter abundance in the Gufeng Formation shales. Prior to analysis, powdered samples were treated with dilute hydrochloric acid to remove carbonate minerals, followed by rinsing, drying, and analysis using a carbon analyzer (Elementar UNICUBE, Frankfurt, Germany).
Following the classification scheme for organic matter abundance in marine shales from the Yangtze region, TOC content was used to categorize the samples into low organic matter shale (0 < TOC < 2%), moderate organic matter shale (2% ≤ TOC < 4%), and high organic matter shale (TOC ≥ 4%). This classification has been widely applied in studies of lithofacies and pore structure in the Wufeng–Longmaxi Formation of the Sichuan Basin and is effective for distinguishing reservoir characteristics among shales with varying organic matter contents [42,43].

3.2.2. Mineralogical Analysis and Lithofacies Classification

Mineralogical compositions were determined using X-ray Powder Diffraction (XRD) with a Bruker D8 A25 Advance diffractometer (Bruker AXS GmbH, Karlsruhe city, Germany) equipped with monochromatic Cu Kα radiation (λ = 1.5405 Å). The instrument was operated at 40 KV and 40 mA in a θ-θ configuration, with Bragg–Brentano geometry and a position-sensitive Lynx Eye detector (Karlsruhe, Germany). Diffractograms were collected over a 2θ range of 4°–120° with a step size of 0.015º and a counting time of 1 s/step, while maintaining sample rotation at 15/min. Crystalline phases were identified using DIFFRAC.EVA V7 software (Bruker, Germany) based on the ICDD database. Semi-quantitative mineral contents were estimated using Siroquant 5.0 software, which is primarily applicable to well-characterized crystalline phases.

3.2.3. NMR Measurements and Parameter Extraction

Nuclear magnetic resonance (NMR) measurements were conducted to characterize pore-fluid occurrence and reservoir effectiveness. The transverse relaxation time (T2) distribution obtained from low-field NMR reflects the pore surface-to-volume ratio and thus serves as an effective proxy for pore size distribution and fluid occurrence state [44]. However, T2 relaxation in shales is affected not only by pore size, but also by surface relaxivity, clay-bound water, organic matter, mineral surface properties, and fluid type. Therefore, the T2 spectra in this study are interpreted as pore-structure-sensitive and pore-fluid-occurrence-sensitive responses rather than direct pore size distributions [45].
The measurements were performed following the Chinese petroleum and natural gas industry standard Measurement Method for Rock Nuclear Magnetic Resonance Parameters (SY/T 6490-2014) [46] using a Niumag MesoMR12-060H-I low-field NMR analyzer (Suzhou Niumag Analytical Instrument Co., Ltd., Suzhou, China) at 25 °C. Before saturated-state NMR measurements were made, the cylindrical samples were vacuum-saturated with deionized water. A preliminary saturation time test was conducted using saturation durations of 6, 12, 24, 36, and 48 h, and 24 h was selected for the formal measurements because the corresponding T2 spectra better reflected the pore-fluid response of the samples.
The T2 spectra were acquired using the Carr–Purcell–Meiboom–Gill (CPMG) pulse sequence. The acquisition parameters were as follows: sampling frequency, 100 kHz; radiofrequency delay, 0.25 ms; main frequency, 12 kHz; frequency offset, 236,199.91 Hz; waiting time, 1500 s; 90° pulse width, 7 μs; 180° pulse width, 10.8 μs; echo spacing, 0.2 ms; number of echoes, 1000; peak offset, 0.01 ms; and number of scans, 32. After saturated-state measurements, the samples were centrifuged at 4000 rpm for 25 min and then remeasured using the same NMR acquisition parameters. The saturated and centrifuged T2 spectra were compared to evaluate fluid mobility and to distinguish bound-fluid and free-fluid components. This saturated–centrifuged comparison is commonly used to determine T2cutoff and to distinguish bound-fluid and free-fluid components [44].
The NMR dataset includes NMR porosity, NMR-derived permeability, T2 distribution, T2cutoff, bound-fluid saturation (BFS), and free-fluid saturation (FFS). NMR porosity was calculated from the calibrated total NMR signal amplitude and was used to represent total pore volume. T2cutoff was determined from the comparison between saturated and centrifuged T2 spectra and was used to separate bound-fluid and free-fluid components. BFS and FFS were calculated from the proportions of spectral areas below and above T2cutoff, respectively. In shale reservoirs, the interpretation of T2cutoff requires caution because shale nanopores and clay-bound water commonly produce very short relaxation components, and conventional cutoff values derived from sandstone or carbonate reservoirs may not be directly applicable [47].
The permeability values reported in this study are NMR-derived permeability values calculated using the Coates model in the Niumag MesoMR analysis software (Version 4.0; Niumag Corporation, Suzhou, China), rather than independently measured gas permeability or pulse-decay permeability. The equation follows the formulation of Coates et al. [48]:
k = C C o a t e s ϕ m F F I B V I n
where k is NMR-derived permeability, ϕ is NMR porosity, FFI is the free-fluid index, BVI is the bound-fluid index, and C C o a t e s , m, and n are empirical coefficients. The default form used in the software is
k m D = 100 ϕ 4 F F I B V I 2
where ϕ is expressed as a decimal fraction. Because no independent gas permeability or pulse-decay permeability calibration was available, the NMR-derived permeability values are only used as relative indicators of fluid mobility and pore–throat effectiveness, rather than calibrated absolute matrix permeability values.
Based on the T2 spectral characteristics, T2cutoff, BFS, NMR-derived permeability, and spectral variations after centrifugation, the samples were classified into four NMR-defined reservoir types: (1) short-T2-dominated micropore-bound type, (2) intermediate-T2-dominated mesopore-effective type, (3) long-T2-enriched but low-efficiency type, and (4) fracture-enhanced composite type. This classification is used as an integrated descriptive framework for comparing reservoir effectiveness among samples. It should be noted that the NMR-defined reservoir types proposed in this study are used as a descriptive and comparative framework rather than as a statistically clustered or independently validated classification scheme. The classification is based on the integrated comparison of T2 spectral shape, T2cutoff, BFS, FFS, NMR-derived permeability, and centrifugation-induced spectral changes. These parameters are used to describe relative differences in pore-fluid occurrence and fluid mobility among samples, rather than to provide absolute thresholds for reservoir type discrimination.

3.2.4. Micro-CT Analysis

Micro-CT analysis was conducted on representative samples YPD-A6, YPD-A24, YPD-A30, and YPD-A49 using a Zeiss Xradia Versa Micro-CT 610 system (Carl Zeiss X-ray Microscopy, Pleasanton, CA, USA). The scans were performed at a tube voltage of 120 kV, with an exposure time of 1 s and 3001 projections for each sample. The spatial resolution was 1.74 μm for YPD-A6 and YPD-A49, and 1.65 μm for YPD-A24 and YPD-A30. The reconstructed voxel dimensions were 977 × 1014 × 992 for YPD-A6, 957 × 1014 × 992 for YPD-A24, 985 × 1014 × 994 for YPD-A30, and 990 × 1014 × 993 for YPD-A49.
Projection data were reconstructed into grayscale slices and three-dimensional volumes. After noise reduction, the grayscale volumes were segmented to distinguish CT-resolved pore space from the rock matrix, followed by three-dimensional rendering of the pore structure. The grayscale segmentation thresholds were 2047–10,254 for YPD-A6, 2047–18,086 for YPD-A24, 2047–12,065 for YPD-A30, and 2047–8287 for YPD-A49. This workflow is widely adopted in digital rock analysis, where grayscale CT volumes are filtered, segmented, and converted into three-dimensional pore models for quantitative characterization [49]. Subsequently, connectivity analysis and pore network modeling were performed on the segmented pore space to obtain pore radius distribution, average pore radius, average pore volume, average specific surface area, throat number, average throat radius, average throat length, and average coordination number. The coordination number reflects the number of throats connected to each pore and thus serves as a quantitative indicator of pore network connectivity [2]. The representative elementary volume (REV)-related porosity values obtained from the analyzed CT volumes were 0.08% for YPD-A6, 1.20% for YPD-A24, 0.04% for YPD-A30, and 0.04% for YPD-A49. These parameters were used to assess whether CT-resolved micrometer-scale pore bodies are effectively connected or predominantly isolated.
Because the spatial resolution of the Micro-CT analysis was 1.65–1.74 μm, the CT results characterize only micrometer-scale pore bodies and throats resolved by the scans. Nanometer- to submicrometer-scale organic pores and clay-related pores are below the resolution of this method. Therefore, the Micro-CT results were used to constrain micrometer-scale pore architecture only and were interpreted together with SEM observations and NMR-derived reservoir parameters [50].

3.2.5. Scanning Electron Microscopy (SEM) Analysis

Scanning electron microscopy (SEM) was conducted on selected Gufeng Formation shale samples to identify pore types, mineral occurrence, organic-matter-related pores, and microfractures. Thin-section samples were coated with gold prior to analysis and examined using a Tescan TIMA GMS scanning electron microscope (TESCAN ORSAY HOLDING, a.s., Brno, Czech Republic) operated at an accelerating voltage of 20 keV. Secondary electron (SE) imaging was employed to observe pore morphology, mineral textures, and microstructural features at different magnifications.
The SEM images were used to distinguish organic-matter-related pores, organic matter–mineral boundary pores, mineral dissolution pores, interparticle pores, mineral-edge pores, intercrystalline pores within pyrite-like aggregates, and microfracture-like pores. These observations provide direct microscopic evidence for interpreting the NMR-derived pore-fluid occurrence and Micro-CT-resolved micrometer-scale pore architecture.
Because SEM observations are two-dimensional and limited to selected fields of view, they were used mainly for the qualitative identification of pore types and local connectivity features. The interpretation of reservoir effectiveness was therefore based on the integrated analysis of SEM pore types, NMR-derived fluid mobility parameters, and Micro-CT-resolved pore architecture.

4. Results

4.1. TOC Characteristics

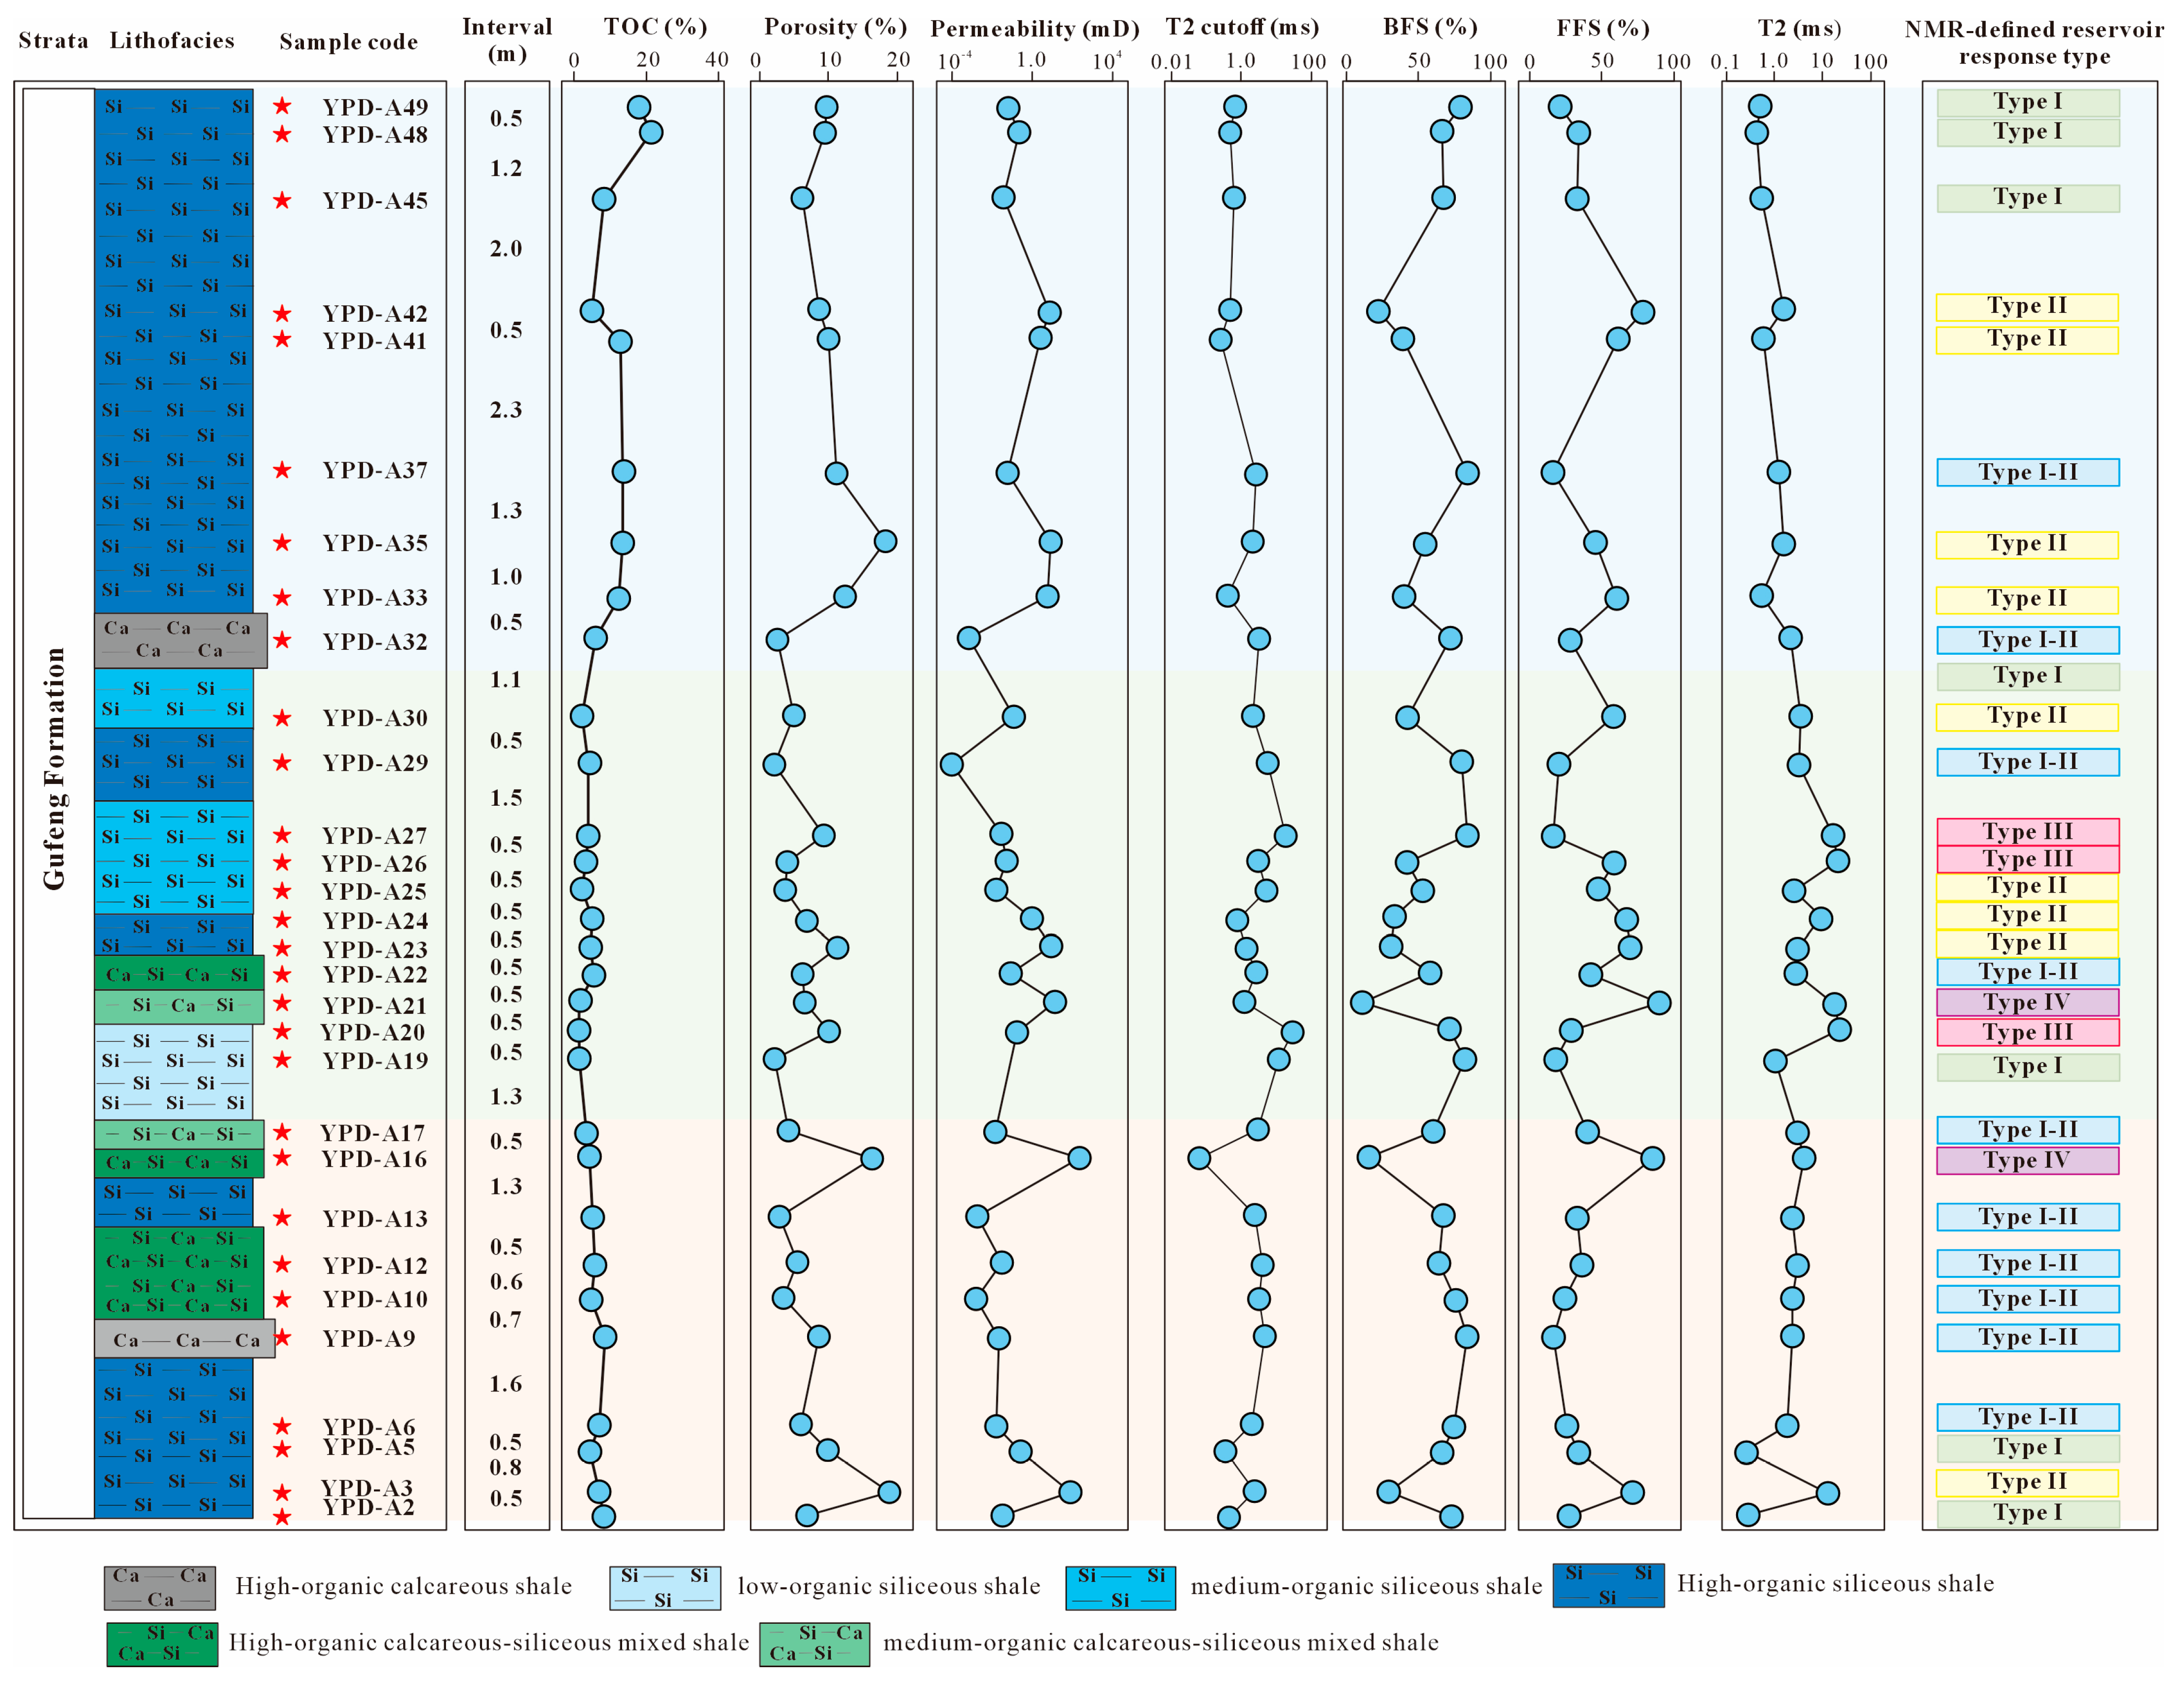
TOC contents of the Gufeng Formation shales range from 1.60% to 21.38%, indicating pronounced heterogeneity in organic matter enrichment (Figure 2). This wide TOC range reflects substantial vertical variation in organic matter input and preservation conditions during deposition.
The TOC profile exhibits a well-defined three-stage vertical pattern. In the lower interval (A2–A17), the TOC values are generally moderate but highly variable, ranging from 3.63% to 8.73% with an average of 6.02%, suggesting unstable organic matter enrichment conditions. In the middle interval (A19–A30), the TOC values decrease markedly, defining a relatively organic-lean segment with values between 1.60% and 5.66% and an average of 3.46%. In contrast, the upper interval (YPD-A32–A49) is distinctly organic-rich, with TOC values ranging from 5.14% to 21.38% and an average of 12.45%. Samples YPD-A33, A35, A37, A41, A48, and A49 exhibit particularly high TOC contents.
Overall, the Gufeng Formation can be subdivided into a moderately enriched but highly variable lower interval, an organic-lean middle interval, and a strongly enriched upper interval. This vertical TOC distribution provides the primary geochemical basis for the stratigraphic differentiation of reservoir properties.

4.2. Mineralogical Characteristics

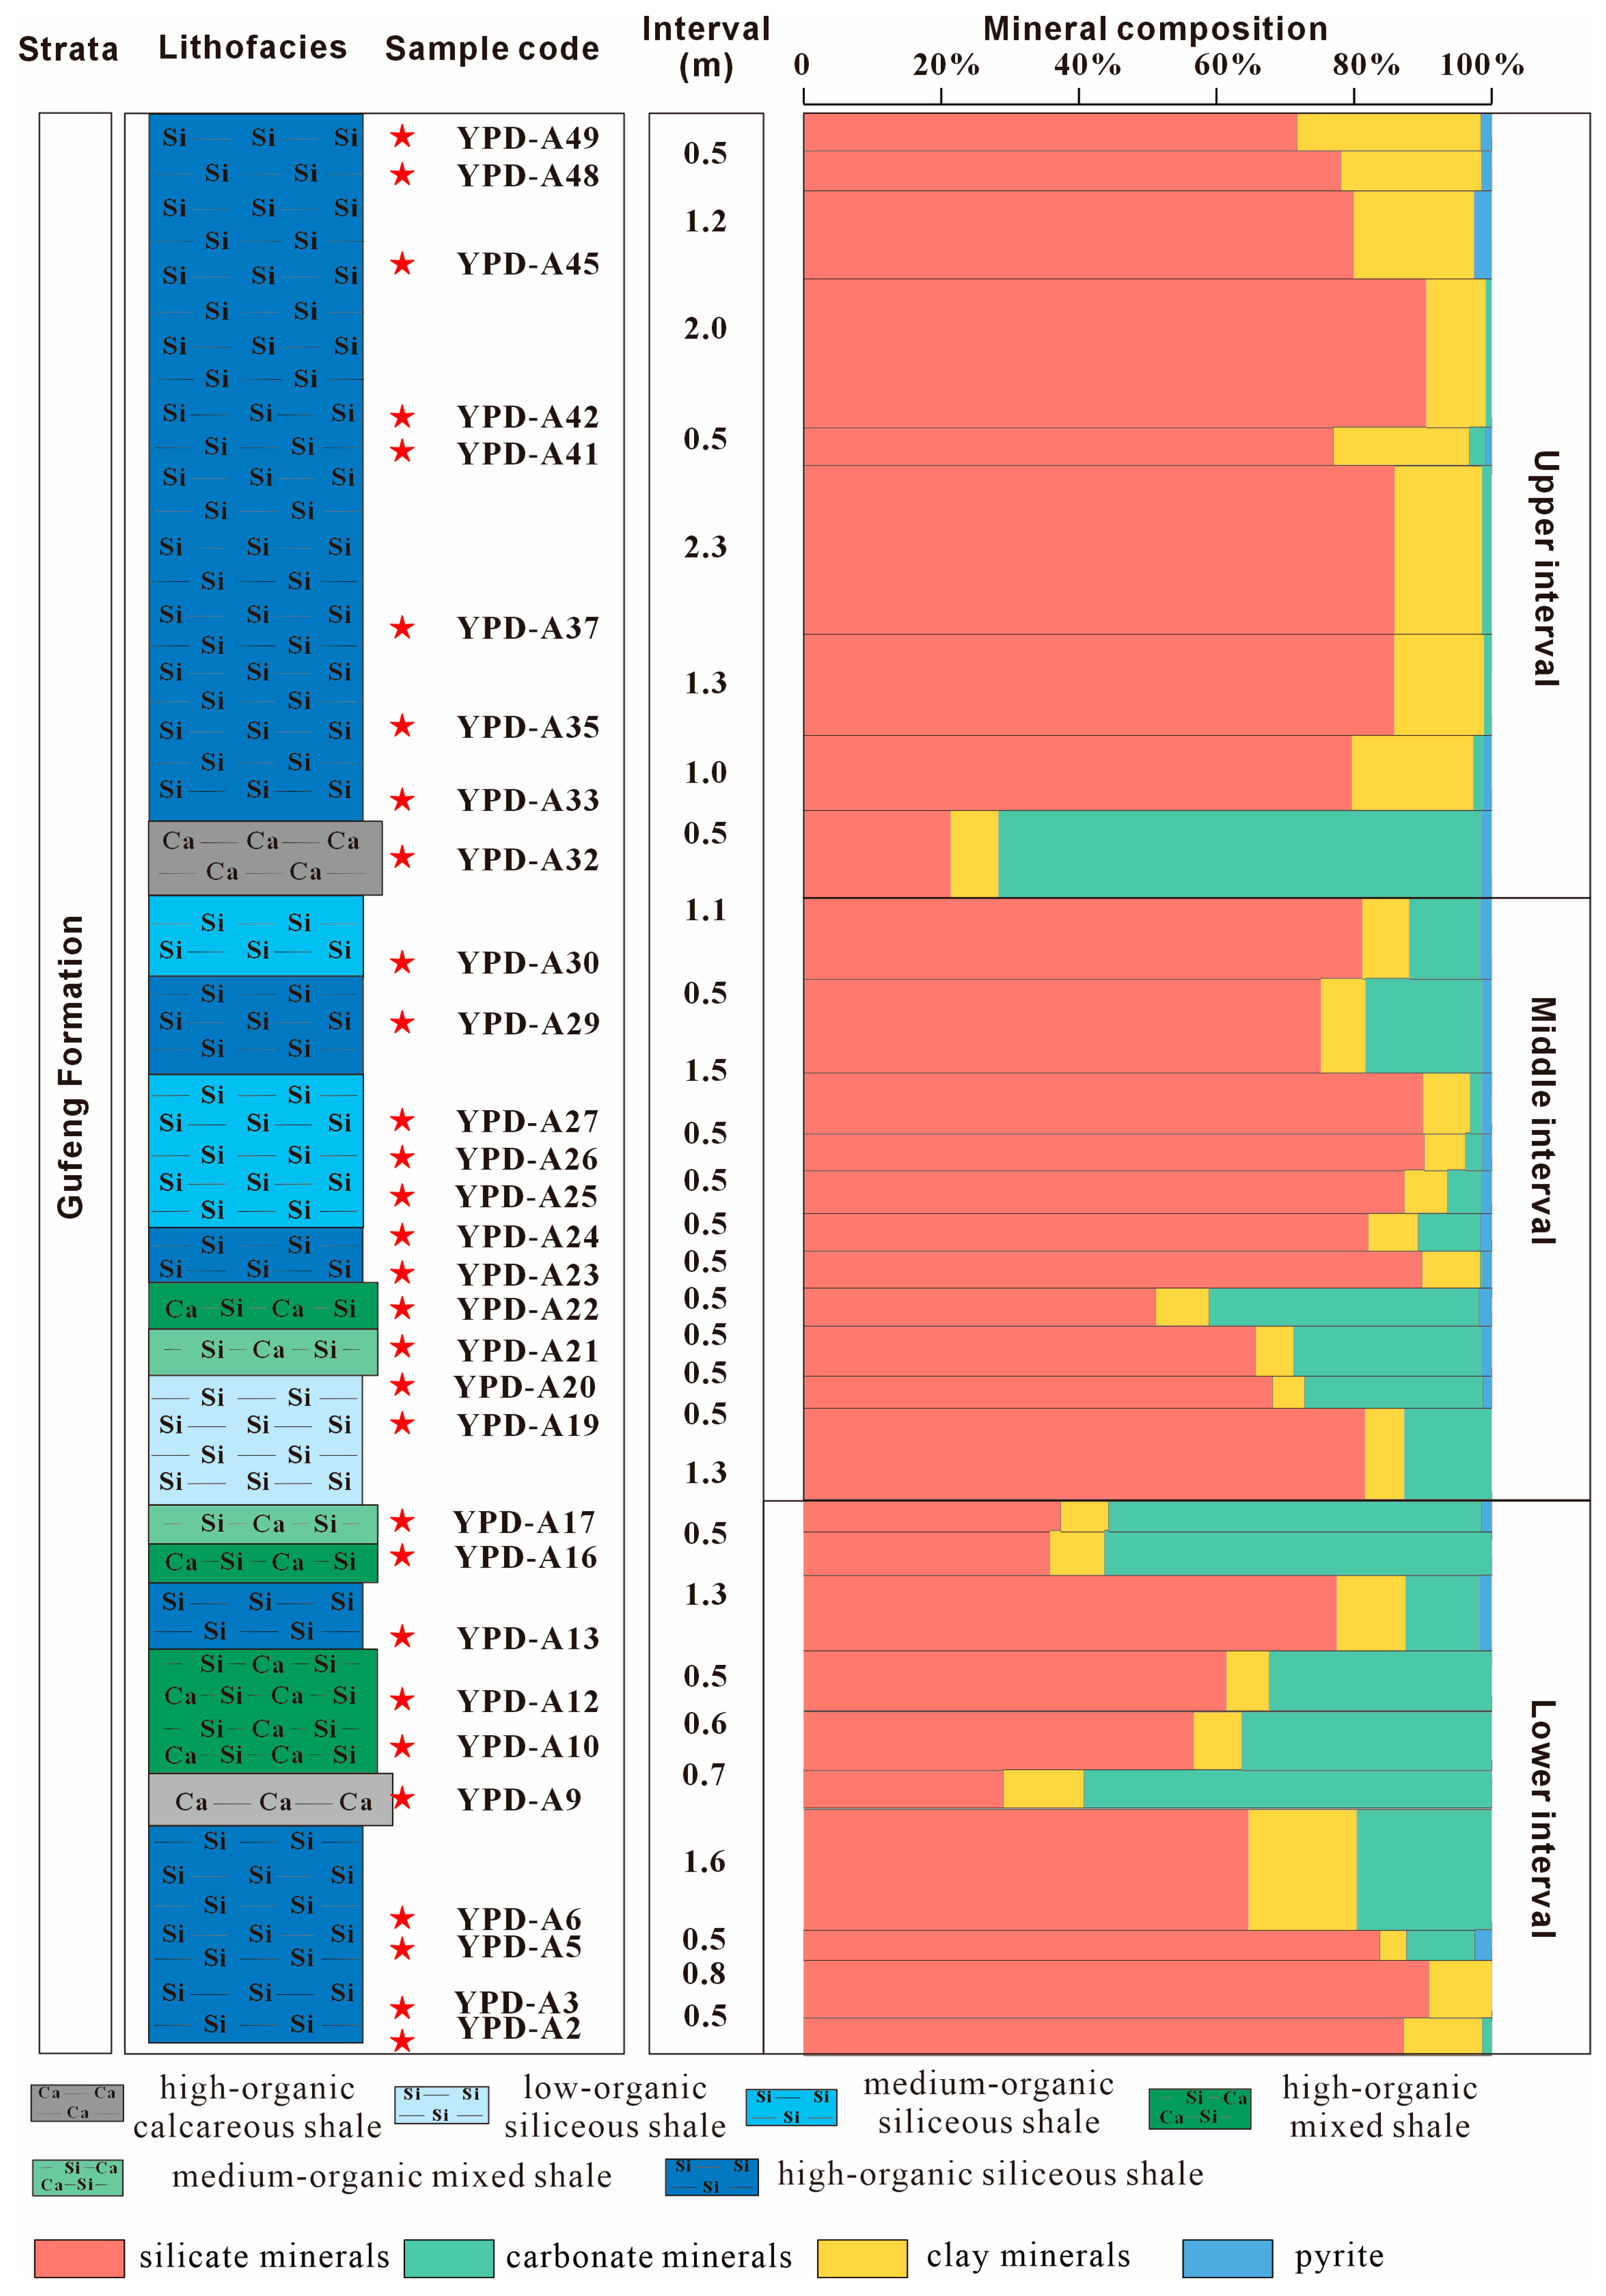
Mineral assemblages of the Gufeng Formation are dominated by siliceous components (quartz, albite, and orthoclase), although considerable compositional variability exists among the samples (Figure 3, Table 1). Quartz and feldspar constitute the primary rigid mineral framework (23.8–91.2%), whereas carbonate minerals (calcite and dolomite) show substantial variation along the section (0–69.4%). Clay minerals (illite and kaolinite) are present in relatively low proportions and vary within a narrow range (3.8–19.5%).
Table 1. XRD -derived mineral compositions and mineral groups of the Gufeng Formation shale samples.
Sample CodeQuartzAlbiteOrthoclaseIlliteMuscoviteKaolinitePyriteCalciteDolomiteGypsum
YPD-A287.20  11.40   1.40  
YPD-A390.90  9.10      
YPD-A582.50  0.003.80 3.009.80 0.90
YPD-A663.945.19 10.39   19.38 1.10
YPD-A928.17  9.46 1.94 57.53 2.90
YPD-A1056.50  7.00   36.20 0.30
YPD-A1261.44  6.19   30.771.60 
YPD-A1376.40 1.308.60  2.4010.50 0.80
YPD-A1635.20 3.504.30   21.3034.101.60
YPD-A1737.00 2.104.80  1.7037.9015.800.70
YPD-A1981.58  5.71   10.512.20 
YPD-A2068.10  4.60  1.4025.900.00 
YPD-A2165.60  5.50  1.6026.101.20 
YPD-A2250.75 1.406.31  2.4037.741.20 
YPD-A2388.41  7.39  1.600.40 1.30
YPD-A2481.10  7.20  2.108.90  
YPD-A2586.57  6.21  1.604.91 0.70
YPD-A2689.40  5.90  1.602.40 0.70
YPD-A2788.29  6.71  1.701.70 1.60
YPD-A2974.90  6.50  1.7016.90  
YPD-A3081.00  6.50  1.9010.30  
YPD-A3221.12 2.704.20  2.1069.37 0.50
YPD-A3377.08 6.6110.51  2.301.30 2.20
YPD-A3585.17 3.209.73   1.10 0.80
YPD-A3785.39 2.3010.31   1.100.300.60
YPD-A4176.30 7.5012.10  1.801.500.80 
YPD-A4290.50 0.707.90   0.90  
YPD-A4578.98 4.4012.91  3.70   
YPD-A4874.60  19.50  5.90   
YPD-A4969.739.195.49 11.29 4.30   
Vertically, the mineral composition exhibits clear stratigraphic organization (Figure 3). The lower interval (YPD-A2–A17) represents the most mineralogically heterogeneous part of the section, characterized by frequent alternations between siliceous-dominated and carbonate-bearing samples, indicating rapidly changing depositional and/or diagenetic conditions. The middle interval (YPD-A19–A30) remains compositionally variable; however, carbonate minerals are relatively abundant in the lower to middle part of the section but decrease upward toward the upper interval, where siliceous minerals become dominant. In the upper interval (YPD-A33–A49), siliceous minerals are dominant and carbonate-rich samples are rare, suggesting a more stable siliceous depositional system.
These observations indicate that the Gufeng Formation evolves upward from a mixed siliceous–carbonate system to a dominantly siliceous shale system. This mineralogical transition provides the lithological framework for vertical variation in reservoir properties.

4.3. Lithofacies Characteristics

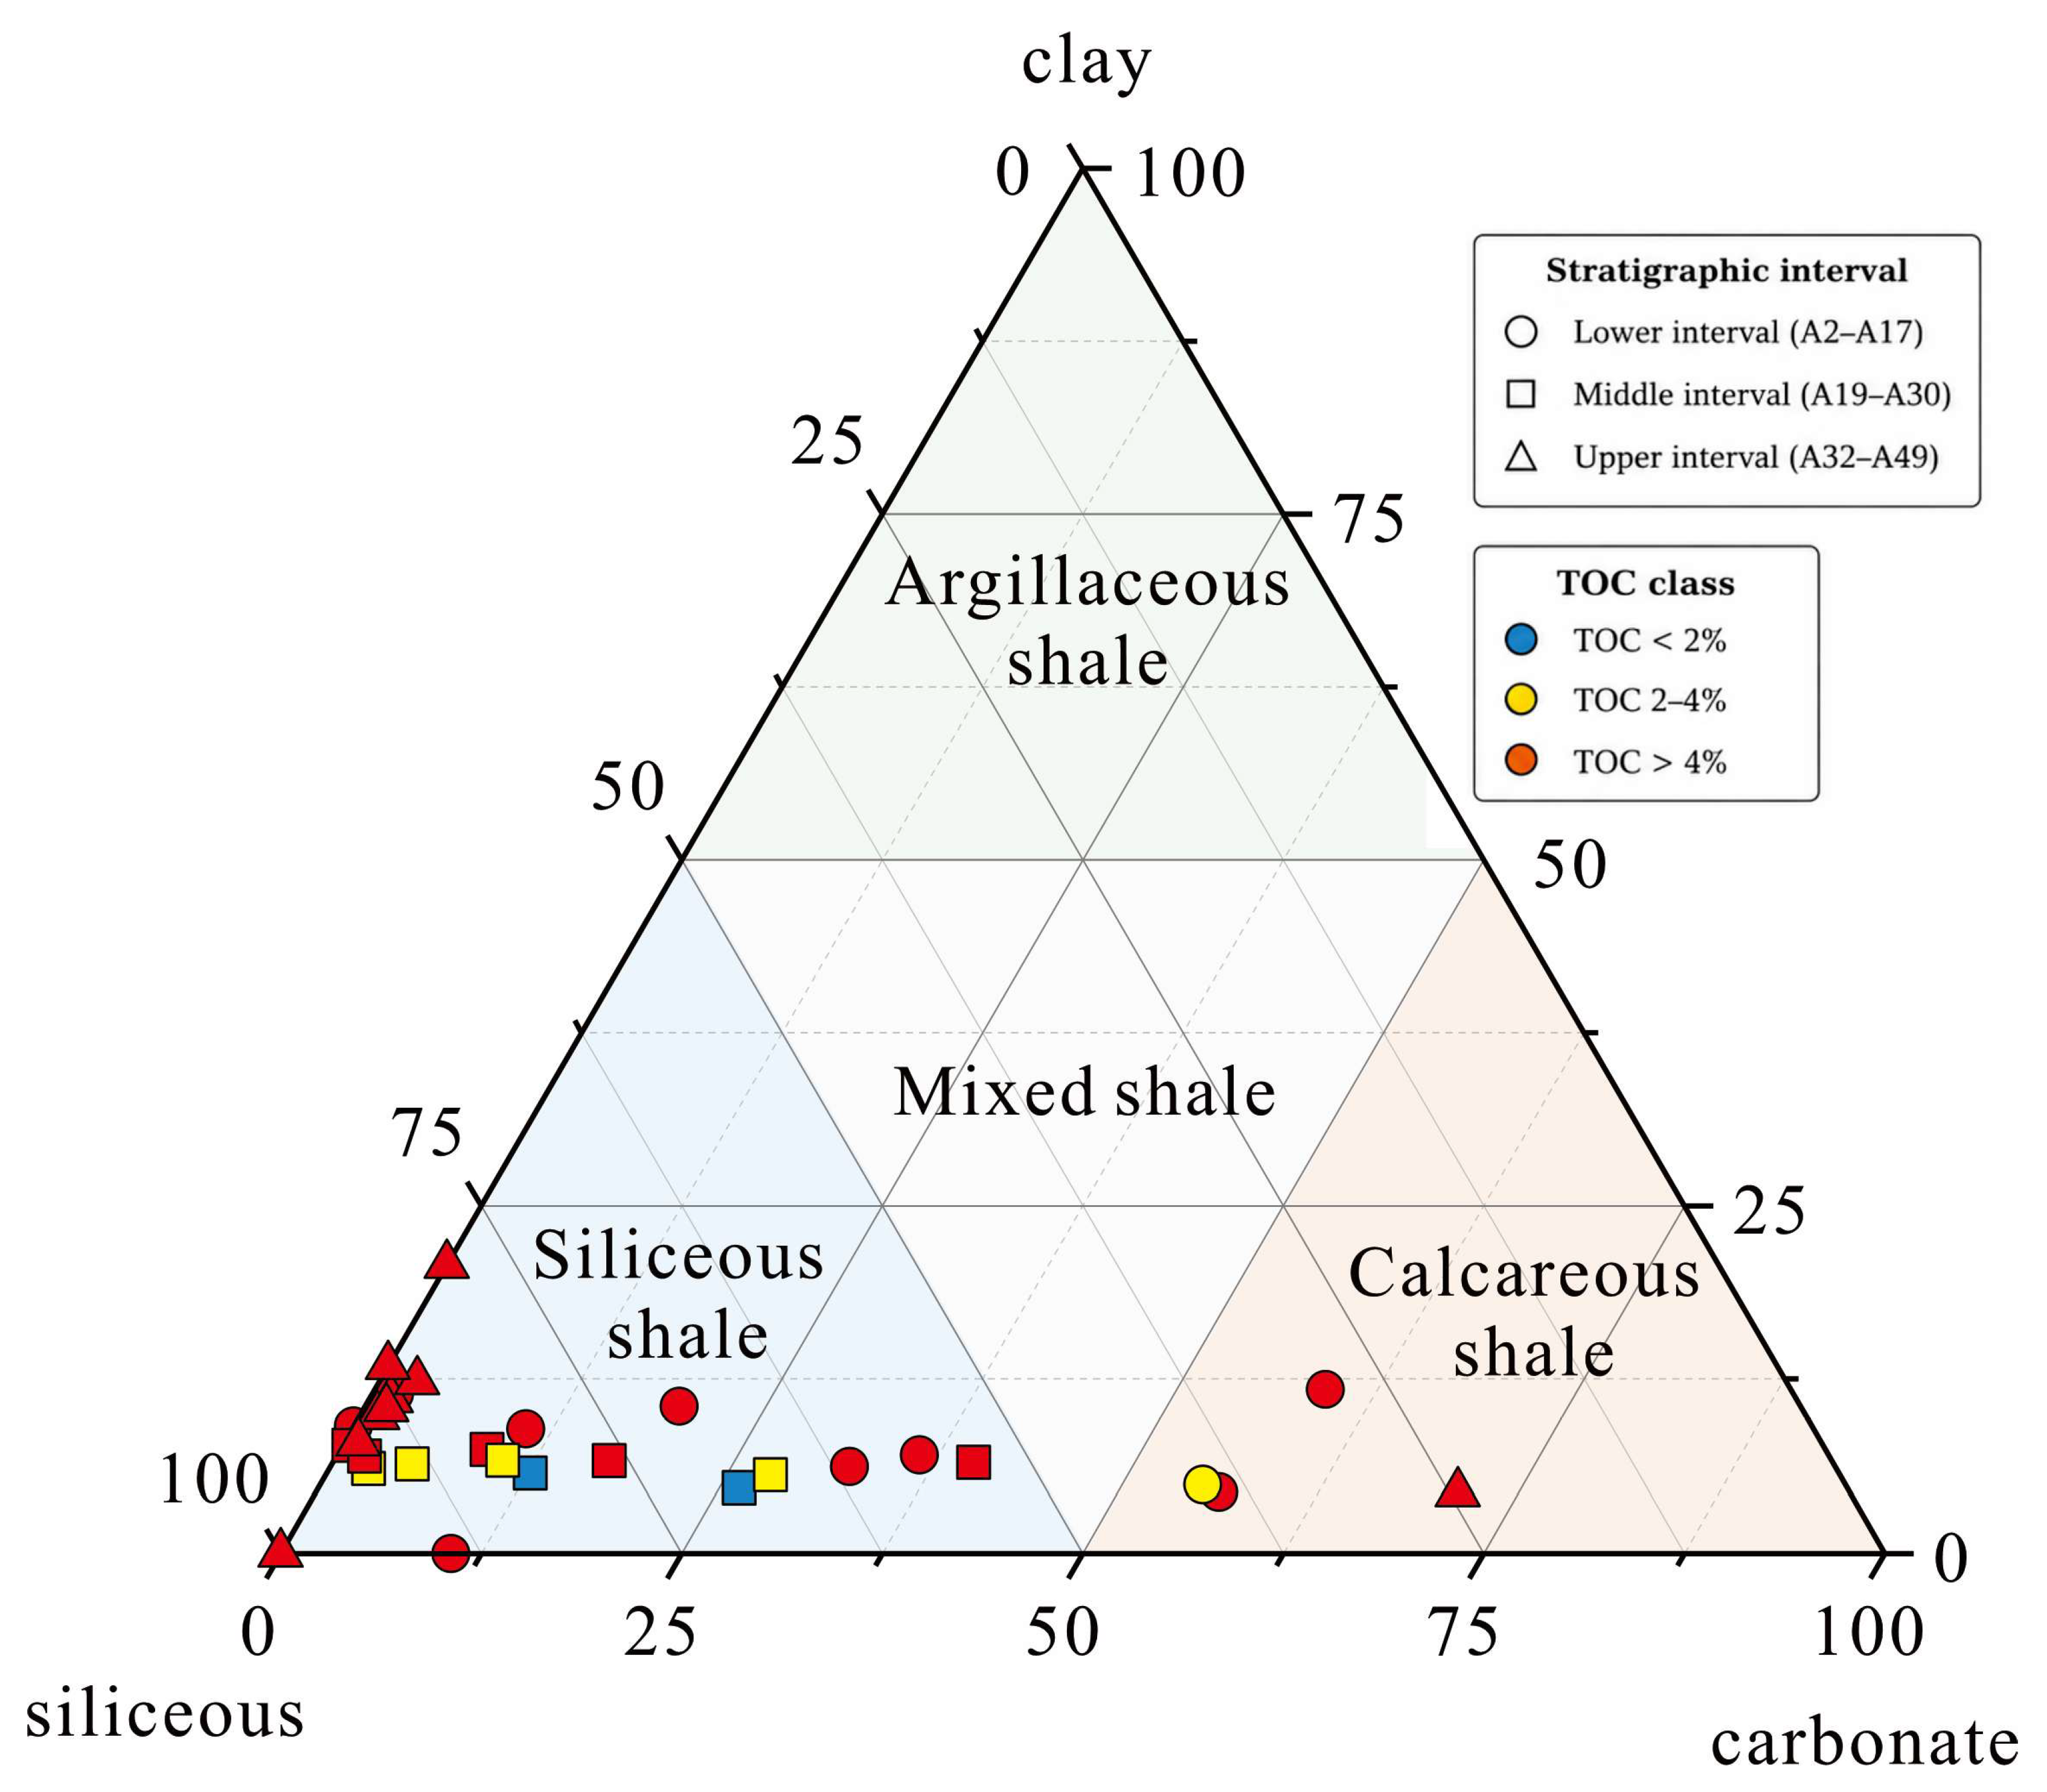
A lithofacies classification of the Gufeng Formation shales was conducted based on the combined characteristics of organic matter content and mineral composition. Mineralogical classification adopts a 50% threshold to define four lithofacies types: siliceous shale (siliceous minerals ≥ 50%), calcareous shale (carbonate minerals ≥ 50%), argillaceous shale (clay minerals ≥ 50%), and mixed shale (all mineral components < 50%). TOC thresholds of 2% and 4% were used to distinguish low-, medium-, and high-organic-matter shales. To improve consistency with widely used fine-grained sedimentary rock nomenclature, the lithofacies classification in this study follows the general mudrock classification concept proposed by Lazar et al. [51], in which fine-grained rocks are described according to mineral composition and organic matter abundance. In this manuscript, the term “mudrock” is used as the broader sedimentological term for fine-grained siliciclastic–carbonate rocks, whereas “shale” is retained where the discussion specifically refers to the Gufeng Formation shale reservoir and shale-gas-related terminology. Therefore, lithofacies such as siliceous shale, calcareous shale, argillaceous shale, and mixed shale are discussed as shale-reservoir equivalents of siliceous mudrock, calcareous mudrock, argillaceous mudrock, and mixed mudrock, respectively.
Based on this scheme, the Gufeng Formation samples are classified into six lithofacies types: high-organic siliceous shale, medium-organic siliceous shale, low-organic siliceous shale, high-organic mixed shale, medium-organic mixed shale, and high-organic calcareous shale (Figure 4).
The vertical distribution of lithofacies shows strong stratification (Figure 2). The lower interval (YPD-A2–A17) is characterized by frequent alternations between high-organic siliceous shale and calcareous–siliceous mixed shale, indicating pronounced lithofacies heterogeneity. The middle interval (YPD-A19–A30) is dominated by low- to medium-organic siliceous lithofacies, with only limited development of calcareous–siliceous mixed shale. The upper interval (YPD-A32–A49) consists predominantly of high-organic siliceous shale, except for sample YPD-A32, which is classified as high-organic calcareous shale; therefore, YPD-A32 represents a lithofacies transition at the base of the upper interval rather than part of the main siliceous high-quality reservoir interval. This vertical lithofacies distribution reflects an upward transition toward an organic-rich siliceous shale-dominated succession.

4.4. NMR-Derived Reservoir Properties

The NMR results demonstrate pronounced reservoir heterogeneity within the Gufeng Formation. The NMR porosity ranges from 2.20% to 18.77%, NMR-derived permeability from <0.0001 to 205.89 mD, FFS from 16.01% to 89.07%, BFS from 10.93% to 83.99%, and T2cutoff from 0.06 to 28.92 ms (Table 2). Because permeability was calculated using the Coates model rather than being independently measured, it is used here as a relative indicator of fluid mobility and pore–throat effectiveness. Therefore, exceptionally high NMR-derived permeability values, such as those of YPD-A16 and YPD-A3, should not be interpreted as calibrated shale matrix permeability, but may reflect enhanced connectivity, bedding-parallel cracks, fracture-related NMR responses, artificial sample damage, or model-derived amplification.
These wide ranges indicate that reservoir heterogeneity is not solely controlled by pore volume; it also involves substantial variations in pore–throat scale, bound-fluid proportion, connectivity, and fluid mobility.
At the profile scale, porosity alone is insufficient to distinguish effective from ineffective reservoirs. Several samples with moderate to high porosity exhibit low NMR-derived permeability and low FFS, whereas other with only moderate porosity show high NMR-derived permeability and strong fluid mobility. This contrast indicates the coexistence of multiple pore systems with distinct storage and flow capacities. Therefore, an integrated NMR evaluation is required to assess reservoir effectiveness.

4.4.1. Implications of T2cutoff and BFS for Pore–Throat Scale and Reservoir Effectiveness

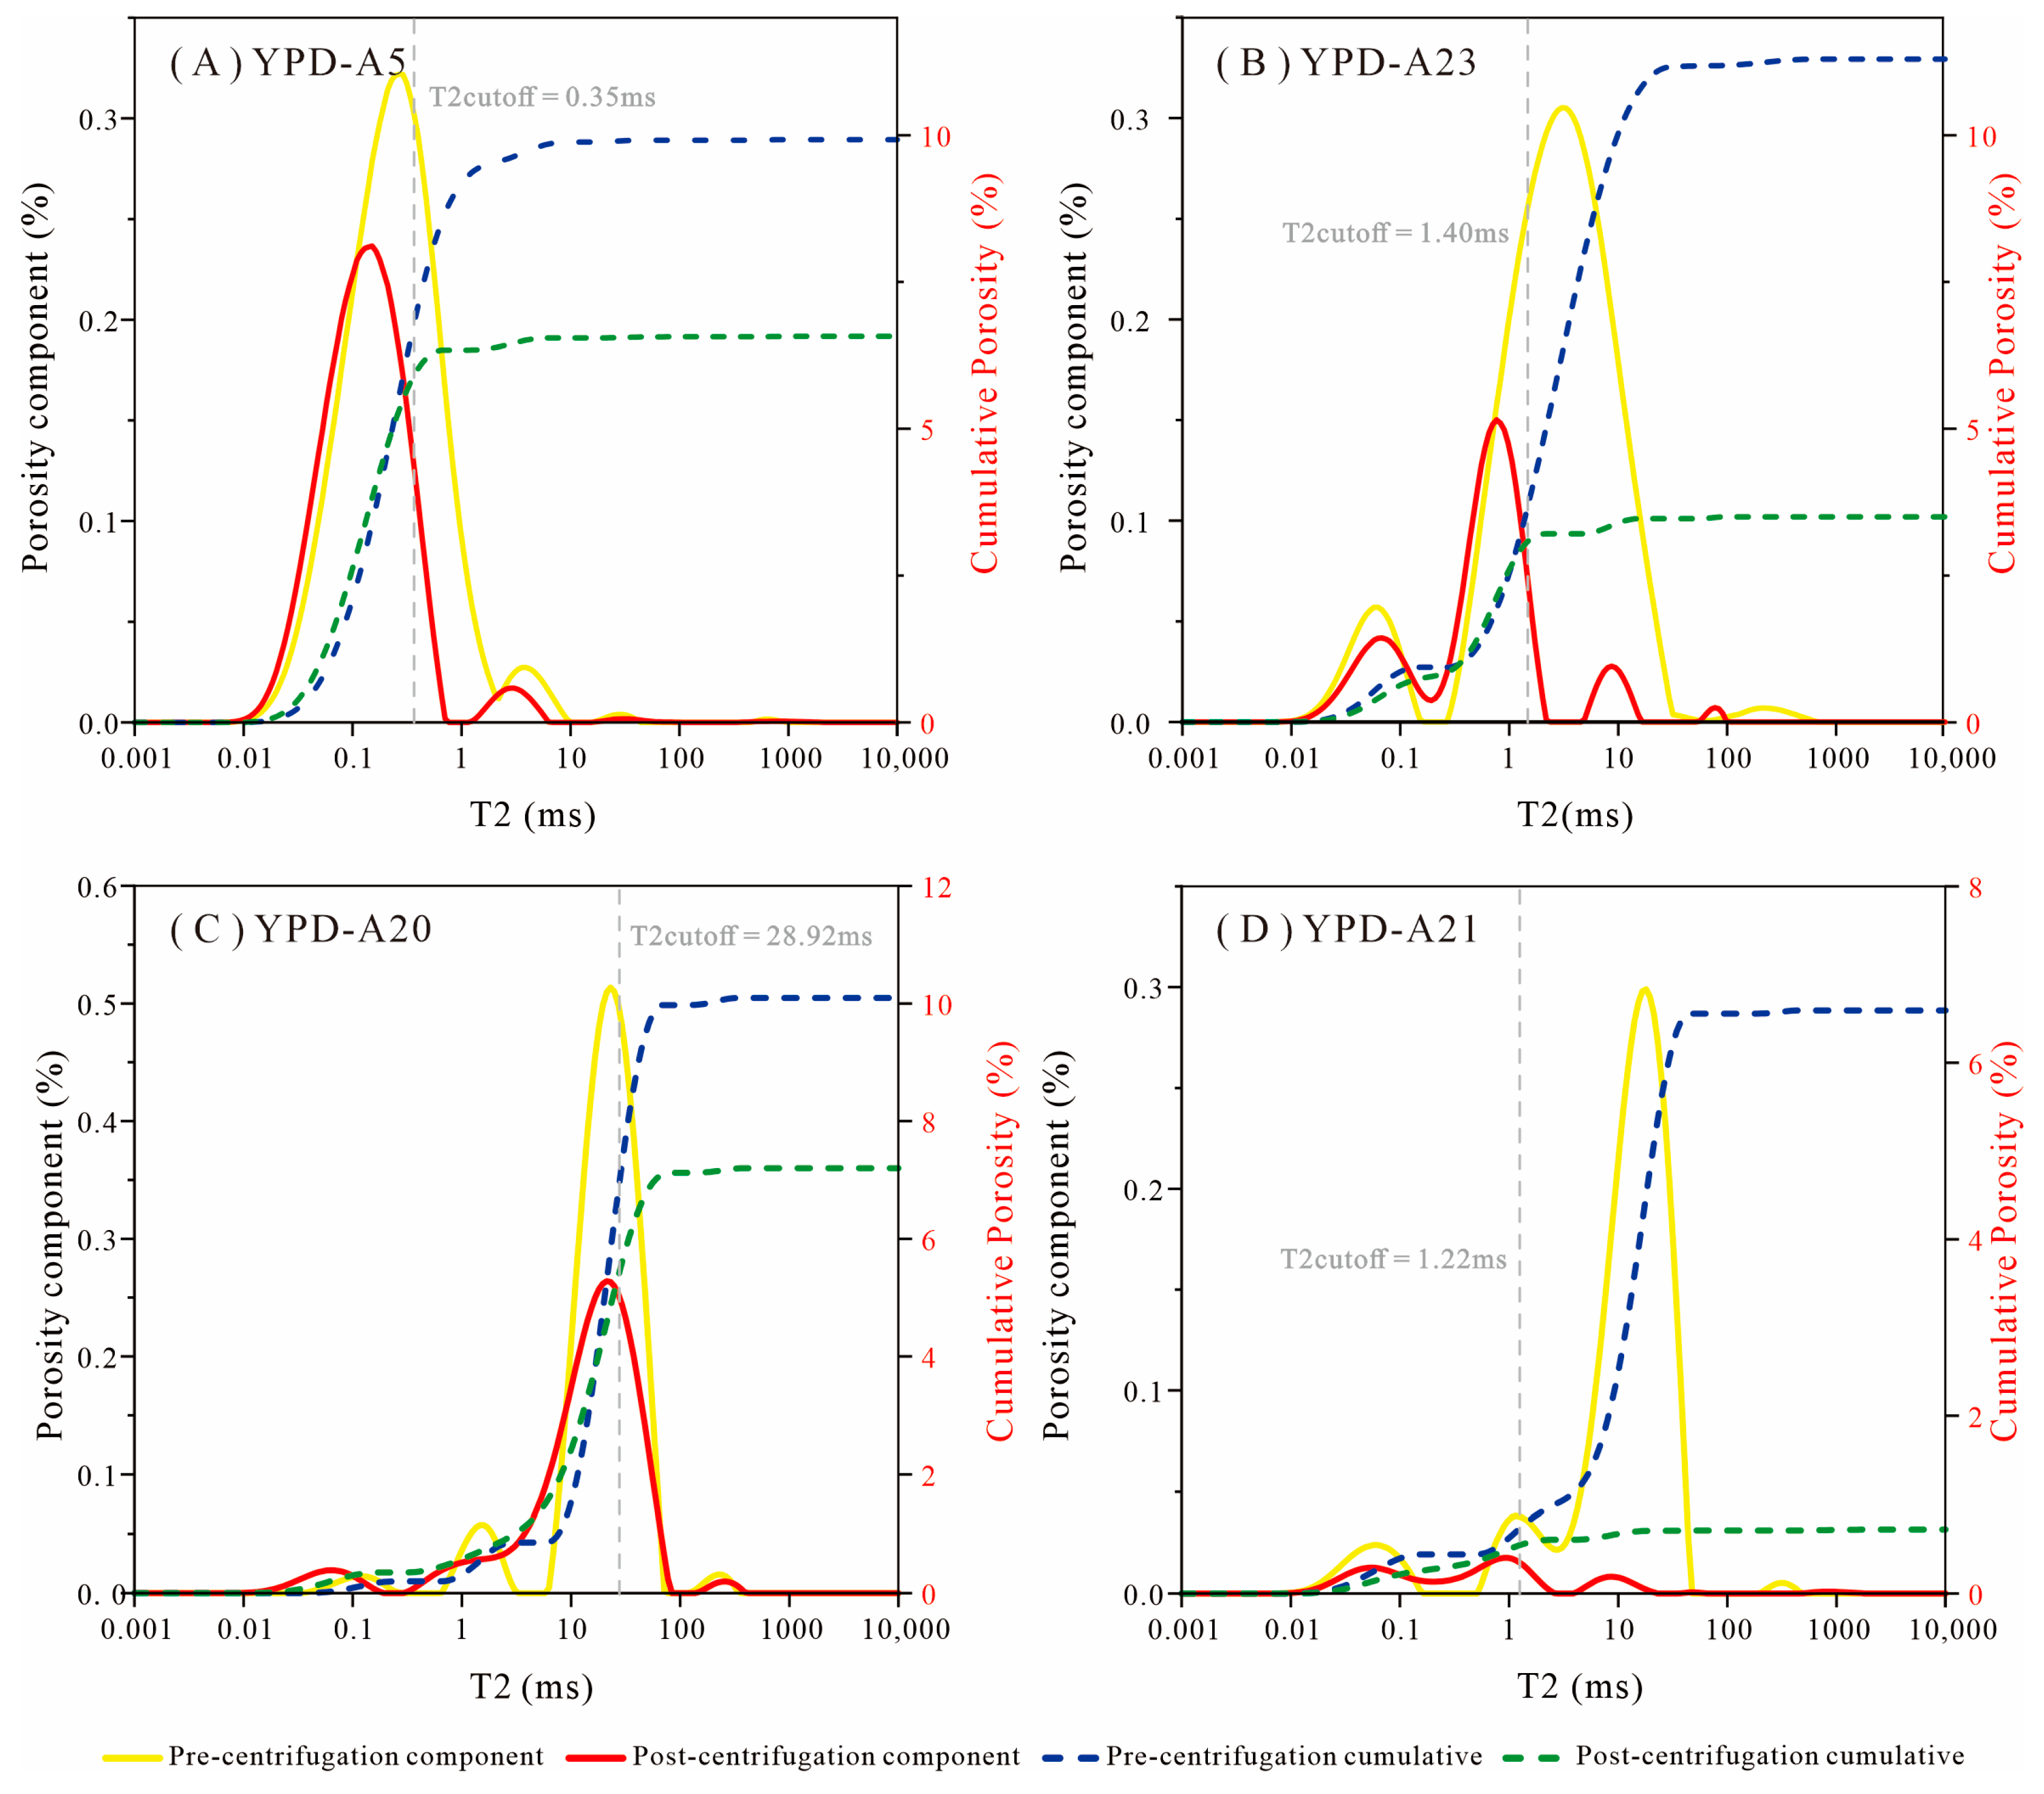
T2cutoff represents the boundary between bound and movable fluids and provides indirect information on pore–throat effectiveness and fluid retention behavior. In the Gufeng Formation, lower T2cutoff values generally indicate that the movable–bound fluid boundary occurs within the short relaxation domain, as observed in samples YPD-A2, A5, A42, and A48. In contrast, higher T2cutoff values indicate that bound fluids extend into longer relaxation domains, suggesting more complex pore structures, larger pore bodies with restricted throats, or poorer pore–throat matching, as seen in YPD-A19, A20, and A27.
Notably, high T2cutoff values do not necessarily indicate better reservoir quality. For example, sample YPD-A20 exhibits a very high T2cutoff (28.92 ms) but relatively low FFS (28.66%) and high BFS (71.34%). Similarly, sample YPD-A27 exhibits relatively high porosity, but also high BFS (83.82%) and low FFS (16.19%). These results indicate that although storage capacity is considerable, most fluids are retained within poorly connected or strongly restricted pore–throat systems. Therefore, high T2cutoff values in the Gufeng Formation more commonly reflect pore structure complexity and ineffective pore–throat architecture rather than improved reservoir quality.
BFS directly reflects fluids retained under irreducible conditions and thus serves as a key parameter for evaluating reservoir effectiveness. Samples with low BFS (e.g., YPD-A16, A21, and A42) generally exhibit high FFS and good NMR-derived permeability, indicating that a large proportion of pore space is hydraulically effective. In contrast, samples such as YPD-A9, A27, A37, and A49 show high BFS despite moderate or relatively high porosity, indicating predominantly immobile fluids.
Overall, T2cutoff and BFS provide more direct constraints on pore–throat effectiveness than porosity alone. Effective reservoirs require not only sufficient storage space, but also relatively low BFS and well-connected pore–throat systems that facilitate fluid flow.

4.4.2. Fluid Mobility Revealed by Saturated and Centrifuged T2 Spectra

The comparison between saturated and centrifuged T2 spectra provides direct evidence for fluid mobility and pore–throat effectiveness. In samples dominated by strongly bound micropore fluids, spectra changes after centrifugation are minimal, indicating that most fluids remain trapped within fine pores under strong capillary forces. This behavior is observed in samples YPD-A2, A5, A48, and A49, where short-T2 signals remain dominant after centrifugation.
In samples with more effective mesopore-scale storage and flow systems, intermediate-T2 components decrease significantly after centrifugation, while short-T2 peaks persist. This pattern indicates that movable fluids are mainly stored in intermediate pore–throat systems, whereas bound fluids characteristics are observed in samples YPD-A3, A23, A24, A33, A35, A41, and A42, which generally exhibit moderate to high FFS and relatively good NMR-derived permeability, reflecting well-developed and effective pore networks.
The fracture-enhanced samples show more pronounced spectral reduction, particularly in the intermediate-to-long T2 range, indicating that fluids stored in fractures or wider pore throats are readily removed during centrifugation. This behavior is most evident in samples YPD-A16 and YPD-A21, which represent fracture-enhanced composite reservoirs.
In contrast, some samples display distinct long-T2 components under saturated conditions but release limited fluids after centrifugation. In these cases, long-T2 enrichment does not indicate an effective pore system, but rather relatively large pore bodies that are poorly connected or linked by narrow throats. This pattern is represented by samples YPD-A20 and YPD-A27, demonstrating that long-T2 components alone cannot be used to define effective reservoirs.
Therefore, the comparison of saturated and centrifuged T2 spectra is essential for distinguishing micropore-bound reservoirs, mesopore-effective reservoirs, and fracture-enhanced reservoirs.

4.4.3. NMR-Defined Reservoir Response Types

Based on the integrated comparison of T2 spectral shape, T2cutoff, BFS, FFS, NMR-derived permeability, and centrifugation-induced spectral changes, the Gufeng Formation samples were divided into four NMR-defined reservoir response types. This classification is descriptive and comparative. It was not derived from statistical clustering or independently calibrated petrophysical thresholds. Therefore, the four types are used to summarize relative differences in pore-fluid occurrence, fluid retention, and fluid mobility among samples rather than to provide an absolute reservoir classification scheme.
The first type is the short-T2-dominated micropore-bound response type (Figure 5A), characterized by dominant peaks at <1 ms, minimal spectral change after centrifugation, high BFS, and low FFS. Representative samples include YPD-A2, A5, A45, A48, and A49. This response indicates that most fluids are retained in fine pores or poorly connected pore systems.
The second type is the intermediate-T2-dominated movable-fluid response type (Figure 5B), characterized by dominant peaks in the 1–10 ms range, significant reduction after centrifugation, relatively low BFS, high FFS, and good NMR-derived permeability. This response indicates a higher proportion of movable fluids and more effective pore–throat systems compared with the short-T2-dominated type. Representative samples include YPD-A23, A24, A30, A33, A35, A41, and A42. Sample YPD-A3 also shows high FFS and high NMR-derived permeability, but its unusually high permeability value suggests possible enhanced connectivity, bedding-parallel cracks, or model amplification; therefore, it is treated as a locally enhanced sample rather than a typical matrix-only reservoir.
The third type is the long-T2-enriched but low-efficiency response type (Figure 5C), characterized by enhanced 10–100 ms components but still exhibiting high BFS and low to moderate FFS. Representative samples include YPD-A20, A26, and A27. This response suggests that large pores or pore bodies may be present, but their connectivity or effective contribution to fluid mobility is limited.
The fourth type is the NMR-inferred enhanced-mobility composite response type, represented by YPD-A16 and YPD-A21 (Figure 5D). These samples show composite multi-peak T2 spectra, strong reduction in intermediate-to-long T2 components after centrifugation, low BFS, high FFS, and high NMR-derived permeability. These features suggest enhanced fluid mobility, but the high permeability values should be interpreted cautiously because they may reflect fracture-related NMR responses, bedding-parallel cracks, artificial sample damage, or Coates-model amplification rather than true shale matrix permeability.
Overall, the NMR response types show that reservoir heterogeneity in the Gufeng Formation is related to differences in pore-fluid occurrence, fluid retention, and fluid mobility. The classification itself is not used as independent proof of reservoir effectiveness. Instead, the geological interpretation of these NMR responses is further constrained by TOC, mineral composition, SEM pore-type observations, and Micro-CT-resolved micrometer-scale pore architecture.

4.4.4. Vertical Variation in NMR-Defined Reservoir Types

The vertical distribution of NMR-defined reservoir types exhibits distinct zonation throughout the YPD-A2–A49 succession (Figure 2). The lower interval (YPD-A2–A17) contains all four reservoir types and therefore represents the most heterogeneous part of the succession. Micropore-bound samples such as YPD-A2 and YPD-A5, coexist with matrix-effective reservoirs such as YPD-A3 and fracture-enhanced reservoirs such as YPD-A16, indicating pronounced short-range heterogeneity in pore systems and reservoir quality.
The middle interval (YPD-A19–A30) is characterized predominantly by a low-efficiency reservoir background. Compact, low-porosity samples and long-T2-enriched but ineffective reservoirs become increasingly common, whereas favorable intervals occur only sporadically. Samples YPD-A21 and YPD-A23–A24 record local reservoir quality, but overall reservoir continuity remains poor. This interval therefore constitutes the main low-efficiency transitional segment of the Gufeng Formation.
The upper interval (YPD-A32–A49) contains the most concentrated development of intermediate-T2-dominated effective reservoirs, particularly between YPD-A33 and YPD-A42, which define the principal high-quality reservoir zone. However, the uppermost part of the section, represented by YPD-A48 and YPD-A49, shift back to short-T2-dominated micropore-bound reservoirs. This pattern indicates that although the TOC remains high in the uppermost interval, the pore system is still dominated by bound micropores, resulting in markedly reduced fluid mobility.
Accordingly, the NMR reservoir of the Gufeng Formation can be divided into four vertical intervals: a lower heterogeneous mixed interval, a middle low-efficiency transitional interval, an upper high-quality reservoir concentration interval, and an uppermost micropore-bound interval.

4.5. SEM Analysis of Pore Types and Microfractures

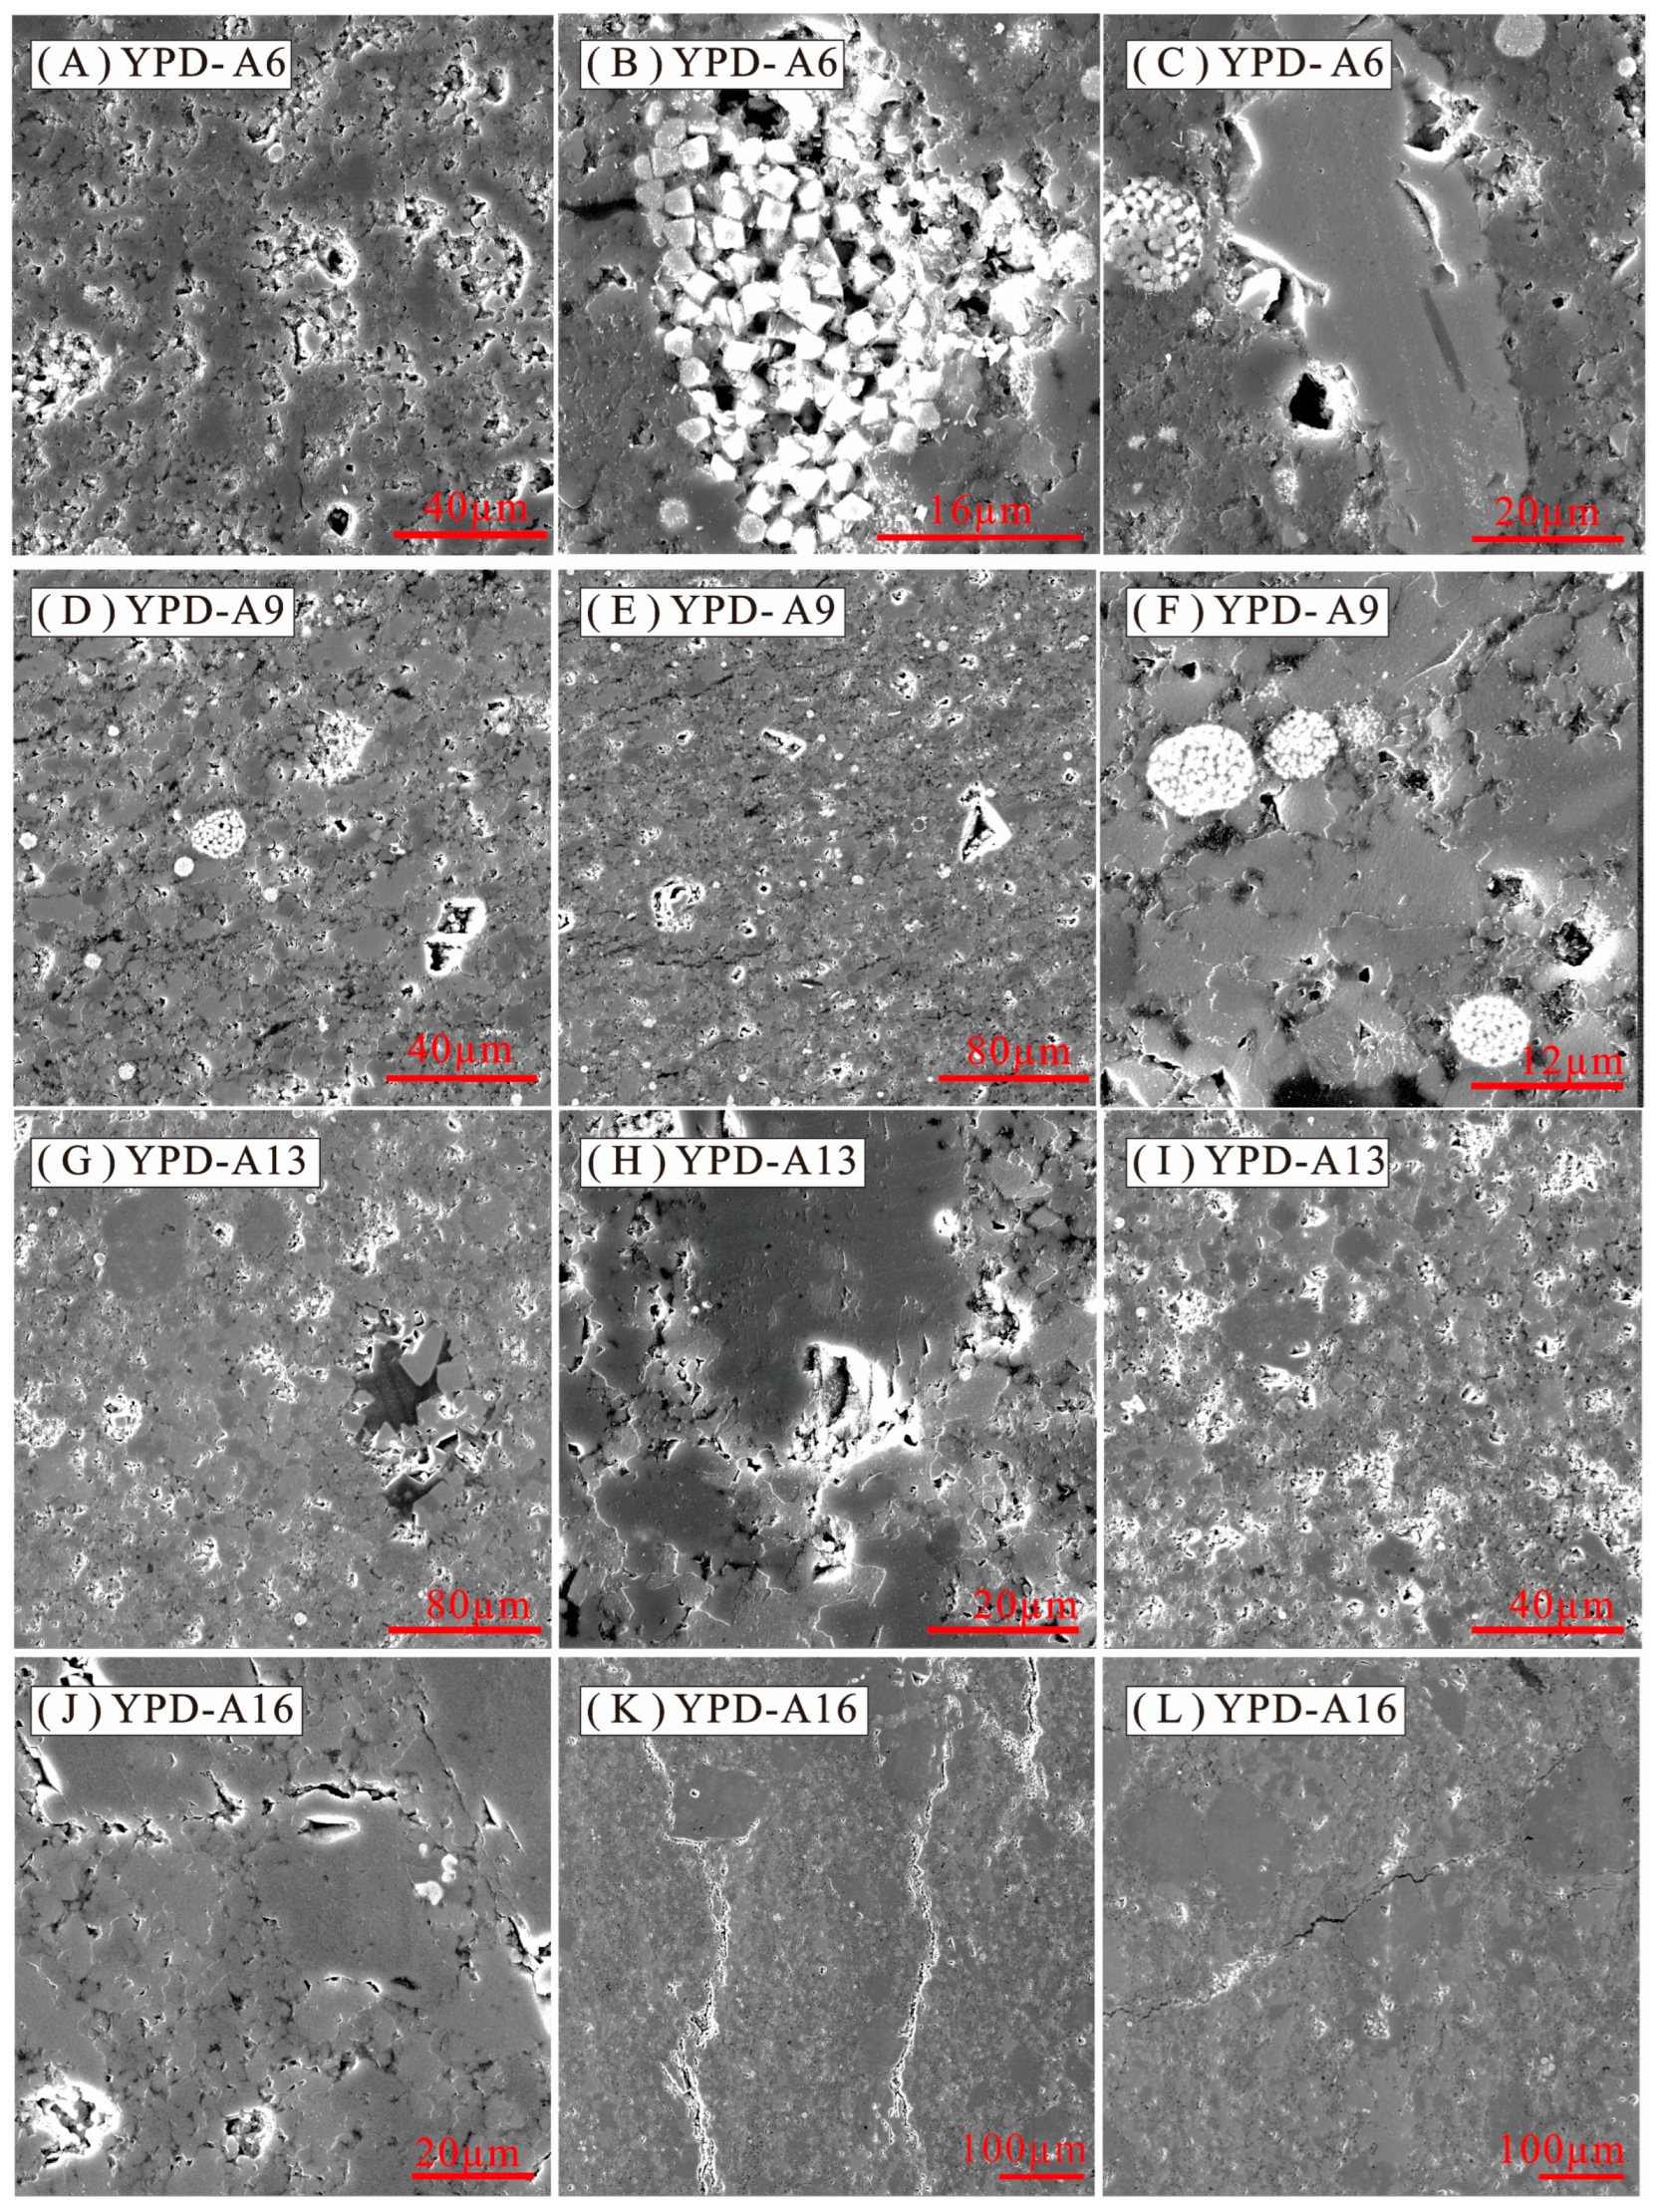
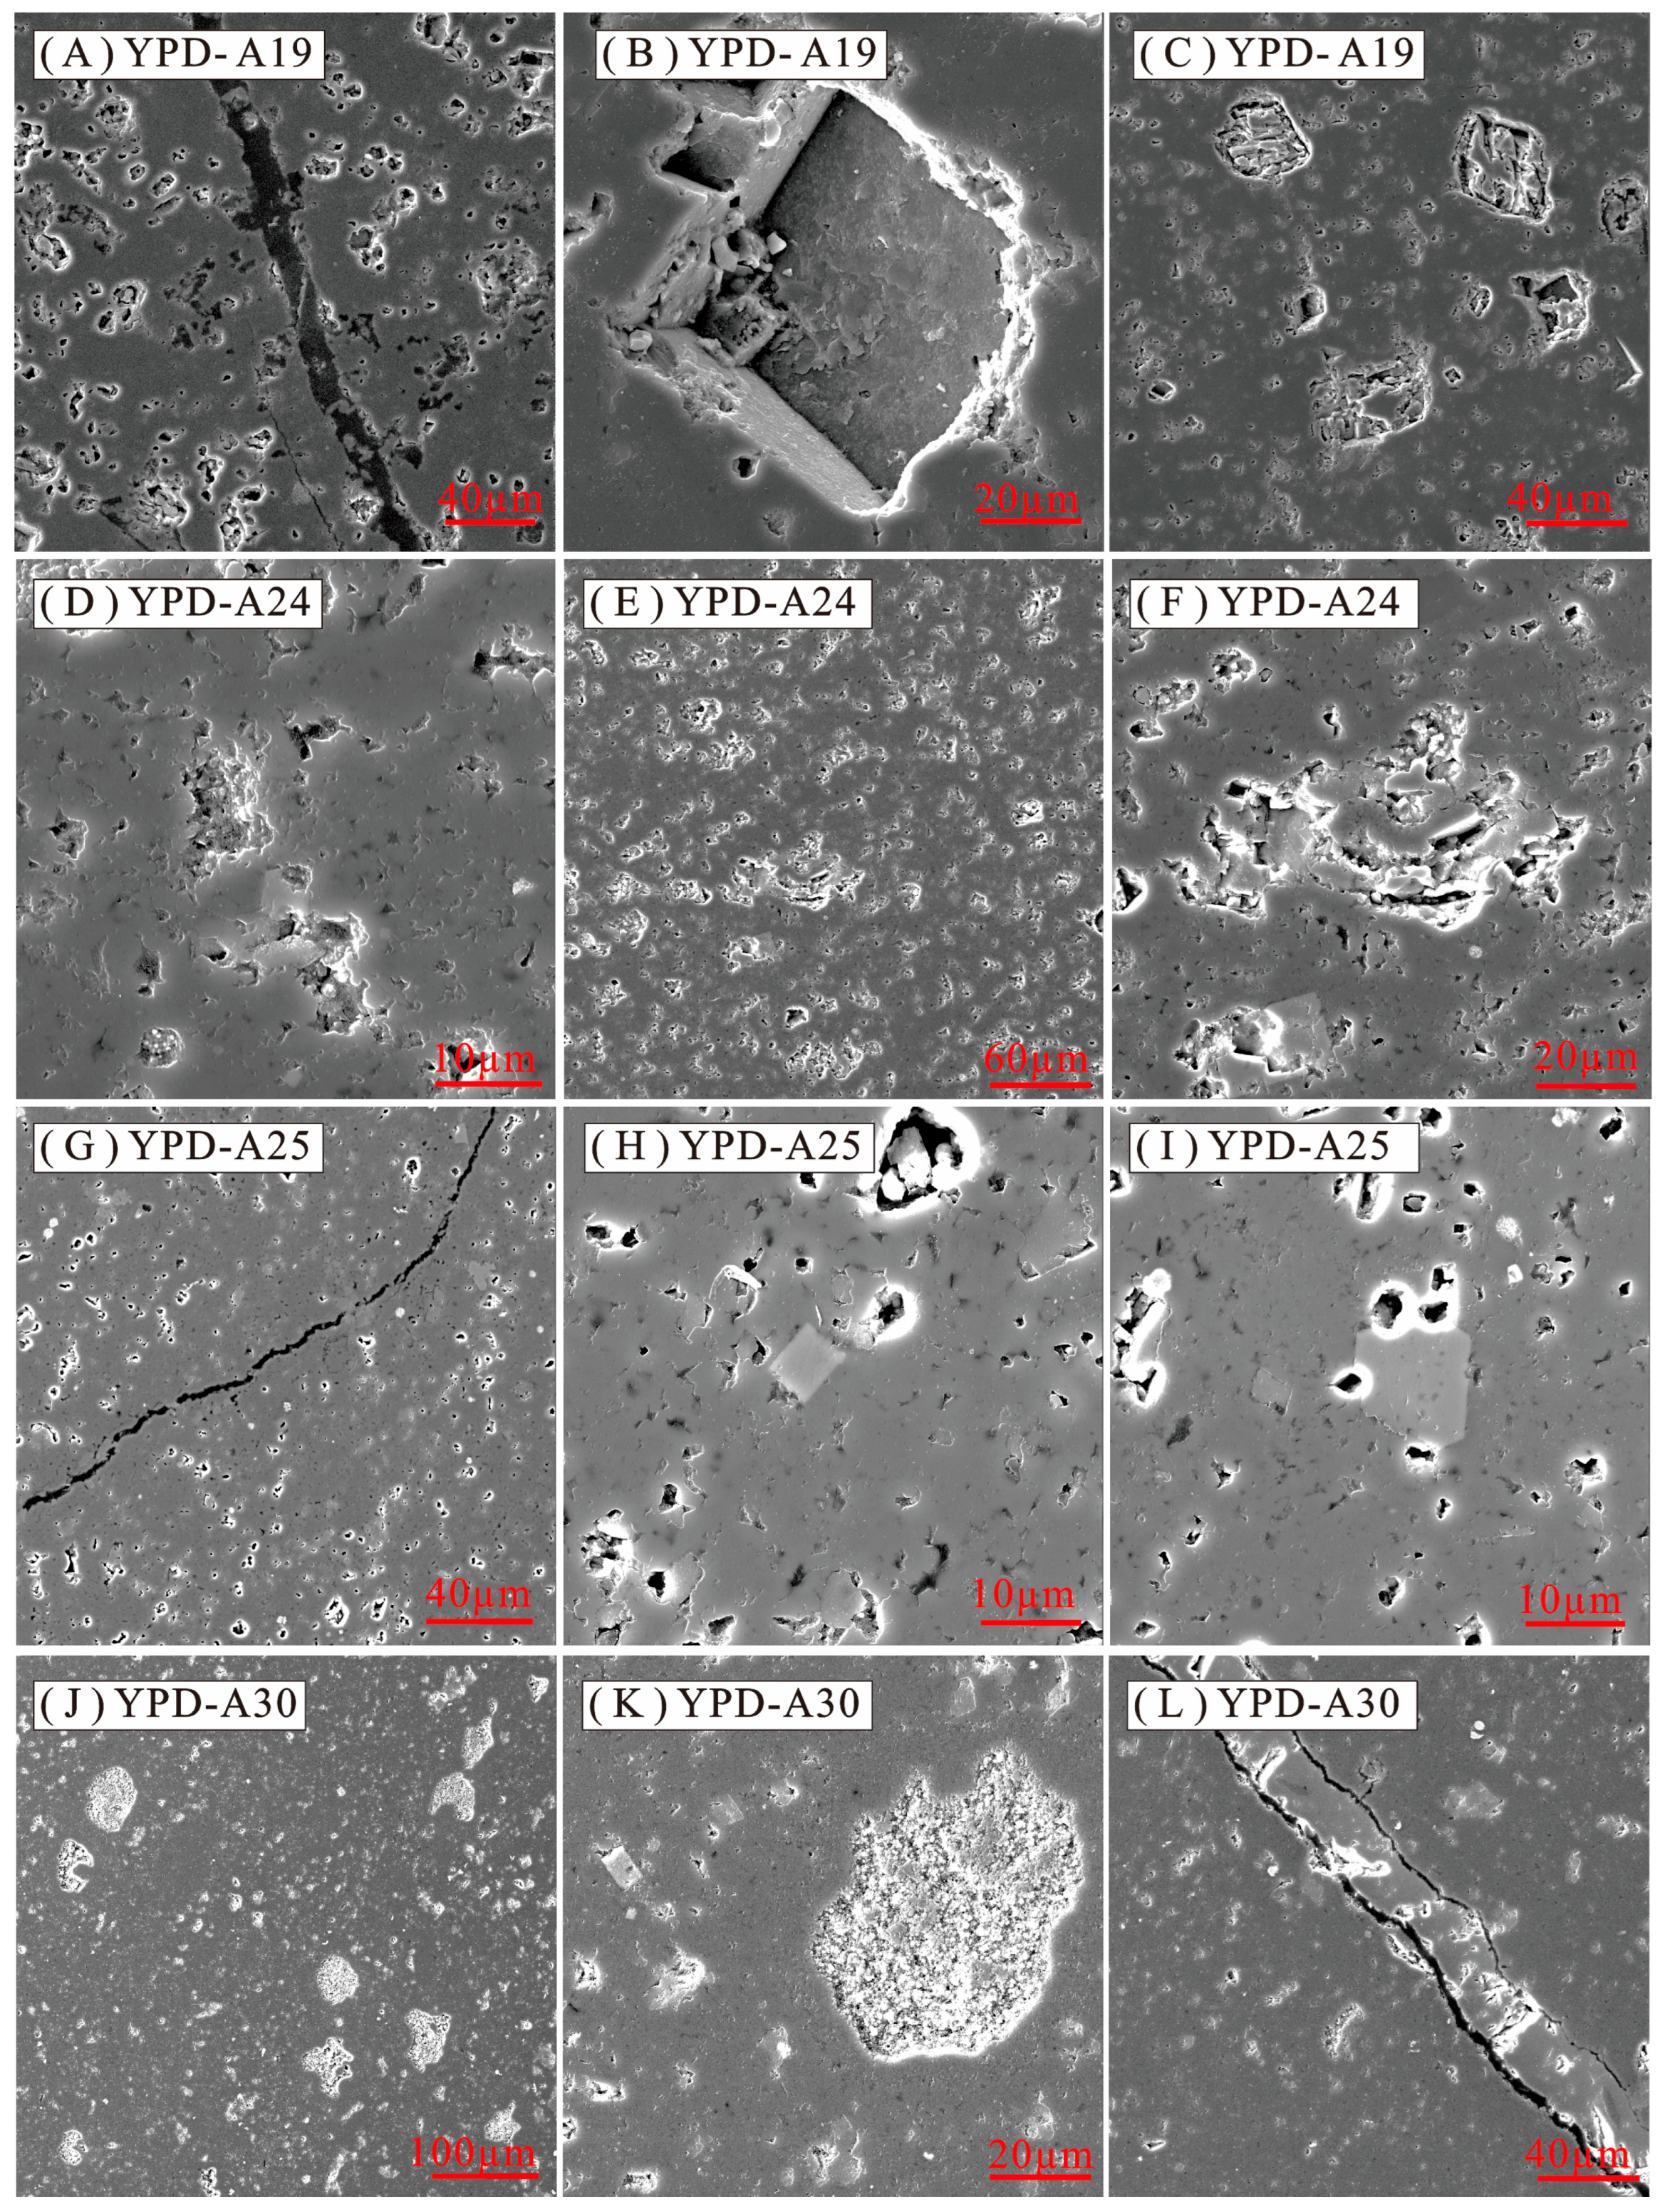
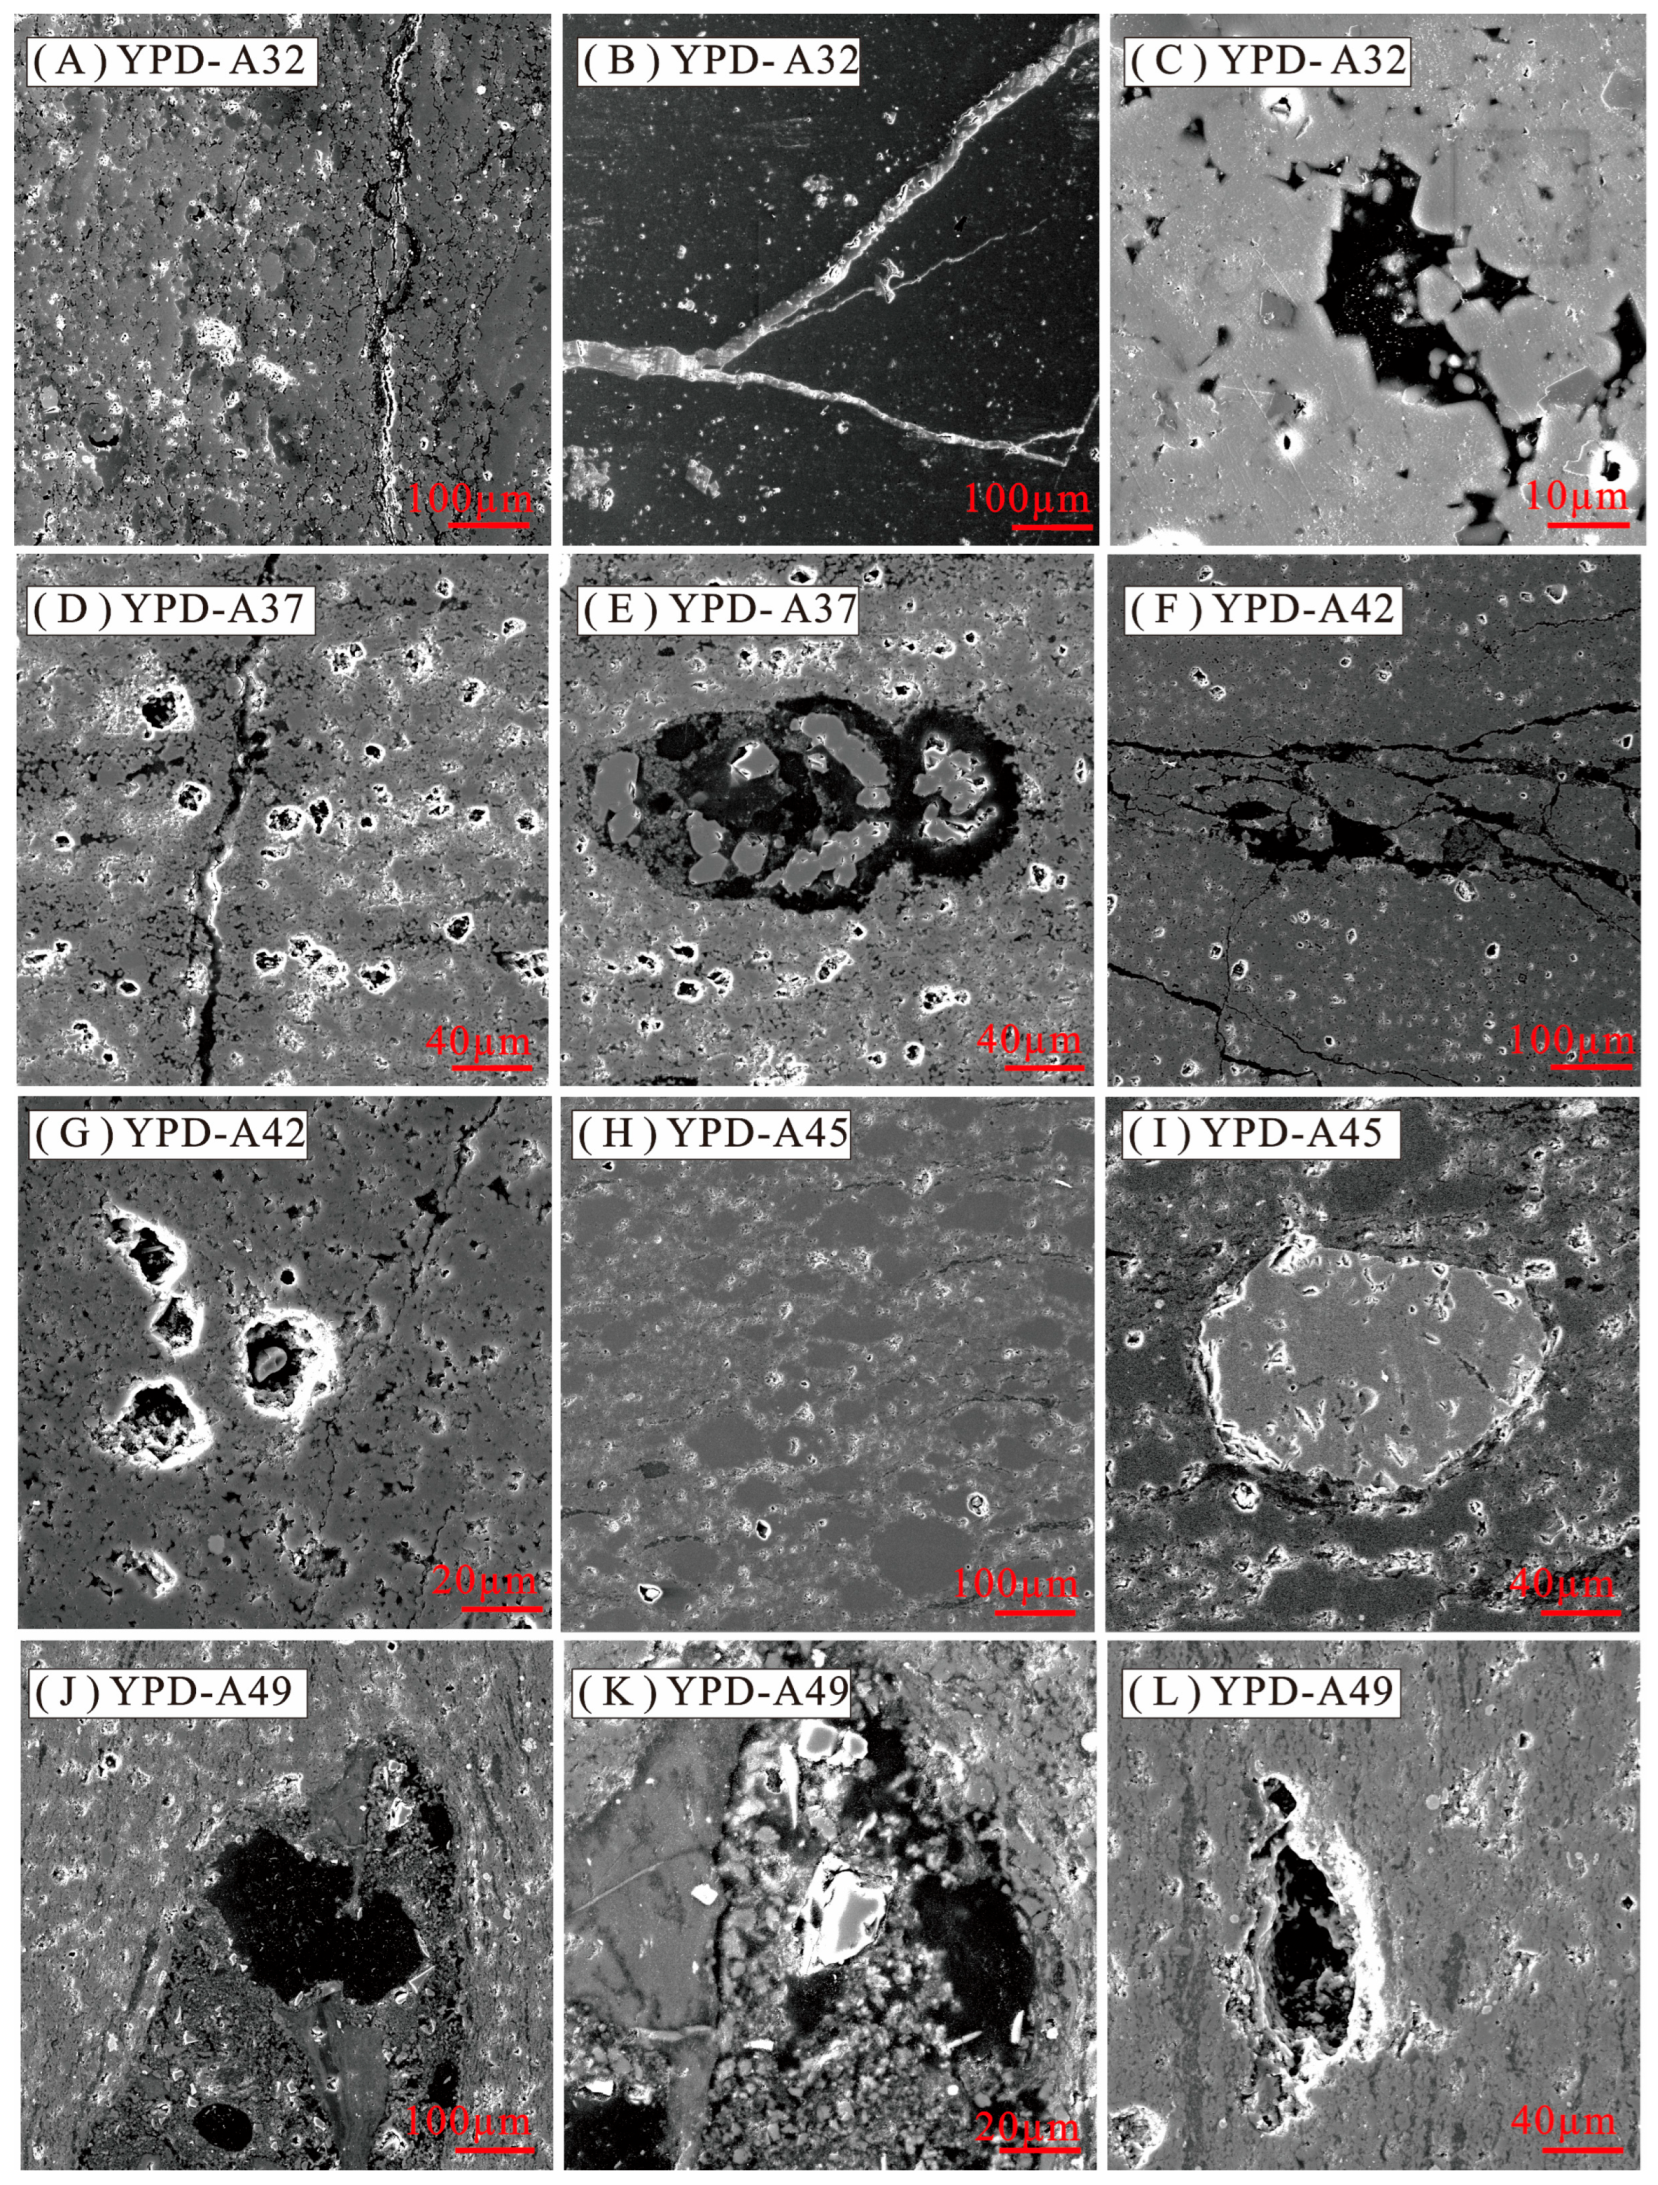
SEM observations reveal that the Gufeng Formation shales contain diverse pore types, including mineral dissolution pores, interparticle pores, mineral-edge pores, intercrystalline pores within pyrite-like aggregates, organic-matter-related pores, organic matter–mineral boundary pores, and local microfracture-like pores (Figure 6, Figure 7 and Figure 8). These pore types are heterogeneously distributed among different samples and provide microscopic evidence for the complex pore-fluid responses revealed by NMR.
Mineral-related pores are widely developed in the studied samples. Irregular mineral dissolution pores are common in YPD-A6, A9, A13, A19, YPD-A24, A25, A42, A45, and A49. These pores are generally irregular, embayed, or moldic in shape, and some contain residual mineral fragments or rough pore walls, indicating the partial dissolution or detachment of unstable mineral grains. Typical large mineral dissolution pores occur in YPD-A19 (Figure 7B), YPD-A42 (Figure 8G), YPD-A45 (Figure 8I), and YPD-A49 (Figure 8L). Smaller dissolution pores and mineral-edge pores are widely distributed in the fine-grained matrix, such as those in YPD-A6 (Figure 6A), YPD-A9 (Figure 6D,E), YPD-A13 (Figure 6G–I), YPD-A24 (Figure 7D–F), and YPD-A25 (Figure 7H,I). These pores provide local storage space, but many of them are isolated or discontinuous at the SEM scale.
Pyrite-like aggregates and related intercrystalline pores are also locally observed. Euhedral to subhedral pyrite-like crystal aggregates occur in YPD-A6 (Figure 6B), whereas framboidal pyrite-like aggregates are visible in YPD-A6, YPD-A9, YPD-A19, YPD-A30, and YPD-A49 (Figure 6C,F, Figure 7C,K and Figure 8K). Intercrystalline pores are developed between pyrite microcrystals or crystal aggregates. These pores contribute to local pore space, but they are mostly confined within pyrite aggregates and their contribution to effective connectivity is limited unless connected to surrounding mineral pores or microfractures.
Organic-matter-related pores and organic matter–mineral boundary pores are locally developed. In YPD-A37, dark organic-matter-rich patches containing embedded mineral grains are observed, and pores occur along organic matter–mineral contacts (Figure 8E). Similar organic matter–mineral aggregates or organic-rich patches are also observed in YPD-A30 and YPD-A49 (Figure 7K and Figure 8J,K). These observations indicate that organic matter can contribute to storage space development. However, most organic-matter-related pores are small and locally distributed, and their contribution to effective reservoir quality depends on their connection with adjacent mineral-related pores or microfractures.
Microfracture-like pores and bedding-related cracks are locally developed in several samples. In YPD-A16, narrow microfractures occur along weak surfaces and mineral–matrix boundaries (Figure 6J–L). Similar microfracture-like pores are observed in YPD-A19 (Figure 7A), YPD-A25 (Figure 7G), YPD-A30 (Figure 7L), YPD-A32 (Figure 8A,B), YPD-A37 (Figure 8D), and YPD-A42 (Figure 8F). These cracks are narrow and elongated and locally extend along laminae, mineral boundaries, or mechanically weak surfaces. In some fields of view, microfractures are surrounded by mineral dissolution pores and mineral-edge pores, suggesting that they may connect otherwise isolated pores and provide preferential pathways for local fluid migration. Nevertheless, because possible preparation-induced cracks cannot be completely excluded, these features are interpreted as supplementary microscopic evidence for local enhanced connectivity rather than proof of a continuous fracture network throughout the formation.
Overall, SEM observations show that both organic-matter-related pores and inorganic-mineral-related pores contribute to storage space development in the Gufeng Formation shales. Mineral dissolution pores and mineral-edge pores are common, pyrite intercrystalline pores are locally developed, and microfractures may locally improve pore connectivity. However, most pores are small, heterogeneous, and locally distributed. Therefore, reservoir effectiveness depends not only on pore abundance but also on whether these pores are connected through microfractures or effective pore–throat systems.

4.6. Micro-CT Characterization of Representative Samples

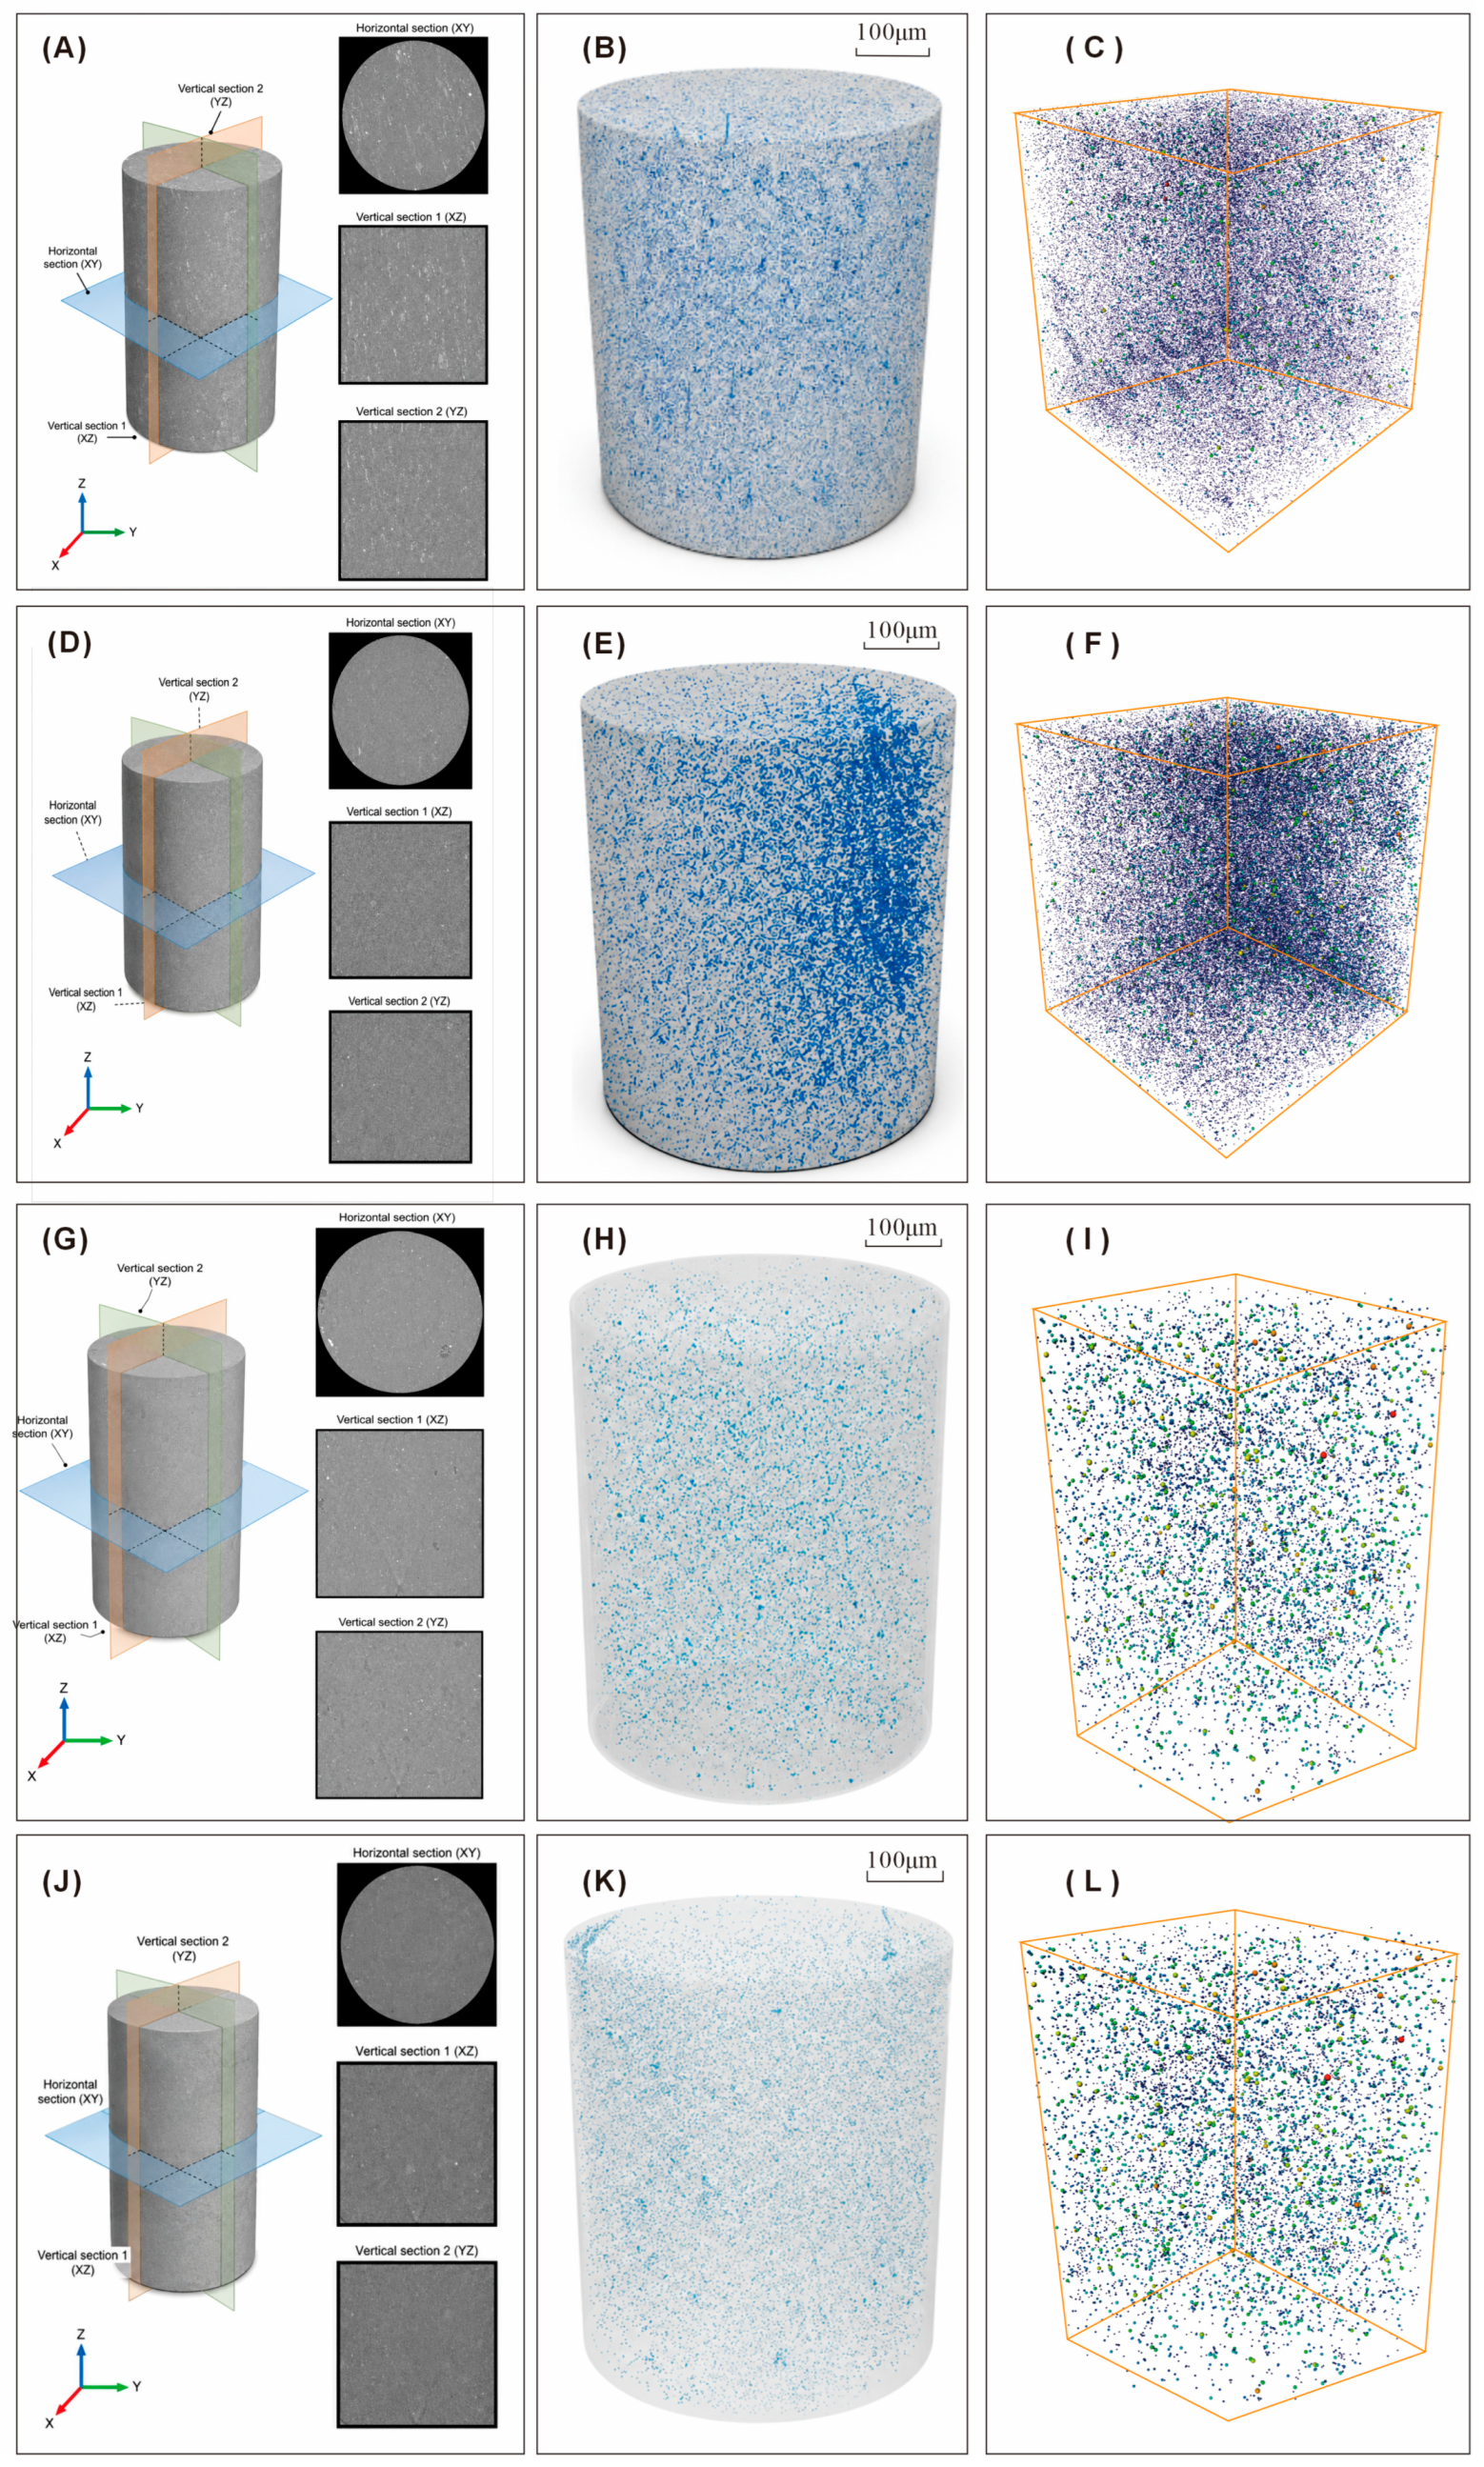
Micro-CT analyses of representative samples YPD-A6, A24, A30, and A49 provide direct three-dimensional evidence for the micrometer-scale pore architecture of the Gufeng Formation shales (Table 3, Figure 9, Figure 10, Figure 11 and Figure 12).
A6 exhibits a fine-grained and poorly connected micrometer-scale pore system (Figure 9A–C). The pore radius ranges from 1.08 to 6.84 μm, and pores smaller than 1.5 μm account for 89.75% of the total pore population. The average pore radius, average pore volume, and average specific surface area are 1.21 μm3, 10.42 μm3, and 15.29 μm2, respectively. Although 52 throats were identified, the average throat radius, average throat length, and average coordination number are all effectively zero, indicating that these throats do not constitute a meaningful connected network. Accordingly, YPD-A6 is characterized by fine isolated pores and extremely limited effective connectivity.
Sample YPD-A24 shows a micrometer-scale pore system broadly similar to that of YPD-A6, but with slightly better development of pore bodies (Figure 9D–F). The pore radius ranges from 1.02 to 5.57 μm, and pores smaller than 1.5 μm account for 87.37% of the total pore population. The average pore radius is 1.23 μm, the average pore volume is 11.01 μm3, and the average specific surface area is 16.78 μm2. However, both throat number and average coordination number are zero, indicating that the pore system remains dominated by isolated pores with no effective throat connections. Thus, although YPD-A24 contains abundant small pores, micrometer-scale connectivity remains poor.
Sample YPD-A30 represents the finest and most homogeneous micrometer-scale pore system among the four CT-analyzed samples (Figure 9G–I). The pore radius ranges from 1.03 to 4.09 μm, and pores smaller than 1.5 μm account for 95.17% of the total pore population, indicating a strong dominance of fine pores. The average pore radius is only 1.11 μm, whereas the average pore volume and average specific surface area are 6.58 μm3 and 11.29 μm2, respectively—all lower than those of YPD-A6 and YPD-A24. No throats were identified, and the average coordination number is zero. These results indicate that YPD-A30 contains the smallest, most homogeneous, and most poorly connected micrometer-scale pore system among the examined samples.
Sample YPD-A49 differs from the other samples in having relatively larger and more widely distributed micrometer-scale pore bodies, although connectivity remains poor (Figure 9J–L). The pore radius ranges from 1.08 to 3.79 μm, and pores smaller than 1.5 μm account for 59.48% of the total pore population, markedly lower than in YPD-A6, A24, and A30. The proportions of pores in the 1.5–2.0 μm and 2.0–2.5 μm ranges reach 26.58% and 10.08%, respectively, indicating a broader pore-size distribution. The average pore radius, average pore volume, and average specific surface area are 1.48 μm, 18.21 μm3, and 25.99 μm2, respectively, all of which are the highest among the four samples. However, no effective throats were identified, and the average coordination number remains zero. Therefore, YPD-A49 demonstrates that relatively large micrometer-scale pore bodies do not necessarily correspond to effective reservoirs when throat connectivity is absent.
Taken together, the CT results show that the micrometer-scale pores in all four representative samples are dominated by isolated pore bodies and lack effectively connected throats. Internal differences among the samples are also evident: YPD-A30 contains the finest and most homogeneous pore system, YPD-A6 and YPD-A24 are intermediate and broadly comparable, and YPD-A49 contains relatively larger pore bodies, greater pore volumes, and a higher specific surface area. Despite these differences in pore-size distribution and pore abundance, all four samples share a common characteristic: poor pore connectivity and the dominance of isolated pores. The three-dimensional connectivity analysis further shows that the pore systems are composed mainly of isolated pore bodies, with no effective connected pore–throat networks. This interpretation is consistent with the pore–throat structural parameters, because the average throat radius, average throat length, and average coordination number are essentially zero in all four samples, whereas throat numbers are absent or extremely limited. These features indicate that the CT-resolved pore systems are dominated by isolated storage space rather than and effective flow pathway.
However, differences in micrometer-scale pore abundance and pore size do not necessarily translate into improved reservoir effectiveness. The key factor controlling effective reservoir quality is not simply pore size or pore abundance at the micrometer scale, but whether these pore bodies are linked by an effective pore–throat network.

5. Discussion

5.1. Integrated Controls on Reservoir Heterogeneity

Reservoir heterogeneity in the Gufeng Formation is governed by the coupled effects of organic matter abundance, mineralogical framework, pore–throat connectivity, and local fracture development. The results show that the studied samples exhibit substantial variations in TOC, mineral composition, NMR-derived pore-fluid parameters, and CT-resolved pore architecture. These differences indicate that reservoir quality cannot be adequately explained by any single factor alone, such as TOC, porosity, or lithofacies. Rather, effective reservoir development depends on the combined favorability of pore generation, pore preservation, and pore–throat connectivity.

5.1.1. TOC Control on Pore Generation and Reservoir Differentiation

TOC provides the fundamental material basis for pore generation in the Gufeng Formation. The TOC content ranges from 1.60% to 21.38%, indicating pronounced heterogeneity in organic matter enrichment. Organic-matter-hosted pores are widely recognized as an important pore type in organic-rich marine shales, particularly in thermally mature to overmature systems, where hydrocarbon generation and expulsion promote the development of abundant micro- to nano-scale pores within organic matter [5,7,52]. In the studied samples, a relatively high TOC content generally corresponds to higher NMR porosity, suggesting that organic matter enrichment contributes substantially to the development of storage space [7,53].
The SEM observations provide direct microscopic evidence for the occurrence of organic-matter-related pores and organic matter–mineral boundary pores in the Gufeng Formation shales. These pores are locally developed within organic-rich patches and organic matter–mineral aggregates, such as those observed in YPD-A30, YPD-A37, and YPD-A49 (Figure 7K and Figure 8E,J,K). These observations support the interpretation that organic matter can contribute to storage space development. However, the SEM images also show that many organic-matter-related pores are small, locally distributed, and commonly associated with mineral particles or mineral-related pores. Therefore, high TOC content should be regarded as an indicator of organic matter abundance and pore generation potential rather than direct evidence for abundant effective organic-hosted pores.
However, TOC does not directly determine reservoir effectiveness, as clearly illustrated by the contrasting behavior of TOC-rich samples. Samples such as A33, A35, and A41 are characterized by intermediate-T2-dominated spectra, relatively low BFS, relatively high FFS, and better NMR-derived permeability. These features indicate that organic-matter-related pores are connected to relatively effective pore–throat systems. In contrast, YPD-A37, YPD-A48, and YPD-A49 are also enriched in TOC, but their spectra are dominated by short-T2 components and are associated with high BFS, low FFS, and low NMR-derived permeability. Although these samples contain abundant storage space, most fluids are retained within strongly bound or poorly connected micropores. SEM images of YPD-A49 further show organic-matter-related or organic matter–mineral aggregate pores and large mineral-related pores (Figure 8J–L), but these pores do not necessarily form effective connected pore–throat systems.
Therefore, TOC mainly controls the potential for pore space generation, whereas reservoir effectiveness depends on whether this storage space can be transformed into connected and movable pore systems. High TOC is a necessary but insufficient condition for the development of high-quality reservoirs in the Gufeng Formation. The decisive factor is whether organic-matter-related pores are incorporated into an effective pore–throat network together with mineral-related pores, dissolution pores, and local microfractures.

5.1.2. Mineralogical Framework Regulates Pore Preservation and Fluid Mobility

Mineralogical composition further governs reservoir heterogeneity by influencing resistance to compaction, pore preservation, pore–throat development, and fracture susceptibility. In the upper section, the Gufeng Formation transitions from a mixed siliceous–carbonate system to a predominantly siliceous shale system, which provides the lithological framework for the vertical variation in reservoir quality [5,49,54].
Siliceous-rich samples generally show relatively favorable reservoir responses in the studied dataset. Samples such as YPD-A3, YPD-A23, YPD-A24, YPD-A33, YPD-A35, YPD-A41, and YPD-A42 are characterized by intermediate-T2 components, relatively low BFS, high FFS, and relatively favorable NMR-derived permeability. These observations suggest that the XRD-defined siliceous–feldspathic mineral group may be associated with better pore preservation and more effective pore-fluid mobility in some samples. In addition, the relatively high brittleness of siliceous lithofacies may favor microfracture development and help preserve pore–throat connectivity [5,49,55]. However, in this study the term “siliceous minerals” refers to an XRD-defined group composed of quartz, albite, and orthoclase, not a single genetic or mechanical category. Pyrite was treated as an independent component and excluded from this group. Because no quartz type analysis, SEM-EDS, cathodoluminescence, thin-section petrography, or Al–Fe–Mn–Ti proxy analysis was performed, we cannot distinguish biogenic silica, detrital quartz, authigenic quartz, or feldspar contributions. Therefore, the role of siliceous minerals is only discussed here as a mineralogical association with reservoir response rather than as direct evidence for a specific silica source or diagenetic mechanism. A relatively high quartz–feldspar content may contribute to a more rigid mineral framework, which can help improve compaction resistance and favor pore preservation. Nevertheless, different silica sources may have distinct implications for brittleness, diagenesis, and pore preservation, so siliceous–feldspathic enrichment should not be interpreted as a unique genetic controller of high-quality reservoir development.
By contrast, carbonate-bearing lithofacies generally exhibit weaker matrix reservoir effectiveness. Several carbonate-rich or carbonate-bearing samples, such as YPD-A10, YPD-A12, YPD-A17, YPD-A25, and YPD-A32, are characterized by relatively low NMR porosity, low NMR-derived permeability, high BFS, or limited FFS, indicating restricted matrix reservoir effectiveness. The XRD results show that carbonate minerals, calculated as calcite plus dolomite, vary strongly among samples and provide a quantitative basis for evaluating the relationship between carbonate abundance and reservoir response. Carbonate cementation and recrystallization can reduce primary pore space and constrict pore throats, thereby decreasing matrix NMR-derived permeability and fluid mobility in fine-grained reservoirs [5,54]. SEM observations provide additional microscopic evidence for mineral-related pores and local microfracture-like pores in carbonate-bearing or mixed lithofacies. For example, mineral dissolution pores, mineral-edge pores, and microfracture-like pores are observed in several samples, including YPD-A16, YPD-A24, YPD-A25, YPD-A32, YPD-A37, and YPD-A42. These features indicate that mineral-related pore development and local microfracturing may contribute to local pore space development and fluid mobility. Nevertheless, because the SEM observations are based on secondary electron images without EDS confirmation, these pores are described as mineral-related pores rather than specifically carbonate-hosted pores.
Samples YPD-A16 and YPD-A21 represent exceptions to the generally weaker matrix-effective behavior of carbonate-bearing or mixed lithofacies. These samples exhibit composite multi-peak T2 spectra, marked post-centrifugation reductions in intermediate- to long-T2 components, low BFS, high FFS, and high NMR-derived permeability. These features suggest enhanced fluid mobility. However, because direct petrographic, SEM-EDS, cathodoluminescence, or Micro-CT evidence for fracture development is unavailable for these two samples, they are interpreted as NMR-inferred enhanced-mobility composite responses rather than confirmed fracture-enhanced reservoirs. Possible explanations include bedding-parallel cracks, local microfractures, relatively wide pore–throat systems, sample-scale heterogeneity, or Coates-model amplification.
Clay minerals vary over a relatively narrow range and do not appear to exert a first-order control on porosity or NMR-derived permeability at the formation scale. Instead, their influence is expressed mainly through fluid retention. In samples dominated by short-T2 signals, clay minerals may increase surface-bound and capillary-bound fluids, thereby elevating BFS and reducing reservoir effectiveness. Low-field NMR studies have shown that clay-bound water and capillary-bound water commonly occur within short-T components, and that clay type and clay-bound water content can influence T2cutoff and bound-fluid evaluation in shales [47,56]. Accordingly, the role of clay minerals in the Gufeng Formation is secondary and mainly regulatory.

5.1.3. Pore–Throat Connectivity Is the Key Link Between Storage Space and Reservoir Effectiveness

NMR and CT analyses collectively indicate that pore volume alone cannot define reservoir quality. NMR-derived porosity ranges from 2.20% to 18.77%, yet several samples with moderate to high porosity exhibit low NMR-derived permeability and low FFS. This suggests that the distinction between effective and ineffective reservoirs is not solely determined by pore abundance, but also by pore–throat scale, bound-fluid fraction, and connectivity. Pore connectivity has also been evaluated in shale reservoirs using spontaneous imbibition methods, and recent work has shown that data-treatment approaches and the presence of original or induced cracks can significantly influence connectivity interpretation [57].
The results from the T2cutoff and BFS measurements support this interpretation. High T2cutoff values do not necessarily correspond to superior reservoir quality. For instance, sample YPD-A20 exhibits a very high T2cutoff but low FFS and high BFS, whereas sample YPD-A27 has relatively high porosity but extremely high BFS and low FFS. These samples contain substantial stored fluids, yet the majority are confined within poorly connected or strongly restricted pore–throat networks. Consequently, elevated T2cutoff values in the Gufeng Formation more often reflect pore structure complexity and ineffective pore–throat architecture rather than actual improvements in reservoir quality.
CT imaging provides direct three-dimensional evidence for this interpretation. Samples YPD-A6, A24, A30, and A49 are dominated by isolated micrometer-scale pore bodies and lack effectively connected throats. Sample YPD-A49 is particularly noteworthy because it exhibits the largest average pore radius, pore volume, and specific surface area among the CT-analyzed samples, yet its pore–throat connectivity remains limited. This explains why YPD-A49 is classified as a low-efficiency reservoir by NMR despite its relatively large micrometer-scale pore. In contrast, Sample YPD-A24 demonstrates higher NMR-defined reservoir effectiveness than would be anticipated from its CT-resolved pore system, suggesting that its performance may be controlled by submicron pore–throat networks below the CT resolution.
These observations demonstrate that reservoir effectiveness in the Gufeng Formation is primarily controlled by effective pore–throat connectivity rather than pore abundance or size alone. Some samples are storage-rich but connection-poor, whereas others achieve enhanced fluid mobility through submicron pore–throat networks or localized fracture enhancement.

5.2. Quantitative Constraints on Reservoir Properties and Reservoir Response

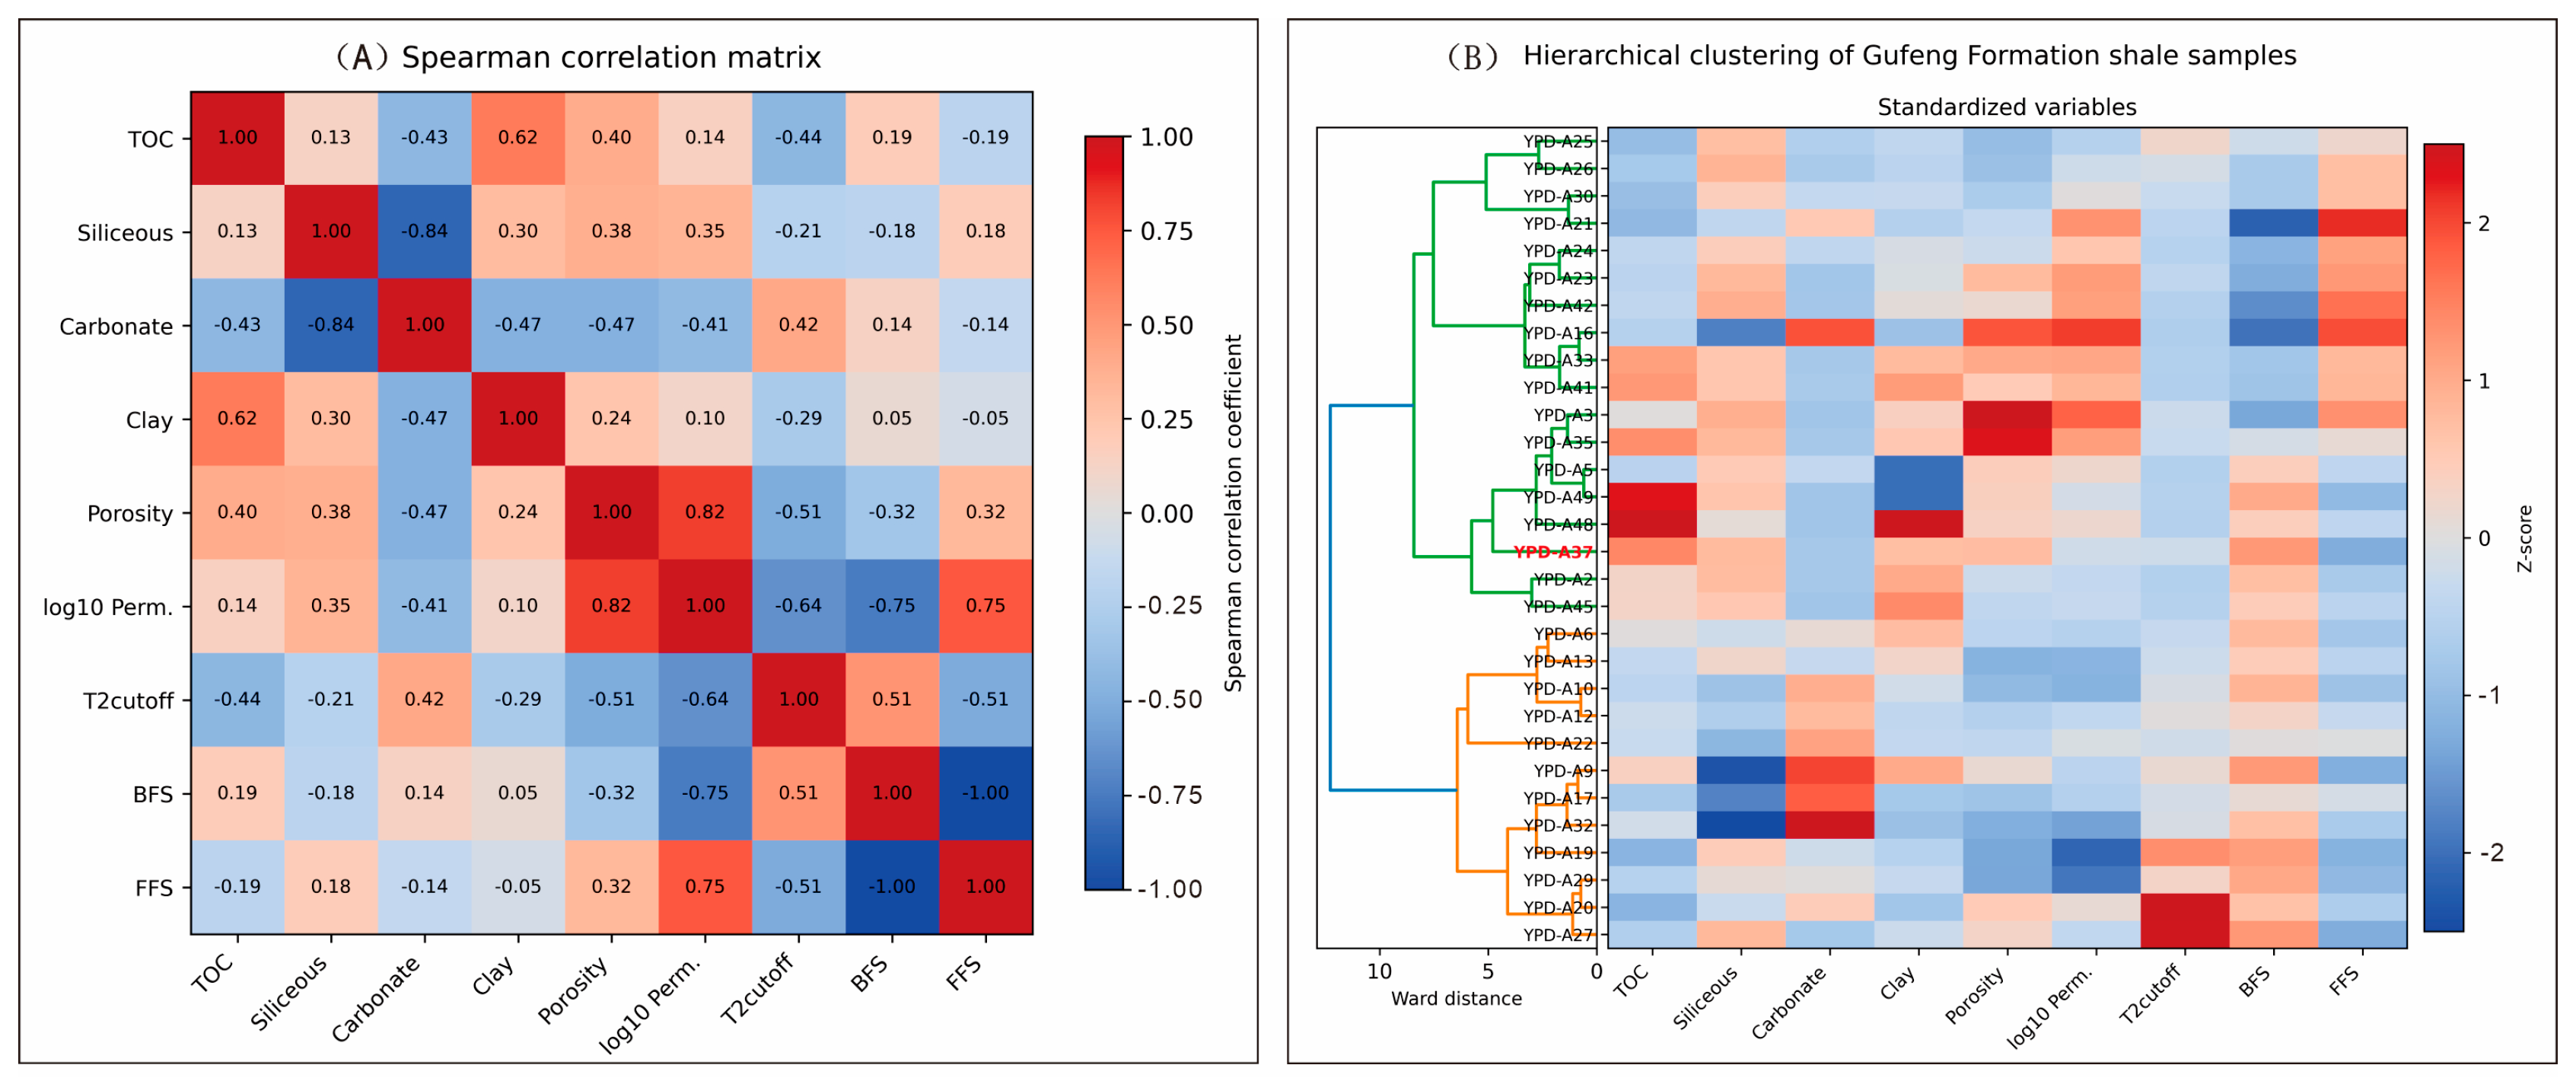
To provide quantitative support for the interpretation of vertical reservoir differentiation, crossplot analysis, correlation analysis, and hierarchical clustering were performed using TOC, mineral groups, and NMR-derived reservoir parameters. The selected variables include TOC, siliceous minerals, carbonate minerals, clay minerals, NMR porosity, NMR-derived permeability, T2cutoff, BFS, and FFS. Among these parameters, NMR porosity and NMR-derived permeability are important indicators of reservoir storage capacity and fluid-flow potential, respectively. For the logarithmic transformation of NMR-derived permeability, the value of YPD-A19 reported as <0.0001 mD was treated as 5 × 10⁻⁵ mD.
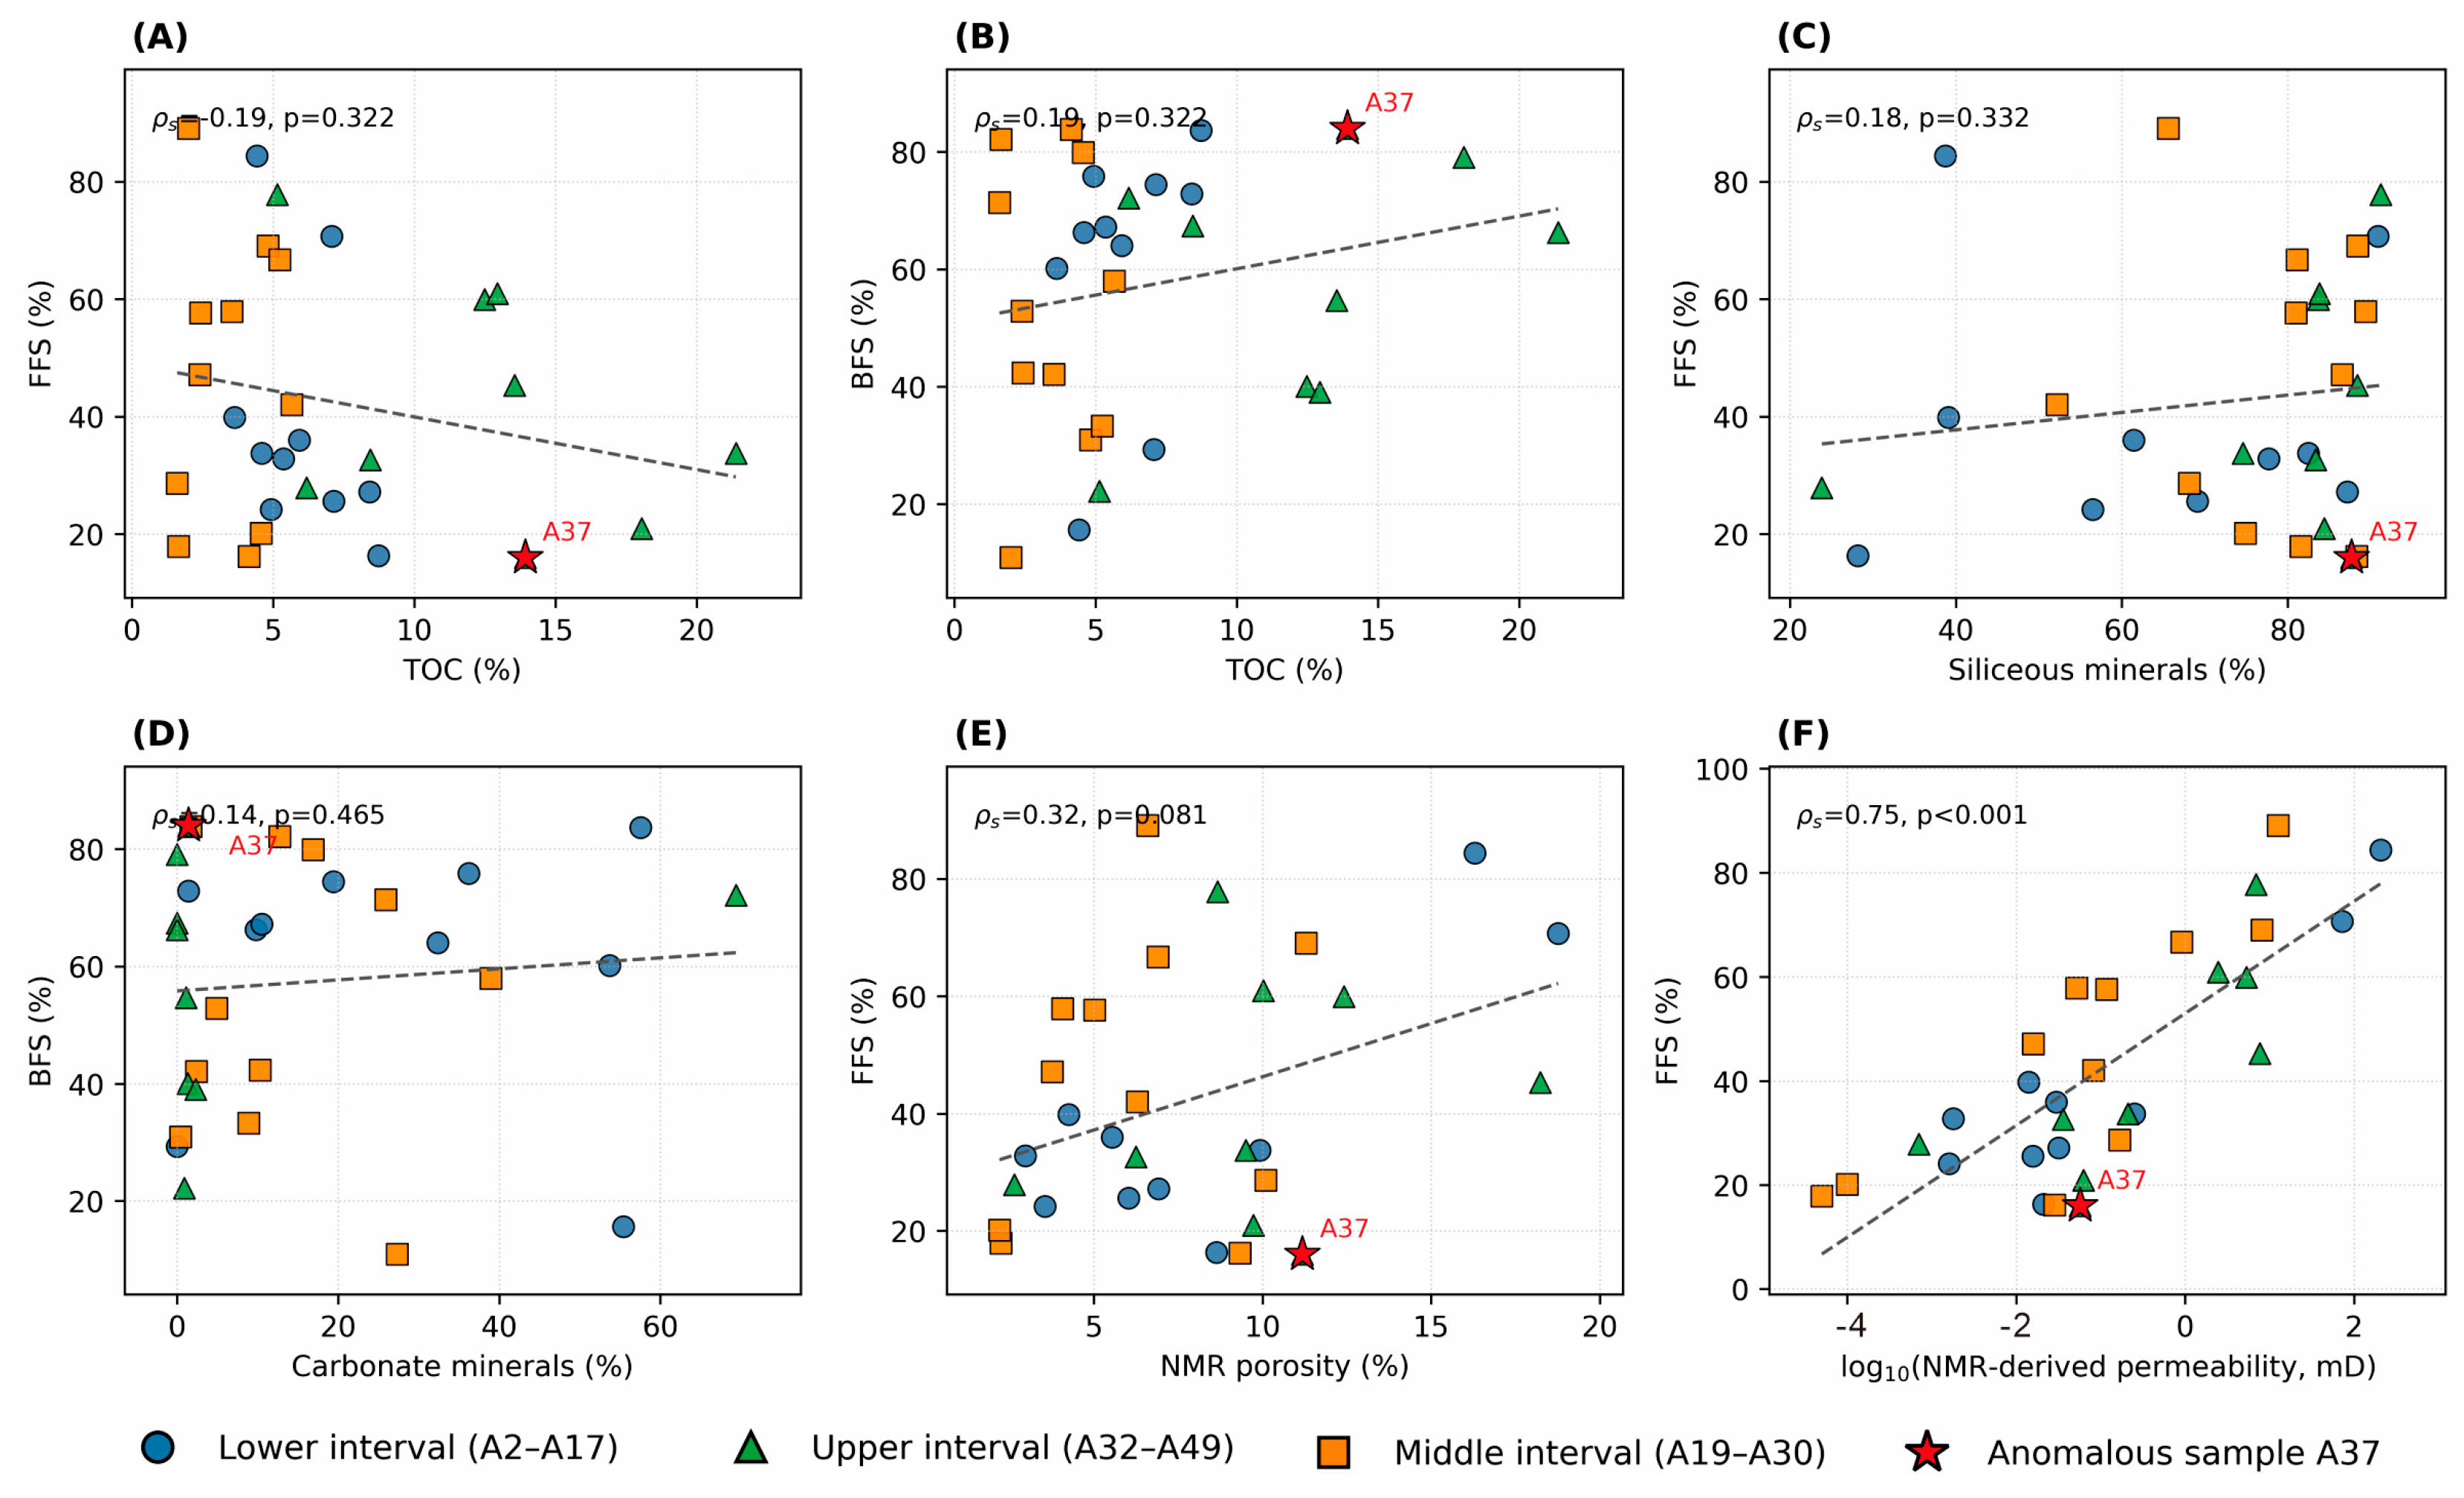
The crossplots indicate that reservoir effectiveness is not controlled by TOC alone (Figure 10). TOC shows only a weak relationship with FFS and BFS, suggesting that high organic matter abundance does not necessarily correspond to a higher movable-fluid proportion. This is consistent with the observation that some high-TOC samples, such as YPD-A37, YPD-A48, and YPD-A49, still show high BFS and low FFS. Therefore, TOC provides an important material basis for pore development, but it cannot independently determine reservoir effectiveness.
NMR porosity provides a quantitative measure of total pore volume and therefore reflects the storage capacity of the shale reservoir. However, the crossplots show that higher NMR porosity does not always correspond to higher FFS. This indicates that total pore volume and movable-fluid proportion are not equivalent. Some samples with relatively high porosity may still be dominated by bound fluids if the pore system is mainly composed of small pores, poorly connected pores, or clay- and organic-matter-associated pores. Therefore, NMR porosity should be evaluated together with BFS, FFS, and T2 spectral characteristics rather than used alone to identify favorable reservoir intervals.
NMR-derived permeability provides a relative indicator of pore–throat effectiveness and fluid-flow potential. Compared with TOC and mineral composition, NMR-derived permeability shows a clearer positive relationship with FFS and a negative relationship with BFS. This suggests that reservoir effectiveness is more directly related to pore–throat connectivity and fluid mobility than to organic matter enrichment or mineral composition alone. However, because permeability in this study was calculated using the Coates model rather than independently measured by gas permeability or pulse-decay methods, it is used as a relative parameter for comparing fluid mobility among samples rather than as calibrated shale matrix permeability.
Mineral composition also shows a non-unique relationship with fluid mobility. Siliceous mineral content displays only a weak positive relationship with FFS, indicating that a rigid siliceous framework may favor pore preservation but is not sufficient to guarantee effective fluid mobility. Carbonate-rich samples show stronger heterogeneity, reflecting the combined effects of carbonate dilution, local dissolution, and heterogeneous pore development. Clay minerals may contribute to higher bound-fluid occurrence because clay-related pores and mineral surfaces can enhance fluid retention. These results indicate that mineral composition should be interpreted together with pore-fluid occurrence, NMR porosity, NMR-derived permeability, and pore–throat effectiveness.
The anomalous behavior of YPD-A37 is particularly important. Although YPD-A37 occurs in the upper interval and has high TOC and high siliceous mineral content, it is characterized by high BFS and low FFS. This indicates that organic matter enrichment and siliceous mineral dominance do not necessarily produce favorable reservoir effectiveness when movable-fluid proportion and pore–throat effectiveness are limited. This sample therefore deviates from the favorable reservoir trend represented by YPD-A33, YPD-A35, YPD-A41, and YPD-A42. Accordingly, the A33–A42 interval should not be interpreted as a uniformly high-quality reservoir interval, but rather as a relatively favorable interval with internal heterogeneity.
Hierarchical clustering based on TOC, mineral groups, NMR porosity, NMR-derived permeability, T2cutoff, BFS, and FFS further supports the presence of distinct reservoir-response groups (Figure 11). The clustering results show that samples with similar storage capacity, fluid mobility, and pore-fluid occurrence tend to group together, but they do not fully validate a deterministic staged reservoir evolution model. Instead, these results indicate that the vertical reservoir architecture of the Gufeng Formation is controlled by the combined effects of organic matter abundance, mineral framework, pore volume, pore-fluid occurrence, and pore–throat effectiveness.
Although the crossplots, correlation analysis, and hierarchical clustering provide quantitative constraints on individual controls and reservoir response groups, they do not directly provide a single reservoir quality score for each sample. Therefore, an integrated reservoir quality evaluation was further performed using an entropy-weighted technique for order preference by similarity to an ideal solution (TOPSIS) method to synthesize organic matter abundance, mineral framework, storage capacity, and fluid mobility parameters into a composite reservoir-quality index.

5.3. Integrated Reservoir Quality Evaluation and Conceptual Model for Vertical Differentiation

Based on the quantitative constraints discussed above, an entropy-weighted TOPSIS method was further applied to integrate the key reservoir quality indicators into a composite reservoir quality index. Compared with crossplots and clustering analysis, this method provides a sample-by-sample quantitative score that can be used to evaluate vertical reservoir quality variation and constrain the conceptual model of reservoir differentiation. The entropy-weighted TOPSIS evaluation was performed using the standard entropy weight method based on Shannon’s information entropy theory [58] and the TOPSIS multi-criteria decision-making framework proposed by Hwang and Yoon [59].
The selected evaluation indicators include TOC, siliceous mineral content, clay mineral content, NMR porosity, NMR-derived permeability, BFS, and FFS. These parameters represent different aspects of shale reservoir quality. TOC reflects the material basis for organic-matter-related pore development; siliceous mineral content represents the rigid mineral framework that may favor pore preservation; NMR porosity reflects storage capacity; and NMR-derived permeability represents relative pore–throat effectiveness and fluid-flow potential. FFS represents the proportion of potentially movable fluids, whereas BFS represents bound-fluid occurrence. Clay mineral content was included as a negative indicator because clay-related pores and mineral surfaces may enhance bound-fluid retention and reduce fluid mobility.
The selected indicators were divided into positive and negative indicators according to their effects on reservoir quality. TOC, siliceous mineral content, NMR porosity, NMR-derived permeability, and FFS were treated as positive indicators, whereas clay mineral content and BFS were treated as negative indicators. Because NMR-derived permeability spans several orders of magnitude, logarithmic transformation was applied before normalization. The permeability value of YPD-A19 reported as <0.0001 mD was treated as 5 × 10⁻⁵ mD for logarithmic transformation.
All indicators were first normalized to eliminate dimensional differences [58]. For positive indicators, the normalized value was calculated as
X i j = X i j X j ,   m i n X j ,   m a x X j ,   m i n
For negative indicators, the normalized value was calculated as
X i j = X j ,   m a x X i j X j ,   m a x X j ,   m i n
where Xij is the original value of indicator j for sample i, X′ij is the normalized value, and Xj,max and Xj,min are the maximum and minimum values of indicator j, respectively. After normalization, all indicators range from 0 to 1, and higher values indicate more favorable reservoir quality.
The entropy weight method was then used to calculate the objective weight of each indicator [58]. The proportion of sample i under indicator j was calculated as
P i j = X i j i = 1 n X i j
The entropy value of indicator j was calculated as
E j = 1 l n m i = 1 m P i j l n P i j
The information utility value was calculated as
D j = 1 E j
The weight of each indicator was then obtained as
W j = D j j = 1 n D j
where m is the number of samples, n is the number of evaluation indicators, and Wj is the entropy weight of indicator j. A higher entropy weight indicates stronger variation among samples and therefore a greater contribution to distinguishing reservoir quality.
The calculated entropy weights show that TOC, FFS, BFS, and NMR porosity are the dominant contributors to the composite reservoir quality index. The weights are 0.217 for TOC, 0.211 for FFS, 0.211 for BFS, and 0.178 for NMR porosity. In comparison, log-transformed NMR-derived permeability, siliceous mineral content, and clay mineral content have lower weights of 0.080, 0.063, and 0.040, respectively. These results indicate that reservoir quality in the Gufeng Formation is mainly controlled by the combined effects of organic matter abundance, storage capacity, and fluid occurrence state rather than by a single mineralogical or organic matter parameter.
The TOPSIS method was then used to calculate the composite reservoir quality index [59]. The following weighted normalized matrix was obtained:
V i j = W j × X i j
The positive ideal solution Vj+ and negative ideal solution Vj were defined as the maximum and minimum weighted normalized values of each indicator, respectively [59]. The distances of each sample from the positive and negative ideal solutions were calculated as
D i + = j = 1 n ( V i j V j + ) 2
D i = j = 1 n ( V i j V j ) 2
Finally, the TOPSIS closeness coefficient was calculated as
C i = D i D i + + D i
where Ci is the composite reservoir quality index. A higher Ci value indicates that the sample is closer to the ideal reservoir condition and farther from the unfavorable reservoir condition.
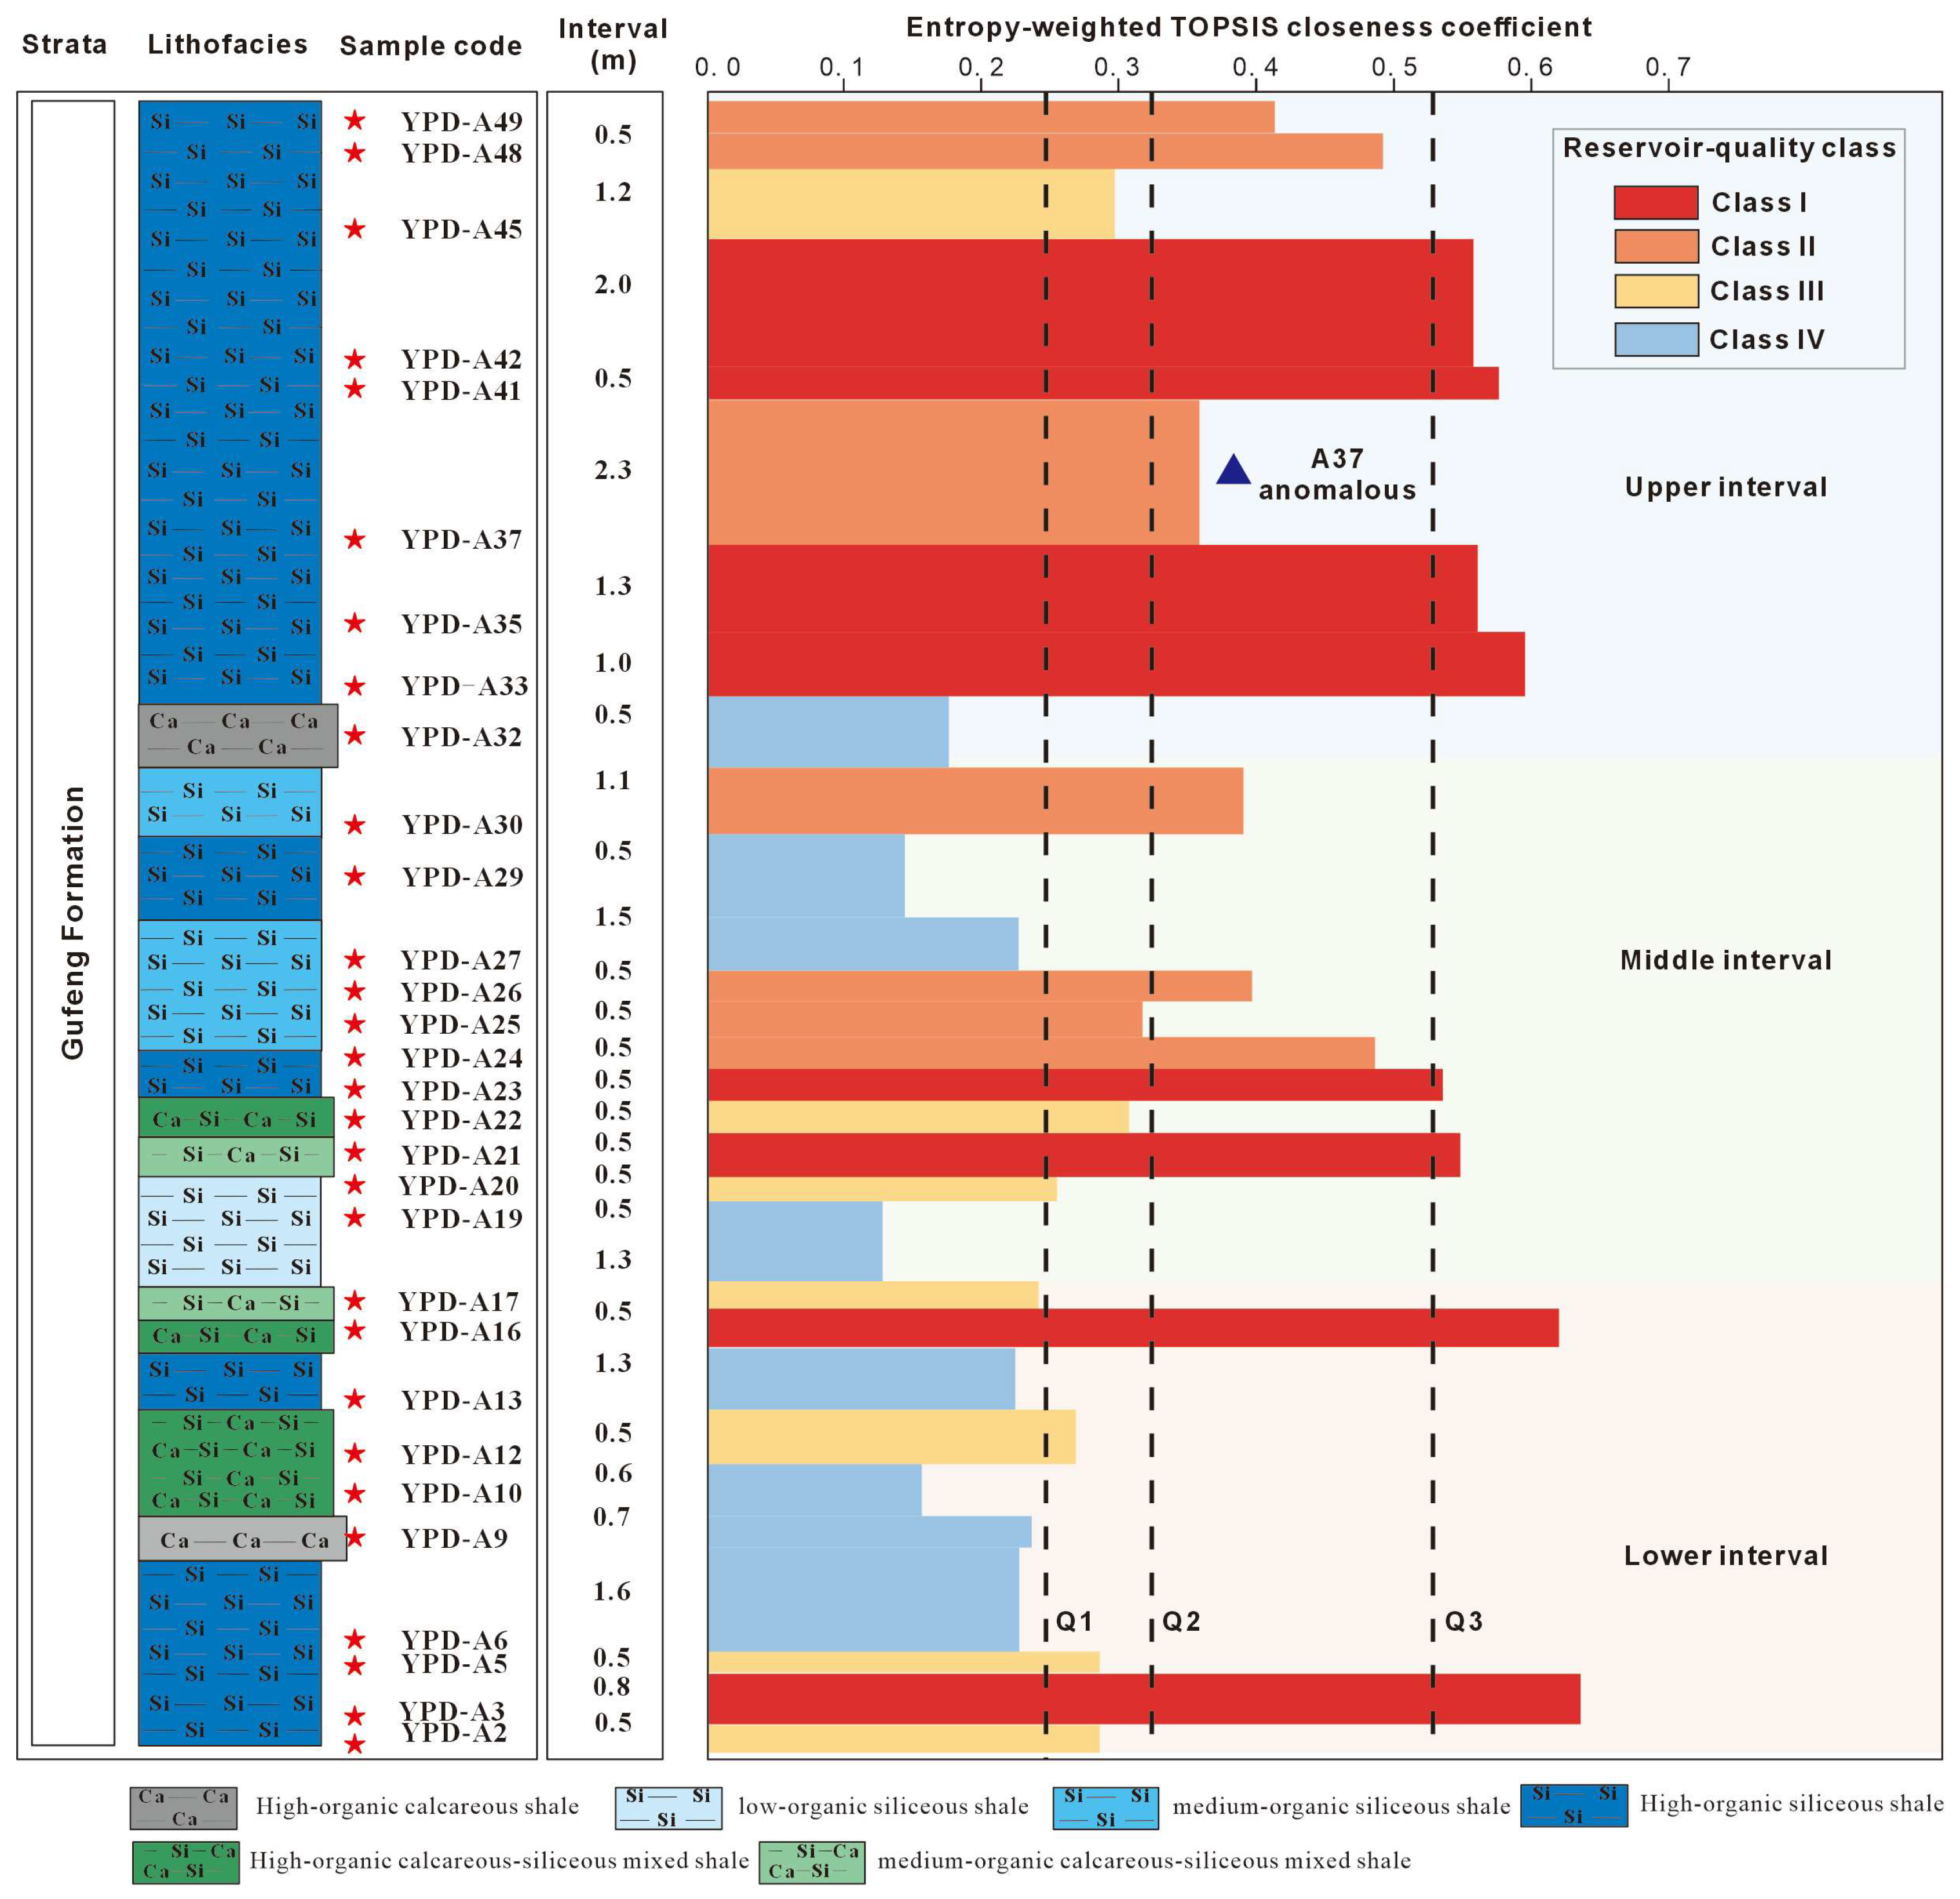
The samples were divided into four reservoir quality classes according to the quartiles of the TOPSIS closeness coefficient (Figure 12). Class I represents high-quality reservoir response, Class II represents relatively favorable reservoir response, Class III represents moderate reservoir response, and Class IV represents poor reservoir response. This quartile-based classification avoids the use of arbitrary fixed thresholds and allows the reservoir quality classes to be determined from the internal distribution of the dataset.
The entropy-weighted TOPSIS results reveal strong vertical heterogeneity in reservoir quality. Several samples in the upper interval, including YPD-A33, YPD-A35, YPD-A41, and YPD-A42, have relatively high composite reservoir quality index values and are classified as Class I. These samples generally have relatively high TOC, high siliceous mineral content, favorable NMR porosity, relatively high FFS, and low BFS. However, the upper interval is not uniformly favorable. YPD-A37 has high TOC and high siliceous mineral content, but its high BFS and low FFS reduce its composite reservoir quality score. This indicates that organic matter enrichment and a rigid siliceous framework alone are insufficient to define high-quality reservoirs when movable-fluid proportion and pore–throat effectiveness are limited.
The middle interval shows mixed reservoir quality responses. YPD-A21 and YPD-A23 are classified as Class I because of their high FFS, low BFS, and relatively high NMR-derived permeability. YPD-A24 and YPD-A30 show relatively favorable responses, whereas YPD-A19 and YPD-A29 show poor reservoir responses due to low movable-fluid proportion and weak NMR-derived permeability. These results indicate that the middle interval is not uniformly poor but contains local intervals with improved reservoir effectiveness.
The lower interval is also highly heterogeneous. YPD-A3 and YPD-A16 obtain high composite reservoir quality scores, but their high NMR-derived permeability should be interpreted cautiously. These values may be influenced by fracture-related NMR responses, bedding-parallel cracks, artificial sample damage, or Coates-model amplification rather than calibrated shale matrix permeability. Therefore, these two samples are regarded as locally enhanced reservoir response samples rather than representative high-quality shale matrix reservoirs.
Overall, the entropy-weighted TOPSIS evaluation demonstrates that favorable reservoir quality in the Gufeng Formation cannot be determined by TOC or siliceous mineral content alone. High-quality reservoir responses occur when organic matter enrichment, rigid mineral framework, sufficient storage capacity, relatively high FFS, low BFS, and enhanced pore–throat effectiveness coincide. The quantitative evaluation therefore supports the interpretation that vertical reservoir differentiation is controlled by the combined effects of organic matter abundance, mineral framework, pore volume, fluid occurrence state, and pore–throat connectivity. Accordingly, the staged reservoir model is revised into a data-constrained conceptual model rather than a deterministic reservoir evolution model.

5.4. Implications for Identifying Favorable Reservoir Intervals

The integrated results from the TOC, XRD, NMR, SEM, Micro-CT, correlation analysis, clustering, and entropy-weighted TOPSIS evaluation indicate that favorable reservoir intervals in the Gufeng Formation cannot be reliably identified using TOC, porosity, or lithofacies alone. TOC reflects the material basis for organic-matter-related pore development, whereas NMR porosity represents total pore volume and storage capacity. However, neither parameter directly reflects movable-fluid proportion or pore–throat effectiveness. Therefore, favorable reservoir identification should be based on the integrated evaluation of organic matter abundance, mineral framework, storage capacity, fluid occurrence state, and pore–throat connectivity.
The most useful NMR indicators for favorable reservoir responses include relatively high FFS, low BFS, moderate to high NMR porosity, enhanced NMR-derived permeability, and clear reductions in intermediate- or intermediate-to-long-T2 components after centrifugation. These characteristics indicate that part of the stored fluid is potentially movable and that the pore system has relatively better fluid-flow effectiveness. However, the NMR-derived permeability in this study is model-derived using the Coates equation and should be interpreted as a relative indicator of fluid-flow potential rather than calibrated shale matrix permeability.
Two types of relatively favorable reservoir responses can be recognized. The first type is a matrix-effective response, mainly developed in high-organic-matter siliceous shale. This type is characterized by intermediate-T2 components, relatively high FFS, low BFS, and effective fluid release after centrifugation. Samples such as YPD-A33, YPD-A35, YPD-A41, and YPD-A42 represent this relatively favorable response. However, the upper interval should not be regarded as a continuous high-quality reservoir zone because YPD-A37 shows high BFS and low FFS despite its high TOC and siliceous mineral enrichment. Therefore, the YPD-A33–A42 interval is interpreted as a relatively favorable but internally heterogeneous interval.
The second type is a locally enhanced composite response, which occurs in some carbonate-bearing or mixed lithofacies and is characterized by composite multi-peak T2 spectra, high FFS, high NMR-derived permeability, and strong post-centrifugation reduction in intermediate- to long-T2 components. YPD-A16 and YPD-A21 may represent this type of reservoir response. However, because these samples were not directly analyzed by Micro-CT, their fracture-enhanced interpretation is mainly based on NMR spectral behavior and model-derived permeability and should be regarded as suggestive rather than diagnostic.
Unfavorable reservoir responses can also be divided into two types. The first is a short-T2-dominated bound-fluid response, in which fluids are mainly retained in fine pores, nanopores, or clay- and organic-matter-associated pore systems under strong surface relaxation and capillary effects. These samples commonly show high BFS and low FFS. The second is a long-T2-enriched but low-efficiency response, in which relatively large pore bodies or long-T2 components are present but do not necessarily correspond to effective fluid mobility. This type indicates that long-T2 enrichment alone cannot be used as evidence for high reservoir quality, especially where pore bodies are isolated or poorly connected.
Accordingly, favorable reservoir intervals in the Gufeng Formation are most likely to occur where several conditions coincide: moderate to high TOC, siliceous-dominated or locally enhanced mixed lithofacies, sufficient NMR porosity, relatively high FFS, low BFS, enhanced NMR-derived permeability, and clear fluid release from intermediate- or intermediate-to-long-T2 components after centrifugation. The entropy-weighted TOPSIS results further show that these favorable conditions are not uniformly distributed along the vertical profile. Therefore, high-quality reservoir identification should be based on integrated evaluation rather than on a single parameter such as TOC, porosity, or mineral composition.

6. Limitations and Future Research Directions

Several limitations should be noted. First, this study is based on a single onshore outcrop section in the Enshi area; therefore, the proposed vertical reservoir-differentiation pattern should be regarded as a section-scale interpretation rather than a regional model for the entire Gufeng Formation. Additional outcrop sections and subsurface cores are needed to test its regional applicability.
Second, Micro-CT analysis was performed on only four representative samples and mainly characterizes CT-resolved micrometer-scale pores and throats. Nanometer- to submicrometer-scale organic pores and clay-related pores remain below the resolution of Micro-CT. Future studies should integrate higher-resolution methods, such as FIB-SEM, gas adsorption, mercury intrusion, and small-angle scattering, to better constrain the multi-scale pore system.
Third, the permeability values used in this study were calculated from NMR data using the Coates model and were not calibrated by independent gas permeability or pulse-decay permeability measurements. Therefore, NMR-derived permeability should be interpreted as a relative indicator of fluid-flow potential rather than absolute shale matrix permeability.
Finally, this study did not include thin-section petrography, SEM-EDS, cathodoluminescence, quartz type analysis, or carbonate fabric analysis. As a result, the origins of quartz and carbonate components and their specific effects on pore preservation remain insufficiently constrained. Future work should combine petrographic observations, mineral fabric analysis, direct permeability testing, burial-history reconstruction, and subsurface data to further evaluate reservoir-quality controls in the Gufeng Formation.

7. Conclusions

The Gufeng Formation shales exhibit strong vertical heterogeneity in organic matter abundance, mineral composition, lithofacies, and reservoir properties. TOC ranges from 1.60% to 21.38% and displays a three-stage vertical pattern: moderate but variable enrichment in the lower interval, relatively low organic matter abundance in the middle interval, and pronounced organic enrichment in the upper interval. Mineral composition changes upward from a mixed siliceous–carbonate system to a dominantly siliceous shale system, forming the basic lithological framework for vertical reservoir differentiation.
NMR-derived parameters demonstrate that porosity alone is insufficient for evaluating reservoir effectiveness. Although NMR porosity ranges from 2.20% to 18.77%, some samples with relatively high porosity still show high bound-fluid saturation and low free-fluid saturation. Therefore, T2cutoff, bound-fluid saturation, free-fluid saturation, NMR-derived permeability, and spectral changes after centrifugation provide more direct constraints on pore–throat effectiveness and fluid mobility.
Based on saturated and centrifuged T2 spectral characteristics, the Gufeng Formation samples can be divided into four descriptive reservoir response types: short-T2-dominated micropore-bound response, intermediate-T2-dominated movable-fluid response, long-T2-enriched but low-efficiency response, and NMR-inferred enhanced-mobility composite response. This classification is used as a comparative framework for describing differences in pore-fluid occurrence and fluid mobility rather than as an independently calibrated reservoir classification scheme.
SEM and Micro-CT observations further constrain the geological meaning of the NMR responses. SEM images reveal multiple pore types, including organic-matter-related pores, mineral dissolution pores, interparticle pores, mineral-edge pores, pyrite intercrystalline pores, and local microfracture-like pores. The Micro-CT results show that the CT-resolved micrometer-scale pores in representative samples are commonly isolated and poorly connected. In particular, A49 contains relatively large micrometer-scale pore bodies but still shows weak reservoir effectiveness, indicating that pore–throat connectivity is more important than pore abundance or pore size alone.
Reservoir heterogeneity in the Gufeng Formation is controlled by the coupled effects of organic matter abundance, mineral framework, pore–throat connectivity, movable-fluid proportion, and local fracture enhancement. TOC provides the material basis for organic pore development, while siliceous minerals help preserve rigid frameworks and pore systems. However, high TOC and high siliceous mineral content do not necessarily indicate high reservoir quality when bound fluids dominate or pore throats are poorly connected.
Integrated reservoir quality evaluation indicates that the most favorable reservoir responses are mainly developed in the upper high-organic siliceous shale interval from YPD-A33 to A42, especially in samples such as YPD-A33, A35, A41, and A42. However, this interval remains internally heterogeneous, as shown by YPD-A37, which has high TOC and high siliceous mineral content but poor fluid mobility. Local enhanced responses also occur in YPD-A16 and YPD-A21, which may be related to fracture-enhanced or composite pore systems, although this interpretation should be treated cautiously because the NMR-derived permeability values are model-derived relative indicators.
Favorable reservoirs in the Gufeng Formation should therefore be identified using integrated criteria rather than a single parameter. Effective reservoir intervals are characterized by moderate to high TOC, siliceous-dominated or locally fracture-enhanced lithofacies, sufficient NMR porosity, relatively low bound-fluid saturation, high free-fluid saturation, intermediate-T2-dominated or composite T2 spectra, and clear fluid release after centrifugation. This integrated approach provides a practical basis for evaluating favorable intervals in heterogeneous marine shale reservoirs.

Author Contributions

Conceptualization, Y.S. and X.Y.; methodology, Y.S., X.Y. and Y.C.; software, Y.C. and T.W.; validation, Y.S. and X.Y.; formal analysis, Y.S. and Y.C.; investigation, Y.S., X.Y. and Y.C.; resources, Y.S.; data curation, Y.C. and T.W.; writing—original draft preparation, Y.C. and Y.S.; writing—review and editing, Y.S., X.Y., Y.C. and T.W.; visualization, Y.C.; supervision, Y.S.; project administration, Y.S. and X.Y.; funding acquisition, Y.S. All authors have read and agreed to the published version of the manuscript.

Funding

This research was financially supported by Fundamental Research Funds for the Central Universities, China University of Geosciences (Wuhan) (No. G1323523166).

Data Availability Statement

All the data is already included in the manuscript.

Conflicts of Interest

The authors declare no conflicts of interest.

References

  1. Du, W.; Lin, R.; Shi, F.; Luo, N.; Wang, Y.; Fan, Q.; Cai, J.; Zhang, Z.; Liu, L.; Yin, W.; et al. Multi-Scale Pore Structure Characterization of Silurian Marine Shale and Its Coupling Relationship with Material Composition: A Case Study in the Northern Guizhou Area. Front. Earth Sci. 2022, 10, 930650. [Google Scholar] [CrossRef]
  2. Fan, Y.; Liu, K.; Yu, L.; Liu, J.; Regenauer-Lieb, K. Assessment of multi-scale pore structures and pore connectivity domains of marine shales by fractal dimensions and correlation lengths. Fuel 2022, 330, 125463. [Google Scholar] [CrossRef]
  3. Guo, C.; Wei, M.; Liu, H. Modeling of Gas Production from Shale Reservoirs Considering Multiple Transport Mechanisms. PLoS ONE 2015, 10, e0143649. [Google Scholar] [CrossRef] [PubMed]
  4. Yang, R.; He, S.; Yi, J.; Hu, Q. Nano-scale pore structure and fractal dimension of organic-rich Wufeng-Longmaxi shale from Jiaoshiba area, Sichuan Basin: Investigations using FE-SEM, gas adsorption and helium pycnometry. Mar. Pet. Geol. 2016, 70, 27–45. [Google Scholar] [CrossRef]
  5. Loucks, R.G.; Reed, R.M.; Ruppel, S.C.; Hammes, U. Spectrum of pore types and networks in mudrocks and a descriptive classification for matrix-related mudrock pores. AAPG Bull. 2012, 96, 1071–1098. [Google Scholar] [CrossRef]
  6. Mathia, E.J.; Bowen, L.; Thomas, K.M.; Aplin, A.C. Evolution of porosity and pore types in organic-rich, calcareous, Lower Toarcian Posidonia Shale. Mar. Pet. Geol. 2016, 75, 117–139. [Google Scholar] [CrossRef]
  7. Milliken, K.L.; Rudnicki, M.; Awwiller, D.N.; Zhang, T. Organic matter–hosted pore system, Marcellus Formation (Devonian), Pennsylvania. AAPG Bull. 2013, 97, 177–200. [Google Scholar] [CrossRef]
  8. Hui, G.; Chen, Z.; Yan, J.; Wang, M.; Wang, H.; Zhang, D.; Gu, F. Integrated evaluations of high-quality shale play using core experiments and logging interpretations. Fuel 2023, 341, 127679. [Google Scholar] [CrossRef]
  9. Sun, M.; Zhang, L.; Hu, Q.; Pan, Z.; Yu, B.; Sun, L.; Bai, L.; Fu, H.; Zhang, Y.; Zhang, C.; et al. Multiscale connectivity characterization of marine shales in southern China by fluid intrusion, small-angle neutron scattering (SANS), and FIB-SEM. Mar. Pet. Geol. 2020, 112, 104101. [Google Scholar] [CrossRef]
  10. Tian, W.; Lu, S.; Huang, W.; Wang, W.; Li, J.; Gao, Y.; Zhan, Z.; Sun, Y. Quantifying the control of pore types on fluid mobility in low-permeability conglomerates by integrating various experiments. Fuel 2020, 275, 117835. [Google Scholar] [CrossRef]
  11. Li, S.; Meng, F.; Zhang, X.; Zhou, Z.; Shen, B.; Wei, S.; Zhang, S. Gas composition and carbon isotopic variation during shale gas desorption: Implication from the Ordovician Wufeng Formation—Silurian Longmaxi Formation in west Hubei, China. J. Nat. Gas Sci. Eng. 2021, 87, 103777. [Google Scholar] [CrossRef]
  12. Long, S.; Feng, D.; Li, F.; Du, W. Prospect analysis of the deep marine shale gas exploration and development in the Sichuan Basin, China. J. Nat. Gas Geosci. 2018, 3, 181–189. [Google Scholar] [CrossRef]
  13. Nie, H.; Jin, Z.; Ma, X.; Liu, Z.; Yang, Z. Graptolites zone and sedimentary characteristics of Upper Ordovician Wufeng Formation-Lower Silurian Longmaxi Formation in Sichuan Basin and its adjacent areas. Acta Pet. Sin. 2017, 38, 160–174. [Google Scholar]
  14. Zou, C.; Dong, D.; Wang, Y.; Li, X.; Huang, J.; Wang, S.; Guan, Q.; Zhang, C.; Wang, H.; Liu, H.; et al. Shale gas in China: Characteristics, challenges and prospects (I). Pet. Explor. Dev. 2015, 42, 753–767. [Google Scholar] [CrossRef]
  15. Du, X.; Song, X.; Zhang, M.; Lu, Y.; Lu, Y.; Chen, P.; Liu, Z.; Yang, S. Shale gas potential of the Lower Permian Gufeng Formation in the western area of the Lower Yangtze Platform, China. Mar. Pet. Geol. 2015, 67, 526–543. [Google Scholar] [CrossRef]
  16. Tang, W.; Tuo, C.; Ma, S.; Yao, Y.; Liu, D.; Yang, X.; Yang, L.; Li, H. Shale reservoir characterization and implications for the exploration and development of the upper Permian Wujiaping Formation, Longmen–Wushankan area, eastern Sichuan Basin. Front. Earth Sci. 2024, 12, 1453098. [Google Scholar] [CrossRef]
  17. Zhang, B.; Cao, J.; Mu, L.; Yao, S.; Hu, W.; Huang, H.; Lang, X.; Liao, Z. The Permian chert event in South China: New geochemical constraints and global implications. Earth-Sci. Rev. 2023, 244, 104513. [Google Scholar] [CrossRef]
  18. Zhu, W.; Zhang, X.; Zhou, D.; Fang, C.; Li, J.; Huang, Z. New cognition on pore structure characteristics of Permian marine shale in the Lower Yangtze region and its implications for shale gas exploration. Nat. Gas Ind. B 2021, 8, 562–575. [Google Scholar] [CrossRef]
  19. Li, L.; Yang, H.; Ju, Z.; Cui, Y.; Xin, J.; Peng, X.; Yang, B.; Zhang, Y.; Hu, Y.; Yang, F. Gas compositional and isotopic variation during desorption of middle-upper Permian shales in western Hubei, Southern China. Nat. Gas Ind. B 2025, 12, 557–571. [Google Scholar] [CrossRef]
  20. Li, S.-Z.; Zhou, Z.; Nie, H.-K.; Zhang, L.-F.; Song, T.; Liu, W.-B.; Li, H.-H.; Xu, Q.-C.; Wei, S.-Y.; Tao, S. Distribution characteristics, exploration and development, geological theories research progress and exploration directions of shale gas in China. China Geol. 2022, 5, 110–135. [Google Scholar] [CrossRef]
  21. Wu, W.; Liu, W.; Mou, C.; Liu, H.; Qiao, Y.; Pan, J.; Ning, S.; Zhang, X.; Yao, J.; Liu, J. Organic-rich siliceous rocks in the upper Permian Dalong Formation (NW middle Yangtze): Provenance, paleoclimate and paleoenvironment. Mar. Pet. Geol. 2021, 123, 104728. [Google Scholar] [CrossRef]
  22. Shi, L.; Feng, Q.; Shen, J.; Ito, T.; Chen, Z.-Q. Proliferation of shallow-water radiolarians coinciding with enhanced oceanic productivity in reducing conditions during the Middle Permian, South China: Evidence from the Gufeng Formation of western Hubei Province. Palaeogeogr. Palaeoclimatol. Palaeoecol. 2016, 444, 1–14. [Google Scholar] [CrossRef]
  23. Zhang, J.; Li, Z.; Wang, D.; Xu, L.; Li, Z.; Niu, J.; Chen, L.; Sun, Y.; Li, Q.; Yang, Z.; et al. Shale gas accumulation patterns in China. Nat. Gas Ind. B 2023, 10, 14–31. [Google Scholar] [CrossRef]
  24. Wei, C.; Cao, J.; Dong, T.; Wang, Y. Effects of the Emeishan large igneous province (ELIP) and coastal upwelling on paleoenvironment and organic matter accumulation during the Middle Permian (Capitanian), South China. Palaeogeogr. Palaeoclimatol. Palaeoecol. 2024, 653, 112426. [Google Scholar] [CrossRef]
  25. Jiang, S.; Zhou, Q.; Li, Y.; Yang, R. Fracability evaluation of the middle–upper Permian marine shale reservoir in well HD1, western Hubei area. Sci. Rep. 2023, 13, 14319. [Google Scholar] [CrossRef] [PubMed]
  26. Wang, Y.; Zhang, Y.; Dong, T.; Duan, K.; Wen, J.; Zhang, H.; Xie, T.; Luo, F. Pore Structure and Fractal Characteristics of the Middle and Upper Permian Dalong and Gufeng Shale Reservoirs, Western Hubei Province, South China. Minerals 2024, 14, 10. [Google Scholar]
  27. Zhu, G.; Jin, J.; Xiao, Q.; Wang, L.; Sheng, G.; Tang, J.; Meng, J.; Lu, Z.; Chen, C. Key geological and engineering technologies and research directions for shale gas exploration and development in western Hubei Province, China. Energy Geosci. 2025, 6, 100460. [Google Scholar] [CrossRef]
  28. Song, Z.; Zhang, J.; Jin, S.; Liu, C.; Abula, A.; Hou, J.; Ma, L. The occurrences and mobility of shale oil in the pore space of terrestrial shale. Fuel 2024, 374, 132377. [Google Scholar] [CrossRef]
  29. Wang, X.; Wang, M.; Li, Y.; Zhang, J.; Li, M.; Li, Z.; Guo, Z.; Li, J. Shale pore connectivity and influencing factors based on spontaneous imbibition combined with a nuclear magnetic resonance experiment. Mar. Pet. Geol. 2021, 132, 105239. [Google Scholar] [CrossRef]
  30. Zhang, Q.; Liu, Y.; Wang, B.; Ruan, J.; Yan, N.; Chen, H.; Wang, Q.; Jia, G.; Wang, R.; Liu, H.; et al. Effects of pore-throat structures on the fluid mobility in chang 7 tight sandstone reservoirs of longdong area, Ordos Basin. Mar. Pet. Geol. 2022, 135, 105407. [Google Scholar] [CrossRef]
  31. Zhang, Q.; Yang, C.; Gu, Y.; Tian, Y.; Liu, H.; Xiao, W.; Wang, Z.; Mi, Z. Microscopic pore-throat structure and fluid mobility of tight sandstone reservoirs in multi-provenance systems, Triassic Yanchang formation, Jiyuan area, Ordos Basin. Energy Geosci. 2025, 6, 100407. [Google Scholar] [CrossRef]
  32. Adeyilola, A.; Nordeng, S.; Onwumelu, C.; Nwachukwu, F.; Gentzis, T. Geochemical, petrographic and petrophysical characterization of the Lower Bakken Shale, Divide County, North Dakota. Int. J. Coal Geol. 2020, 224, 103477. [Google Scholar] [CrossRef]
  33. Yuan, Y.; Rezaee, R.; Zhou, M.-F.; Iglauer, S. A comprehensive review on shale studies with emphasis on nuclear magnetic resonance (NMR) technique. Gas Sci. Eng. 2023, 120, 205163. [Google Scholar] [CrossRef]
  34. Ji, L.; Lin, M.; Cao, G.; Jiang, W. A core-scale reconstructing method for shale. Sci. Rep. 2019, 9, 4364. [Google Scholar] [CrossRef] [PubMed]
  35. Xu, Z.; Shi, W.; Zhai, G.; Peng, N.; Zhang, C. Study on the characterization of pore structure and main controlling factors of pore development in gas shale. J. Nat. Gas Geosci. 2020, 5, 255–271. [Google Scholar] [CrossRef]
  36. Liao, Z.; Hu, W.; Cao, J.; Wang, X.; Hu, Z. Petrologic and geochemical evidence for the formation of organic-rich siliceous rocks of the Late Permian Dalong Formation, Lower Yangtze region, southern China. Mar. Pet. Geol. 2019, 103, 41–54. [Google Scholar] [CrossRef]
  37. Huang, Z.; Yi, X.; Huang, Y.; Tian, L.; Wu, K.; Li, M. Response of carbonate factories to late Paleozoic climate change: A case study from the Yanduhe section, Hubei Province, South China. Front. Mar. Sci. 2025, 12, 1513219. [Google Scholar] [CrossRef]
  38. Kametaka, M.; Takebe, M.; Nagai, H.; Zhu, S.; Takayanagi, Y. Sedimentary environments of the Middle Permian phosphorite–chert complex from the northeastern Yangtze platform, China; the Gufeng Formation: A continental shelf radiolarian chert. Sediment. Geol. 2005, 174, 197–222. [Google Scholar] [CrossRef]
  39. Fu, X.; Chen, Y.; Luo, B.; Li, W.; Zhang, J.; Wang, X.; Qiu, Y.; Lü, X.; Yao, Q. Characteristics and petroleum geological significance of the high- quality source rocks in the Gufeng Member of the Middle Permian Maokou Formation in the northern Sichuan basin. Acta Geol. Sin. Engl. Ed. 2021, 95, 1903–1920. [Google Scholar] [CrossRef]
  40. Wang, X.; Li, B.; Yang, X.; Wen, L.; Xu, L.; Xie, S.; Du, Y.; Feng, M.; Yang, X.; Wang, Y.; et al. Characteristics of “Guangyuan-Wangcang” trough during Late Middle Permian and its petroleum geological significance in northern Sichuan Basin, SW China. Pet. Explor. Dev. 2021, 48, 655–669. [Google Scholar] [CrossRef]
  41. Qiu, Z.; Dou, L.; Wu, J.; Wei, H.; Liu, W.; Kong, W.; Zhang, Q.; Cai, G.; Zhang, G.; Wu, W.; et al. Lithofacies Palaeogeographic Evolution of the Middle Permian Sequence Stratigraphy and Its Implications for Shale Gas Exploration in the Northern Sichuan and Western Hubei Provinces (in Chinese with English abstract). Earth Sci. 2024, 49, 712–748. [Google Scholar]
  42. He, W.; Li, T.; Mou, B.; Lei, Y.; Song, J.; Liu, Z. Lithofacies Types and Physical Characteristics of Organic-Rich Shale in the Wufeng-Longmaxi Formation, Xichang Basin, China. ACS Omega 2023, 8, 18165–18179. [Google Scholar] [CrossRef] [PubMed]
  43. Yang, H.; Zhao, S.; Li, B.; Liu, Y.; Zheng, M.; Zhang, J.; Liu, Y.; Wang, G.; Yin, M.; Cao, L. Micropore Structure of Deep Shales from the Wufeng–Longmaxi Formations, Southern Sichuan Basin, China: Insight into the Vertical Heterogeneity and Controlling Factors. Minerals 2023, 13, 1347. [Google Scholar] [CrossRef]
  44. Zhang, K.; Lai, J.; Bai, G.; Pang, X.; Ma, X.; Qin, Z.; Zhang, X.; Fan, X. Comparison of fractal models using NMR and CT analysis in low permeability sandstones. Mar. Pet. Geol. 2020, 112, 104069. [Google Scholar] [CrossRef]
  45. Meng, M.; Li, Z.; Hong, Z.; Bao, J.; Jiang, Q. Quantifying pore size distribution by nuclear magnetic resonance method in tight sandstones: Comparison between water-wet and oil-wet saturated fluids. Int. J. Hydrog. Energy 2026, 197, 152608. [Google Scholar] [CrossRef]
  46. Standard’s SY/T 6490-2014; Specification for Measurement of Rock NMR Parameter in Laboratory. National Energy Administration: Beijing, China, 2014.
  47. Testamanti, M.N.; Rezaee, R. Determination of NMR T2 cut-off for clay bound water in shales: A case study of Carynginia Formation, Perth Basin, Western Australia. J. Pet. Sci. Eng. 2017, 149, 497–503. [Google Scholar] [CrossRef]
  48. Coates, G.R.; Xiao, L.; Prammer, M.G. NMR Logging Principles and Applications; Elsevier Science: Amsterdam, The Netherlands, 1999. [Google Scholar]
  49. Ma, L.; Dowey, P.J.; Rutter, E.; Taylor, K.G.; Lee, P.D. A novel upscaling procedure for characterising heterogeneous shale porosity from nanometer-to millimetre-scale in 3D. Energy 2019, 181, 1285–1297. [Google Scholar] [CrossRef]
  50. Hong, Z.; Meng, M.; Yuan, B.; Ma, C.; Wang, Q.; Deng, K.; Bao, J.; Yuan, M. Nanopore structure characterization of lacustrine and marine shales: Comparison between small angle neutron scattering and nitrogen adsorption methods. Int. J. Hydrog. Energy 2026, 208, 153565. [Google Scholar] [CrossRef]
  51. Lazar, O.R.; Bohacs, K.M.; Macquaker, J.H.S.; Schieber, J.; Demko, T.M. Capturing key attributes of fine-grained sedimentary rocks in outcrops, cores, and thin sections: Nomenclature and description guidelines. J. Sediment. Res. 2015, 85, 230–246. [Google Scholar] [CrossRef]
  52. Nie, H.; Jin, Z.; Zhang, J. Characteristics of three organic matter pore types in the Wufeng-Longmaxi Shale of the Sichuan Basin, Southwest China. Sci. Rep. 2018, 8, 7014. [Google Scholar] [CrossRef] [PubMed]
  53. Zhang, X.; Gui, H.; Wu, L.; Sun, Y.; Hong, D.; Yang, Z.; Zhang, K.; Huang, S.; Liu, H.; Xiao, W.; et al. Characterizing pore size distribution of high maturity shales and main controlling factors analysis: A case study of Permian Gufeng Formation in the Lower Yangtze region, China. Geol. J. 2023, 58, 4533–4546. [Google Scholar] [CrossRef]
  54. Milliken, K.L.; Olson, T. Silica Diagenesis, Porosity Evolution, and Mechanical Behavior In Siliceous Mudstones, Mowry Shale (Cretaceous), Rocky Mountains, U.S.A. J. Sediment. Res. 2017, 87, 366–387. [Google Scholar] [CrossRef]
  55. Jarvie, D.M.; Hill, R.J.; Ruble, T.E.; Pollastro, R.M. Unconventional shale-gas systems: The Mississippian Barnett Shale of north-central Texas as one model for thermogenic shale-gas assessment. AAPG Bull. 2007, 91, 475–499. [Google Scholar] [CrossRef]
  56. Li, Z.; Mao, Z.; Sun, Z.; Luo, X.; Wang, Z.; Zhao, P. An NMR-based clay content evaluation method for tight oil reservoirs. J. Geophys. Eng. 2019, 16, 116–124. [Google Scholar] [CrossRef]
  57. Bao, J.; Meng, M.; Wang, Q.; Yu, S.; Yuan, M.; Hong, Z.; Jiang, Q. Comparison of square-root and logarithmic data treatment for pore connectivity by co-current spontaneous imbibition in lacustrine shales. Int. J. Hydrog. Energy 2026, 229, 154737. [Google Scholar] [CrossRef]
  58. Shannon, C.E. A Mathematical Theory of Communication. Bell Syst. Tech. J. 1948, 27, 379–423. [Google Scholar] [CrossRef]
  59. Hwang, C.-L.; Yoon, K. Basic Concepts and Foundations. In Multiple Attribute Decision Making: Methods and Applications a State-of-the-Art Survey; Hwang, C.-L., Yoon, K., Eds.; Springer: Berlin/Heidelberg, Germany, 1981; pp. 16–57. [Google Scholar] [CrossRef]
Figure 1. (A) Middle Permian (ca. 260 Ma) global paleogeographic reconstruction (modified from Ron Blakey; http://deeptimemaps.com); (B) paleogeographic framework of South China during the Middle Permian, showing the location of the YPD section. Adapted from Huang et al. [37], © 2025 by the authors, published by Frontiers Media S.A., licensed under CC BY 4.0.; (C) YPD profile and sampling locations.
Jmse 14 01131 g001
Figure 2. Vertical variations in lithofacies, TOC, NMR-derived parameters, and NMR-defined reservoir response types of the Gufeng Formation shale samples in the YPD section.
Jmse 14 01131 g002
Figure 3. Vertical variations in XRD-derived mineral compositions and mineral groups of the Gufeng Formation shale samples. Siliceous minerals = quartz + albite + orthoclase; carbonate minerals = calcite + dolomite; clay minerals = illite + kaolinite; pyrite = independent mineral component.
Jmse 14 01131 g003
Figure 4. Lithofacies classification diagram for the Gufeng Formation shales.
Jmse 14 01131 g004
Figure 5. Representative NMR T2 spectra and cumulative porosity curves of the Gufeng Formation shale samples before and after centrifugation. YPD-A5, YPD-A23, YPD-A20, and YPD-A21 represent different NMR-defined reservoir response types. Yellow and red solid curves represent pre-centrifugation and post-centrifugation T2 spectral components, respectively. Blue and green dashed curves represent pre-centrifugation and post-centrifugation cumulative porosity, respectively. The pre-centrifugation cumulative porosity is greater than or equal to the post-centrifugation cumulative porosity. Vertical dashed lines indicate the T2cutoff values used to distinguish bound-fluid and free-fluid components.
Jmse 14 01131 g005
Figure 6. SEM images showing pore types and microfractures in selected lower Gufeng Formation shale samples. (AC) YPD-A6: mineral dissolution pores and mineral-edge pores in the matrix (A), pyrite-like crystal aggregates with intercrystalline pores (B), and mineral dissolution pores associated with framboidal pyrite-like aggregates and mineral-edge pores (C). (DF) YPD-A9: scattered mineral dissolution pores and mineral-edge pores (D,E), and framboidal pyrite-like aggregates with local intercrystalline pores (F). (GI) YPD-A13: mineral dissolution pores, mineral-edge pores, and interparticle pores in the fine-grained matrix. (JL) YPD-A16: mineral-edge pores and local microfracture-like pores (J), bedding-related microfractures extending along weak planes (K), and narrow microfracture-like pores with limited continuity (L).
Jmse 14 01131 g006
Figure 7. SEM images showing pore types and microfractures in selected middle Gufeng Formation shale samples. (AC) YPD-A19: a continuous microfracture surrounded by mineral dissolution pores (A), a large mineral dissolution pore with residual mineral fragments (B), and mineral dissolution pores with local pyrite-like aggregates (C). (DF) YPD-A24: organic-matter-related or mineral-related small pores (D), densely distributed small mineral dissolution pores and mineral-edge pores (E), and irregular mineral dissolution pores in the matrix (F). (GI) YPD-A25: a continuous microfracture-like pore that may connect scattered mineral pores (G), and small mineral dissolution pores and mineral-edge pores (H,I). (JL) YPD-A30: scattered mineral-related pores and pyrite-like aggregates (J), organic-matter-related pores or organic matter-mineral aggregate pores (K), and a bedding-related microfracture with adjacent mineral-edge pores (L).
Jmse 14 01131 g007
Figure 8. SEM images showing pore types and microfractures in selected upper Gufeng Formation shale samples. (AC) YPD-A32: matrix-hosted mineral pores and bedding-related microfractures (A,B), and large mineral dissolution pores or mineral-edge pores (C). (D,E) YPD-A37: microfracture-like pores associated with mineral dissolution pores (D), and organic matter–mineral aggregates with organic matter–mineral boundary pores (E). (F,G) YPD-A42: bedding-related microfractures and branching cracks that may connect adjacent mineral-related pores (F), and irregular mineral dissolution pores (G). (H,I) YPD-A45: small mineral dissolution pores and mineral-edge pores in the matrix (H), and intragranular dissolution pits and mineral-edge pores around a rigid mineral grain (I). (JL) YPD-A49: organic-matter-related or organic matter–mineral aggregate pores (J,K), and a large irregular mineral dissolution pore with rough pore walls and residual mineral fragments (L).
Jmse 14 01131 g008
Figure 9. Micro-CT-based pore structure characterization of representative Gufeng Formation shale samples. (AC) YPD-A6, (DF) YPD-A24, (GI) YPD-A30, and (JL) YPD-A49. For each sample, the left panel shows the 3D rendered model and orthogonal CT slice views in the XY, XZ, and YZ directions; the middle panel shows the CT-derived 3D pore distribution, where blue regions represent CT-resolved pores and gray-white regions represent the rock matrix; the right panel shows the pore–throat network model, where red spheres represent connected pore bodies and yellow rods represent throats.
Jmse 14 01131 g009
Figure 10. Spearman correlation matrix of TOC, mineral composition, NMR-derived pore parameters, and reservoir-quality indicators. ρs represents Spearman’s rank correlation coefficient, and p represents the significance level of the correlation. Positive ρs values indicate positive correlations, whereas negative values indicate negative correlations. (A) Relationship between free fluid saturation (FFS) and total organic carbon (TOC) content; (B) relationship between bound fluid saturation (BFS) and TOC content; (C) relationship between FFS and siliceous mineral content; (D) relationship between BFS and carbonate mineral content; (E) relationship between FFS and NMR porosity; (F) relationship between FFS and log10-transformed NMR-derived permeability.
Jmse 14 01131 g010
Figure 11. Spearman correlation matrix and hierarchical clustering of Gufeng Formation shale samples based on TOC, mineral composition, and NMR-derived reservoir parameters. (A) Spearman correlation matrix among TOC, siliceous minerals, carbonate minerals, clay minerals, NMR porosity, log-transformed NMR-derived permeability, T2cutoff, BFS, and FFS. The values in the cells represent Spearman’s rank correlation coefficients. (B) Hierarchical clustering heatmap of the same standardized variables. The variables were standardized before clustering, and the dendrogram was generated using Ward’s method. Positive Z-scores indicate values higher than the sample mean, whereas negative Z-scores indicate values lower than the sample mean.
Jmse 14 01131 g011
Figure 12. Relative stratigraphic distribution and entropy-weighted TOPSIS closeness coefficients for reservoir quality classification of Gufeng Formation shale samples.
Jmse 14 01131 g012
Table 2. TOC, lithofacies, NMR-derived parameters, and NMR-defined reservoir response types of the Gufeng Formation samples.
Sample CodeInterval (m)LithofaciesTOC (%)NMR-Derived ParametersNMR-Defined Reservoir Response Type
Porosity (%)Permeability (mD)T2cutoff (ms)BFS (%)FFS (%)T2 (ms)
YPD-A20.5high-organic matter siliceous shale8.416.910.03180.4472.8327.170.29Type I
YPD-A30.5high-organic matter siliceous shale7.0718.7772.08912.3729.3270.6813.05Type II; locally enhanced
YPD-A50.8high-organic matter siliceous shale4.599.920.25150.3566.2633.740.27Type I
YPD-A60.5high-organic matter siliceous shale7.146.030.01571.9874.4125.591.87Type I–II
YPD-A91.6high-organic matter calcareous shale8.738.630.02114.6983.6716.332.38Type I–II
YPD-A100.7high-organic matter siliceous shale4.933.550.00163.2175.8624.142.38Type I–II
YPD-A120.6high-organic matter siliceous shale5.935.530.02974.0464.0135.993.04Type I–II
YPD-A130.5high-organic matter siliceous shale5.362.960.00182.4367.2232.782.38Type I–II
YPD-A161.3high-organic matter calcareous shale4.4216.29205.88600.0615.6284.384.20Type IV
YPD-A170.5medium-organic matter calcareous shale3.634.250.01402.9860.1639.843.04Type I–II
YPD-A191.3low organic matter siliceous shale1.652.24<0.000111.7582.1217.881.06Type I
YPD-A200.5low organic matter siliceous shale1.610.090.167428.9271.3428.6623.00Type III
YPD-A210.5medium-organic matter siliceous shale26.5912.56111.2210.9389.0718.04Type IV
YPD-A220.5high-organic matter siliceous shale5.666.280.08212.6757.9742.032.80Type I–II
YPD-A230.3high-organic matter siliceous shale4.8211.298.07971.4030.9669.043.04Type II
YPD-A240.5high-organic matter siliceous shale5.236.900.90790.7733.3266.689.44Type II
YPD-A250.5medium-organic matter siliceous shale2.43.760.01595.2252.8547.152.58Type II-T
YPD-A260.5medium-organic matter siliceous shale3.534.060.05173.0142.0957.9121.21Type III
YPD-A270.5high-organic matter siliceous shale4.149.330.028318.5283.8216.1916.64Type III
YPD-A291.5high-organic matter siliceous shale4.572.200.00015.6079.8820.123.29Type I–II
YPD-A300.5medium-organic matter siliceous shale2.435.020.11742.1342.3557.653.57Type II
YPD-A321.1high-organic matter calcareous shale6.182.640.00073.1972.1127.892.20Type I–II
YPD-A330.5high-organic matter siliceous shale12.4812.415.30050.4140.0859.920.55Type II
YPD-A351high-organic matter siliceous shale13.5418.247.61522.0954.6645.341.59Type II
YPD-A371.3high-organic matter siliceous shale13.9211.180.05672.6083.9916.011.25Type I–II
YPD-A412.3high-organic matter siliceous shale12.9410.022.45190.2639.0760.930.60Type II
YPD-A420.5high-organic matter siliceous shale5.148.666.89140.4722.2277.781.59Type II
YPD-A452high-organic matter siliceous shale8.446.250.03580.6167.3532.650.55Type I
YPD-A481.2high-organic matter siliceous shale21.389.500.21080.4866.2833.720.43Type I
YPD-A490.5high-organic matter siliceous shale18.049.730.06270.6679.0720.930.51Type I
Type I, short-T2-dominated micropore-bound response; Type II, intermediate-T2-dominated movable-fluid response; Type III, long-T2-enriched but low-efficiency response; Type IV, NMR-inferred enhanced-mobility composite response; Type I–II, short- to intermediate-T2-dominated low-mobility response; Type II-T, intermediate-T2-dominated transitional movable-fluid response.
Table 3. Micro -CT-derived pore structure parameters of representative Gufeng Formation shale samples.
Sample CodePore Radius Range (μm)Proportion of Pores < 1.5 μm (%)Average Pore Radius (μm)Average Pore Volume (μm3)Average Specific Surface Area (μm2)Throat NumberPore Number
YPD-A61.08–6.8489.751.2110.4215.295281,038
YPD-A241.02–5.5787.371.2311.0116.78091,951
YPD-A301.03–4.0998.171.116.5811.29026,925
YPD-A491.08–3.7959.481.4818.2125.9909094
Note: The Micro-CT parameters characterize CT-resolved micrometer-scale pore bodies and throats. They do not represent nanometer- to submicrometer-scale organic pores or clay-related pores.
Disclaimer/Publisher’s Note: The statements, opinions and data contained in all publications are solely those of the individual author(s) and contributor(s) and not of MDPI and/or the editor(s). MDPI and/or the editor(s) disclaim responsibility for any injury to people or property resulting from any ideas, methods, instructions or products referred to in the content.