1. Introduction
The performance of a ship is evaluated during the delivery by a set of sea trials, which are currently carried out in accordance with ISO 15016:2025 [
1]. The ISO standard provides the internationally accepted framework for assessing ship speed and power performance under reference environmental conditions and includes procedures for correcting environmental effects such as wind, waves, water temperature, and displacement variations. However, although the standard provides the basis for performance assessment and monitoring, it does not explicitly address the variation in hull fouling effects across different operational speeds during long-term service operation. The present study focuses specifically on this aspect. With the passing time, the performance of the vessel deteriorates mainly due to the increase in roughness of the wetted surface of the hull, while roughness on the propeller further deteriorates its efficiency and consequently the overall propulsive performance of the ship. Hull roughness increases progressively with the passing time between successive dry dockings of the ship, usually scheduled by the ship owners every 4 or 5 years. In addition, to clean and polish the propeller, they use modern underwater technology once or twice per year, so that the propeller is kept more or less in a relatively clean condition. This assumption applies to the presented study; thus, the effect of propeller fouling is not taken into consideration. However, the smoothness of the hull plating deteriorates due to erosion and ageing of steel as well as slight local buckling of the plates between the stiffeners, leading to a further increase in frictional resistance.
Traditionally, frictional resistance refers to the clean hull of a new building, while roughness resistance represents the resistance component due to fouling, erosion and ageing. The hull form does not affect roughness resistance as derived by Hakim et al. (2023) [
2] and Oliveira et al. (2018) [
3].
Roughness resistance constitutes a major portion of the total resistance of ships in deep (Choi et al., 2024) [
4] and in shallow waters (Song et al., 2023 [
5], Song et al., 2020 [
6]) and affects the economic management of ships significantly. The shipping companies examine alternative plans for cleaning the hull, accounting for the properties of the applied coatings to conclude with the optimum one. Furthermore, ship owners sign charter contracts with the charterers who operate the ships in the waterborne transportation of goods. In these documents, there is always a clause that in case the service speed or the consumption at the promised service speed deviates from the agreed one, a penalty or an award (bonus) is due to the ship owners, depending on whether the actual service speed is higher or lower than the one stated in the contract, respectively. A similar clause also holds true with respect to the consumption at the agreed service speed. Following the findings of this paper, the current common practice of the charterers to evaluate the ship speed and/or the consumption at the agreed service speed in calm water at the beginning of the hiring period and to extend their penalty or bonus over the whole hiring period (one or more years) should certainly be revised.
To be more specific, during the hiring period, the ship may sail at a reduced speed for one of the following reasons:
to reduce consumption or emissions to confront the strict IMO (International Maritime Organization) regulations for the protection of the environment (slow steaming) (IMO/MEPS 83/6, 2025) [
7], or
to operate safely and avoid excessive dynamic responses in waves violating internationally accepted criteria in rough waters (voluntary speed reduction) (Lloyds, 1989) [
8], or,
When the installed onboard resources cannot afford to cover the additional resistance at service speed due to the dynamic responses of the ship, it slows down and keeps sailing at a reduced speed (involuntary speed loss) (Lloyds, 1989) [
8].
In recent years, the maritime sector has faced increasing pressure to reduce greenhouse gas emissions and improve operational energy efficiency due to progressively stricter IMO decarbonization policies, such as the Energy Efficiency Design Index (EEDI), the Energy Efficiency Existing Ship Index (EEXI), the Carbon Intensity Indicator (CII), the European Union’s Emission Trading System (EU ETS) and the FuelEU Maritime regulation. On top of that, the ever-increasing cost of fuel has made slow steaming one of the most widely adopted operational measures for reducing fuel consumption and emissions.
Although the overall benefits of slow-steaming might be less promising than expected under the assumption of constant transport work (slow-steaming results in an increased number of ships in order to transfer the same amount of cargo), as it is shown by Degiuli et al. (2024) [
9], understanding the variation in fouling-induced performance penalties across different operational speeds becomes increasingly important for realistic performance assessment, operational planning, and dry-docking scheduling.
Currently, slow steaming constitutes the most realistic measure to reduce emissions and a strong competitor to alternative emission reduction methods, such as ESD (Energy Saving Devices), WAP (Wind Assisted Propulsion) and Blue/Green fuels. Various researchers investigate the value of slow steaming as an effective measure to reduce emissions. References [
9,
10,
11,
12,
13] are the most recent of them.
On the other hand, the forced slowdown in adverse sea and weather conditions, mainly due to the limited available power onboard, or to avoid excessive dynamic ship motions, is quite often a situation for ocean-going ships sailing for long periods (many days or weeks) in various adverse sea environments, covering a considerable percentage of the hiring period. The main purpose of the study is to derive the effect of fouling at speeds lower than the service speed, based on the respective effect at the service speed. It proves that this effect diminishes at speeds significantly lower than the service speed. The interest in this investigation is based on the current slow steaming practice, as well as on the fact that a significant part of the charter contract is spent in confused seas, where the ship is forced to sail at reduced speeds due to excessive power requirements (involuntary speed loss) or for the safety of the ship, the crew and the cargo (voluntary speed reduction). Thus, shipping companies should prepare their hull and propeller cleaning based on the weighted effect of fouling on ship performance over the whole charter period. This outcome should also be considered in the charter contract. The study assumes a reduced performance evaluated or monitored at service speed without considering the type of fouling (homogeneous or heterogeneous). Furthermore, the propeller is usually cleaned on a regular basis, once or twice per year, so the reduced performance is due to hull fouling.
Although the proportionality between resistance and speed is well established in classical ship hydrodynamics, there is currently no simple and practically validated methodology for estimating the variation in roughness effect across different operational speeds based on recorded ship performance data. The novelty of the present study is not the derivation of the cubic relationship of total resistance with speed, which is based on clean hulls, with an assumed standard roughness allowance, but the investigation of how the actual roughness resistance (experimentally or operationally observed) is related to speed. The findings of this study permit the transfer of the fouling effects at one speed (typically the service speed) to another (lower) operational speed. In
Section 2 of this manuscript, the available literature on the effect of roughness on the performance of ships is briefly reviewed to demonstrate that the variation in the effect of fouling on ship performance for reduced ship speeds has not yet been treated adequately. The paper proposes a new robust and reliable methodology to derive the effect of fouling on ship performance at reduced speeds based on the respective effect at service speed. In this way, the overall performance of a ship encompassing the power requirements and the fuel consumption at any reduced speed will be assessed based on the respective data at the service speed. The proposed methodology, which is detailed in
Section 3, can also be used to form a more reasonable basis for specifying the clauses in the charter contracts, as well as leading shipping companies to a realistic revision of their dry-docking policy. Finally,
Section 4 summarizes the advantages of using the proposed method to assess the overall performance of a ship as well as in scheduling dry-dockings and preparing realistic charter contracts.
2. State-of-the-Art Review
Already in the 19th century, Froude (1888) [
14] realized the importance of friction as a major component of the resistance of ships. By the mid-20th century, hydrodynamicists focused more on the mechanics of friction and the boundary layer intervening between the solid body surface and the free advancing fluid. Both the friction and the shape of the boundary layer are correlated with the viscosity of the fluid and the non-dimensional Reynolds number
. Hoerner (1965) [
15] presents in detail the layout of the fluid-solid interface in the case of laminar (low
) and turbulent (high
) flows. However, in the case of merchant ships, turbulent flow prevails (
> 10
6) and the flow velocity at distance y from the solid surface is proportional to
(y/δ
)1/n, where δ is the thickness of the boundary layer and exponent n increases with
. For 10
6 <
< 10
7, n = 7 approximately, and the frictional resistance coefficient
is estimated by the ITTC 1957 formula [
1]:
where
RF: frictional resistance
ρ: density of fluid
S: wetted surface
V: ship speed
Roughness of a ship’s hull, mainly caused by hull fouling (Townsin, 2003) [
16] and corrosion (Tezdogan and Demirel, 2014) [
17], can significantly increase ship resistance and hence its fuel consumption and greenhouse gas (GHG) emissions, as well as the cost associated with drydocking (Schultz et al., 2011) [
18]. Accordingly, there have been numerous investigations into the roughness effect on ship resistance from the earliest times to the present. A milestone was the work of Schultz et al. (2007) [
19], who based his study on Granville’s similitude law (Granville, 1958) [
20], as well as the more recent study of Oliveira et al. (2020) [
21]. Demirel et al. (2019) [
22] used Granville’s law to estimate the added resistance due to fouling at various speeds. Chung et al. (2021) [
23] focused on the topology of fouling to estimate an equivalent sand-grain roughness. However, most of the recent studies use Computational Fluid Dynamics (CFD) to evaluate the fouling effect [
24,
25,
26,
27,
28,
29,
30,
31,
32]. Among these papers, Andresson et al. (2020) [
25] reviewed the various methods of modelling roughness, noting the lack of any convergence within the research community towards specific roughness functions and listed the difficulties in correlating fouling with roughness resistance. References [
24,
25,
26,
27,
28] consider homogeneous roughness on the hull while References [
29,
30,
31,
32] study the case of heterogeneous fouling over the wetted surface of the hull. Plessas (2023) [
33] developed a semi-empirical methodology for the estimation of the effect of hull and propeller fouling on the performance of various vessel types and sizes based solely on the observed condition of the hull. Furthermore, Choi et al. (2024) [
4] used CFD calculations to demonstrate that the roughness resistance coefficient defined in the way as the frictional resistance coefficient
CF on Equation (1) is a percentage of that, independently of the ship speed. They found that it can range from 10% up to 85% of
CF depending on the extent of fouling for the DTMB 5415 surface combatant. Analogous results were found by Song et al. (2023) [
5], using CFD calculations for a KCS containership in shallow water. Hakim et (2023) [
2] and Oliveira et al. (2018) [
3] concluded that the hull form does not affect the roughness resistance coefficient. Mohsen and Abozar (2012) [
34] used the scaled model of a Panamax bulk carrier to demonstrate that CFD is in close agreement with the experimental results at model scale. These references provide the major contributions regarding the consequences of fouling on the resistance and powering of ships.
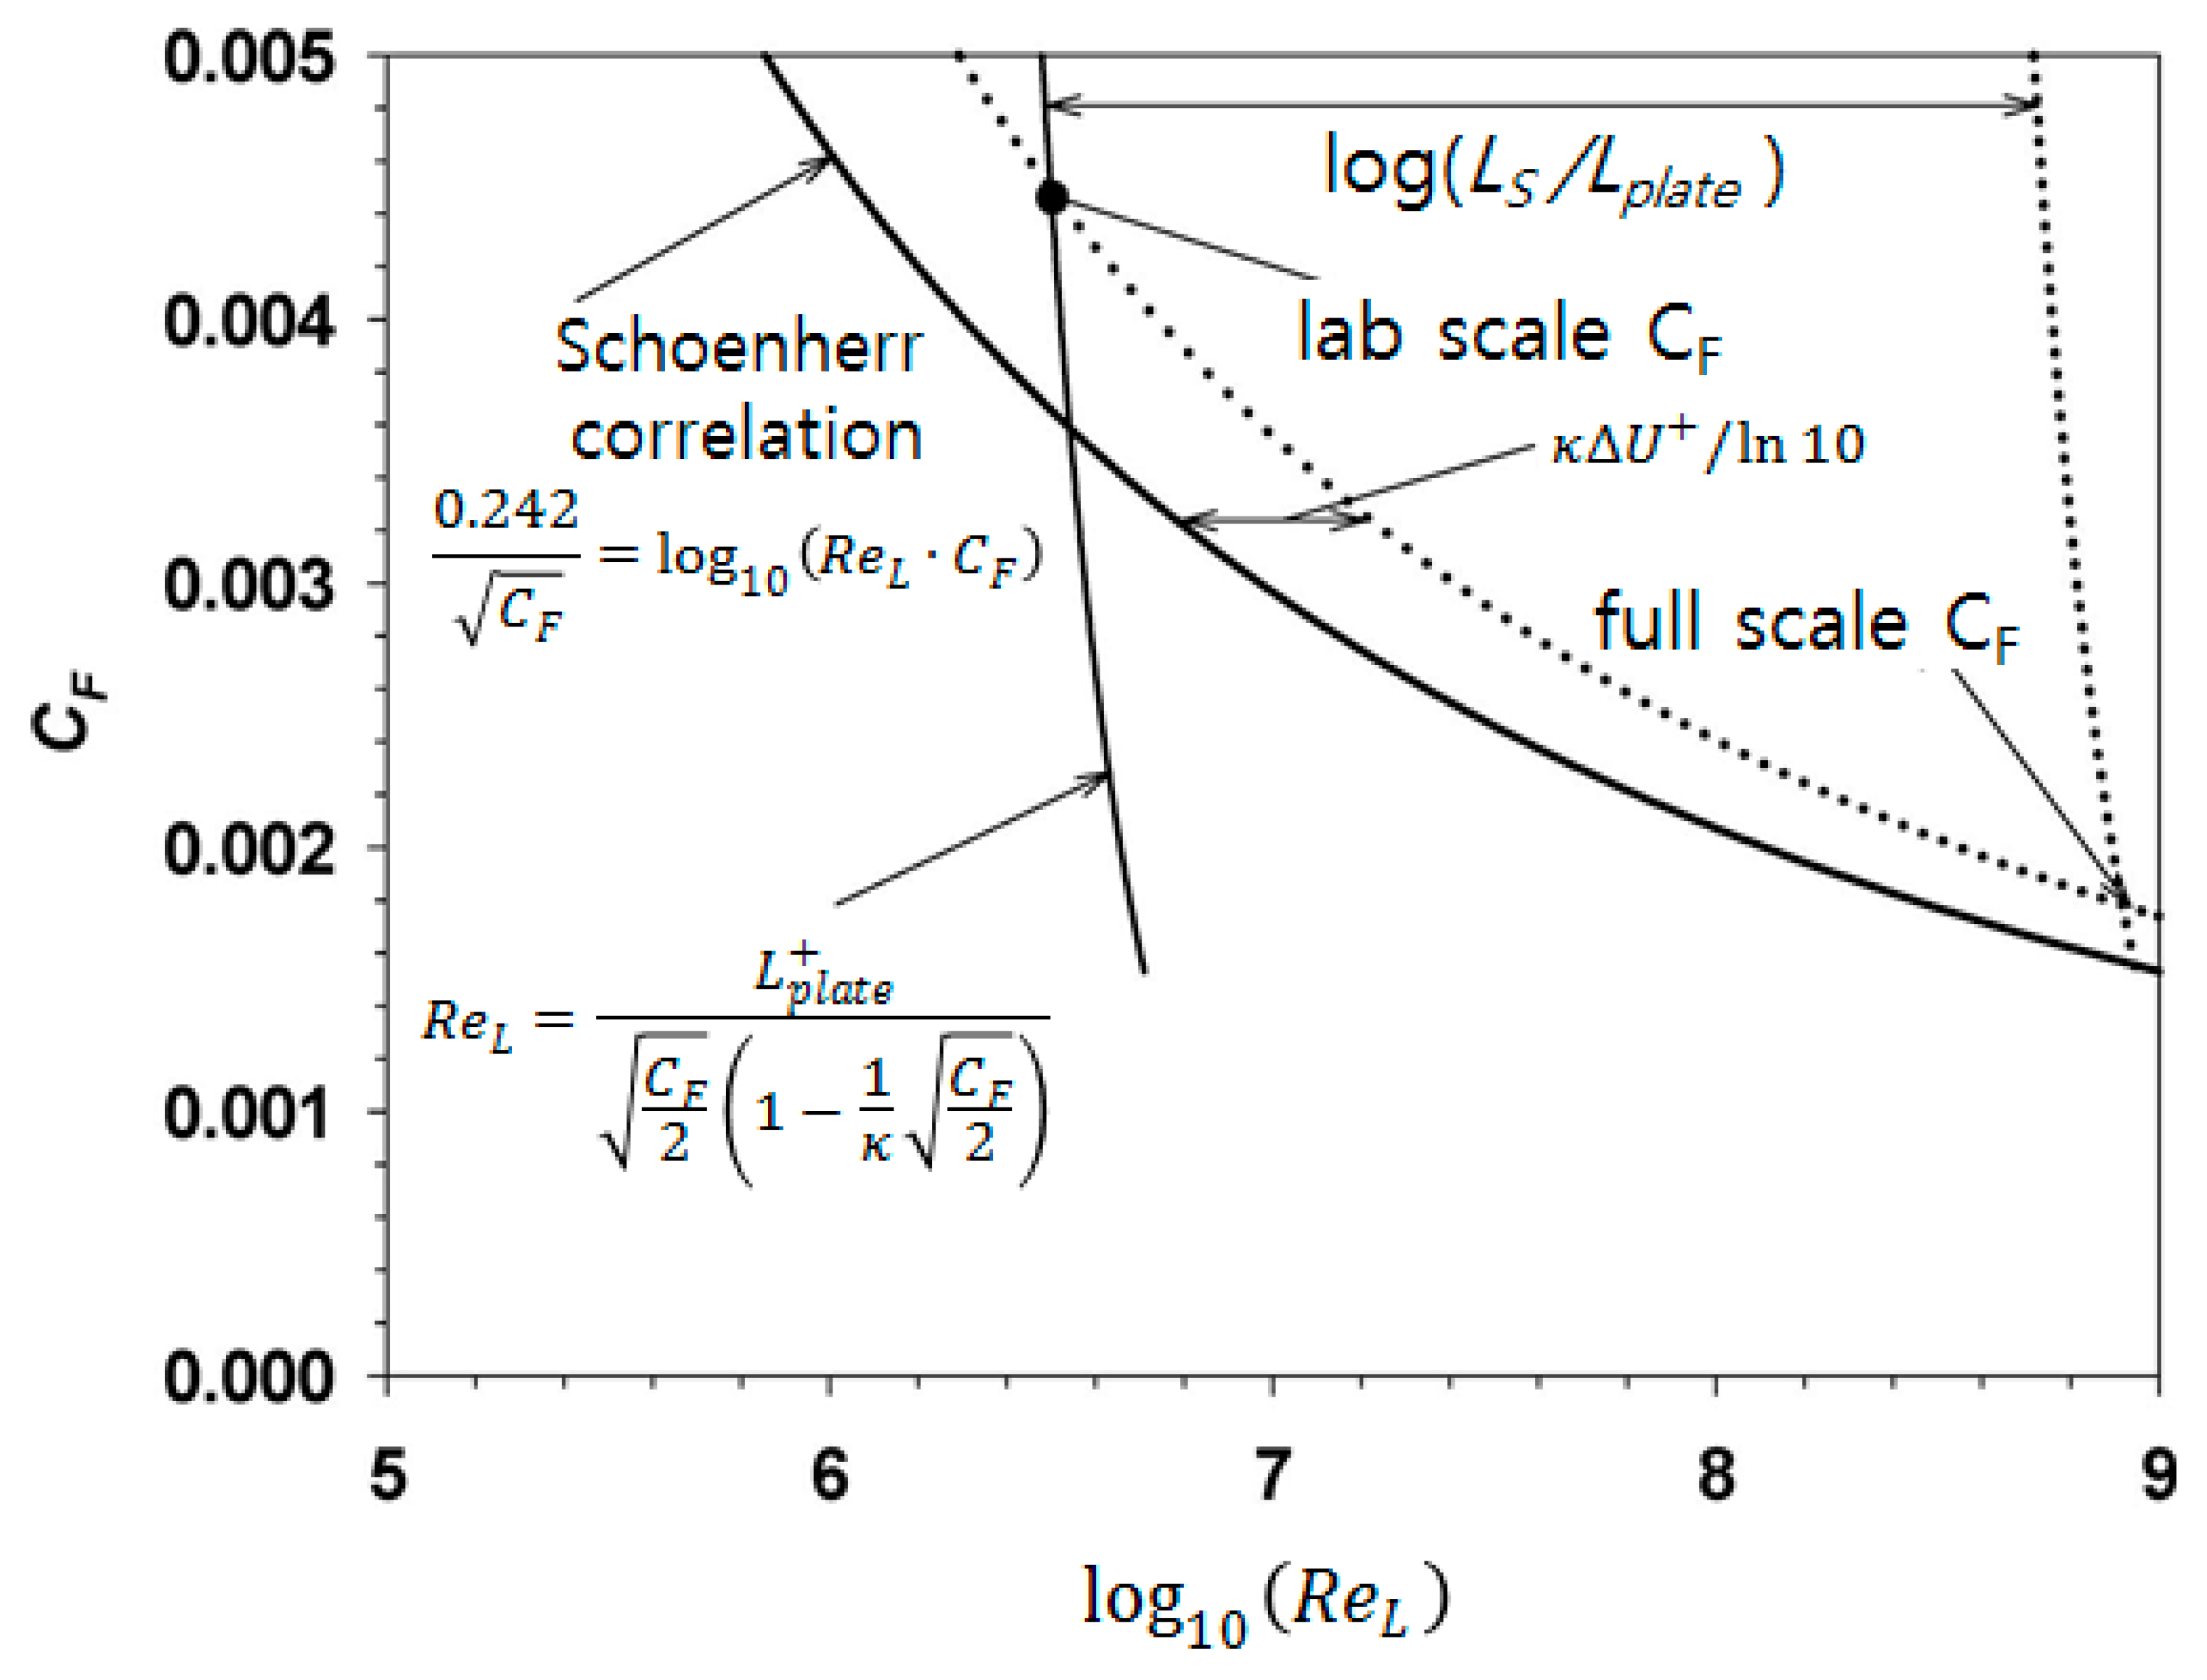
The starting point of the literature on the effect of roughness on ship resistance is the principle of similarity between plates and actual ships proposed by Granville (1958) [
20], which postulates that the horizontal distance of the two curves depicting the frictional resistance coefficient
CF as functions of the Reynolds Number Re, is (
Figure 1):
In (
Figure 1) and in relation (2):
Lplate = the plate length
Ls = the ship length
ΔU+ is related to the increase in the frictional resistance coefficient at ship scale. It is determined from the laboratory hydrodynamic tests.
κ = 0.41, the von Karman constant
ΔCF = CFR − CF is the respective vertical distance at a specific Re and speed V between a rough and a smooth surface.
Figure 1.
Granville’s similarity law for the effect of roughness at model and ship scale [
35].
Figure 1.
Granville’s similarity law for the effect of roughness at model and ship scale [
35].
The increase in
CF due to hull (and plate) roughness depends on the average peak-to-trough heights of the roughness topography. The Δ
CF results in an equal increase in the total resistance coefficient of ships
CT and, consequently, in the total resistance of the ship
RT related to it by an expression like that for
CF:
The scope of this paper is not to investigate the relation between hull roughness topology and an increase in frictional resistance, but to assess the variation in the effect of hull roughness with ship speed. The proposed methodology is described in the next section.
3. Methodology
A vessel is designed to sail at a service speed, depending on its size, its hull form, its type (containership, bulk carrier, tanker, passenger ship, ferry, etc.) and its mission. At this service speed, the main engine of the vessel operates using 85–90% of its Maximum Continuous Rating (MCR), allowing for a margin of 10–15% to compensate for fouling and adverse weather and sea conditions.
Although the above is a reasonable design condition, it cannot be used to manage the ship throughout its service life. This is because the ship sails at reduced speeds for significant portions of her life, either due to the encountered adverse weather and sea conditions, when the available power onboard is not sufficient to maintain the service speed (involuntary speed loss), or because this is specified in the charter contract. Thus, it is very interesting to assess the effect of roughness on her performance at reduced speeds, where the ship spends a significant, if not the major, part of her service life. Since there is no established methodology for reliable estimation of the roughness effect over a specified speed range, even using CFD, it was decided to base its assessment at a reduced speed on the respective effect at service speed.
Following the currently common practice in the hiring of ships, the performance of a vessel is evaluated on a day with good weather, corresponding to wind strength up to 4 Beaufort (BF) and significant wave height HS up to 1.5 m. This performance, which currently provides a reference in the charter contract to specify the penalty or the bonus to be superimposed on the hiring rate of the ship, constitutes the input information to the proposed methodology in this paper.
As far as roughness is concerned, Schultz (2007) [
19] provides
Table 1, which associates NSTM rating with a range of equivalent and average sand roughness. According to the NSTM rating, up to 30 corresponds to soft fouling, while higher ratings correspond to hard fouling. The Manual describes the appearance of the surface and specifies the cleaning process for each rating.
Schulz (2007) [
19] found that FFG-7 with a calm water resistance of 186 KN (Kilo-Newton) and 1160 KN, at 15 kn (knots) and 30 kn, respectively, require about 29.000 KW of power to sail at 30 kn. The effect of the worst fouling condition is to increase resistance by 162 KN and 677 KN, respectively. Since 30 kn = 2 × 15 kn and 677 KN ~ 2
2 × 162 KN, it can be concluded that for the same roughness condition, its effect on resistance is proportional to
VS2. These findings are in line with classical resistance formulation and, although the cubic relation of speed and power (which is a result of the quadratic relation of resistance and speed) has been criticized [
9,
36], the cubic relation is the most rational approach when detailed models and calculations are not practically available. Denoting by Δ
CF the roughness resistance coefficient in line with the definition of the frictional resistance coefficient
CF, we can state:
and since
we can conclude that:
In the above relations:
S = wetted surface of the ship
ρ = seawater density
ΔEHP = increase in Effective Horsepower
ΔSHP = increase in Shaft Horsepower
PC = propulsive coefficient including propeller efficiency
ΔCF = roughness resistance coefficient
FR = index to indicate the effect of roughness on the respective quantity
Following relation (6), the increase in SHP due to fouling, ΔSHPFF, and, therefore, the fuel consumption are proportional to the cube of the ship speed.
Table 1.
Representative fouling conditions and roughness values [
19,
37].
Table 1.
Representative fouling conditions and roughness values [
19,
37].
| Description of Condition | NSTM Rating | Equivalent Sand Roughness (μm) | Average Coating Roughness (μm) |
|---|
| Hydraulically smooth surface | 0 | 0 | 0 |
| Typical as applied AF coating | 0 | 30 | 150 |
| Deteriorated coating or light slime | 10–20 | 100 | 300 |
| Heavy slime | 30 | 300 | 600 |
| Small calcareous fouling or weed | 40–60 | 1000 | 1000 |
| Medium calcareous fouling | 70–80 | 3000 | 3000 |
| Heavy calcareous fouling | 90–100 | 10,000 | 10,000 |
Effect of Fouling at Reduced Speeds
Based on the above analysis, in case an increased fuel consumption Δ
FC1 is reported at a specific ship speed V
1, the corresponding reduction at a reduced speed V
2 should be estimated by the following relation:
In case the ship achieves a reduced speed at the MCR of the main engine due to fouling, the speed reduction Δ
V1 =
V1,EXP(ECTED) −
V1,ACT(UAL) should correspond to the additional power Δ
SHP1 necessary to overcome the resistance due to fouling and reach the expected speed V
EXP, or, equivalently, to the fuel consumption Δ
FC1 spent due to fouling. Following Equation (3):
At the same time, SHP is proportional to the cube of V
S and therefore:
or, equivalently:
By setting:
in Equation (9), we conclude with the following relation:
or equivalently:
4. Calculation of Added Resistance Due to Fouling
Although the cubic relation of power and speed is in line with the established theory, it is important to confirm that the derived formula will not result in significant deviations from “reality” (in this study, “reality” refers to the calculation of added resistance due to fouling based on available experimental and computational results).
More specifically, in order to investigate the expected effect of fouling at different speeds with more detail, the added resistance coefficient will be estimated by utilizing fouling diagrams produced by Demirel et al. [
22] for determining the effect of different types of fouling at various speeds on the effective power of the vessel.
The study follows the formulation of the 1978 IITC Performance prediction method (2021) [
38], where
where
is the total resistance coefficient
is the form factor
is the frictional resistance coefficient
is the roughness resistance coefficient
is the correlation allowance
is the air resistance coefficient
For the calculation of
, ITTC [
38] proposes the use of a formula which will be examined later. In this section, published results regarding the effect of roughness will be used. More specifically, we will utilize the diagrams that have been created by Demirel et al. [
22] which refer to the different types of fouling as categorized in
Table 1. The added resistance diagrams are being used as fouling response surfaces, which can be accessed instantly and provide the requested
for given type of fouling, vessel length and speed.
We want to calculate the difference in power from the baseline case, which is the “Typical as applied anti-fouling coating”. This condition will be referred to as the ‘clean hull’ case (or just ‘clean’), thus the increase in the total resistance coefficient for each type of fouling is formulated as follows:
where
denotes the five different types of fouling, namely “Deteriorated coating or light slime”, “Heavy slime”, “Small calcareous fouling or weed”, “Medium calcareous fouling” or “Heavy calcareous fouling”.
values are extracted from the produced resistance coefficient response surfaces [
23].
The added effective (towing) power due to fouling is estimated as follows:
where,
Thus,
where
i denotes the different types of fouling
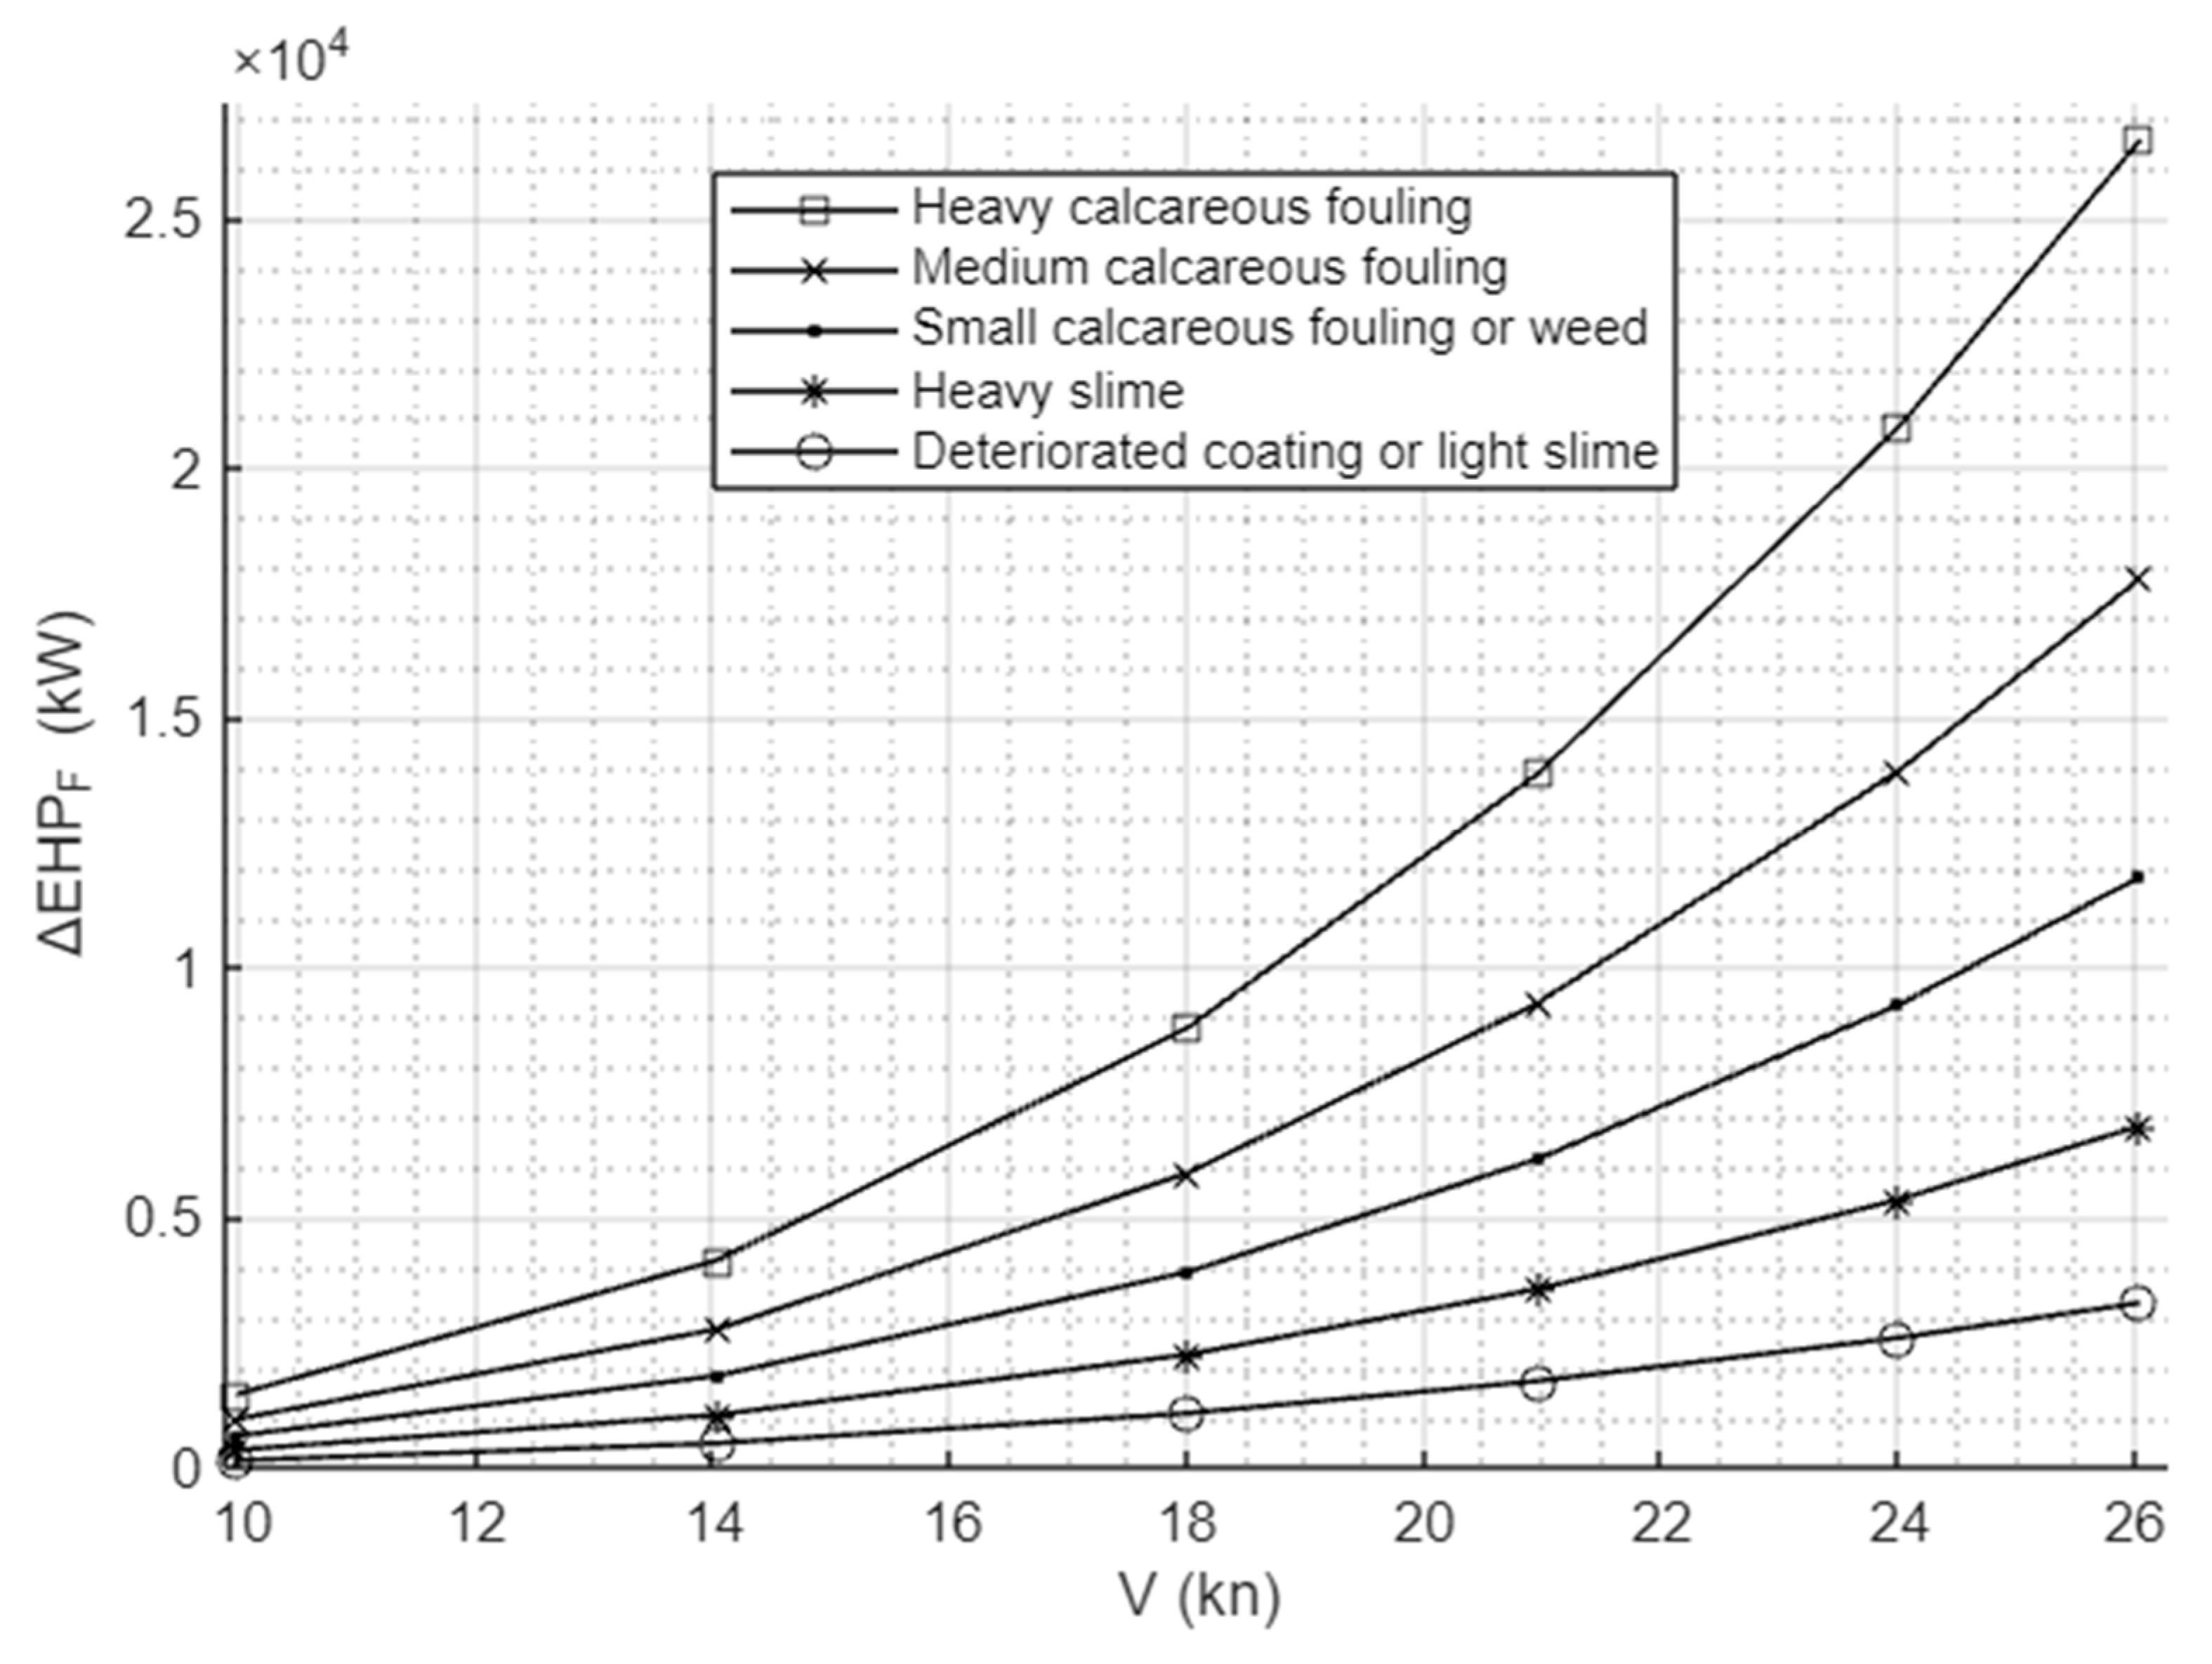
In
Figure 2, the added power due to fouling is calculated for the full-scale KRISO Containership for five types of fouling. The main particulars of the KRISO Containership are presented in
Table 2.
5. Results
Based on the formulation provided in the previous section, we can estimate the effect of fouling on the performance of a ship by simply using the cubic law and confirm its accuracy with the detailed calculations. Of course, the same law is valid for the frictional resistance and, to a large extent, for the total resistance, assuming that the service speed does not exceed
Fn ≈ 0.30 for slender ships. Thus, the power and fuel consumption due to hull roughness are analogous to the cube of speed. At higher
Fn wave resistance,
RW increases at a higher rate than the cubic law, and the same holds true for the total resistance
RT. The relation of power and fuel consumption to the rest of the components of the total resistance of a ship in calm water, i.e., wave, viscous pressure and frictional resistance, is also discussed by Molland et al. (2011) [
41]. However, the wave resistance and the frictional resistance vary also with Froude number and Reynolds number, respectively, in a more complicated way. On the other hand, this behaviour of resistance due to fouling with speed is not limited by
Fn, as is also depicted in the case of the naval combatant, which has a service speed corresponding to
Fn = 0.40. Anyway, the present study focuses on the speed dependence of hull fouling only on ship performance.
Unfortunately, only the two benchmark test cases used in this paper present a reliable and detailed investigation of the speed dependence of roughness resistance. Most of the studies described in the state-of-the-art review are involved in the modelling of roughness resistance by CFD, providing diverging results as noted by Andresson et al. (2020) [
25]. On the other hand, the scope of this study is not to model roughness but to evaluate the effect of fouling for reduced speeds, assuming the recorded effect at one speed, usually the service speed.
Equations (10) and (11) should be used by the shipping companies and the charterers to assess the actual required power and the fuel consumption of ships during the periods of sailing at reduced speed, independently of the reason for this speed reduction (slow steaming or severe sea conditions). It should also be considered in the preparation of charter contracts to specify the performance of hired vessels and the clauses for over- or under-performance.
To demonstrate the significance of the above statements, the results of a case study are presented for the KRISO Containership (KCS). It should be noted that the calculations presented in this study refer primarily to the increase in effective power (EHP) due to hull fouling. The extension of the proposed methodology to shaft power (SHP) and fuel consumption estimation should be made with caution, since variations in propulsive efficiency and Specific Fuel Oil Consumption (SFOC) may occur depending on the operating condition and propulsion system characteristics.
As demonstrated by Degiuli et al. (2024) [
9], for a large containership, the difference in propulsive efficiency for a speed variation of ±5 kn is less than 2%, whereas the difference in SFOC is 5% to 7% for the same speed variation in the examined speed range (17.5 to 25 kn). This implies that the estimation of fuel consumption using the cubic law needs more caution and further validation with onboard measurements. Still, it can be concluded that for moderate speed variations and in cases where no major changes in propulsive efficiency occur within the examined speed range, the cubic-law approximation can provide a reasonable practical estimation for SHP variations. If the difference is higher, then the effect of the change in the
PC should be taken into account.
Actual speed: V1,ACT = 26 kn
Recorded additional power due to fouling at V1,ACT: ΔEHPFR = 3284.4 kW
Expected speed: V1,EXP = 21 kn
Estimated effect of speed reduction in additional power due to fouling from Equation (10):
This means that with Equation (10), the estimated additional power due to fouling at 21 kn is estimated to be (1 − 0.473)∙3284.4 = 1730.9 kW, while the detailed calculation of Δ
EHPFR at 21 kn is 1746.6 kW, which is approximately a −0.9% deviation.
Similarly, the deviation of the cubic law from the calculated value of ΔEHPFR is calculated for all fouling types. It should be noted that it is not realistic for heavily fouled vessels to travel at high speed, but for the sake of uniform presentation of the results, the same speed ranges were used for all fouling cases.
The deviations observed in
Table 3 are less than 5% in most cases. However, the deviation for ‘light slime’ at the lower speed range is close to 10%. This is attributed to the significantly smaller absolute values of added power (232.9 kW) at low speed (11 kn) and light fouling (light slime), resulting in large deviations when expressed percentagewise (23 kW difference corresponds to 9.9% deviation). Thus, the cubic law formula is accurate enough for the purpose of this study, which proposes a quick and practical formula to be used by shipping companies without significant deviation from the “truth” when the effect of fouling at one speed is recorded.
The above indicative case studies demonstrate that the cubic law provides a satisfactory approximation of the expected effect of fouling at different speeds when the effect at one speed is recorded.
6. Further Investigation into the Validity of the Methodology
So far, to prove the validity of the cubic law formula, the roughness resistance coefficient was calculated using the fouling diagrams by Demirel et al. [
22]. But the validity of the derived formula relies on basic principles; thus, it extends beyond the selected methodology of calculating the roughness resistance coefficient.
To demonstrate this, a different formulation of the roughness resistance coefficient is utilized, namely the “roughness allowance” formula by ITTC [
16,
38]:
The same procedure is followed, and the relevant differences are shown in
Table 4.
From
Table 4, it can be observed that the cubic law formula provides satisfactory accuracy with different roughness resistance coefficient estimations; thus, it is not limited to a particular methodology for estimating the roughness resistance coefficient.
It should also be noted that, although the results of the present study focus mainly on one particular ship type and size, it is obvious from the formulation of the problem (Equation (16)) that the calculation of added power due to fouling is mainly affected by the difference between the roughness resistance coefficient for different fouling types, so the methodology may extend to different vessel types and sizes without losing is validity as it has been briefly demonstrated for a naval combatant vessel.
It should also be emphasized that the present study focuses on the variation in the additional power requirement due to fouling relative to the corresponding “clean hull” condition, rather than on the absolute contribution of fouling to the total ship resistance, which may differ considerably among ship types and hull forms. As demonstrated by Demirel et al. [
22], the relative contribution of fouling to the total resistance depends on the hydrodynamic characteristics of each vessel, such as hull fullness, wetted surface area, and operating Froude number. However, the present methodology examines primarily the speed dependence of the fouling-induced performance penalty itself, which follows the scaling behaviour of roughness-induced resistance and may therefore remain applicable to different conventional displacement ship types and sizes.
7. Conclusions
In this paper, a robust methodology has been presented to model the way the effect of fouling varies with speed. The methodology is based on direct evaluation of the respective effects at service speed. Using this methodology it is demonstrated that the effect of fouling on the performance of ships reduces rapidly with speed, and it is almost halved when they operate at 80% of the service speed, either due to slow steaming imposed by the charter contract or due to excessive dynamic responses (voluntary seed reduction) and/or added resistance (involuntary speed loss) in adverse sea and weather conditions. Thus, hull roughness plays a less significant role in the percentage of the hiring period when they sail at speeds well below their service speed. The results provided by the proposed methodology are in very good agreement with the available data from full-scale records of a naval combatant and extensive experimental and CFD calculations for a standard containership used for comparative studies by the scientific community on ship hydrodynamics. Tests with scaled models are used to validate CFD calculations only at low Reynolds numbers, while actual ships operate at Re 10
2 to 10
3 times higher. Furthermore, as is demonstrated in the state-of-the-art review in
Section 2, available CFD calculations encounter difficulties in providing the variation in roughness effect with ship speed.
Nowadays, when the cost of fuel is quite high, and the strict regulations issued by the maritime organizations impose taxes on excessive fuel consumption, maritime companies have a tool to estimate it at any time, based on the actual roughness condition of the hull fouling at that time. The effect of fouling on the propeller is much more easily monitored and remedied by underwater cleaning, whenever it is necessary, and in general, more frequently than the cleaning of the hull, which necessitates dry-docking.
The findings of this study should be considered by the shipping companies:
to optimize the dry-docking plan of the vessel in conjunction with the properties of the coatings used,
to estimate the overall fuel consumption of a ship on a specific trip and the respective annual fuel consumption
to prepare realistic charter contracts and present them to the charterers.
Shipping companies should examine alternative scenarios of ship operation on the basis of freight rate, contract speed and hull condition and schedule dry-dockings or even proactive underwater hull cleaning, taking into account the recorded effect of hull roughness on vessel performance. Nowadays, as data regarding ship performance are becoming quite accurate and are instantly available at the office, shipping companies can leverage these insights to schedule additional proactive hull cleanings in between the dry-dockings.
These findings confirm that the overall performance of a cargo vessel in terms of fuel consumption and emission of GHG depends mainly on the optimization of its hull form design to achieve minimum resistance (and propulsion) in calm water and in sea states where added resistance is superimposed on the one in calm sea. The ship owner should keep track of the extent of fouling, especially when the ship operates in calm seas most of the hiring period. Finally, the underwater cleaning of the propeller should be scheduled once or twice per year, since it leads to significant benefits at relatively low expenses.
Future work may include further validation of the proposed methodology using real onboard performance measurements from various vessel types operating under different operational and environmental conditions. The increasing availability of high-frequency ship performance monitoring data is expected to support more detailed investigation of fouling effects under realistic service conditions. In this context, data-driven and statistical techniques, such as neural-network-based predictive maintenance [
42], could complement the present resistance-based methodology by supporting more efficient maintenance scheduling and resource allocation, and thus contribute to fuel savings and operational optimization with minimal resource expenditure.