Abstract
As offshore wind energy industry advances into deeper water recently, jacket foundations become one of the predominant support structure types for far-sea wind farms. To ensure the safety and reliability of offshore wind turbine (OWT) jacket foundations in the complex environments of far-seas, the investigation of their resistance capabilities to extreme ocean wave is essential. In this study, the OWT jacket foundations in the sea area of Cangnan and Lianjiang are adopted to conduct a typical case study. This study employs a full-scale jacket foundation to carry out some full-scenario, large-scale hydrodynamic numerical simulations considering the combined action of wave and current. It is revealed that for OWT jacket foundations in Cangnan and Lianjiang, China, under an extreme condition with approximately 26 m wave height and 18 s wave period, the peak wave impact and horizontal force on the jacket foundation are approximately 190 kPa and 18,000 kN, respectively. Furthermore, this study discusses the wave profile evolution characteristics around the jacket foundation and the correlation between wave run-up and wave height. These findings provide a good case study and technical reference for the full-scale fine simulation of wave forces on OWT jacket foundations in far-sea areas.
1. Introduction
To maximize offshore wind energy exploitation, wind farm development is advancing toward far-sea regions. Beyond widely implemented monopile foundations, jacket foundations are emerging as a primary support structure for deep-water installations. When deployed in deep-water environments, such foundations experience significantly more complex and severe hydrodynamic loads. Extreme wave impacts may induce structural fatigue damage, resonance responses, and cumulative lateral seabed deformations, compromising wind turbine’s safety and stability. Consequently, investigating wave–current load characteristics and wave run-up on deep-water offshore wind turbine (OWT) jacket foundations carries critical engineering significance for enhancing design reliability, operational safety, and lifecycle cost efficiency.
Within the field of ocean engineering, domestic and international scholars have conducted research on the hydrodynamic response of multi-pile foundations and jacket foundations for OWTs, primarily employing model tests and numerical simulations.
In experimental research, Jose et al. [1] analyzed the influence of wave parameters on impact forces and slamming coefficients based on measured wave impact force data on jacket structural members. However, they directly applied a monopile slamming force model to jacket members without validating its applicability to complex spatial truss structures. Furthermore, their conclusions were derived solely from a specific seabed slope (10%), thus limiting the generalizability of the findings. Hildebrandt and Schlurmann [2] experimentally investigated breaking wave forces acting on tripod-type support structures and established the relationship between breaking wave types and slamming coefficients. Liu et al. [3] also conducted wave flume tests to investigate the dynamic response of seabed around tripod turbine foundations under dynamic wave pressure. It is found that the wave force acting on the tripod structure varies with different arrangements. Chatjigeorgiou et al. [4] studied the hydrodynamic characteristics of a three-legged jacket support system under both linear and nonlinear waves through 1:18 scale physical model tests, to validate their numerical results by finite element method. They found good agreement between numerical and experimental results across different wave heights, though wave breaking scenarios were not considered in the study. Lan [5] conducted experimental research on the hydrodynamic characteristics of monopile and pile-group cap structures under combined wave–current actions. The study discussed the impact of both regular and irregular waves on the pile cap, summarizing the variation patterns of the pile cap effect coefficient and the group pile effect coefficient with the Keulegan–Carpenter (KC) number. Cong et al. [6] performed experimental studies on wave run-up phenomena around a four-pile platform. They observed significant fluid resonance within the multi-pile structure under specific incident wave periods, leading to a substantially elevated water level at the downstream pile legs. However, their numerical validation employed potential flow theory and did not account for the influence of fluid viscosity on wave height attenuation, potentially resulting in an overestimation of the actual wave height. With regard to the impact characteristics of jacket structures subjected to focused wave conditions, Sruthi and Sriram [7] performed a series of wave flume experiments to systematically examine the influence of wave-breaking locations on the magnitude and distribution of impact forces acting on the structures. On this basis, they proposed an enhanced methodology for evaluating wave-induced impact forces on jackets, together with a refined estimation of the slamming coefficient Cs. Santo et al. [8] employed a 1:80 scale physical model of a jacket structure in basin experiments to investigate the wave–current blockage effect under extreme wave conditions. Their findings indicate that existing design guidelines may substantially overestimate the peak forces induced by extreme waves.
In terms of numerical simulation, Abdel Raheem and Abdel Aal [9] employed the finite element method and the Morison equation, considering the influence of different wave approach angles, to investigate the stress and displacement response of a jacket platform under extreme waves and combined wave–current actions. Their results indicated that the incident angle significantly affected the joint displacements, and the displacement response increased nonlinearly along the height of the jacket. However, they did not account for the effects of transient impact loads such as wave slamming. Similarly, Li et al. [10] and Zhang and Liu [11] utilized the Morison equation to model wave loads or combined wave–current loads, simulating the dynamic response of jacket platforms under various wave approach angles, wave heights, and periods using the finite element software ANSYS. Their studies found that under different wave conditions, the maximum member stresses consistently concentrated at three locations: the intersection of the main piles with the seabed, the diagonal braces near the free surface, and the midpoints of the horizontal braces. Tu et al. [12] developed, for the first time based on extensive experimental data, a global slamming force model for jacket structures, addressing the limitations of traditional cylindrical models. Nevertheless, its reliability in non-shallow water regions remains unverified. Han [13] used SACS to analyze the fatigue performance of an OWT jacket structure under wind and wave loads, proposing optimized design parameters for stiffening rings. However, this study considered only a single wave condition and did not account for extreme scenarios. Guan [14] conducted, for the first time using the open-source computational fluid dynamics (CFD) code OpenFOAM, a detailed simulation of a composite bucket foundation under coupled wave–current loads, revealing the force distribution patterns on the foundation and the surrounding flow characteristics. However, the developed numerical wave tank exhibited issues such as unstable wave surfaces and reduced computational efficiency due to sponge layer wave absorption. Furthermore, it also failed to consider extreme wave conditions. Liu [15] established a finite element model based on a 1:50 scale physical model, conducting numerical simulations of the static and dynamic responses of a jacket platform under wind loads, wave loads, and seismic actions. The results showed that displacement, velocity, and acceleration responses reached their maxima at the platform top, while structural vulnerabilities were located at the bottom pile legs. Although the study involved multiple external loads, it did not couple wind, wave, and seismic actions and lacked validation against physical model tests. Xu and Peng [16] analyzed the wave-induced dynamic characteristics of an OWT jacket foundation using random wave theory and the modal superposition method. They found that in deeper waters, the dynamic response of the jacket foundation significantly exceeded the static results calculated using theoretical formulas. Zhu et al. [17] adopted ABAQUS to study the lateral loading behavior of tetrapod piled jacket foundations in undrained clay, while the complex lateral loads were simplified to an equivalent lateral load acting at a certain height of the jacket in their simulation. Asgarian et al. [18] conducted a case study to explore the failure modes of jacket offshore platform under wave loading utilizing OpenSees. The wave loading was also obtained adopting Morison equation and considered as the lateral load exerted on the platform. It is concluded that the structural factors such as pile size is the most influential factor on the failure mode.
Overall, the works on the hydrodynamic response of multi-pile foundations and jacket foundations for wind turbines has achieved certain progress, both in terms of physical model tests and numerical studies. However, the hydrodynamic characteristics of jacket foundations located in deep-water regions under extreme sea conditions remain insufficiently investigated. By integrating actual site-specific operational and extreme conditions, large-scale, full-size numerical computational analyses will be conducted in this study. The research will focus on the wave run-up around the jacket foundation, and the wave–current impact characteristics of jacket foundations in deep waters, particularly the peak wave pressure and the resultant impact force on the jacket structure. The findings are intended to provide fundamental data and references for the design, construction, operation, and maintenance of deep-water OWT support structures.
2. Numerical Model
2.1. Governing Equation
To investigate the hydrodynamic characteristics of jacket foundations under combined wave–current actions in far-sea environments, this study employs the solver OlaFlow [19] developed by Higuera et al. [20] based on the open-source CFD code OpenFOAM. Its governing equations are the Volume-Averaged Reynolds-Averaged Navier–Stokes (VARANS) equations that consider the drag force of seepage flow in porous media. However, since the cases in this project do not involve porous media and the porosity is uniformly 1, the governing equations degenerate into the Reynolds-Averaged Navier–Stokes (RANS) equations:
where represents velocity vectors; is fluid density; is fluid pressure; is body force vector; refers to the effective viscosity of fluid, in which represents the dynamic viscosity and is the turbulent viscosity; and corresponds to external forces, such as the surface tension.
To capture the free surface for the two-phase flow, VOF method is employed in OlaFlow. The coefficient is an indicator that represents the volume of water in each cell. = 0 indicates the cell is full of air; = 1 indicates the cell is full of water; if is between 0 and 1, then the cell is at the interface of air and water. The indicator can be determined by the following equation:
The physical properties in every cell can be averagely characterized by the following equation, taking the density as an example,
in which and is the density of water and air, respectively. In this study, is 1000 kg/m3; is 1 kg/m3.
2.2. Numerical Verification
In order to calibrate the reliability of OlaFlow model, the experimental results obtained by Zang et al. [21] are adopted to conduct numerical verification. Zang et al. [21] conducted experimental investigations on the interaction between regular waves and a monopile foundation under three operational cases in a flume with dimensions of 35 m length, 25 m width, and 1.8 m height. During the experiments, the water depth in the flume was maintained constant at 0.505 m. The cylinder extended vertically downward to the flume bottom, leaving a 1 mm gap beneath it. The cylinder was positioned 7.8 m from the wave generator. Pressure transducers were installed at four vertical locations along the stagnation point line upstream of the cylinder. An Acoustic Doppler Velocimeter (ADV) was utilized to measure wave kinematics, while an array wave gauge monitored the wave field surrounding the cylinder. Detailed parameter configurations are illustrated in Figure 1, with corresponding wave parameters tabulated in Table 1.
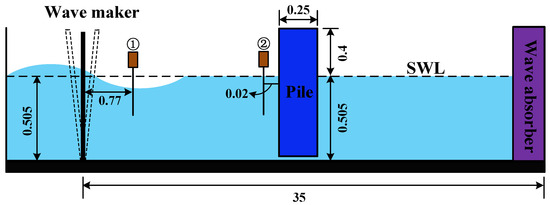
Figure 1.
Schematic diagram of the flume experimental setup for wave-monopile interaction conducted by Zang et al. [21] (① and ② denote wave gauges).

Table 1.
Wave parameters of the flume experiments on monopile-regular wave interaction conducted by Zang et al. [21].
Figure 2 and Figure 3 present time history comparisons of simulated wave heights and horizontal wave forces from OlaFlow against experiment data under different wave conditions. The simulated results show close agreement with experimental measurements, validating the solver’s capability for modeling wave-structure interactions.
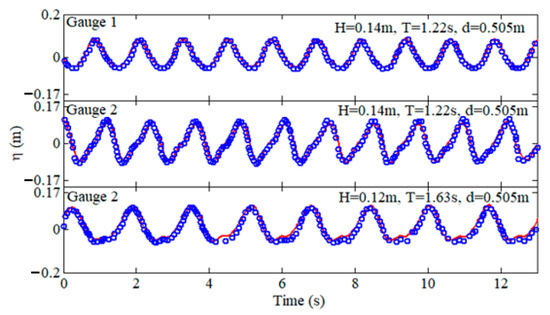
Figure 2.
Comparison of wave profile obtained by OlaFlow against experiment results measured by Zang et al. [21] ( Numerical results
  Experiment results).
Numerical results Experiment results).
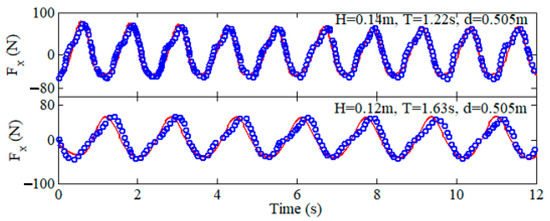
Figure 3.
Comparison of horizontal wave forces obtained by OlaFlow against experiment results measured by Zang et al. [21] ( Numerical results Experiment results).
Numerical results Experiment results).
To further validate the OlaFlow model, the numerical results were compared with the experimental results by Liu et al. [3]. Liu et al. [3] conducted a study of wave dynamics for a tripod pile foundation in a flume with dimensions of 50 m length, 1 m width, and 1.5 m height at Hohai University. The basic setup of the flume test, the location of the tripod pile foundation, and the wave monitoring points are shown in Figure 4a,b, respectively. Figure 5 shows that the numerical results are in good agreement with experimental measurements, which further confirms the reliability of OlaFlow and supports its use in subsequent numerical investigations of jacket foundations.
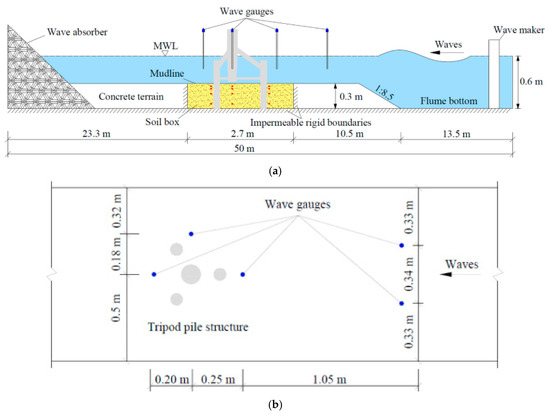
Figure 4.
Experimental setup in Liu et al. [3] (a) wave flume; (b) location of wave gauges.
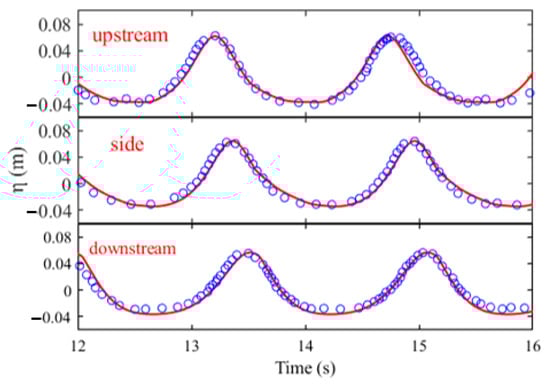
Figure 5.
Comparison of wave profiles predicted by OlaFlow against experiment results measured by Liu et al. [3] ( Numerical results Experiment results).
Numerical results Experiment results).
2.3. Extraction of Horizontal Force and Overturning Moment
Given the high-resolution computational meshes used in the jacket foundation simulations, this study proposes an efficient algorithm to extract the integrated horizontal force and overturning moment acting on the structure. The method utilizes a characteristic of OpenFOAM output files, where pressure fields consist primarily of values located at the centroids of internal and boundary cells. By identifying specific field tags, pressure data defined on boundary patches are efficiently retrieved. A spatial-matching procedure is then employed to extract the surface pressure distribution on the structural wetted boundaries. This strategy eliminates the need for exhaustive domain-wide searches and thereby enhances computational efficiency, particularly in large-scale simulations. The hydrodynamic loads are subsequently computed via surface pressure integration. The method is robust, accurate, and particularly effective for complex offshore geometries with extensive mesh resolutions. The key procedures are outlined as follows:
(I) The structural surface is re-meshed into a number of tetrahedral elements. Cells that possess at least one triangular face located on the structure’s surface are identified and marked as valid elements, as shown in Figure 6. These triangular faces are considered as the exterior surfaces of the valid elements. Using interpolation and nearest-point matching, the computed pressure results are then assigned to the triangular surface nodes of the re-meshed structural model.
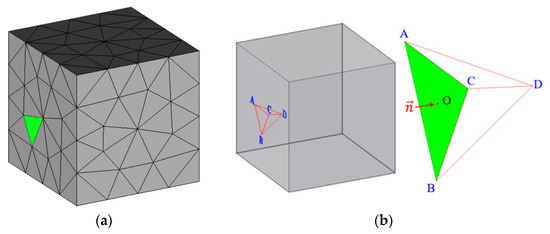
Figure 6.
Example of the re-meshed structural mesh (a) External surfaces of valid elements; (b) Normal vector of the external surfaces.
(II) The force components in the x, y, and z directions acting on the exterior surface of the ith valid element are calculated using the following Equations (3)–(5):
where Si denotes the area of the external surface of the ith valid element; pi(xi, yi, zi) represents the pressure acting at the centroid of the external surface of the ith valid element; , , and are the components of the outward normal vector (pointing inward toward the structure) of the ith element’s external surface in the x, y, and z directions, respectively. By integrating the x-, y-, and z-directional forces over all valid external surfaces, Horizontal force components , , and acting on the entire structure can be obtained. The overall moment acting on the structure can then be further calculated based on these forces.
2.4. Design SOFTWARE SESAM
In order to systematically investigate the result discrepancies between industrial design softwares and CFD programs in this large-scale, full-scenario computational analysis of structural loads, this study also employs the design software Sesam 2022, which is an offshore engineering design software widely utilized in industry, to perform the design analyses on the same jacket structure in a comparative manner.
Sesam is a structural analysis software launched by Det Norske Veritas (DNV) of Norway in 1969. It is primarily used for the design and strength analysis of ships and offshore structures. The software comprises three core modules: DeepC (for coupled mooring analysis of deep-water floating systems), GeniE (for plate/beam structure analysis of fixed offshore platforms), and HydroD (for hydrodynamic analysis of ships and mobile offshore platforms). It supports the entire lifecycle management of marine structures, from initial design to decommissioning.
In Sesam-based simulations, users are required to specify the structural geometry, wave conditions, and the theoretical framework for hydrodynamic load estimation, including wave run-up prediction. The hydrodynamic analysis is primarily based on potential flow theory combined with some engineering simplification methods, as opposed to high-fidelity CFD simulations that resolve the detailed flow field.
For the computational scenarios considered in this study, the application of Sesam in structural design involves first constructing the offshore jacket model in the GeniE module, where material properties, cross-sectional characteristics, and boundary conditions are defined. The resulting structural model is then transferred to the Wajac module, which is based on the Morison equation and dedicated to the calculation of wave and wind loads on jacket structures. Within Wajac, either regular or irregular wave theory is selected, wave height, period, and direction are specified, current velocity and directional parameters are prescribed, and appropriate drag and inertia coefficients are assigned to the structural members. On this basis, hydrodynamic analyses are performed to determine the loading characteristics of the jacket foundation.
3. Geometric Model, Mesh, and Parameters
To advance offshore wind energy exploitation in southeastern China, deep-sea wind farm construction projects have been initiated in the adjacent waters of Cangnan County in Zhejiang Province and Lianjiang County in Fujian Province, China. The Locations of Cangnan County and Lianjiang County are shown in Figure 7. Taking the Lianjiang offshore wind farm as an example, a total of 39 wind turbines have been installed, with a combined capacity of 700 MW. Due to its location in deep-sea waters, 32 of the 39 turbines adopt jacket foundations as support structures to ensure the safety and reliability of the superstructure.
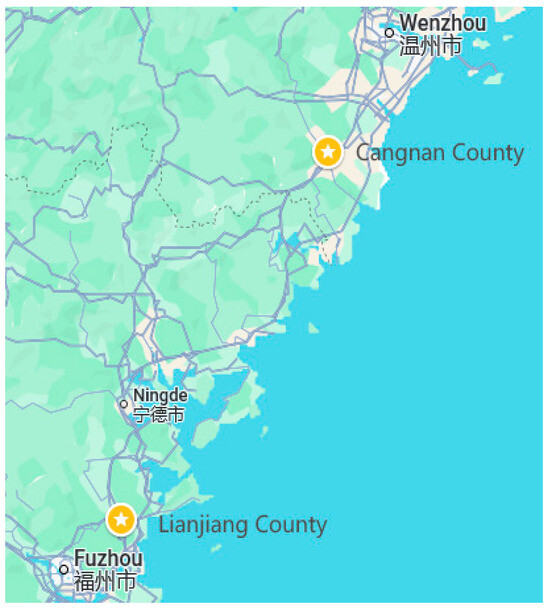
Figure 7.
Locations of Cangnan County and Lianjiang County in China.
To ensure model accuracy and reliability, three-dimensional jacket models were constructed based on the actual geometric parameters of deep-water jackets from the Cangnan and Lianjiang offshore wind farms, as illustrated in Figure 8. The Cangnan jacket foundation stands at 90 m height with a maximum leg diameter of 3.9 m and bottom-center leg spacing of 35 m, while the Lianjiang foundation measures 67.7 m height with maximum leg diameter of 2.7 m and bottom-center leg spacing of 30 m. During the simulation, the mesh grids within the region occupied by the jacket structure are excised. The resulting geometric contour is accordingly treated as a wall boundary, meaning the structure is fixed.
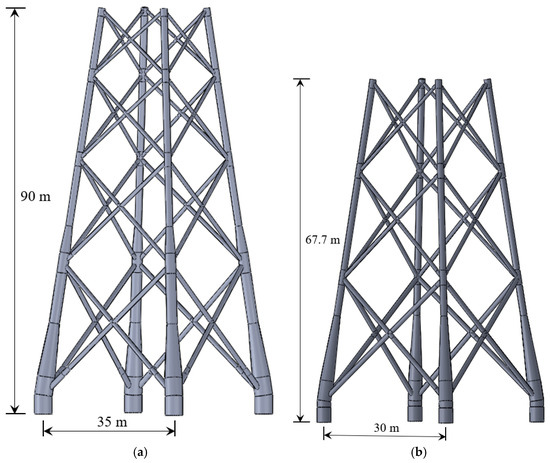
Figure 8.
Schematic diagrams of the geometric models for the two jacket foundations (a) Jacket foundation in Cangnan offshore wind farms; (b) Jacket foundation in Lianjiang offshore wind farms.
The wave condition parameters adopted in this study were proposed by the design company based on the specific oceanic conditions at the site, and the parameters for operational and extreme conditions—including initial water depth, significant wave height, peak wave period, and current velocity—are provided in Table 2.
Table 2.
Wave conditions for jacket foundations in Cangnan and Lianjiang offshore wind farms.
The intersection point of the center points of the jacket legs is taken as the whole reference point (0, 0, 0). Regarding the configuration of the computational domain, for each case, the origin is defined at the intersection point of the centerlines connecting the bottom legs of the jacket structure. The fluid domain extends approximately 1.5–2.0 wavelengths upstream (in the negative x-direction) and 0.5 wavelengths downstream (in the positive x-direction) along the wave propagation direction (x-axis). Taking the Cangnan jacket under operating conditions as an example, the corresponding wavelength is approximately 185 m. Consequently, the computational domain extends 370 m from the center of the jacket to the left boundary, and 90 m to the right boundary. In the direction perpendicular to the plane of the paper (y-axis), the domain extends 30 m both forward and backward. In the vertical direction (z-axis), the domain height is determined based on the specific height of the individual jacket structure under consideration.
To monitor the wave evolution process before and after impacting the jacket, four wave elevation probes were established near the jacket structure, as illustrated in Figure 9a. Monitoring probes G1, G2, and G4 are positioned along the y-direction centerline, with G1 located at a greater distance from the jacket. Probe G3 is situated laterally adjacent to the jacket. Exact coordinates relative to the jacket center are provided in Table 3. Additionally, twenty pressure monitoring sensors were deployed on the jacket structure (Figure 9b) to capture wave impact characteristics at critical locations under various wave conditions. The spatial coordinates of these sensors for the Cangnan wind turbine jacket foundation under operating wave conditions are detailed in Table 4.
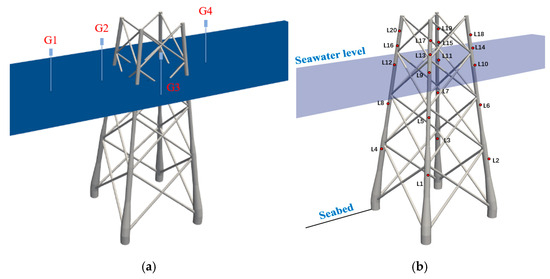
Figure 9.
Monitoring points setup around the wind turbine jacket foundation (Cangnan) (a) Wave gauges; (b) Wave impact sensors.
Table 3.
Position of the monitoring point for the wave profile.
Table 4.
Position of the monitoring points for wave impact as shown in Figure 6a (Cangnan wind turbine jacket foundation under operating wave conditions).
To ensure reliability in wave-structure hydrodynamic computations, local mesh refinement was implemented around the jacket foundations. For conciseness, only the fluid domain mesh near the Cangnan jacket under operational conditions is shown in Figure 10. The number of grid cells and the minimum size for each case in this study are shown in Table 5. Among them, the extreme wave condition mesh for the Cangnan jacket foundation peaked at 62 million cells. Prior tests had been conducted with varying mesh sizes. The final selection of the mesh dimensions and cell counts presented in this study was determined through a balanced consideration of computational efficiency and result convergence, specifically tailored for the case studies on jackets in different locations.
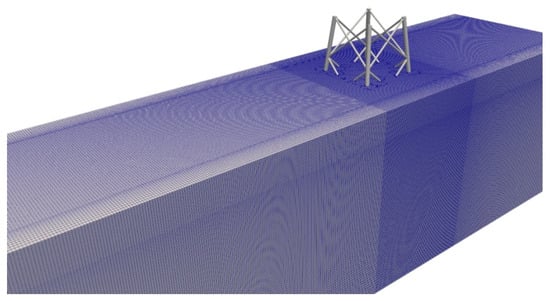
Figure 10.
Mesh near the jacket foundation (Cangnan operating condition).
Table 5.
Mesh parameters of the wind turbine jacket foundations at Cangnan and Lianjiang.
The adoption of complex 3D jacket models necessitates an extensive fluid domain, where conventional relaxation zones would excessively extend the computational domain, causing prohibitive mesh quantities and severe computational inefficiency. To mitigate the adverse effects of wave reflection on computational results while maintaining computational efficiency across various conditions. Therefore, this study implemented active wave absorption boundaries (Higuera et al. [20], Higuera et al. [22]). The computational domain features a wave generation boundary on the left, about 1.5–2.0 wavelengths away from the center of the jacket, and an active absorption boundary implemented on the right, about half the wavelength. In addition, the computational domain is configured with an open boundary at the top, a wall boundary at the bottom, and active absorption boundaries at the front and back.
The selection of appropriate turbulence models is essential for ensuring the accuracy of CFD simulations, particularly in the context of wave-structure interactions. Previous studies (Larsen and Fuhrman [23], Zhou and Ye [24], Zhou sand Ye [25]) have shown that the stabilized k-ω SST model exhibits improved performance over conventional k-ε and k-ω models, especially in suppressing excessive turbulent kinetic energy near free surfaces. This enhancement enables more reliable prediction of complex wave kinematics and hydrodynamic impact phenomena. Accordingly, the stabilized k-ω SST model was employed in all simulation cases conducted in this study.
In this study, the simulation duration for each case was set to eight wave periods, with a sampling interval of 0.2 s for computational results. The solver employed an adaptive time-stepping scheme, wherein the time step for each iteration was constrained by the Courant number. In computational fluid dynamics, an excessively small Courant number results in significantly diminished computational efficiency, while an excessively large value may lead to numerical instability and divergence. After a few tests, the maximum Courant number for all cases was set to 0.25 to balance the numerical stability and computational efficiency.
4. Results Analysis
This chapter presents detailed analyses of wave transformation processes, wave run-up characteristics, and structural wave loads on jacket foundations at the Cangnan and Lianjiang offshore wind farms under both operating and extreme wave conditions.
4.1. Wave Profile Evolution
Figure 11 presents the simulated time series of wave profile evolution near the jacket foundations at the Cangnan and Lianjiang offshore wind farms. Under operating conditions, the wave profiles at monitoring points G1 (far upstream) and G3 (lateral to the structure) exhibit minimal variation for all jackets. In contrast, at G2—immediately upstream of the jackets—progressive wave crest steepening is evident, resulting from constructive interference and localized wave reflection. At G4, diffraction effects dominate the wave field due to the relatively small diameter of the structural members compared to the incident wavelengths, leading to localized wave height amplification behind the jackets through energy redistribution around the structure.
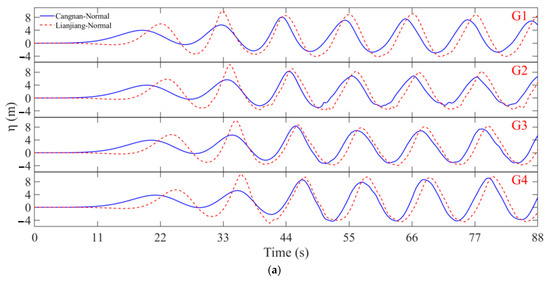
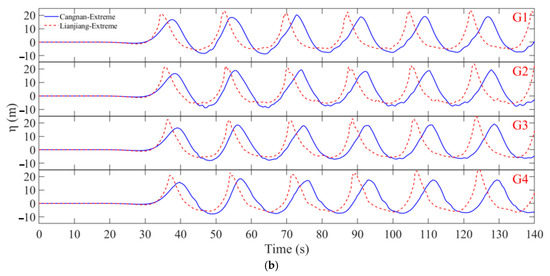
Figure 11.
Wave profile evolution near the wind turbine jacket foundation at Cangnan and Lianjiang (a) Operating wave condition; (b) Extreme wave condition.
Under extreme wave conditions, pronounced crest steepening is primarily observed at G2 in the Cangnan case, highlighting intensified wave-structure interactions. In contrast, the Lianjiang case exhibits notable crest attenuation at G2, G3, and G4, which suggests significant wave profile distortion caused by highly nonlinear phenomena, including wave impact, breaking, and reflection.
Representative wave run-up patterns on the Cangnan jacket under both operating and extreme wave conditions are illustrated in Figure 12. In this study, wave run-up is quantified as the maximum vertical excursion of the water surface above the still water level (SWL), consistent with standard hydrodynamic definitions.
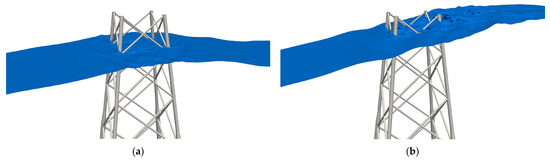
Figure 12.
Wave run-up on the wind turbine jacket foundation at Cangnan at typical moment (a) Operating wave condition; (b) Extreme wave condition.
Based on the aforementioned definition, the maximum wave run-up values and corresponding R/Hs ratios for the jacket foundations at the Cangnan and Lianjiang sites under various conditions are summarized in Table 6. According to the American Petroleum Institute (API) recommendations, no explicit upper limit is prescribed for the wave run-up ratio. However, in offshore engineering practice, an empirical range of 1.5–2.0 is commonly adopted to provide a conservative estimate for the design of marine structures. In the present study, the computed R/Hs values range from 0.70 to 0.83, with an average of 0.77. These values fall well below the conservative design threshold and are considered acceptable from the perspective of structural wave run-up safety.
Table 6.
Wave run-up and its ratio to the significant wave height under different wave conditions.
4.2. Wave Impact
Wave-induced loads on jacket foundations are critical considerations in the structural design of offshore wind turbine support structures. This section presents the computed dynamic wave pressures, horizontal forces, and overturning moments at selected monitoring points under various wave conditions, serving as the basis for further analysis of the hydrodynamic responses of the jacket foundations.
As wave impacts near the top and base of the jacket are relatively limited, Figure 13 presents the dynamic wave pressure time histories (excluding hydrostatic pressure) at three vertical sensor tiers located near SWL: L5–L8, L9–L12, and L13–L16, under extreme wave conditions. Peak dynamic pressures are observed at all SWL-adjacent sensor locations under both operating and extreme wave conditions, indicating concentrated wave loading near the free surface. Table 7 summarizes the maximum dynamic pressures obtained at sensor group L9–L12 over representative wave cycles for various wave conditions.
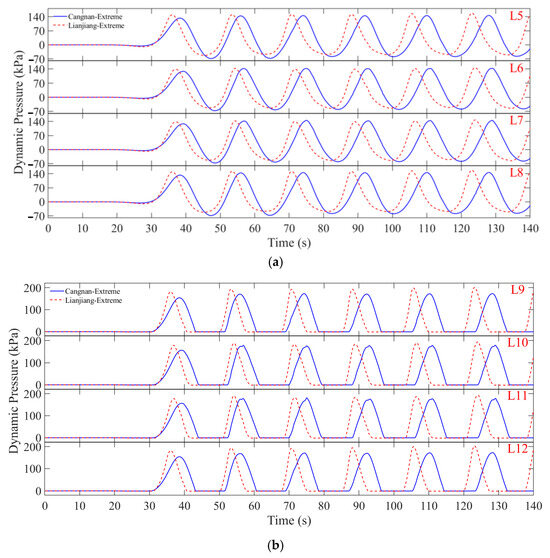
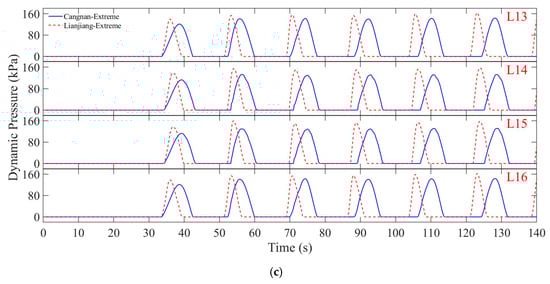
Figure 13.
Dynamic wave pressure time histories on the wind turbine jacket foundation at Cangnan and Lianjiang under extreme wave conditions (a) L5–L8; (b) L9–L12; (c) L13–L16.
Table 7.
Maximum dynamic wave pressure at typical positions under different wave conditions.
Under extreme wave conditions, the maximum computed dynamic pressures on the Cangnan and Lianjiang jacket foundations reach 181.58 kPa and 203.07 kPa, respectively. Under operating conditions, the corresponding values are significantly lower, at 70.17 kPa and 84.26 kPa. Figure 14 illustrates the temporal evolution of dynamic pressure distributions on the surface of the Cangnan jacket at typical moments under extreme wave conditions. The simulation results indicate that olaFlow effectively captures the transient wave loading process, demonstrating that the location of peak dynamic pressure gradually shifts from the front to the rear legs of the structure as the wave progresses through the structure.
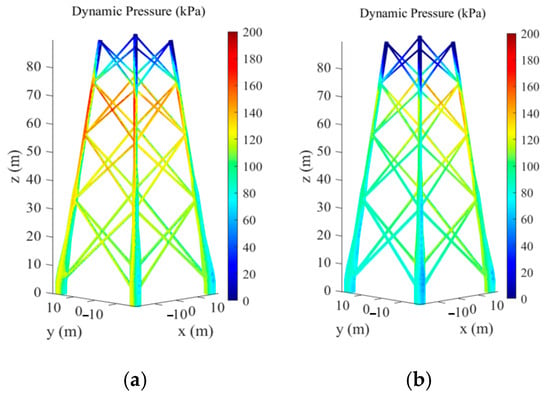
Figure 14.
Dynamic pressure distributions on the Cangnan jacket surface at typical moments under extreme wave conditions (a) t = 128 s; (b) t = 130 s.
The time histories of horizontal forces and overturning moments acting on the Cangnan and Lianjiang jacket foundations under various wave conditions are derived from numerical simulations and presented in Figure 15 and Figure 16. Under extreme wave conditions, the peak horizontal forces in the incident wave direction (x-axis) are approximately 6.2 to 6.5 times greater than those observed under operating conditions. Similarly, the corresponding peak overturning moments exhibit increases of nearly sevenfold. In contrast, the horizontal forces and moments in the transverse direction (y-axis), perpendicular to wave propagation, are negligible relative to the x-direction components. The maximum horizontal force and moment values across all tested conditions are summarized in Table 8.
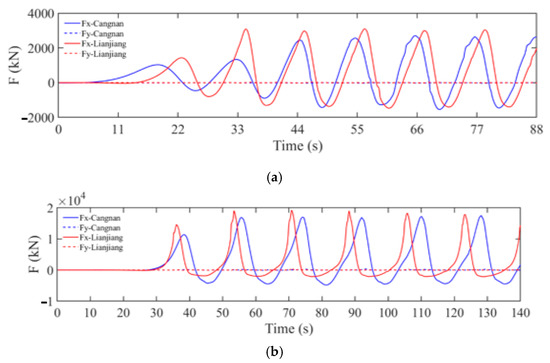
Figure 15.
Horizontal force time histories on the jacket foundation under different wave conditions (a) Operating wave condition; (b) Extreme wave condition.

Figure 16.
Overturning moment time histories on the jacket foundation under different wave conditions (a) Operating wave condition; (b) Extreme wave condition.
Table 8.
Maximum forces in x direction and moments on the jacket foundation using OpenFOAM.
For jacket foundations subjected to wave heights of 10–13 m under operating conditions, the peak dynamic pressures at the SWL are approximately 70–80 kPa. The corresponding maximum horizontal forces and overturning moments are around 2900 kN and 1.2 × 10⁵ kN·m, respectively, and remain relatively consistent for water depths of 50 m and 70 m. Under extreme wave conditions with wave heights of approximately 26 m, these values increase to about 190 kPa, 18,000 kN, and 8.5 × 10⁵ kN·m, respectively. These results suggest that, within the considered depth range, water depth is not the primary influencing parameter for wave-induced loads on jacket foundations. Instead, wave height and period have a more pronounced effect on load magnitudes. This contrasts with shallow-water environments, where wave loading is strongly governed by local water depth.
4.3. Comparison with Design Software Sesam
To assess the differences in the predicted forces, moments, and wave run-up between Sesam and the present CFD-based methodology, a series of quantitative comparisons are performed. The computational results obtained using Sesam are provided by PowerChina Huadong Engineering Corporation Limited, which boasts extensive expertise in the design of offshore structures and accounts for more than 50% of the market share in offshore wind power installation design in China.
According to the comparative results shown in Table 9 and Table 10, under operating conditions, OpenFOAM-based simulations are found to produce slightly higher horizontal forces and overturning moments on the OWT jacket foundations than those predicted by Sesam. Under extreme wave conditions, the differences become more pronounced, with OpenFOAM-to-Sesam force and moment ratios reaching up to 1.47. For wave run-up predictions, OpenFOAM systematically yields higher values, with ratios of approximately 1.42 (operating) and 1.26 (extreme). These findings suggest that Sesam may underestimate hydrodynamic loads and wave run-up in certain cases, potentially resulting in non-conservative designs for jacket foundation if uncorrected. Notably, the underestimation of wave run-up could compromise platform freeboard safety under severe sea states. To ensure sufficient clearance at the transition piece level during extreme events, it is recommended to apply correction factors in the range of 1.5–1.8 to Sesam-predicted run-up values, as inferred from the present numerical comparisons.
Table 9.
Comparison of maximum forces in x direction and moments on the jacket foundation.
Table 10.
Comparison of wave run-up results between OpenFOAM and Sesam (Noted: the outside wall sides of the jacket are considered as smooth).
5. Conclusions
This study utilizes the CFD-based numerical model OlaFlow to investigate the wave–hydrodynamic behavior of full-scale jacket foundations at the Cangnan and Lianjiang offshore wind farms under combined wave–current conditions. The numerical analyses focus on three key aspects: (1) the evolution of near-structure wave profiles; (2) wave-induced impact loads on the jackets; and (3) wave run-up characteristics. The main conclusions drawn from the comparative simulations are as follows:
- (1)
- Complex wave–structure interactions result in progressive steepening of wave crests upstream of the jacket foundations. Under specific conditions, wave diffraction and energy propagation behind the structure can lead to localized amplification of wave heights.
- (2)
- Wave height and period are the dominant factors influencing wave-induced load magnitudes, while water depth has a comparatively minor effect. Under extreme wave conditions, the peak dynamic pressure reaches approximately 190 kPa, with corresponding horizontal forces around 18,000 kN. Notably, the highest impact pressures consistently occur near the SWL across all conditions.
- (3)
- Compared to the CFD-based results, Sesam simulations tend to underpredict horizontal forces, overturning moments, and wave run-up heights, potentially leading to non-conservative designs, which should be carefully considered during the structural design process of offshore wind turbine jacket foundations. The discrepancies in these results primarily stem from differences in computational methodologies, with additional influences arising from specific simulation settings.
It should be noted that this study does not account for seabed interactions. Future research will incorporate wave–current–seabed coupling and soil–structure interaction to investigate the coupled hydrodynamic response involving the seawater, jacket foundation, and supporting seabed.
Author Contributions
Conceptualization, J.Y., B.H. and P.G.; methodology, J.Y., W.J., D.Z. and H.Z.; software, H.Z.; validation, H.Z. and J.Y.; formal analysis, H.Z. and J.Y.; investigation, J.Y., B.H., P.G. and H.Z.; resources, J.Y., B.H., P.G., W.J., D.Z., C.Z., W.S. and C.H.; data curation, J.Y. and H.Z.; writing—original draft preparation, H.Z.; writing—review and editing, J.Y. and H.Z.; visualization, H.Z.; supervision, J.Y., W.J., D.Z., C.Z., W.S. and C.H.; project administration, J.Y.; funding acquisition, B.H., P.G., J.Y. and H.Z. All authors have read and agreed to the published version of the manuscript.
Funding
This study was financially supported by the Postdoctoral Science Foundation (Grant No. P66425) from Power China Chengdu Engineering Corporation Limited.
Data Availability Statement
The original contributions presented in this study are included in the article. Further inquiries can be directed to the corresponding author.
Conflicts of Interest
Authors Haoran Zhou, Wei Jin, Dan Zhang, Chong Zhang, Wenqi Sa and Chunhui He were employed by the company Power China Chengdu Engineering Corporation Limited. Authors Ben He and Peng Gao were employed by the company Power China Huadong Engineering Corporation Limited. The remaining author declares that the research was conducted in the absence of any commercial or financial relationships that could be construed as a potential conflict of interest.
References
- Jose, J.; Podrażka, O.; Gudmestad, O.T.; Cieślikiewicz, W. Characteristics of the wave slamming forces on jacket structures under plunging breaking waves based on experimental data. In International Conference on Offshore Mechanics and Arctic Engineering; American Society of Mechanical Engineers: New York, NY, USA, 2007; Volume 57748, p. V07BT06A036. [Google Scholar]
- Hildebrandt, A.; Schlurmann, T. Breaking wave kinematics, local pressures, and forces on a tripod support structure. In Proceedings of the Coastal Engineering Conference, Santander, Spain, 1–6 July 2012; American Society of Civil Engineers: Reston, VA, USA, 2012. [Google Scholar]
- Liu, C.; Sui, T.; Zhang, J.; Zhang, C. 3D numerical investigation of wave-induced seabed response around a tripod pile foundation with different arrangements. Ocean. Eng. 2023, 287, 115861. [Google Scholar] [CrossRef]
- Chatjigeorgiou, I.K.; Chatziioannou, K.; Katsardi, V.; Koukouselis, A.; Mistakidis, E. Numerical and experimental investigation of the wave loading on a three-legged offshore wind turbine jacket platform. In International Conference on Offshore Mechanics and Arctic Engineering; American Society of Mechanical Engineers: New York, NY, USA, 2018; Volume 51302, p. V009T13A005. [Google Scholar]
- Lan, Y. Study on Wave-Current Forces of Pile Foundation Structures. Ph.D. Thesis, Shanghai Jiao Tong University, Shanghai, China, 2006. [Google Scholar]
- Cong, P.; Teng, B.; Zhang, K.; Huang, Y.; Gou, Y. Experimental study on wave diffraction around four-column structure. Ocean. Eng. 2014, 32, 13–23. (In Chinese) [Google Scholar]
- Sruthi, C.; Sriram, V. Wave impact load on jacket structure in intermediate water depth. Ocean. Eng. 2017, 140, 183–194. [Google Scholar] [CrossRef]
- Santo, H.; Taylor, P.H.; Day, A.H.; Nixon, E.; Choo, Y.S. Current blockage and extreme forces on a jacket model in focussed wave groups with current. J. Fluids Struct. 2018, 78, 24–35. [Google Scholar] [CrossRef]
- Abdel Raheem, S.E.; Abdel Aal, E.M. Finite element analysis for structural performance of offshore platforms under environmental loads. Key Eng. Mater. 2013, 569, 159–166. [Google Scholar] [CrossRef]
- Li, S.; Wu, J.; Liu, H. Dynamic response analysis of jacket platform under wave loads. Ocean. Technol. 2013, 32, 66–72. (In Chinese) [Google Scholar]
- Zhang, J.; Liu, H. Structural response of jacket platform under random wave loads. China Offshore Platf. 2018, 33, 36–42. (In Chinese) [Google Scholar]
- Tu, Y.; Cheng, Z.; Muskulus, M. A global slamming force model for offshore wind jacket structures. Mar. Struct. 2018, 60, 201–217. [Google Scholar] [CrossRef]
- Han, C. Fatigue Performance Study of Jacket Support Structure for Offshore Wind Turbine. Master’s Thesis, Harbin Engineering University, Harbin, China, 2013. [Google Scholar]
- Guan, N. Study on Wave-Current Loads of Offshore wind Turbine Foundation Structure. Ph.D. Thesis, Tianjin University, Tianjin, China, 2014. [Google Scholar]
- Liu, W. Numerical Modeling and Simulation Study of Jacket Platform in Marine Environment. Ph.D. Thesis, Northeast Petroleum University, Daqing, China, 2014. [Google Scholar]
- Xu, H.; Peng, Y. Wave dynamic response of jacket offshore wind turbine under random wave action. China Water Transp. 2021, 21, 57–59. (In Chinese) [Google Scholar]
- Zhu, B.; Wen, K.; Kong, D.; Zhu, Z.; Wang, L. A numerical study on the lateral loading behaviour of offshore tetrapod piled jacket foundations in clay. Appl. Ocean. Res. 2018, 75, 165–177. [Google Scholar] [CrossRef]
- Asgarian, B.; Zarrin, M.; Sabzeghabaian, M. Effect of foundation behaviour on steel jacket offshore platform failure modes under wave loading. Ships Offshore Struct. 2019, 14, 570–581. [Google Scholar] [CrossRef]
- phicau/olaFlow: CFD for Waves. 2017. Available online: https://zenodo.org/records/1297013 (accessed on 15 May 2025).
- Higuera, P.; Lara, J.L.; Losada, I.J. Three-dimensional interaction of waves and porous coastal structures using OpenFOAM®. Part I: Formulation and validation. Coast. Eng. 2014, 83, 243–258. [Google Scholar] [CrossRef]
- Zang, J.; Taylor, P.H.; Morgan, G.; Stringer, R.; Orszaghova, J.; Grice, J.; Tello, M. Steep wave and breaking wave impact on offshore wind turbine foundations–ringing re-visited. In Proceedings of the 25th International Workshop on Water Waves and Floating Bodies, Harbin, China, 9–12 May 2010; pp. 9–12. [Google Scholar]
- Higuera, P.; Lara, J.L.; Losada, I.J. Realistic wave generation and active wave absorption for Navier–Stokes models: Application to OpenFOAM®. Coast. Eng. 2013, 71, 102–118. [Google Scholar] [CrossRef]
- Larsen, B.E.; Fuhrman, D.R. On the over-production of turbulence beneath surface waves in Reynolds-averaged Navier–Stokes models. J. Fluid Mech. 2018, 853, 419–460. [Google Scholar] [CrossRef]
- Zhou, H.; Ye, J. Numerical study on the hydrodynamic performance of a revetment breakwater in the South China Sea: A case study. Ocean. Eng. 2022, 256, 111497. [Google Scholar] [CrossRef]
- Zhou, H.; Ye, J. On the selection of turbulent model for the nearshore hydrodynamics modeling of coral reefs: Insight from an inter-comparison study. Ocean. Eng. 2022, 266, 113046. [Google Scholar] [CrossRef]
Disclaimer/Publisher’s Note: The statements, opinions and data contained in all publications are solely those of the individual author(s) and contributor(s) and not of MDPI and/or the editor(s). MDPI and/or the editor(s) disclaim responsibility for any injury to people or property resulting from any ideas, methods, instructions or products referred to in the content. |
© 2025 by the authors. Licensee MDPI, Basel, Switzerland. This article is an open access article distributed under the terms and conditions of the Creative Commons Attribution (CC BY) license (https://creativecommons.org/licenses/by/4.0/).