Article

Advances in Imputation Strategies Supporting Peak Storm Surge Surrogate Modeling

by
WoongHee Jung
1,
Christopher Irwin
1,
Alexandros A. Taflanidis
1,*,
Norberto C. Nadal-Caraballo
2,
Luke A. Aucoin
2 and
Madison C. Yawn
2
1
Department of Civil and Environmental Engineering and Earth Sciences, University of Notre Dame, Notre Dame, IN 46556, USA
2
U.S. Army Corps of Engineers, Engineer Research and Development Center, Coastal and Hydraulics Laboratory, Vicksburg, MS 39180, USA
*
Author to whom correspondence should be addressed.
J. Mar. Sci. Eng. 2025, 13(9), 1678; https://doi.org/10.3390/jmse13091678
Submission received: 18 July 2025 / Revised: 15 August 2025 / Accepted: 28 August 2025 / Published: 31 August 2025
(This article belongs to the Special Issue Machine Learning in Coastal Engineering)

Abstract

Surrogate models are widely recognized as effective, data-driven predictive tools for storm surge risk assessment. For such applications, surrogate models (referenced also as emulators or metamodels) are typically developed using existing databases of synthetic storm simulations, and once calibrated can provide fast-to-compute approximations of the storm surge for a variety of downstream analyses. The storm surge predictions need to be established for different geographic locations of interest, typically corresponding to the computational nodes of the original numerical model. A number of inland nodes will remain dry for some of the database storm scenarios, requiring an imputation for them to estimate the so-called pseudo-surge in support of the surrogate model development. Past work has examined the adoption of kNN (k-nearest neighbor) spatial interpolation for this imputation. The enhancement of kNN with hydraulic connectivity information, using the grid or mesh of the original numerical model, was also previously considered. In this enhancement, neighboring nodes are considered connected only if they are connected within the grid. This work revisits the imputation of peak storm surge within a surrogate modeling context and examines three distinct advancements. First, a response-based correlation concept is considered for the hydraulic connectivity, replacing the previous notion of connectivity using the numerical model grid. Second, a Gaussian Process interpolation (GPI) is examined as alternative spatial imputation strategy, integrating a recently established adaptive covariance tapering scheme for accommodating an efficient implementation for large datasets (large number of nodes). Third, a data completion approach is examined for imputation, treating dry instances as missing data and establishing imputation using probabilistic principal component analysis (PPCA). The combination of spatial imputation with PPCA is also examined. In this instance, spatial imputation is first deployed, followed by PPCA for the nodes that were misclassified in the first stage. Misclassification corresponds to the instances for which imputation provides surge estimates higher than ground elevation, creating the illusion that the node is inundated even though the original predictions correspond to the node being dry. In the illustrative case study, different imputation variants established based on the aforementioned advancements are compared, with comparison metrics corresponding to the predictive accuracy of the surrogate models developed using the imputed databases. Results show that incorporating hydraulic connectivity based on response similarity into kNN enhances the predictive performance, that GPI provides a competitive (to kNN) spatial interpolation approach, and that the combination of data completion and spatial interpolation emerges as the recommended approach.

1. Introduction

The prediction of storm surge hazard and its consequences has become a priority when examining the resilience of coastal communities in planning (pre-disaster), emergency management, and post-disaster contexts [1,2,3]. To address this priority, researchers have made substantial efforts to develop high-fidelity numerical models to establish accurate predictions for the anticipated surge levels driven by tropical cyclones and other storm events [4,5]. These models entail, however, a large computational burden, due to the need to resolve complex hydrodynamic processes in the nearshore region [5,6]. To address this challenge, and improve computational efficiency for regional coastal hazard assessment [7,8] or real-time surge forecasting [9,10], researchers have examined the use of surrogate modeling techniques [11,12,13,14,15,16,17,18,19,20]. Surrogate models, also referenced as metamodels or emulators, correspond to data-driven predictive tools developed using a database of simulation results from a high-fidelity numerical model, and offer a computationally efficient approximation of the input/output relationship of that model. In the context of storm surge emulation, regional flood study databases, consisting of surge predictions for synthetic storm scenarios, are typically used for the surrogate model development. Once properly calibrated, these surrogate models can provide highly accurate and computationally efficient predictions with substantially reduced computational cost, and can be employed to either complement the original high-fidelity model for accelerating the hazard estimation [9] or to fully replace that model for any type of future surge predictions [8], accommodating even the development of real-time decision support tools [21].
The surrogate model surge predictions need to be established for different geographic locations of interest, corresponding typically to the computational nodes of the underlying numerical simulation model or to some subset of them. These nodes cover coastal areas consisting of offshore, onshore, and inland locations, and their number may vary from a few thousand up to more than one million. Frequently, a number of inland nodes will remain dry for some of the database storm scenarios, and therefore, a storm surge estimate will not be provided for them by the numerical model. If the intent of a metamodeling implementation is to provide a binary classification of the node condition (i.e., wet or dry), then the information within the database is sufficient for the emulator development [22]. If, on the other hand, the intent is to provide storm surge predictions, an imputation stage is first needed [23] to fill in the missing data with the so-called pseudo-surge [24]. Spatial interpolation, specifically using weighted k-nearest neighbor (kNN) interpolation, has been shown to be effective, especially for the imputing peak storm surge responses [23]. This approach uses the surge values of neighboring inundated nodes to infer the missing data, with the distances to the neighbors (representing spatial correlation) used as weights in the interpolation scheme. The enhancement of kNN by using the connectivity of the underlying numerical grids as a proxy for the hydraulic connectivity was further examined in [22], reflecting the observation that in domains with complex geomorphologies (e.g., ridges and sharp elevation changes) or flood protection measures (e.g., levees, floodwalls, or seawalls), spatial proximity does not necessarily mean correlated surge responses.
This work revisits the imputation of peak storm surge databases when couched within a specific objective—the development of surrogate models for emulation of the peak-surge. This objective dictates both the specific imputation strategies examined, advancing techniques previously considered for this application, as well as the accuracy metrics utilized to evaluate the performance of the different imputation strategies. Also, the focus is specifically on imputation for the peak-surge and not for the surge time-series. The imputation task for these two types of responses has very different characteristics. For example, time-series databases offer richer information due to the inclusion of an additional dimension (the temporal variation), which permits the consideration of an expanded range of imputation strategies that are appropriate for spatiotemporal problems [25,26,27]. In contrast, imputation of peak storm surge values may pose greater challenges, though it has significant relevance due to the wide use of peak storm surge emulation techniques for coastal hazard estimation [8,14,16].
Specifically, three distinct advancements are considered building upon previous efforts in peak storm surge database imputation. For the first advancement, the use of response-based correlation is examined for infusing hydraulic connectivity information within the spatial interpolation, replacing the previously used proxy based on the numerical model grid connections [22]. This replacement constitutes the first novel contribution of the study. The response-based correlation between nodes is defined using the binary response information for the condition of each node (i.e., inundated/wet or not). Only nodes with correlation higher than a specific threshold are considered as candidate neighbors in the kNN implementation. For the second advancement, a Gaussian Process interpolation (GPI) [28] is examined as an alternative (to the previously used kNN [22]) spatial interpolation-based imputation strategy. GPIs have shown great promise in filling in missing values for spatially correlated data [29], but their application to surge imputation has not been explored to date as they have been hindered by computational challenges due to the large size of the databases, originating from the large number of nodes (e.g., millions of nodes per study). Here, a recently established adaptive covariance tapering scheme [30] is adopted to accommodate an efficient GPI implementation for large datasets, and its advantages are examined compared to kNN-based spatial interpolation. This consideration of GPI for the peak storm surge database imputation represents another novel contribution of the study. For the third advancement, imputation using data completion is examined as an alternative to the aforementioned spatial interpolation techniques. Data completion techniques have been shown to be viable candidates for imputing missing data [31,32], especially for large datasets containing sufficient information for the respective technique to learn the underlying patterns. For storm surge applications, they have been recently shown to be effective for imputing surge time-series predictions [26], but their reliability for peak-surge imputations remains an open question. Here this research gap is addressed, establishing the third novel contribution of the study. Specifically, data completion through a latent space projection using probabilistic principal component analysis (PPCA) [33] is examined for imputation, an approach that has demonstrated high scalability and robust performance [34,35] in similar problems and has connections to the principal component analysis-based dimensionality reduction widely used in storm surge emulation [12]. The combination of spatial imputation with PPCA is also considered, with the objective of enriching the information first before performing PPCA. Establishing an appropriate combination approach constitutes the last novel contribution of this study.
The first two advancements, representing spatial interpolation-based imputation strategies are discussed in Section 5, while the remaining advancement, using data completion (or combination), is presented in Section 6. Before elaborating on these advancements, the problem formulation, database used in the case study and peak storm surge surrogate model developments are reviewed in Section 2, Section 3 and Section 4, respectively.

2. Problem Formulation

The development of the surrogate model relies on the availability of a synthetic storm database, typically developed during regional coastal flood hazard studies [36]. These databases consist of n synthetic storms and provide storm surge predictions for a total of nz nodes within the respective computational domains. The objective of the surrogate model developed utilizing a synthetic storm database is to predict the surge at the available nodes (output) for new storms (input). To support this objective, each synthetic storm is parameterized through the nx-dimensional vector x n x that will serve as the emulator input, with x i denoting the ith input component. Additional details on the selection of x can be found in [23] and in Section 3 that discusses the case study database. Superscript notation will be utilized to distinguish the storms in the database, with x h representing the input vector for the hth storm.
For the ith node within the domain, let s i l a t and s i l o n correspond to the latitude and longitude, e i to the node elevation, z i to the peak-surge, and y i to the inundation state indicator, with y i = 1 meaning that the node is wet (inundated) and y i = 0 meaning that the node is dry. When the relationship to the input vector needs to be explicit, notation z i ( x ) [or y i ( x ) ] will also be used for the surge response [or inundation state] for the ith node. Define s i = [ s i l a t s i l o n ] 2 as the geo-location coordinate vector for the ith node and S 2 × n z as the matrix assembling all nodal coordinates. Let z n z denote the n z -dimensional surge vector, with its components corresponding to the surge values for all individual nodes of interest, and let y n z denote the corresponding inundation state vector. All notations including the subscript, superscript, and input dependencies extend to z and y, and to their individual components. For example, z i h = z i ( x h ) corresponds to the peak-surge for the ith node for the hth storm [described through the input vector x h ] and z ( x h ) corresponds to the vector of peak-surge for all nodes for the same storm.
The original database includes missing data, i.e., no information available for the storm surge, when inland nodes remain dry. These correspond to dry instances y i h = 0 and have no corresponding value z i h . Herein we will reference as always-wet the nodes that have been inundated across the entire database and as once-dry the nodes with at least one missing value, for which y i h = 0 at least once across the storm suite database. We will assume that n r such nodes (once-dry) exist within the database.
Finally, after the synthetic storm parameterization, the database provides the storm input matrix X = [ x 1   x 2     x n ] T n × n x and the output matrix for the surge responses Z = [ z 1   z 2     z n ] T n × n z . Based on the latter matrix, the binary inundation state condition matrix Y = [ y 1   y 2     y n ] T n × n z is derived, with 0 representing the missing surge values in Z (node dry). The hth rows of all these matrices correspond to the characteristics (parametric input or predictions) for the hth synthetic storm and will be distinguished (when needed) by superscript h, with Z h corresponding, for example, to the row vector with the surge responses for the hth storm. Note that the missing data in the Z matrix ultimately correspond to the elements in Y equal to 0.

3. Database Description

The high-fidelity storm surge database utilized in this study is part of the U.S. Army Corps of Engineers (USACE) Coastal Hazards System (CHS; https://chs.erdc.dren.mil accessed 27 August 2025) [37]. It specifically corresponds to the CHS Louisiana (CHS-LA) coastal flood hazard study [36], developed for quantifying storm hazards and coastal compound flooding in Louisiana. CHS-LA includes areas in the vicinity of the Greater New Orleans Hurricane Storm Damage Risk Reduction System (HSDRRS), which encompasses the district of focus here. A detailed description of the database has been presented in [22]. Here, a basic overview is presented.
The CHS-LA tropical cyclone (TC) suite consists of n = 645 synthetic storms separated into 85 master tracks (MTs), shown in Figure 1. All TCs are characterized by unique combinations of the following parameters: landfall location, defined by the latitude x l a t and longitude of the storm’s eye x l o n , heading direction of the storm track during the final approach to landfall β , central pressure deficit Δ P , forward translation speed v t , and radius of maximum wind speed R m w . Each MT is initially constructed as a unique combination of the storm’s heading direction β and its landfall location [ x l a t   x l o n ] . The remaining parameters defining the synthetic storms dictate the strength Δ P , size R m w , and translational speed v t characteristics of each synthetic storm, further distinguishing storms that might correspond to the same MT. Table 1 summarizes the range of the TC parameters that constitute the database.
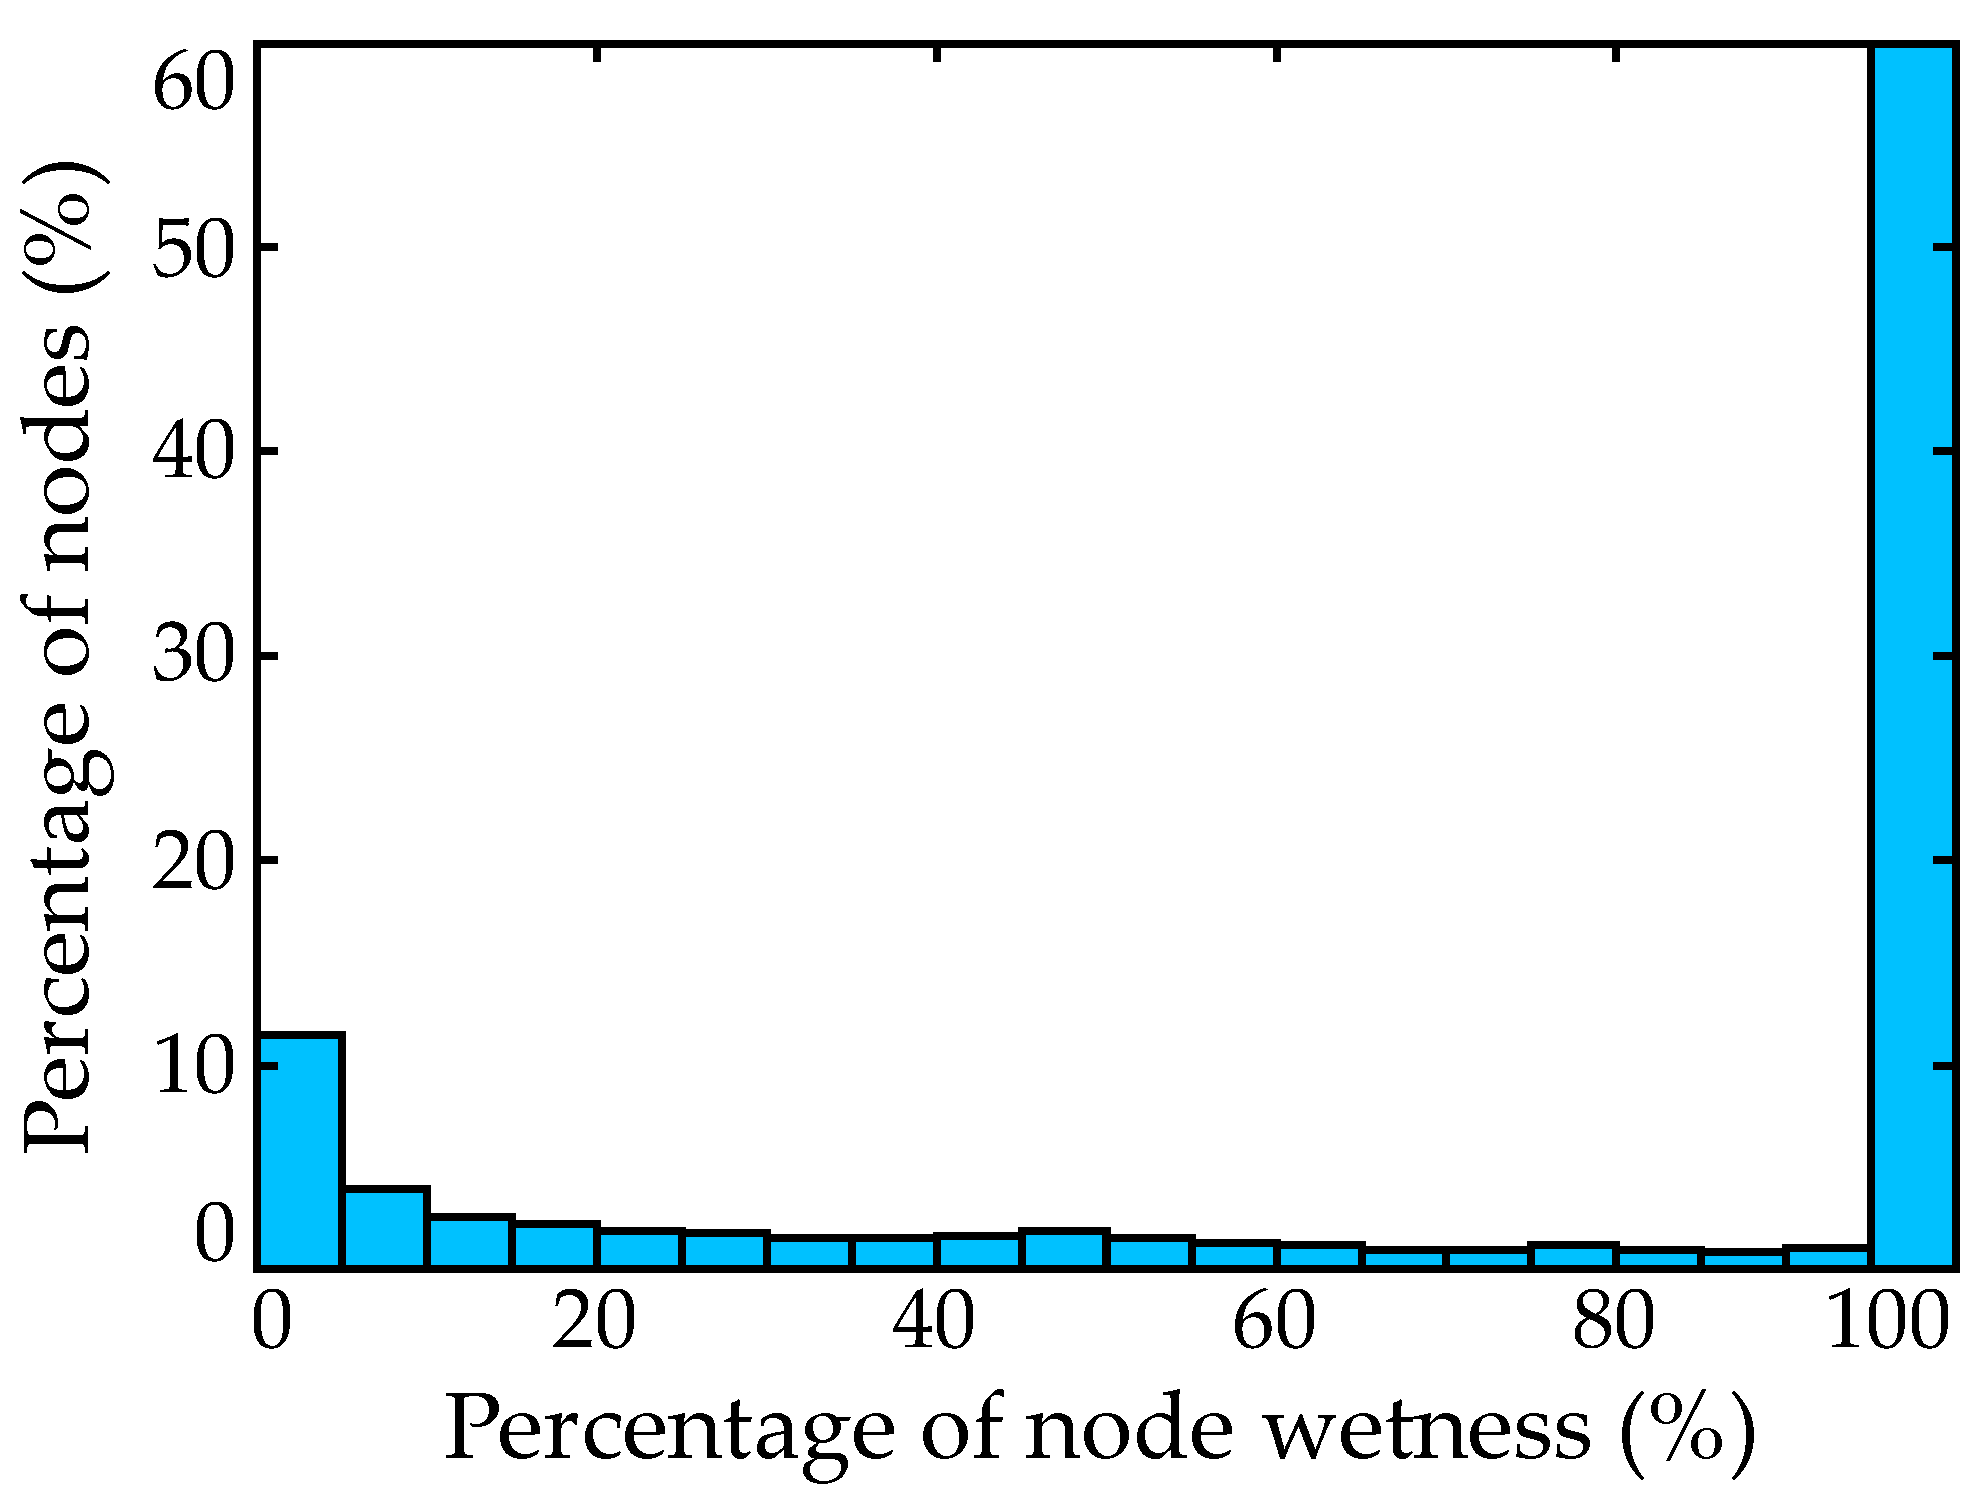
The simulation of the 645 synthetic TCs was performed using high-resolution, high-fidelity atmospheric and hydrodynamic numerical models. The forcing of these models for each storm corresponded to the wind and pressure fields obtained using a nested grid Planetary Boundary Layer (PBL) model with input defined through the parametric description of the storm. The hydrodynamic simulations were performed by coupling the ADCIRC [ADvanced CIRCulation model] [38] and the STWAVE [Steady-State Spectral Wave model] [39]. The ADCIRC mesh consisted of close to 1.6 million nodes and 3.1 million triangular elements. The geographic domain includes various flood protection systems around the New Orleans area. A subset of the entire domain will be considered for the metamodel development, focusing on areas around New Orleans, constrained by latitude [28.5°, 40°] N and longitude [86°, 93.5°] W. This corresponds to a total of n z = 1,179,179 nodes, with n r = 488,216 being dry in at least one storm. Figure 2 presents the histogram of the percentage of storms for which each node is inundated. Note that percentage equal to 100% corresponds to the set of always-wet nodes. The spatial distribution of the n r nodes with the percentage of storms for which these nodes are inundated will be illustrated later in Section 7.1.
With respect to the input parameterization, as shown in [22] the storm strength, size, and translational speed, characteristics for the CHS-LA suite have been held relatively constant starting at approximately 250 km prior to landfall. This incentivizes the use of the characteristics at a reference landfall location to define x . Following the recommendations in [13], a piece-wise linear coastal boundary is utilized for defining this reference landfall location to avoid ambiguous definition of landfall due to the existence of bays. This boundary is also shown in Figure 1 (white solid line). The reference landfall is defined at the intersection of this boundary and the synthetic storm track. A single parameter is adopted for describing this landfall, corresponding to the distance (in km) of the landfall location along this boundary from a reference point (any reference point can be utilized here). This leads to a five-dimensional ( n x = 5) input vector that includes the distance for the reference landfall along the linearized boundary, along with β , Δ P , R m w , and v t at final approach to landfall.

4. Surrogate Modeling Overview

This section briefly reviews different aspects of the surrogate model implementation: (i) the database imputation; (ii) the development and calibration of two surrogate models, one for regression and one for classification, and their combination to establish the final storm surge predictions; and (iii) the validation of the established models. Additional details can be found in [22]. Readers familiar with the surrogate model implementation may proceed directly to Section 5 and Section 6.

4.1. Database Imputation

The development of the regression surrogate model (discussed in Section 4.2) requires imputation of the original database to provide the pseudo-surge [24] for any missing data for Z. For the ith node and hth storm, this pseudo-surge is denoted as z ˜ i h and can be obtained through any of the approaches discussed in detail in Section 5 and Section 6. As discussed in detail in [23], imputation is not guaranteed to lead to pseudo-surge values z ˜ i h that are smaller than the node elevation e i , with nodes for which z ˜ i h > e i falsely classified as wet based on the imputed surge values. The solutions for accommodating such erroneous information in the surrogate model development are as follows [23]: (a) adjust the estimated z ˜ i h to be smaller (for example 10 cm smaller) than e i , guaranteeing that z ˜ i h < e i and the estimated pseudo-surge provides a correct classification of the node as dry; or (b) retain the (erroneously classified) pseudo-surge values in the development of the regression surrogate model but supplement that regression model with an additional surrogate model for the classification of the inundation condition of each node, established using the original condition matrix Y (which does not include any erroneous information). The term problematic nodes and notation Apn are introduced herein to describe the subset of nodes that are at least once misclassified during the imputation process. Following [22], the terminology pseudo-surge database and corrected pseudo-surge database will be used to describe, respectively, the imputed database with no modification [case (b)] or with adjustment that guarantee all imputed values lead to correct classification of nodes [case (a)].
As discussed in detail in [22,23], the corrected pseudo-surge database includes discontinuities (jumps) in the imputed observation matrix Z. These discontinuities are represented by the surge gap η i for the once-dry nodes, defined using the information in the original database as follows [22]:
η i = min h ( z i h ) e i
where min h ( . ) denotes the minimum of the quantity inside the parentheses across all the storms in the database. The larger the value of this gap, the greater the challenges for the regression surrogate model in achieving accurate predictions when the corrected pseudo-surge database is utilized. As discussed in detail in [23], this is the main reason for promoting the use of the pseudo-surge database in the surge surrogate model development. It is expected to provide a higher accuracy predictive model, as long as the erroneous information in this database (originating from the imputed data) can be corrected when supplementing predictions with the ones from the secondary classification surrogate model.
To assess the quality of information associated with the imputed database, the following measures are introduced. The maximum surge misinformation m s i , corresponding to the largest difference between the imputed pseudo-surge value and the node elevation:
m s i = max h { ( z ˜ i h e i ) | y i h 1 | }
and the percentage of misinformation m p i , corresponding to the relative ratio of storms (with respect to the total database) that a node is misclassified at the imputation stage:
m p i = 1 n h = 1 n { I [ z ˜ i h > e ] | y i h 1 | }
where I [ . ] denotes the indicator function, corresponding to one if the expression inside the brackets is true and to zero otherwise. Note that the term | y i h 1 | restricts the operations in the above equations to only the originally dry instances, i.e., when y i h = 0 . For each problematic node, the maximum surge misinformation and the percentage of misinformation represent, respectively, the magnitude or amount of erroneous information. A modification of the problematic node definition was proposed in [22] using m s i and m p i . Any problematic nodes that correspond to small values for both m s i and m p i can be removed from the set A p n ; the information quality for them is deemed as sufficiently high (erroneous information is negligible). This modified problematic node set is denoted as A ¯ p n herein. In the case study presented later, the thresholds used for m s i and m p i are 5 cm and 2.0%, respectively, following the recommendation in [22].

4.2. Surrogate Model Development

4.2.1. Overview of Data-Driven Predictive Model Formulation

The storm surge predictive model is composed of two different surrogate models [22]: (a) the primary regression surrogate model, denoted as Ss herein, for approximating the storm surge z ( x ) ; and (b) the secondary classification model, denoted as Sc herein, for approximating the inundation state y ( x ) . The regression surrogate Ss is established using a database with input and output matrices corresponding to X and imputed Z, respectively. Either the pseudo-surge database or the corrected pseudo-surge database can be used for Z. The classification surrogate Sc is established using a database with input and output matrices corresponding to X and Y, respectively. Note that the classification surrogate can be established only for the once-dry nodes [total of n r nodes] since for the always-wet nodes there is no useful information in the database to support a classification metamodel development (all training points correspond to the same value of 1). The metamodel predictions will be denoted as z ˜ i ( x ) and y ˜ i c ( x ) for the ith node and as z ˜ ( x ) and y ˜ c ( x ) for the entire output vector, for the Ss and Sc surrogate models, respectively. Note that the Ss metamodel also establishes predictions for the inundation state, denoted by y ˜ i s ( x ) for the ith node and given by the following:
y ˜ i s ( x ) = I [ z ˜ i ( x ) > e i ]
where, as defined earlier, I [ . ] denotes the indicator function. The predictions for the entire output vector, with elements y ˜ i s ( x ) , will be denoted as y ˜ s ( x ) . Note that superscripts c and s were introduced to distinguish the predictions for the node inundation state according to the Sc and Ss surrogate models, respectively. The final approximation for the inundation state, denoted as y ˜ i ( x ) for the ith node and as y ˜ ( x ) for the entire output vector, can be obtained, as will be discussed in Section 4.2.3, by the appropriate combination of the predictions of each of these metamodels.

4.2.2. Classification and Regression Surrogate Model Details

Any type of surrogate model [15,16] can be utilized for establishing the Ss and Sc metamodels. In the illustrative case study, a Gaussian Process (GP) metamodel [40,41] is considered as the surrogate model for both Sc and Ss, coupled with a dimensionality reduction step, using principal component analysis (PCA), to deal with the potentially large dimension of the output (i.e., large number of nodes). This implementation has been shown to be highly efficient for storm surge surrogate model predictions [12,23]. Details for the surrogate models are presented in Appendix A and Appendix B for Ss and Sc, respectively, with Appendix C providing an overview of the GP formulation. This surrogate modeling implementation establishes ultimately probabilistic predictions for the node inundation state. Instead of providing a binary classification, i.e., predicting node as wet or dry, these predictions provide the probability of the node being inundated. For the ith node these predictions will be denoted herein as p i s ( x ) and p i c ( x ) for the Ss and Sc surrogate models, respectively. The binary classification can be established as y i s ( x ) = I [ p i s ( x ) > 0.5 ] and y i c ( x ) = I [ p i c ( x ) > 0.5 ] , respectively, though the probabilities can be explicitly utilized in the combination of the surrogate model predictions, as detailed next.

4.2.3. Combination of Individual Surrogate Model Predictions

The final storm surge surrogate model predictions are established by combining the Ss and Sc metamodels, with both of them leveraged to establish the predictions for the inundation state y ˜ i ( x ) , and the first one [Ss] used to provide the final surge predictions z ˜ i ( x ) for the nodes that are predicted to be inundated, i.e., correspond to y ˜ i ( x ) = 1 . A detailed discussion on alternative options for the metamodel combination is presented in [22]. Here, a quick review of the recommended implementation is provided. To accommodate this combination, the following classes of nodes are defined:
  • The always-wet nodes (inundated across the entire database), with no missing information. These will be denoted as C 1 class. The node condition classification for them is based entirely on Ss.
  • The modified problematic nodes  A ¯ p n for which imputation was needed, and that imputation led to sufficiently large values of m s i or m p i . These will be denoted as C 2 class.
  • The remaining nodes, for which imputation was needed, but that imputation did not lead to significant misclassification. These will be denoted as C 3 class.
Additionally, the combined surrogate model probabilistic predictions are defined as follows:
p i c b ( x ) = w i c b p i s ( x ) + ( 1 w i c b ) p i c ( x )
where 0 w i c b 1 and ( 1 w i c b ) correspond to the weights assigned to the Ss (regression) and Sc (classification) metamodels. Note that if the established metamodels for Sc and Ss do not provide probabilistic predictions, the binary classification can be utilized in the combination. The selection of weights w i c b reflects the degree of confidence for each metamodel class with a balanced implementation recommended in [22]. The implementation weighs equally ( w i c b = 1 / 2 ) the Ss and Sc predictions for all instances that these predictions could be deemed as reliable. This reliability should be evaluated under the following consideration. Ss predictions for class C 2 are biased towards false positives (dry nodes characterized as wet) due to the underlying erroneous information in the pseudo-surge database (see also Section 4.1 discussion). Based on this tendency, if Ss predictions classify nodes as dry, they can be assessed as reliable, as they are opposite to the underlying metamodel bias. In such cases, both models can be combined to provide p i c b ( x ) . On the other hand, if Ss predictions classify nodes as wet, i.e., z ˜ i ( x ) e i , then due to the underlying false positive bias they should be ignored as not credible. The recommendation for the surrogate model combination is finally as follows:
y ˜ i ( x ) = { C 1 : y i s ( x ) = I [ z ˜ i ( x ) > e i ] C 2 : { I [ p i c b ( x ) > 0.5 | w i c b ] = 0 if z ˜ i ( x ) < e i y i c ( x ) = I [ p i c ( x ) > 0.5 ] else C 3 : I [ p i c b ( x ) > 0.5 | w i c b ]
It should be noted that for the Ss surrogate, the relationship y i s ( x ) = I [ z ˜ i ( x ) > e i ] = I [ p i s ( x ) > 0.5 ] also holds.
Finally, the surge predictions are established as follows. For the instances corresponding to y ˜ i ( x ) = 1 , the surge estimates are provided directly by the Ss metamodel, z ˜ i ( x ) , as long as z ˜ i ( x ) > e i . If z ˜ i ( x ) < e i and the node would have been classified eventually as dry, even if the combined surrogate model predictions yield y ˜ i ( x ) = 1 , then instead of using directly z ˜ i ( x ) the predictions are set equal to some margin (2.0 cm used in this study) over the node elevation e i . This is necessary so that assigned surge predictions correspond to nodes classified as inundated for all y ˜ i ( x ) = 1 instances.

4.3. Surrogate Model Validation

For validation, a k-fold cross-validation (CV) is adopted. The process for establishing it is as follows: (s.1) the original database is randomly partitioned to k different and equally sized groups; (s.2) sequentially, each group is removed from the database, and the surrogate model is calibrated using as observations the remaining storms; (s.3) predictions for the surge of the removed storms are established using this surrogate model; (s.4) comparing these predictions to the actual storm output (of the removed storms) quantifies the prediction error for them; (s.5) accuracy statistics are estimated by combining error information across all folds. Note that when imputation relying on data completion is utilized for the metamodel development, then imputation is repeated for each k-fold in step (s.2). The k-fold CV implementation ultimately provides for the ith node estimates for the surge z ˜ i ( x h ) and inundation condition y ˜ i ( x h ) established for the hth storm by using astraining database the specific group that does not include the storm.
As validation metrics, the misclassification and surge score are utilized. For a specific node and storm, the total misclassification is given by the following:
M C i h = y ˜ i ( x h ) y i h .
This total misclassification can be decomposed to the false positive and false negative components, with the first corresponding to the instances that the node is predicted wet when dry, and the second to the instances the node is predicted dry when wet. These misclassification types are described, respectively, by the following equations:
M C i h + = max ( 0 , y ˜ i ( x h ) y i h ) M C i h = max ( 0 , y i h y ˜ i ( x h ) )
with max(a,b) corresponding to the maximum of the two arguments a or b. Average misclassification statistics per node or across all nodes can be then estimated to describe the accuracy. These are separately estimated for the false positive/false negative/total misclassification components. For the latter they are denoted as M C i for the statistics per node and as M C ¯ for the statistics across all nodes (across entire database) and are given, respectively, by the following:
  M C i = 1 n h = 1 n M C i h ;   M C ¯ = 1 n n z h = 1 n i = 1 n z M C i h .
The equations for the respective statistics for the false positive or the false negative misclassification are identical with the only difference that instead of n z , the number of nodes that were dry or wet is utilized, respectively, for each storm for the false positive or negative misclassification statistics. Additionally, statistics can be provided for specific groups instead of the entire database; this is accomplished by examining in the averaging in Equation (9) only the nodes belonging to that group (i.e., summation is performed only with respect to the indices i included that group).
The surge score for a specific node and storm is given by the following [10,24]:
S C i h = | z ˜ i ( x h ) z i h | z ˜ i ( x h ) e i z i ( x h ) e i 0   if   z ˜ i ( x h ) > e i   &   z i h > e i   if   z ˜ i ( x h ) > e i   &   z i h e i if   z ˜ i ( x h ) e i   &   z i h > e i if   z ˜ i ( x h ) e i   &   z i h e i = max ( e i , z ˜ i ( x h ) ) max ( e i , z i h ) .
This surge score quantifies the absolute discrepancy between the predicted and actual surge, further incorporating the node inundation state: if the node is wet and is also predicted wet, then the absolute value of the predicted surge discrepancy is used as a penalty function; if the node is wet, but it is predicted dry, or vice versa, then the difference between surge (or predicted surge) and node elevation is used as penalty; if the node is actually dry and it is predicted dry, then the penalty is zero. Note that the expression | max ( e i , z ˜ i ( x h ) ) max ( e i , z i h ) | represents the compact mathematical representation of the four-branch definition of the surge score. The averaged statistics per node, or across the entire database, can be then obtained, respectively, as the following:
  S C i = 1 n h = 1 n S C i h ; S C ¯ = 1 n n z h = 1 n i = 1 n z S C i h .
Statistics for the surge score can be examined for specific groups instead of the entire node set, similar to the misclassification case.

5. Imputation Based on Spatial Interpolation

Spatial interpolation is a popular and practical tool for estimating spatially varying variables for geographical locations where they have not been observed, based on observations from neighboring locations [28]. For the application examined here, spatial interpolation techniques can be calibrated utilizing the always-wet nodes and can be subsequently utilized to estimate the pseudo-surge values (i.e., impute the database) based on the storm surge values of other inundated nodes in close proximity. Imputation is separately performed for each storm. As discussed in the introduction, two separate spatial interpolation techniques are examined: weighted kNN and GPI. Weighted kNN has been previously considered for imputation of peak storm surge databases [22,23], and here an extension is proposed integrating a response-based correlation measure to better describe the hydraulic connectivity between nodes. GPI is an attractive spatial interpolation approach [28,42] but, as discussed in Section 1, to date it has not been considered for the application examined here due to computational challenges associated with the large dimension of the database.

5.1. Imputation Using kNN with Enhanced Hydraulic Connectivity

To formalize the kNN implementation, define d i j = d ( s i , s j ) as the geo-distance between nodes i and j and A k h [ i ] as the set of k closest nodes to the ith node for the hth storm. Importantly, the only nodes included in set A k h [ i ] correspond to nodes with known surge values; these correspond to originally inundated nodes for the hth storm (nodes for which y i h = 1 in the original database) and nodes with already imputed values based on the iterative implementation proposed in [23] (and also reviewed next). The pseudo-surge estimate z ˜ i h for the ith node and the hth storm based on the weighted kNN interpolation is given by the following:
z ˜ i h = j A k h [ i ] w ( d i j ) z j h j A k h [ i ] w ( d i j )
where w ( d i j ) is a distance-dependent weight taken as a power exponential with a cut-off distance d t :
w ( d i j ) = e d i j ψ l ψ e   if   d i j < d t 0   if   d i j d t .
The set of [ k   d t   ψ l   ψ e ] corresponds to the kNN hyper-parameters. These can be calibrated to optimize interpolation accuracy across the always-wet nodes [23]. The calibration procedure is reviewed in Appendix D.
The kNN-based imputation is progressively performed [23] within an iterative implementation. At each iteration, only dry nodes that have at least k wet (both imputed and genuine) neighbors in a larger set of kc nodes are imputed. For nodes for which fewer than k wet neighbors are available, imputation is not performed at the current iteration (these will be imputed in a future iteration). The value of kc is chosen equal to twice the value of k in this study, adopting the same recommendation as in [23]. Additionally, the use of hydraulic connectivity information within the kNN imputation was introduced in [22] and shown to be advantageous. Instead of the closest nodes based purely on d i j , the closest connected neighbors are used, defined by the number of element edges between nodes i and j in the graph representing the underlying numerical grid [for example, ADCIRC in the database discussed in Section 3]. Nodes corresponding to fewer edge connections are given higher priority in estimating the k nearest neighbors independent of the actual distance. This approach ultimately prioritizes relatively ADCIRC connectivity over spatial proximity in selecting the closest neighbors.
The edge connections within the underlying numerical grid offer, though, only a proxy for the hydraulic connectivity between nodes. Here, this concept is advanced to use the inferred connectivity based on the response database Y. Given the fact that the responses are binary, the cosine similarity is adopted as a response-based correlation measure [43], defined for nodes i and j as follows:
C s ( i , j ) = h = 1 n y i h y j h h = 1 n ( y i h ) 2 h = 1 n ( y j h ) 2 .
This cosine similarity represents the normalized degree of inundation state alignment between nodes i and j, with a value equal to 1 representing perfect alignment and a value equal to 0 representing perfect misalignment. Another way to interpret the cosine similarity for the binary variables is the following. Consider the resultant partitioning of the outcome of the binary vectors { y i h ; h = 1 , , n } and { y j h ; h = 1 , , n } with the following: N11 representing the total number of storms where both y i h and y j h are equal to 1; N10 representing the total number of storms where y i h = 1 and y j h = 0 ; N01 representing the total number of storms where y i h = 0 and y j h = 1 ; and N00 representing the total number of storms where both y i h and y j h are equal to 0. Then the cosine similarity can be expressed as follows:
C s ( i , j ) = N 11 N 11 + N 10 N 11 + N 01 .
Alternative measures for quantifying correlation between binary-valued vectors, for example, Jaccard similarity or Hamming similarity, could also be considered instead of the cosine similarity. Finally, a threshold C s t is imposed for the cosine similarity with nodes considered connected only if C s ( i , j ) > C s t . The nearest neighbors for node i are finally chosen only from the candidate connected neighbors. This implementation avoids creating connections between nodes with close spatial proximity that do not appearto be correlated based on the response database Y.

5.2. Imputation Using GPI with Adaptive Covariance Tapering

The GPI is established based on the formulation of Appendix C for input and output choices u = s [node spatial coordinates] and v = z h [spatially varying surge for each storm], respectively, leading to n u = 2 . It is separately implemented for each storm. To formalize the implementation, let i w h and i r h represent the indices corresponding to the wet and dry nodes for the ith storm, with the number of elements in i w h denoted as n w h and the number of elements in i r h as n r h . The training data for the hth storm are n w h , with input matrix U and output vector V (based on Appendix C terminology) corresponding to the columns of S and Z h for indices i w h , with n G P = n w h . The metamodel predictions given by Equation (A6) for each of the inputs corresponding to the remaining columns of S, for indices i d h , provide the desired pseudo-surge estimates. Ultimately, this corresponds to predictions for n d h new inputs. Similarly to the kNN implementation, a progressive imputation can be achieved for each storm instead of estimating all pseudo-surge values in one iteration. A common correlation kernel used for spatial interpolation is the Matérn function [28,44], expressed for nodes i and j as a function of their distance d i j = d ( s i , s j ) and given by the following:
R ( s i , s j | γ ) = 1 2 v 1 Γ v d i j d r v K v d i j d r  
where K v is the modified Bessel function (of the second kind) of order v , and d r controls the rate of decay with distance while v controls the GP smoothness. The hyper-parameter vector of the correlation kernel is γ = [ d r   v ] . Note that the correlation kernel is strictly a function of the distance between nodes, i.e., R ( d i j | γ ) = R ( s i , s j | γ ) .
The challenge in the GPI implementation originates from the large number of wet nodes for each storm, since formulation (see details in Appendix C) requires the inversion of a correlation matrix R [with elements R ( d i j | γ ) ] of dimension n G P = n w h . This task has computational complexity of order O [ n G P 3 ] [41]. A variety of solutions [45,46,47,48] have been established for promoting computationally efficiency for GP implementations dealing with such large datasets. For spatial interpolation, covariance tapering is an especially appealing solution due its intuitive interpretation, as it relies on spatial correlation/connectivity between nodes. Additionally, some of its variants [46] are appropriate for irregular grids, like the ones encountered for storm surge surrogate modeling applications. It should be noted that the foundation of covariance tapering resembles the one for kNN: only a reduced number of (close proximity) neighbors should impact the GPI.
Mathematically, covariance tapering leverages inversion algorithms for sparse matrices [49] to reduce the computational burden of inverting large-dimensional covariance matrices. Sparsity is infused by setting unimportant correlations to zero in the GP correlation matrix R, such that the resultant matrix R consists of a very large number of zeros. A smooth taper function with compact support 0 T ( d i j | φ i , φ j ) 1 is introduced to achieve this objective, with φ i representing the hyper-parameter defining the compact support for each node, the so-called taper range (or taper length). When the nodal distance exceeds the compact support (defined through the respective taper ranges), zero correlation is presumed. By replacing R ( d i j | γ ) with R ( d i j | γ ) T ( d i j | φ i , φ j ) the desired sparsity in R can be achieved. To distinguish the resultant sparse matrix when tapering is used, the notation Rs will be used herein. Let ρ and ρ i represent the degrees of global and local sparsity, respectively. These correspond, respectively, to the proportion of non-zero entries in the overall matrix Rs, or in its ith column. The computational cost of inverting Rs for large degrees of sparsity is reduced to approximately O ( n G P ( ρ n G P ) 3 ) [50]. Note that the exact computational burden depends on the details of the implementation. The taper range can be selected to achieve the desired degree of global sparsity to achieve some targeted reduction in the computational burden.
The simplest implementation of covariance tapering is a constant tapering approach using the same taper range across all nodes φ i = φ [48], chosen based on the aforementioned target global sparsity ρ. Unfortunately for irregular grids, like the ones frequently encountered in storm surge applications [38], the constant tapering approach promotes non-uniform local sparsity, with some nodes having too few neighbors and others having too many, something that can adversely affect predictive accuracy. An adaptive covariance tapering formulation [46], explicitly trying to achieve the target local sparsity for each node, circumvents this challenge. An adaptive taper is utilized in this case for which φ i φ j for ij. An example of an adaptive taper, and the one utilized in this study, is as follows [46]:
T ( d i j | φ i , φ j ) = 1 π R i j r i j π r i j 2 if   d i j < R i j r i j V 2 ( R i j , d i j 2 + R i j 2 r i j 2 2 d i j ) + V 2 ( r i j , d i j 2 + r i j 2 R i j 2 2 d i j ) if   R i j r i j d i j < R i j + r i j 0 otherwise ,
where r i j = min ( φ i , φ j ) / 2 , R i j = max ( φ i , φ j ) / 2 , and
V 2 ( r , x ) = r 2 cos 1 x / r x r 2 x 2 x < r 0 else .
This selection leads to compact support d i j ( φ i + φ j ) / 2 for the taper, and to a non-stationary, sparse covariance matrix that can have uniform local sparsity per node (i.e., constant ρ i ) even for highly irregular datasets.
A key aspect in the implementation of adaptive covariance tapering is the selection of the taper ranges per node { φ i ; i = 1 , , n z } to achieve the desired local sparsity { ρ i ; i = 1 , , n z } . An iterative optimization was established in [46] to support this selection, but that procedure cannot scale to large datasets (beyond a few thousand nodes). Recently [30], a computationally efficient implementation of adaptive covariance tapering was established that can seamlessly scale to applications even with a few hundred thousand nodes. This is the formulation adopted in this study for performing imputation using GPI with adaptive covariance tapering. According to this formulation, a small subset of nodes, termed inducing points, is chosen for guiding the identification of the taper ranges. The ranges are only explicitly chosen for the inducing points, something that greatly simplifies the corresponding optimization, achieving the desired computational efficiency. The taper ranges for the remaining points are inferred from the taper range values chosen for the inducing points. The corresponding algorithm established in [30] for the identification of the taper ranges, termed M-IAT (iterative adaptive taper selection), is reviewed in Appendix E. M-IAT can only directly control the local sparsity of the inducing points, with the local sparsity for the remaining points influenced indirectly by the distribution of those inducing point set. The selection of the inducing points becomes, therefore, critical so that the decisions made based on the inducing points are compatible with the decisions that would have been made if all the points were used. An adaptive, iterative selection was proposed in [30] for the inducing points, and is the one adopted here. This selection starts with a small number of inducing points, performs the taper identification utilizing them (step 1), and then augments them with additional points (step 2) corresponding to regions for which the discrepancy from the target local sparsity (based on the step 1 tapers) is the largest. The latter points represent the ones (among the remaining points not already chosen as inducing points) with the expected largest information value in guiding the taper range selection for achieving the target local sparsity throughout the entire domain. Steps 1 and 2 are repeated until convergence, defined as establishing a discrepancy from the target local sparsity below a specific threshold, is achieved. The corresponding algorithm established in [30] for selecting the inducing points, termed IIP (iterative inducing point identification), is reviewed in Appendix F.

5.3. Computational Complexity and Scalability of Spatial Interpolation Techniques

The computational complexity of kNN is of order O ( h ( n z k ) + n z 2 ) if the implementation relies on the estimation of distances and cosine similarity measures between all pairs of nodes. With some intelligent implementation to restrict this estimation to only a smaller number of k p r candidate neighbors (for example within a rectangular domain centered at each node), this complexity may be reduced to O ( h ( n z k ) + n z k p r ) . As such the computational burden of kNN may be considered to scale practically linearly with the size of the database (either storms or nodes), showing that it can be easily extended to larger datasets. On the other hand, the computational complexity of GPI is of order O ( n z ( ρ n z ) 3 + h n z 2 ) . Depending on the adopted value of ρ, this means that the computational burden of GPI scales linearly with the number of storms and at best quadratically with the number of nodes. As such, extension to very large datasets is expected to face challenges, depending on the available computational resources. A partial remedy to this challenges can be provided by employing GPU resources for the relevant matrix manipulations [51].
Note that the iterative implementation of the spatial interpolation techniques to support the progressive imputation of the database will increase the aforementioned computational costs, but the exact cost (or total number of iterations) is database dependent as it depends on the exact pattern of the missing data.

6. Imputation Based on Data Completion

6.1. Motivation for Imputation Utilizing Data Completion

Instead of trying to establish a predictive model by inferring spatial correlations, imputation approaches based on data completion utilize solely the original observation matrix Z. They infer patterns based on all observed data and then project these patterns into the missing data to accomplish the imputation task. As they do not utilize any spatial information, they avoid the pitfalls that might exist for spatial interpolation approaches, when spatial proximity does not necessarily translate into surge response correlation. For imputation of storm surges, they will be implemented utilizing all data, trying to infer patterns across storms and between nodes, to fill in the missing values.
A range of imputation methods relying on data completion exist; for example, variants of low-rank matrix completion [52,53] or principal component analysis (PCA) [54,55]. In general, such approaches perform well when there is sufficient information in the original data to infer the underlying patterns. For peak-surge imputation, they are expected to face challenges due to the limited information that is available for some nodes. This is evident in the results shown in Figure 2 for the case study database, with a significant portion of the nodes (over 15%) being inundated in less than 10% of the storms (i.e., over 90% missing data rate). For this reason, a two-stage imputation approach will also be explored, filling originally missing values based on spatial interpolation, to enrich information for the implementation of the data completion-based imputation in the second stage. The specific data completion imputation method utilized here is probabilistic principal component analysis (PPCA) [33], as it can easily scale to large datasets, like the ones frequently encountered in storm surge imputation, and is well aligned with the PCA-based dimensionality reduction utilized when Sc and Ss metamodels are established based on GP surrogate modeling principles.

6.2. Imputation Using PPCA

PPCA-based imputation [33,56] establishes first a dimensionality reduction by projecting the original data (with missing values) onto its principal components (latent outputs) and subsequently estimates the missing values by recovering the data from its dimension-reduced form. The specific PPCA-based imputation variant utilized here follows the implementation adopted in [56]. A succinct description for it is provided next.
Formulation assumes a linear relationship between the original surge vector and the vector of principal components as the following:
z = W t + μ + ε
where t n t denotes the n t -dimensional principal component vector, W n z × n t the projection matrix, μ n z the mean vector with the ith component representing the mean of z i (mean of the ith column of Z ), and ε n z the isotropic noise. Within the PPCA implementation, the probabilistic distributions for t and ε are assumed, respectively, as t ~ N ( 0 , I ) and ε ~ N ( 0 , σ 2 I ) , where N ( m , Σ ) represents the multivariate Gaussian distribution with the mean vector m and covariance matrix Σ , 0 the vector of zeros, I the identity matrix, and σ 2 the magnitude of the error. These assumptions lead to the conditional distribution of the original surge vector z given t as the following:
z | t ~ N ( W t + μ , σ 2 I ) .
Based on probability models in Equations (19) and (20), and using the surge response data (matrix Z) as samples of z , the complete-data log-likelihood of the n observations (correspond to the different storms) can be expressed as the following:
L = h = 1 n ln { p ( z h , t h ) } = h = 1 n [ ln { p ( z h | t h ) } + ln { p ( t h ) } ]
where t h = t ( x h ) denotes the latent outputs for the hth storm. For maximizing this complete-data log-likelihood and, ultimately facilitating the data imputation, an Expectation-Maximization (EM)-based [57] iterative formulation is adopted for computational efficiency. The expectation step estimates the latent outputs using the observed portion of Z only, and then fills in missing entities in Z based on the estimated latent outputs (along with fixed W and σ 2 ). The maximization step updates estimates for W and σ 2 based on the updated complete matrix Z. Vector μ can be either updated at each iteration using imputed values or fixed to some reasonably initialized values at the beginning.
Following recommendations in [56], the adopted EM implementation also incorporates prior knowledge about expected patterns during the data completion process. This is critical for providing imputed data that exhibit similar patterns. Specifically, to the storm surge imputation problem, the pattern that we try to retain is to have the missing data in the storm surge database be below the node elevation (i.e., the pseudo-surge values corresponding to dry inundation state). For this reason, the missing entries in Z are initialized within the EM algorithm slightly (5 cm) below the corresponding node elevation.

6.3. Two-Stage Imputation Combining Spatial Interpolation and Data Completion Techniques

To enrich the information available for imputation relying on data completion, a two-stage formulation is promoted. In the first stage, spatial interpolation is first performed separately for each storm; for example, using kNN or GPI as detailed in Section 5. The incorrectly classified imputed data, corresponding to pseudo-surge values z ˜ i h > e i , are still considered to correspond to missing data. This leads to a partially imputed database that is subsequently imputed in the second stage using a data completion imputation technique. Through the introduction of the first stage, the database utilized in the data completion imputation is substantially enriched, while the enriched data are also guaranteed to facilitate correct classification based on the pseudo-surge.

6.4. Computational Complexity and Scalability of PPCA Imputation

Though the computational complexity of PPCA depends on the specifics of the EM algorithm used [58], with an appropriate EM implementation it can be reduced to be of order O ( h n z n t T ) , where T is the total number of EM iterations. This shows that, similar to kNN, PPCA may be considered to scale practically linearly with the size of the database (either the number of storms or nodes), showing that it can be easily extended to larger datasets. Compared to the computational complexity of the spatial interpolation techniques presented in Section 5.3, PPCA is expected to outperform GPI and have a similar computational burden as kNN. However, in general, PPCA outperforms even kNN if the progressive imputation of the latter requires a significant number of iterations.

7. Illustrative Case Study

The illustrative case study considers implementations of the proposed advances for establishing surrogate models for the CHS-LA database described in Section 3. The advantages of the different imputation advancements are examined with respect to the accuracy of the surrogate models that are subsequently calibrated using the imputed databases. The validation adopts a 10-fold CV implementation, following guidelines in Section 4.3.

7.1. Variants Examined

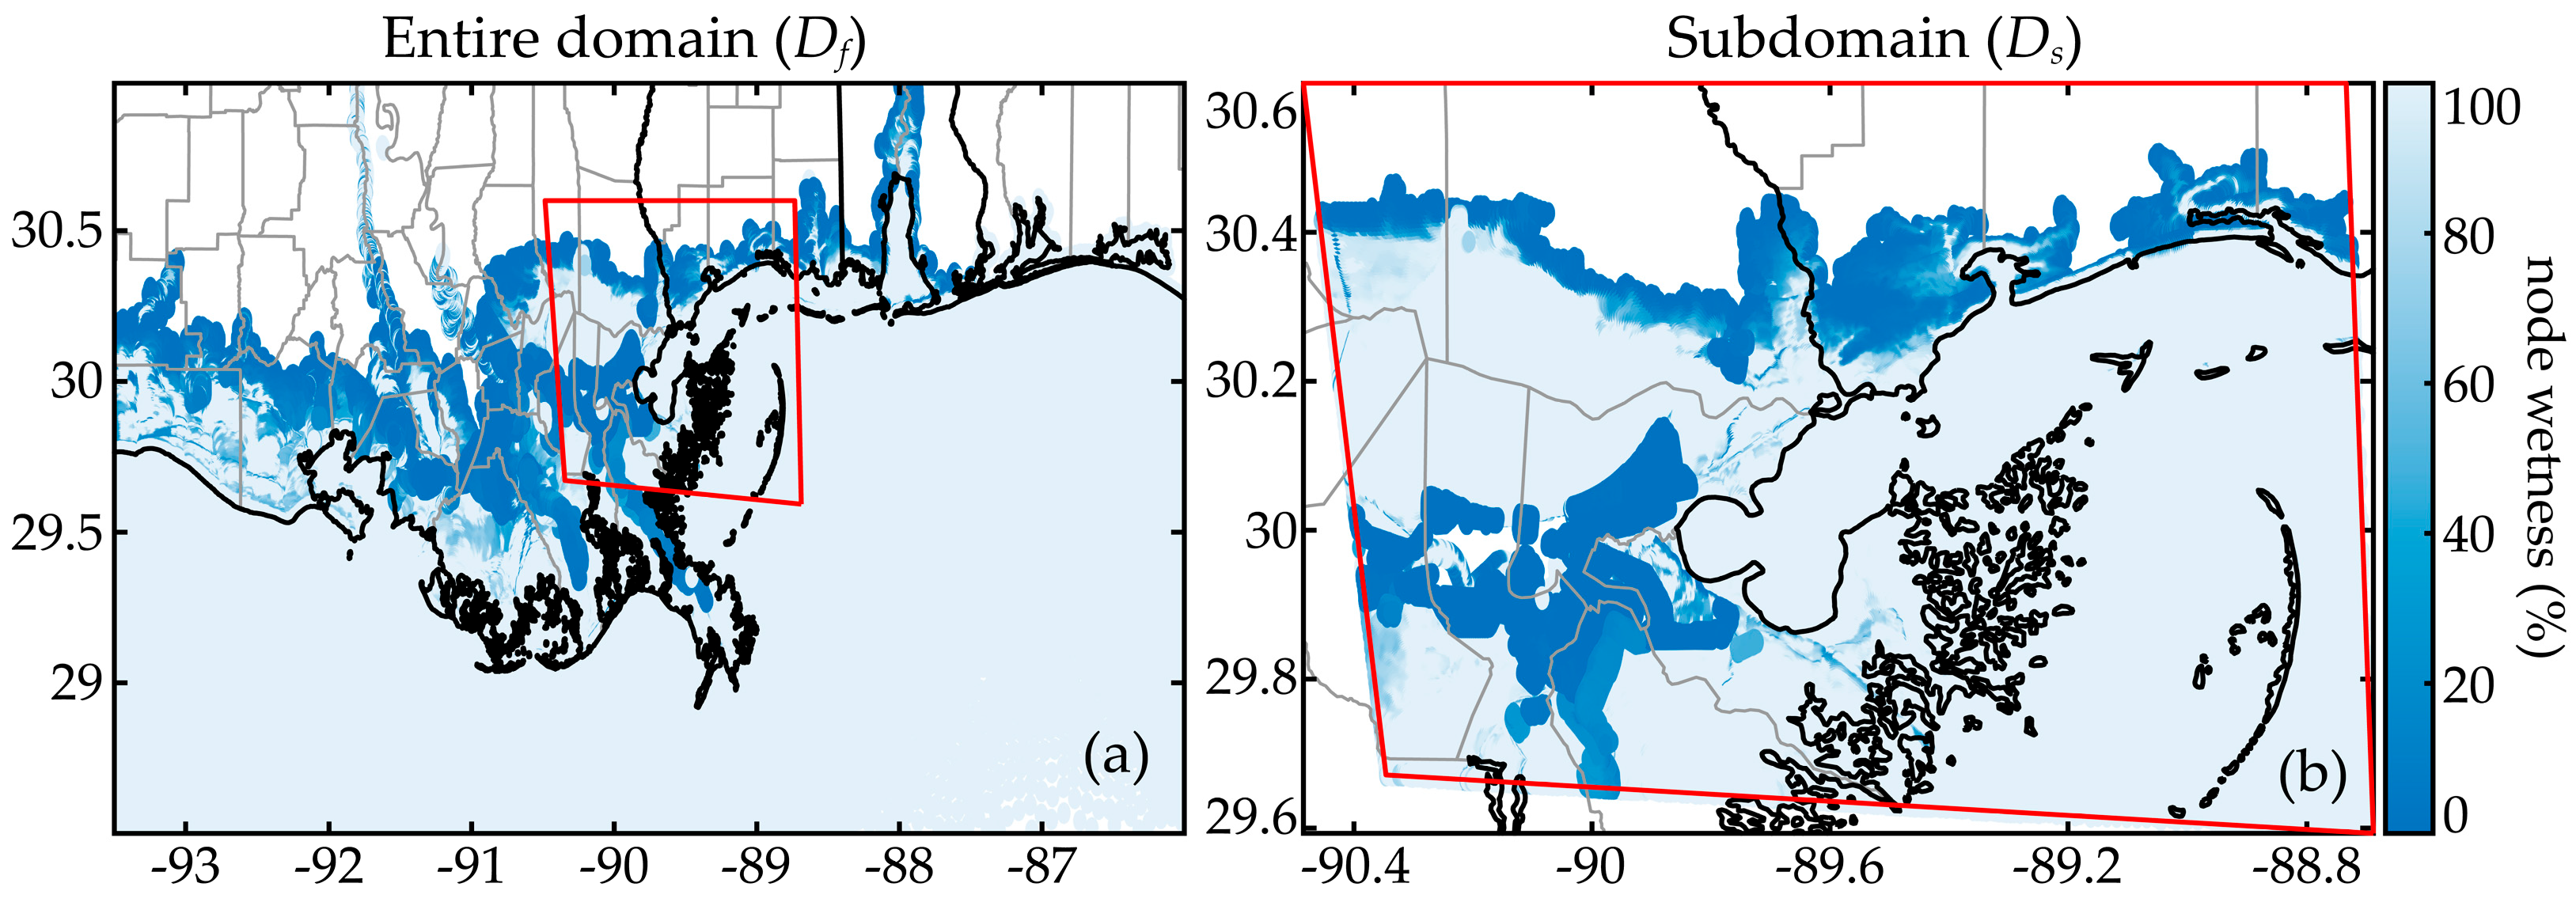
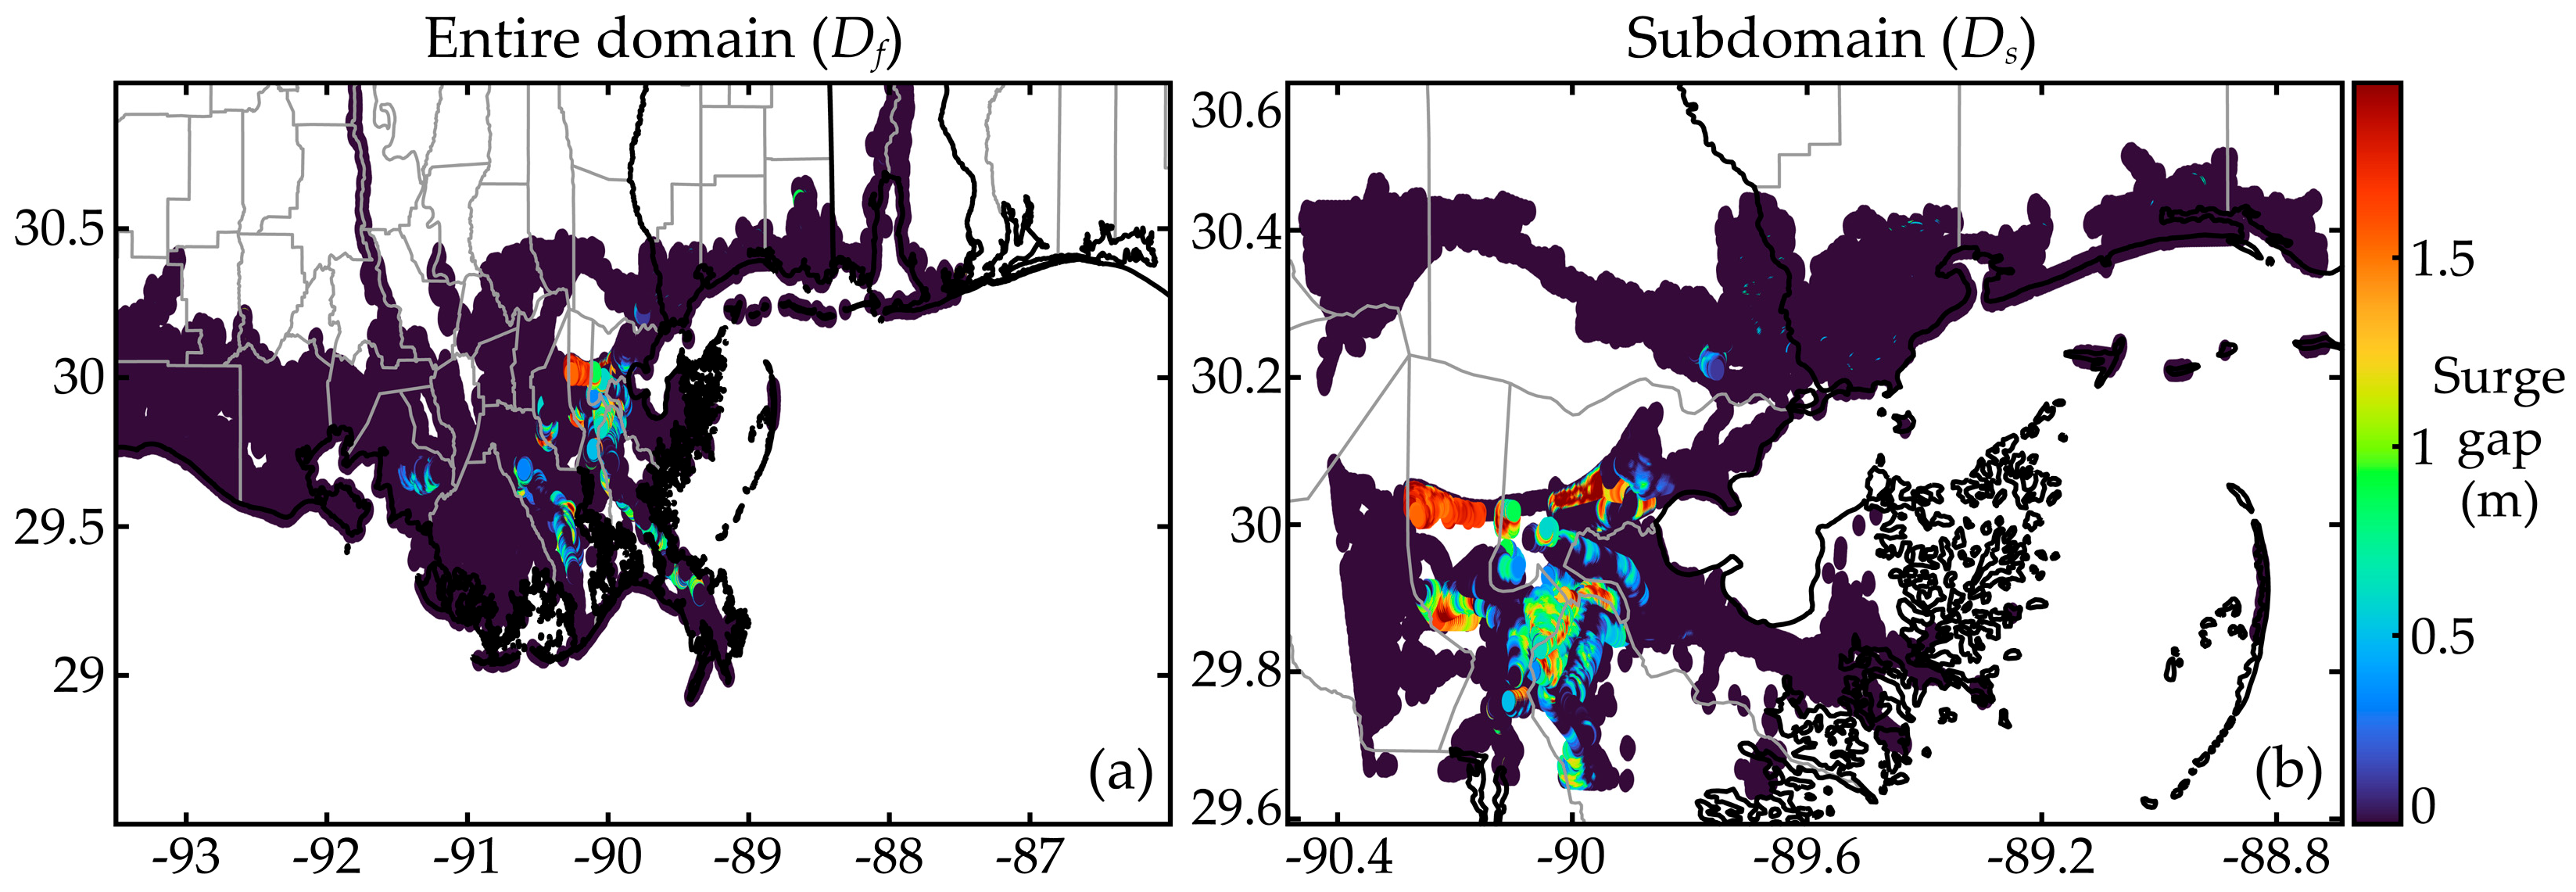
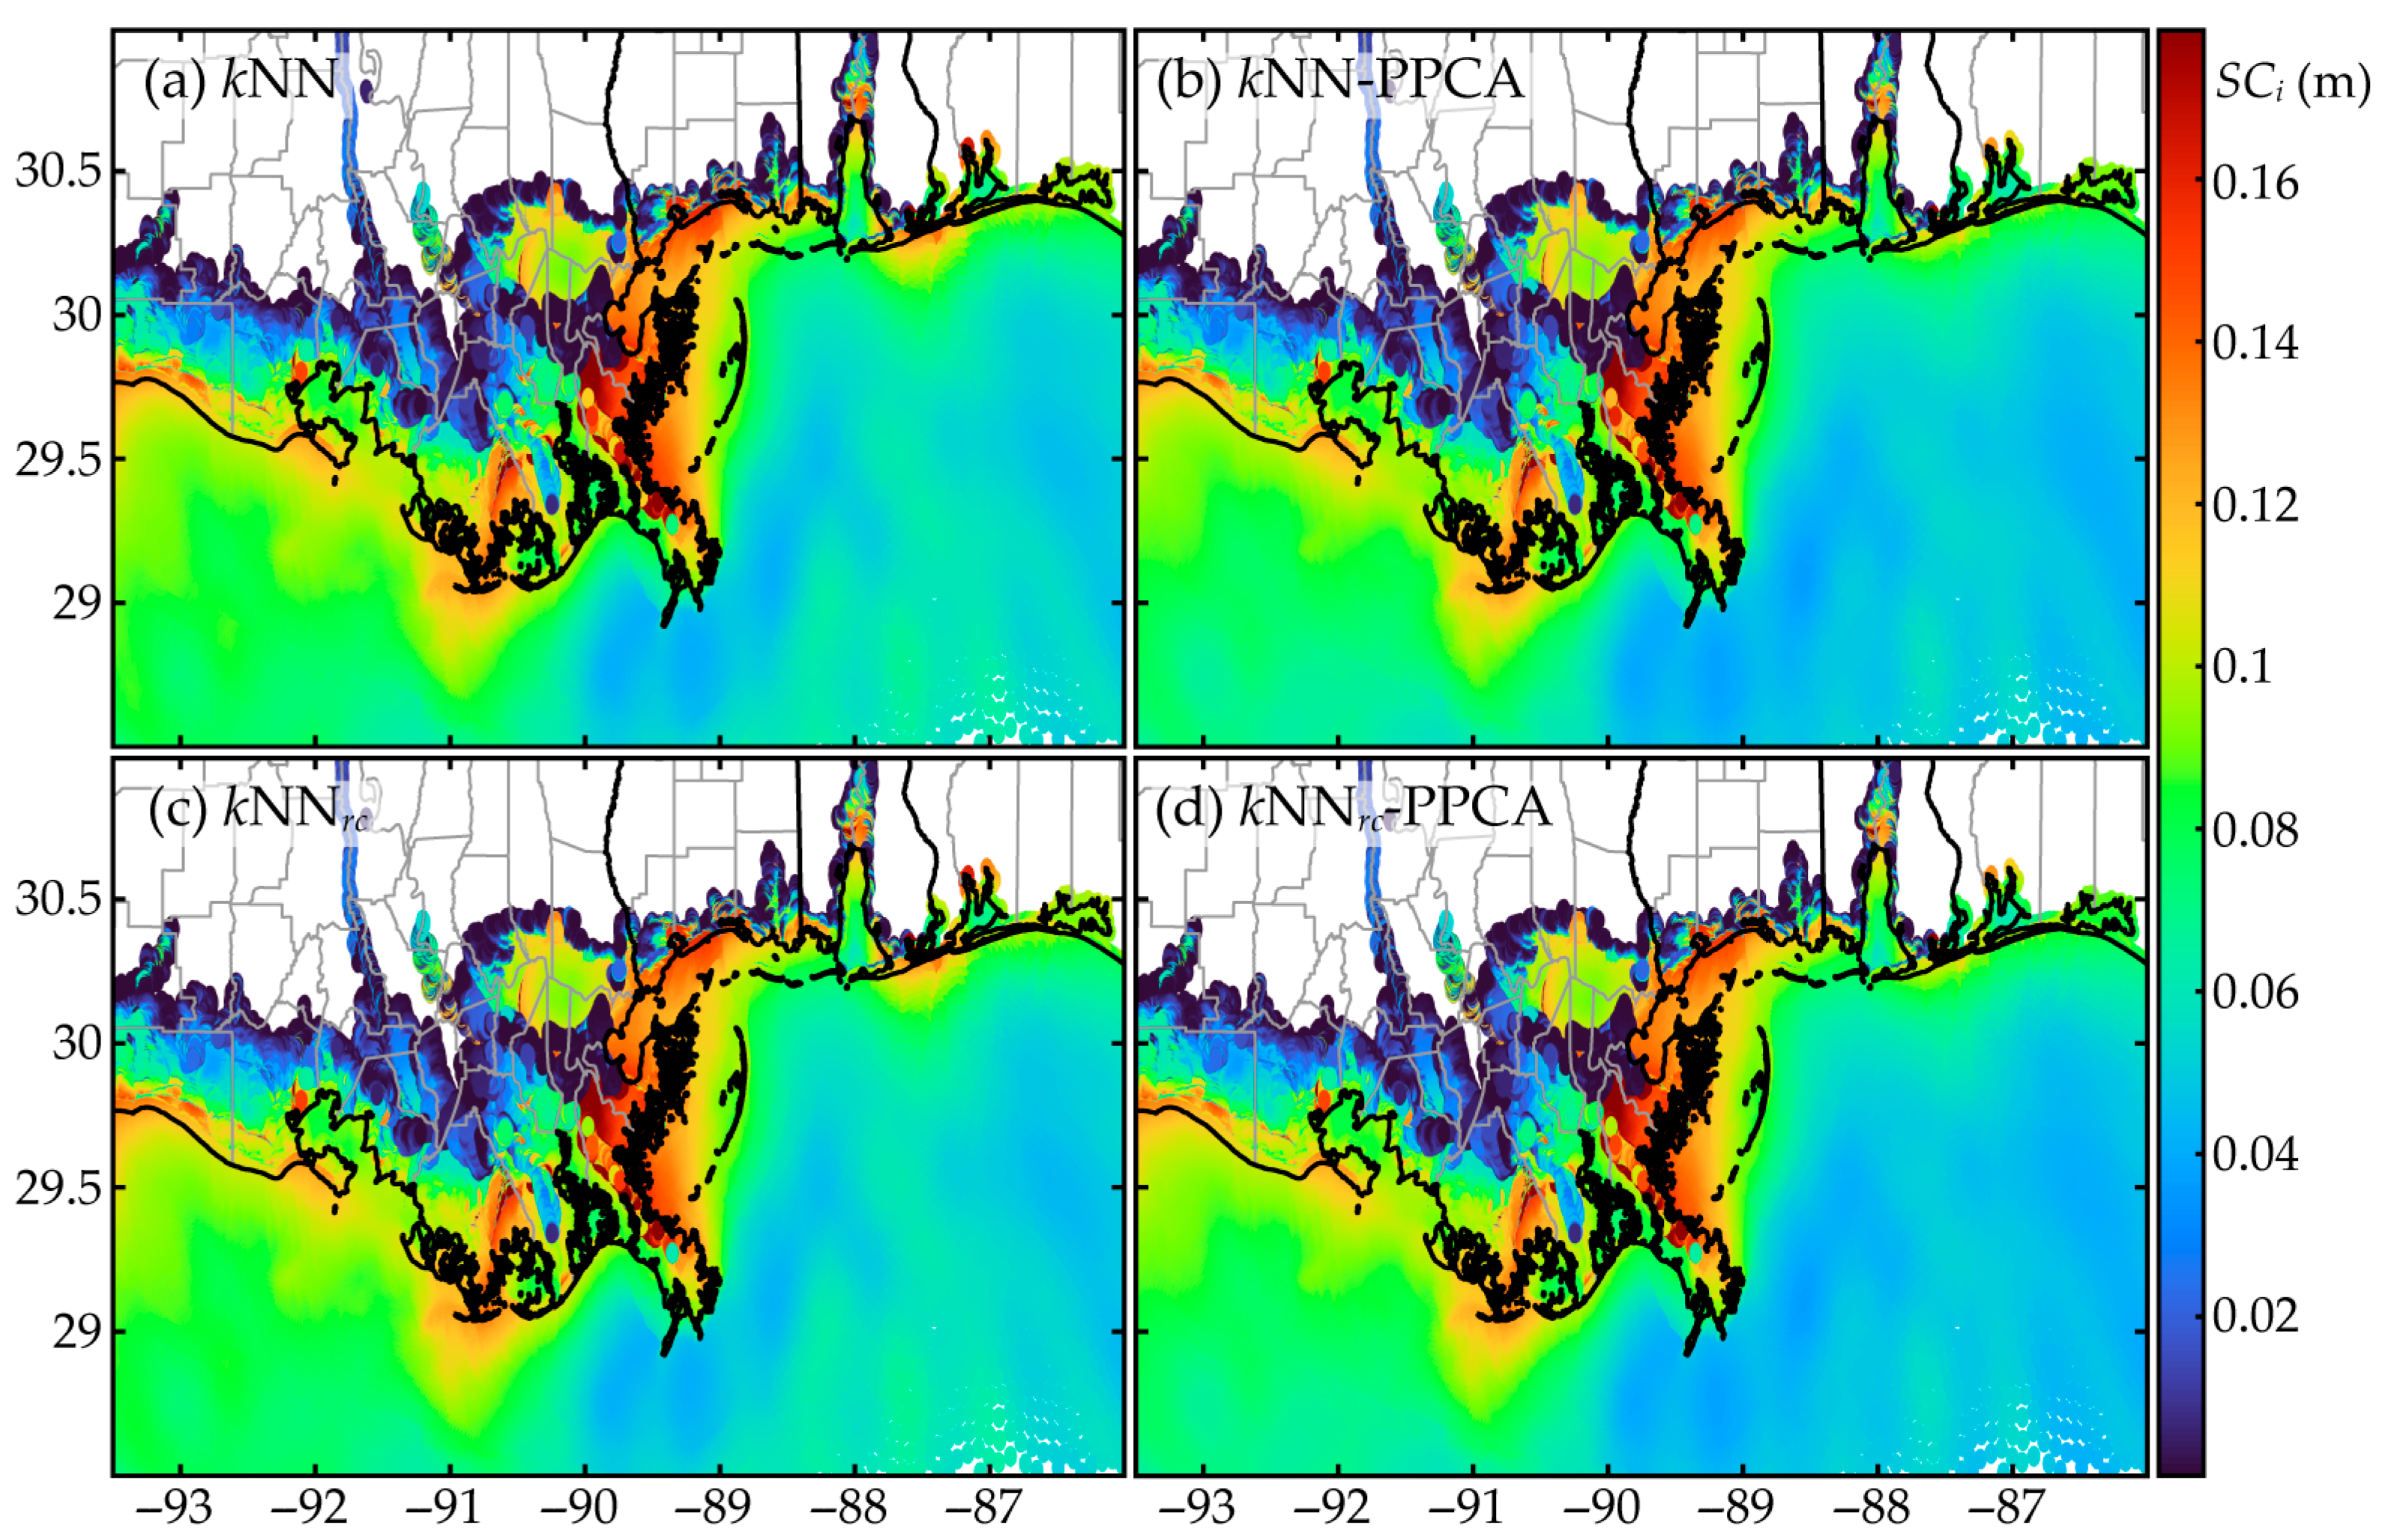
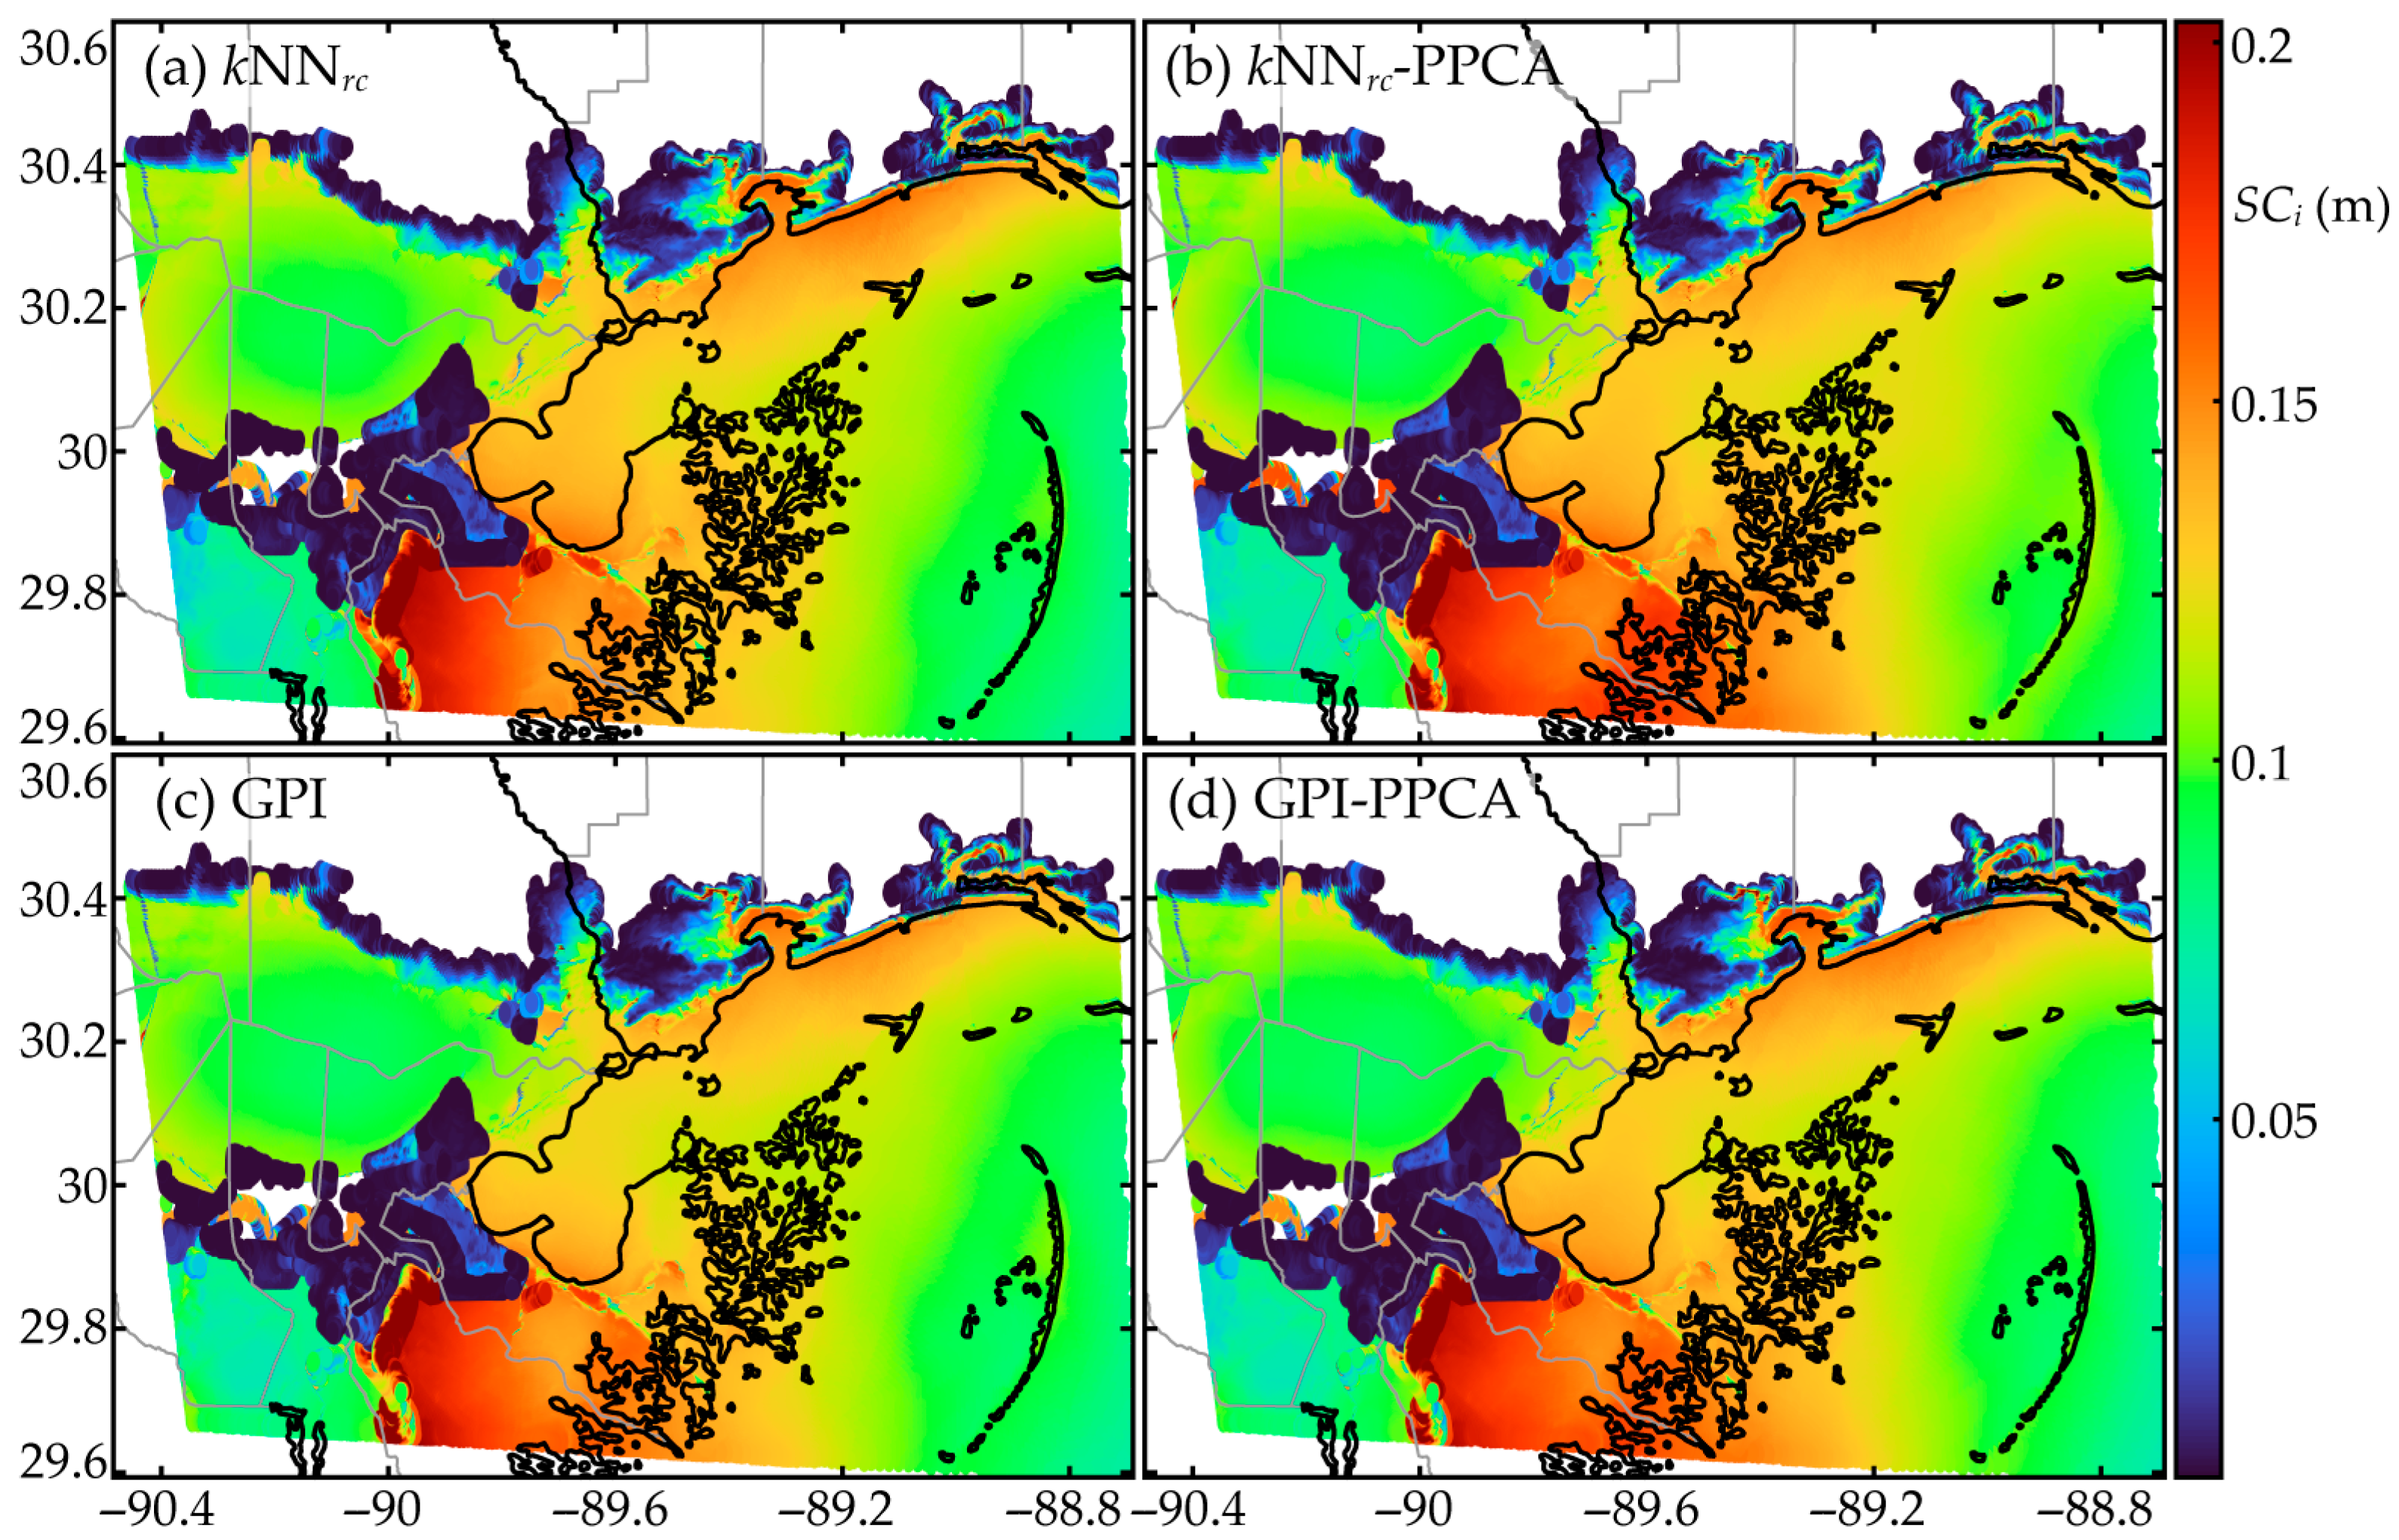
Results are presented for the entire database consisting of n z = 1,179,179 nodes, with n r = 488,216 being dry in at least one storm, as well as for a smaller domain around New Orleans with n z = 200,200 nodes, shown with the red boundary in Figure 3, with n r = 79,536 being dry in at least one storm, respectively. The smaller database is introduced in order to accommodate the efficient implementation of the GPI-based imputation. Even with adaptive covariance tapering, this implementation cannot scale to the n z = 1,179,179 nodes case unless a large-memory GPU-based workstation is utilized (see discussions in Section 5.3). A partitioning of the entire domain into smaller subdomains is needed to facilitate the GPI-based imputation. Without loss of generality, in the case study, the focus is placed on one of these subdomains only, with the understanding that implementation across the entire domain can be facilitated by repeating the process for other subdomains. The consideration of the subdomain allows, additionally, examination of the robustness of the different imputation strategies [especially of data-completion strategies as will be showcased in the discussions in Section 7.4] with respect to the size of the considered database. The notations Df (full domain) and Ds (subdomain) are introduced to distinguish the different domains (and corresponding datasets). The spatial distribution of nodes, along with the proportion of instances in which they are inundated, is presented for Df and Ds in Figure 3a and Figure 3b, respectively. Additionally, surge gaps of once-dry nodes within Df and Ds are presented, respectively, in Figure 4a and Figure 4b. It is evident from these figures that the large storm surge gaps appear in regions with predominantly dry nodes, appearing next to flood protection systems around New Orleans. Note that Figure 3 and Figure 4 will be revisited in Section 7.5 when examining the spatial distribution of surrogate model prediction errors.
Imputation is performed using (i) spatial interpolation (kNN, GPI) or (ii) data completion (PPCA) as well as a combination of (i) and (ii) through the two-stage implementation presented in Section 6.3. Notations kNN, GPI, PPCA or, for the combined implementations, kNN-PPCA and GPI-PPCA will be used to distinguish the different cases. Note that the GPI variants (GPI and GPI-PPCA) will be only examined for the Ds domain. Additionally, for the kNN implementation, two formulations will be explored for incorporating hydraulic connectivity: the previous strategy [22] using the ADCIRC grid to define this connectivity and the newly proposed approach using a response-based connectivity. Notation kNNrc will be used to differentiate the approach when the response-based connectivity is utilized, with notation kNN used for the original [22] formulation. The GPI implementation corresponds to sparsity ρ i = 0.12 % [250 connected neighbor per node]. The surrogate models are established using either the pseudo-surge database or the corrected pseudo-surge database. Results are presented for the combination of Ss and Sc surrogate models for the pseudo-surge database and for the use of only the Ss surrogate model for the corrected pseudo-surge database, as the intention of the modification of the pseudo-surge within this database is to avoid the use of the secondary classification surrogate.

7.2. Imputation Results

Results are initially discussed for the imputation statistics. To better frame discussion, some statistics for the databases are first reviewed in Table 2. This table presents the proportion of the nodes belonging to different groups: the once-dry nodes as well as nodes with a surge gap over specific thresholds. The respective percentages (%) of instances, where these nodes are inundated within the original database, is also shown in this table. Table 3 and Table 4 then present similar statistics for the different imputation approaches, with Table 3 presenting results for the individual imputation variants, and Table 4 presenting results for the two-stage combination variants. Specifically, these tables present the proportion of the once-dry nodes that belong to the problematic node set A p n , as well as the nodes that belong to groups C 2 and C 3 . Recall that group C 2 corresponds to the modified problematic node set A ¯ p n and C 3 to its complement. Similarly to Table 3, the respective percentages (%) of instances that these nodes are inundated within the original database is also shown.
Results show that the problematic nodes (group A p n or C 2 ) correspond to predominantly dry nodes in the original database, a trend agreeing with the one illustrated in [22]. Comparing across the imputation techniques relying on spatial interpolation (kNN variants and GPI), the kNN with response-based connectivity between nodes (kNNrc) shows some small degradation of performance over kNN, with percentages of nodes belonging to groups A p n or C 2 increasing. GPI demonstrates an additional, larger performance degradation over the kNN variants. It should be pointed out that these preliminary results should not be interpreted as preference for kNN over kNNrc and GPI; the performance of the imputation strategies needs to be examined with respect to the accuracy of the supported surrogate model and not with respect to small increases in the number of problematic nodes. On the other hand, the data completion strategy, PPCA, leads to a significant reduction in imputation quality, with almost all imputed nodes falling into the problematic category according to the results in Table 3. Though not definitive, this pattern provides a strong indication that this imputation approach will not be beneficial for peak-surge imputation.
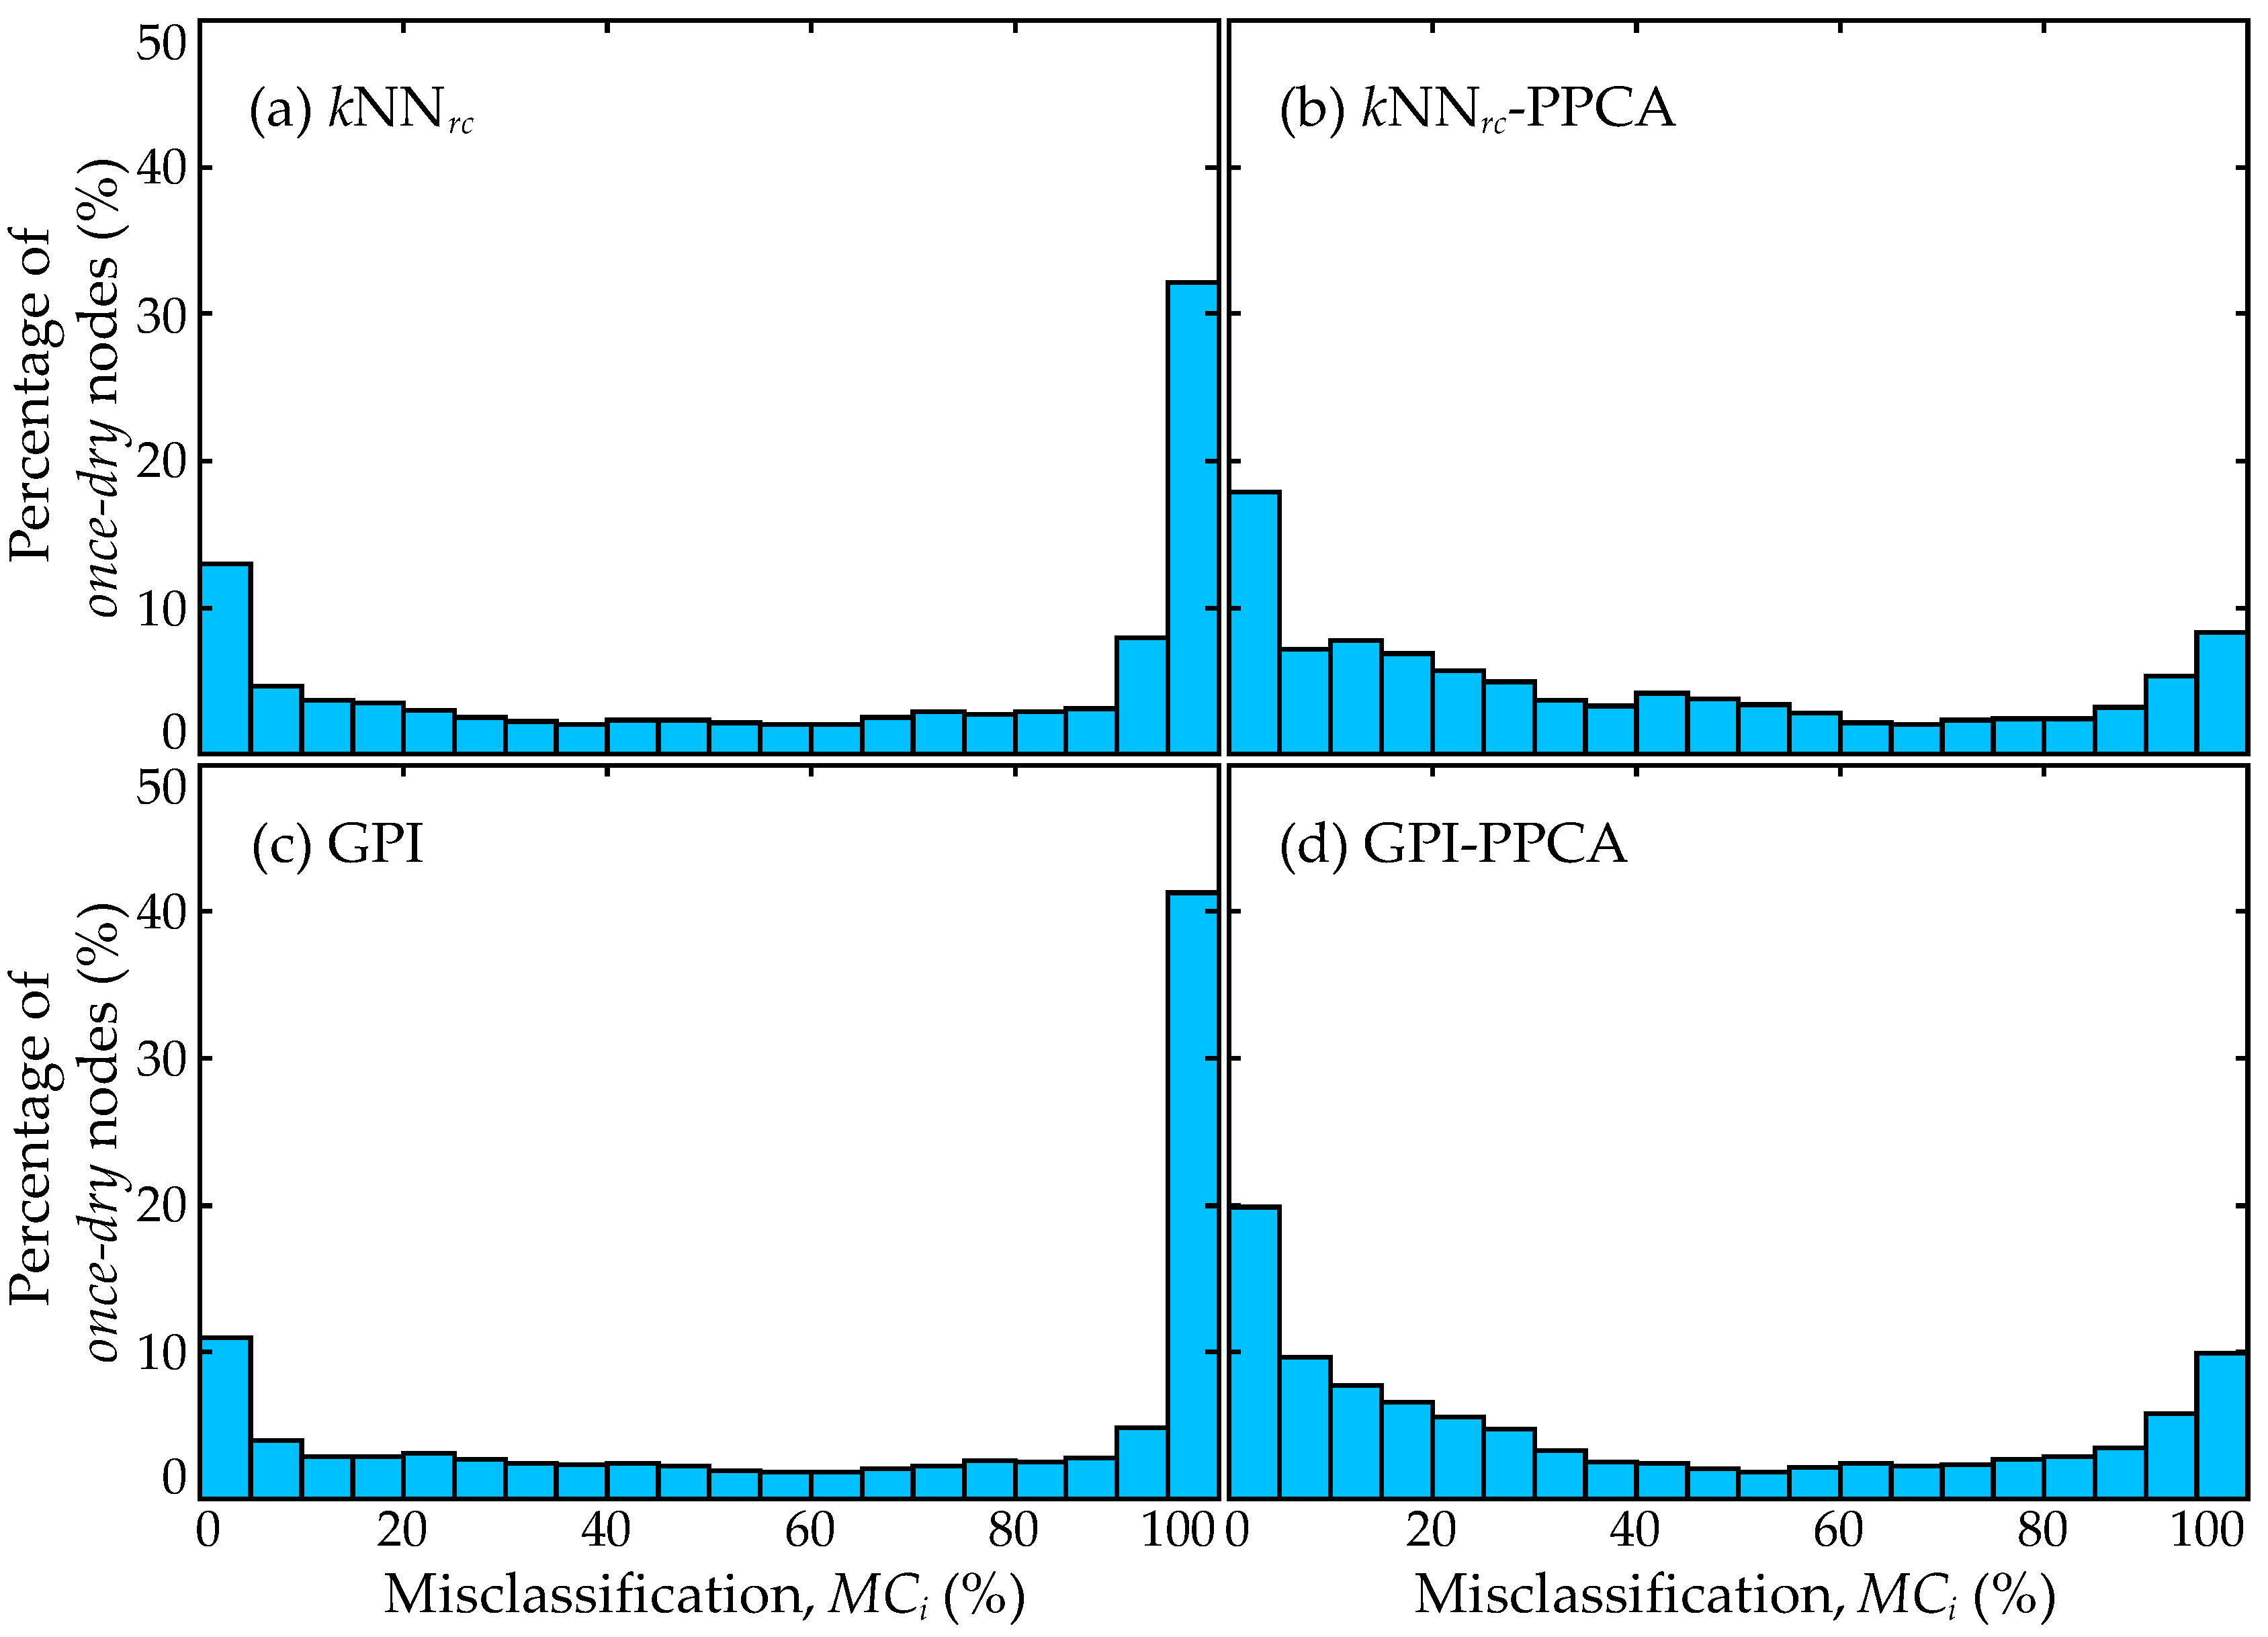
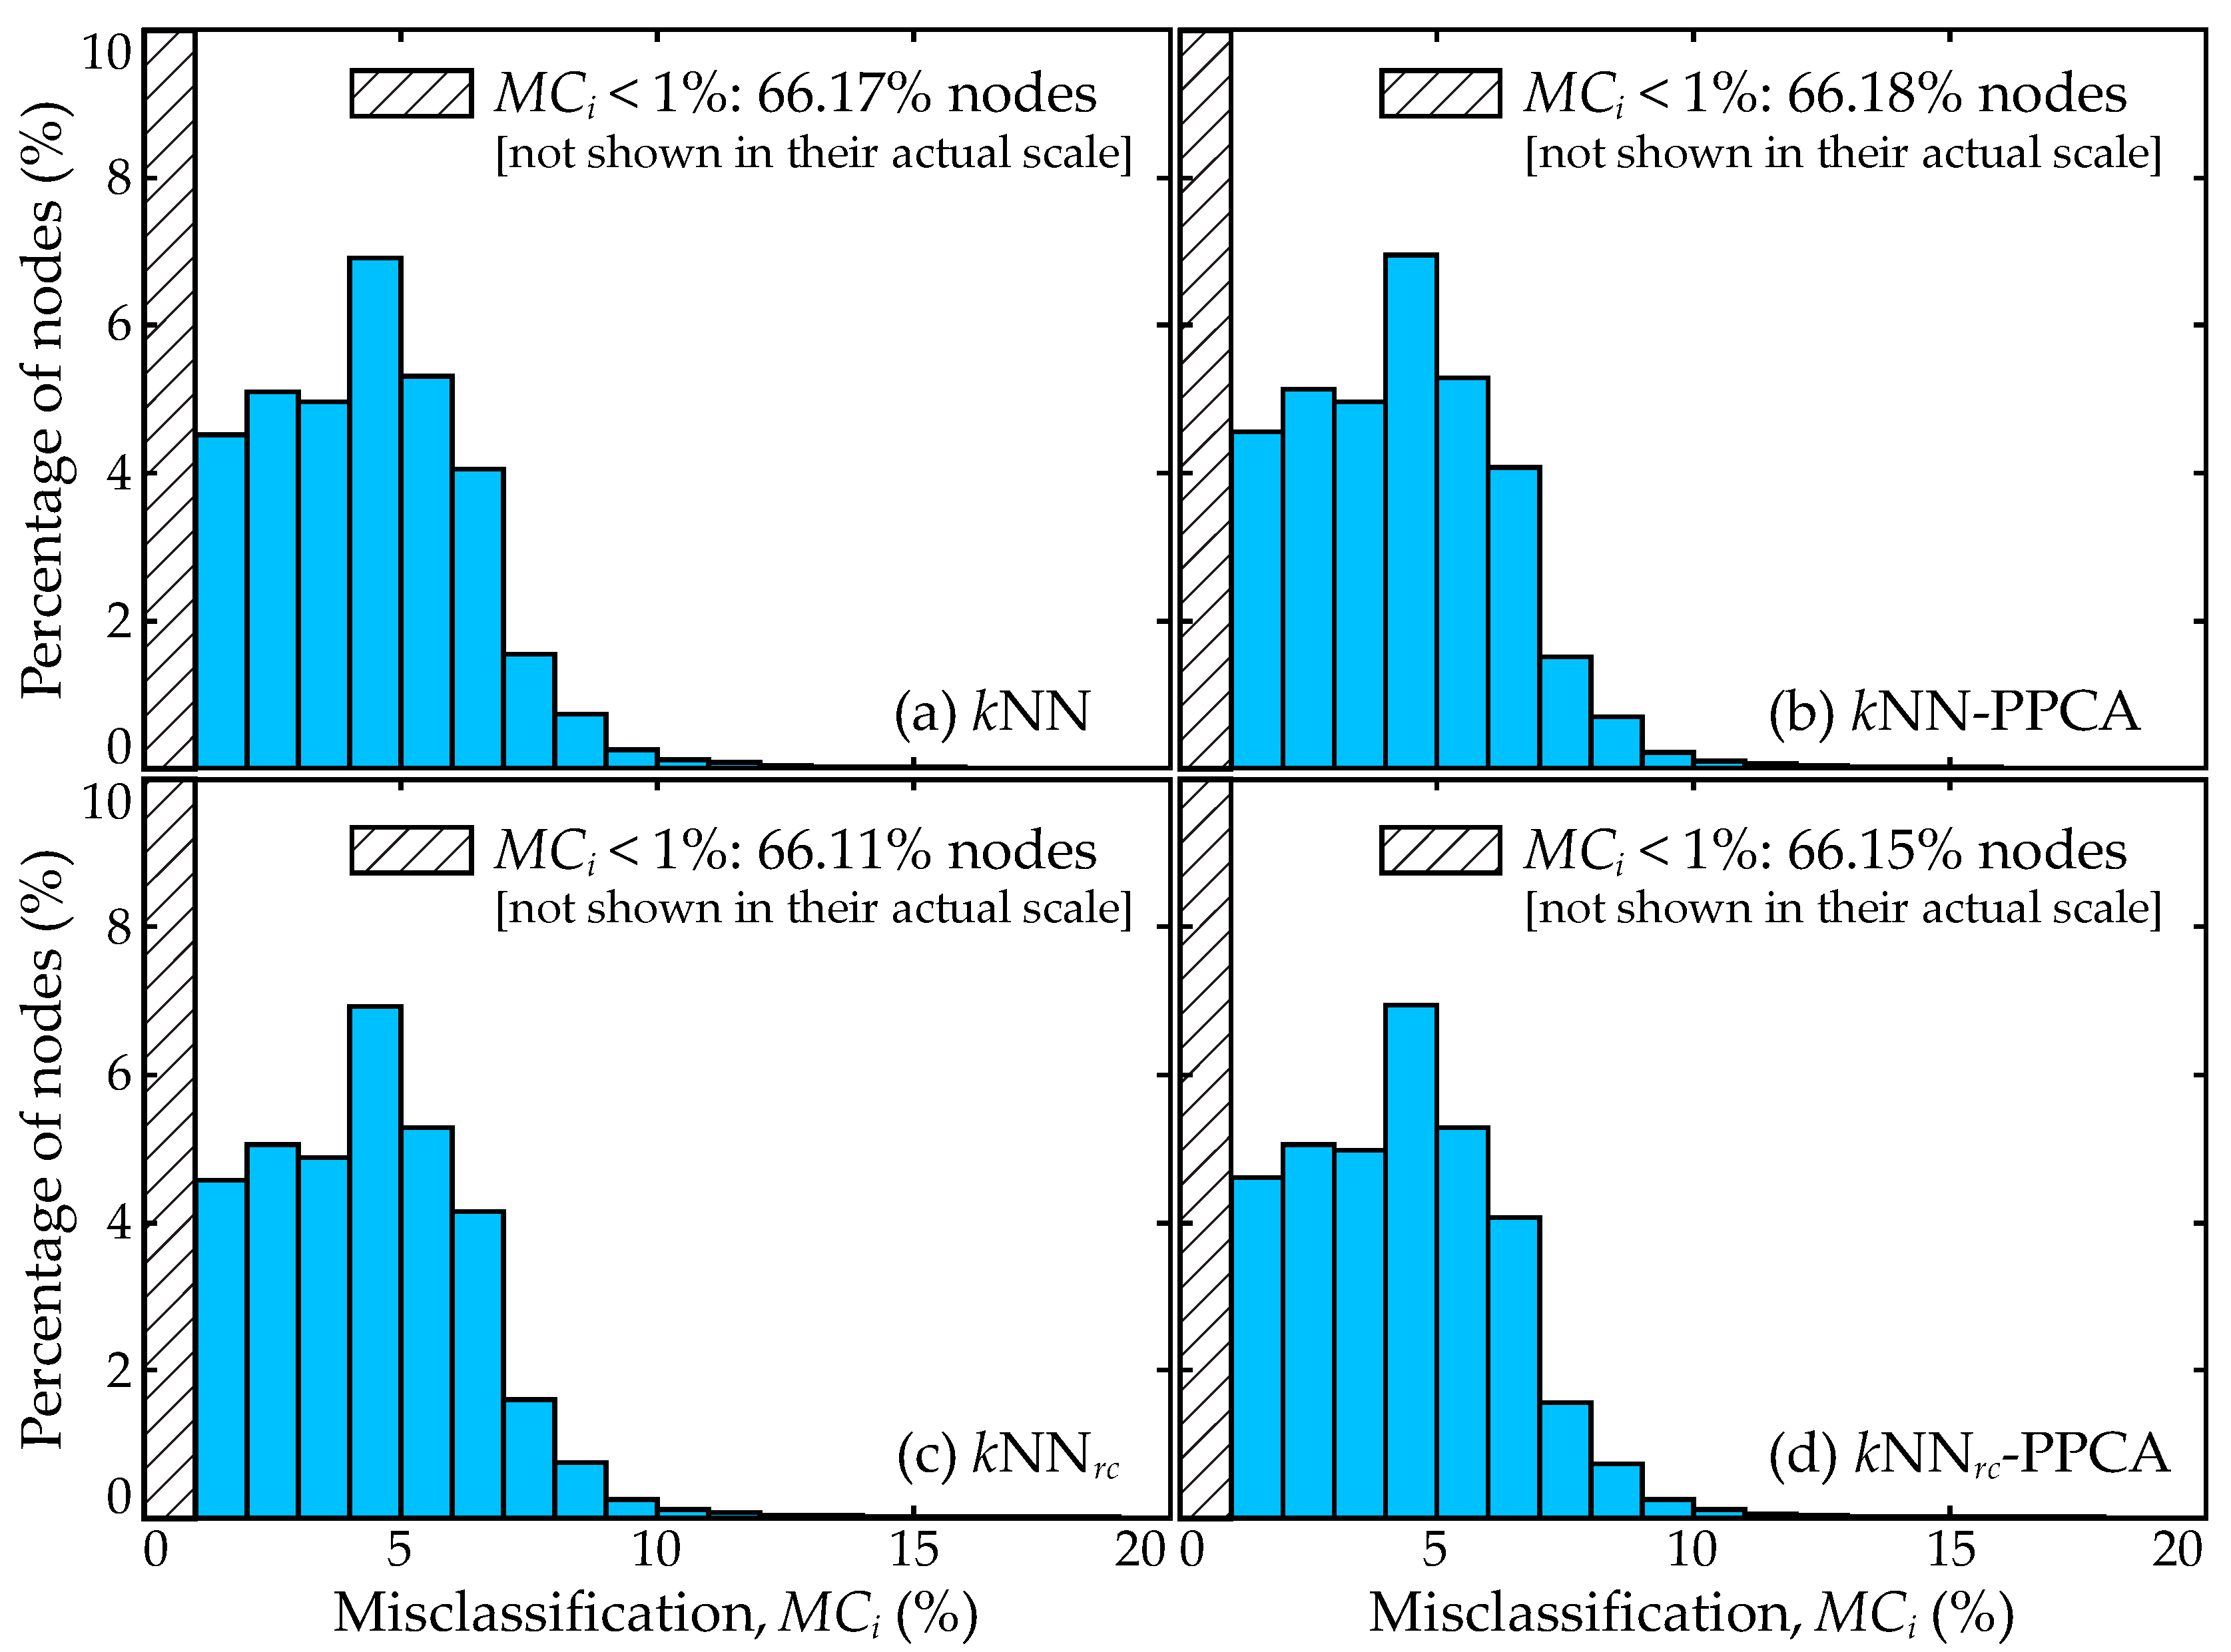
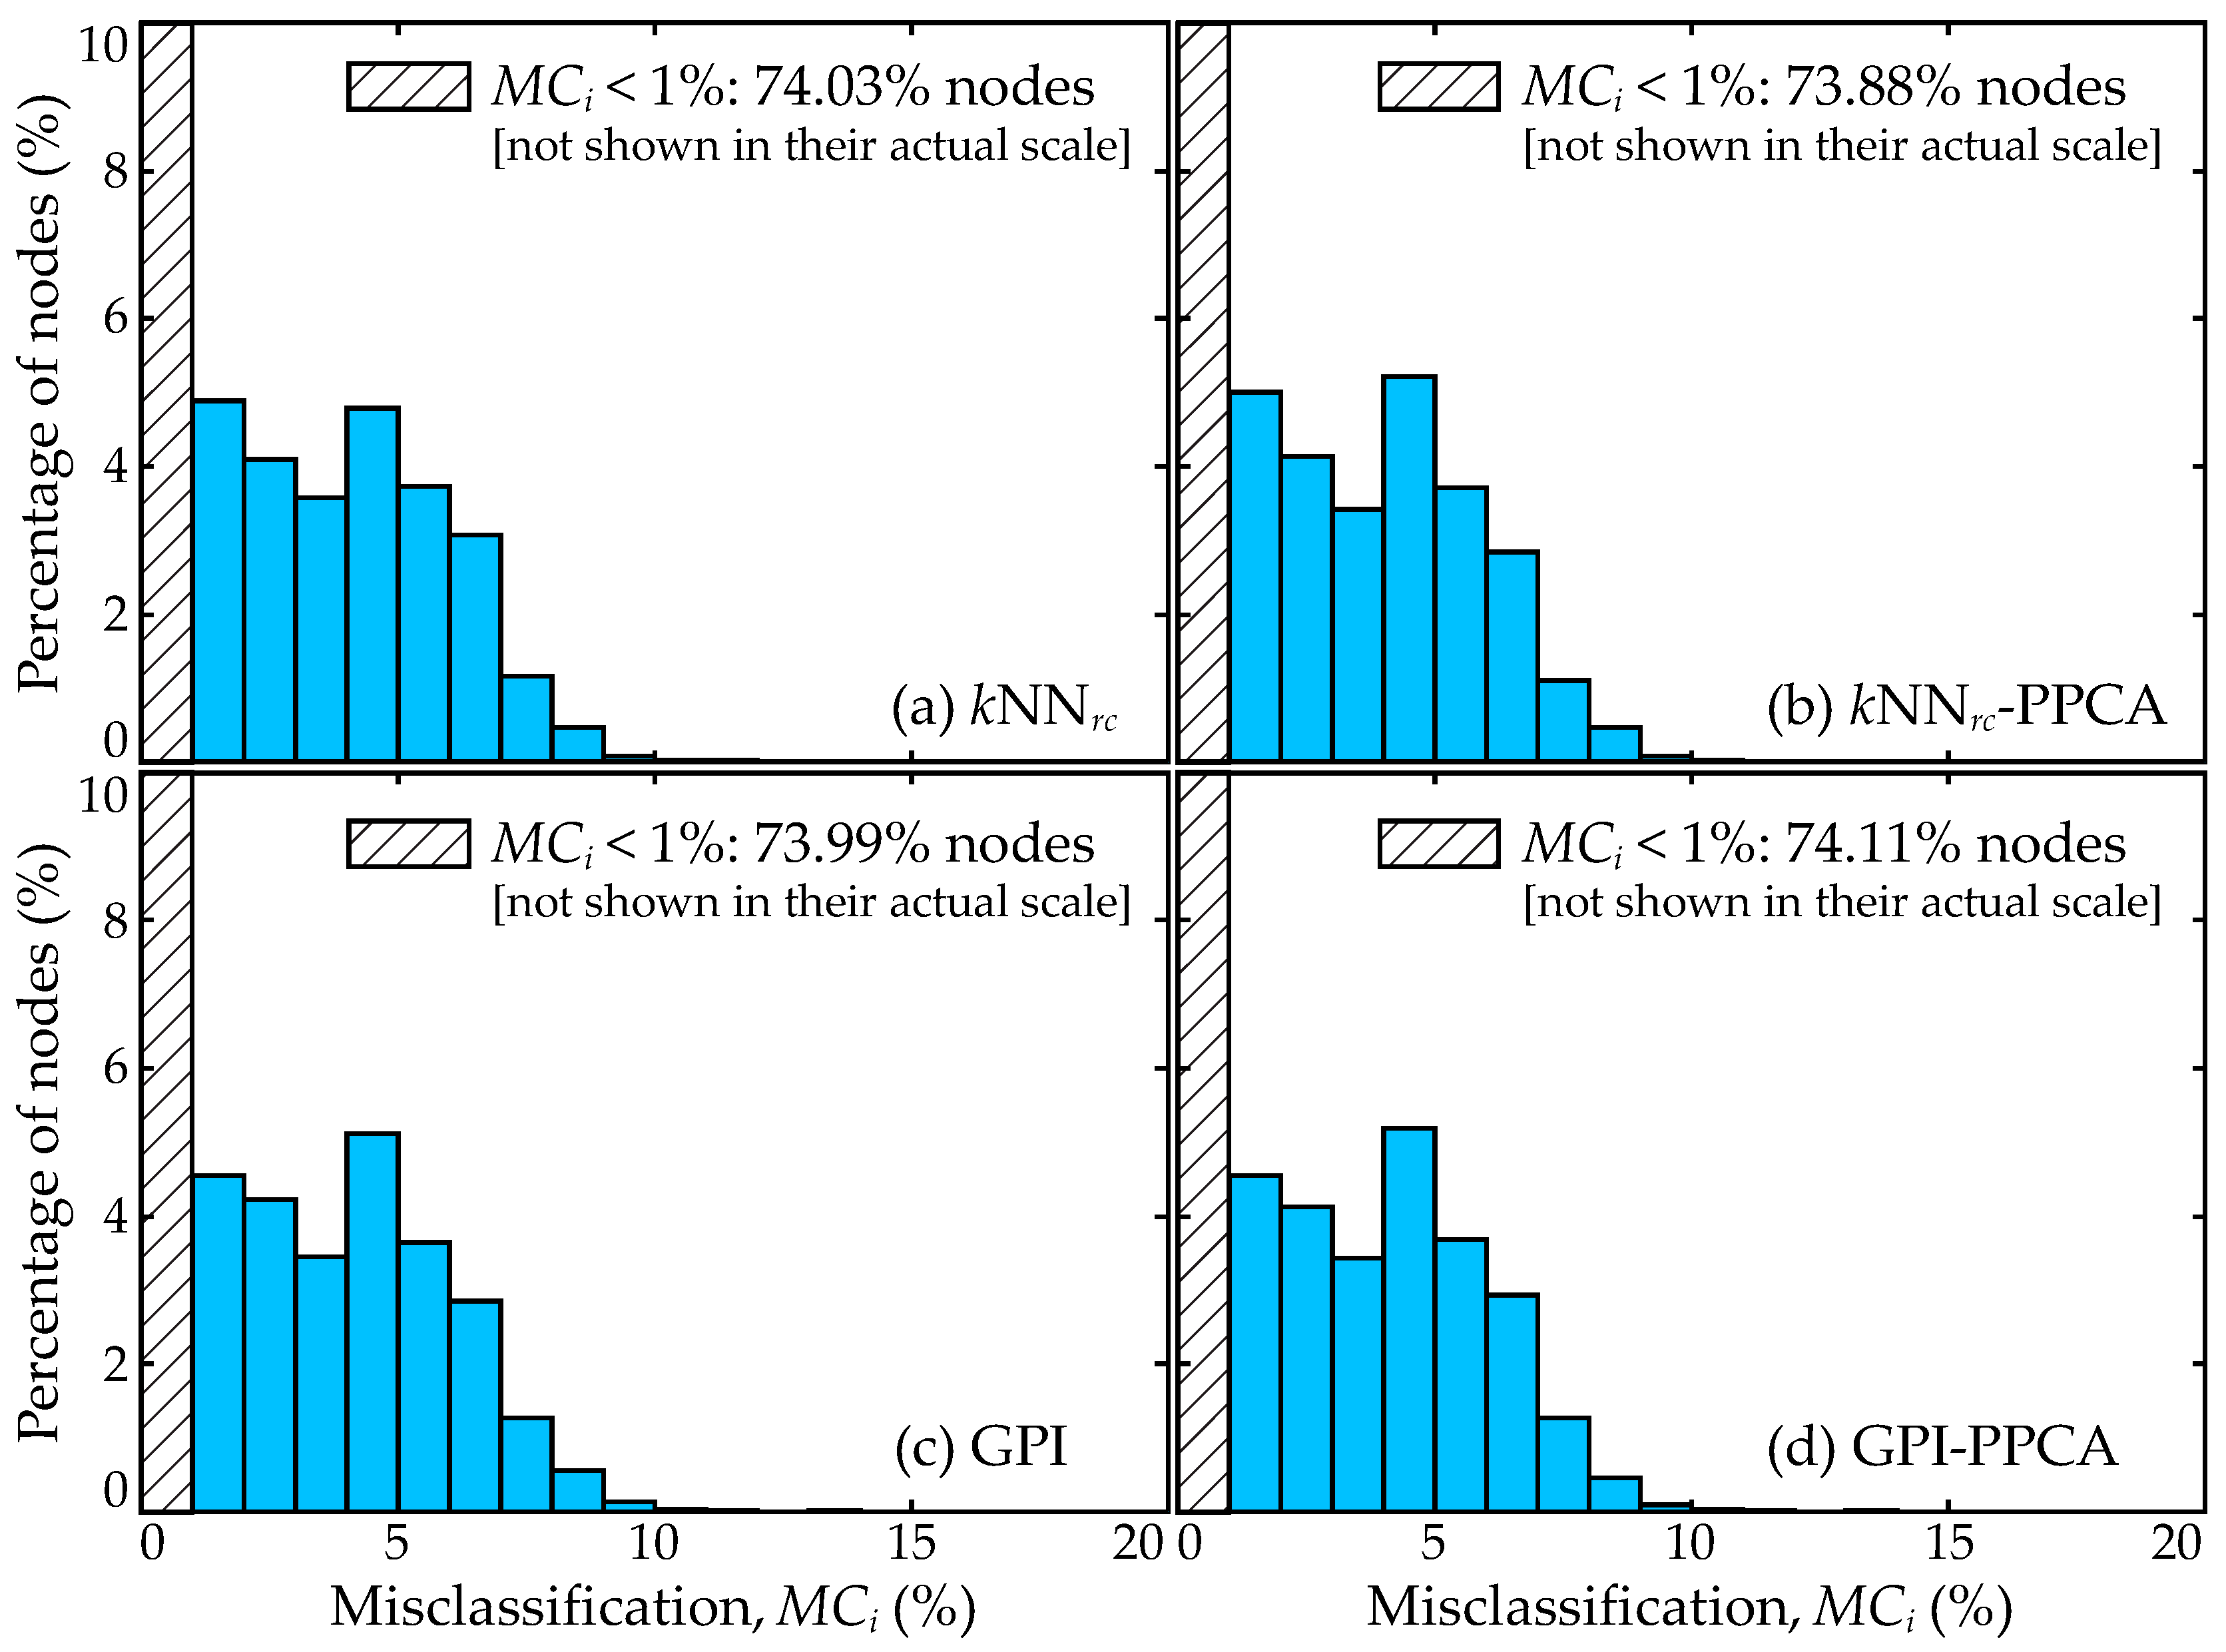
Results for the two-stage combination variants in Table 4 show a significant improvement compared to PPCA, and moderate improvement for the kNN and GPI variants with respect to both A p n and C 2 . For PPCA-based imputation, comparisons across Table 3 and Table 4 verify the expectations presented in Section 6.3. Enriching the information for predominantly dry nodes through initial spatial interpolation is highly beneficial for the data completion imputation strategies. The two-stage combination also illustrates improvements over the pure spatial interpolation strategies, especially GPI. To further examine the improvement achieved through the combination, the histograms of the misclassification of the imputation for the once-dry nodes, with (subplots in the left column) or without the data completion (subplots in the right column), are presented in Figure 5 and Figure 6, respectively, for Df (full domain) and Ds (subdomain). In Figure 6, the results for kNN and kNN-PPCA are not presented as they are almost identical to those for kNNrc and kNNrc-PPCA. The results in the figures clearly demonstrate that the second stage of implementing PPCA-based data completion helps to reduce the portion of nodes with especially high misclassification (close to or over 80%), which is consistent with the observations from Table 3 and Table 4. As discussed in the previous paragraph, the important question is whether these benefits translate to improved predictive accuracy for the surrogate model developed based on the imputed datasets. It is important to note that the trends across all tables are very comparable between the domains Df and Ds, illustrating a degree of similarity between them.

7.3. Surrogate Model Performance for the Entire Domain

The performance of the imputation strategies is evaluated next with respect to the accuracy of the established surrogate models. In this section, results for the entire database Df are discussed, meaning that only kNN variants are examined for imputation using spatial interpolation. Results for the subdomain Ds will be examined in the next section. The validation metrics correspond to the misclassification and surge score discussed in Section 4.3. Results are presented for different node groupings: the entire domain, the once-dry nodes, nodes set for different surge gaps, and groups C 2 and C 3 . It should be pointed out that groups C 2 and C 3 change across the variants, as illustrated earlier in Table 3 and Table 4, meaning that comparisons of their statistics across the variants do not yield any meaningful trends. Results for these groups are only presented for examining trends within each variant. Table 5 shows results for the surge score S C ¯ , Table 6 results for the total misclassification M C ¯ , Table 7 for the false positive misclassification M C ¯ + , and Table 8 for the false negative M C ¯ misclassification. As discussed in Section 7.1, results are presented for the combination of Ss and Sc surrogate models for the pseudo-surge database and for the use of only the Ss surrogate model for the corrected pseudo-surge database. To examine in detail the imputation quality, corresponding results when using the Ss surrogate model for the pseudo-surge database are presented in Table A1, Table A2, Table A3 and Table A4 in Appendix G. The presentation mirrors the ones in Table 5, Table 6, Table 7 and Table 8. It should be pointed out that this formulation is not a recommended implementation for storm surge surrogate modeling [22]; the two formulations whose results are presented in Table 5, Table 6, Table 7 and Table 8 are the promoted alternatives.
Before discussing the results, it is important to stress that to evaluate and ultimately compare the performance of the imputation strategies, all the tables need to be comprehensively examined altogether, with primary focus on the surge score (Table 5) which directly represents the predictive accuracy of the resultant surrogate models, and secondary focus on the total misclassification (Table 6) which quantifies the quality of the inundation state predictions. The false positive and false negative misclassification results can be used to interpret the trends in the performance and should be linked to the surge score and total misclassification, and to the characteristics of each imputation strategy, as discussed in Section 5 or Section 6. For example, a low false negative rate that is not combined with a low total misclassification rate does not show superiority, rather that there is an over prediction bias. Such a bias will be naturally reflected with a higher surge score and therefore will be identified when results across all tables are comprehensively evaluated.
Performance across the different databases or combination of regression and classification options verify the trends observed in [22]. The combination of Ss and Sc provides the best overall performance with results relying on the use of Ss only consistently yielding lower accuracy (larger surge score values in Table 5 and Table A1 and larger misclassification in Table 6 and Table A2), predominantly originating from false positive predictions as evident from Table 7and Table A3. The performance deteriorates significantly when only Ss is implemented utilizing the pseudo-surge database without any corrections (Table A1, Table A2, Table A3 and Table A4). As discussed in Section 4, these trends, especially the propensity for false positives, are expected and originate from the wrong information introduced into the database during the imputation process supporting the development of the regression surrogate model. Note that this propensity still exists when the corrected pseudo-surge database is utilized (Table 5, Table 6, Table 7 and Table 8). The propensity, in this case, can be attributed [22] to the inability of the correction (setting surge value to be always smaller than the node elevation) to capture the appropriate underlying variation characteristics for the pseudo-surge across the storms with different characteristics in the original database. However, the predictive accuracy of all considered surrogate model implementations deteriorates consistently for the problematic nodes corresponding to large surge gaps, demonstrating the challenges associated with this type of nodes.
Moving now to the comparison across the different imputation variants, focusing first on the different kNN strategies, both exhibit similarly good performance in general (Table 5, Table 6, Table 7 and Table 8). However, the use of the response-based connectivity between nodes, i.e., the kNNrc case, results in the best performance (lower surge score and best misclassification results) for the surrogate model implementation corresponding to the combination of Ss and Sc, especially for the problematic nodes with larger surge gaps (Table 5). These are important results, as they demonstrate that incorporating hydraulic connectivity based on surge response similarity into the imputed database can improve the predictive performance of the surrogate model for more challenging regions without compromising its accuracy for other regions, which was the motivation for introducing the new concept of hydraulic connectivity. When predictions rely strictly on the use of the regression surrogate model (Ss), either utilizing the pseudo-surge database or the corrected pseudo-surge database, kNN demonstrates superior performance compared to kNNrc, primarily originating from better false positive misclassification accuracy (Table 7 and Table A3). This pattern agrees with the trends reported earlier in Table 3 related to kNN yielding smaller percentage of problematic nodes. In this case, however, these trends suggest that while Ss developed from the kNN-imputed database tends to underestimate surge levels for nodes with large surge gaps, the higher false positive rate of Ss developed from the kNNrc-imputed database can actually improve final prediction accuracy for these nodes when combined with Sc. This stresses, again, an advantage for introducing response-based connectivity information in the imputation process, as the approach can ultimately promote more accurate predictions for the storm surge.
Imputation based entirely on data completion (PPCA) shows superior performance compared to the other imputation strategies when considering the implementation that uses Ss only, based on the pseudo-surge database (Table A1, Table A2, Table A3 and Table A4). Its superiority originates from better false positive misclassification for the highly problematic nodes with larger surge gaps. This should be attributed to the ability of the promoted data completion strategy to better fit the underlying trends for the original database. Still, this performance is substantially worse compared to strategies relying on the combination of Ss and Sc surrogates or the use of the corrected pseudo-surge database (Table 5, Table 6, Table 7 and Table 8), and so it should not be interpreted as superiority of the PPCA imputation strategy. In fact, in Table 5, Table 6, Table 7 and Table 8, PPCA slightly underperforms the spatial interpolation variants, with vulnerabilities originating from the false positive misclassification for the corrected pseudo-surge database strategy (use of Ss only) and from the false negative misclassification for the pseudo-surge database strategy (use of combination of Ss and Sc). This change in the patterns should be attributed to the larger portion of nodes identified as problematic for the PPCA implementation (Table 2). Overall, the discussions indicate a small preference for the spatial imputation strategies over the pure data completion ones.
Finally, examining the two-stage imputation strategies, kNN-PPCA and kNNrc-PPCA, they demonstrate the best overall performance and the most robust trends across the different surrogate modeling strategies. This is not surprising, as they combine the two imputation approaches to fully leverage their complementary strengths and include an intermediate check that ultimately reduces the number of problematic nodes, as evident in the results in Table 4 (compare values to those in Table 3). This intermediate check and the enrichment of the information for PPCA contributes to a remarkable improvement, compared to the alternative imputation variants, when considering implementation using the Ss only, based on the pseudo-surge database (Table A1, Table A2, Table A3 and Table A4). More importantly, it yields some improvements, though admittedly smaller compared to the other imputation variants, for the promoted surrogate modeling alternatives presented in Table 5, Table 6, Table 7 and Table 8. The improved performance seems to originate from better misclassification rates. Overall the discussion shows that for peak storm surge predictions, the combination of spatial interpolation (stage 1) and data completion (stage 2) imputation strategies supports higher accuracy surrogate modeling predictions, a trend that agrees with the results reported in [26] for time-series predictions.

7.4. Surrogate Model Performance for the Subdomain

This section evaluates the performance of the imputation strategies with respect to the accuracy of the established surrogate models for the subdomain Ds. Results are presented for the two promoted surrogate model alternative implementations in Table 9, Table 10, Table 11 and Table 12, mirroring the presentation format of Table 5, Table 6, Table 7 and Table 8. Additionally, results are presented in Table A5, Table A6, Table A7 and Table A8 for the implementation using only the Ss surrogate model with the pseudo-surge database, mirroring the presentation format of Table A1, Table A2, Table A3 and Table A4. In all instances, results for the GPI imputation strategy are also reported in this section.
With respect to the remaining imputation strategies, excluding the GPI implementation, the trends are similar to the ones presented in Section 7.3, with the primary difference being a relatively small reduction in the performance of the imputation strategies utilizing data completion, especially PPCA, but also kNN-PPCA and kNNrc-PPCA. This should be attributed to the 6-fold reduction in the database size (from Df to Ds). This negatively influences the quality of imputation by data completion, and subsequently the performance of the established regression surrogate model. The consistency of the remaining trends, and the justified small reduction in the performance of the approaches relying on data completion imputation, provide a strong validation of the results and arguments presented in Section 7.3, demonstrating that they are not database dependent.
Focusing now on the performance of GPI imputation, it offers comparable results to the other imputation approaches relying on spatial interpolation, kNN and kNNrc, demonstrating that it is a viable alternative. This holds true both on its own (GPI) and when combined with data completion within the two-stage imputation strategy (GPI-PPCA). The trends vary across the different surrogate model strategies, i.e., whether the combination of Ss and Sc is used or whether predictions are established using solely Ss based on the pseudo-surge database or the corrected pseudo-surge database. The best overall performance is established when utilizing the combination of Ss and Sc, as expected, and performing imputation based on GPI or GPI-PPCA. For the highly problematic nodes, corresponding to larger surge gaps, kNNrc still remains the preferred choice.
Overall, these comparisons, coupled with the discussions in Section 7.3, demonstrate that spatial interpolation with global characteristics (i.e., GPI) tends to better capture the global trends for the surge behavior compared to spatial interpolation based on localized characteristics (kNN variants). Still, the latter have the ability to better capture the discontinuous behavior around problematic nodes corresponding to large surge gaps, especially when connectivity information based on flooding patterns is leveraged within the imputation process, as evident by the superiority of kNNrc over kNN. Combining spatial interpolation with data completion imputation strategies offers additional robustness in the predictions and has the potential to further improve accuracy, depending on the quality of the information (size of database) available for the data completion approaches.

7.5. Trends for Distribution of Errors

This section examines the distribution of errors (surge score and misclassification) for the best performing variants that were identified in Section 7.3 and Section 7.4. These correspond to kNNrc and GPI as well as their counterparts when coupled with PPCA, kNNrc-PPCA, and GPI-PPCA (all variants corresponding to those using pseudo-surge database with surrogate model combination of Ss and Sc). Figure 7 and Figure 8 present results for the spatial distribution of the surge score across the nodes, with Figure 7 offering results for the entire domain Df and Figure 8 for the subdomain Ds. Figure 9 and Figure 10 present results for the histogram of misclassification for the same implementation variants illustrated in Figure 7 and Figure 8, corresponding to the entire domain Df and Figure 8 for the subdomain Ds, respectively.
Focusing first on the spatial distributions of the surge score (Figure 7 and Figure 8), the surge scores of nodes that are closer to those with large surge gaps are generally larger (see the locations of once-dry nodes and their surge gaps in Figure 4), whereas predominantly dry nodes (those with lower wetness in Figure 3) have small surge score values regardless of their proximity to the nodes with large surge gaps. The former trend is expected as nodes with larger surge gaps pose greater challenges in achieving accurate surge predictions, both for themselves as well as for nearby nodes. The better accuracy for the predominantly dry nodes can be attributed to the incorporation of the classification surrogate model Sc, which enhances the predictive accuracy of node conditions significantly. When comparing surge score distributions between variants, the spatial distribution trends remain largely the same, with very small differences across the different variants. This is true even when focusing on the comparisons to the variants with (subplots in the right column) and without data-completion (subplots in the left column); the two-stage imputation strategy contributes to a slight general improvement in the accuracy, consistent with observations reported from Table 5 and Table 9, though the distributions do not significantly change. The patterns are the same for both the entire domain Df and the subdomain Ds.
Examining next the histograms of the misclassification (Figure 9 and Figure 10), small misclassification is reported for most of the domain, with nodes that exhibit higher than 5% misclassification corresponding to only a small portion of the database: less than 15% for the entire domain Df and less than 10% for the subdomain Ds. This result shows a remarkable robustness with respect to appropriately classifying the correct inundation state (dry or wet) for the vast majority of the nodes within the domain of interest. Again, small differences are exhibited across the variants, verifying the trends exhibited in Figure 7 and Figure 8 for similarity of the predictive performance across the nodes within the broader domain. This shows that the different variant implementations promoted here share the same robustness when evaluated with respect to the worst-case performance for individual nodes within the domain, either with respect to surge score (Figure 7 and Figure 8) or misclassification (Figure 9 and Figure 10) of the node inundation state.

8. Conclusions

The development of surrogate models or metamodels for the prediction of peak storm surge requires imputation of the original simulation data for inland nodes that have remained dry in some of the synthetic storm simulations to estimate the so-called pseudo-surge. This paper examined three distinct advancements for the imputation of peak storm surge databases. In the first advancement, the use of response-based correlation was examined for infusing hydraulic connectivity information within a kNN based spatial interpolation. The response-based correlation between nodes was defined using the binary response information representing the condition of each node (i.e., inundated or not), with only nodes whose correlation with the target node is higher than a specific threshold considered as candidate neighbors in the kNN implementation. In the second advancement, a Gaussian Process interpolation (GPI) was examined as a spatial imputation strategy, relying on a recently established adaptive covariance tapering scheme for accommodating an efficient GPI implementation for large datasets. In the third advancement, imputation using data completion, specifically utilizing PPCA, was examined as an alternative to spatial interpolation techniques. Additionally, the combination of spatial imputation with PPCA was also considered, with the objective to enrich the information before performing PPCA. The advantages of the advancements are examined with respect to the accuracy of the surrogate model that is subsequently calibrated using the imputed databases.
An illustrative case study regarding surrogate modeling predictions for Louisiana, focusing on New Orleans, was considered utilizing (and imputing) the Coastal Hazards System-Louisiana (CHS-LA) coastal storm hazards study database. A comprehensive k-fold cross validation implementation was established, and the key outcomes of the investigation are as follows:
  • As reported in previous studies, the best overall performance can be established by combining a regression and a classification surrogate models, with the regression model developed utilizing directly the imputed database without any corrections.
  • Spatial interpolation using response-based connectivity information can better capture discontinuous patterns in surge responses, demonstrating superiority in supporting surrogate model development with improved predictive accuracy at problematic nodes. Note that such nodes can be identified by the larger surge gaps in the original data.
  • Imputation utilizing GPI is a viable alternative (compared to kNN) imputation strategy based on spatial interpolation, and can better capture the global surge trends, offering superior overall performance. However, it cannot capture discontinuous patterns in surge responses, and extending GPI using response-based connectivity information within the covariance kernel is not straightforward. Nevertheless, this is a topic that should be investigated in the future.
  • Data completion imputation for the peak-surge demonstrates very poor performance, originating from the fact that for many (predominantly dry) nodes, very limited information is available in the original database to establish the underlying patterns to fill in the missing data. An enrichment stage of the original data, using spatial interpolation in the first stage, is needed for data completion to offer any advantages.
  • The two-stage imputation strategy combining spatial interpolation (stage 1) with data completion (stage 2) for the misclassified instances from the first stage offers additional robustness in the predictions and has the potential to further improve accuracy compared to the approach implemented in stage 1. The degree of improvement depends on the quality of information available for the second stage, which is a function of both the size of the database as well as the degree of enrichment established in the first stage for the originally predominantly dry nodes.
It is important to recognize that a limitation of the present study is that the quantification of performance improvement focused solely on the predictive accuracy of the established surrogate models (calibrated using the imputed databases). However, as coastal hazard is ultimately represented and communicated through risk descriptions derived from these predictions, such as storm surge thresholds with prescribed annual exceedance probabilities, future work should examine the impact of the different imputation strategies on the accuracy of such downstream hazard estimates.

Author Contributions

Conceptualization, A.A.T., W.J., C.I., and N.C.N.-C.; methodology, W.J., C.I., and A.A.T.; software, W.J. and C.I.; validation, W.J., C.I., and A.A.T.; data curation, N.C.N.-C., L.A.A., and M.C.Y.; writing—original draft preparation, A.A.T., W.J., and C.I.; writing—review and editing, A.A.T., W.J., C.I., N.C.N.-C., L.A.A., and M.C.Y.; funding acquisition, A.A.T. All authors have read and agreed to the published version of the manuscript.

Funding

This work has been done under contract with the U.S. Army Corps of Engineers (USACE), Engineer Research and Development Center, Coastal and Hydraulics Laboratory (ERDC-CHL), under grant number W912HZ-22-C-0041.

Institutional Review Board Statement

Not applicable.

Informed Consent Statement

Not applicable.

Data Availability Statement

Database of synthetic storms used in this study is part of the U.S. Army Corps of Engineers (USACE) Coastal Hazards System (CHS) program (https://chs.erdc.dren.mil, accessed 27 August 2025).

Acknowledgments

The support of the USACE Civil Works R&D and the Coastal Hazards System (CHS) program is gratefully acknowledged.

Conflicts of Interest

The authors declare no conflicts of interest.

Nomenclature

The following nomenclature and abbreviations are used throughout this manuscript:
Terminologies
always-wet nodesNodes that have been inundated across all storms in the database
once-dry nodesNodes that have been dry at least once (i.e., with missing data) in the database
problematic nodesNodes whose imputed pseudo-surge values were misclassified (above node elevations) at least once
pseudo-surge databaseDatabase in which all missing data are filled with pseudo-surge values through imputation
corrected pseudo-surge databaseDatabase in which all missing data are filled with pseudo-surge values through imputation, with any misclassified pseudo-surge values corrected to be below node elevations
Notations
A p n Group of problematic nodes
A ¯ p n Modified group A p n containing only problematic nodes with high misclassification rates and large discrepancies from node elevations
C 1 Class of always-wet nodes
C 2 Class of once-dry nodes whose pseudo-surge values exhibit high misclassification rates and large discrepancies from node elevations (corresponding to A ¯ p n )
C 3 Class of once-dry nodes whose pseudo-surge values exhibit low misclassification rates and small discrepancies from node elevations
SsRegression surrogate model used to predict surge levels
ScClassification surrogate model used to predict node condition (dry or wet)
DfFull domain containing 1,179,179 nodes
DsSubdomain of the full domain (Df) containing 200,200 nodes
Validation metrics
S C i Averaged surge score for the ith node across all storms in the database
M C i Misclassification rate for the ith node across all storms in the database
M C i + False positive rate for the ith node across all storms in the database
M C i False negative rate for the ith node across all storms in the database
V ¯ Averaged validation metric V i across all nodes ( V i = S C i , M C i , M C i + , or M C i )
Examined imputation strategies
kNNSpatial interpolation-based imputation using weighted k-nearest neighbor (kNN) interpolation, where the connectivity of original numerical model grids is considered as hydraulic connectivity
kNNrcSpatial interpolation-based imputation using weighted kNN interpolation, where response similarity between nodes is considered as hydraulic connectivity, as proposed in this study
GPISpatial interpolation-based imputation using Gaussian Process interpolation (GPI) with adaptive covariance tapering scheme
PPCAData completion-based imputation using probabilistic principal component Analysis (PPCA)

Appendix A. Review of GP-Based Regression Ss Metamodel

This appendix reviews the GP-based Ss metamodel that is utilized in the case study. This metamodel is formulated [12] using as input matrix X and as output matrix the imputed Z, and is established through the following steps:
  • Step 1: Dimensionality reduction. To address the high dimensionality of the output z, principal component analysis (PCA) [59] is used as a dimensionality reduction technique [12]. PCA is performed on Z and identifies, through a linear projection matrix P s , a small number of m s latent outputs (principal components) { z _   t ; t = 1 , , m s } that best explain the variance of the original observation matrix Z, with m s < n < < n z . For each component, it also provides the vector Z ¯ t n of observations whose hth row corresponds to the latent output for the hth storm, and its relative importance ωt corresponding to the portion of the variance of the original observation matrix Z that can be explained by the respective component. The latter information is leveraged to select the number of principal components to retain [59]. The PCA transformation also utilizes the mean (across the storm database) of the observations for each z i , denoted herein as μi. This simply corresponds to the mean of each column of Z.
  • Step 2: Principal component GP calibration. For each of the m s principal components, a separate GP is developed using input–output observation pair X- Z _ t . This is accomplished through the formulation reviewed in Appendix C for definitions u = x , v = z _ t , U = X , and V = Z _ t with n G P = n and n u = n x . The GP provides the predictive mean z _ ˜   t ( x ) and variance ( σ t z _ ( x ) ) 2 for each latent component given by Equations (A6) and (A7), respectively. Note that the dimensionality reduction established in Step 2 accommodates a computationally efficient GP calibration separately for each principal component, since m s is typically small (relative to both n and, especially, nz).
  • Step 3: Storm surge predictions. Combining the predictions for all principal components, the metamodel approximation for the storm surge is obtained using the linear PCA transformation. Adopting notation [ . ] i t to denote the { i , t } element of a matrix (corresponding to the ith row and tth column), the mean and variance predictions for the ith node are as follows [12]:
z ˜ i ( x ) = μ i + t = 1 m s [ P s ] i t z _ ˜   t ( x ) ,
( σ i ( x ) ) 2 = t = 1 m s [ P s ] i t 2 ( σ t z _ ( x ) ) 2 .
Utilizing the Gaussian probabilistic nature of the GP estimates under the PCA linear transformation [12], the inundation probability p i s ( x ) according to Ss is finally given by the following [22]:
p i s ( x ) = Φ z ˜ i ( x ) e i σ i ( x )
where Φ [ . ] denotes the standard Gaussian cumulative distribution function.

Appendix B. Review of GP-Based Classification Sc Metamodel

This appendix reviews the GP-based Sc metamodel that is utilized in the case study. This metamodel is formulated [23] using as input matrix X and as output matrix Y, and is established through the following steps:
  • Step 1: Dimensionality reduction and projection to continuous output. To address the high dimensionality of the output y and accommodate a projection to a continuous space, logistic principal component analysis (LPCA) [60] is used as a dimensionality reduction technique [23]. LPCA is performed by maximizing the likelihood of observations Y given the compact representation for the natural parameter (log-odds) vector θ of the underlying logistic function describing y [60]. It identifies a small number of m c latent outputs { θ _   t ; t = 1 , , m c } along with the projection matrix P c , the bias Δ t for each component, and the latent observation matrix Θ _ t n whose hth row corresponds to the latent output for the hth storm. The value of m c can be selected based on parametric sensitivity analysis to avoid overfitting [23]. The latent outputs describing the natural parameters correspond to a continuous variable, even though the original data corresponded to a binary variable. This facilitates the use of a regression surrogate model for predicting θ _   t in Step 2.
  • Step 2: Principal component GP calibration. For each of the m c principal components, a separate GP is developed using input–output observation pair X- Θ _ t . This is accomplished through the formulation reviewed in Appendix C for definitions u = x , v = θ _   t , U = X , and V = Θ _ t , with n G P = n and n u = n x . The GP provides the predictive mean θ _ ˜   t ( x ) given by Equation (A6). Note that the dimensionality reduction established in Step 2 accommodates a computationally efficient GP calibration separately for each principal component, since m c is typically very small (relative to both n and, especially, nz).
  • Step 3: Classification predictions. Combining the predictions for all principal components, the metamodel approximation for the inundation state for the ith node is first established by obtaining the natural parameter approximation for that node through the linear transformation:
θ ˜ i ( x ) = Δ i + t = 1 m ψ [ P c ] i t θ _ ˜   t ( x ) ,
and then utilizing the logistic function:
p i c ( x ) = 1 1 + e θ ˜ i ( x ) .

Appendix C. Review of GP Formulation

This appendix reviews the GP implementation for a generic input u n u and scalar output v. For appropriate selection of input and output, this formulation accommodates the different GP variants discussed in this paper. For the metamodel development we assume that the training set with n G P data is available, with superscript o utilized to distinguish the input u o and output v o for the oth data point, and corresponding input matrix U n G P × n u [each observation represents a different row] and output matrix (vector in this instance) V n G P .
The fundamental building blocks for the GP are the nb-dimensional basis vector f(u) and the correlation function between inputs R ( u , u | γ ) , with γ denoting the hyper-parameter vector that needs to be calibrated. Selection of these functions are discussed in the main manuscript. Let F = [ f ( u 1 ) f ( u n G P ) ] T n G P × n b denote the basis matrix over database U, r ( u )   =   [ R ( u , u 1 | γ )   R ( u , u n G P | γ ) ] T n G P the correlation vector between u and each of the elements of U, and R n G P × n G P the correlation matrix over the database U with the ojth element defined as R ( x o , x j | γ ) ;   o , j = 1 , , n G P . To improve the surrogate model’s numerical stability or even its accuracy when fitting noisy data [40], a nugget is included in the formulation of the correlation function R _ = R + δ I , with δ denoting the nugget value and I the identity matrix. The GP predictive mean is given by the following [40,61]:
v ˜ ( x ) = f ( x ) T β * + r ( x ) T R _ 1 ( V F β * )
where β * = ( F T R _ k 1 F ) 1 F T R _ 1 V is the weighted least squares regression solution. The probabilistic characteristics of the GP are quantified through the GP predictive variance given by the following [40,61]:
σ v ( x ) 2 = σ ˜ v 2 [ 1 + γ ( x ) T { F T R _ 1 F } 1 γ k ( x ) r ( x ) T R _ 1 r ( x ) ]
where γ ( x ) = F T R _ 1 r ( x ) f ( x ) and the process variance is as follows:
σ ˜ v 2 = ( V F β * ) T R _ 1 ( V F β * ) n G P .
The calibration of the GP pertains to the selection of the hyper-parameters [ γ   δ ] , and can be performed using maximum likelihood estimation (MLE), leading to the following [40,61]:
[ γ δ ] = arg min [ γ δ ] ln ( det ( R _ ) ) + n G P ln σ ˜ v 2
where det(.) stands for the determinant of a matrix. The optimization of Equation (A9) is well known to have multiple local minima [62] and non-smooth characteristics for small values of δ [63]. To address these challenges, all numerical optimizations that are performed in this study use a pattern-search optimization algorithm [64].

Appendix D. Weighted k-Nearest Neighbor (kNN) Calibration

The appendix briefly reviews the kNN interpolation calibration [23]. Let A w t , with n w t nodes, denote a subset of the always-wet nodes set that the calibration is based upon. A w t may be chosen identical to the set of always-wet nodes, denoted A w f herein, though it is recommended to only include nodes corresponding to smaller depths so that the calibration is based on predictions for nearshore nodes only. The kNN surge estimate for each node in A w t and for each storm are obtained using Equation (12) considering its respective neighbors. Denoting as z ˜ i h the predictions for the ith node and the hth storm, the calibration is finally expressed through the optimization of the hyper-parameters [23]:
[ k , d , ψ l , ψ e ] * = arg min ( h = 1 n i A w t z i h z ˜ i h ) k ,   1 k k max 0 < d t d t max ,   0 < ψ l ψ l max ,   ψ e min ψ e ψ e max
with appropriate box-bounded constraints for minimum (superscript min) and maximum (superscript max) value of each of the hyper-parameters (note that kc from Section 5.1 has been replaced by kmax here). Numerical details for efficiently performing this calibration are discussed in [23].

Appendix E. Adaptive Taper Selection Using Inducing Points

This appendix reviews the M-IAT algorithm [30] for the estimation of taper ranges per node { φ i ; i = 1 , , n z } to achieve the desired local sparsity { ρ i ; i = 1 , , n z } within adaptive covariance tapering for taper function selection given by Equation (17). For achieving computational efficiency, a set of inducing points is leveraged to guide the selection, whereas an iterative optimization is adopted to select the taper values.
To formalize implementation, define distance matrix D n z × n z with ij element [ D ] i j = d i j and taper range matrix C n z × n z with elements [ C ] i j = ( φ i + φ j ) / 2 . Herein, notation [ A ] i j indicates the element located in the ith row and jth column of matrix A, with an asterisk for either i or j indicating the selection of all columns or rows, respectively. Also, let n t i = ρ i n z define the target local sparsity for the ith node based on number of neighbors. Let i d n d denote the set of utilized inducing points, where n d is the number of inducing points in the set. Define the matrices D ¯ = [ D ] i d * n d × n z and C ¯ = [ C ] i d * n d × n z corresponding to the subsets of D and C, respectively, for rows pertaining to the inducing points only. The full vector of taper ranges and the corresponding subset for the inducing points are denoted as φ n z and φ ¯ = [ φ ] i d n d , respectively. Since the M-IAT algorithm adjusts only φ ¯ , a projection mapping φ = g ( φ ¯ ) is established (for example, using scatter interpolation based on Delaunay triangulation) to estimate the remaining taper ranges using φ ¯ .
To accommodate the iterative implementation, superscript (k) is used in this appendix to distinguish the quantities pertaining to the kth iteration of the M-IAT algorithm. The iterative formulation is established as follows. First, set the variables defining convergence: the number of allowable iterations k m a x , the tolerance threshold n t o l for the maximum discrepancy, the tolerance N t o l for the number of nodes with considerable discrepancy, and the value n d s defining the considerable discrepancy. Next, initialize the vector of taper ranges φ ¯ ( 0 ) = { φ ¯ i ( 0 ) ; i = 1 , , n d } , select mapping φ = g ( φ ¯ ) , and estimate φ ( 0 ) = g ( φ ¯ ( 0 ) ) . After the initialization, calculate C ¯ ( 0 ) and the initial number of non-zero elements for each inducing point { n n z i ( 0 ) ; i i d } by identifying the entries satisfying [ D ¯ ] i * [ C ¯ ( 0 ) ] i * < 0 . Note that updating φ = g ( φ ¯ ) has a non-negligible computational burden for large n z values and for this reason it is not repeated for every iteration of M-IAT, rather it is performed every n s c iterations. At the kth iteration of the M-IAT algorithm, perform the following steps:
  • Step 1: Check total number of neighbors. Evaluate the appropriate correction to obtain the most benefits for the overall number of non-zero elements. For the inducing points, perform the following operations: [23]:
    If   i i d n n z i ( k 1 ) < i i d n t i   proceed   to   Step   2 a If   i i d n n z i ( k 1 ) > i i d n t i   proceed   to   Step   2 b If   i i d n n z i ( k 1 ) = i i d n t i   then   if   max i i d ( | n n z i ( k 1 ) n t i | ) = max i i d ( n n z i ( k 1 ) n t i )   proceed   to   Step   2 a else   proceed   to   Step   2 b .
  • Step 2: Adjust most influential taper. Depending on the outcome of Equation (A11).
Step 2a: Adjust most influential taper if total number of non-zeros are too many. Select the inducing point that corresponds to the maximum of { n n z i ( k 1 ) n t i ; i i d } . If multiple inducing points satisfy this criterion, select one of them at random. Let m denote the chosen inducing point.
Step 2b: Adjust most influential taper if total number of non-zeros are too few. Select the inducing point that corresponds to the minimum of { n n z i ( k 1 ) n t i ; i i d } . If multiple inducing points satisfy this criterion, select one of them at random. Let m denote the chosen inducing point.
  • Step 3: Taper range adjustment. Compute the taper range adjustment for the mth node, so that n n z m ( k 1 ) = n t m . This is achieved by ordering the elements [ D ¯ ] m * [ C ¯ ( k 1 ) ] m * , then randomly choosing a number, denoted φadj, between the n t m and n t m + 1 ordered values. Finally, update the mth taper range to be φ ¯ m ( k ) = φ ¯ m ( k 1 ) + 2 φ ¯ a d j .
  • Step 4: Update taper vector and taper thresholds. The new taper range vector φ(k) is obtained by replacing φ ¯ m ( k 1 ) with φ ¯ m ( k ) . If k k l a s t = n s c , proceed to Step 5 and update k l a s t k . Otherwise, update the taper threshold matrix based on the new φ ¯ m ( k ) by setting [ C ¯ ( k ) ] m * = [ C ¯ ( k 1 ) ] m * + φ a d j (updating the mth row) and [ C ¯ ( k ) ] * i d ( m ) = [ C ¯ ( k 1 ) ] * i d ( m ) + φ a d j (updating the id(m)th column), and proceed to the next iteration by returning to Step 1.
  • Step 5: Use interpolation to update entire vector. Update the entire taper φ ( k ) based on projection mapping φ ( k ) = g ( φ ¯ ( k ) ) . This provides the taper ranges for the remaining points (i.e., non-inducing points) based on the taper ranges for the inducing points.
  • Step 6: Global update of taper thresholds and number of non-zeros. Using the new vector φ ( k ) , calculate C ¯ ( k ) and the new number of non-zero elements for each inducing point { n n z i ( k ) ; i i d } by identifying the entries satisfying [ D ¯ ] i * [ C ¯ ( k ) ] i * < 0 .
  • Step 7: Assess stopping criteria. If k = k m a x , set φ = φ ( k ) and stop iterating since the allowable computation burden has been exceeded. If k < k m a x , examine the convergence criteria. For the inducing points, examine the following conditions:
    max i i d ( | n n z i ( k ) n t i | ) < n t o l   and   i i d I [ | n n z i ( k ) n t i | > n d s ] < N t o l .
    If both conditions are satisfied, the algorithm has convergence and iterations may stop (and set φ = φ ( k ) ). Otherwise, set k k + 1 and proceed to the next iteration by returning to Step 1.

Appendix F. Adaptive Taper Selection Using Inducing Points

This appendix reviews the IIP algorithm [30] for the iterative identification of inducing points. For formalizing implementation, let S d [ l ] denote the set of inducing points at the lth iteration of the IIP algorithm. Superscript [l] (in brackets) is used to distinguish the quantities pertaining to the lth iteration of the IIP algorithm. Use a modest number of n d [ 0 ] nodes to define an initial set S d [ 0 ] . For example, S d [ 0 ] may be obtained via k-means clustering. The iterative implementation proceeds as follows. First, select the maximum number of allowable inducing points n d m a x , the number of inducing points to be added in each iteration n d a d d , the maximum allowable discrepancy npr, and the (relative) weight cn used to prioritize nodes with too few non-zero elements. At the lth iteration of the IIP algorithm, perform the following steps:
  • Step 1: Perform M-IAT. Perform M-IAT using S d [ l ] as the current set of inducing points. If l > 1 , then the taper range vector φ[l] used within M-IAT may be initialized based on the taper range values identified at the previous iteration of IIP.
  • Step 2: Check convergence. Estimate the number of non-zero elements { n n z i [ l ] ; i = 1 , , n z } for all nodes in the domain by identifying nodes satisfying [ D ¯ ] i * [ C ¯ [ l ] ] i * . If max i ( | n n z i [ l ] n t i | ) < n p r or n d [ l ] > n d m a x is satisfied, convergence has been achieved and S d [ l ] is the final set of inducing points. Otherwise, proceed to Step 4.
  • Step 3: Select new inducing points. The remaining n z n d [ l ] nodes (i.e., non-inducing points) are separated into two groups: (a) those for which there are sufficiently too many non-zero elements (i.e., n n z i [ l ] n t i > n z + [ l ] ); and (b) those for which there are sufficiently too few non-zero elements (i.e., n t i n n z i [ l ] > n z [ l ] ). These groups are denoted G + [ l ] and G [ l ] , respectively, and contain nG+ and nG nodes, respectively. Separately, perform clustering within each group ( G + [ l ] and G [ l ] ) and select the number of clusters (within each group) to be proportional to the number of total nodes in the group while incorporating the weight cn. This yields n + = r o u n d [ n G + / ( n G + + c n n G ) n d a d d ] clusters for G + [ l ] and n = n d a d d n + clusters for G [ l ] . The nG+ nodes within G + [ l ] are clustered into n+ clusters based on spatial location, and the worst-performing node (i.e., the node with the largest discrepancy | n n z i [ l ] n t i | ) within each cluster is selected as the representative point to be added to the existing set of inducing points. Denote these nodes S d + [ l ] . Similarly, the nG nodes within G [ l ] are clustered into n clusters based on spatial location, and the worst-performing node within each cluster is selected as the representative point to be added to the existing set of inducing points. Denote these nodes S d [ l ] . To obtain the updated set of inducing points, augment the existing set such that S d [ l + 1 ] = { S d [ l ] , S d + [ l ] , S d [ l ] } . The new set of inducing points contains n d [ l + 1 ] nodes. Finally, set l l + 1 and proceed to the next iteration by returning to Step 1.

Appendix G. Performance of the Regression Surrogate Model Developed Based on the Pseudo-Surge Database Without Correction

This appendix presents the predictive performance of the Ss surrogate model, developed using the pseudo-surge database imputed by different imputation variants. Table A1, Table A2, Table A3 and Table A4 provide results for the entire domain (Df), mimicking Table 5, Table 6, Table 7 and Table 8 in Section 7.3, respectively, while Table A5, Table A6, Table A7 and Table A8 show results for the subdomain (Ds), mimicking Table 9, Table 10, Table 11 and Table 12 in Section 7.4, respectively.
Table A1. Surge score S C ¯ (cm) for different node groups for Df domain for surrogate models (Ss only) based on pseudo-surge database imputed by different variants.
Pseudo-Surge Database (Ss Only)
kNNkNNrcPPCAkNN-PPCAkNNrc-PPCA
All nodes13.3913.909.257.917.98
Once-dry19.0820.288.936.086.22
Surge gap> (m)0.2559.7872.375.394.114.90
0.570.6188.334.683.644.85
0.7587.09106.734.723.735.30
1109.14122.555.264.215.82
1.5139.46142.927.956.437.67
Node groups C 2 38.9536.069.037.887.73
C 3 5.045.167.304.824.88
Table A2. Misclassification M C ¯ (%) for different node groups from Df for surrogate models (Ss only) based on pseudo-surge database imputed by different variants.
Pseudo-Surge Database (Ss Only)
kNNkNNrcPPCAkNN-PPCAkNNrc-PPCA
All nodes7.197.6810.823.704.17
Once-dry17.2218.3825.998.799.91
Surge gap> (m)0.2546.9447.9119.9011.6815.86
0.553.7655.5518.1211.3417.78
0.7563.2065.3917.9412.0920.34
171.3174.1218.8112.9921.25
1.572.7378.4723.4215.4821.87
Node groups C 2 35.1532.9927.3315.1516.33
C 3 4.554.382.974.364.23
Table A3. False positive misclassification M C ¯ * (%) for different node groups from Df for surrogate models (Ss only) based on pseudo-surge database imputed by different variants.
Pseudo-Surge Database (Ss Only)
kNNkNNrcPPCAkNN-PPCAkNNrc-PPCA
All nodes6.467.0010.362.963.47
Once-dry15.6116.9025.027.148.39
Surge gap> (m)0.2546.7947.8119.8511.4615.71
0.553.6555.4918.0611.1617.67
0.7563.1265.3417.8711.9320.23
171.2674.0918.7312.8521.12
1.572.7378.4723.3315.3721.74
Node groups C 2 34.2832.1826.4014.1815.41
C 3 2.412.261.362.252.16
Table A4. False negative misclassification M C ¯ (%) for different node groups from Df for surrogate models (Ss only) based on pseudo-surge database imputed by different variants.
Pseudo-Surge Database (Ss Only)
kNNkNNrcPPCAkNN-PPCAkNNrc-PPCA
All nodes0.730.680.460.740.70
Once-dry1.611.480.971.651.53
Surge gap> (m)0.250.150.100.060.220.15
0.50.110.060.060.180.11
0.750.080.050.070.160.12
10.050.030.080.140.13
1.50.010.010.090.110.13
Node groups C 2 0.870.810.930.970.91
C 3 2.142.131.612.122.07
Table A5. Surge score S C ¯ (cm) for different node groups from Ds for surrogate models (Ss only) based on pseudo-surge database imputed by different variants.
Pseudo-Surge Database (Ss Only)
kNNkNNrcGPIPPCAkNN-PPCAkNNrc-PPCAGPI-PPCA
All nodes26.3131.1729.5411.119.9610.139.91
Once-dry48.8261.0157.159.787.227.547.43
Surge gap> (m)0.25108.97151.33129.244.733.755.043.92
0.5118.19164.75140.343.963.214.783.37
0.75131.17177.32153.553.622.984.763.11
1145.46178.84165.693.733.014.603.17
1.5177.34190.90195.685.884.665.425.09
Node groups C 2 87.01104.9584.8310.287.868.458.22
C 3 6.936.876.646.496.606.556.27
Table A6. Misclassification M C ¯ (%) for different node groups from Ds for surrogate models (Ss only) based on pseudo-surge database imputed by different variants.
Pseudo-Surge Database (Ss Only)
kNNkNNrcGPIPPCAkNN-PPCAkNNrc-PPCAGPI-PPCA
All nodes13.8313.5515.019.493.774.774.40
Once-dry34.7334.0337.6823.819.4111.9011.00
Surge gap> (m)0.2576.9278.0479.8815.5811.2919.1411.19
0.583.4485.1586.4813.8610.8720.2010.33
0.7587.7989.2089.3112.8110.7620.519.81
188.6689.7589.4113.3411.0518.599.94
1.587.5888.1588.1518.5314.1615.2613.74
Node groups C 2 62.6158.4656.4127.1415.1819.3516.27
C 3 4.143.933.512.003.833.703.32
Table A7. False positive misclassification M C ¯ + (%) for different node groups from Ds for surrogate models (Ss only) based on pseudo-surge database imputed by different variants.
Pseudo-Surge Database (Ss Only)
kNNkNNrcGPIPPCAkNN-PPCAkNNrc-PPCAGPI-PPCA
All nodes13.3213.0914.609.293.254.293.97
Once-dry33.5232.9536.7523.398.1910.7910.00
Surge gap> (m)0.2576.7977.9579.8415.5011.0818.9911.07
0.583.3585.0886.4713.7810.6920.0710.23
0.7587.7489.1589.3012.7210.6120.389.71
188.6389.7389.4113.2510.9118.469.85
1.587.5788.1588.1518.4514.0415.1313.66
Node groups C 2 62.1458.0256.0026.7814.6218.8515.77
C 3 2.132.071.631.151.971.931.60
Table A8. False negative misclassification M C ¯ (%) for different node groups from Ds for surrogate models (Ss only) based on pseudo-surge database imputed by different variants.
Pseudo-Surge Database (Ss Only)
kNNkNNrcGPIPPCAkNN-PPCAkNNrc-PPCAGPI-PPCA
All nodes0.510.460.410.200.520.480.43
Once-dry1.211.080.930.421.221.111.00
Surge gap> (m)0.250.130.090.040.080.210.150.12
0.50.090.070.010.080.180.130.11
0.750.050.050.010.090.160.130.10
10.030.030.000.090.140.130.10
1.50.010.010.000.090.120.130.09
Node groups C 2 0.480.450.410.360.560.500.51
C 3 2.001.861.880.851.851.771.72

References

  1. Shepard, C.C.; Agostini, V.N.; Gilmer, B.; Allen, T.; Stone, J.; Brooks, W.; Beck, M.W. Assessing future risk: Quantifying the effects of sea level rise on storm surge risk for the southern shores of Long Island, New York. Nat. Hazards 2012, 60, 727–745. [Google Scholar] [CrossRef]
  2. Zachry, B.C.; Booth, W.J.; Rhome, J.R.; Sharon, T.M. A national view of storm surge risk and inundation. Weather Clim. Soc. 2015, 7, 109–117. [Google Scholar] [CrossRef]
  3. Lin, N.; Shullman, E. Dealing with hurricane surge flooding in a changing environment: Part I. Risk assessment considering storm climatology change, sea level rise, and coastal development. Stoch. Environ. Res. Risk Assess. 2017, 31, 2379–2400. [Google Scholar] [CrossRef]
  4. Resio, D.T.; Westerink, J.J. Modeling of the physics of storm surges. Phys. Today 2008, 61, 33–38. [Google Scholar] [CrossRef]
  5. Woodruff, J.; Dietrich, J.; Wirasaet, D.; Kennedy, A.; Bolster, D. Storm surge predictions from ocean to subgrid scales. Nat. Hazards 2023, 117, 2989–3019. [Google Scholar] [CrossRef]
  6. Cialone, M.A.; Grzegorzewski, A.S.; Mark, D.J.; Bryant, M.A.; Massey, T.C. Coastal-storm model development and water-level validation for the North Atlantic Coast Comprehensive Study. J. Waterw. Port Coast. Ocean Eng. 2017, 143, 04017031. [Google Scholar] [CrossRef]
  7. Hsu, C.-H.; Olivera, F.; Irish, J.L. A hurricane surge risk assessment framework using the joint probability method and surge response functions. Nat. Hazards 2018, 91, 7–28. [Google Scholar] [CrossRef]
  8. Jung, W.; Taflanidis, A.A.; Nadal-Caraballo, N.C.; Yawn, M.C.; Aucoin, L.A. Regional storm surge hazard quantification using Gaussian process metamodeling techniques. Nat. Hazards 2024, 120, 755–783. [Google Scholar] [CrossRef]
  9. Jung, W.; Taflanidis, A.A.; Kyprioti, A.P.; Zhang, J. Adaptive Multi-fidelity Monte Carlo for real-time probabilistic storm surge predictions. Reliab. Eng. Syst. Saf. 2024, 247, 109994. [Google Scholar] [CrossRef]
  10. Plumlee, M.; Asher, T.G.; Chang, W.; Bilskie, M.V. High-fidelity hurricane surge forecasting using emulation and sequential experiments. Ann. Appl. Stat. 2021, 15, 460–480. [Google Scholar] [CrossRef]
  11. Irish, J.; Resio, D.; Cialone, M. A surge response function approach to coastal hazard assessment. Part 2: Quantification of spatial attributes of response functions. Nat. Hazards 2009, 51, 183–205. [Google Scholar] [CrossRef]
  12. Jia, G.; Taflanidis, A.A. Kriging metamodeling for approximation of high-dimensional wave and surge responses in real-time storm/hurricane risk assessment. Comput. Methods Appl. Mech. Eng. 2013, 261-262, 24–38. [Google Scholar] [CrossRef]
  13. Kyprioti, A.P.; Taflanidis, A.A.; Nadal-Caraballo, N.C.; Campbell, M. Storm hazard analysis over extended geospatial grids utilizing surrogate models. Coast. Eng. 2021, 168, 103855. [Google Scholar] [CrossRef]
  14. Jiang, W.; Zhong, X.; Zhang, J. Surge-NF: Neural Fields inspired peak storm surge surrogate modeling with multi-task learning and positional encoding. Coast. Eng. 2024, 193, 104573. [Google Scholar] [CrossRef]
  15. Qin, Y.; Su, C.; Chu, D.; Zhang, J.; Song, J. A Review of Application of Machine Learning in Storm Surge Problems. J. Mar. Sci. Eng. 2023, 11, 1729. [Google Scholar] [CrossRef]
  16. Al Kajbaf, A.; Bensi, M. Application of surrogate models in estimation of storm surge: A comparative assessment. Appl. Soft Comput. 2020, 91, 106184. [Google Scholar] [CrossRef]
  17. Bass, B.; Bedient, P. Surrogate modeling of joint flood risk across coastal watersheds. J. Hydrol. 2018, 558, 159–173. [Google Scholar] [CrossRef]
  18. Kim, S.-W.; Lee, A.; Mun, J. A surrogate modeling for storm surge prediction using an artificial neural network. J. Coast. Res. 2018, 85, 866–870. [Google Scholar] [CrossRef]
  19. Pachev, B.; Arora, P.; del-Castillo-Negrete, C.; Valseth, E.; Dawson, C. A framework for flexible peak storm surge prediction. Coast. Eng. 2023, 186, 104406. [Google Scholar] [CrossRef]
  20. Gharehtoragh, M.A.; Johnson, D.R. Using surrogate modeling to predict storm surge on evolving landscapes under climate change. npj Nat. Hazards 2024, 1, 33. [Google Scholar] [CrossRef]
  21. Kijewski-Correa, T.; Taflanidis, A.; Vardeman, C.; Sweet, J.; Zhang, J.; Snaiki, R.; Wu, T.; Silver, Z.; Kennedy, A. Geospatial environments for hurricane risk assessment: Applications to situational awareness and resilience planning in New Jersey. Front. Built Environ. 2020, 6, 549106. [Google Scholar] [CrossRef]
  22. Kyprioti, A.P.; Taflanidis, A.A.; Nadal-Caraballo, N.C.; Yawn, M.C.; Aucoin, L.A. Integration of node classification in storm surge surrogate modeling. J. Mar. Sci. Eng. 2022, 10, 551. [Google Scholar] [CrossRef]
  23. Kyprioti, A.P.; Taflanidis, A.A.; Plumlee, M.; Asher, T.G.; Spiller, E.; Luettich, R.A.; Blanton, B.; Kijewski-Correa, T.L.; Kennedy, A.; Schmied, L. Improvements in storm surge surrogate modeling for synthetic storm parameterization, node condition classification and implementation to small size databases. Nat. Hazards 2021, 109, 1349–1386. [Google Scholar] [CrossRef]
  24. Shisler, M.P.; Johnson, D.R. Comparison of Methods for Imputing Non-Wetting Storm Surge to Improve Hazard Characterization. Water 2020, 12, 1420. [Google Scholar] [CrossRef]
  25. Adeli, E.; Zhang, J.; Taflanidis, A.A. Convolutional generative adversarial imputation networks for spatio-temporal missing data in storm surge simulations. arXiv 2021, arXiv:2111.02823. [Google Scholar] [CrossRef]
  26. Jung, W.; Taflanidis, A.A.; Nadal-Caraballo, N.C.; Aucoin, L.A.; Yawn, M.C. Advances in spatiotemporal storm surge emulation: Database imputation and multi-mode latent space projection. Coast. Eng. 2025, 201, 104762. [Google Scholar] [CrossRef]
  27. Yang, C.-H.; Wu, C.-H.; Hsieh, C.-M.; Wang, Y.-C.; Tsen, I.-F.; Tseng, S.-H. Deep learning for imputation and forecasting tidal level. IEEE J. Ocean. Eng. 2021, 46, 1261–1271. [Google Scholar] [CrossRef]
  28. Cressie, N. Statistics for Spatial Data; John Wiley & Sons: Hoboken, NJ, USA, 2015. [Google Scholar]
  29. Yang, H.; Yang, J.; Han, L.D.; Liu, X.; Pu, L.; Chin, S.-M.; Hwang, H.-L. A Kriging based spatiotemporal approach for traffic volume data imputation. PLoS ONE 2018, 13, e0195957. [Google Scholar] [CrossRef]
  30. Irwin, C.; Taflanidis, A.A.; Nadal-Caraballo, N.C.; Aucoin, L.A.; Yawn, M.C. Adaptive covariance tapering for large datasets and application to spatial interpolation of storm surge. Coast. Eng. 2025, 201, 104768. [Google Scholar] [CrossRef]
  31. Choi, Y.-Y.; Shon, H.; Byon, Y.-J.; Kim, D.-K.; Kang, S. Enhanced application of principal component analysis in machine learning for imputation of missing traffic data. Appl. Sci. 2019, 9, 2149. [Google Scholar] [CrossRef]
  32. Kornelsen, K.; Coulibaly, P. Comparison of interpolation, statistical, and data-driven methods for imputation of missing values in a distributed soil moisture dataset. J. Hydrol. Eng. 2014, 19, 26–43. [Google Scholar] [CrossRef]
  33. Tipping, M.E.; Bishop, C.M. Probabilistic principal component analysis. J. R. Stat. Soc. Ser. B Stat. Methodol. 1999, 61, 611–622. [Google Scholar] [CrossRef]
  34. Hegde, H.; Shimpi, N.; Panny, A.; Glurich, I.; Christie, P.; Acharya, A. MICE vs PPCA: Missing data imputation in healthcare. Inform. Med. Unlocked 2019, 17, 100275. [Google Scholar] [CrossRef]
  35. Sportisse, A.; Boyer, C.; Josse, J. Estimation and imputation in probabilistic principal component analysis with missing not at random data. Adv. Neural Inf. Process. Syst. 2020, 33, 7067–7077. [Google Scholar]
  36. Nadal-Caraballo, N.C.; Yawn, M.C.; Aucoin, L.A.; Carr, M.L.; Taflanidis, A.A.; Kyprioti, A.P.; Melby, J.A.; Ramos-Santiago, E.; Gonzalez, V.M.; Cobell, Z.; et al. Coastal Hazards System–Louisiana (CHS-LA); ERDC/CHL TR-22-16; US Army Engineer Research and Development Center: Vicksburg, MS, USA, 2022. [Google Scholar] [CrossRef]
  37. Nadal-Caraballo, N.C.; Campbell, M.O.; Gonzalez, V.M.; Torres, M.J.; Melby, J.A.; Taflanidis, A.A. Coastal Hazards System: A Probabilistic Coastal Hazard Analysis Framework. J. Coast. Res. 2020, 95, 1211–1216. [Google Scholar] [CrossRef]
  38. Luettich, R.A., Jr.; Westerink, J.J.; Scheffner, N.W. ADCIRC: An Advanced Three-Dimensional Circulation Model for Shelves, Coasts, and Estuaries. Report 1. Theory and Methodology of ADCIRC-2DDI and ADCIRC-3DL; Coastal Engineering Research Center: Vicksburg, MS, USA, 1992. [Google Scholar]
  39. Smith, J.M.; Sherlock, A.R.; Resio, D.T. STWAVE: Steady-State Spectral Wave Model User’s Manual for STWAVE, Version 3.0; Engineer Research and Development Center, Coastal and Hydraulics Laboratory: Vicksburg, MS, USA, 2001. [Google Scholar]
  40. Gramacy, R.B. Surrogates: Gaussian Process Modeling, Design, and Optimization for the Applied Sciences; Chapman and Hall/CRC: Boca Raton, FL, USA, 2020. [Google Scholar]
  41. Rasmussen, C.E.; Williams, C.K.I. Gaussian Processes for Machine Learning (Adaptive Computation and Machine Learning); The MIT Press: Cambridge, MA, USA, 2005. [Google Scholar]
  42. Räty, M.; Kangas, A. Comparison of k-MSN and kriging in local prediction. For. Ecol. Manag. 2012, 263, 47–56. [Google Scholar] [CrossRef]
  43. Lesot, M.-J.; Rifqi, M.; Benhadda, H. Similarity measures for binary and numerical data: A survey. Int. J. Knowl. Eng. Soft Data Paradig. 2009, 1, 63–84. [Google Scholar] [CrossRef]
  44. Matérn, B. Spatial Variation; Springer Science & Business Media: Berlin/Heidelberg, Germany, 2013; Volume 36. [Google Scholar]
  45. Cressie, N.; Johannesson, G. Fixed rank kriging for very large spatial data sets. J. R. Stat. Soc. Ser. B Stat. Methodol. 2008, 70, 209–226. [Google Scholar] [CrossRef]
  46. Bolin, D.; Wallin, J. Spatially adaptive covariance tapering. Spat. Stat. 2016, 18, 163–178. [Google Scholar] [CrossRef]
  47. Katzfuss, M.; Guinness, J. A general framework for Vecchia approximations of Gaussian processes. Stat. Sci. 2021, 36, 124–141. [Google Scholar] [CrossRef]
  48. Furrer, R.; Genton, M.G.; Nychka, D. Covariance tapering for interpolation of large spatial datasets. J. Comput. Graph. Stat. 2006, 15, 502–523. [Google Scholar] [CrossRef]
  49. Davis, T.A. Algorithm 849: A concise sparse Cholesky factorization package. ACM Trans. Math. Softw. 2005, 31, 587–591. [Google Scholar] [CrossRef]
  50. Davis, T.A. Direct Methods for Sparse Linear Systems; Society for Industrial and Applied Mathematics: Philadelphia, PA, USA, 2006. [Google Scholar]
  51. Gardner, J.; Pleiss, G.; Weinberger, K.Q.; Bindel, D.; Wilson, A.G. Gpytorch: Blackbox matrix-matrix gaussian process inference with gpu acceleration. In Proceedings of the Advances in Neural Information Processing Systems 31 (NeurIPS 2018), Montreal, QC, Canada, 3–8 December 2018. [Google Scholar]
  52. Dray, S.; Josse, J. Principal component analysis with missing values: A comparative survey of methods. Plant Ecol. 2015, 216, 657–667. [Google Scholar] [CrossRef]
  53. Audigier, V.; Husson, F.; Josse, J. A principal component method to impute missing values for mixed data. Adv. Data Anal. Classif. 2016, 10, 5–26. [Google Scholar] [CrossRef]
  54. Chen, X.; Yang, J.; Sun, L. A nonconvex low-rank tensor completion model for spatiotemporal traffic data imputation. Transp. Res. Part C Emerg. Technol. 2020, 117, 102673. [Google Scholar] [CrossRef]
  55. Liu, X.; Wang, X.; Zou, L.; Xia, J.; Pang, W. Spatial imputation for air pollutants data sets via low rank matrix completion algorithm. Environ. Int. 2020, 139, 105713. [Google Scholar] [CrossRef]
  56. Qu, L.; Li, L.; Zhang, Y.; Hu, J. PPCA-based missing data imputation for traffic flow volume: A systematical approach. IEEE Trans. Intell. Transp. Syst. 2009, 10, 512–522. [Google Scholar] [CrossRef]
  57. Moon, T.K. The expectation-maximization algorithm. IEEE Signal Process. Mag. 1996, 13, 47–60. [Google Scholar] [CrossRef]
  58. Roweis, S. EM algorithms for PCA and SPCA. In Proceedings of the Advances in Neural Information Processing Systems 10 (NIPS 2017), Long Beach, CA, USA, 4–9 December 2017; Volume 10. [Google Scholar]
  59. Jolliffe, I.T. Principal Component Analysis, 2nd ed.; Springer: New York, NY, USA, 2002; pp. 1094–1096. [Google Scholar]
  60. Schein, A.I.; Saul, L.K.; Ungar, L.H. A generalized linear model for principal component analysis of binary data. In Proceedings of the Ninth International Workshop on Artificial Intelligence and Statistics, Key West, FL, USA, 3–6 January 2003; p. 10. [Google Scholar]
  61. Sacks, J.; Welch, W.J.; Mitchell, T.J.; Wynn, H.P. Design and analysis of computer experiments. Stat. Sci. 1989, 4, 409–435. [Google Scholar] [CrossRef]
  62. Lophaven, S.N.; Nielsen, H.B.; Sondergaard, J. Aspects of the MATLAB Toolbox DACE; Technical University of Denmark: Lyngby, Denmark, 2002. [Google Scholar]
  63. Bostanabad, R.; Kearney, T.; Tao, S.; Apley, D.W.; Chen, W. Leveraging the nugget parameter for efficient Gaussian process modeling. Int. J. Numer. Methods Eng. 2018, 114, 501–516. [Google Scholar] [CrossRef]
  64. Audet, C.; Dennis, J.E., Jr. Analysis of generalized pattern searches. SIAM J. Optim. 2002, 13, 889–903. [Google Scholar] [CrossRef]
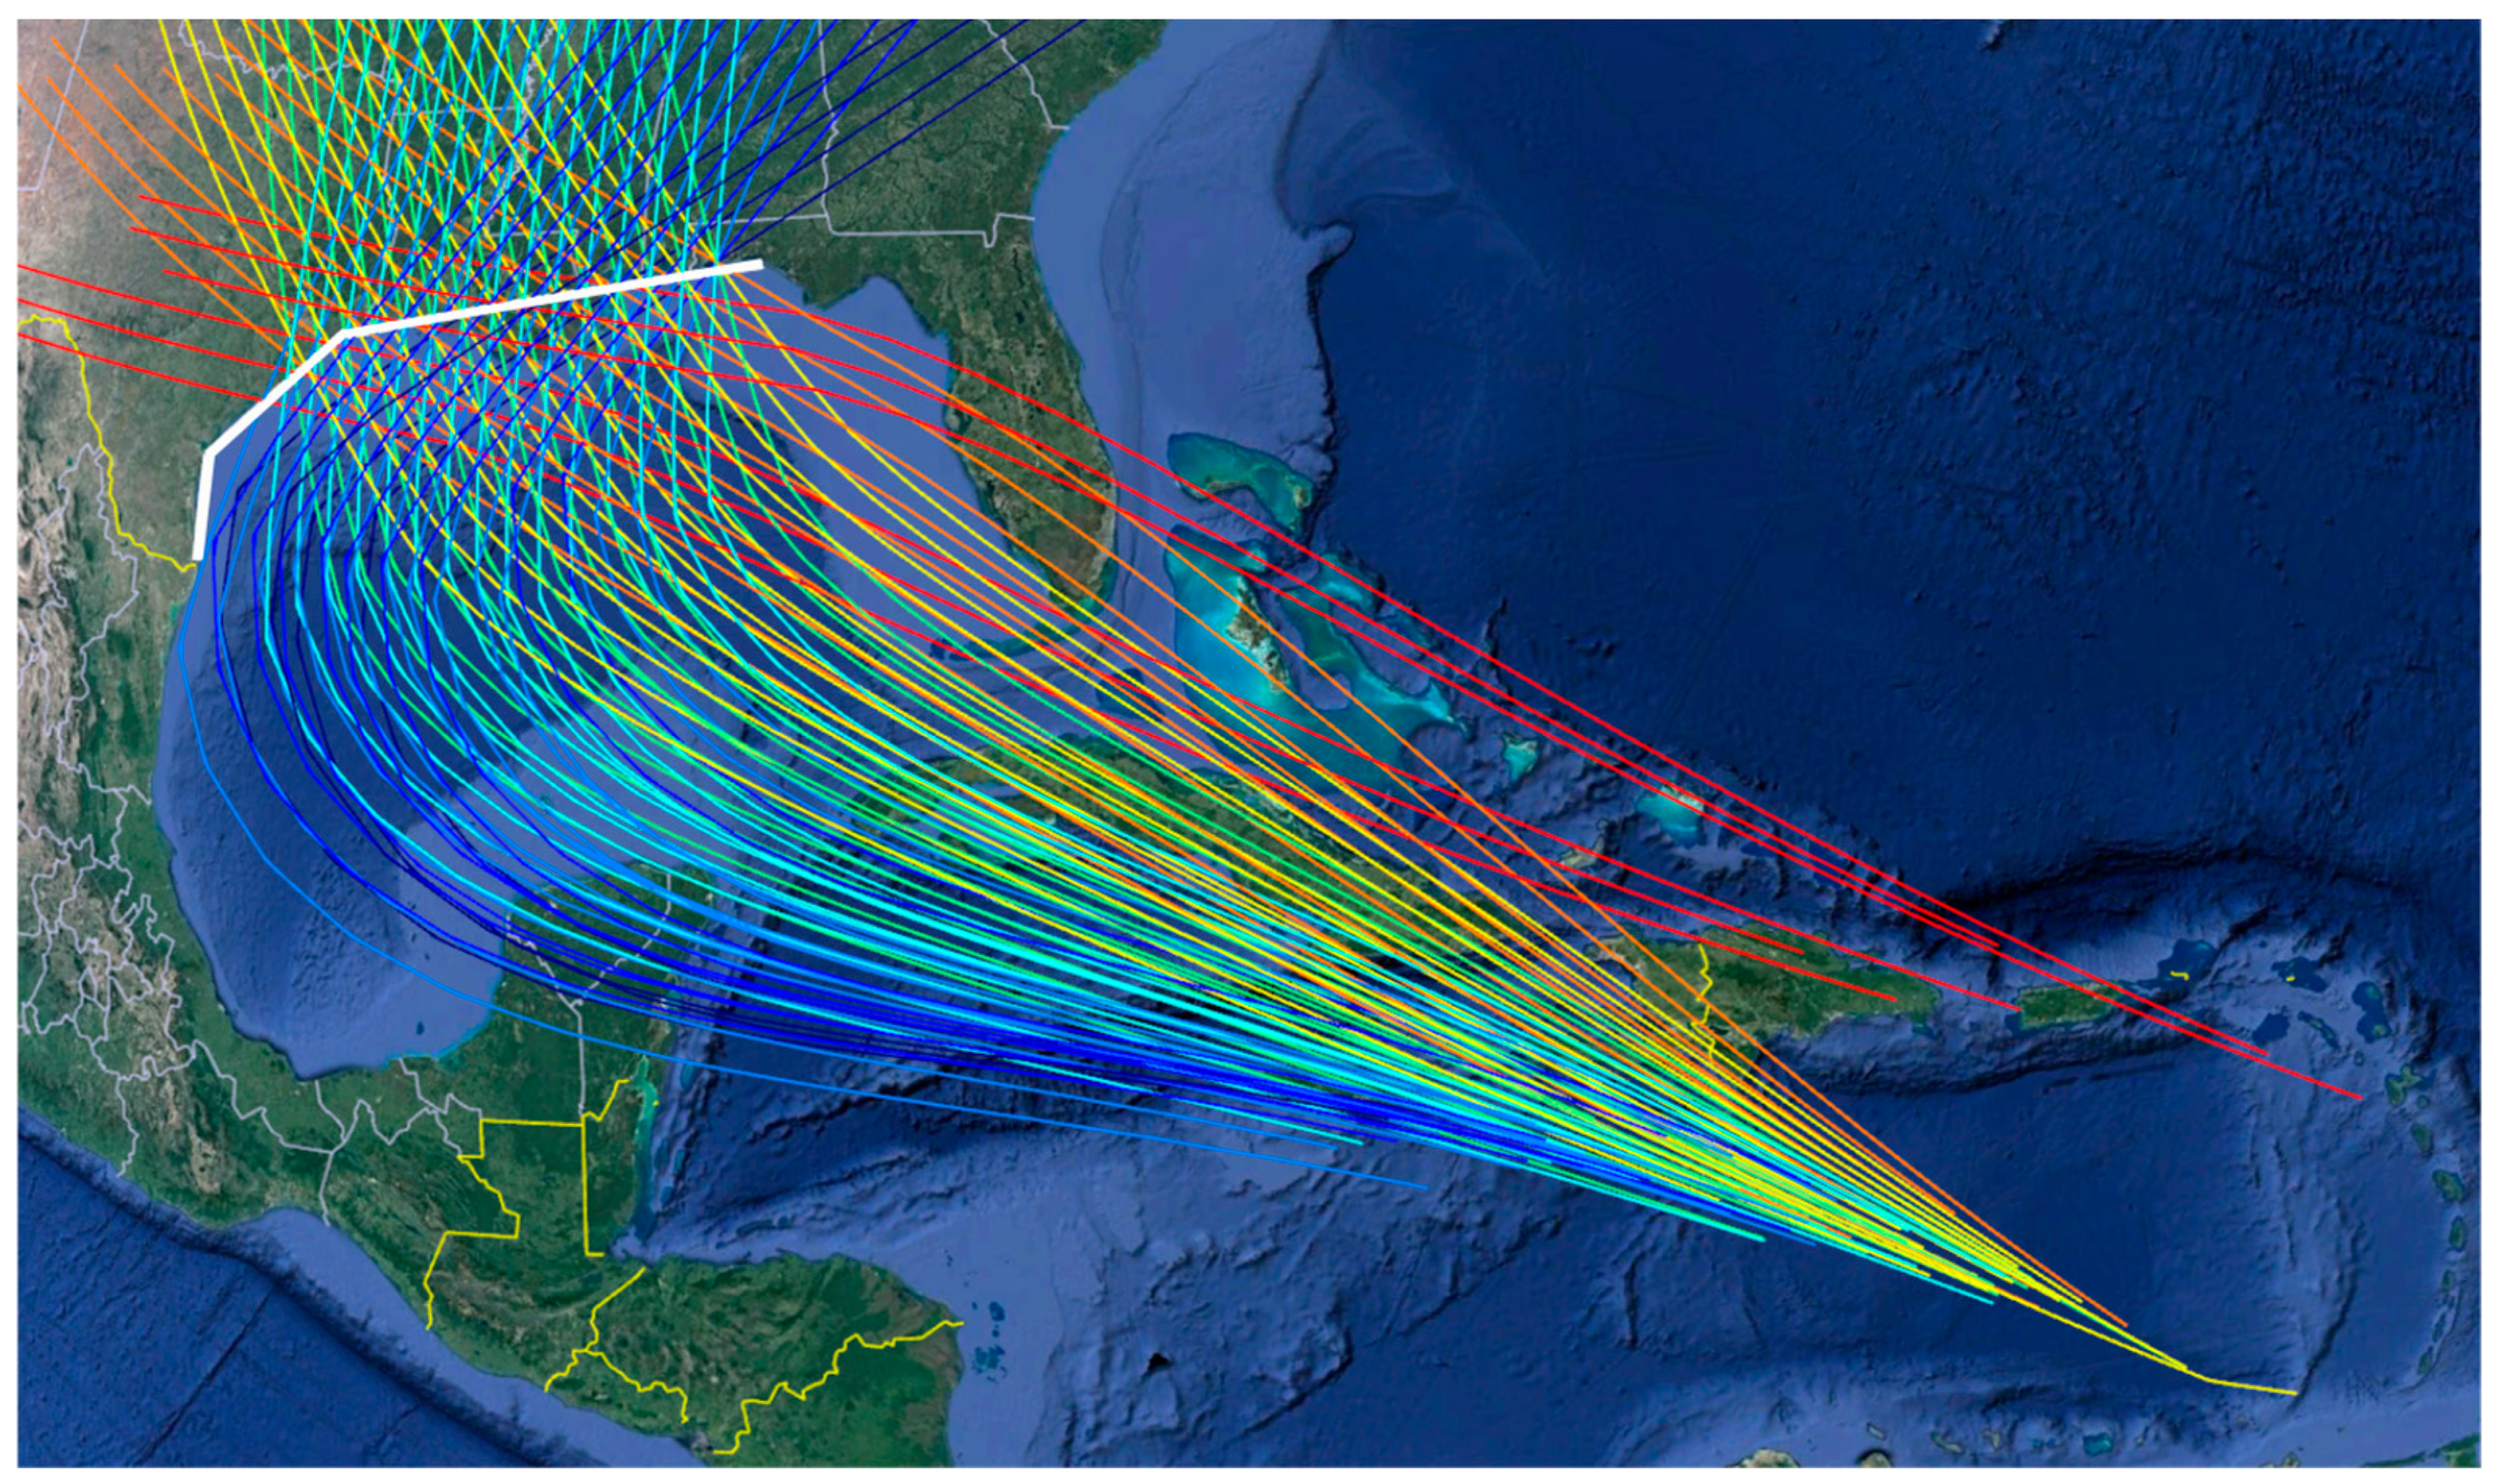
Figure 1. All the master tracks for the considered database, along with the linearized coastal boundary (white line) for the reference landfall definition. Tracks corresponding to the same heading are shown with the same color.
Jmse 13 01678 g001
Figure 2. Histograms of the percentage of storms for which each node is inundated, presented as a relative frequency plot.
Jmse 13 01678 g002
Figure 3. Spatial distribution of the percentage of storms for which each node is inundated (wetness) for domains: (a) full domain (Df) and (b) subdomain (Ds). The red-colored box represents the boundary for Ds.
Jmse 13 01678 g003
Figure 4. Spatial distribution of the surge gap at each once-dry node for domains: (a) full domain (Df) and (b) subdomain (Ds).
Jmse 13 01678 g004
Figure 5. Histograms of the percentage of once-dry nodes for which pseudo-surge is misclassified within full domain (Df), presented as a relative frequency plot, for imputation variants: (a) kNN, (b) kNN-PPCA, (c) kNNrc, and (d) kNNrc-PPCA.
Jmse 13 01678 g005
Figure 6. Histograms of the percentage of once-dry nodes for which pseudo-surge is misclassified for subdomain (Ds), presented as a relative frequency plot, for imputation variants: (a) kNNrc, and (b) kNNrc-PPCA, (c) GPI, and (d) GPI-PPCA.
Jmse 13 01678 g006
Figure 7. Spatial distribution of the surge score across full domain (Df) for implementation variants: (a) kNN, (b) kNN-PPCA, (c) kNNrc, and (d) kNNrc-PPCA.
Jmse 13 01678 g007
Figure 8. Spatial distribution of the surge score across subdomain (Ds) for implementation variants: (a) kNNrc, and (b) kNNrc-PPCA, (c) GPI, and (d) GPI-PPCA.
Jmse 13 01678 g008
Figure 9. Histogram of the percentage of nodes for which surrogate model prediction is misclassified within full domain (Df), presented as a relative frequency plot, for imputation variants: (a) kNN, (b) kNN-PPCA, (c) kNNrc, and (d) kNNrc-PPCA.
Jmse 13 01678 g009
Figure 10. Histogram of the percentage of nodes for which surrogate model prediction is misclassified within subdomain (Ds), presented as a relative frequency plot, for imputation variants: (a) kNNrc, (b) kNNrc-PPCA, (c) GPI, and (d) GPI-PPCA.
Jmse 13 01678 g010
Table 1. Storm characteristics per master track (MT) group for CHS-LA.
IDStorm Heading β (°)Number of Different MTs
(Landfall Locations)
Number of Storms per MTStorm Parameter Range
Δ P
(mbar)
R m w
(km)
v t
(m/s)
1−80648[8 148][9.3 115.5][2.4 10.60]
2−60970[18 138][11.8 127.5][2.4 12.50]
3−4013104[8 148][8.5 133.1][2.2 13.90]
4−2015105[18 138][9.1 116.5][2.4 11.80]
5015120[8 148][8.0 130.0][2.4 13.05]
6201498[18 138][8.6 138.2][2.3 12.65]
740972[8 148][9.6 141.3][2.3 12.85]
860428[18 138][9.4 119.4][2.5 13.40]
Table 2. Database statistics: proportion of nodes belonging to different groups as well as the respective percentages (%) of instances that these nodes are inundated within the original database.
DatabaseStatisticsOnce-DrySurge Gap> (m)
0.0750.150.250.50.7511.5
Df% of nodes41.4021.7713.918.863.771.860.990.35
% inundated in database31.266.944.402.901.941.882.042.89
Ds% of nodes39.7337.1827.6720.2610.595.993.551.28
% inundated in database42.544.753.182.271.461.211.161.63
Table 3. Imputation statistics for each of the individual imputation variants: proportion of nodes belonging to different groups as well as the respective percentages (%) of instances that these nodes are inundated within the original database.
DatabaseStatisticskNNkNNrcPPCAGPI
A p n C 2 C 3 A p n C 2 C 3 A p n C 2 C 3 A p n C 2 C 3
Df% of nodes63.8741.4058.6069.5648.9251.0899.2494.505.50N/A
% inundated in database33.3525.7535.1532.0924.9337.3131.1729.1667.30
Ds% of nodes69.9552.3147.6972.2755.2044.8098.1789.1810.8278.5264.6135.39
% inundated in database26.4015.0744.0826.3715.9744.8428.7825.1559.8255.5155.1855.10
Table 4. Imputation statistics for the two-stage imputation variants: proportion of nodes belonging to different groups as well as the respective percentages (%) of instances that these nodes are inundated within the original database.
DatabaseStatisticskNN-PPCAkNNrc-PPCAGPI-PPCA
A p n C 2 C 3 A p n C 2 C 3 A p n C 2 C 3
Df% of nodes54.5841.0059.0060.4546.9853.02N/A
% inundated in database33.3426.8134.3432.1326.2335.70
Ds% of nodes63.4952.8547.1565.5555.2044.8073.0959.2740.73
% inundated in database24.4916.7742.5025.0817.7442.6655.5555.1055.23
Table 5. Surge score S C ¯ (cm) for different nodal groups for full domain (Df), for surrogate models supported by different imputation variants. The best accuracy across different imputation variants is highlighted in bold.
Pseudo-Surge Database
(Combination of Ss and Sc)
Corrected Pseudo-Surge Database
(Ss Only)
kNNkNNrcPPCAkNN-PPCAkNNrc-PPCAkNNkNNrcPPCAkNN-PPCAkNNrc-PPCA
All nodes7.697.697.797.517.537.857.878.107.697.73
Once-dry5.325.275.405.135.125.555.605.835.425.49
Surge gap> (m)0.252.272.182.112.172.102.883.132.942.793.05
0.51.851.751.741.811.722.522.912.592.442.83
0.751.761.681.711.761.692.583.102.642.473.02
11.891.811.861.901.842.903.472.932.773.35
1.52.672.562.722.752.704.384.834.404.244.66
Node groups C 2 5.765.415.295.625.436.216.005.746.246.14
C 3 5.005.137.294.794.855.085.227.454.864.92
Table 6. Misclassification M C ¯ (%) for different nodal groups for full domain (Df), for surrogate models supported by different imputation variants. The best accuracy across different imputation variants is highlighted in bold.
Pseudo-Surge Database
(Combination of Ss and Sc)
Corrected Pseudo-Surge Database
(Ss Only)
kNNkNNrcPPCAkNN-PPCAkNNrc-PPCAkNNkNNrcPPCAkNN-PPCAkNNrc-PPCA
All nodes1.541.551.681.531.542.602.793.532.462.62
Once-dry3.573.573.903.543.556.146.588.385.796.18
Surge gap> (m)0.251.011.001.021.000.995.047.156.114.386.01
0.50.770.760.770.760.754.607.725.524.006.41
0.750.690.680.690.690.684.558.535.244.007.03
10.700.680.690.690.684.598.655.174.146.96
1.50.860.840.840.860.845.247.966.325.256.63
Node groups C 2 3.633.674.033.723.758.378.868.697.838.38
C 3 3.523.471.673.423.374.564.392.944.384.24
Table 7. False positive misclassification M C ¯ + (%) for different nodal groups for full domain (Df), for surrogate models supported by different imputation variants. The best accuracy across different imputation variants is highlighted in bold.
Pseudo-Surge Database
(Combination of Ss and Sc)
Corrected Pseudo-Surge Database
(Ss Only)
kNNkNNrcPPCAkNN-PPCAkNNrc-PPCAkNNkNNrcPPCAkNN-PPCAkNNrc-PPCA
All nodes0.680.670.620.660.661.822.052.901.681.89
Once-dry1.631.611.501.601.594.394.947.014.074.56
Surge gap> (m)0.250.310.300.320.300.304.827.006.024.155.84
0.50.210.200.210.210.204.417.605.433.816.29
0.750.190.180.190.190.184.388.425.153.836.91
10.220.200.200.220.204.438.525.063.996.82
1.50.340.280.280.340.285.127.856.225.136.48
Node groups C 2 1.361.391.521.371.407.227.787.346.697.28
C 3 1.831.821.121.761.752.402.231.242.242.15
Table 8. False negative misclassification for M C ¯ (%) for different nodal groups for full domain (Df), for surrogate models supported by different imputation variants. The best accuracy across different imputation variants is highlighted in bold.
Pseudo-Surge Database
(Combination of Ss and Sc)
Corrected Pseudo-Surge Database
(Ss Only)
kNNkNNrcPPCAkNN-PPCAkNNrc-PPCAkNNkNNrcPPCAkNN-PPCAkNNrc-PPCA
All nodes0.860.881.060.870.880.780.740.630.780.73
Once-dry1.931.962.411.941.971.741.631.371.731.62
Surge gap> (m)0.250.700.700.700.700.690.220.150.090.240.16
0.50.550.550.560.550.550.190.120.080.190.13
0.750.500.500.500.490.500.170.110.090.170.12
10.470.490.490.470.490.160.120.110.150.14
1.50.520.560.560.520.560.120.110.100.120.14
Node groups C 2 2.272.282.512.342.351.151.091.351.141.09
C 3 1.691.660.541.671.622.162.151.712.132.09
Table 9. Surge score S C ¯ (cm) for different node groups for subdomain (Ds), for surrogate models supported by different imputation variants. The best accuracy across different imputation variants is highlighted in bold.
Pseudo-Surge Database
(Combination of Ss and Sc)
Corrected Pseudo-Surge Database
(Ss Only)
kNNkNNrcGPIPPCAkNN-PPCAkNNrc-PPCAGPI-PPCAkNNkNNrcGPIPPCAkNN-PPCAkNNrc-PPCAGPI-PPCA
All nodes9.269.259.139.639.399.409.209.619.6710.7210.089.589.839.91
Once-dry5.915.825.856.065.775.695.646.486.627.296.786.256.527.43
Surge gap> (m)0.251.981.861.861.841.921.811.842.733.342.822.702.603.243.92
0.51.581.461.471.471.551.461.492.313.062.352.282.202.973.37
0.751.361.291.301.321.361.301.332.112.972.152.092.012.913.11
11.351.281.291.331.351.311.342.132.932.222.152.032.863.17
1.51.981.871.891.992.031.982.013.153.613.403.293.123.575.09
Node groups C 2 5.014.995.626.004.954.945.225.916.306.706.815.956.418.22
C 3 6.906.846.386.486.566.526.267.097.028.376.576.536.646.27
Table 10. Misclassification M C ¯ (%) for different node groups for subdomain (Ds), for surrogate models supported by different imputation variants. The best accuracy across different imputation variants is highlighted in bold.
Pseudo-Surge Database
(Combination of Ss and Sc)
Corrected Pseudo-Surge Database
(Ss Only)
kNNkNNrcGPIPPCAkNN-PPCAkNNrc-PPCAGPI-PPCAkNNkNNrcGPIPPCAkNN-PPCAkNNrc-PPCAGPI-PPCA
All nodes1.131.131.151.211.121.131.142.372.973.783.352.212.784.40
Once-dry2.782.762.802.962.752.742.795.907.409.408.345.496.9011.00
Surge gap> (m)0.250.780.780.770.780.780.770.785.4710.374.835.034.809.2111.19
0.50.600.590.590.590.600.590.595.2111.114.034.384.539.9310.33
0.750.510.510.510.510.510.510.515.0211.513.553.994.4010.439.81
10.510.510.510.510.510.500.514.8310.803.614.114.419.579.94
1.50.670.650.660.650.660.650.665.208.414.775.485.286.9213.74
Node groups C 2 2.152.252.633.212.222.292.707.4610.209.009.337.239.7716.27
C 3 3.473.383.111.283.263.232.924.183.9510.151.903.813.743.32
Table 11. False positive misclassification M C ¯ + (%) for different node groups for subdomain (Ds), for surrogate models supported by different imputation variants. The best accuracy across different imputation variants is highlighted in bold.
Pseudo-Surge Database
(Combination of Ss and Sc)
Corrected Pseudo-Surge Database
(Ss Only)
kNNkNNrcGPIPPCAkNN-PPCAkNNrc-PPCAGPI-PPCAkNNkNNrcGPIPPCAkNN-PPCAkNNrc-PPCAGPI-PPCA
All nodes0.500.500.490.510.490.500.481.822.473.493.071.682.283.97
Once-dry1.261.261.221.281.251.251.224.576.228.777.724.235.7510.00
Surge gap> (m)0.250.230.230.230.240.230.230.245.1910.194.624.874.549.0411.07
0.50.170.160.160.160.170.160.164.9810.953.844.234.309.7910.23
0.750.140.130.140.130.140.130.144.8311.373.373.844.2110.299.71
10.140.140.140.140.140.140.144.6510.653.453.974.229.439.85
1.50.220.200.210.200.210.200.205.058.274.635.355.136.7813.66
Node groups C 2 0.760.841.061.340.780.851.056.799.608.398.746.589.2115.77
C 3 1.801.791.520.871.691.691.462.132.069.481.021.961.941.60
Table 12. False negative misclassification M C ¯ (%) for different node groups for subdomain (Ds), for surrogate models supported by different imputation variants. The best accuracy across different imputation variants is highlighted in bold.
Pseudo-Surge Database
(Combination of Ss and Sc)
Corrected Pseudo-Surge Database
(Ss Only)
kNNkNNrcGPIPPCAkNN-PPCAkNNrc-PPCAGPI-PPCAkNNkNNrcGPIPPCAkNN-PPCAkNNrc-PPCAGPI-PPCA
All nodes0.630.630.660.700.630.630.660.560.500.300.280.530.490.43
Once-dry1.521.501.581.501.501.491.571.321.180.630.621.261.151.00
Surge gap> (m)0.250.550.540.540.540.540.540.540.280.190.200.160.260.170.12
0.50.430.430.430.430.430.430.430.230.160.190.160.220.140.11
0.750.380.380.380.380.380.370.380.200.140.180.150.190.140.10
10.370.370.370.370.370.360.370.180.140.170.140.180.140.10
1.50.450.450.450.450.450.450.450.150.140.140.120.160.140.09
Node groups C 2 1.381.421.571.871.441.441.640.670.600.610.590.640.570.51
C 3 1.671.591.580.411.571.541.452.051.890.670.881.851.791.72
Disclaimer/Publisher’s Note: The statements, opinions and data contained in all publications are solely those of the individual author(s) and contributor(s) and not of MDPI and/or the editor(s). MDPI and/or the editor(s) disclaim responsibility for any injury to people or property resulting from any ideas, methods, instructions or products referred to in the content.