Article

Satellite-Based Analysis of Nutrient Dynamics in Northern South China Sea Marine Ranching Under the Combined Effects of Climate Warming and Anthropogenic Activities

1
Department of Port, Waterway and Coastal Engineering, School of Transportation, Southeast University, Nanjing 210096, China
2
CCCC Guangdong-Hong Kong-Macao Greater Bay Area Innovation Research Institute Ltd., Zhuhai 519000, China
*
Author to whom correspondence should be addressed.
J. Mar. Sci. Eng. 2025, 13(9), 1677; https://doi.org/10.3390/jmse13091677
Submission received: 23 July 2025 / Revised: 19 August 2025 / Accepted: 28 August 2025 / Published: 31 August 2025
(This article belongs to the Section Marine Environmental Science)

Abstract

This study presents a comprehensive assessment of long-term nutrient dynamics in the northern South China Sea (NSCS), a region that hosts the world’s largest marine ranching cluster and serves as a cornerstone of China’s “Blue Granary” initiative. By integrating multi-sensor satellite remote sensing data (Landsat and Sentinel-2, 2002–2024) with in situ observations, we developed robust retrieval algorithms for total nitrogen (TN) and total phosphorus (TP), achieving high accuracy (TN: R2 = 0.82, RMSE = 0.09 mg/L; TP: R2 = 0.94, RMSE = 0.0071 mg/L; n = 63). Results showed that TP concentrations increased significantly faster than TN, leading to a decline in the TN:TP ratio (NP) from 19.2 to 13.2 since 2013. This shift indicates a transition from phosphorus (P) limitation to nitrogen (N) limitation, driven by warming sea surface temperatures (SST) (about 1.16 °C increase) and increased anthropogenic phosphorus inputs (about 27.84% increase). The satellite-based framework offers a scalable, cost-effective solution for monitoring aquaculture water quality. When integrated with artificial intelligence (AI) technologies, these near-real-time nutrient anomaly data can support early warning of harmful algal blooms (HABs), offering key insights for ecosystem-based management and climate adaptation. Overall, our findings highlight the utility of remote sensing in advancing sustainable marine resource governance amid environmental change.

1. Introduction

Marine ranching, particularly offshore aquaculture, has emerged as a promising strategy to address the depletion of coastal fishery resources and mitigate marine ecological degradation [1,2,3,4]. In China, offshore aquaculture has been positioned as a cornerstone of the nation’s high-quality marine fishery development strategy, fulfilling dual objectives: ensuring marine food security and accelerating the transformation and modernization of the fishing industry [5]. By 2024, China had established nine batches comprising a total of 189 national marine ranching demonstration zones, primarily distributed across the Bohai Sea, Yellow Sea, East China Sea, and South China Sea, covering 11 coastal provinces, autonomous regions, and municipalities, and delivering considerable ecological and economic benefits [6,7]. However, the rapid expansion of marine ranching has also introduced multi-scale disturbances in nutrient dynamics. In particular, anthropogenic feed inputs can disrupt nutrient influx, which, together with hydrodynamic processes such as riverine runoff and sediment resuspension, jointly influences nutrient status, leading to alterations in nutrient migration, transformation, and accumulation processes. These changes have raised growing concerns over ecological risks [8,9,10,11] and potential threats to human health [12,13].
The northern South China Sea (NSCS) hosts the world’s largest marine ranching cluster. Guangdong Province, the core region of China’s “Blue Granary” initiative, has maintained its leading position in the national marine economy for 30 consecutive years. Although it hosts only 9.8% of China’s marine ranches, it encompasses an extensive sea-use area that accounts for nearly half of the national total (approximately 49.88%) [7]. In 2024, Guangdong’s Gross Ocean Product reached ¥2002.25 billion (approx. US $281.7 billion), contributing 14.1% of the regional Gross Domestic Product (GDP) and representing 19.0% of China’s total Gross Ocean Product. Within this sector, the mariculture industry generated an added value of ¥68.19 billion (approx. US $9.57 billion), marking a 3.8% year-on-year increase. The pace of marine ranching development in Guangdong has accelerated markedly, with 624 new gravity-based deep-sea cages and 7 truss-type cages deployed in 2024 alone [14]. Given these ecological pressures and the rapid expansion of marine ranching, the nutrient status and biogeochemical dynamics within the aquaculture zones of the NSCS merit urgent scientific investigation.
Nitrogen (N) and phosphorus (P) are essential macronutrients that regulate phytoplankton growth, metabolic activity, and community structure [15]. The ratio of total nitrogen to total phosphorus (TN:TP, NP) serves as a key ecological indicator. Deviations from the canonical Redfield ratio (NP = 16:1) [16] can shift the nutrient limitation regime: NP < 16 typically reflects N-limited [17], while NP > 16 indicates P-limited [10,18]. Beyond nitrogen and phosphorus, carbon (C) is also a core element in aquatic ecosystems. Algal growth and mortality influence the uptake and release of carbon dioxide, linking nutrient ratios to the carbon source/sink function of marine environments. Thus, variations in NP ratios, through their effects on phytoplankton biomass and metabolic pathways, may modulate the ecosystem’s carbon cycling and sequestration capacity [19,20]. Investigating NP dynamics in aquaculture systems is therefore essential for understanding how mariculture practices influence the oceanic carbon pool, with important implications for evaluating the sustainability of marine ranching under global climate change. In Guangdong Province, the nucleus of China’s marine economy, previous studies have shown that nutrient dynamics in aquaculture zones such as the Pearl River Estuary (PRE) (Figure 1a) are predominantly P-limited. However, increasing nutrient loads driven by intensified aquaculture activities and climate-induced shifts in hydrodynamics are threatening the stability of NP ratios in coastal waters [21,22,23]. Notably, NP values below 16 have already been observed in certain eastern Guangdong mariculture areas, indicating a transition towards nitrogen-limited regimes. Lin et al. [21] further highlighted the spatiotemporal variability of NP ratios across different mariculture zones and seasons. Imbalances in NP ratios can promote harmful algal blooms (HABs) dominated by taxa such as Trichodesmium (favored by N-excess) or Pseudo-nitzschia (favored by P-surplus) [24]. Such events are often associated with cascading ecological consequences, including eutrophication, hypoxia, and acidification [25], and toxin production [26]. These impacts deteriorate water quality and threaten the ecological integrity and economic viability of coastal aquaculture [27,28]. The PRE and western Guangdong coastal areas—particularly Zhanjiang and Maoming—have been recurrently affected by HABs. Between 2013 and 2022, China experienced over 95 such outbreaks in Guangdong alone, causing direct economic losses exceeding ¥57.6 billion (approx. US $8.07 billion) nationwide [29,30,31]. For instance, mass fish mortality incidents were recorded in Zhuhai and Huizhou. Similarly, Yangjiang’s marine ranches, a major production area for golden pompano (Trachinotus ovatus), have suffered considerable economic setbacks in recent years due to nutrient-induced ecological stress [32].
The frequent occurrence of severe HABs highlights the urgent need to establish integrated monitoring systems, integrating remote sensing, in situ measurements, laboratory analyses, predictive modeling, and data platforms, along with early-warning frameworks and mitigation strategies to minimize their ecological and economic impacts on coastal ecosystems and mariculture industries. Conventional aquaculture water quality monitoring systems are constrained by several limitations, including insufficient spatial coverage, coarse resolution, and low temporal frequency. These challenges become especially critical during HABs emergencies, exposing major deficiencies in traditional methods, particularly in terms of three-dimensional nutrient profiling and the characterization of nutrient transport processes [29,30,33]. Although previous studies have monitored various nutrient species in the coastal waters of Yangjiang, most have been restricted to short-term (monthly or seasonal) observations [30,31]. Lin et al. [21] investigated the spatiotemporal evolution of NP ratios in recent years across several coastal regions in Guangdong, such as Leizhou Bay, Chaozhou Bay, and the PRE. However, no comprehensive assessment of the NP ratio has been conducted for the Yangjiang’s marine ranching areas. In particular, a systematic understanding of long-term (decadal-scale) nutrient dynamics and transport processes within offshore net-pen aquaculture systems remains lacking. This knowledge gap severely limits the ability to develop effective early-warning systems for ecological hazards such as HABs. Therefore, investigating the long-term variability of nutrient levels and identifying their regulatory mechanisms in offshore aquaculture areas has become an urgent scientific priority. Satellite remote sensing, with its synoptic coverage and repeatability, offers an innovative approach to address the spatiotemporal constraints of conventional in situ monitoring [34,35]. Recent studies have demonstrated the potential of remote sensing for regional-scale quantitative inversion of nutrient concentrations. Zhao et al. [36] combined GF-1 WEV data with an XGBoost model to estimate total nitrogen and total phosphorus in a reservoir in the northern Sichuan Plain, Zou et al. [37] employed Sentinel-2 L1C imagery to retrieve nitrogen and phosphorus in aquaculture areas of the Jianghan Plain, and Yu et al. [38] established inversion models for TP and TN based on systematic spectral data in Hongze Lake. Building on these advances, our study aims to develop novel multi-source satellite-based inversion models for marine ranching areas, enabling high-resolution, dynamic monitoring of nutrient dynamics and providing a robust foundation for early warning and predictive systems for HABs, thereby supporting the sustainable management of coastal aquaculture ecosystems.
This study aims to address two fundamental research questions: (1) How does the rapid expansion of offshore aquaculture in the NSCS since the 2013 altered the nutrient limitation in surface marine ecosystems? (2) What are the dominant biochemical and hydrodynamic mechanisms driving the nutrient regime shifts observed in this region? To answer these questions, we employed multi-sensor satellite remote sensing techniques to retrieve the spatiotemporal distribution patterns of NP ratios across the NSCS. We further analyzed the biogeochemical processes regulating nutrient dynamics in offshore mariculture zones to identify the dominant drivers of nutrient regime transitions.
The outcomes of this research contribute to the development of scalable, data-driven frameworks for nutrient monitoring in marine ranching ecosystems globally, especially in western Guangdong, an intensive aquaculture region. Moreover, by linking nutrient dynamics to carbon cycling processes, this study provides critical scientific support for understanding the mechanisms underlying marine carbon sequestration (i.e., “blue carbon”), ultimately informing ecosystem-based conservation strategies and climate-resilient marine resource management under ongoing climate change.

2. Study Area and Data Resources

2.1. Study Area

The study area is situated near Hailing Island (HLI) (Figure 1b), Yangjiang City, Guangdong Province, in the NSCS, west of the PRE (Figure 1a) and adjacent to the Guangdong–Hong Kong–Macao Greater Bay Area. The geographical coordinates of the region range approximately from 111.8° E to 112.3° E longitude and 21.3° N to 21.8° N latitude. This area is economically prosperous, with fisheries serving as the primary industry. Since 2013, over one hundred deep-sea cage aquaculture bases have been established in this region, as highlighted by the red rectangles in Figure 1a,b, with an on-site view provided in Figure 1c. The predominant cultured species in this region is the golden pompano (Trachinotus ovatus), an economically important marine fish in Guangdong Province, with the Yangjiang coastal waters representing the second-largest production area within the province [39].
The red-marked area of interest (Figure 1a–c) on the map is located approximately 12 km offshore near Yangjiang, with a water depth of around 10 m. Deep-sea cage culture systems have been deployed in the waters surrounding Dahuo Island (DHI) (Figure 1b), primarily targeting golden pompano. This area has a subtropical climate, dominated by southeast winds, with an annual average temperature of approximately 22.3 °C. Under the influence of global warming, sea surface temperature (SST) in autumn has shown an increasing trend, with the average November temperature over the past decade reaching about 25 °C (Figure 1d,e). Currents and waves predominantly flow in a southeastward direction, and the area has historically experienced strong typhoons. The seabed within 5 m is primarily composed of clayey silt or silt. No HABs have been reported within the offshore aquaculture zone marked in red, however, several significant HABs events were documented in the adjacent waters of HLI during spring in 2022, 2024 and 2025 (Figure 1b).

2.2. Data Sources

Remote sensing data employed in this study were obtained from the Level 2 products of the National Aeronautics and Space Administration (NASA) Landsat 5/7/8/9 missions spanning 2003 to 2024, and the European Space Agency (ESA) Sentinel-2 mission covering 2019 to 2024. These datasets have undergone rigorous preprocessing steps, including radiometric calibration and atmospheric correction, enabling accurate quantitative retrievals of TN, TP, and SST. To ensure optimal data quality and minimize cloud contamination, only images acquired during the month of November were selected for analysis (Table 1).
Field measurements were obtained through two separate sampling campaigns. The large-scale campaign, conducted from January to April 2024, encompassed a broad spatial extent to capture seasonal variations. In addition, a targeted sampling effort was carried out in November 2024, focusing on 13 specific sites within the cage culture areas. These campaigns collected in situ data on SST, TN, and TP, providing essential validation and complementary information for the remote sensing analysis (Table 2). During field sampling, SST was measured using a Sea-Bird water quality monitoring instrument. Immediately after collection, the water samples were transported to the analytical center under refrigerated conditions at 4 °C. The samples were subsequently filtered using vacuum filtration techniques, and the concentrations of TN and TP were determined with a SEAL continuous flow analyzer.

3. Remote Sensing Quantitative Inversion

3.1. Selection and Optimization of Remote Sensing Data Sources

Before performing quantitative remote sensing inversion, a thorough evaluation of available data sources was conducted to ensure the accuracy and reliability of the results. This study systematically compared various datasets and optimized the data selection through comprehensive experimental analyses.
Initial consideration of Moderate Resolution Imaging Spectroradiometer (MODIS) data was abandoned due to its coarse spatial resolution, which was insufficient to capture the fine-scale spatial heterogeneity required for this study. For the Landsat series, a temporal stratification strategy was implemented: Landsat 5 data were utilized prior to 2013 to avoid striping artifacts associated with Landsat 7, while Landsat 8 and 9 data were used from 2013 onward. Landsat 7’s Enhanced Thematic Mapper Plus (ETM+) exhibited superior performance in SST monitoring owing to its unique sensor characteristics [40]: (1) Band 6 (thermal infrared) provides a native resolution of 60 m, resampled to 30 m in Level-1 products; (2) a dual-gain design accommodates varying radiation conditions, preventing saturation and underexposure; and (3) enhanced radiometric performance compared to TM (120 m native resolution, single gain) and OLI (100 m resolution). Although striping artifacts caused by the Scan Line Corrector (SLC) failure in Landsat 7 post-2003 posed challenges, these were effectively mitigated using focal mean interpolation. In addition, previous studies have demonstrated that Landsat 7 ETM+ provides more accurate SST measurements compared to other Landsat sensors, with minimal bias, further supporting its effectiveness for high-resolution water surface temperature monitoring [41]. Since 2021, Landsat 8 and 9 have delivered SST retrievals of comparable quality, serving as reliable alternatives when Landsat 7 data are unavailable.
During algorithm development, obtaining (quasi-) synchronous satellite reflectance data concurrent with in situ measurements proved challenging due to cloud contamination throughout the January–April 2024 sampling campaign, underscoring limitations in temporal resolution. This limitation necessitated the incorporation of Sentinel-2 data to achieve adequate temporal matching.
Ultimately, the optimized data selection strategy employed Sentinel-2 imagery for developing inversion algorithms of TN and TP, while prioritizing Landsat data in the following order: Landsat 7 ETM+ (pre-2013), Landsat 8 OLI (post-2020), and Landsat 9 as a secondary option.

3.2. The Establishment of Inversion Algorithms

Prior to inversion analysis, all remote sensing datasets underwent scale transformation and cloud masking procedures on the Google Earth Engine (GEE) platform. To ensure compatibility with in situ measurements while maintaining high spatial resolution, Sentinel-2 imagery was employed to develop inversion algorithms for TN and TP concentrations. These algorithms were subsequently applied to Landsat 8 data to enhance both temporal and spatial coverage of the analysis.
Model training and validation were performed using 63 field samples, with an 80%/20% split for training and validation sets, respectively. The algorithms demonstrated robust performance, achieving high accuracy across both training and validation datasets (R2 = 0.82, RMSE = 0.09 mg/L for TN; R2 = 0.94, RMSE = 0.0071 mg/L for TP, respectively). These results confirm the reliability of the proposed method for estimating TN and TP concentrations in the study area. The developed empirical algorithms of TN (Equation (1)) and TP (Equation (2)) are expressed as follows:
y = 0.1996 − 5.8032x1 + 5.2725x2 + 0.9737x3
y = 0.0155 − 0.6508x1 + 0.5572x2 + 0.0597x3
where y in Equation (1) and Equation (2) represents the estimated concentrations inversion results of TN (mg/L) and TP (mg/L), respectively, while variables x1, x2, and x3 represent the reflectance values in the blue, green, and red spectral bands, respectively, derived from Landsat satellite imagery. These selected bands could capture the optical signals of chlorophyll a and suspended matter, which are strongly correlated with TN and TP, enabling reliable indirect estimation of nutrient concentrations [42].
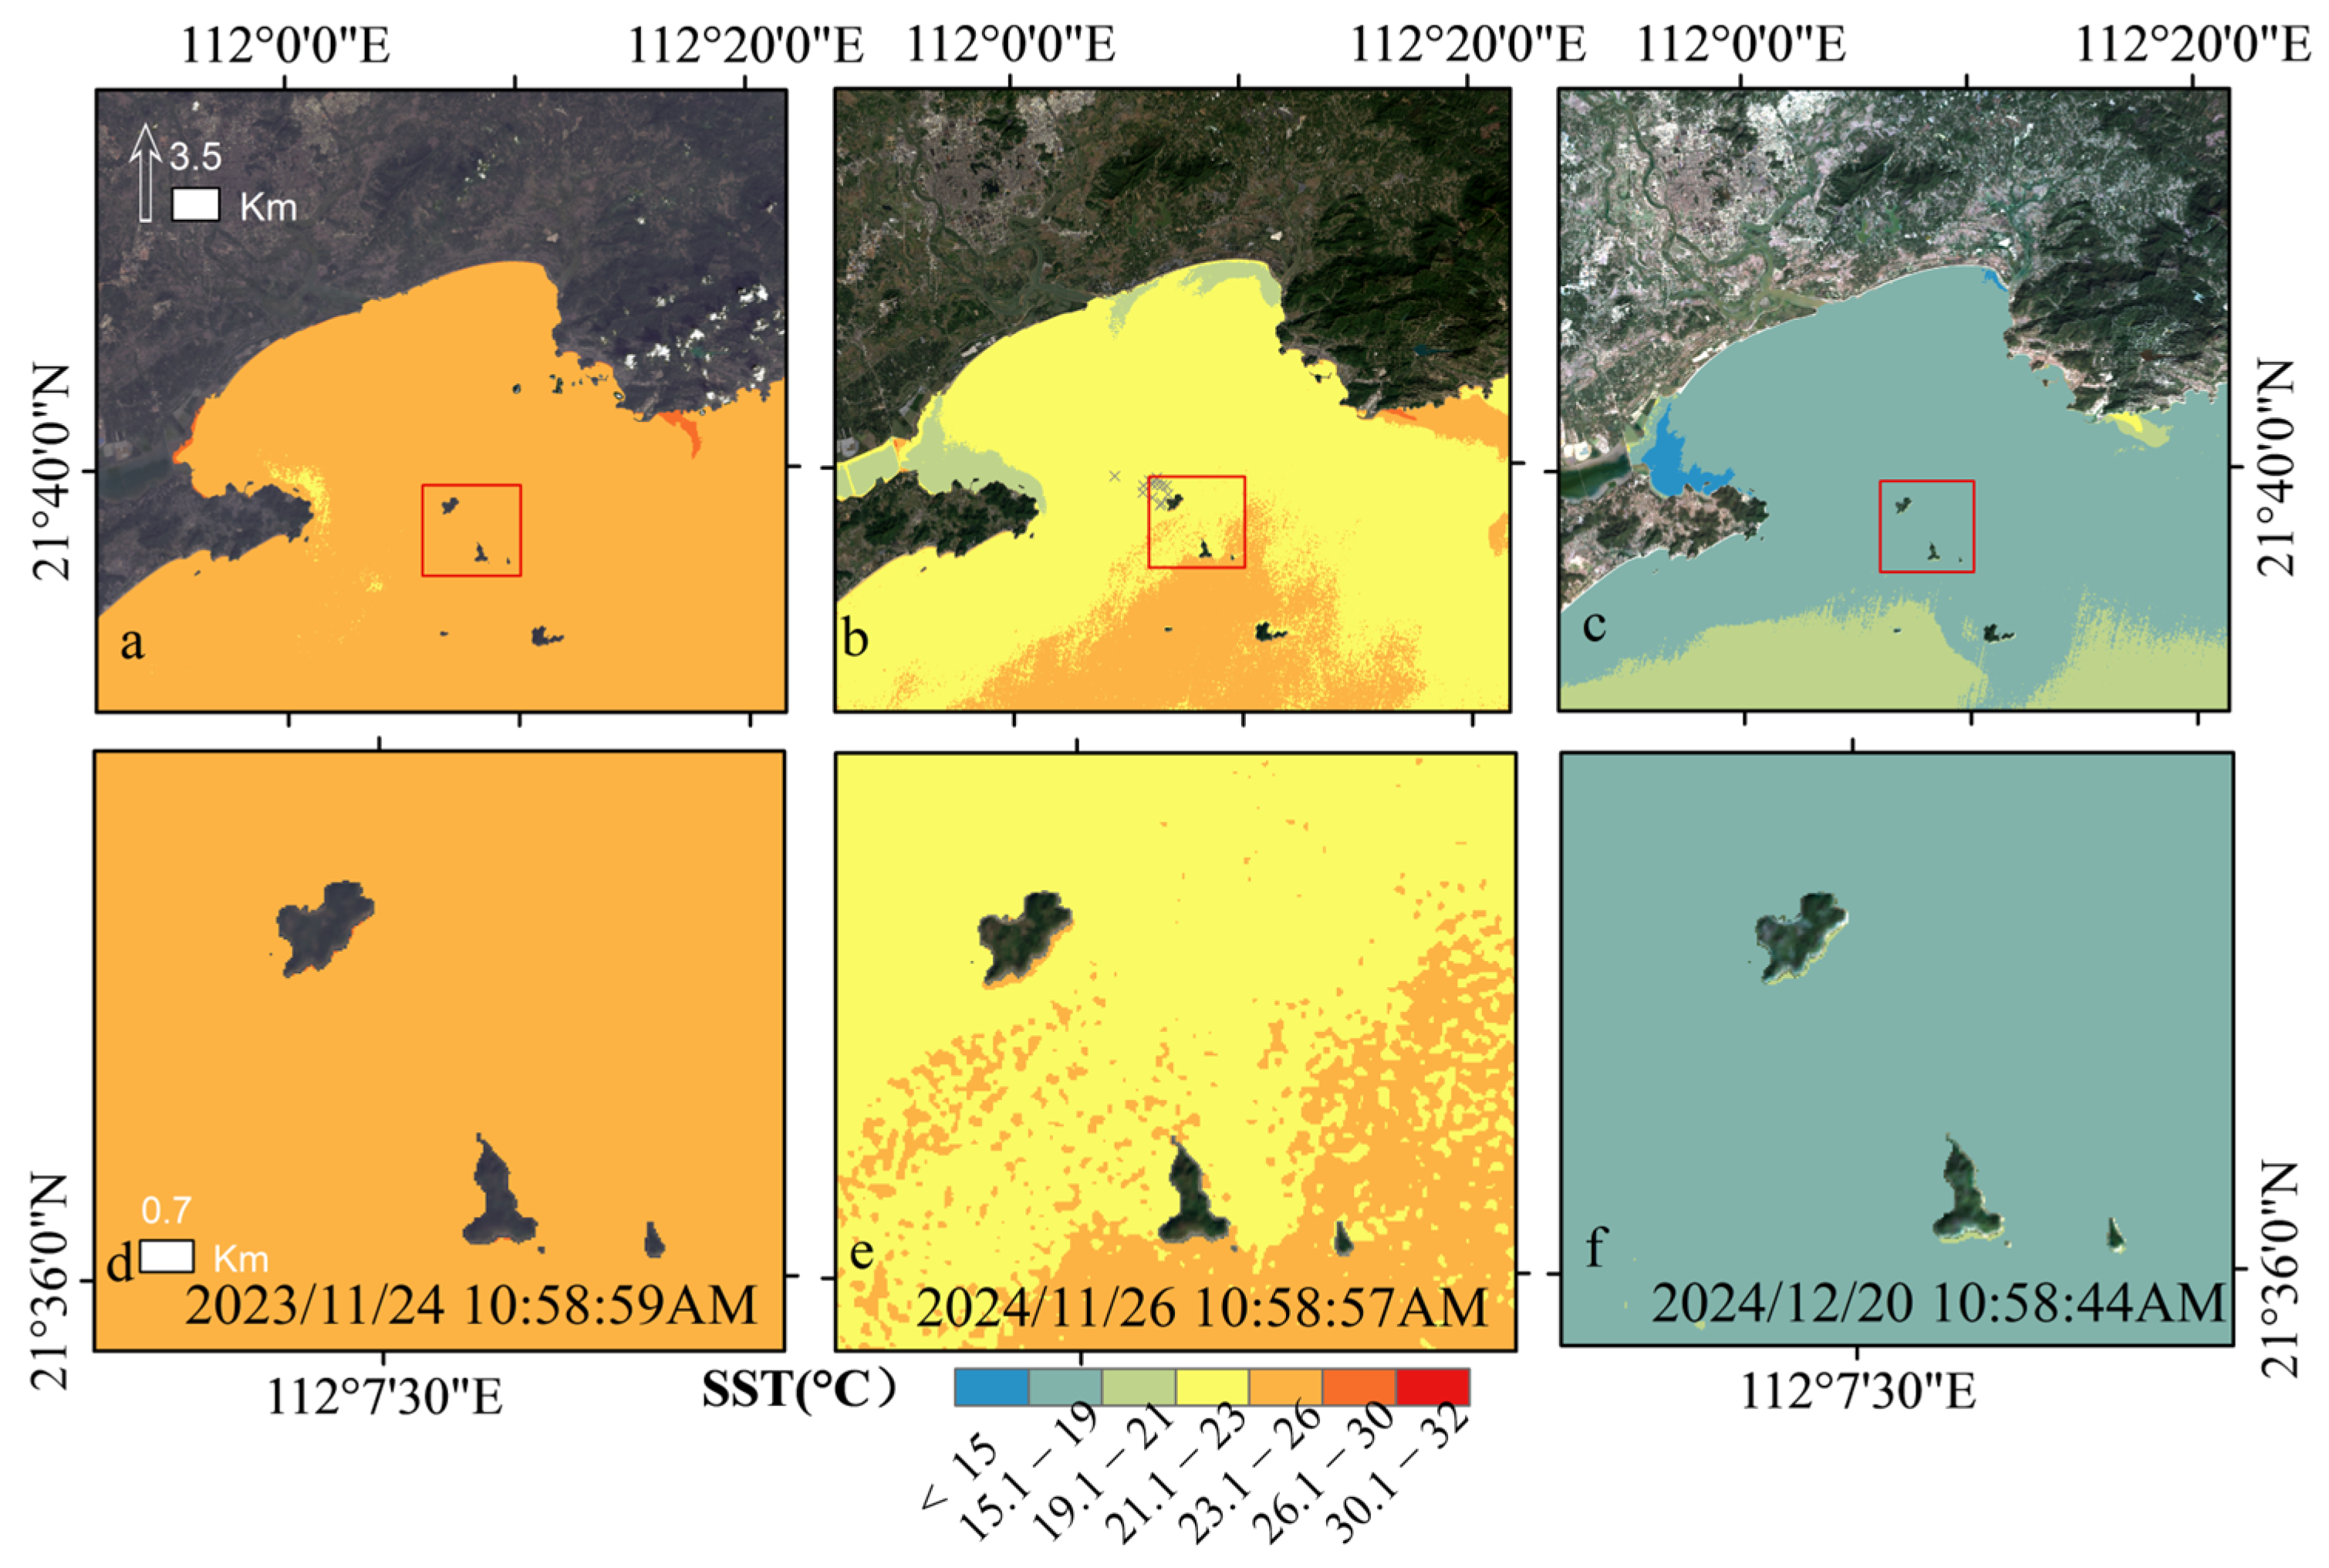
SST was retrieved from thermal infrared bands, with derived values ranging between 21–23 °C (Figure 2b,f), confirming the reliability of the inversion process.

4. Results

4.1. Spatiotemporal Evolution of the Total Nitrogen-to-Total Phosphorus Ratio (NP)

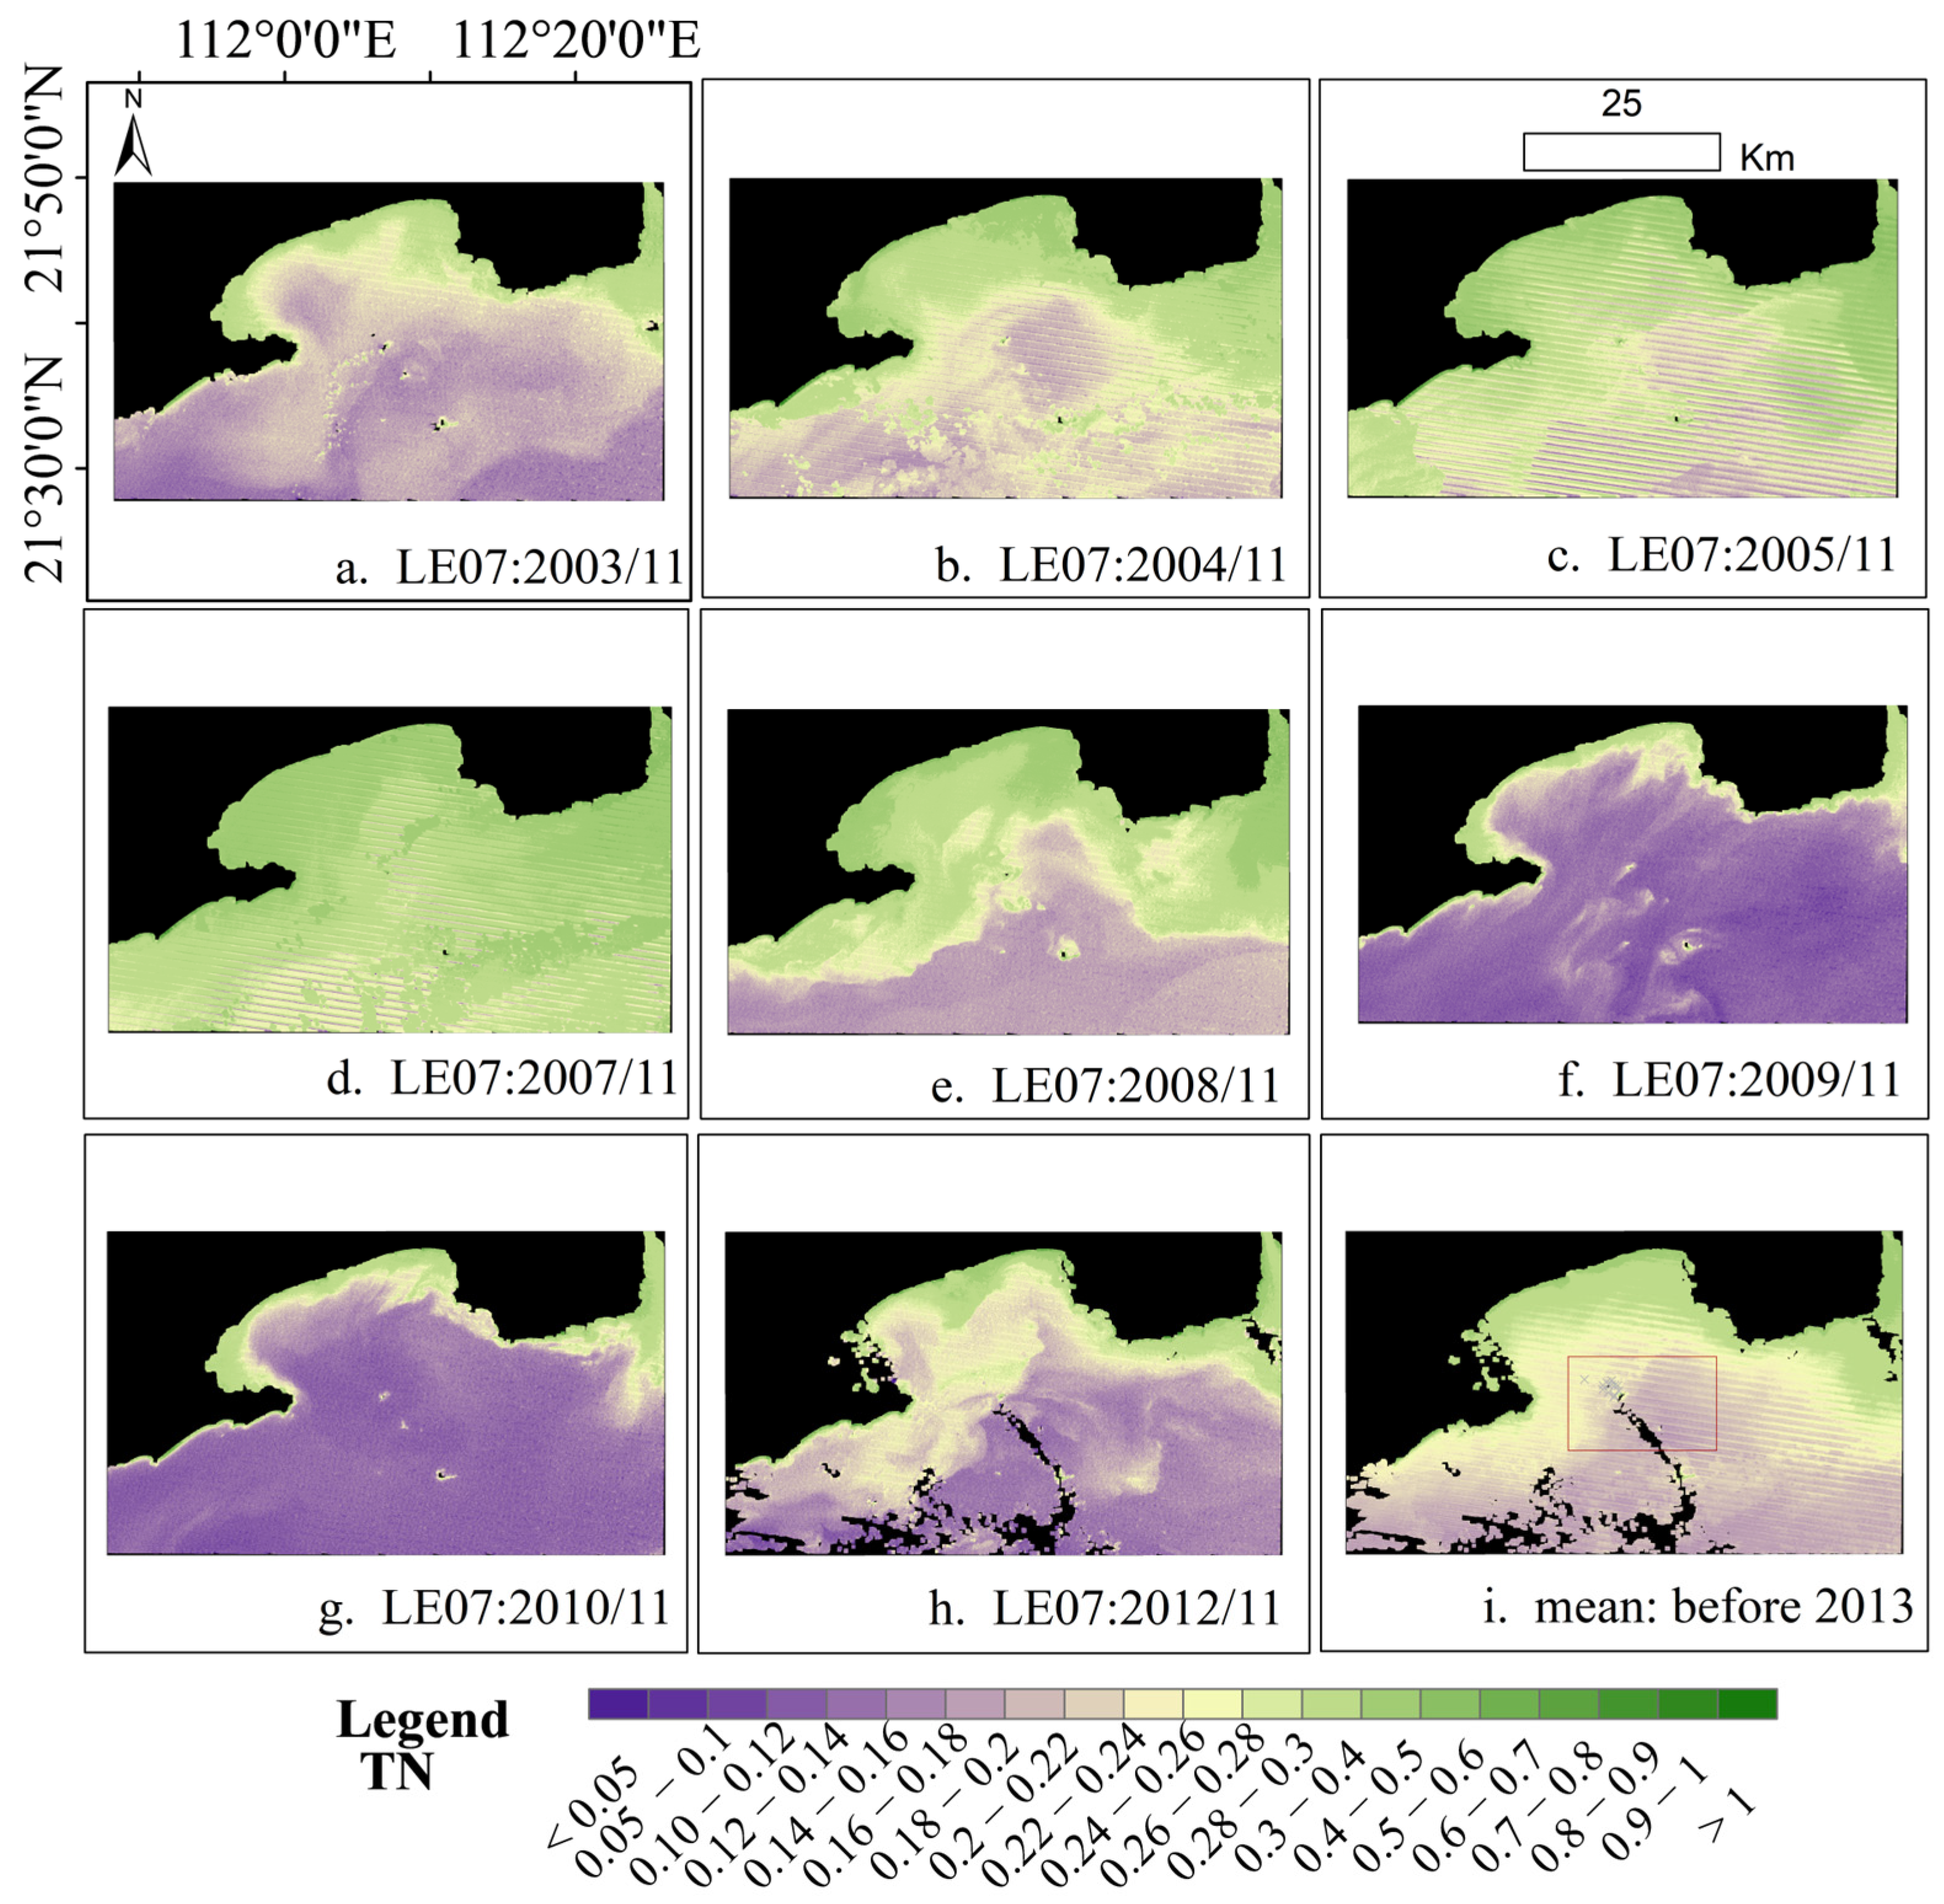
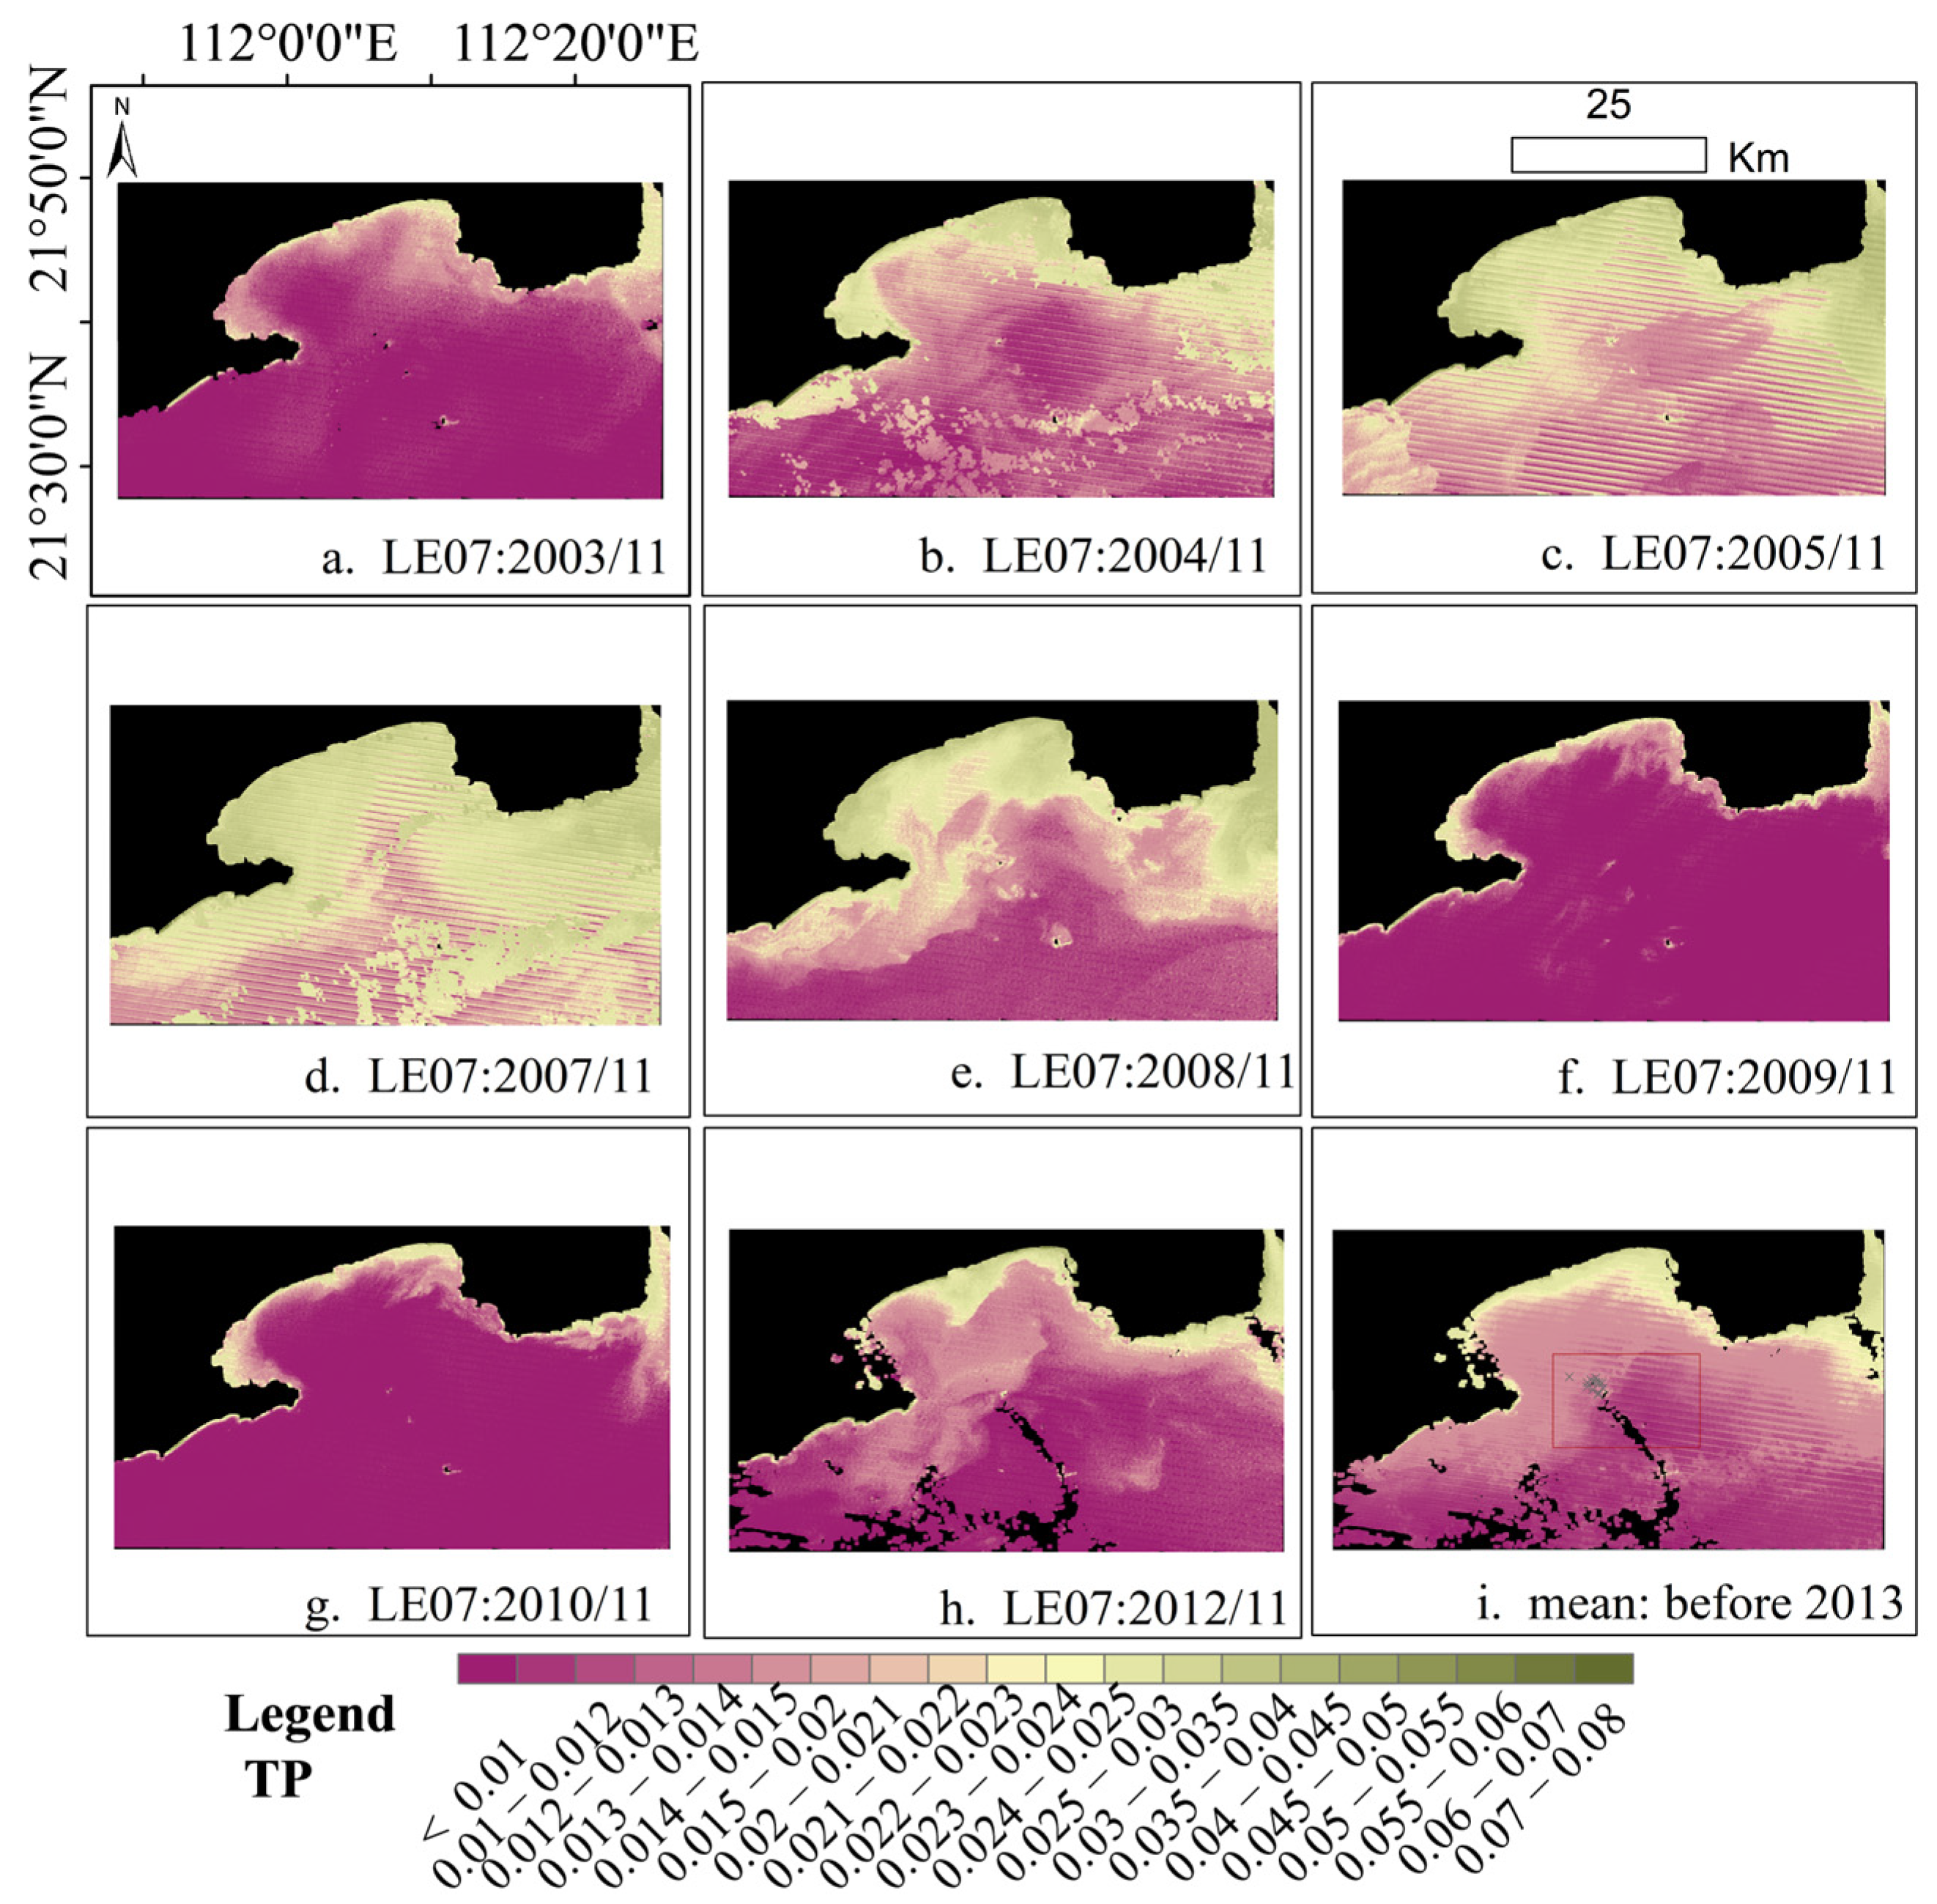
Spatially, the distribution of TN concentrations in surface waters exhibited a distinct “nearshore high, offshore low” gradient, with elevated values primarily concentrated in the HLI region and the northeastern part of the study area. This pattern is likely driven by riverine inputs. Following 2013, TN levels increased across the entire region, although the magnitude of the increase was relatively smaller within the bay area (Appendix A, Figure A1 and Figure A2). TP showed a similar spatial distribution and also increased after 2013, albeit with less clearly defined low-increase zones compared to TN (Appendix A, Figure A3 and Figure A4).
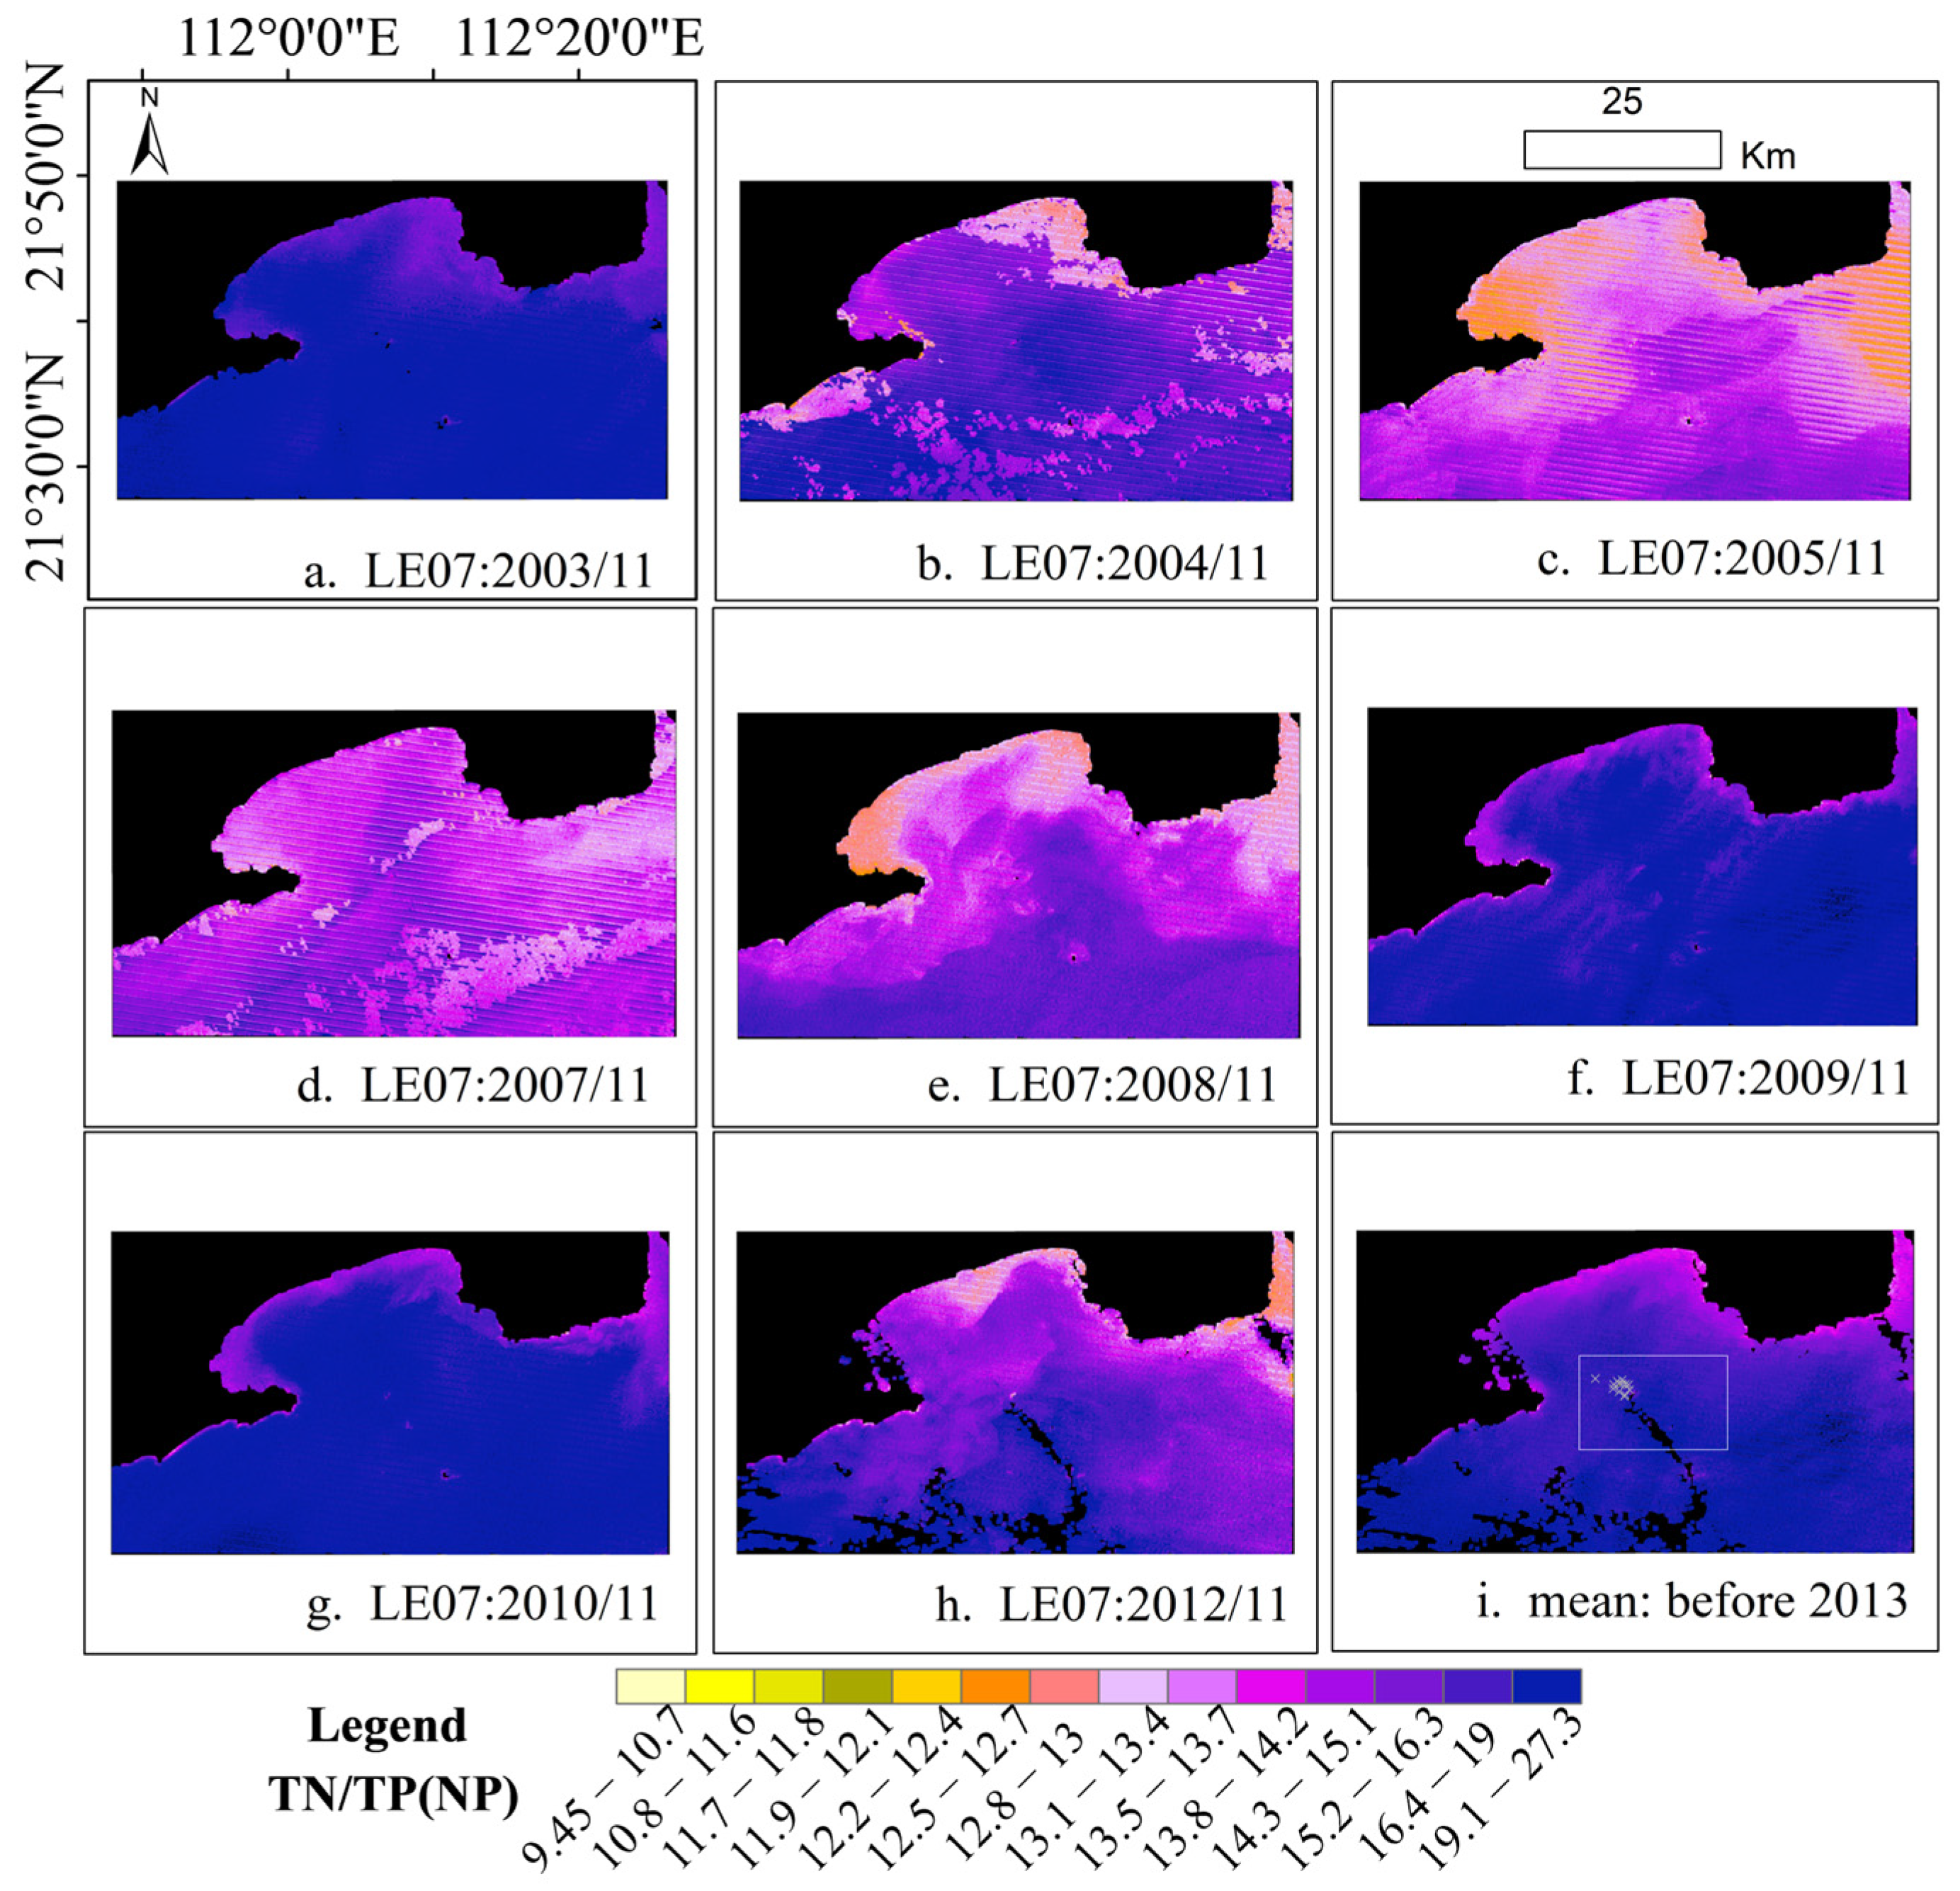
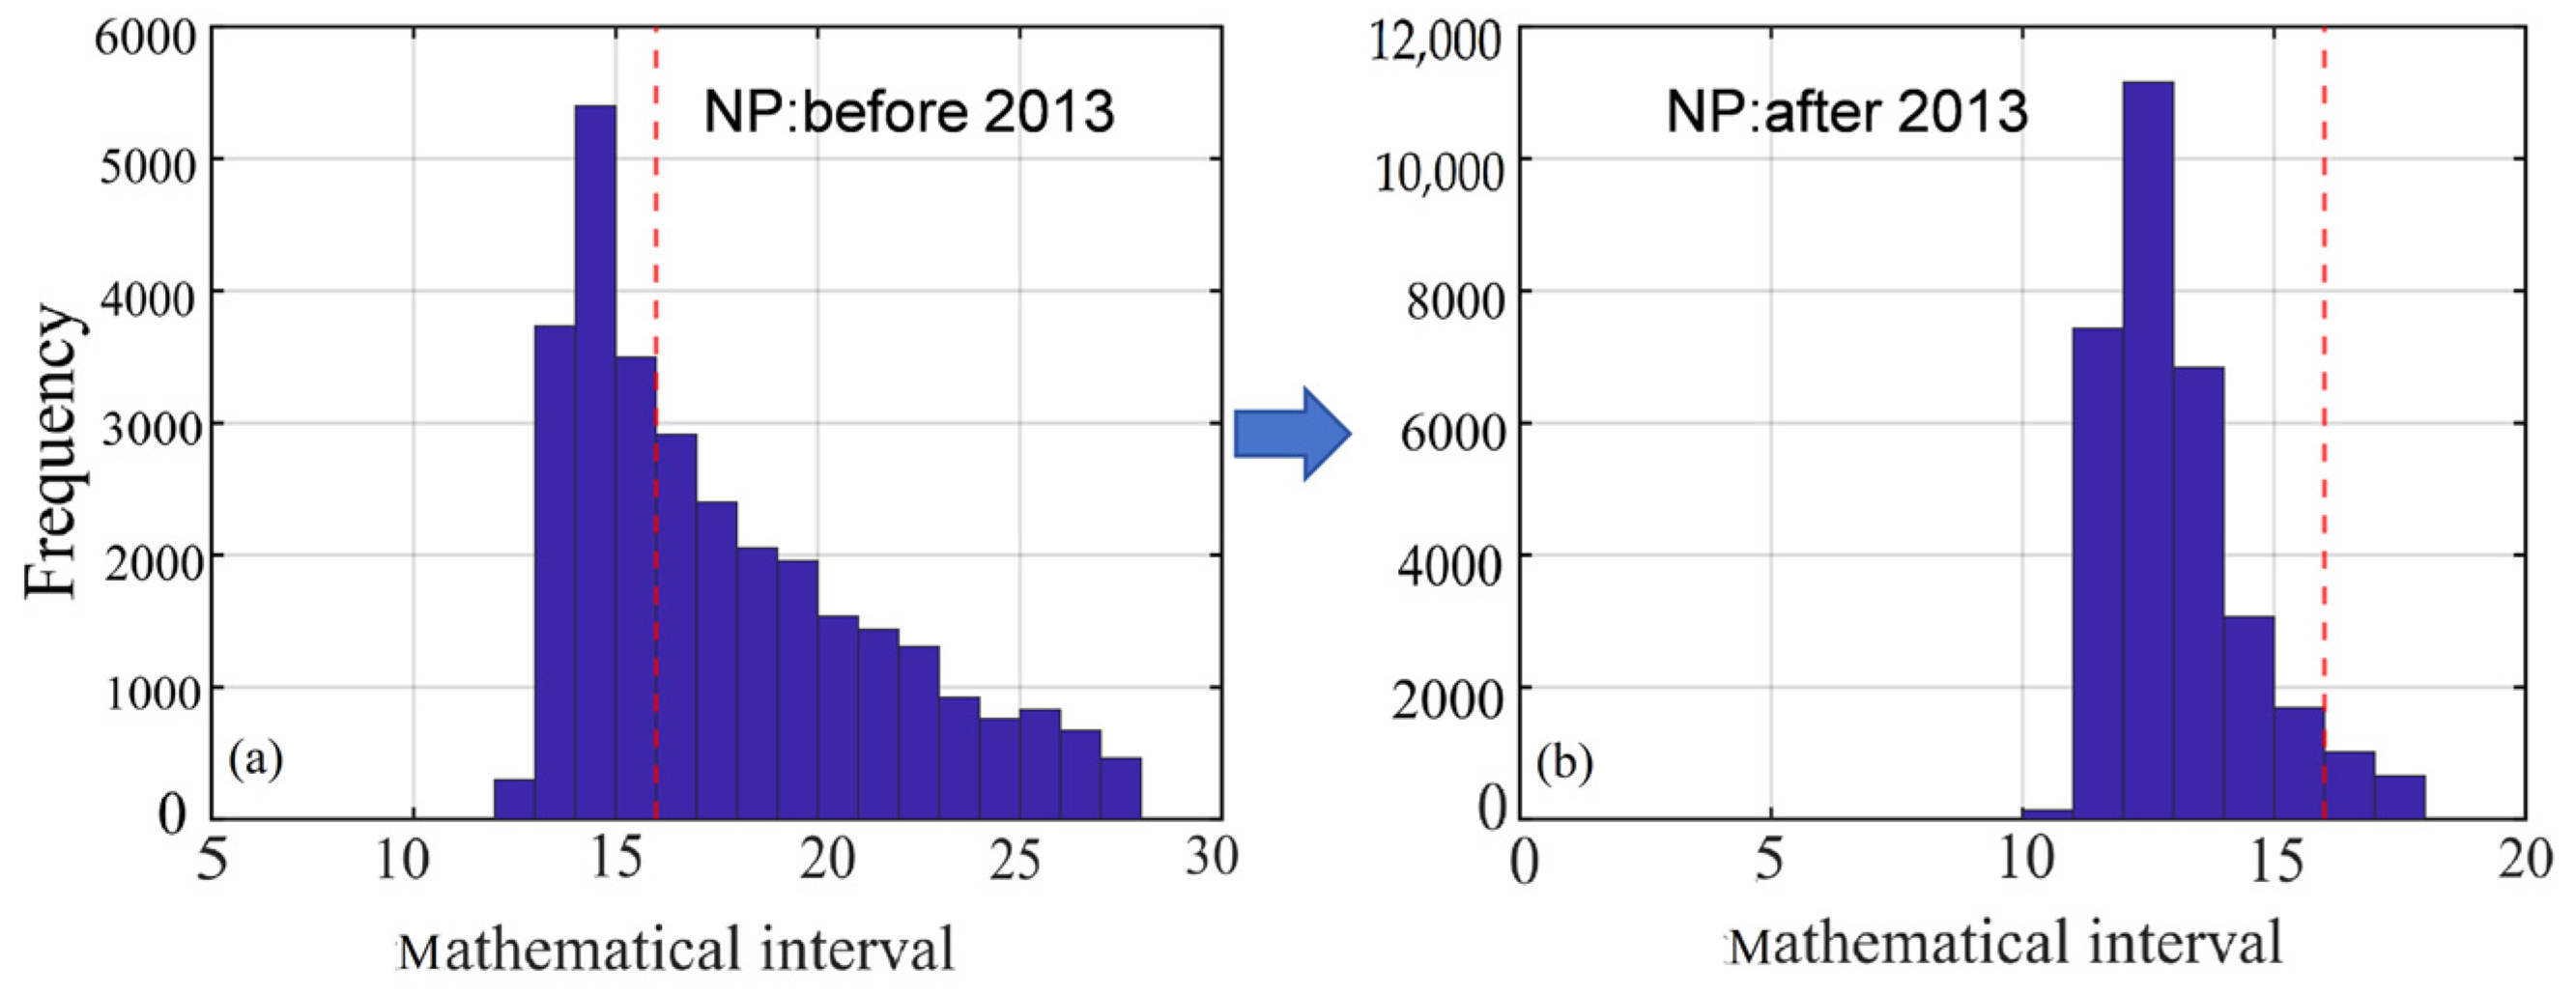
The NP ratio displayed a spatial gradient, increasing from the inner bay toward offshore waters. Notably, a significant regional decline in the NP ratio was observed after 2013. Before 2013, NP ratios frequently exceeded 16 in most offshore areas (Figure 3). Post-2013, warm-colored zones (yellow to orange) became dominant in the spatial maps, indicating a widespread decline in NP, especially after 2021 (Figure 4). Along the northern coastline, the NP ratio declined by approximately 5 units, with even greater reductions observed in other parts of the region. As shown in Figure 5, NP ratios predominantly exceeded 16 before 2013 but declined steadily in subsequent years, falling below 16 in most areas. Using the Redfield ratio (16:1) as an ecological threshold, these findings suggest a shift in nutrient limitation status—from “P limitation” prior to 2013 to “N limitation” in the post-2013 period.
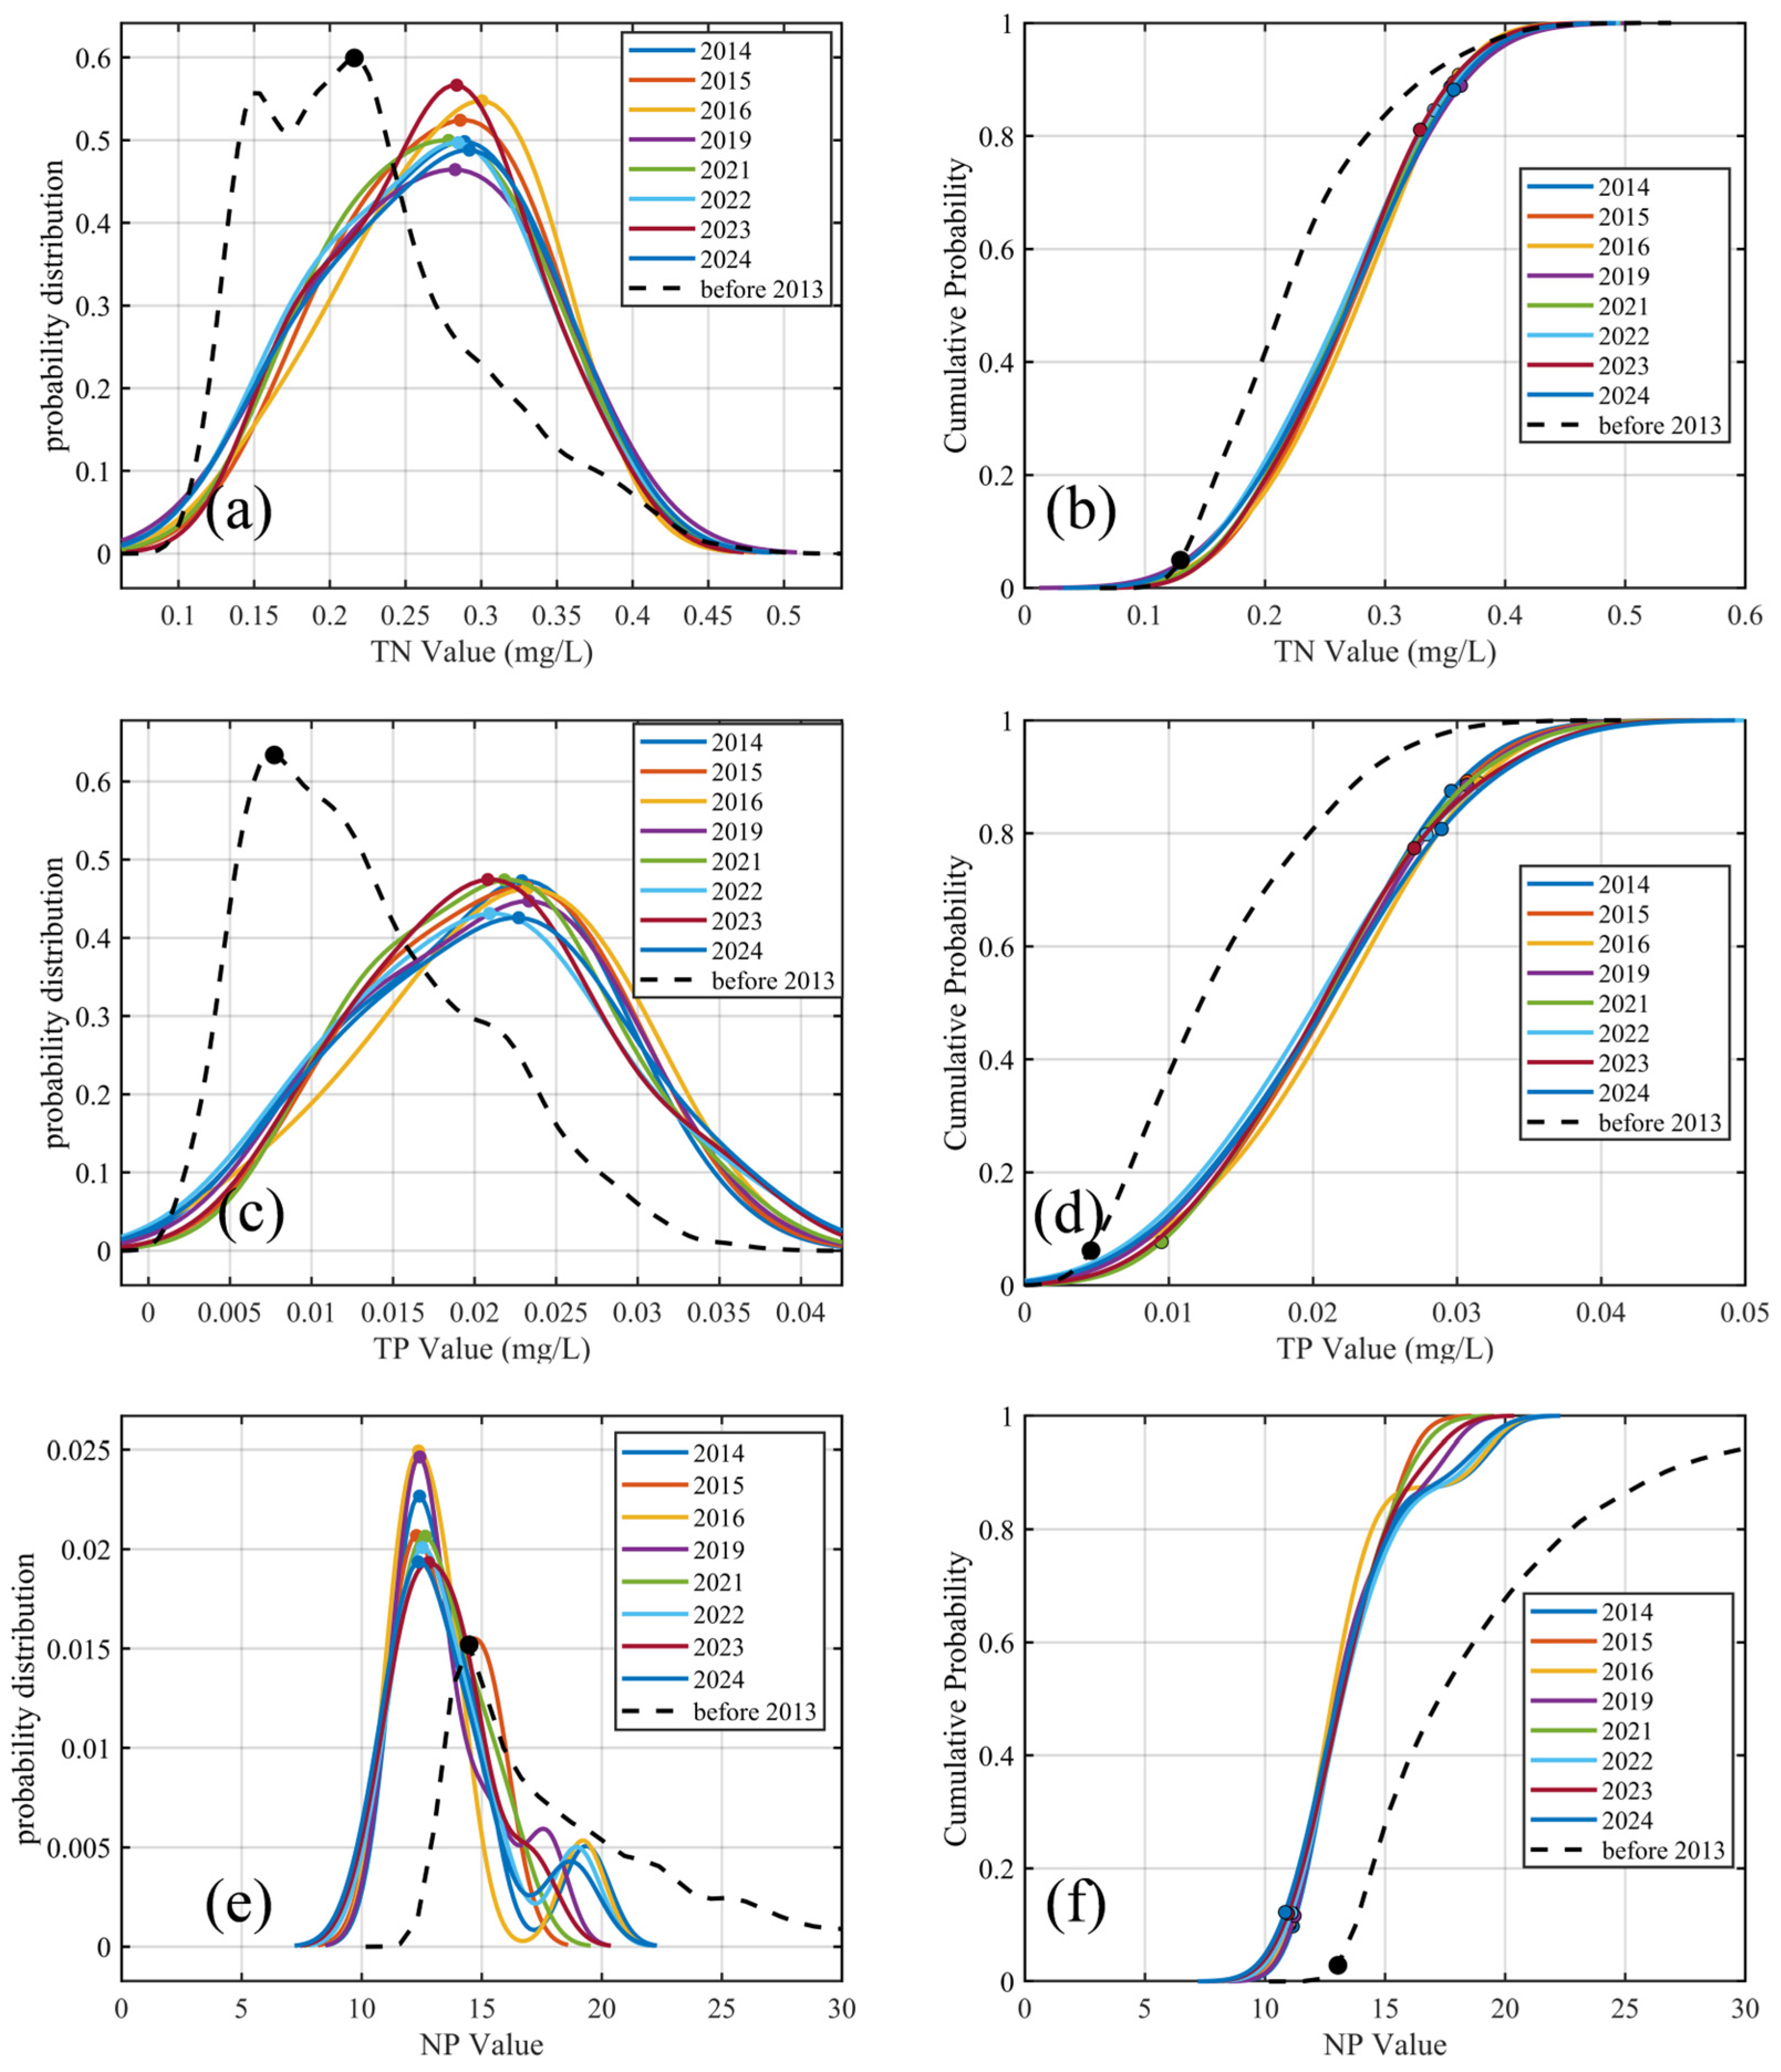
To further elucidate the temporal changes in the cage culture area, probability density functions (PDFs) and cumulative distribution functions (CDFs) were calculated for annual TN, TP, and the NP ratio post-2013 (Figure 6). The PDF curves for TN and TP shifted toward higher concentrations, with TP exhibiting a more pronounced increase. The PDF curve for NP narrowed, with high-ratio regions (e.g., >22) disappearing post-2013. The most frequent NP value decreased from approximately 15 to approximately 12. This narrowing reflects a more uniform nutrient environment dominated by nitrogen limitation.
The CDF curves for TN and TP post-2013 generally shifted to the right of the pre-2013 curves, indicating higher nutrient levels of TN and TP. The inflection points for TN and TP shifted from 0.13 mg/L and 0.0046 mg/L, respectively, to 0.32–0.36 mg/L (TN) and 0.02–0.03 mg/L (TP), suggesting critical thresholds for nutrient concentrations. For the NP ratio, the inflection point decreased from approximately 13 to 10–11, indicating a shift in ecological thresholds potentially driven by intensified aquaculture activities and associated nutrient dynamics. Ecologically, the narrowing of the NP distribution suggests stronger nutrient stress for phytoplankton communities, which may alter species composition, reduce biodiversity, and affect primary productivity. Overall, these results indicate that aquaculture not only increased nutrient concentrations but also homogenized nutrient availability, with potential cascading effects on local food webs and ecosystem stability.

4.2. Analysis of Key Driving Factors

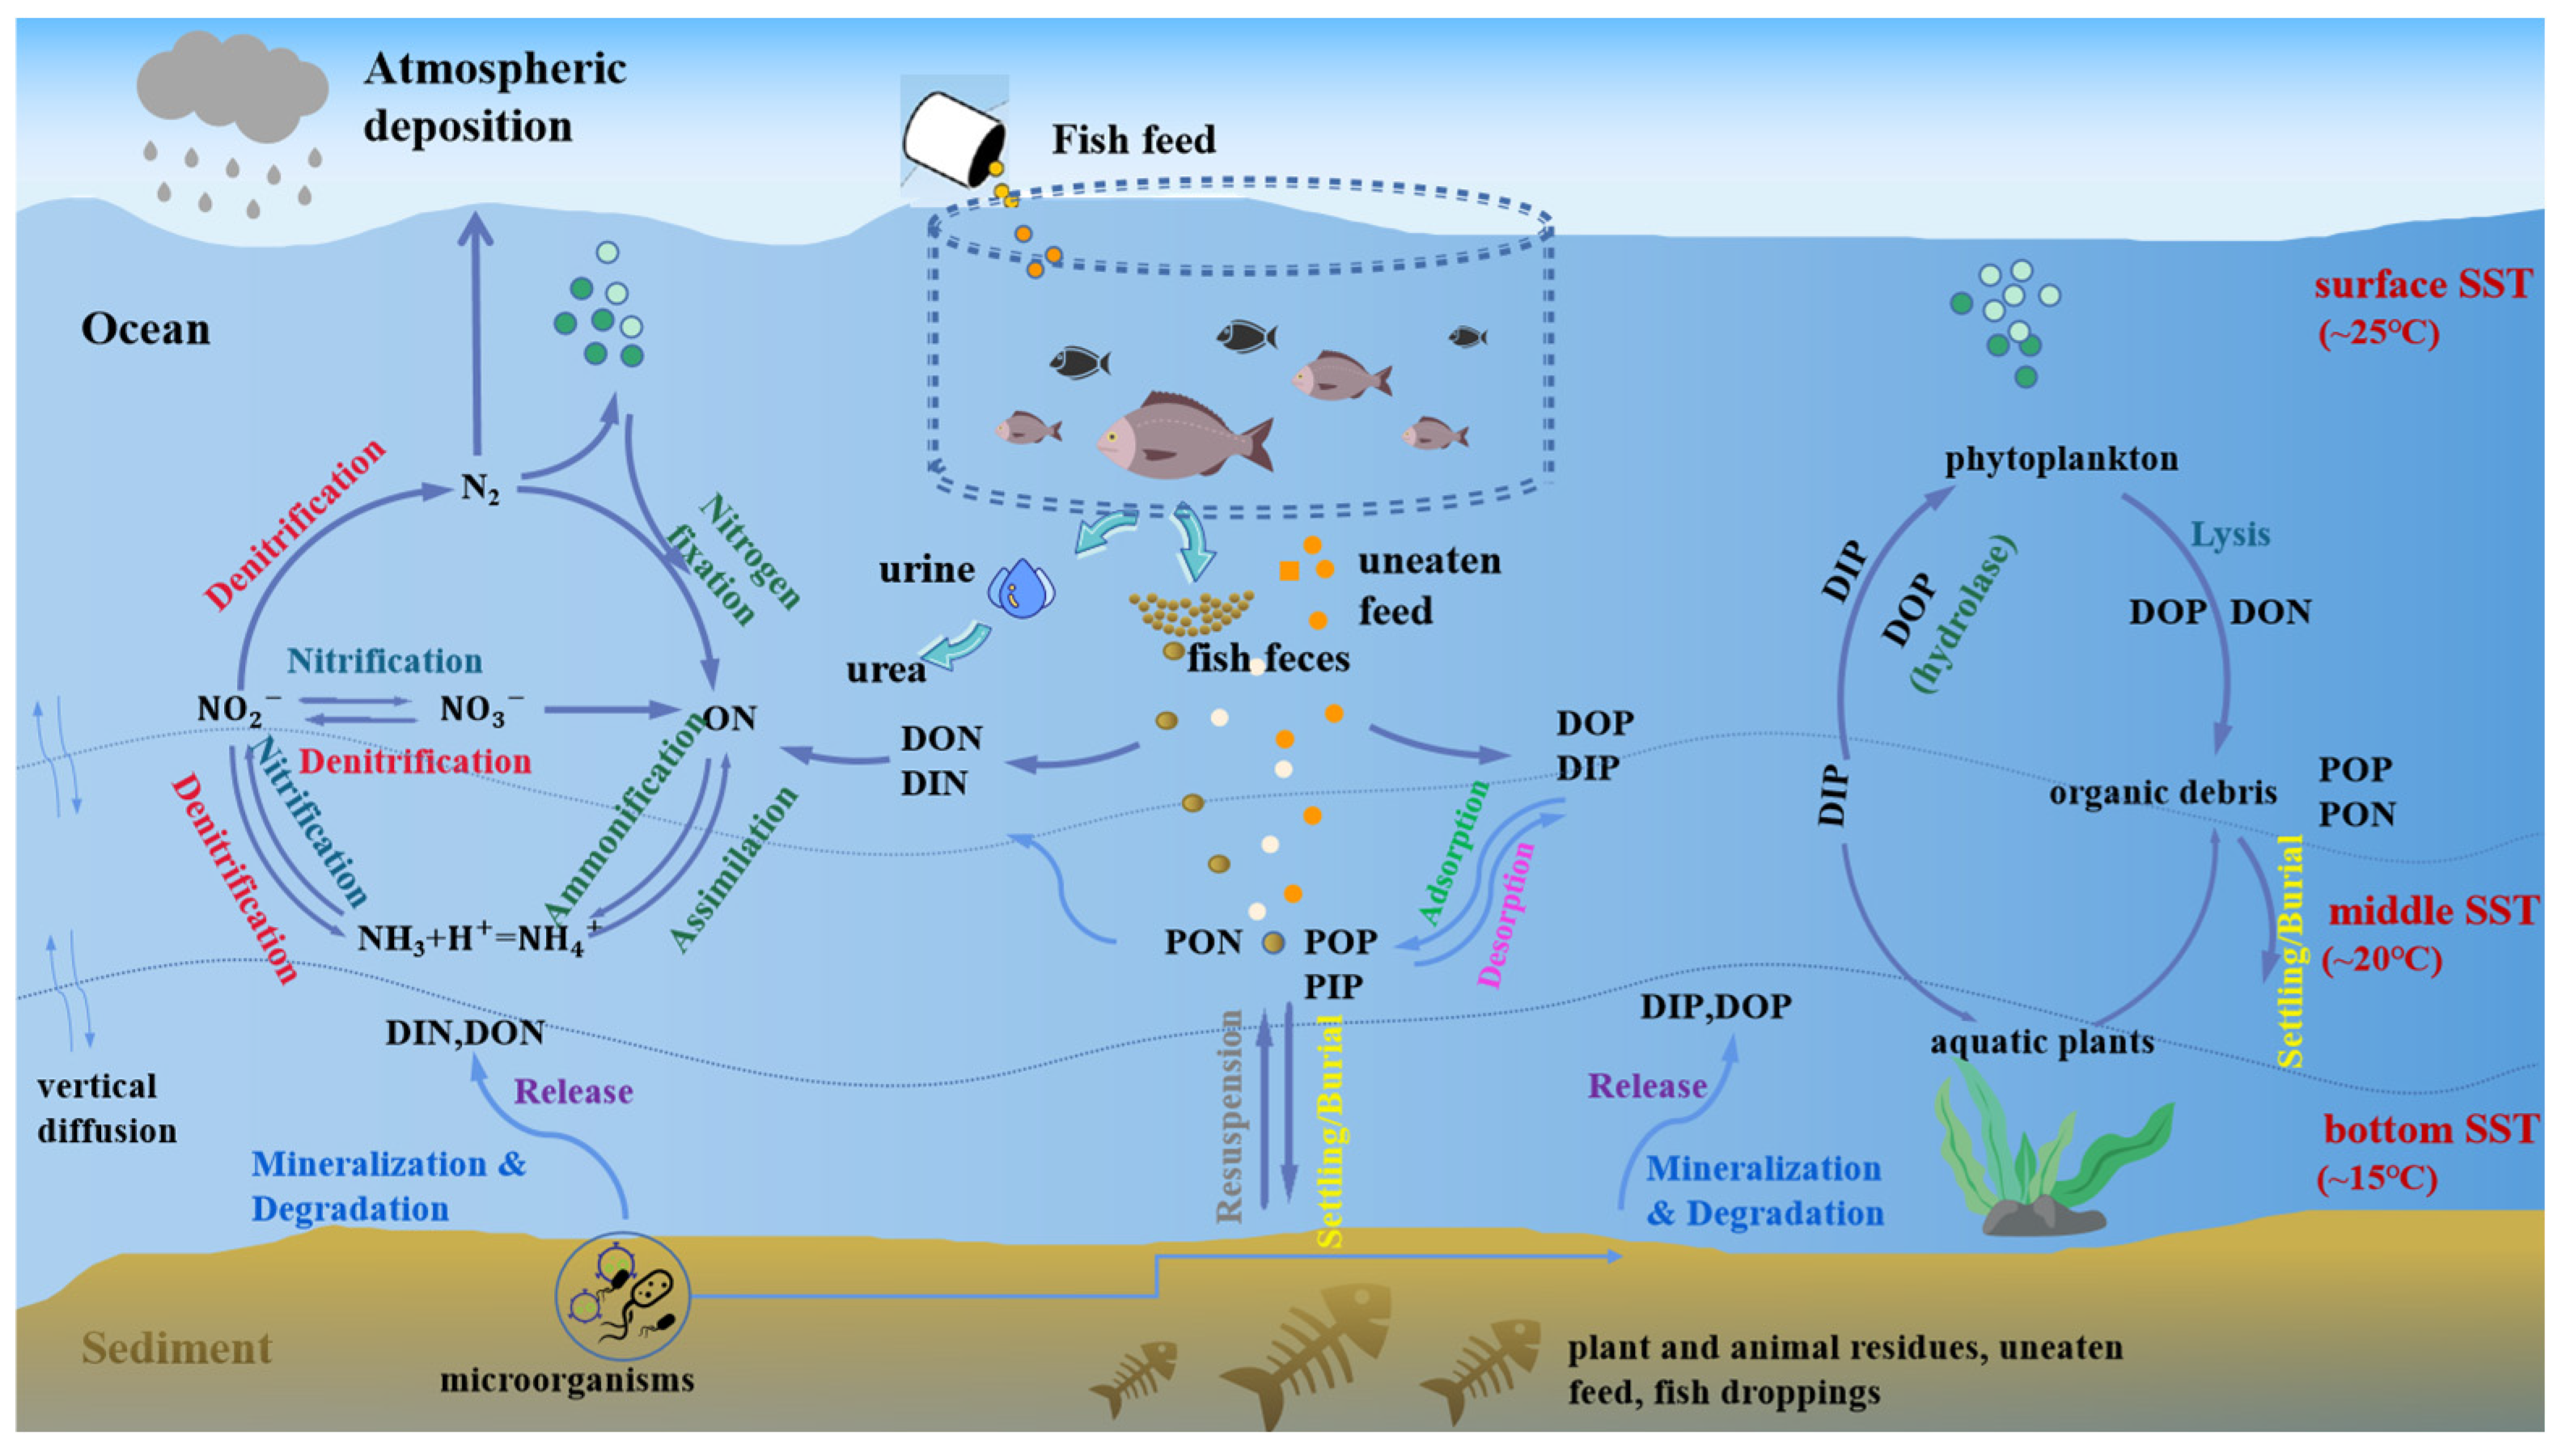
As shown in Figure 7, atmospheric nitrogen deposition, primarily via precipitation, is a critical nitrogen source for aquatic ecosystems. This process initiates the nitrogen cycle and elevates seawater nitrogen concentrations, potentially exacerbating eutrophication [43]. In aquaculture practices, residual feed and fish excreta constitute significant sources of both nitrogen and phosphorus [44]. Nitrogen from these residues mainly exists in the forms of ammonia (NH3) and urea. Through microbial nitrification, ammonia is converted into ammonium (NH4+), which is subsequently oxidized to nitrite (NO2) and nitrate (NO3). Under anoxic conditions, denitrifying bacteria convert nitrates back into nitrogen gas (N2), thereby completing the nitrogen cycle [45]. The balance of nitrogen in marine environments is primarily regulated by biological nitrogen fixation and denitrification processes [46]. In contrast, the phosphorus cycle plays a fundamental role in stabilizing the marine nitrogen cycle [47]. Phosphorus is essential for the growth, development, and reproduction of aquatic organisms, and its absence would significantly constrain biological productivity [48].
Due to its strong tendency to adsorb to particles, phosphorus is predominantly associated with suspended particulate matter and sediments [49], primarily in the form of particulate phosphorus (including particulate organic phosphorus (POP) and particulate inorganic phosphorus (PIP)). In addition to these forms, phosphorus also exists in aquatic systems as dissolved species, including dissolved inorganic phosphorus (DIP) and dissolved organic phosphorus (DOP). Phosphorus derived from aquaculture residues or other inputs may either settle into bottom sediments or be resuspended into the water column. Once deposited in sediments, phosphorus can be remineralized into its dissolved forms (e.g., DIP and DOP), thereby re-entering the aquatic phosphorus cycle [50]. Additionally, particulate phosphorus can be transformed into dissolved phosphorus through adsorption–desorption processes, enhancing its bioavailability for uptake by aquatic primary producers (Figure 7).
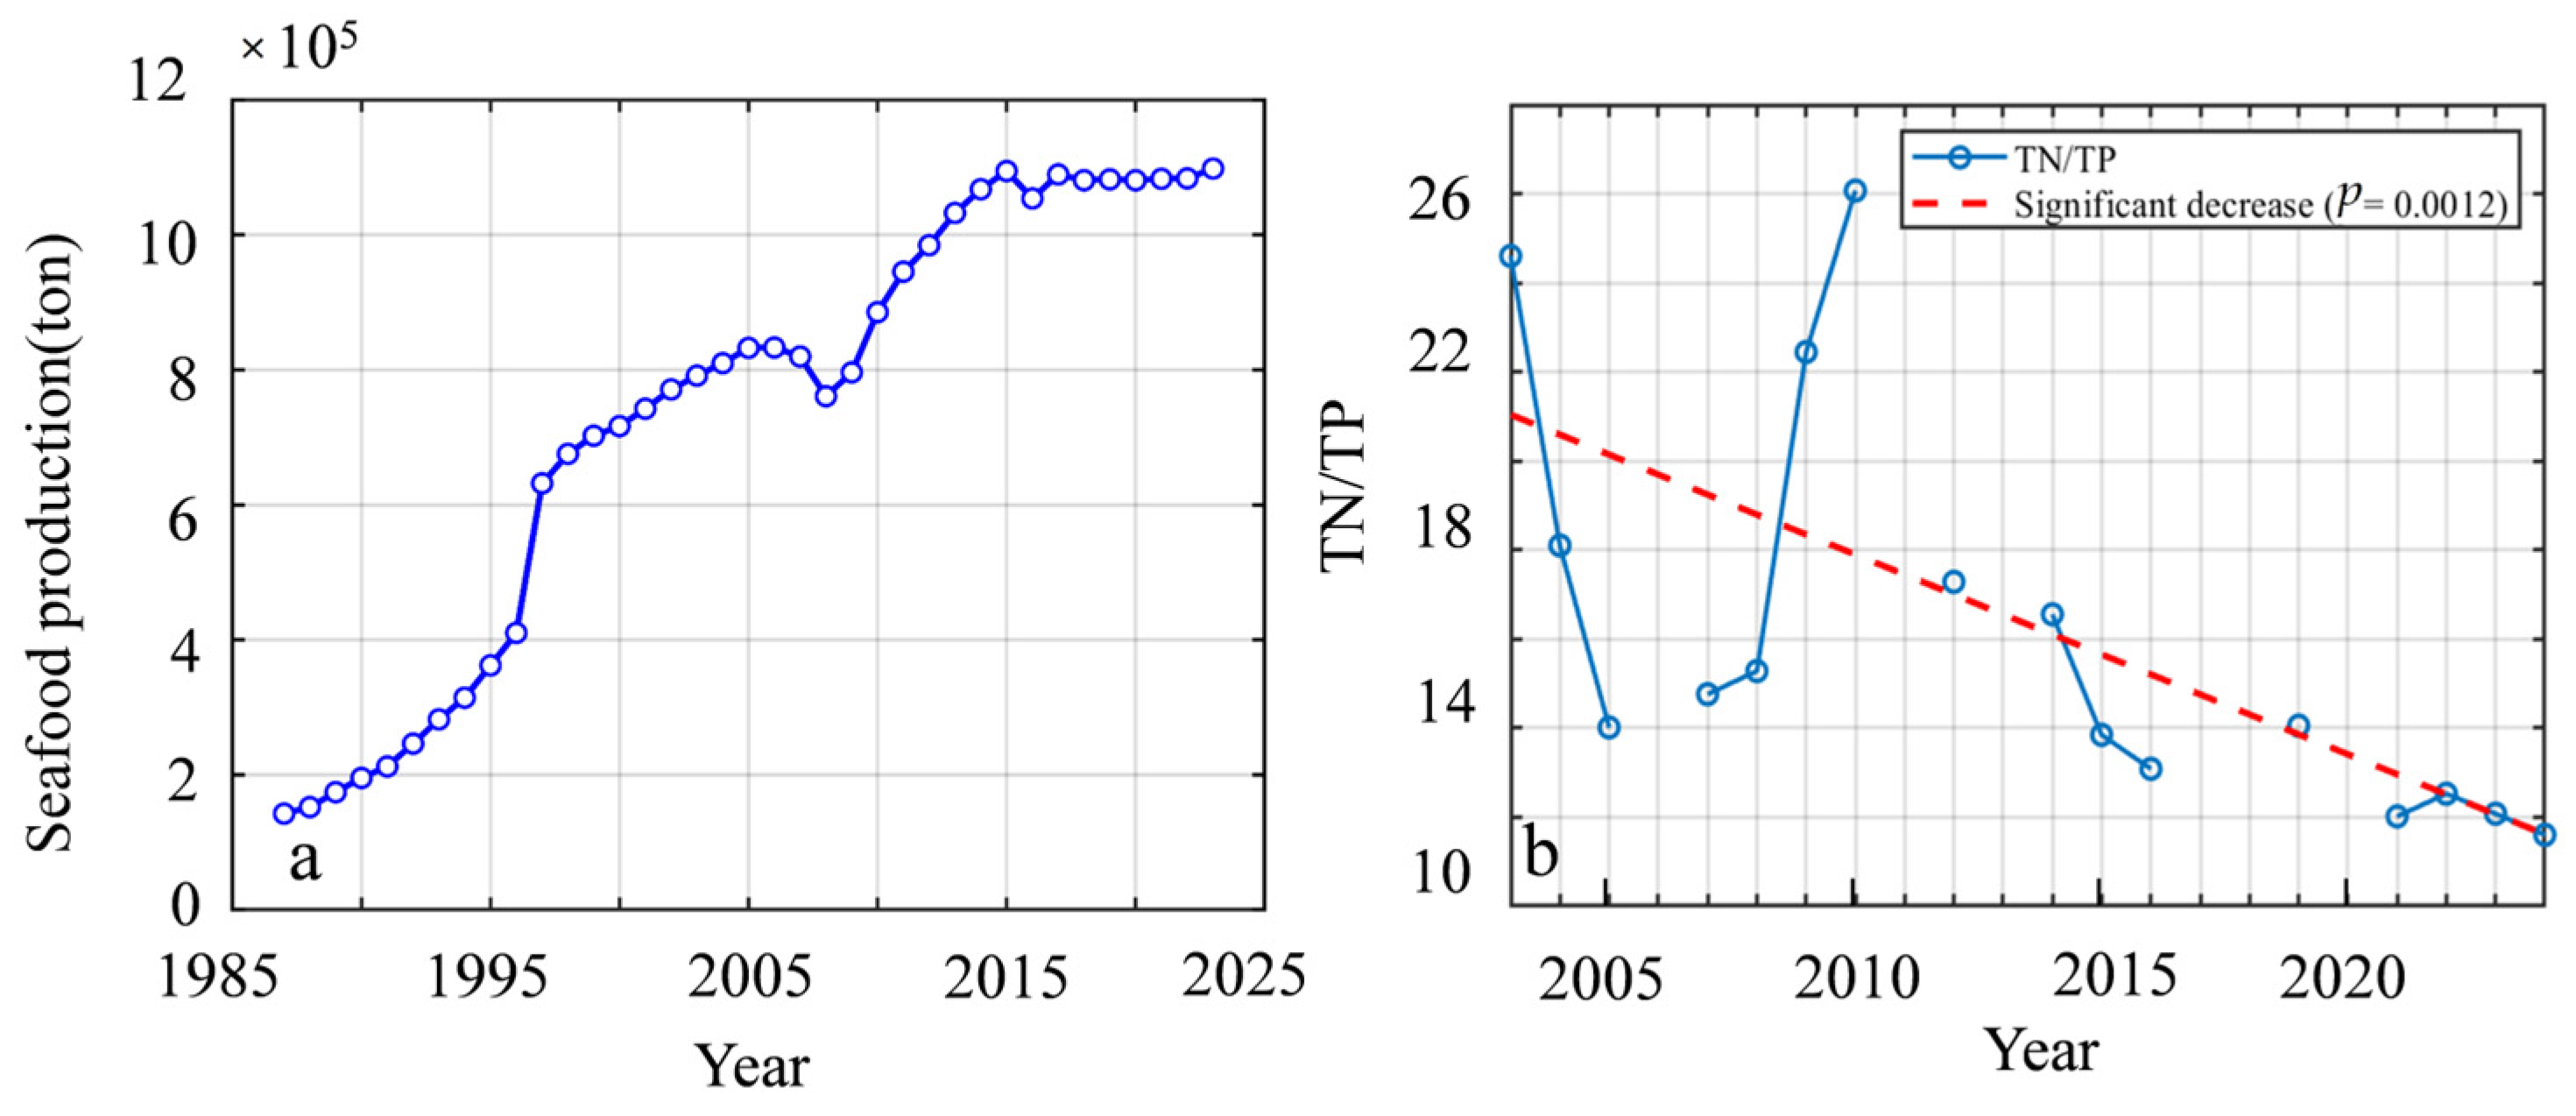
After 2013, a significant positive accumulation of TN and TP was observed, whereas the NP ratio showed a marked decline, indicating that the rate of TP increase exceeded that of TN (Figure 8). Concurrently, SST exhibited a consistent upward trend post-2013 (Figure 1c,d), which may have contributed to the elevated TP levels. Rising water temperatures can enhance microbial activity, promoting the decomposition and release of organic phosphorus, thereby intensifying the risk of phosphorus pollution.
Sustained warming since 2013 may have facilitated the mobilization of sediment-bound phosphorus, with diffusion processes subsequently increasing TP concentrations in surface waters. Furthermore, anthropogenic activities such as aquaculture, particularly feed input, can contribute additional phosphorus. Unlike nitrogen, which can be removed from aquatic systems through microbial nitrification–denitrification processes and lost to the atmosphere as gaseous products, phosphorus tends to persist and accumulate within the aquatic environment.
However, the analysis presented in Table 3 contradicts this expectation, revealing a negative correlation between SST and TP of surface-water, which indicates that surface water TP concentrations are controlled by the complex interplay of biogeochemical and physical processes: (1) Elevated water temperatures stimulate phytoplankton growth, accelerating the uptake of dissolved phosphorus and reduces TP concentrations in surface waters through ecological stoichiometric adjustments [51]; (2) Increased temperatures enhance water column stratification by strengthening vertical density gradients [52], thereby limiting the upward flux of phosphorus from deeper layers. As a result, even if sedimentary phosphorus is released under warming conditions, restricted vertical mixing and intensified biological uptake may lead to an overall decline in surface TP concentrations.
Interestingly, our findings reveal a 65.2% increase in surface TP levels—opposite to the decline predicted under temperature-driven mechanisms. This discrepancy strongly indicates that anthropogenic influences, particularly nutrient inputs from aquaculture activities [53,54], have overridden natural regulatory processes and are the primary drivers of TP accumulation, rather than SST increases alone.
According to statistics (Figure 8a), seafood production in Yangjiang City increased dramatically from 1.7 × 10⁵ tons in 1987 to nearly 12 × 105 tons in 2023—an approximate sevenfold increase. The growth rate of seafood during 2010–2015 was significantly higher than that of the previous decade. Correspondingly, TP concentrations in the study area showed a marked increase: prior to 2013, the mean TP level was only 0.0135 mg/L, whereas after 2013, it nearly doubled to 0.0223 mg/L. Given that feed input is directly proportional to aquaculture yield, the volume of feed used has also risen significantly during this period. Since 2015, feed input has stabilized at levels much higher than those before 2013. As marine aquaculture feed is the primary source of TP in the region, this strongly suggests that anthropogenic phosphorus inputs are a major contributor to elevated TP concentrations in coastal waters. Simultaneously, these inputs are likely a key anthropogenic driver of the observed decline in the NP ratio.
Similarly, the analysis in Table 3 indicates that rising temperatures have also contributed to a reduction in TN. The main reason for this is that “Intensified denitrification and nitrogen cycle closure”. Elevated temperatures significantly enhance denitrification processes [55], promoting the conversion of NO3 to N2. Under hypoxic conditions within the 15–25 °C range, denitrification rates increase linearly, leading to a substantial depletion of dissolved inorganic nitrogen (DIN) [56].
These coupled processes collectively explain the observed attenuation in TN accumulation after 2013. The temperature–nitrification–denitrification feedback mechanism thus emerges as a critical biogeochemical regulator of nitrogen availability in mariculture ecosystems. Consequently, accelerated denitrification under warming conditions also helps explain the faster rate of TP accumulation relative to TN.
Furthermore, in addition to nutrient concentration variations driven by hydrodynamic conditions and temperature changes, sediment-related environmental factors and bioturbation also play important roles in shaping the distribution and transport mechanisms of nitrogen and phosphorus. These processes affect nutrient cycling by altering the rates of nutrient release, transformation, and retention within aquatic systems.

5. Discussion

Utilizing optical remote sensing imagery, we observed a marked decline in the NP ratio in the marine ranching zones of the NSCS. Following the rapid expansion of aquaculture in 2013, the NP ratio fell from >16 to <16, indicating a transition from P limitation to N limitation conditions. This trend is expected to continue, as projections based on the trajectory in Figure 8b suggest a sustained decline in NP in surface waters. Similar observations were reported by Wang et al. [22] in Zhelin Bay, eastern Guangdong, where a declining NP ratio followed the establishment of marine ranching. Although they noted positive ecological outcomes, such as habitat restoration and enhanced fishery resources, the underlying biogeochemical mechanisms driving the NP shift were not thoroughly explored.
In contrast, our findings suggest that this shift is primarily driven by a disproportionate rise in TP concentrations (largely resulting from phosphorus-rich artificial feed inputs) and a slower increase in TN, which is significantly influenced by warming SST. Indeed, SST in the region has risen by approximately 1.16 °C since 2013, and is projected to increase by 4 °C by the end of the century [57]. In such a warmer marine environment, shifts in phytoplankton and microbial community structure, biogeochemical cycling rates, and nutrient interactions are expected. These ecological responses to nutrient regime changes increase the likelihood of HABs, underscoring the urgency of nutrient management. Pan et al. [58] discovered that accelerated sea surface warming in the southern Yellow Sea led to the large-scale bloom of Ulva prolifera in northern Jiangsu in 2007.
To mitigate these ecological risks, we emphasize the development of intelligent control systems for precision feeding, based on real-time water quality monitoring. Such systems allow dynamic adjustments to feed composition and timing, improving feed conversion efficiency and minimizing nutrient waste [59]. This approach can substantially reduce anthropogenic nutrient loading and enhance the sustainability of aquaculture operations.
By integrating satellite observations with ecosystem models, this framework enables robust assessment of nutrient evolution under varying climatic and anthropogenic pressures. Beyond the study area, it is transferable to other regions and ecosystems worldwide [60,61], highlighting the global potential of satellite-based approaches for sustainable ecosystem management. Beyond global warming and phosphorus inputs from anthropogenic feed, other human activities also influence nutrient dynamics. Our previous studies [62,63] revealed that land-based human disturbances, such as sand mining, dredging, coastal development, and riverine inputs, exert significant impacts on coastal water quality in the PRE. Rainfall and runoff can transport pollutants from urban centers into marine ranching areas, causing additional variability in nitrogen and phosphorus availability. These broader anthropogenic pressures must be factored into regional nutrient management frameworks.
A recent study published in Nature Geoscience has revealed a paradigm shift in marine ecological stoichiometry, characterized by a distinct transition in phytoplankton NP ratio. While these ratios increased markedly during the late 20th century, a reversal trend emerged around 2007, showing a gradual decline [19]. Our investigations in the NCSC marine ranching systems since 2013 have corroborated this pattern, with observed decreases in the NP ratio primarily driven by enhanced anthropogenic phosphorus inputs from agricultural runoff, municipal wastewater, and industrial effluents—factors that have partially alleviated regional P limitation.
Concurrently, analysis of C:P ratio dynamics has revealed significant enrichment of the surface ocean carbon sink, highlighting the influence of NP eutrophication on inorganic carbon source–sink processes. Zhang [20] further elucidated regulatory mechanisms, showing that phosphate predominantly controls inorganic carbon fluxes: elevated phosphorus suppresses algal growth, whereas under P-limited conditions, it alters the balance between carbon fixation and decomposition. These findings call for a shift beyond the conventional Redfield ratio. Empirical and modeling studies demonstrate widespread deviations from 106C:16N:1P. For example, Ayata et al. [64] showed that quota-based phytoplankton models with flexible stoichiometry improve performance under oligotrophic conditions. Kwiatkowski et al. [65] found that variable C:N:P in global models enhances carbon export efficiency and alters food quality. Moreno & Martiny [66] reviewed mechanisms driving Redfield deviations across taxa and regions, emphasizing the importance of incorporating stoichiometric flexibility into ecosystem modeling. Building on these insights, we propose comprehensive C:N:P models integrating multi-parameter observational data to optimize marine ranching ecosystems by simultaneously achieving three critical objectives: maintaining optimal water quality, sustaining phytoplankton productivity, and maximizing carbon sequestration potential, thus supporting effective marine resource management and climate change mitigation.
This study has limitations that could be addressed in future work. A key limitation of this study is the lack of long-term, continuous in situ observations, which constrains comprehensive evaluation of the temporal and spatial variability in nutrient dynamics. Additionally, considering the availability and quality of sampling data in the study area, we relied on a single cloud-free or nearly cloud-free satellite image from November of each year for analysis. Although this approach has precedent in previous studies [67], it limits the assessment of seasonal variability. In future work, we plan to integrate multiple data sources and publicly available datasets, using a larger set of images across all seasons, which may reveal additional insights into seasonal and interannual changes in nutrient dynamics. Future research should prioritize expanding seasonal and spatial coverage to refine inversion models and enhance nutrient assessment accuracy. Moreover, this study focused exclusively on surface nutrient concentrations. Considering the complex vertical stratification and mixing processes in aquatic environments, future efforts should integrate three-dimensional (3D) hydrodynamic models to better characterize vertical nutrient distribution and transport, thereby supporting the development of early-warning systems for HABs. Additionally, incorporating investigations on carbon and nitrogen–phosphorus stoichiometry is essential to elucidate how changes in the NP ratio affect marine carbon sequestration, thereby contributing systematically to global change research. Furthermore, as research scope extends to more regions (including those frequently obscured by cloud cover) there is an urgent need to develop region-specific image reconstruction and gap-filling algorithms building upon existing cloud-removal and data-reconstruction techniques.

6. Conclusions

This study presents a comprehensive assessment of long-term nutrient dynamics in the NSCS, a region that hosts the world’s largest marine ranching cluster and plays a pivotal role in China’s “Blue Granary” initiative. Using Yangjiang as a case study, we investigated changes in the marine environment, particularly TN and TP, before and after the expansion of offshore aquaculture in 2013. Robust retrieval algorithms for TN and TP were developed by integrating multi-sensor satellite remote sensing data (Landsat and Sentinel-2, spanning 2002–2024) with in situ observations, achieving high accuracy (TN: R2 = 0.82, RMSE = 0.09 mg/L; TP: R2 = 0.94, RMSE = 0.0071 mg/L, n = 63).
PDF and CDF analyses were used to examine nutrient regime shifts, complemented by a mechanistic analysis of nitrogen and phosphorus biogeochemical processes. Our findings indicate that the slowed increase in TN is closely linked to rising SST, with a significant negative correlation (r = −0.6513, p < 0.1). In contrast, the sharp rise in TP concentrations is primarily attributed to anthropogenic inputs rather than natural processes. Statistical records show that seafood production in the region increased from 8.459 × 10⁵ to 10.814 × 10⁵ tons since 2013 (26.4% increase), corresponding with a notable rise in phosphorus load. During the same period, TP concentrations rose from 0.0135 mg/L to 0.0223 mg/L (65.2% increase), while TN showed a slower increase, from 0.2254 mg/L to 0.2849 mg/L. Consequently, the TN:TP ratio (NP) declined significantly by 31.3%, from 19.2 to 13.2. These findings reveal that rising SST (approximately 1.16 °C) and increased anthropogenic phosphorus inputs (approximately 27.84%) have synergistically driven a nutrient regime shift from P-limited to N-limited conditions in the NSCS marine ranching area.
The satellite-based nutrient retrieval framework established in this study provides a practical, scalable, and cost-effective approach for long-term and near-real-time monitoring of nutrient dynamics in coastal marine environments. These data offer essential insights for sustainable aquaculture management under increasing climatic and anthropogenic pressures. Importantly, they form the scientific basis for early-warning systems targeting HABs and support ecosystem-based management and climate adaptation strategies, particularly in the regulation of oceanic carbon sinks in high-nutrient waters. The findings underscore the pivotal role of satellite remote sensing in advancing sustainable marine resources governance. Future research with high-resolution seasonal monitoring of nitrogen, phosphorus, and carbon will enhance understanding of C:N stoichiometric dynamics over time, which may further clarify how nutrient stoichiometry regulates marine carbon sequestration, especially in marginal seas like the NSCS.

Author Contributions

Conceptualization, R.Z., N.C. and K.Y.; methodology, R.Z., N.C. and K.Y.; validation, N.C., K.Y. and Q.L.; formal analysis, H.L.; investigation, Q.L.; data curation, Q.L.; writing—original draft preparation, R.Z. and N.C.; writing—review and editing, R.Z., N.C., L.D. and H.L.; visualization, Q.L., L.D. and H.L. All authors have read and agreed to the published version of the manuscript.

Funding

This study was funded by the National Natural Science Foundation of China [Grant Number 52471274, 42206173] and the CCCC Academician Special Project [RP 2024044644].

Data Availability Statement

Landsat remote sensing imagery was downloaded from http://oceancolor.gsfc.nasa.gov (accessed on 1 March 2025), and Sentinel-2 imagery was downloaded from http://browser.dataspace.copernicus.eu (accessed on 1 March 2025).

Acknowledgments

This research was supported by the National Aeronautics and Space Administration (NASA) and European Space Agency (ESA) for providing data.

Conflicts of Interest

Author Nanyang Chu, Langsheng Dong, Qihang Li and Huapeng Liu were employed by the company CCCC Guangdong-Hong Kong-Macao Greater Bay Area Innovation Research Institute Ltd. The remaining authors declare that the research was conducted in the absence of any commercial or financial relationships that could be construed as a potential conflict of interest. The authors declare that this study received funding from the CCCC Academician Special Project [RP 2024044644]. The funder was not involved in the study design, collection, analysis, interpretation of data, the writing of this article or the decision to submit it for publication.

Appendix A

Figure A1. Pre-2013 spatial variability and mean concentrations of total nitrogen (TN) during November (Subfigure explanations are consistent with those in Figure 3. For clarity, the white box in Figure 3i is replaced with a red box in this subfigure (i)).
Jmse 13 01677 g0a1
Figure A2. Post-2013 spatial variability and mean concentrations of total nitrogen (TN) during November (Subfigure explanations are consistent with those in Figure 3. For clarity, the white box in Figure 3i is replaced with a red box in this subfigure (i)).
Jmse 13 01677 g0a2
Figure A3. Pre-2013 spatial variability and mean concentrations of total phosphorus (TP) during November (Subfigure explanations are consistent with those in Figure 3. For clarity, the white box in Figure 3i is replaced with a red box in this subfigure (i)).
Jmse 13 01677 g0a3
Figure A4. Post-2013 spatial variability and mean concentrations of total phosphorus (TP) during November (Subfigure explanations are consistent with those in Figure 3. For clarity, the white box in Figure 3i is replaced with a red box in this subfigure (i)).
Jmse 13 01677 g0a4

References

  1. Lin, M. Developing Large-Scale Deep Sea Aquaculture: Problems, Modes and Realization Ways. J. Manag. World 2022, 12, 39–60. [Google Scholar]
  2. Li, J. Marine Resource Economy and Marine Strategy under the Background of Marine Ecological Civilization Construction (Part 1). Ocean World 2022, 9, 58–67. [Google Scholar]
  3. Wang, X.; Zhang, M. China’s Marine Ranching Construction: Strategic Implications, Risks and Challenges, and Development Paths. Pac. J. 2024, 32, 67–80. [Google Scholar]
  4. Chen, Y. Research and construction of modern marine ranching in China: A review. J. Dalian Fish. Univ. 2020, 35, 147–154. [Google Scholar]
  5. Yang, H.; Ding, D. Marine Ranching Version 3.0: History, Status and Prospects. Bull. Chin. Acad. Sci. 2022, 6, 832–839. [Google Scholar]
  6. Zhou, W.; Jia, Z. Research on the Impact of the Construction of National Marine Ranching Demonstration Zones on the Resilience of Ecological Environment in Coastal Areas. Chin. Fish. Econ. 2025, 43, 27–41. [Google Scholar]
  7. Jiao, M.; Yue, W.; Suo, A.; Zhang, L.; Li, H.; Xu, P.; Ding, D. Construction and influencing factors of an early warning system for marine ranching ecological security: Experience from China’s coastal areas. J. Environ. Manag. 2023, 335, 117515. [Google Scholar] [CrossRef]
  8. He, W.; Ding, J.; Liu, W.; Zhong, W.; Zhu, L.; Zhu, L.; Feng, J. Occurrence, Bioaccumulation and Trophic Transfer of Organophosphate Esters in Marine Food Webs: Evidence from Three Bays in Bohai Sea, China. Sci. Total Environ. 2022, 828, 160658. [Google Scholar] [CrossRef] [PubMed]
  9. Sahu, B.; Pradhan, U.K.; Udayakrishnan, P.B.; Bambaras, P. Dissolved and suspended nutrient complexity in an urbanized creek-estuary confluence: Implication on water quality alteration. Mar. Pollut. Bull. 2024, 209 Pt B, 117259. [Google Scholar] [CrossRef]
  10. Yao, K.; Rui, Y.; Yang, W.; Feng, C.; Liu, Z. Distribution Characteristics of Nutrients and Eutrophication Assessment in Yueqing Bay. Ocean. Dev. Manag. 2024, 9, 121–132. [Google Scholar]
  11. Zhang, P.; Chen, Y.; Peng, C.; Dai, P.; Lai, J.; Zhao, L.; Zhang, J. Spatiotemporal Variation, Composition of DIN and Its Contribution to Eutrophication in Coastal Waters Adjacent to Hainan Island, China. Reg. Stud. Mar. Sci. 2020, 37, 101332. [Google Scholar] [CrossRef]
  12. Sala, B.; Giménez, J.; Fernández-Arribas, J.; Bravo, C.; Lloret-Lloret, E.; Esteban, A.; Bellido, J.M.; Coll, M.; Eljarrat, E. Organophosphate Ester Plasticizers in Edible Fish from the Mediterranean Sea: Marine Pollution and Human Exposure. Environ. Pollut. 2021, 277, 118377. [Google Scholar] [CrossRef] [PubMed]
  13. Olivero-Verbel, R.; Eljarrat, E.; Johnson-Restrepo, B. Organophosphate Ester Flame Retardants in Sediments and Marine Fish Species in Colombia: Occurrence, Distribution, and Implications for Human Risk Assessment. Mar. Pollut. Bull. 2025, 213, 117654. [Google Scholar] [CrossRef] [PubMed]
  14. Department of Natural Resources of Guangdong Province. Guangdong Marine Economy Development Report; Department of Natural Resources of Guangdong Province: Guangzhou, China, 2025. Available online: https://nr.gd.gov.cn (accessed on 15 July 2025).
  15. Wang, X.; Li, C.; Yi, N.; Zhang, H.; Liu, J.; Wang, X.; Liu, X. Investigation and Analysis of Water Quality and Environment of Shellfish Culture Area of Laizhou Bay, Shandong Province. J. Fish. Res. 2024, 3, 286–295. [Google Scholar]
  16. Redfield, A.C. The Influence of Organisms on the Composition of Seawater. In The Sea; Hill, M.N., Ed.; Interscience: New York, NY, USA, 1963; Volume 2, pp. 26–77. [Google Scholar]
  17. Xu, S.; Qi, Z.; Song, R.; Liu, Y.; Hu, T.; Huang, H. Influence of Mariculture on Tempo-Spatial Distribution of Nitrogen and Phosphorus in Subtropical Zone: A Case Study of Shen’ao Bay. South China Fish. Sci. 2019, 4, 29–38. [Google Scholar]
  18. Zhao, Y.; Sun, B.; Ma, Y.; Guo, W.; Xu, H.; Li, J.; Duan, X.; Sun, S. Characteristics of Nutrient Structures and Limitation of Coastal Aquaculture Area in Shandong Province, 2018. Mar. Environ. Sci. 2022, 5, 714–722, 730. [Google Scholar]
  19. Liu, J.; Wang, H.; Mou, J.; Peñuelas, J.; Delgado-Baquerizo, M.; Martiny, A.C.; Zhou, G.; Hutchins, D.A.; Inomura, K.; Lomas, M.W.; et al. Global-Scale Shifts in Marine Ecological Stoichiometry over the Past 50 Years. Nat. Geosci. 2025, 18, 769–778. [Google Scholar] [CrossRef]
  20. Zhang, N. Influence of External Source Nitrogen and Phosphate on Inorganic Carbon Source/Sink. Ph.D. Thesis, Institute of Oceanology, Chinese Academy of Sciences, Qingdao, China, 2008. [Google Scholar]
  21. Lin, Z.; Chen, H.; Liang, J. Temporal and Spatial Evolution Characteristics and Cause Analysis of Ratios of Nitrogen and Phosphorus in Offshore Waters of Guangdong Province. Guangdong Chem. Ind. 2022, 49, 141–144. [Google Scholar]
  22. Wang, Y.; Yu, J.; Chen, P. Remote Sensing Assessment of Ecological Effects of Marine Ranching in the Eastern Guangdong Waters, China. J. Geosci. Environ. Prot. 2018, 6, 101–113. [Google Scholar] [CrossRef]
  23. Wei, W.; Han, Y.; Zhou, Y. Nutrients and Sea Surface Temperature Drive Harmful Algal Blooms in China’s Coastal Waters over the Past Decades. Environ. Res. Lett. 2023, 18, 094068. [Google Scholar] [CrossRef]
  24. Chen, S.; Shi, L.; Liu, X.; Liu, R.; Yu, J. Evaluation on Sediment Pollution and Potential Ecological Risks in the Intertidal Zone of Typical Bays in Zhejiang Province. China Environ. Sci. 2020, 40, 1771–1781. [Google Scholar]
  25. Cai, W.J.; Hu, X.; Huang, W.J.; Murrell, M.C.; Lehrter, J.C.; Lohrenz, S.E.; Chou, W.C.; Zhai, W.; Hollibaugh, J.T.; Wang, Y.; et al. Acidification of Subsurface Coastal Waters Enhanced by Eutrophication. Nat. Geosci. 2011, 4, 766–770. [Google Scholar] [CrossRef]
  26. Johansson, D.; Juell, J.-E.; Oppedal, F.; Stiansen, J.E.; Ruohonen, K. The Influence of the Pycnocline and Cage Resistance on Current Flow, Oxygen Flux and Swimming Behaviour of Atlantic Salmon (Salmo salar L.) in Production Cages. Aquaculture 2007, 265, 271–287. [Google Scholar] [CrossRef]
  27. Chukwuka, A.V. First Report of Fishkill Incidence in Bonny-Andoni Coastal Area, Nigeria. Croat. J. Fish. 2023, 81, 83–91. [Google Scholar] [CrossRef]
  28. Wang, J.; Beusen, A.H.W.; Liu, X.; van Dingenen, R.; Dentener, F.; Yao, Q.; Xu, B.; Ran, X.; Yu, Z.; Bouwman, A.F. Spatially Explicit Inventory of Sources of Nitrogen Inputs to the Yellow Sea, East China Sea, and South China Sea for the Period 1970–2010. Earth’s Future 2020, 8, e2020EF001516. [Google Scholar] [CrossRef]
  29. Ma, F.; Li, K.; Zhang, Q.; Bu, Y.; Hou, Q. Analysis on the Occurrences and Evolution Mechanism of HABs in Dapeng Bay, Shenzhen in the Last 40 Years. In Proceedings of the 2020 Annual Science and Technology Conference of Guangdong Provincial Environmental Science Society, Guangzhou, China, 20 September 2020. [Google Scholar]
  30. Yan, L. Water Quality Monitoring in Environmental Engineering: Significance and Process Analysis. Clean. World 2025, 41, 142–144. [Google Scholar]
  31. Hu, F. Analysis of the Role and Application Strategies of Remote Sensing Technology in Water Environment Monitoring. Wisdom China 2025, 4, 110–111. [Google Scholar]
  32. Li, T.; Zhu, C.; Li, J.; Chen, S.; Xie, X.; Liu, Y. Water Quality Assessment for Hailing Bay Estuary, China. South China Fish. Sci. 2018, 14, 49–57. [Google Scholar]
  33. Qiu, Y.; Zhu, L.; Xu, M.; Chen, X. Characterization of Aquatic Environmental Factors in Hailing Bay. J. Ocean Sci. 2006, 30, 5. [Google Scholar]
  34. Lai, L.; Zhang, Y.; Jiang, Y.; Liu, Z. Research Progress on Remote Sensing Monitoring of Phytoplankton in Eutrophic Water. J. Lake Sci. 2021, 33, 1299–1314. [Google Scholar] [CrossRef]
  35. Torres, J.; Ramos-Scharron, C.; Hernandez, W.; Armstrong, R.; Barreto, M.; Ortiz-Zayas, J.; Guild, L.; Viqueira, R. River Streamflow, Remotely Sensed Water Quality, and Benthic Composition of Previously Undescribed Nearshore Coral Reefs in Northern Puerto Rico. Front. Mar. Sci. 2021, 8, 698323. [Google Scholar] [CrossRef]
  36. Zou, Z.K.; Yu, L.; Zhang, Y.; Wang, W.; Zhao, Y.; Sun, J.; Cheng, Q. Inversion of water quality parameters in Jianghan Plain based on Sentinel-2 L1C image. J. Changjiang River Sci. Res. Inst. 2023, 40, 181–187+194. [Google Scholar]
  37. Zhao, L.; Lu, X.; Tan, H.; Ma, T. Water quality monitoring technology based on GF-1 satellite and XGBoost model. Remote Sens. Inf. 2021, 36, 96–103. [Google Scholar]
  38. Yu, Y.; Ding, P.; Bian, H.; Wei, J.; Zhang, H. Water quality parameters inversion based on multispectral remote sensing. J. Water Process Eng. 2025, 73, 107707. [Google Scholar] [CrossRef]
  39. Liu, J.; Wang, H. The development and countermeasures of the Golden Pompano industry in Guangdong province. J. Guangdong Canye 2023, 57, 107–110. [Google Scholar]
  40. Qiu, B. Study on the Difference of Spectral and Urban Green Land Biomass Estimation Based on Landsat OLI and ETM+ Images. Master’s Thesis, Zhejiang Agriculture & Forestry University, Hangzhou, China, 2017. [Google Scholar]
  41. Wachmann, A.; Starko, S.; Neufeld, C.J.; Costa, M. Validating Landsat Analysis Ready Data for Nearshore Sea Surface Temperature Monitoring in the Northeast Pacific. Remote Sens. 2024, 16, 920. [Google Scholar] [CrossRef]
  42. Yang, H.; Kong, J.; Hu, H.; Du, Y.; Gao, M.; Chen, F. A Review of Remote Sensing for Water Quality Retrieval: Progress and Challenges. Remote Sens. 2022, 14, 1770. [Google Scholar] [CrossRef]
  43. Moline, J.; Harichaux, P.; Baudouin, J.; Lavandier, M.; Bretaudeau, J. Atmospheric Nitrogen Deposition Has Caused Nitrogen Enrichment and Eutrophication of Lakes in the Northern Hemisphere. C. R. Soc. Biol. 2010, 162, 964. [Google Scholar]
  44. Herbeck, L.S.; Unger, D.; Wu, Y.; Jennerjahn, T.C. Effluent, Nutrient and Organic Matter Export from Shrimp and Fish Ponds Causing Eutrophication in Coastal and Back-Reef Waters of NE Hainan, Tropical China. Cont. Shelf Res. 2013, 57, 92–104. [Google Scholar] [CrossRef]
  45. Wu, R. Migration and Transformation Process and Driving Mechanism of Nitrogen and Phosphorus in Lake Daihai at Sediment–Water Interface. Master’s Thesis, Inner Mongolia Agricultural University, Hohhot, China, 2024. [Google Scholar]
  46. Howarth, R.W.; Marino, R. Nitrogen as the limiting nutrient for eutrophication in coastal marine ecosystems: Evolving views over three decades. Limnol. Oceanogr. 2006, 51, 364–376. [Google Scholar] [CrossRef]
  47. Gruber, N.; Galloway, J.N. An Earth-system perspective of the global nitrogen cycle. Nature 2008, 451, 293–296. [Google Scholar] [CrossRef]
  48. Elser, J.J. Phosphorus: A limiting nutrient for humanity? Curr. Opin. Biotechnol. 2012, 23, 833–838. [Google Scholar] [CrossRef]
  49. Liu, C.; Du, Y.; Li, Y.; Wang, Y.; Xu, M.; Zhang, Y.; Gu, X. Exchanges of nitrogen and phosphorus across the sediment–water interface influenced by the external suspended particulate matter and the residual matter after dredging. Environ. Pollut. 2019, 246, 207–216. [Google Scholar] [CrossRef]
  50. Paytan, A.; McLaughlin, K. The Oceanic Phosphorus Cycle. Chem. Rev. 2007, 107, 563–576. [Google Scholar] [CrossRef]
  51. Ho, J.C.; Michalak, A.M.; Pahlevan, N. Widespread Global Increase in Intense Lake Phytoplankton Blooms since the 1980s. Nature 2019, 574, 667–670. [Google Scholar] [CrossRef] [PubMed]
  52. Yao, Y.; Wang, C. Variations in Summer Marine Heatwaves in the South China Sea. J. Geophys. Res. Oceans 2021, 126, e2021JC017792. [Google Scholar] [CrossRef]
  53. Yuan, H.; Wang, H.; Dong, A.; Zhou, Y.; Huang, R.; Yin, H.; Zhang, L.; Liu, E.; Li, Q.; Jia, B.; et al. Tracing the Sources of Phosphorus in Lake at Watershed Scale Using Phosphate Oxygen Isotope (δ18OP). Chemosphere 2022, 305, 135382. [Google Scholar] [CrossRef] [PubMed]
  54. Liu, D.; Li, X.; Zhang, Y.; Qiao, Q.; Bai, L. Using a Multi-Isotope Approach and Isotope Mixing Models to Trace and Quantify Phosphorus Sources in the Tuojiang River, Southwest China. Environ. Sci. Technol. 2023, 57, 7328–7335. [Google Scholar] [CrossRef]
  55. Tan, E.; Zou, W.; Zheng, Z.; Yan, X.; Kao, S.J. Warming Stimulates Sediment Denitrification at the Expense of Anaerobic Ammonium Oxidation. Nat. Clim. Chang. 2020, 10, 349–355. [Google Scholar] [CrossRef]
  56. Hamilton, B.S.K. Have we overemphasized the role of denitrification in aquatic ecosystems? A review of nitrate removal pathways. Front. Ecol. Environ. 2007, 5, 89–96. [Google Scholar]
  57. Kling, J.D.; Lee, M.D.; Fu, F.; Phan, M.D.; Wang, X.; Qu, P.; Hutchins, D.A. Transient Exposure to Novel High Temperatures Reshapes Coastal Phytoplankton Communities. Int. Soc. Microb. Ecol. 2020, 14, 413–424. [Google Scholar] [CrossRef]
  58. Pan, Y.; Li, P.; Sun, J.; Liu, S.; Xing, L.; Yu, D.; Feng, Q. Potential Impact of Sea Surface Temperature Variability on the 2007 Sudden Bloom of Ulva prolifera in the Southern Yellow Sea. Remote Sens. 2024, 16, 4407. [Google Scholar] [CrossRef]
  59. Saad, A.; Baikas, A.; Remen, M.; Bjørnson, F.O. Optimizing Feeding Strategies in Aquaculture Using Machine Learning: Ensuring Sustainable and Economically Viable Fish Farming Practices. Procedia Comput. Sci. 2024, 246, 4712–4721. [Google Scholar] [CrossRef]
  60. Romero-Puig, N.; Pardini, M.; Papathanassiou, K.P. Forest Change Analysis by means of Pol-InSAR Measurements at Land P-band. Remote Sens. 2024, 16, 358. [Google Scholar]
  61. Pardini, M.; Romero-Puig, N.; Guliaev, R.; Papathanassiou, K.P. Identification of Forest Structure Changes from L-Band SAR Data: A Tomographic Perspective. Remote Sens. 2024, 16, 1605. [Google Scholar]
  62. Zhang, R.; Ai, B.; Guan, G.F. Ecological Responses to the Coastal Exploitation of Urban Agglomerations along the Pearl River Estuary. Environ. Res. Lett. 2019, 14, 124058. [Google Scholar] [CrossRef]
  63. Ai, B.; Zhang, R.; Zhang, H.; Ma, C.; Gu, F. Dynamic Process and Artificial Mechanism of Coastline Change in the Pearl River Estuary. Reg. Stud. Mar. Sci. 2019, 30, 100715. [Google Scholar] [CrossRef]
  64. Ayata, S.D.; Lévy, M.; Aumont, O.; Sciandra, A.; Sainte-Marie, J.; Tagliabue, A.; Bernard, O. Phytoplankton growth formulation in marine ecosystem models: Should we take into account photo-acclimation and variable stoichiometry in oligotrophic areas? J. Mar. Syst. 2013, 125, 29–40. [Google Scholar] [CrossRef]
  65. Kwiatkowski, L.; Aumont, O.; Bopp, L.; Ciais, P. The Impact of Variable Phytoplankton Stoichiometry on Projections of Primary Production, Food Quality, and Carbon Uptake in the Global Ocean. Glob. Biogeochem. Cycles 2018, 32, 516–528. [Google Scholar] [CrossRef]
  66. Moreno, A.R.; Martiny, A.C. Ecological Stoichiometry of Ocean Plankton. Annu. Rev. Mar. Sci. 2018, 10, 43–69. [Google Scholar] [CrossRef] [PubMed]
  67. Traganos, D.; Reinartz, P. Interannual Change Detection of Mediterranean Seagrasses Using RapidEye Image Time Series. Front. Plant Sci. 2018, 9, 96. [Google Scholar] [CrossRef] [PubMed]
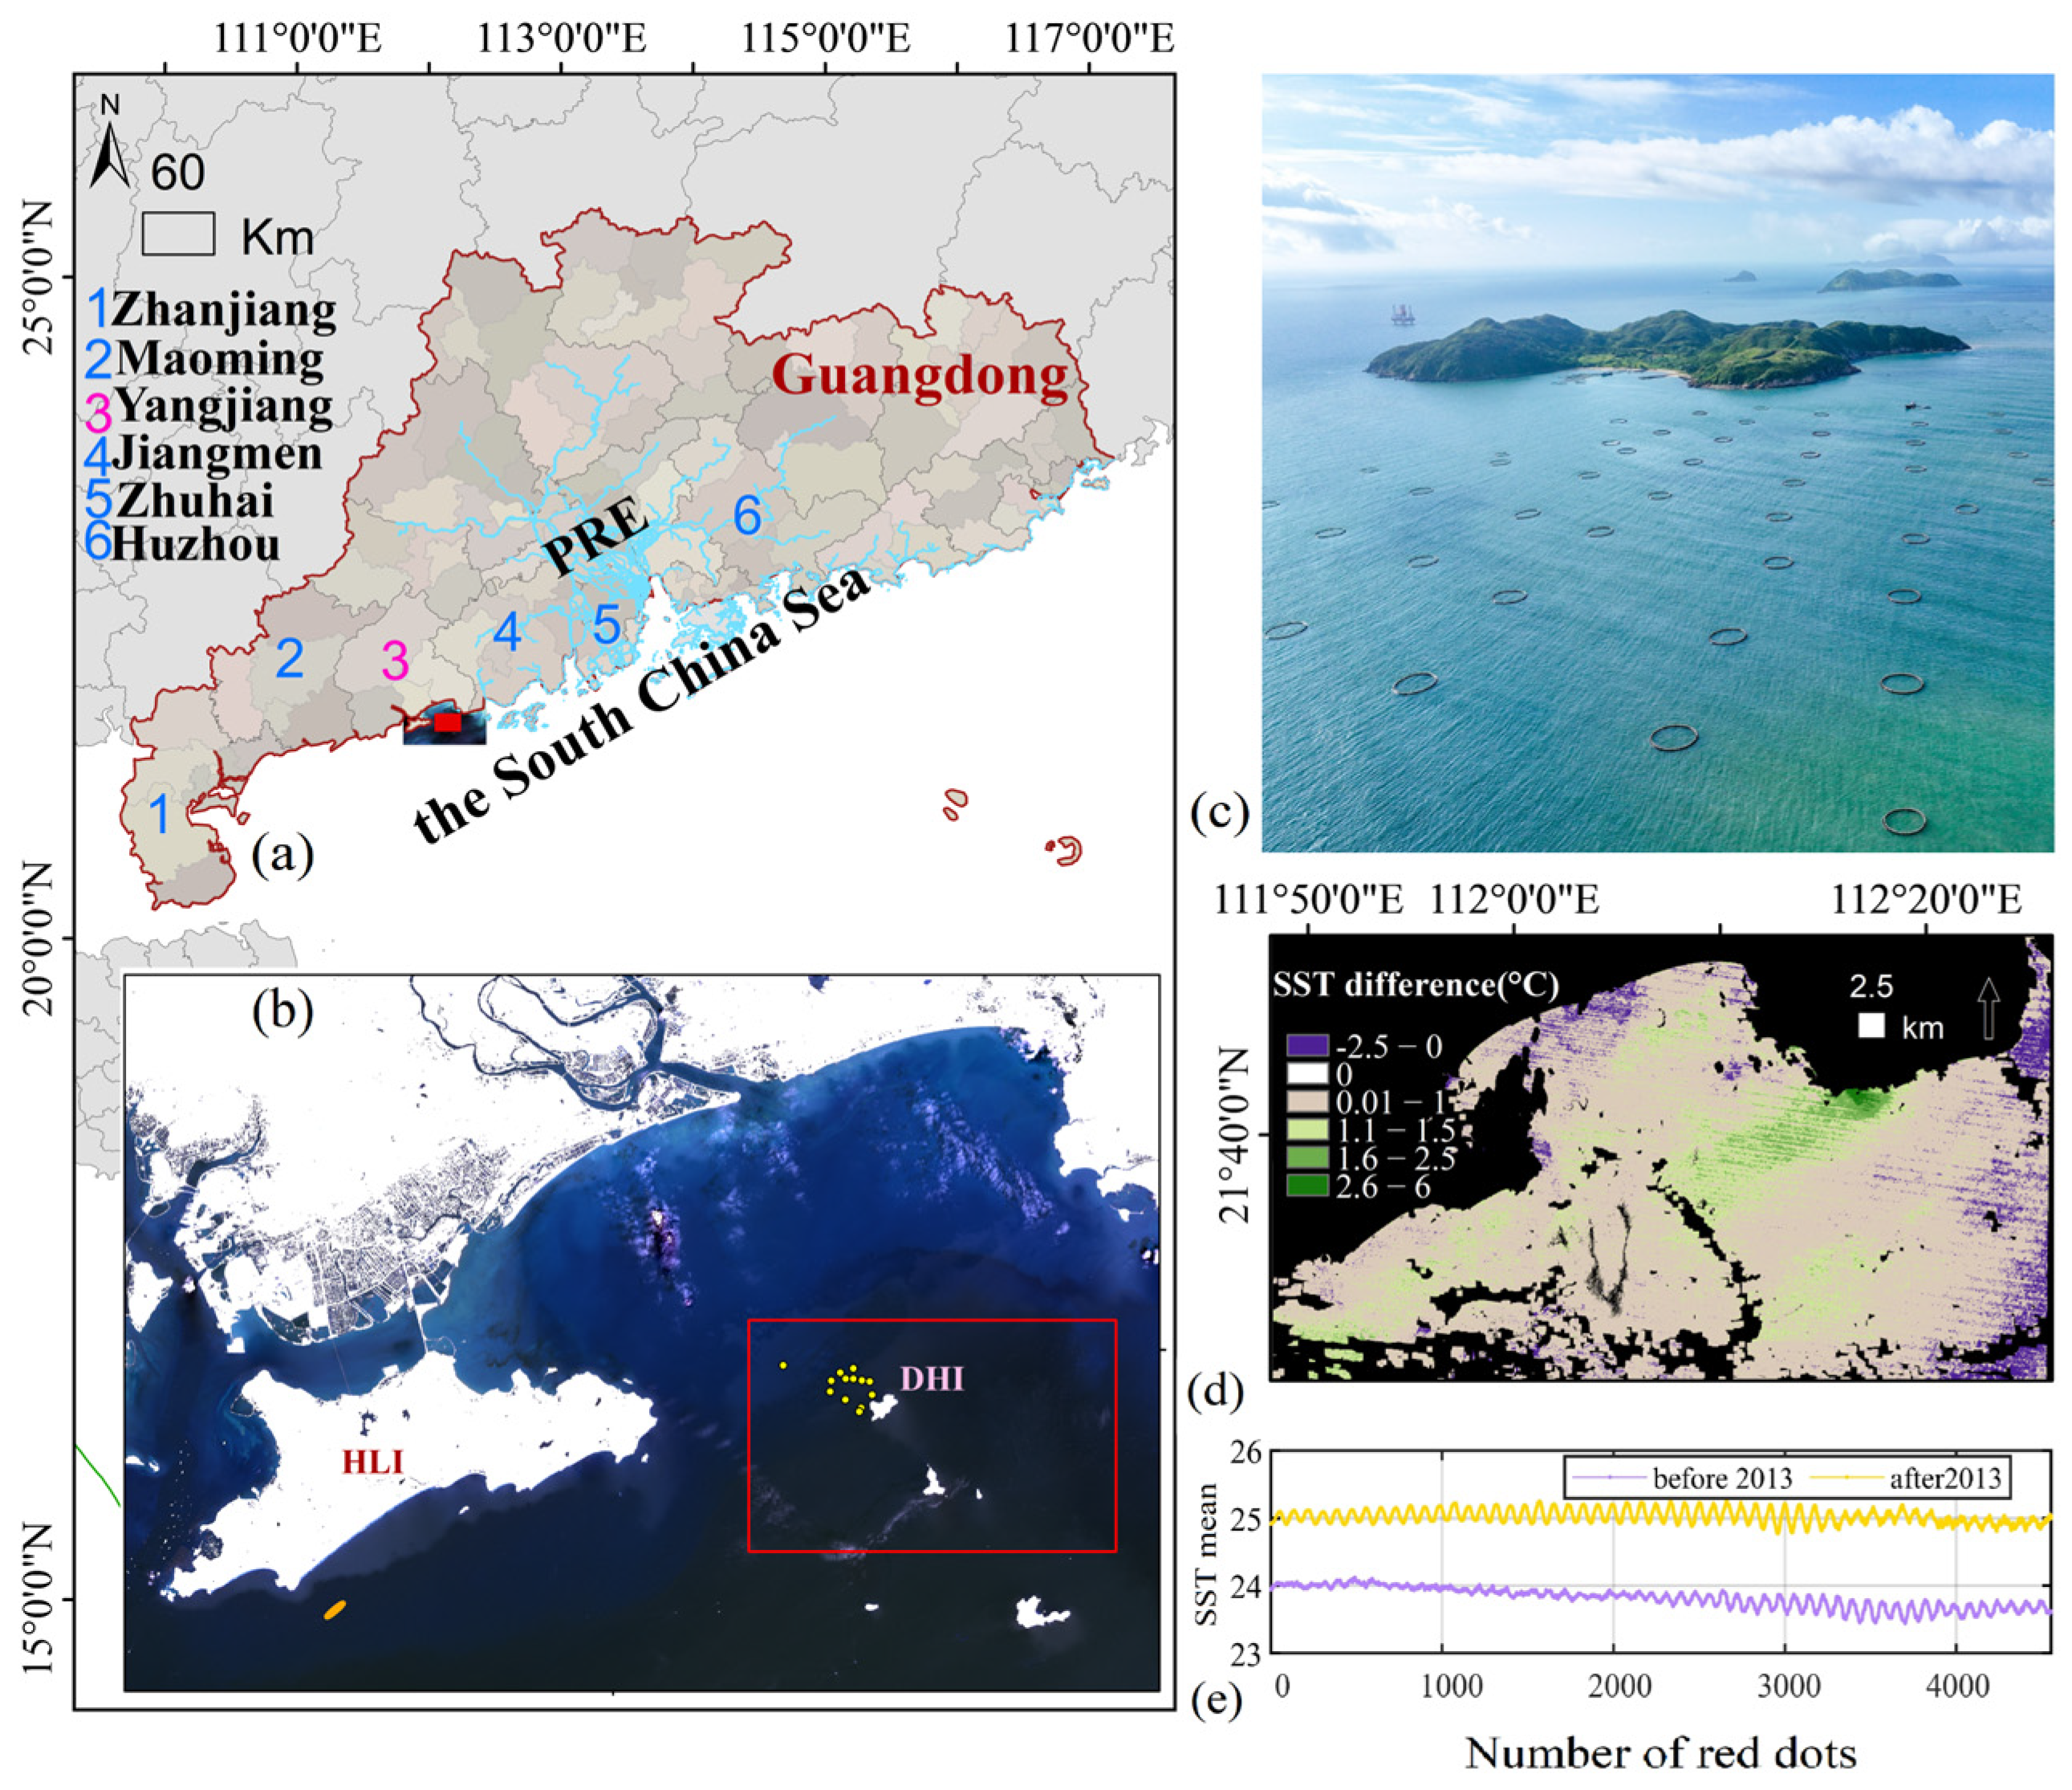
Figure 1. Geographical location of the study area and its temperature variations (a). Location of the Yangjiang offshore cage culture area in Guangdong Province, China. PRE: Pearl River Estuary. Red dots indicate the primary area of interest where cage culture is concentrated; (b). Detailed zoomed-in map of the coastal waters along Yangjiang, with the red box indicating the study area boundary. Key geographical features are labeled, including Yangjiang, Dahuo Island (DHI) (pink mark), Hailing Island (HLI) (red mark), and previously documented HABs occurrence zones (orange ellipses); (c). An on-site view of the cage aquaculture area highlighted in the red rectangle in panel (b); (d). SST changes post- 2013; (e). Temperature variation curve in the red-marked area of interest, the numbers on the x-axis represent the sequence numbers of the dense red points in panel (a).
Jmse 13 01677 g001
Figure 2. SST inversion results from Landsat 8/9 thermal infrared data. Acquisition dates: (a,d) 24 November 2023; (b,e) 26 November 2024; (c,f) 20 December 2024. Insets (d,e,f) show zoomed-in views of regions marked by red rectangles in (a,b,c), respectively.
Jmse 13 01677 g002
Figure 3. Spatial distribution and mean levels of NP ratio in November pre-2013 (For enhanced clarity, the aquaculture area of interest, corresponding to the red box shown in Figure 1b, is delineated by a white frame in the figure, the scattered points marked as (i) correspond to the 13 locations within the net cages listed in Table 2).
Jmse 13 01677 g003
Figure 4. Spatial distribution and mean levels of NP ratio in November post-2013 (Subfigure explanations are consistent with those in Figure 3).
Jmse 13 01677 g004
Figure 5. Frequency distribution histogram of NP ratio changes ((a) pre-2013, (b) post-2013) (The red dotted line marks the Redfield NP value (16)).
Jmse 13 01677 g005
Figure 6. Probability Density Function (PDF) (a,c,e) and Cumulative Distribution Function (CDF) (b,d,f) of TN (a,b), TP (c,d), and NP ratio (e,f).
Jmse 13 01677 g006
Figure 7. Nitrogen and Phosphorus transformation pathways in offshore cage-culture marine ranching (DIN: dissolved inorganic nitrogen, DON: dissolved organic nitrogen, PON: particulate organic nitrogen, ON: organic nitrogen, POP: particulate organic phosphorus, DOP: dissolved organic phosphorus, DIP: dissolved inorganic phosphorus, PIP: particulate inorganic phosphorus).
Jmse 13 01677 g007
Figure 8. Historical trends in seafood production (a) and the trend analysis of the ratio NP changes (b).
Jmse 13 01677 g008
Table 1. Primary datasets supporting this study.
Data TypeData NameData SourceTime PeriodCoverage
Satellite ObservationLandsat 5/7/8/9 dataNational Aeronautics and Space Administration (NASA)1995–2024Yangjiang offshore aquaculture area
Optical Remote SensingSentinel-2 dataEuropean Space Agency (ESA)2019–2024Yangjiang offshore aquaculture area
Offshore Cage Field ObservationTN (mg/L), TP (mg/L), SST (°C)CCCC Guangdong-Hong Kong-Macao Greater Bay Area Innovation Research Institute Ltd.January–April 2024, 23 November 2024Yangjiang offshore aquaculture area
Table 2. Field measurements included SST, TN, and TP concentrations at designated sampling sites in the offshore cage-culture area (23 November 2024).
StationsX (Longitude/°E)Y (Latitude/°N)SST (°C)TN (mg/L)TP (mg/L)
0112.07421.66022.840.5140.044
1112.11221.65323.750.5680.036
2112.11321.64723.860.5150.039
3112.10521.65923.710.4980.040
4112.10921.65423.880.5980.044
5112.09921.65723.790.680.041
6112.10521.65423.350.3820.045
7112.10821.64223.490.4920.046
8112.10221.65423.430.3970.043
9112.10121.64522.20.4130.043
10112.09521.65322.670.3970.044
11112.09521.64923.330.3780.043
12112.10721.64023.440.3880.040
Table 3. Correlation between post-2013 nutrient changes and SST changes (Sample size (n = 17) used for correlation analysis).
Parameter (Change)RpCorrelation
TN_d & SST_d−0.6513 0.0802Significant at 0.1 level
TP_d & SST_d−0.6511 0.0804Significant at 0.1 level
N/P_d & SST_d0.12290.7719Not significant
Disclaimer/Publisher’s Note: The statements, opinions and data contained in all publications are solely those of the individual author(s) and contributor(s) and not of MDPI and/or the editor(s). MDPI and/or the editor(s) disclaim responsibility for any injury to people or property resulting from any ideas, methods, instructions or products referred to in the content.