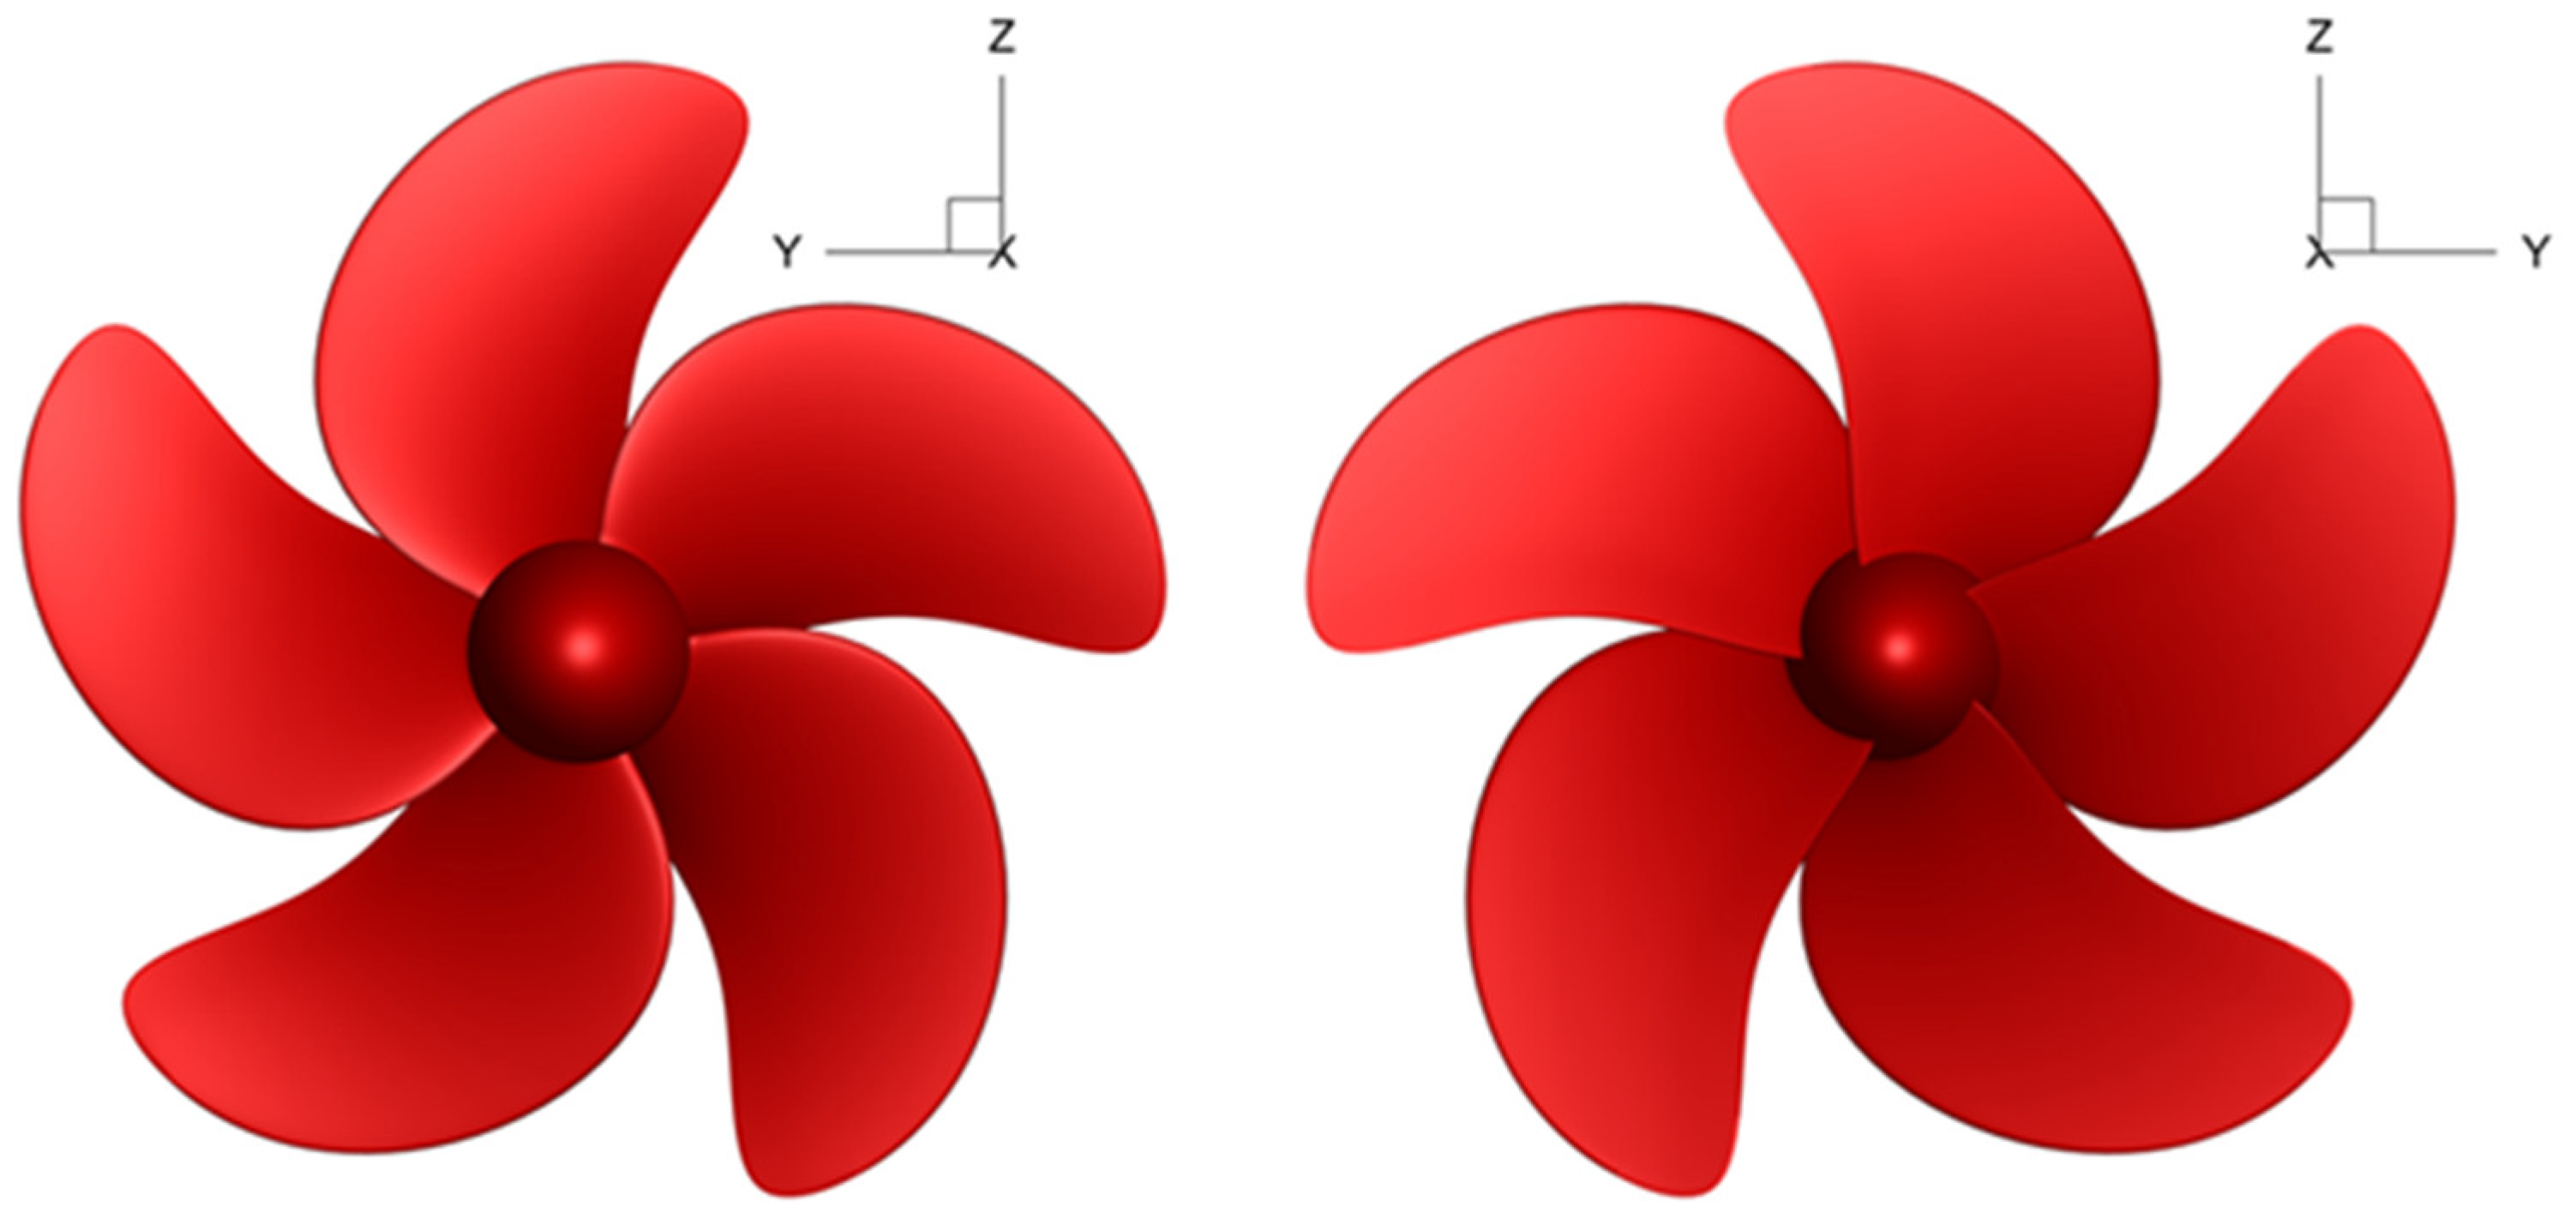
Figure 1.
The geometry of KP505 propeller.
Figure 1.
The geometry of KP505 propeller.
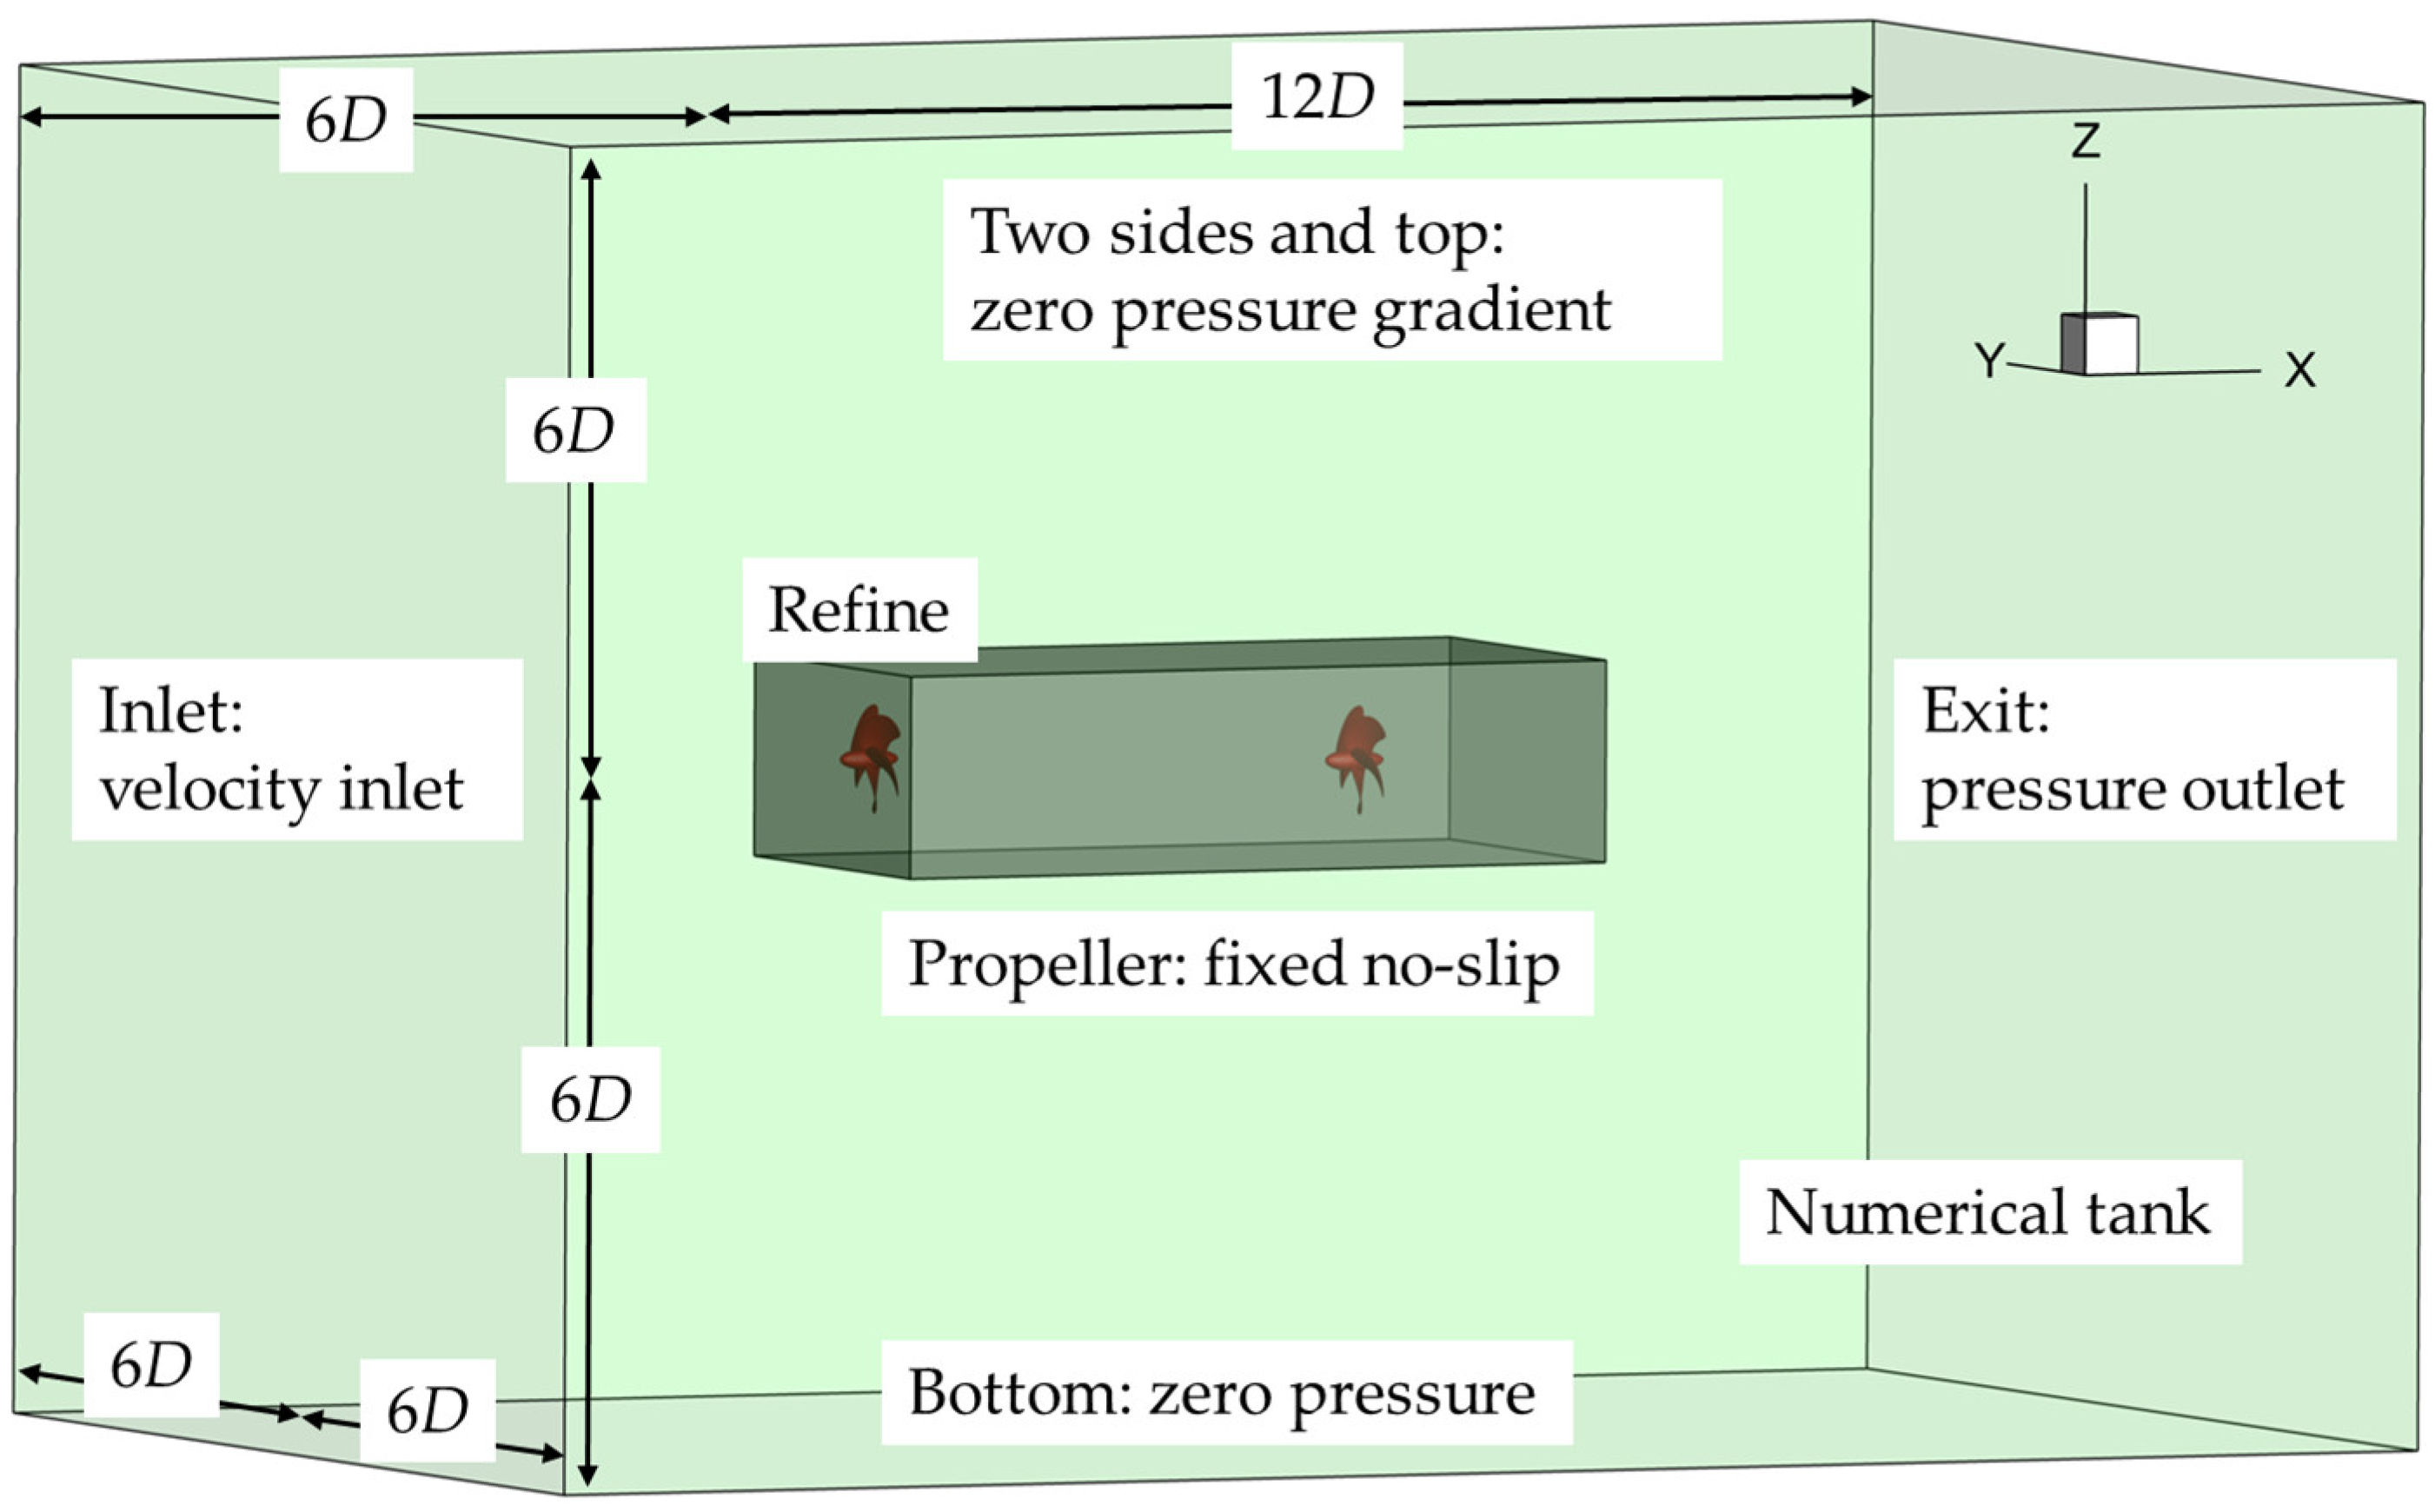
Figure 2.
Computational domain and boundary conditions.
Figure 2.
Computational domain and boundary conditions.
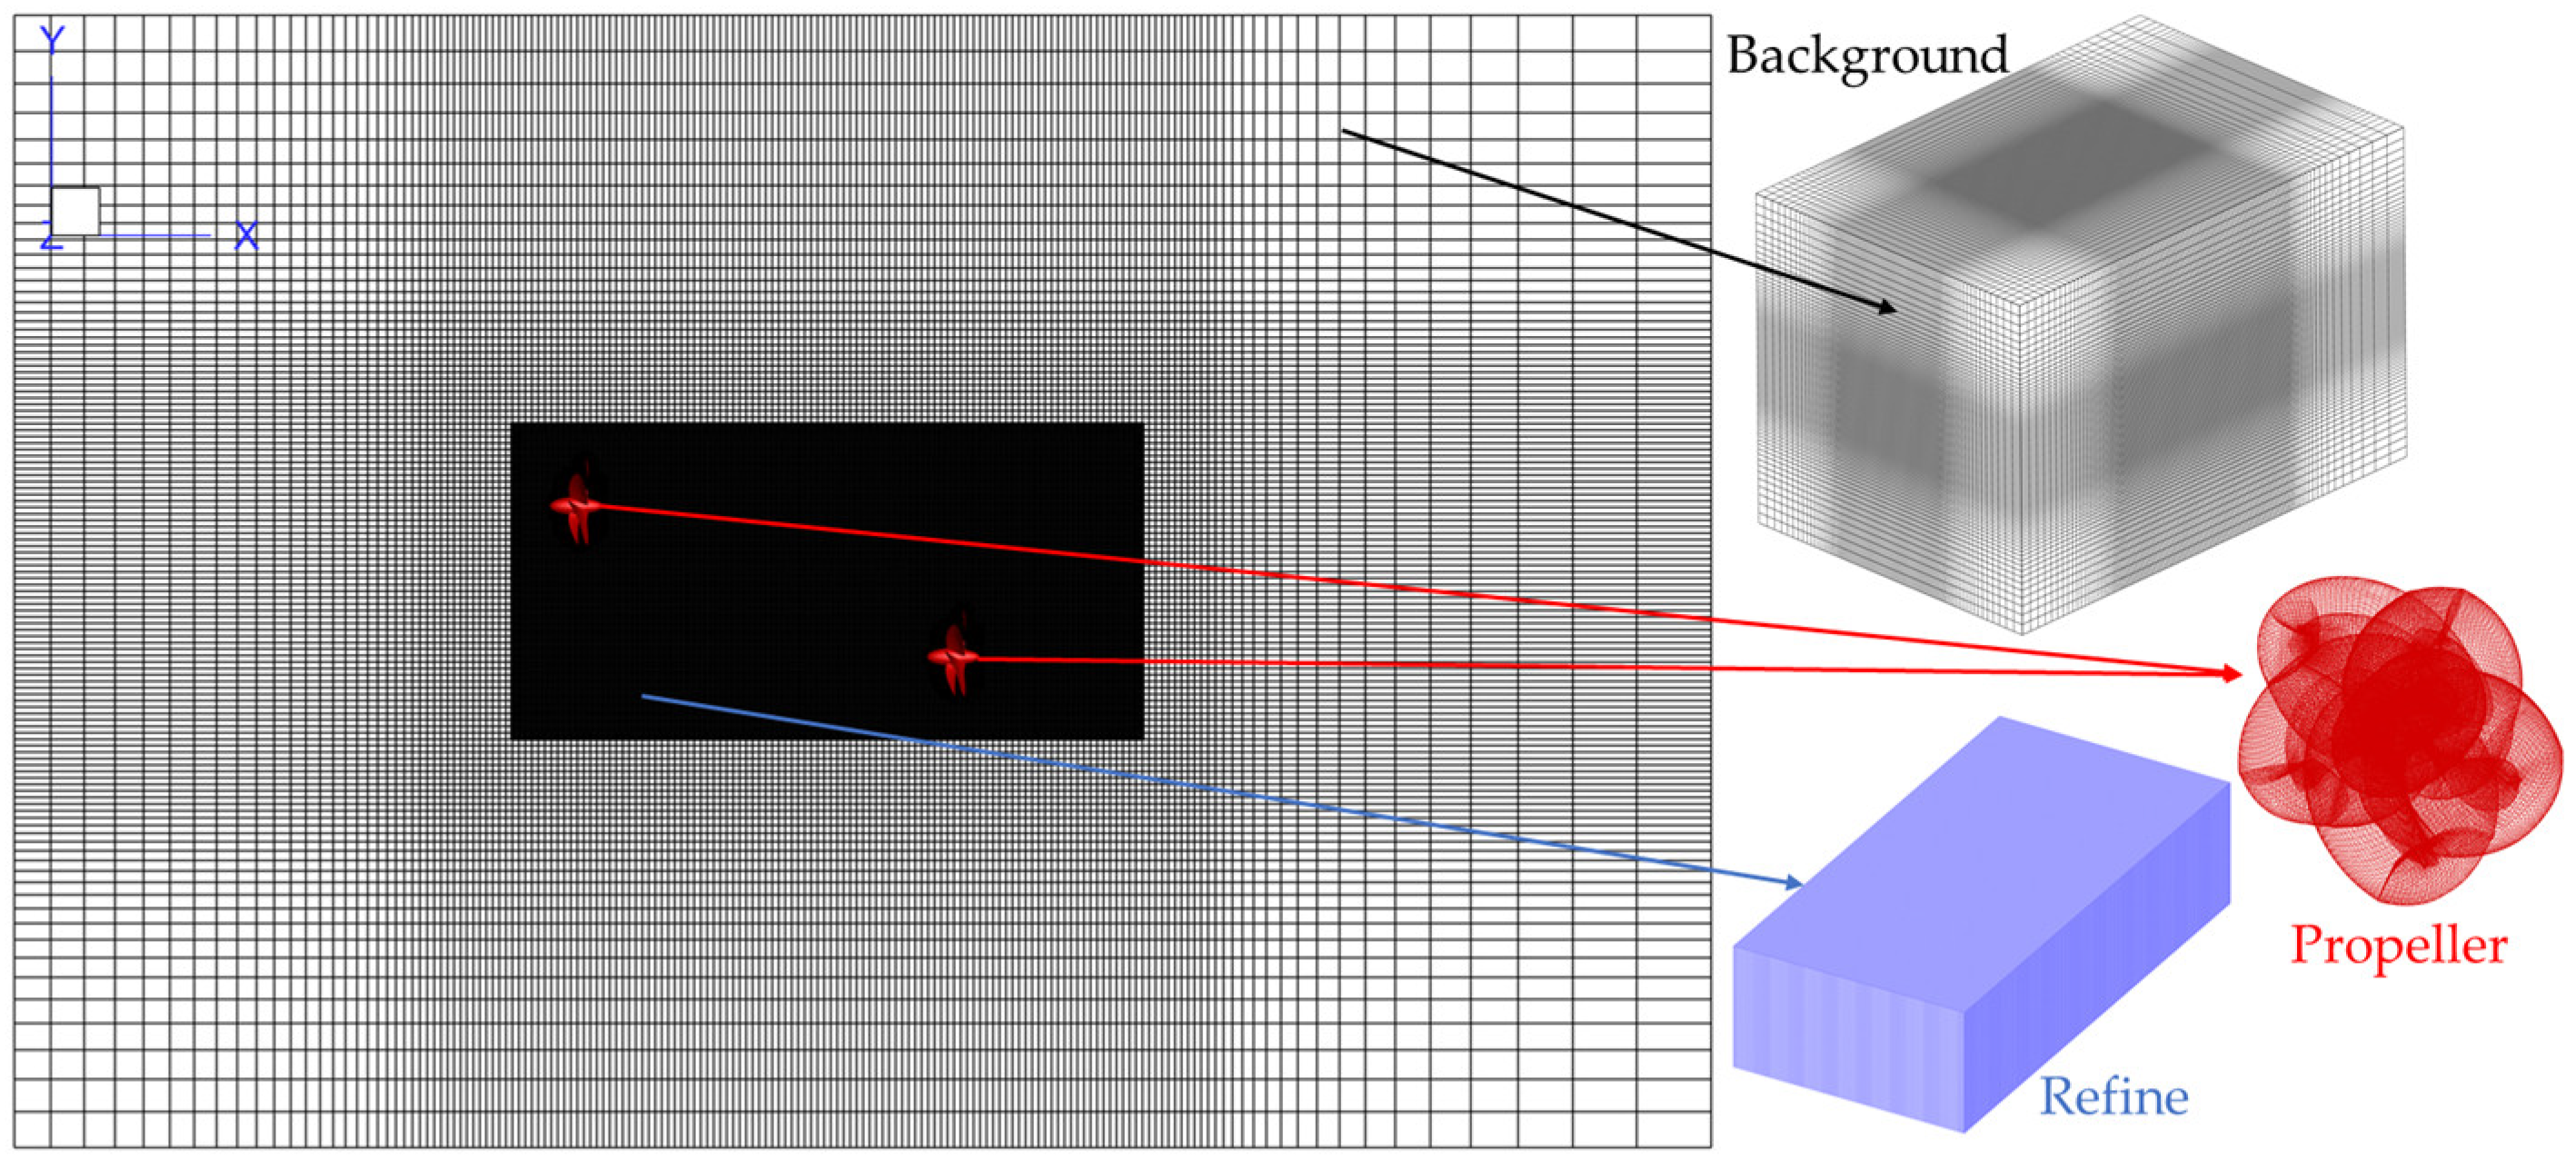
Figure 3.
Different components of grids.
Figure 3.
Different components of grids.
Figure 4.
Grid distribution of different components.
Figure 4.
Grid distribution of different components.
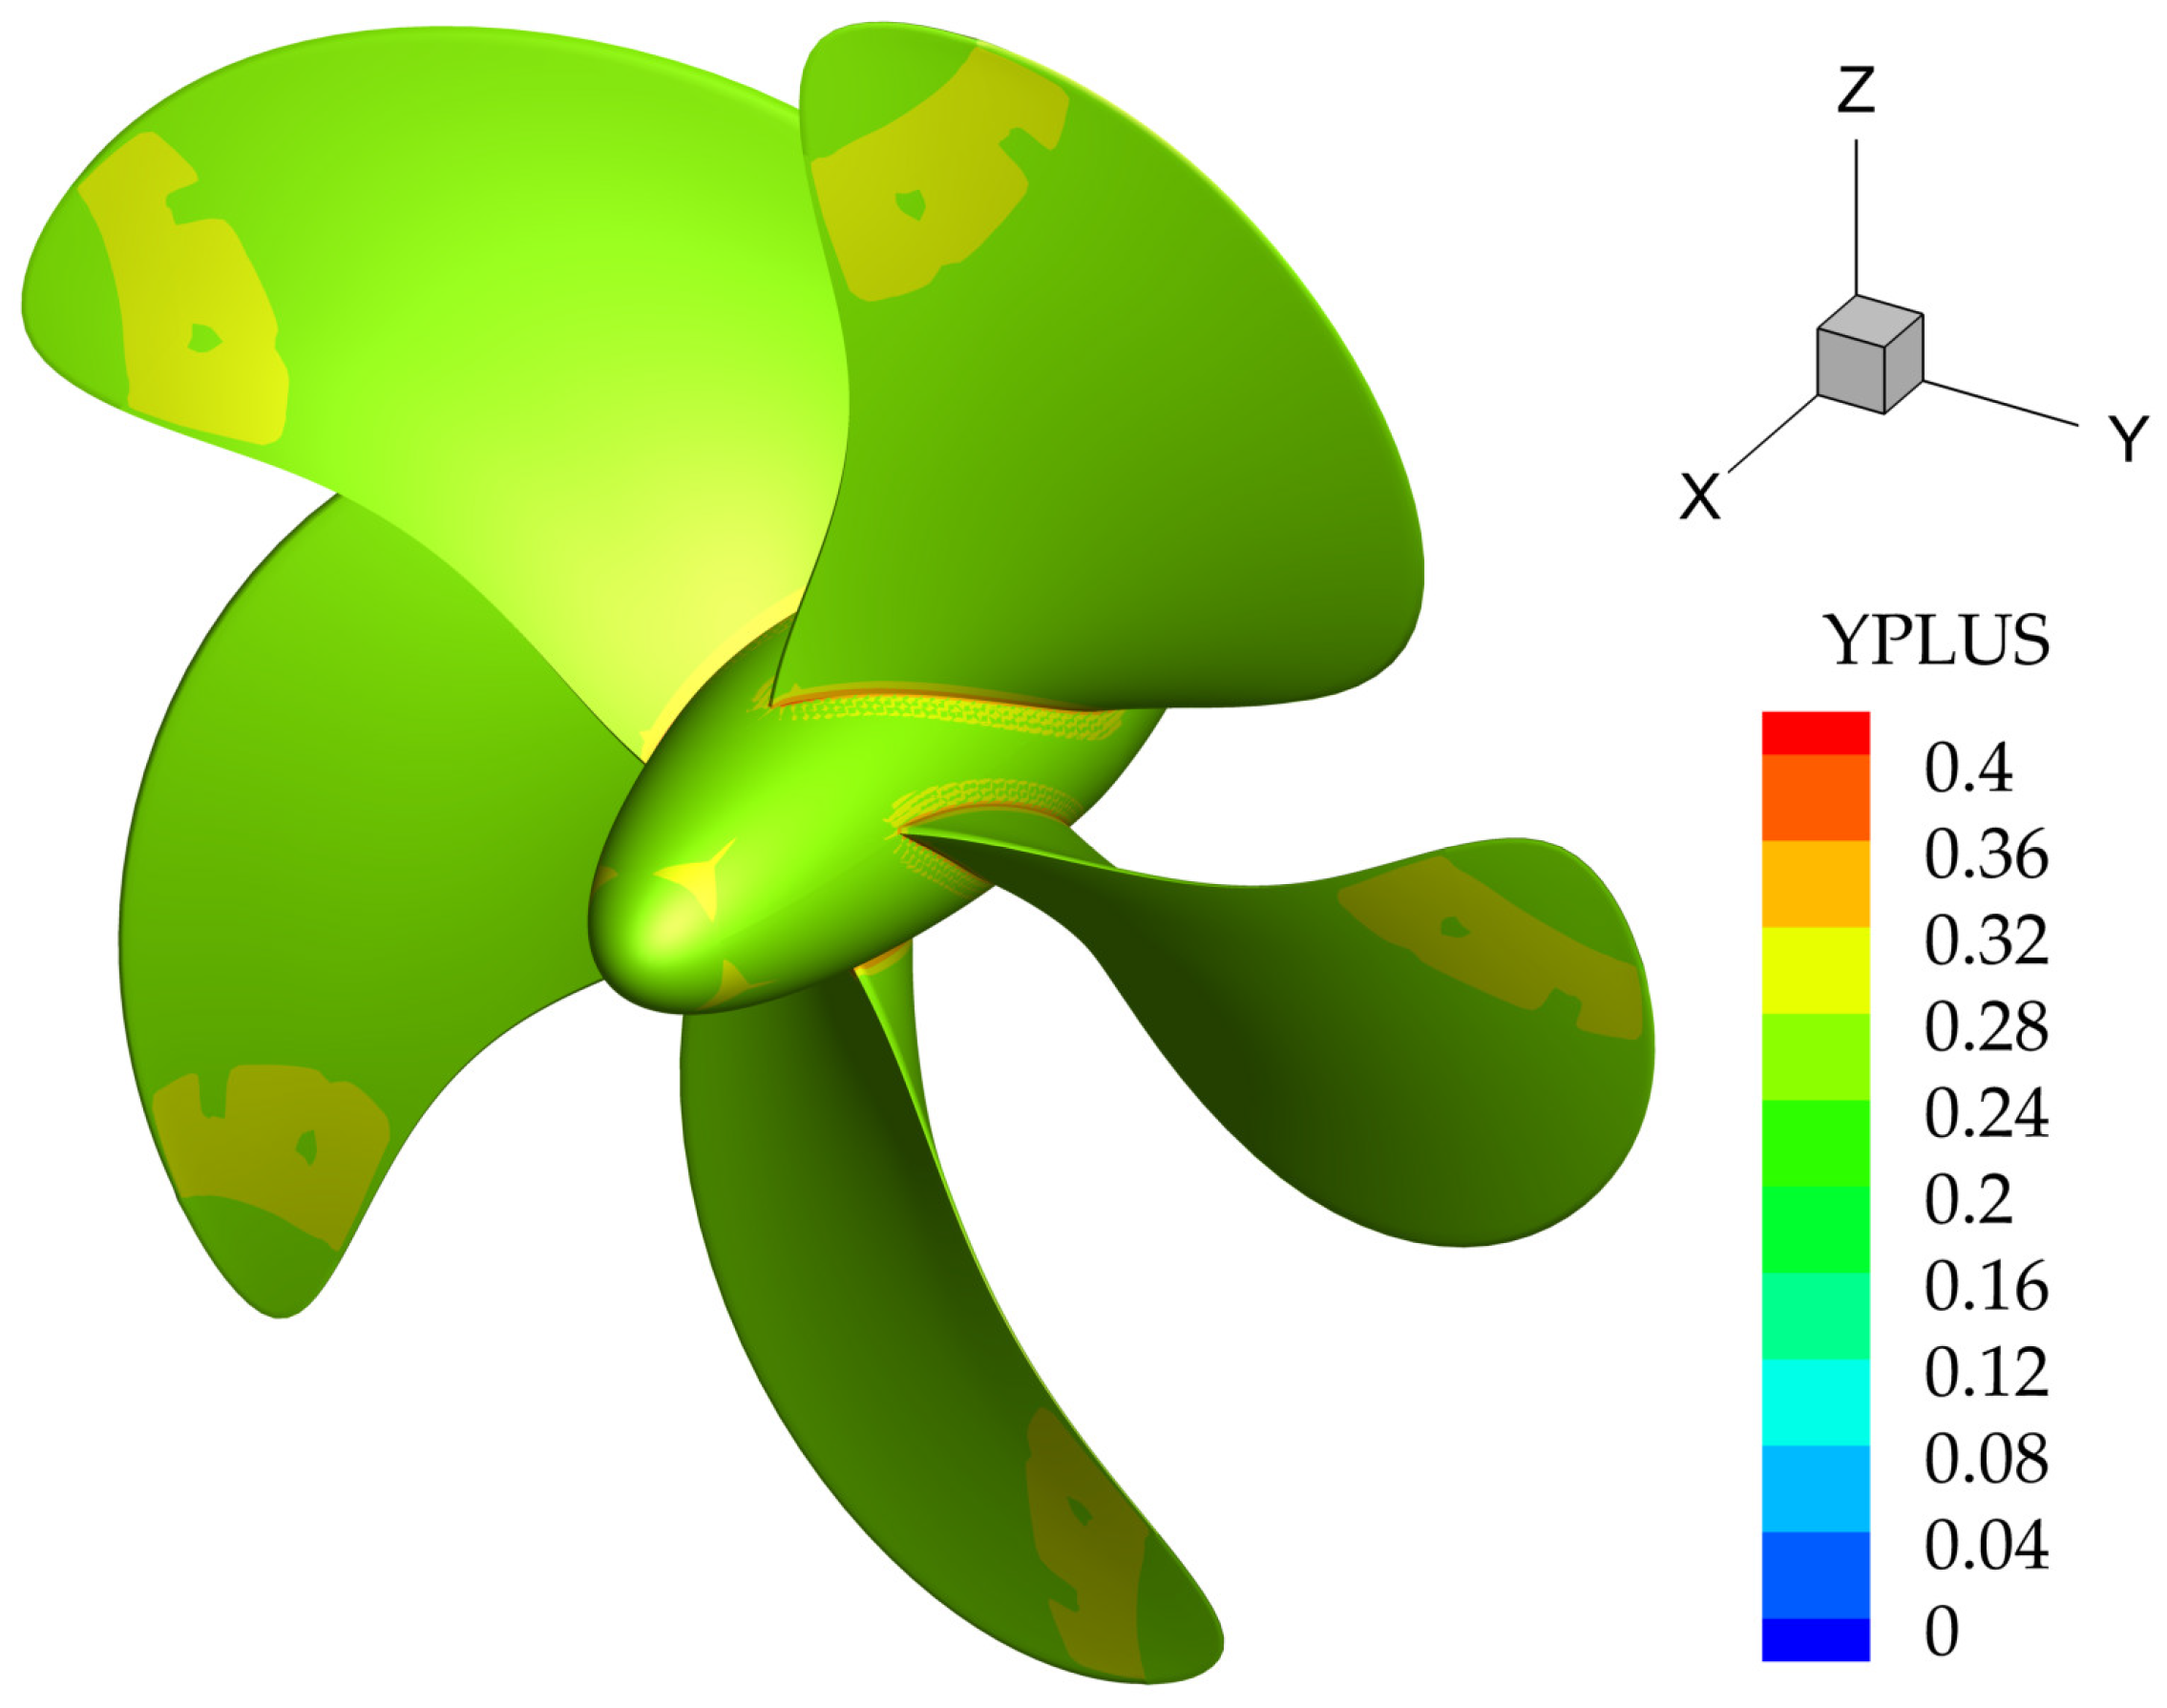
Figure 5.
Y+ on the propeller surface.
Figure 5.
Y+ on the propeller surface.
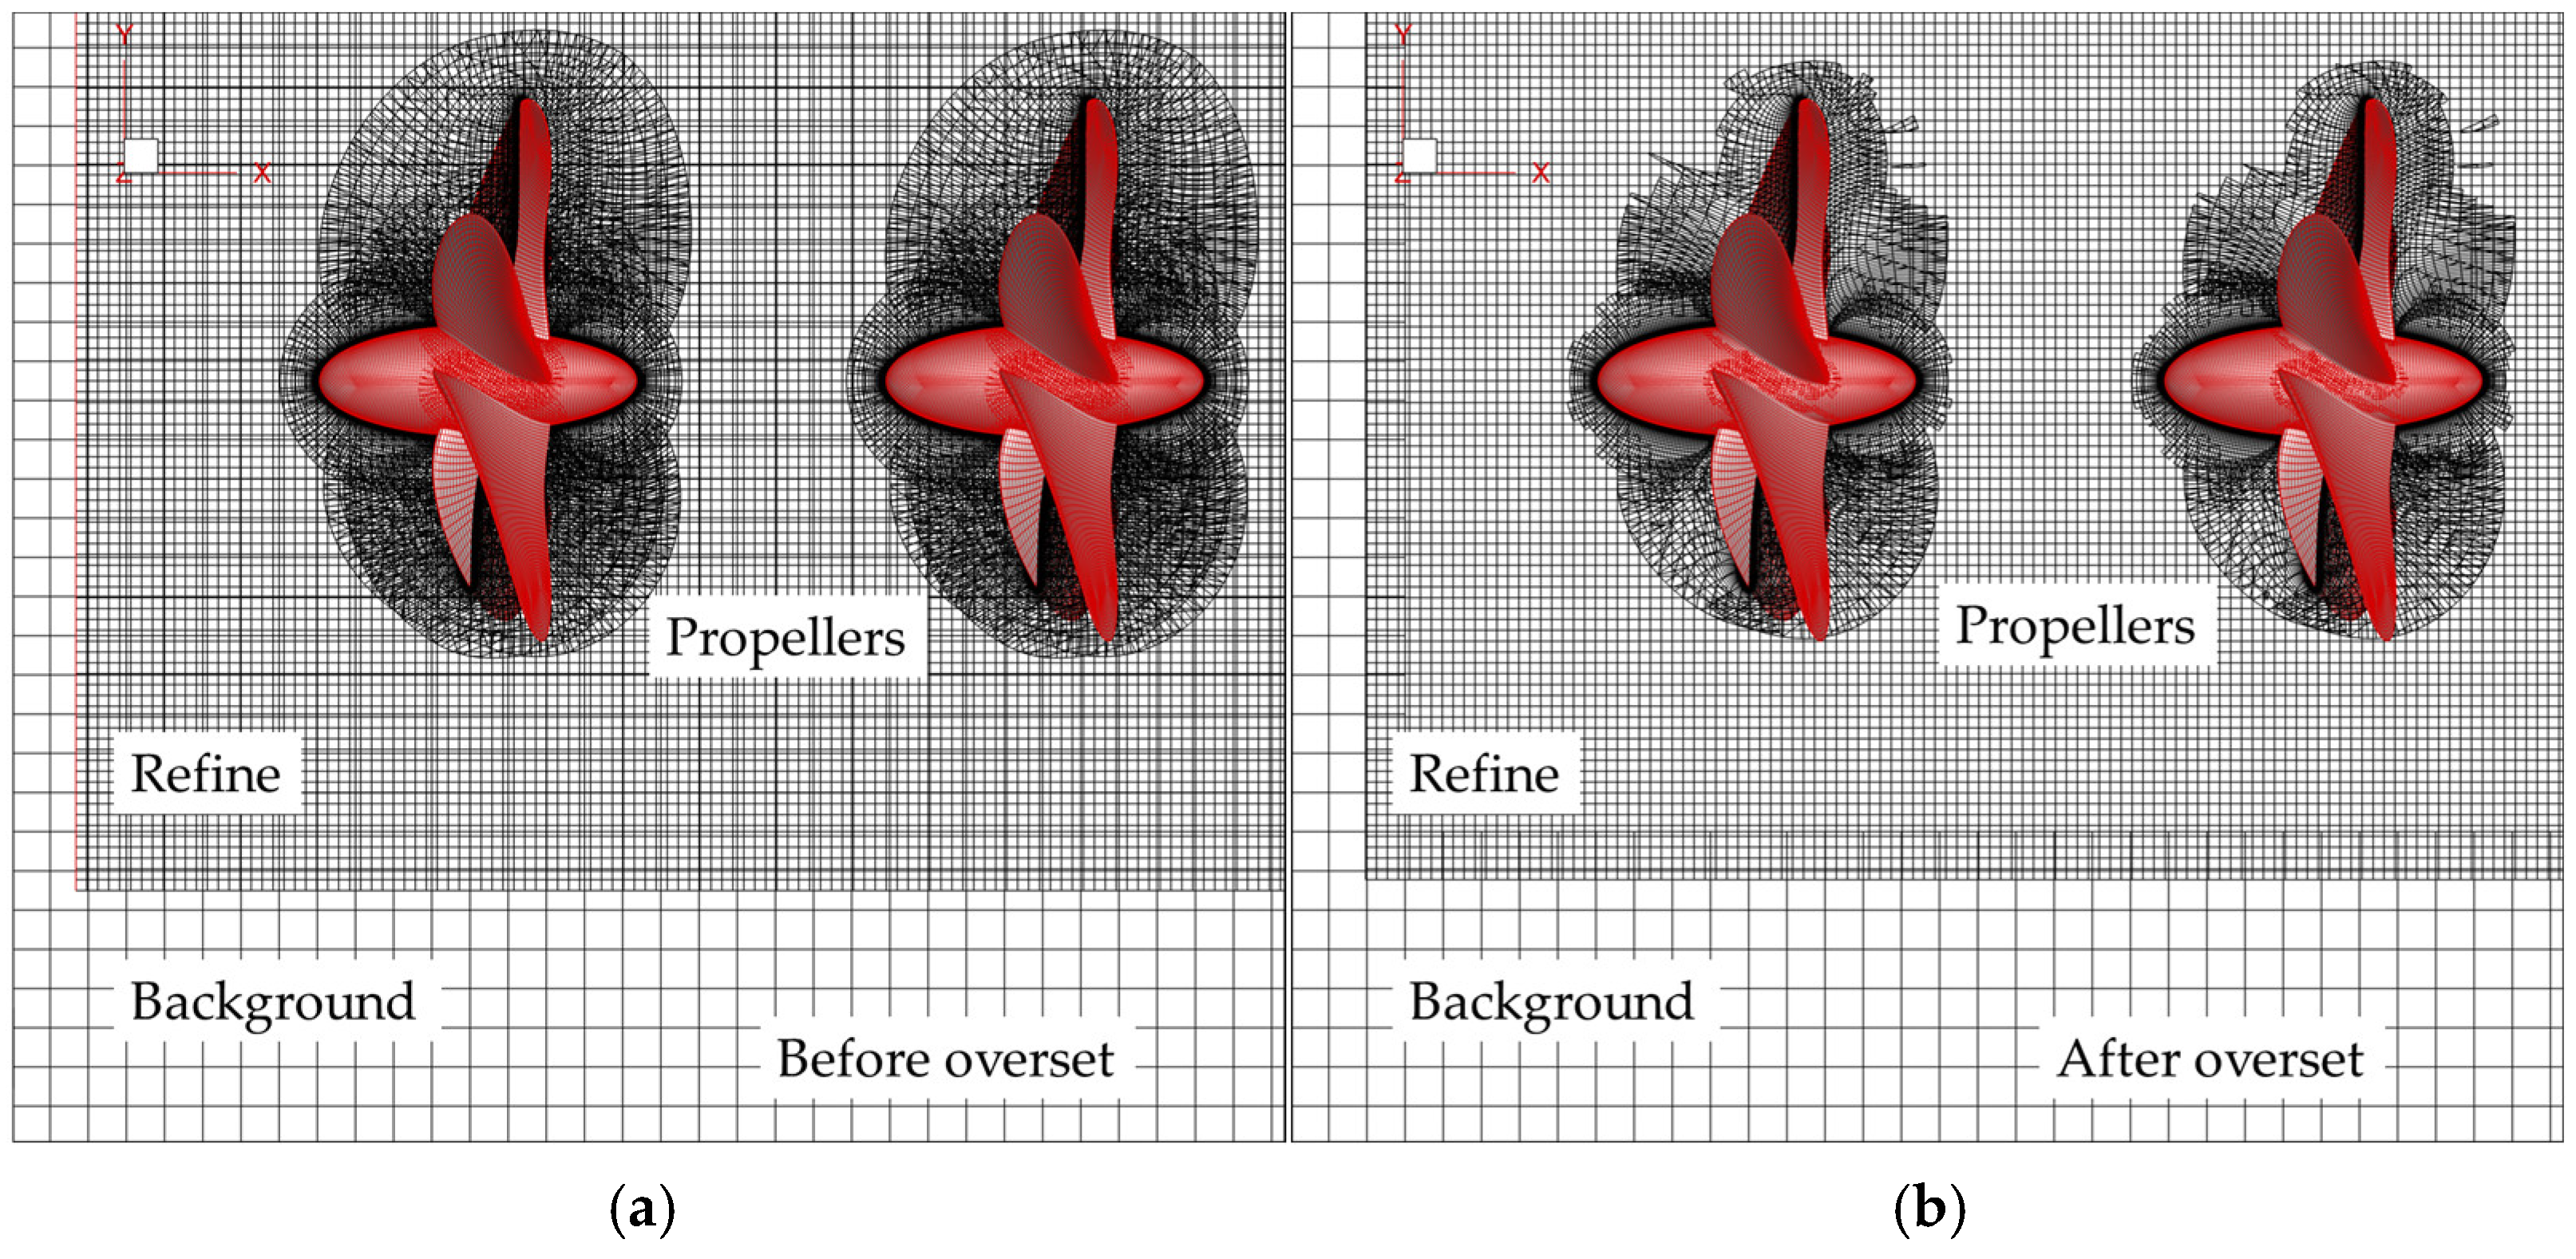
Figure 6.
Grids before and after overset: (a) Before overset; (b) After overset.
Figure 6.
Grids before and after overset: (a) Before overset; (b) After overset.
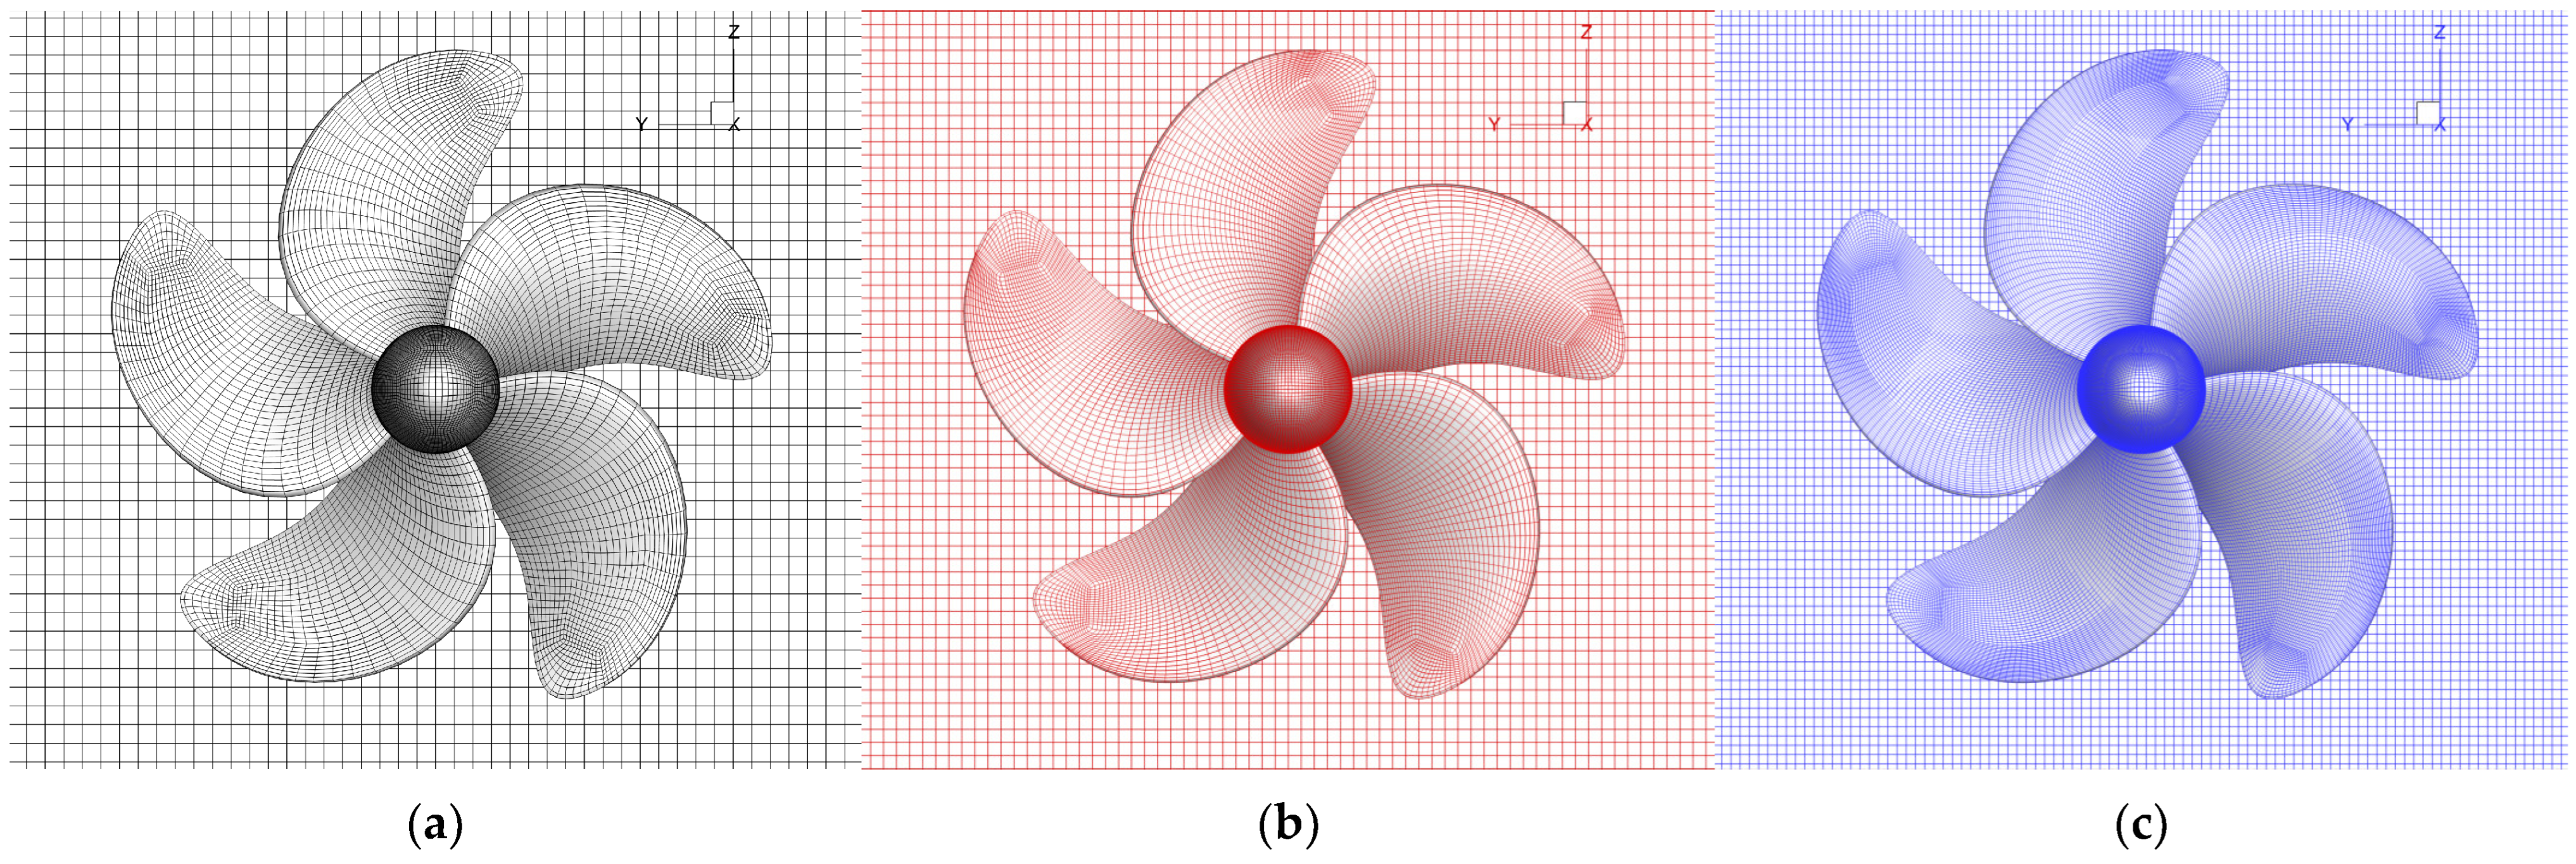
Figure 7.
Three sets of grids: (a) Coarse grids; (b) Medium grids; (c) Fine grids.
Figure 7.
Three sets of grids: (a) Coarse grids; (b) Medium grids; (c) Fine grids.
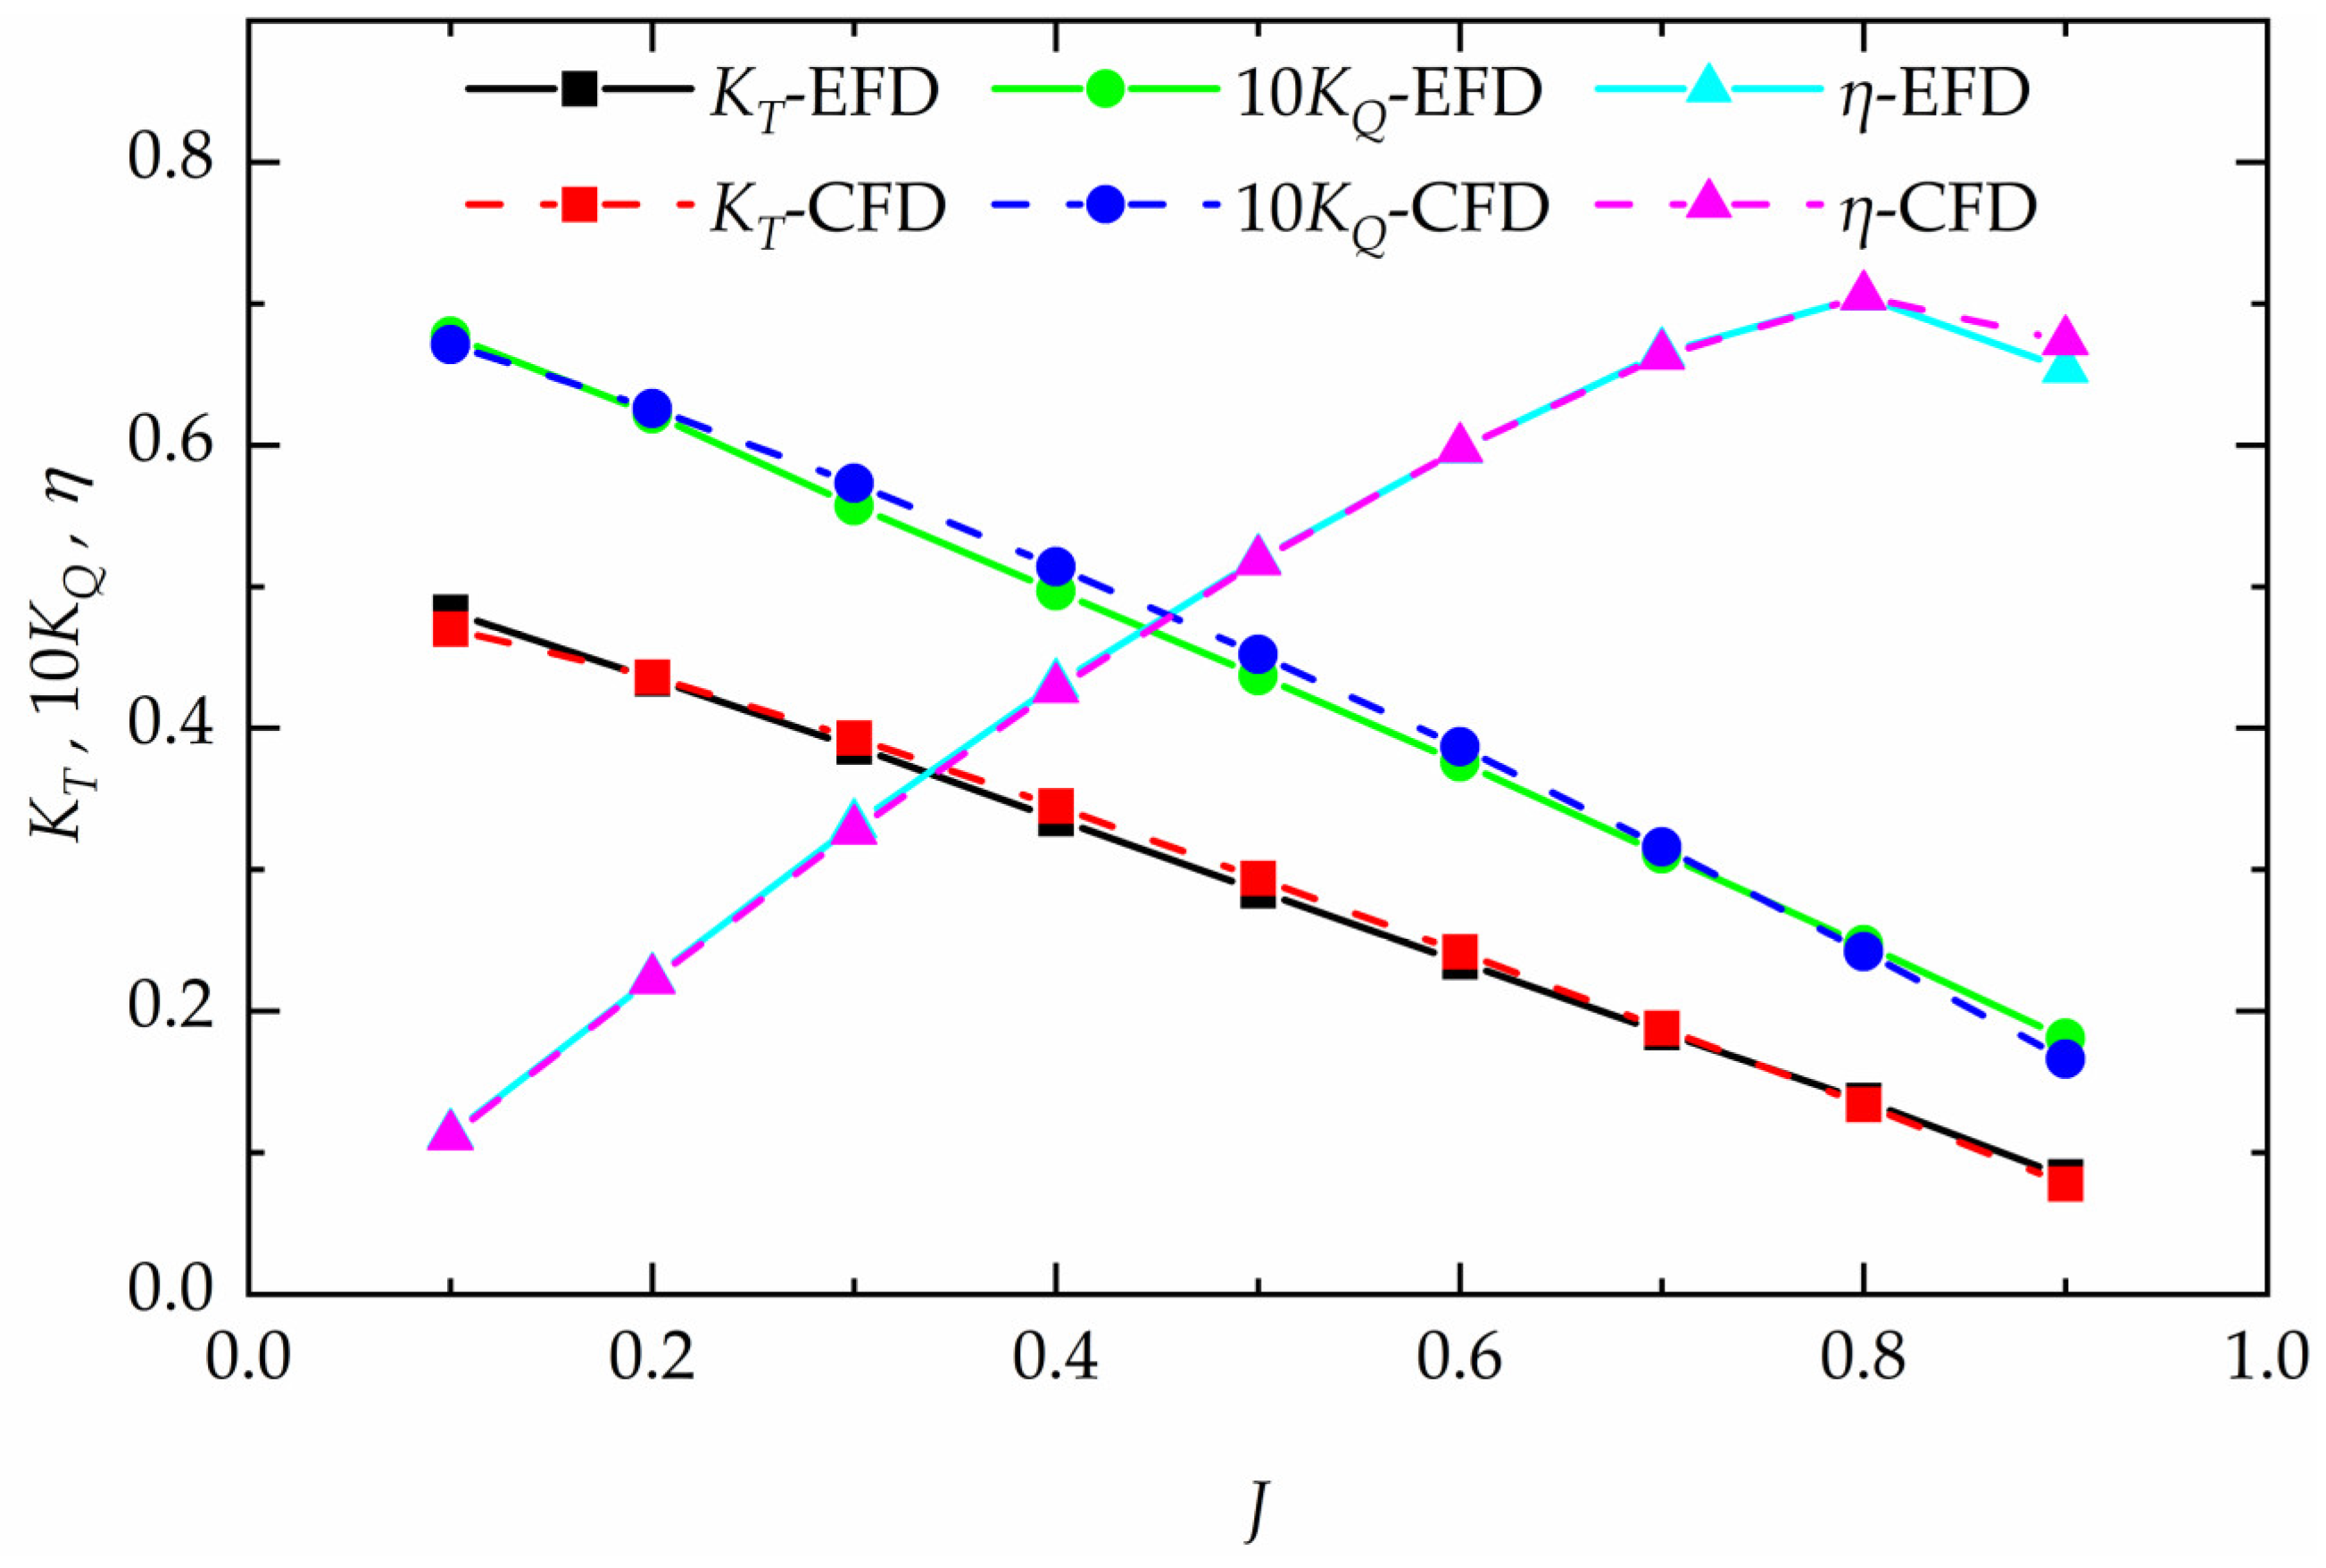
Figure 8.
Open-water characteristics of KP505 propeller.
Figure 8.
Open-water characteristics of KP505 propeller.
Figure 9.
Definition of the transverse spacing (TS) and longitudinal spacing (LS).
Figure 9.
Definition of the transverse spacing (TS) and longitudinal spacing (LS).
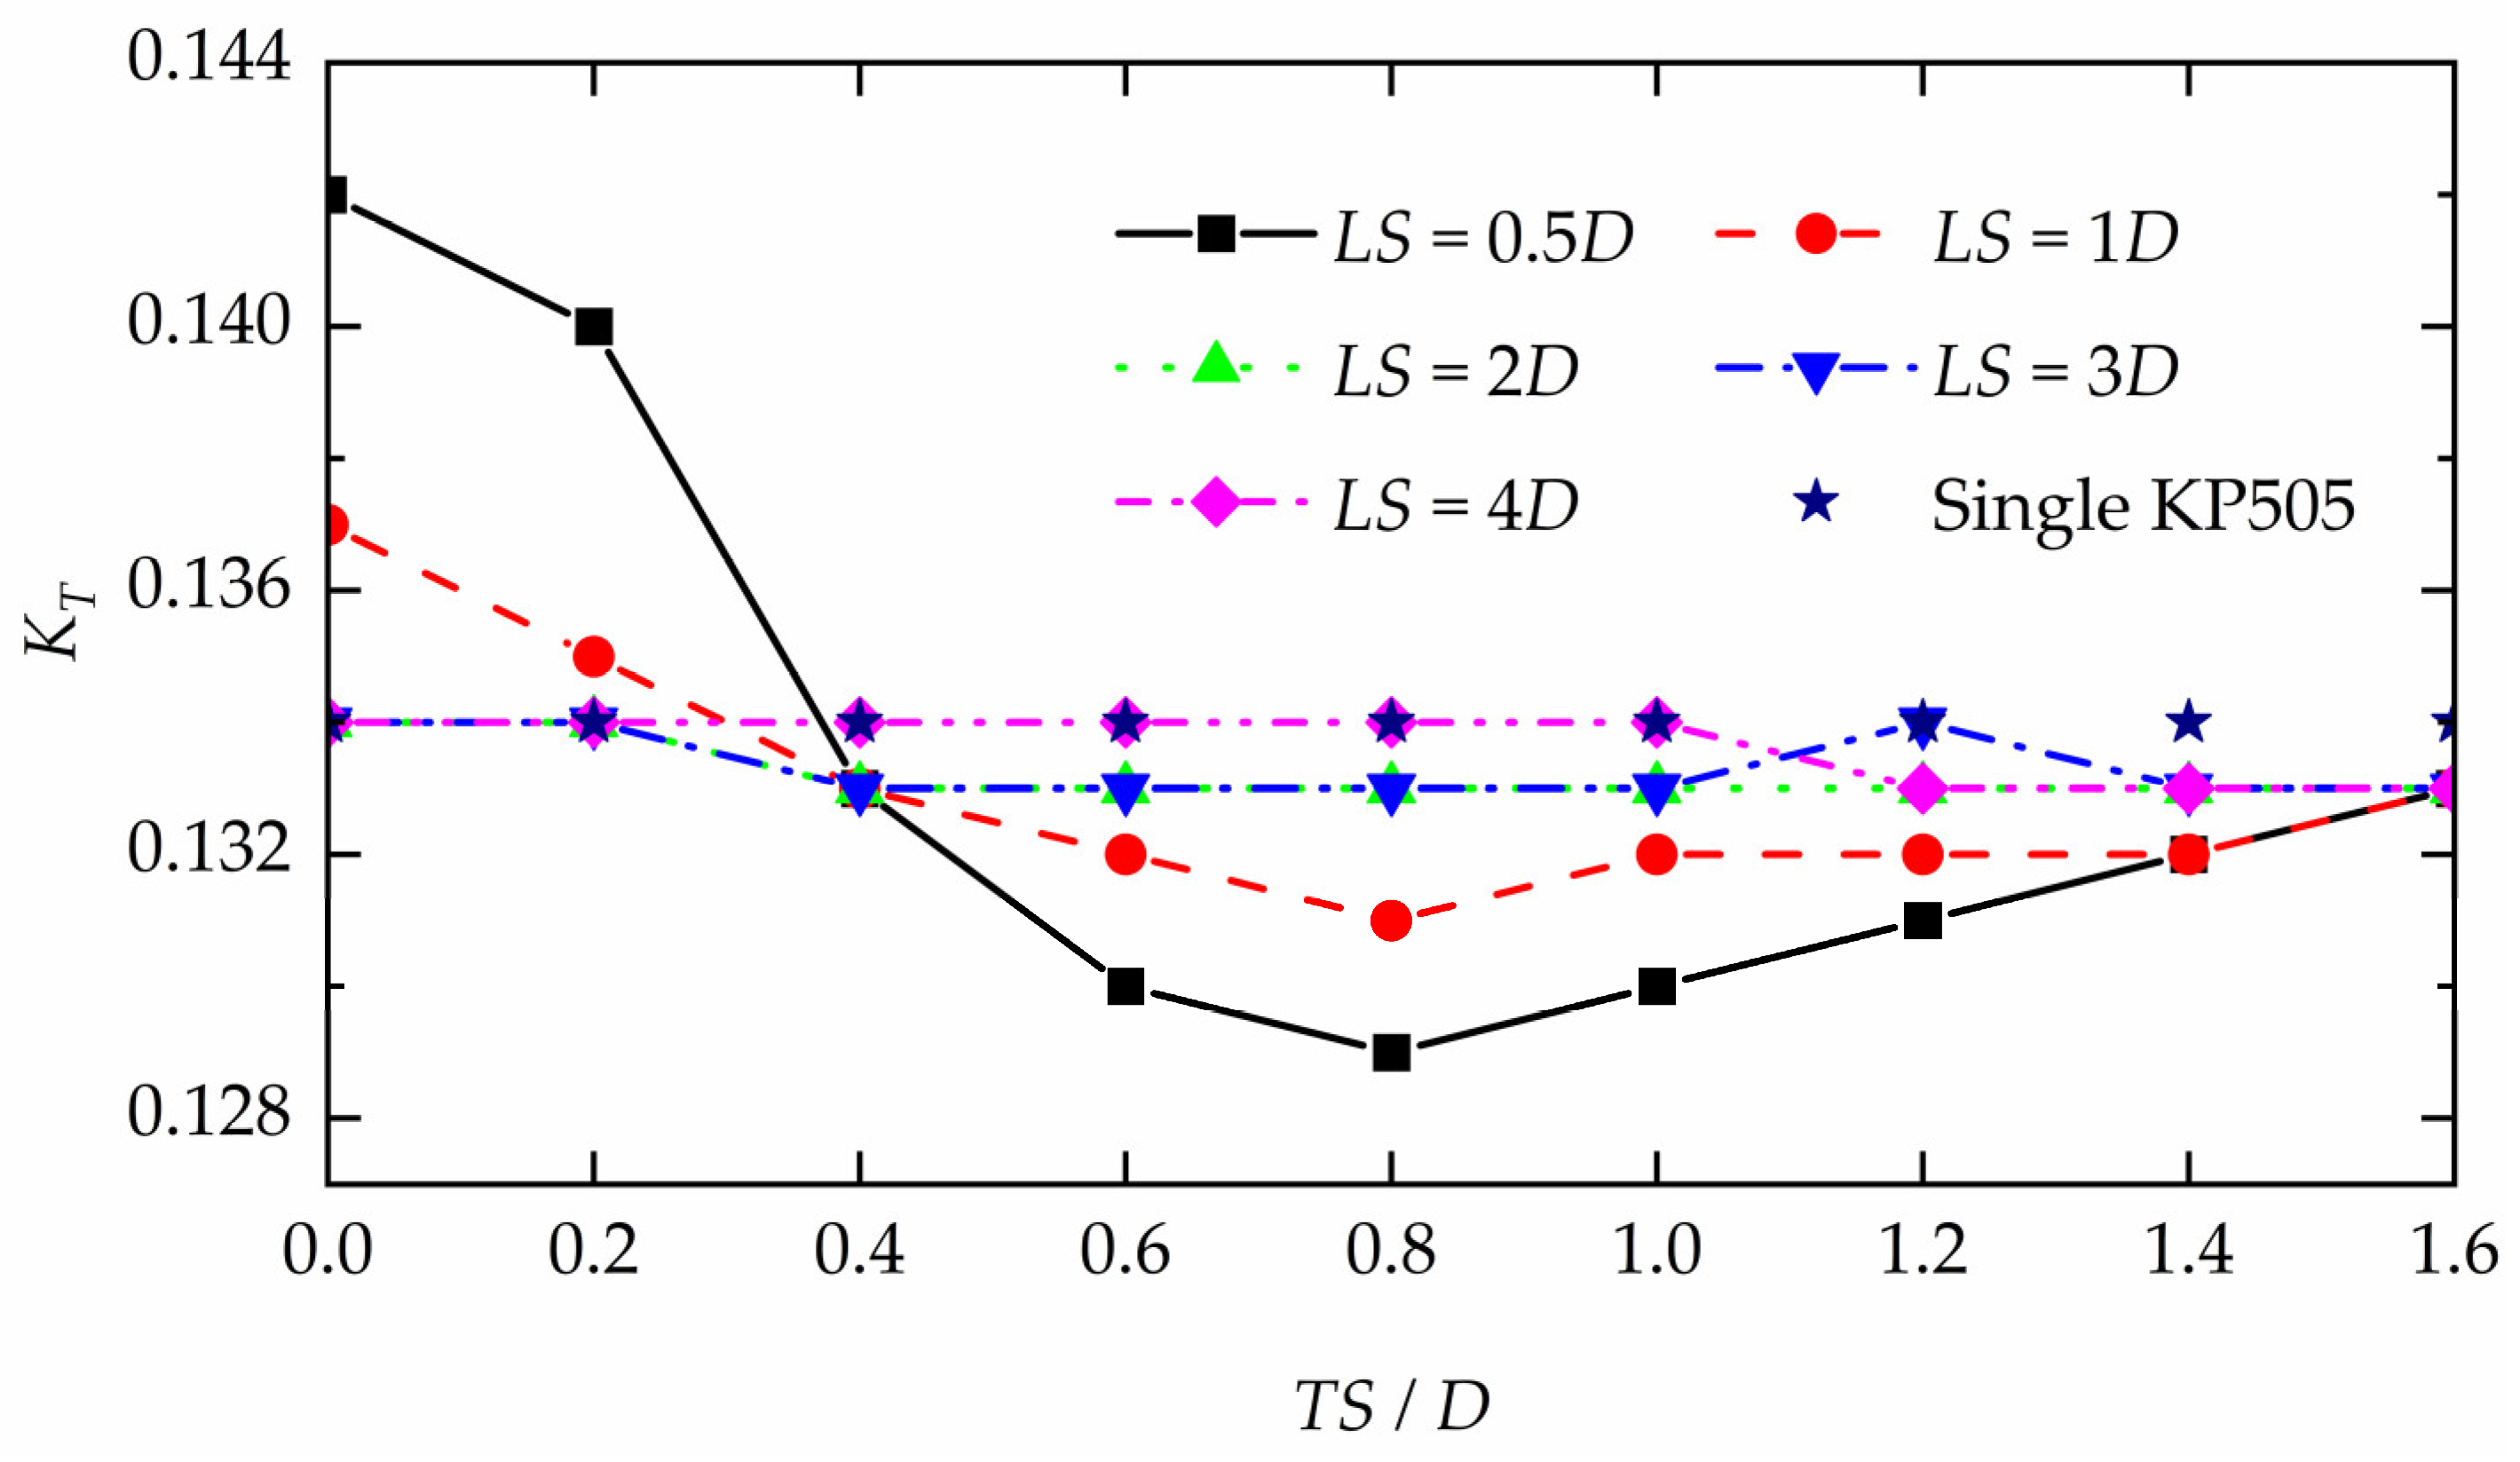
Figure 10.
The KT of the front propeller in different arrangements and single KP505 propeller.
Figure 10.
The KT of the front propeller in different arrangements and single KP505 propeller.
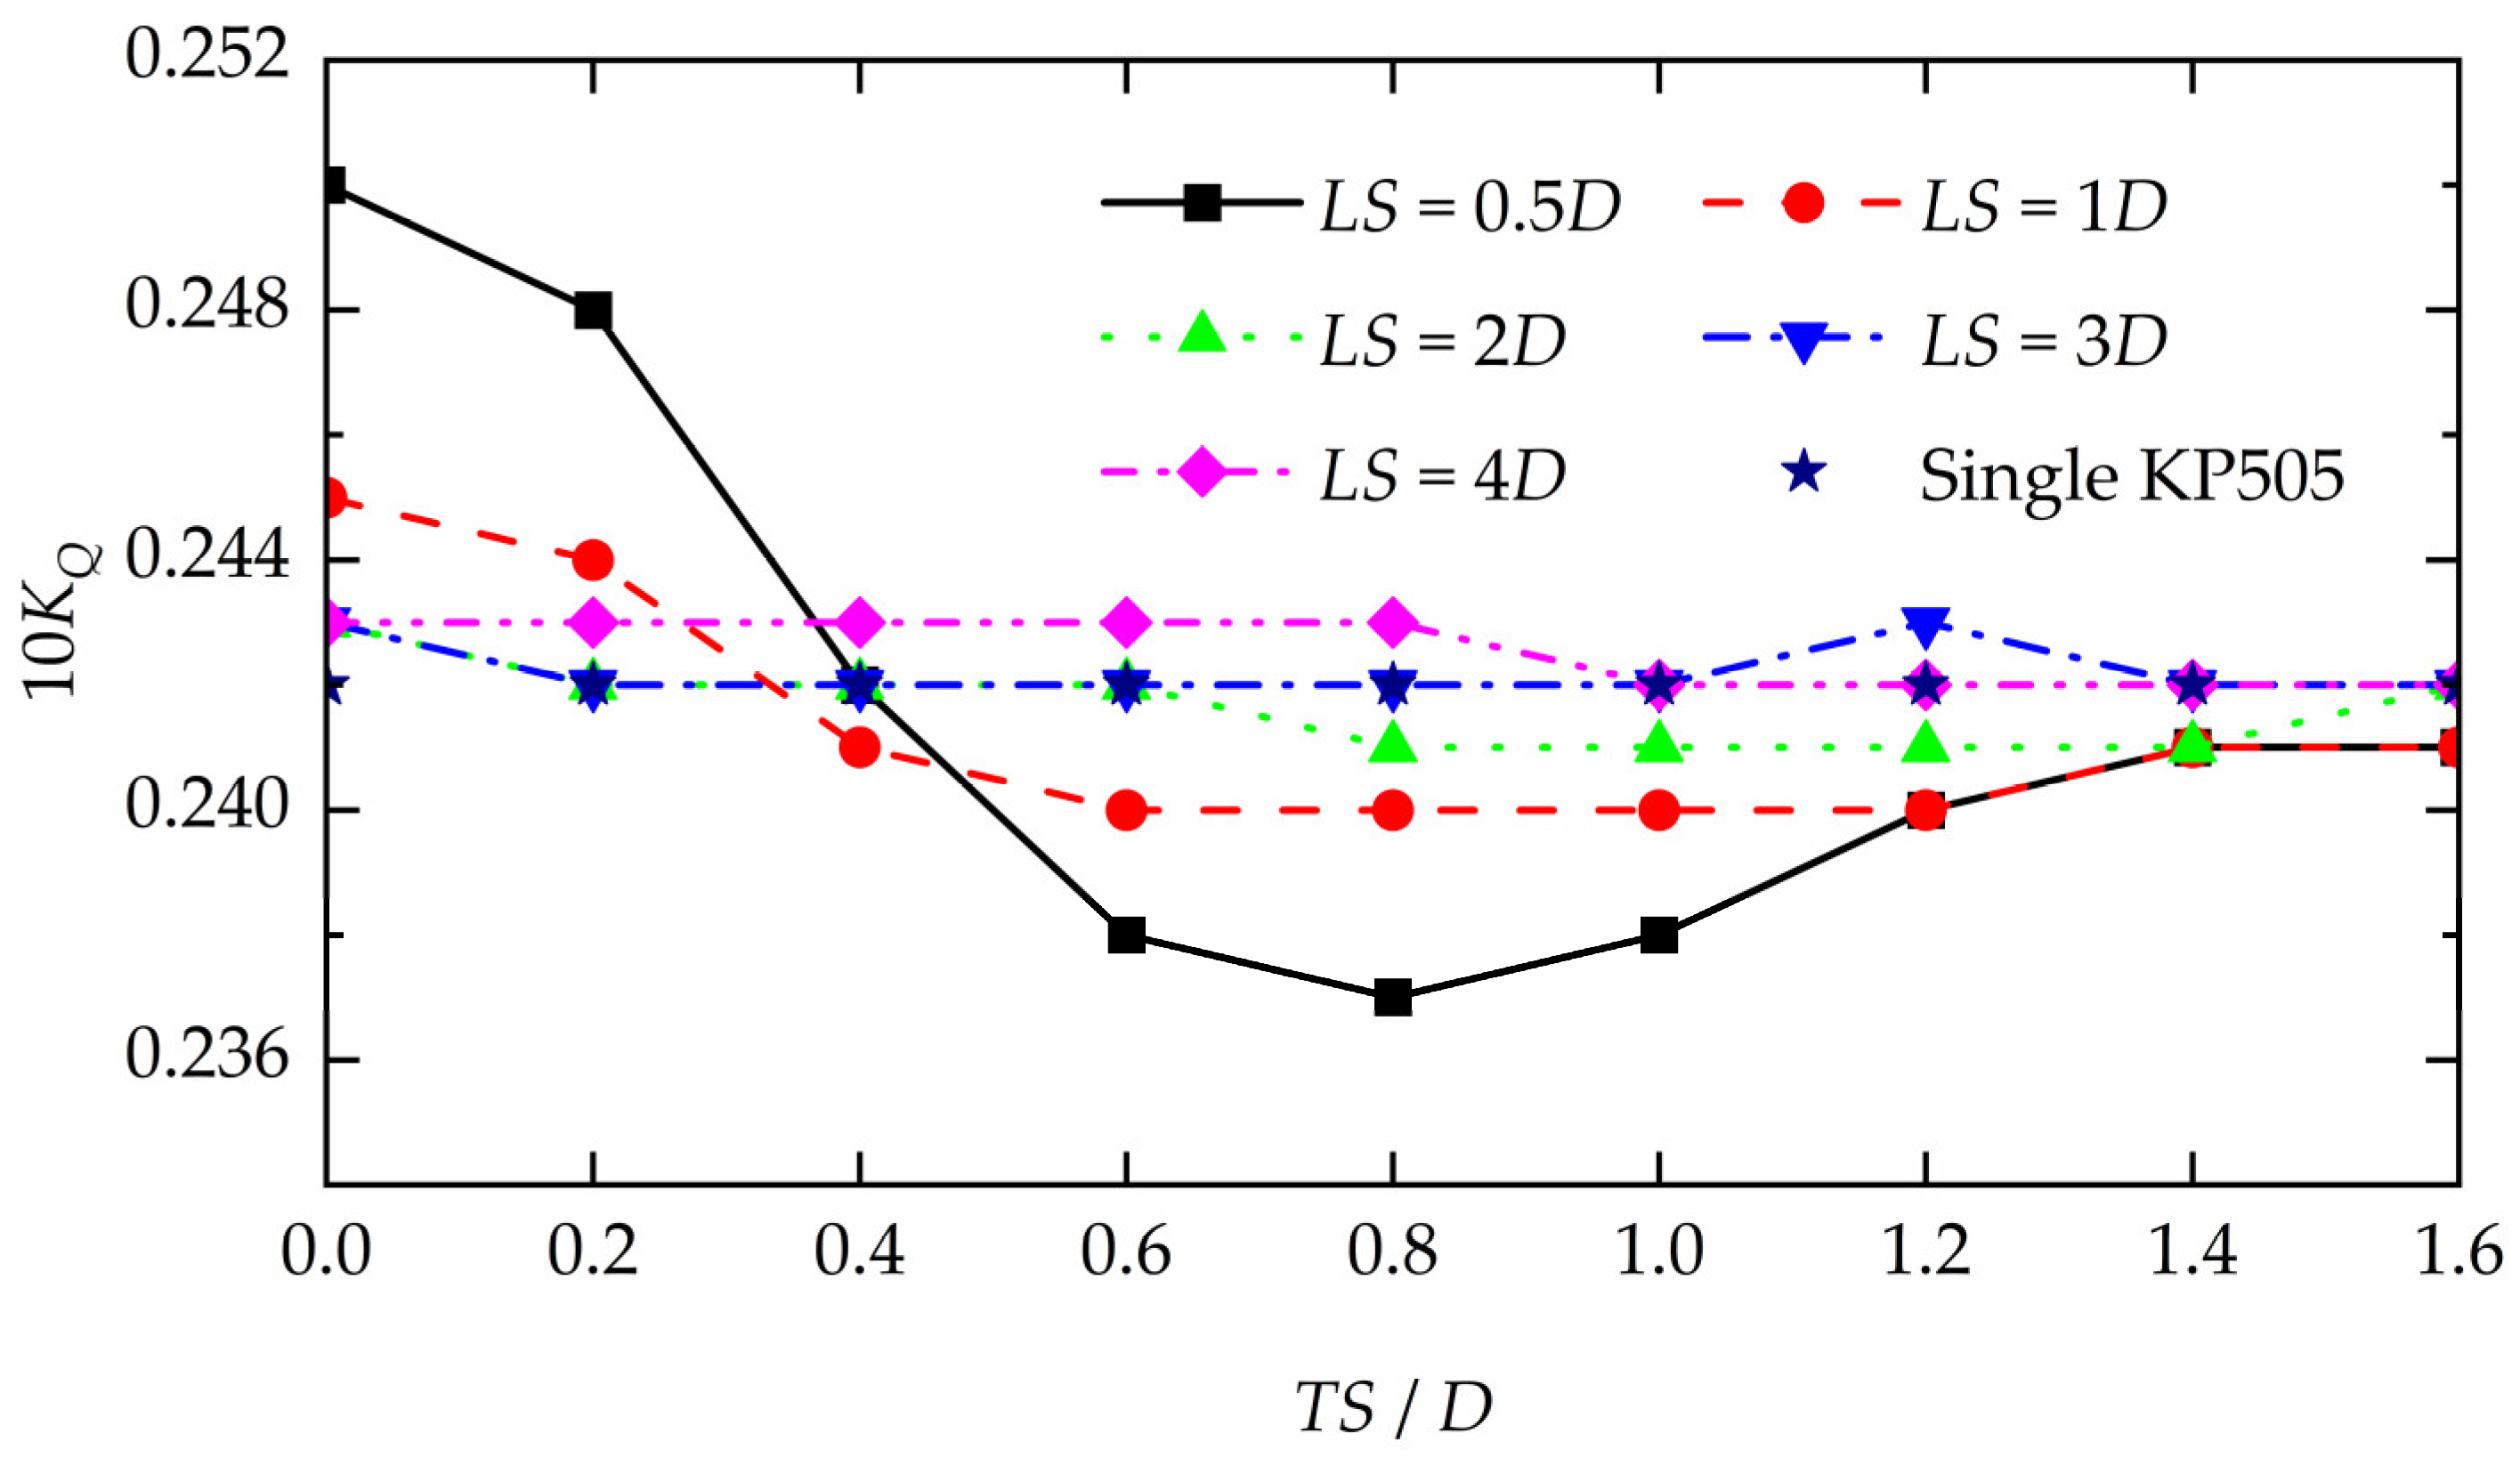
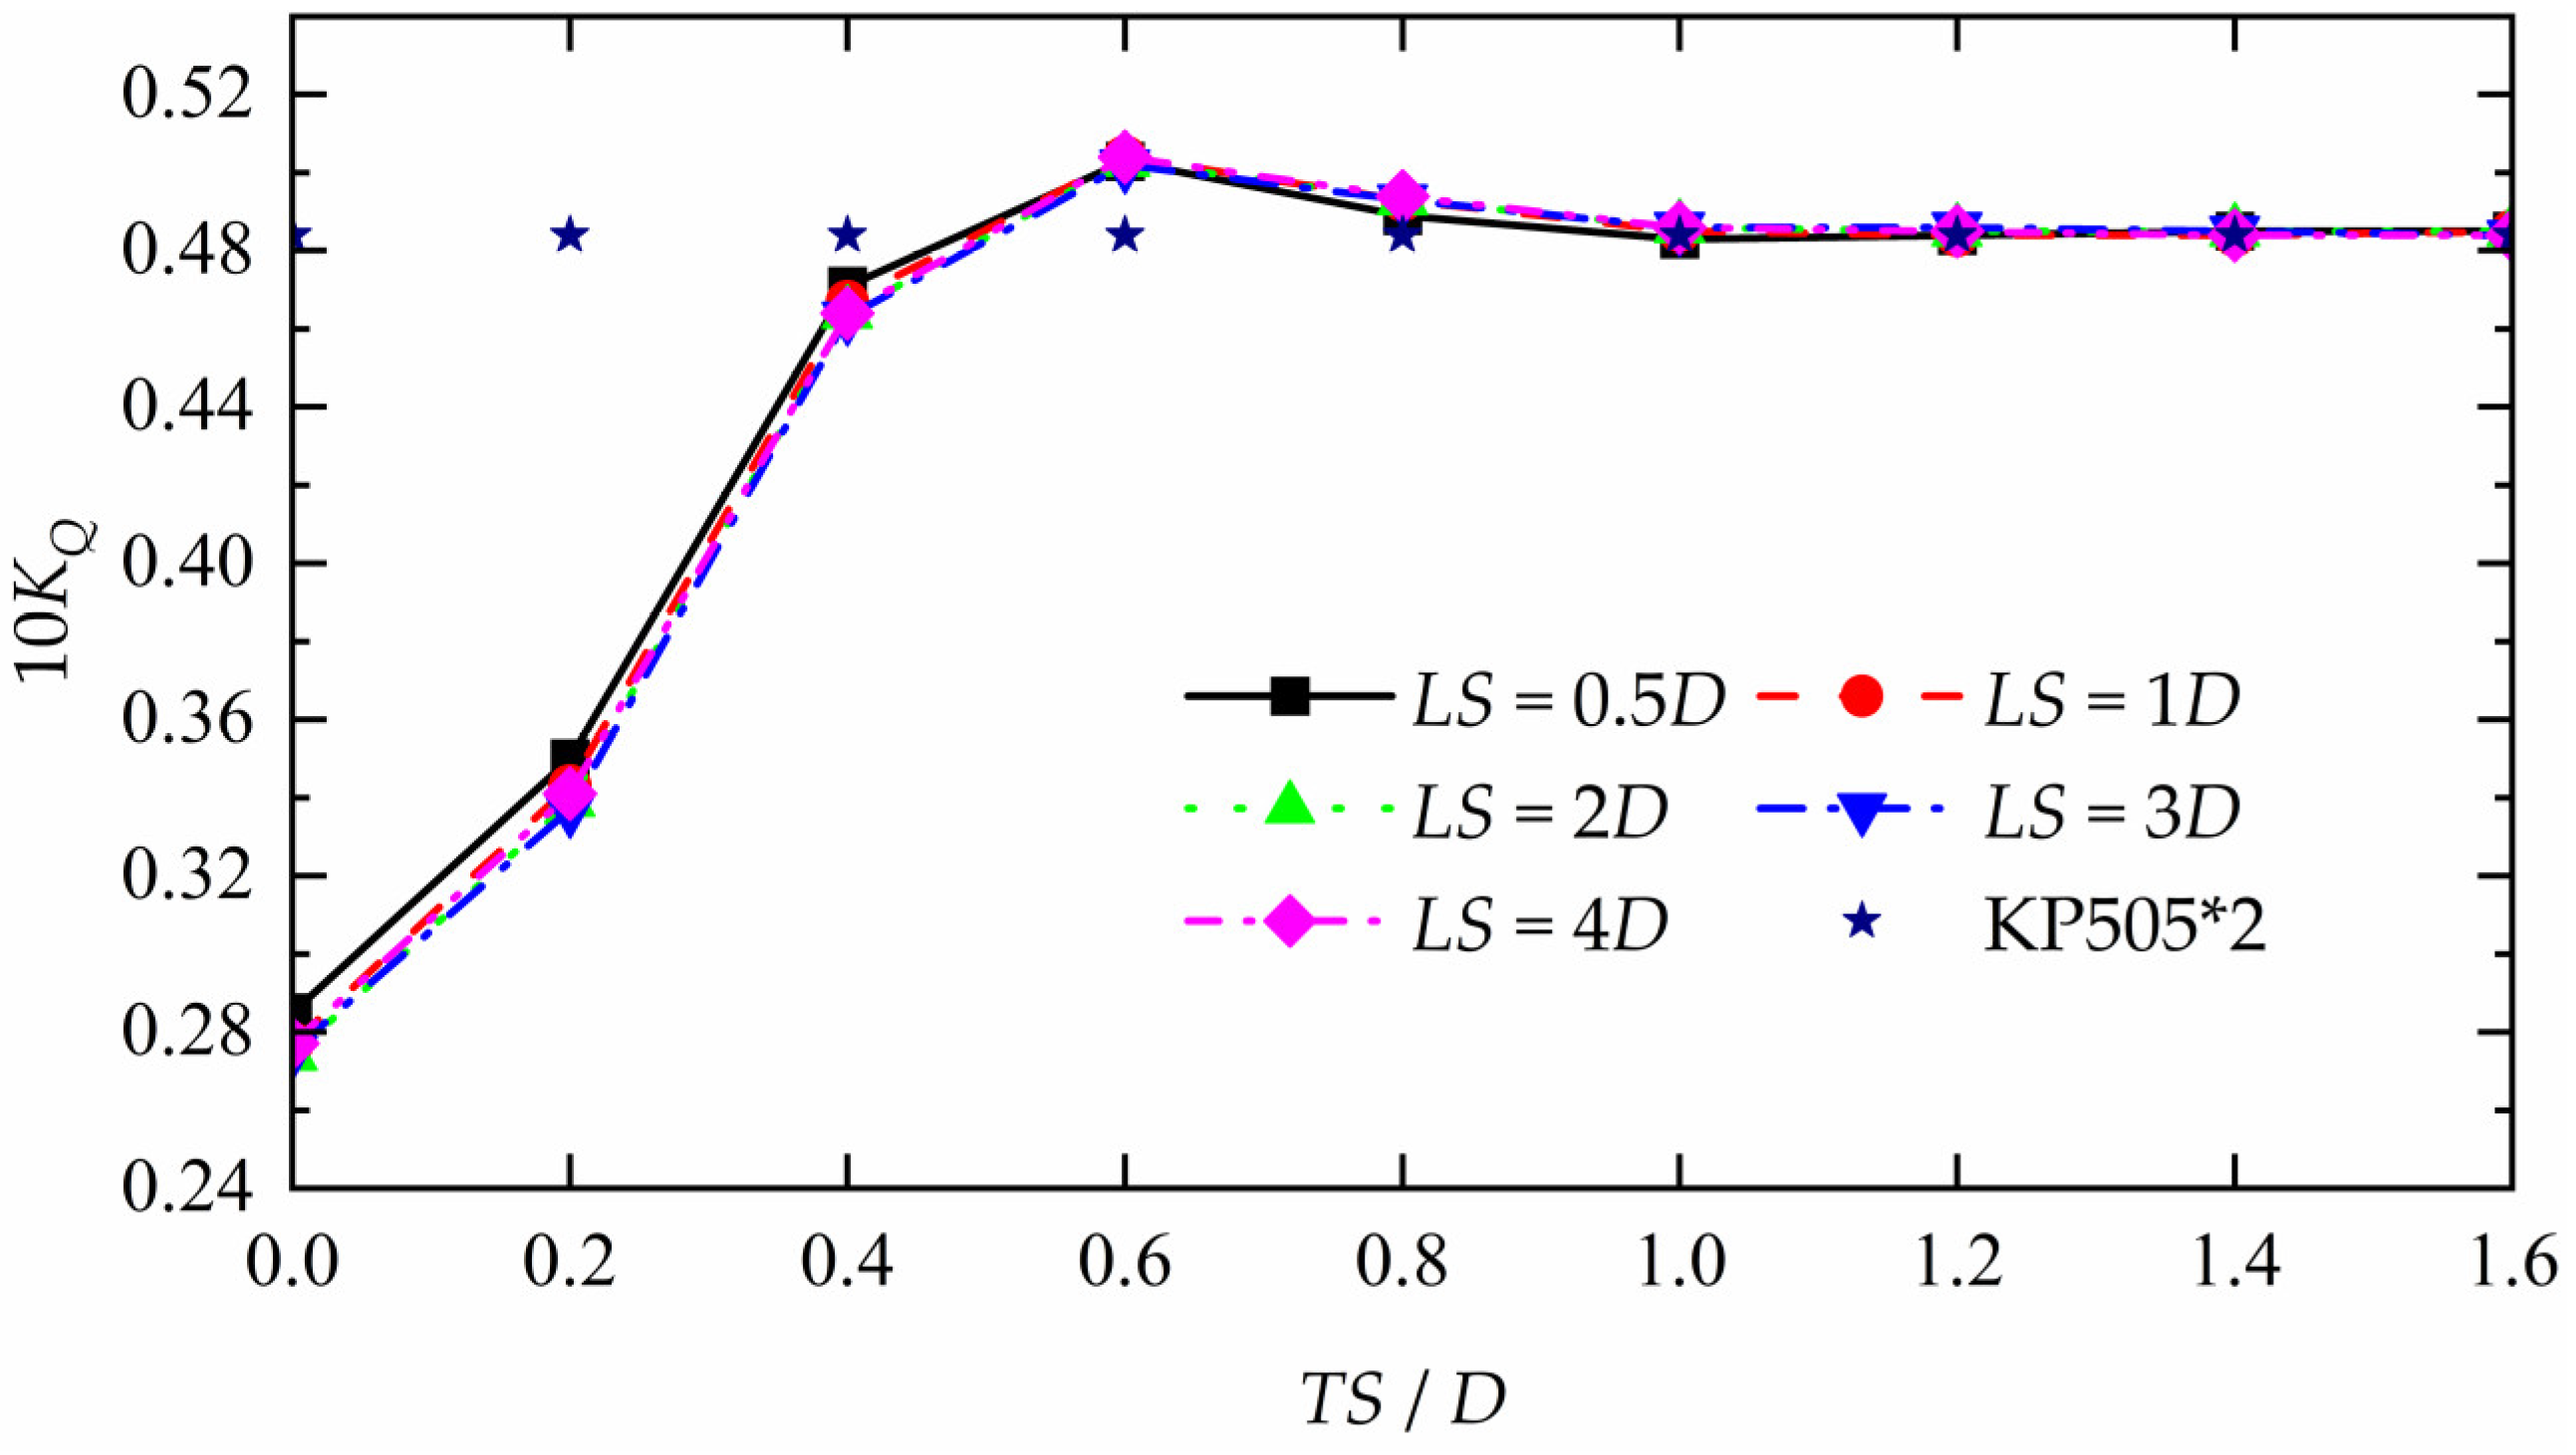
Figure 11.
The 10KQ of the front propeller in different arrangements and single KP505 propeller.
Figure 11.
The 10KQ of the front propeller in different arrangements and single KP505 propeller.
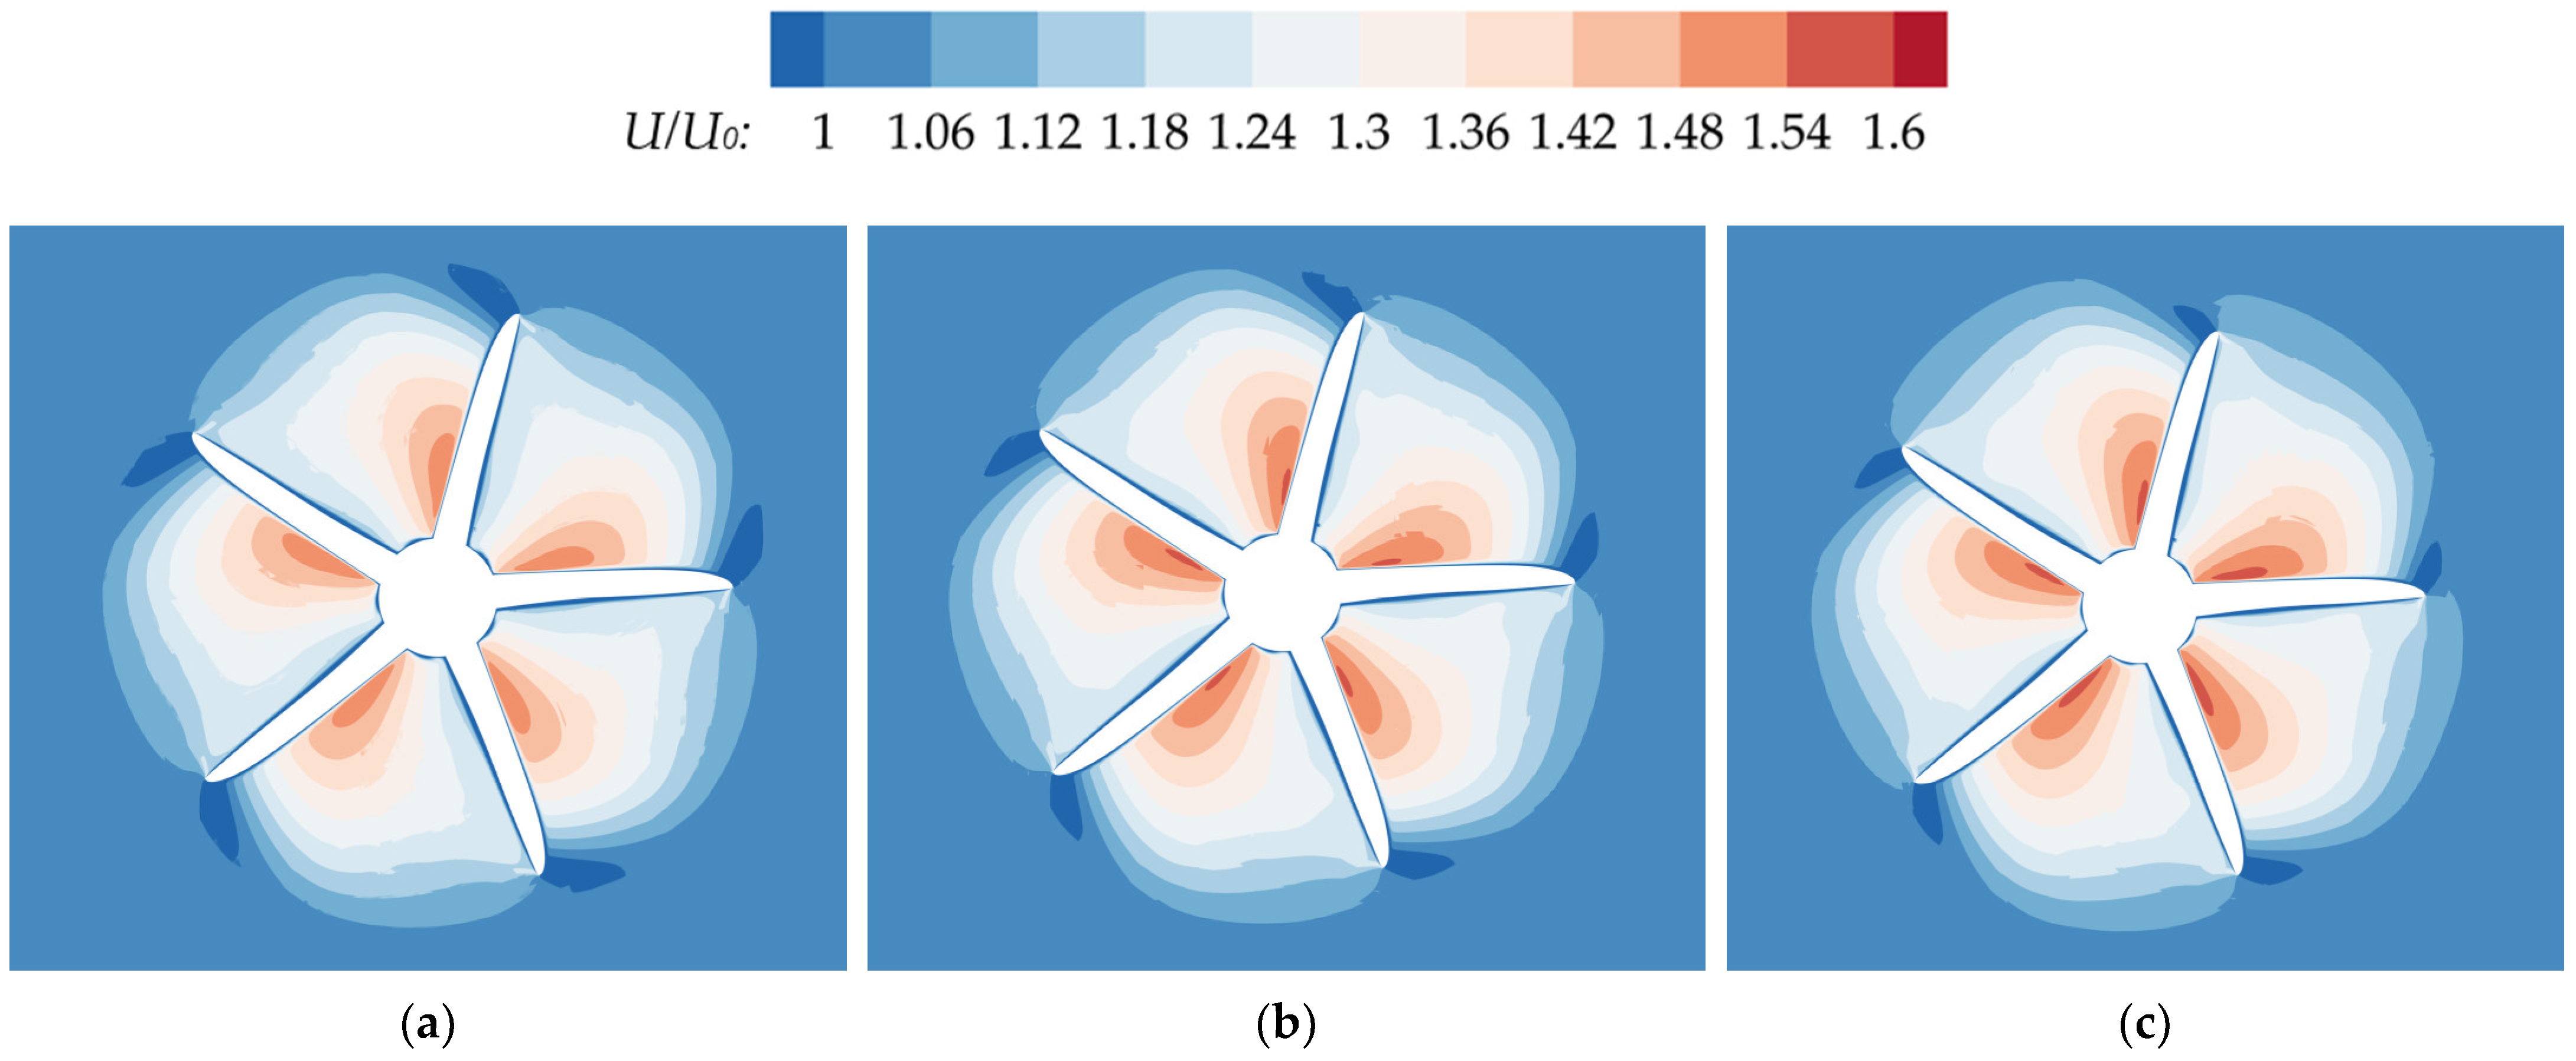
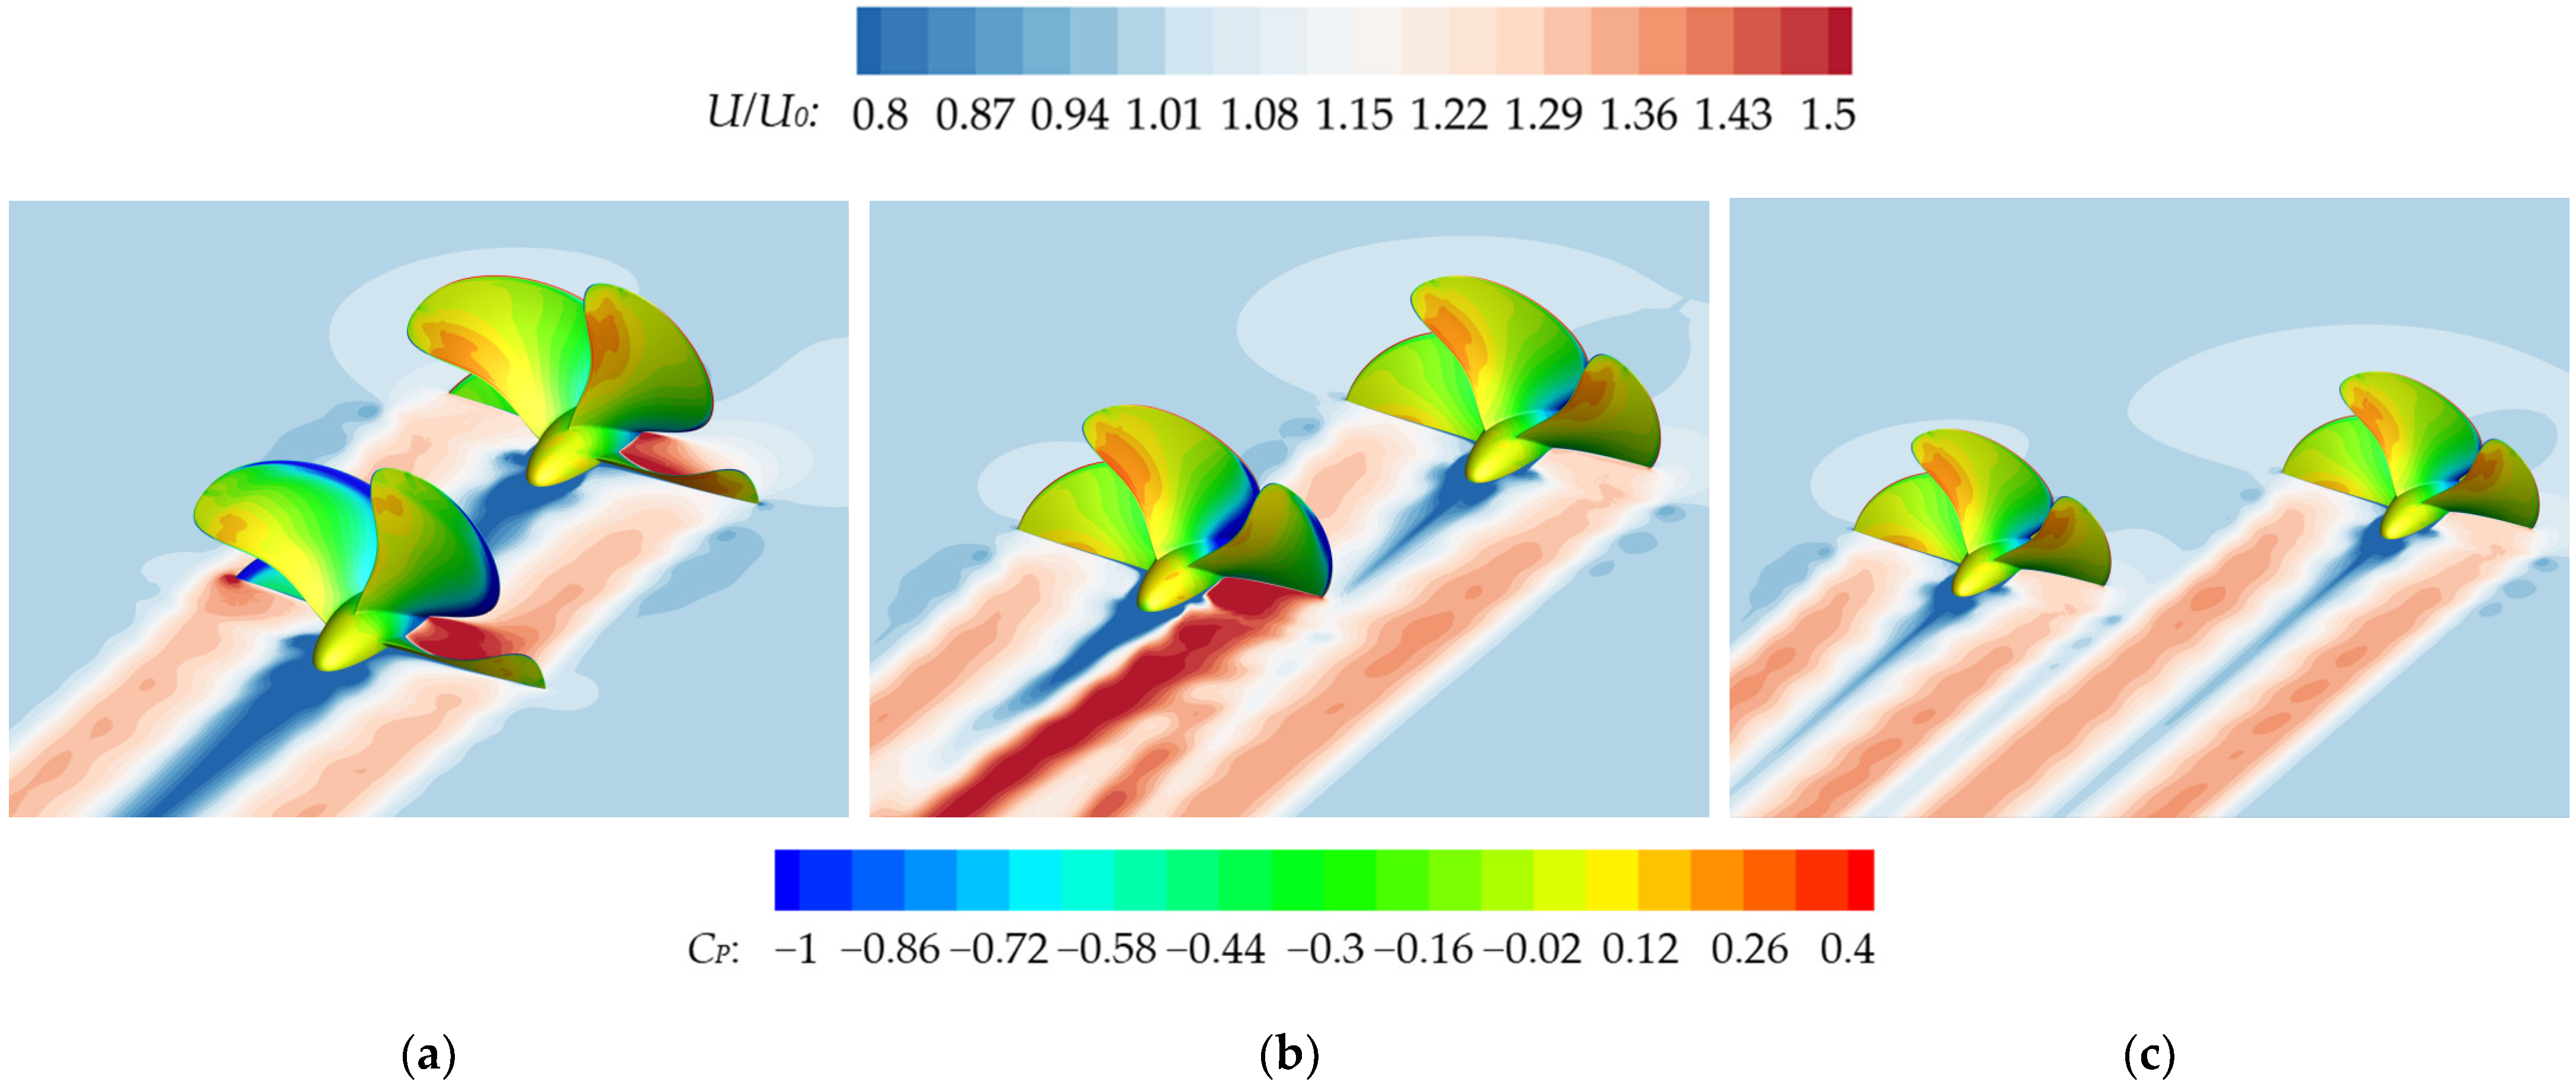
Figure 12.
Comparison of axial velocity distributions between the front propeller plane under different conditions and a single propeller plane (a) C1 (TS = 0, LS = 0.5D); (b) Single propeller; (c) C21 (TS = 0.8D, LS = 0.5D).
Figure 12.
Comparison of axial velocity distributions between the front propeller plane under different conditions and a single propeller plane (a) C1 (TS = 0, LS = 0.5D); (b) Single propeller; (c) C21 (TS = 0.8D, LS = 0.5D).
Figure 13.
The axial velocity distribution on the XOY plane of the flow field at C21 (TS = 0.8D, LS = 0.5D).
Figure 13.
The axial velocity distribution on the XOY plane of the flow field at C21 (TS = 0.8D, LS = 0.5D).
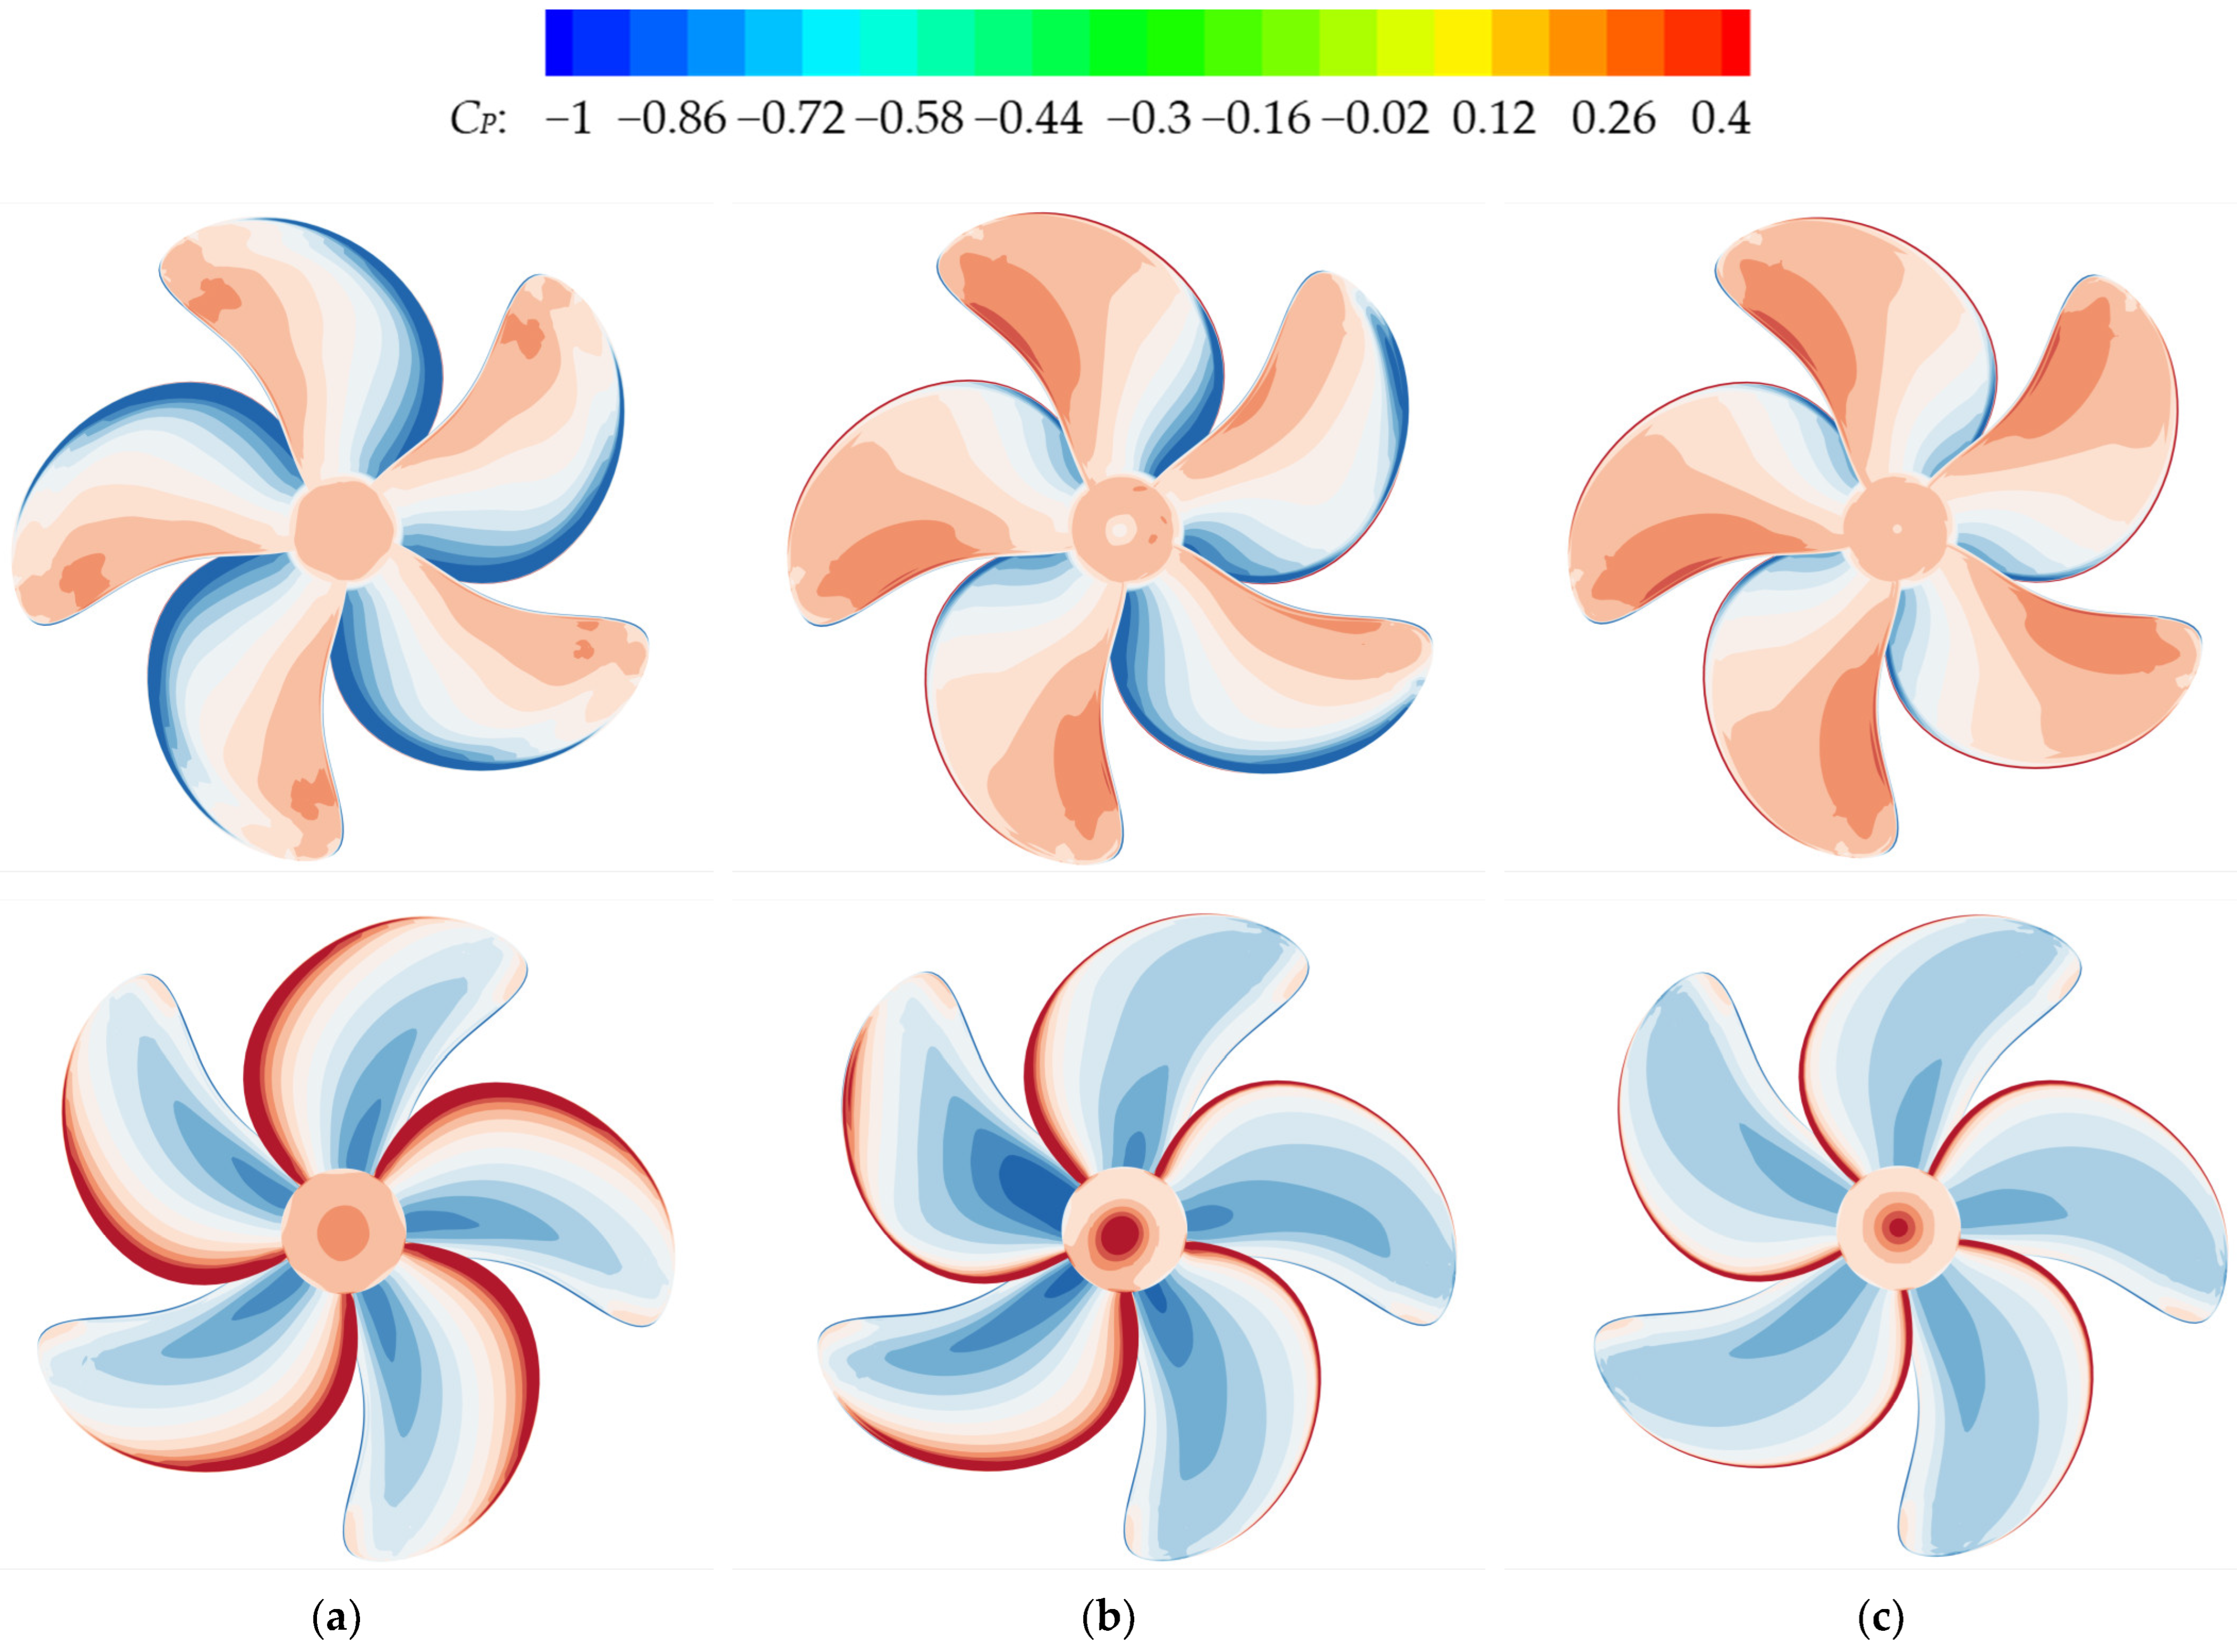
Figure 14.
Pressure distributions on the front propeller surfaces at C1 and C21, compared to those of a single KP505 propeller: (a) C1 (TS = 0, LS = 0.5D); (b) Single propeller; (c) C21 (TS = 0.8D, LS = 0.5D).
Figure 14.
Pressure distributions on the front propeller surfaces at C1 and C21, compared to those of a single KP505 propeller: (a) C1 (TS = 0, LS = 0.5D); (b) Single propeller; (c) C21 (TS = 0.8D, LS = 0.5D).
Figure 15.
The KT of the rear propeller in different arrangements.
Figure 15.
The KT of the rear propeller in different arrangements.
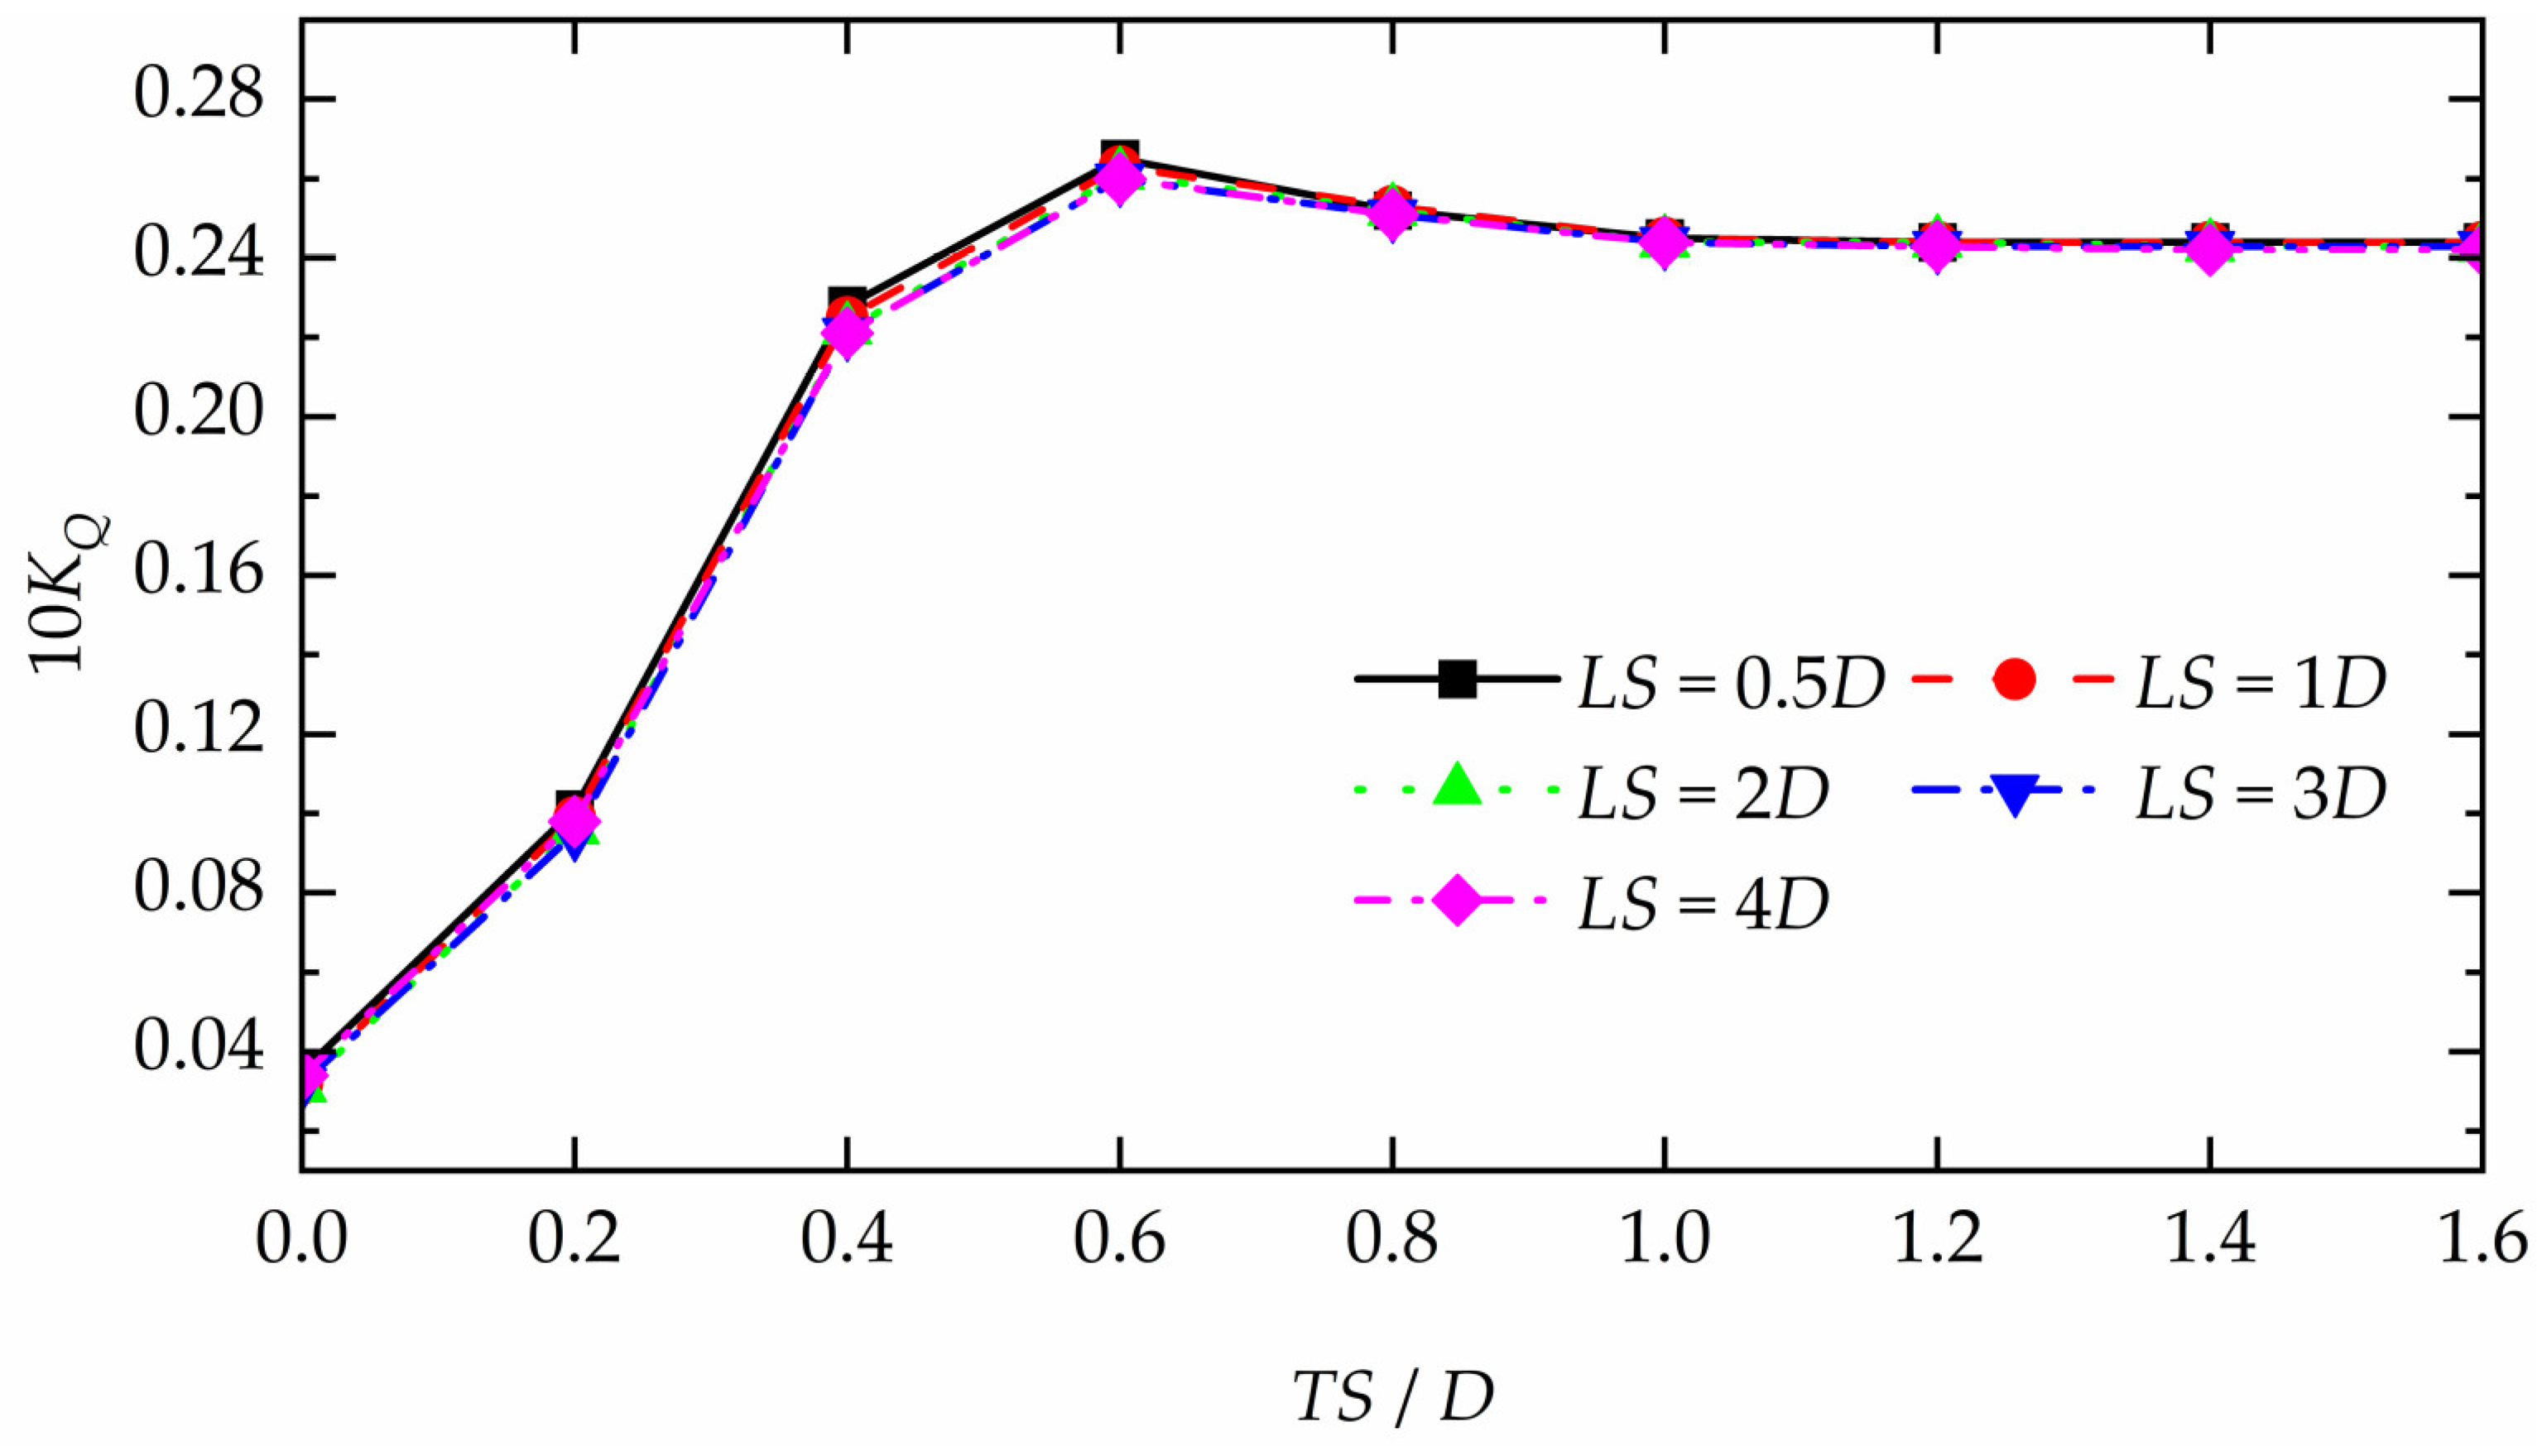
Figure 16.
The 10KQ of the rear propeller in different arrangements.
Figure 16.
The 10KQ of the rear propeller in different arrangements.
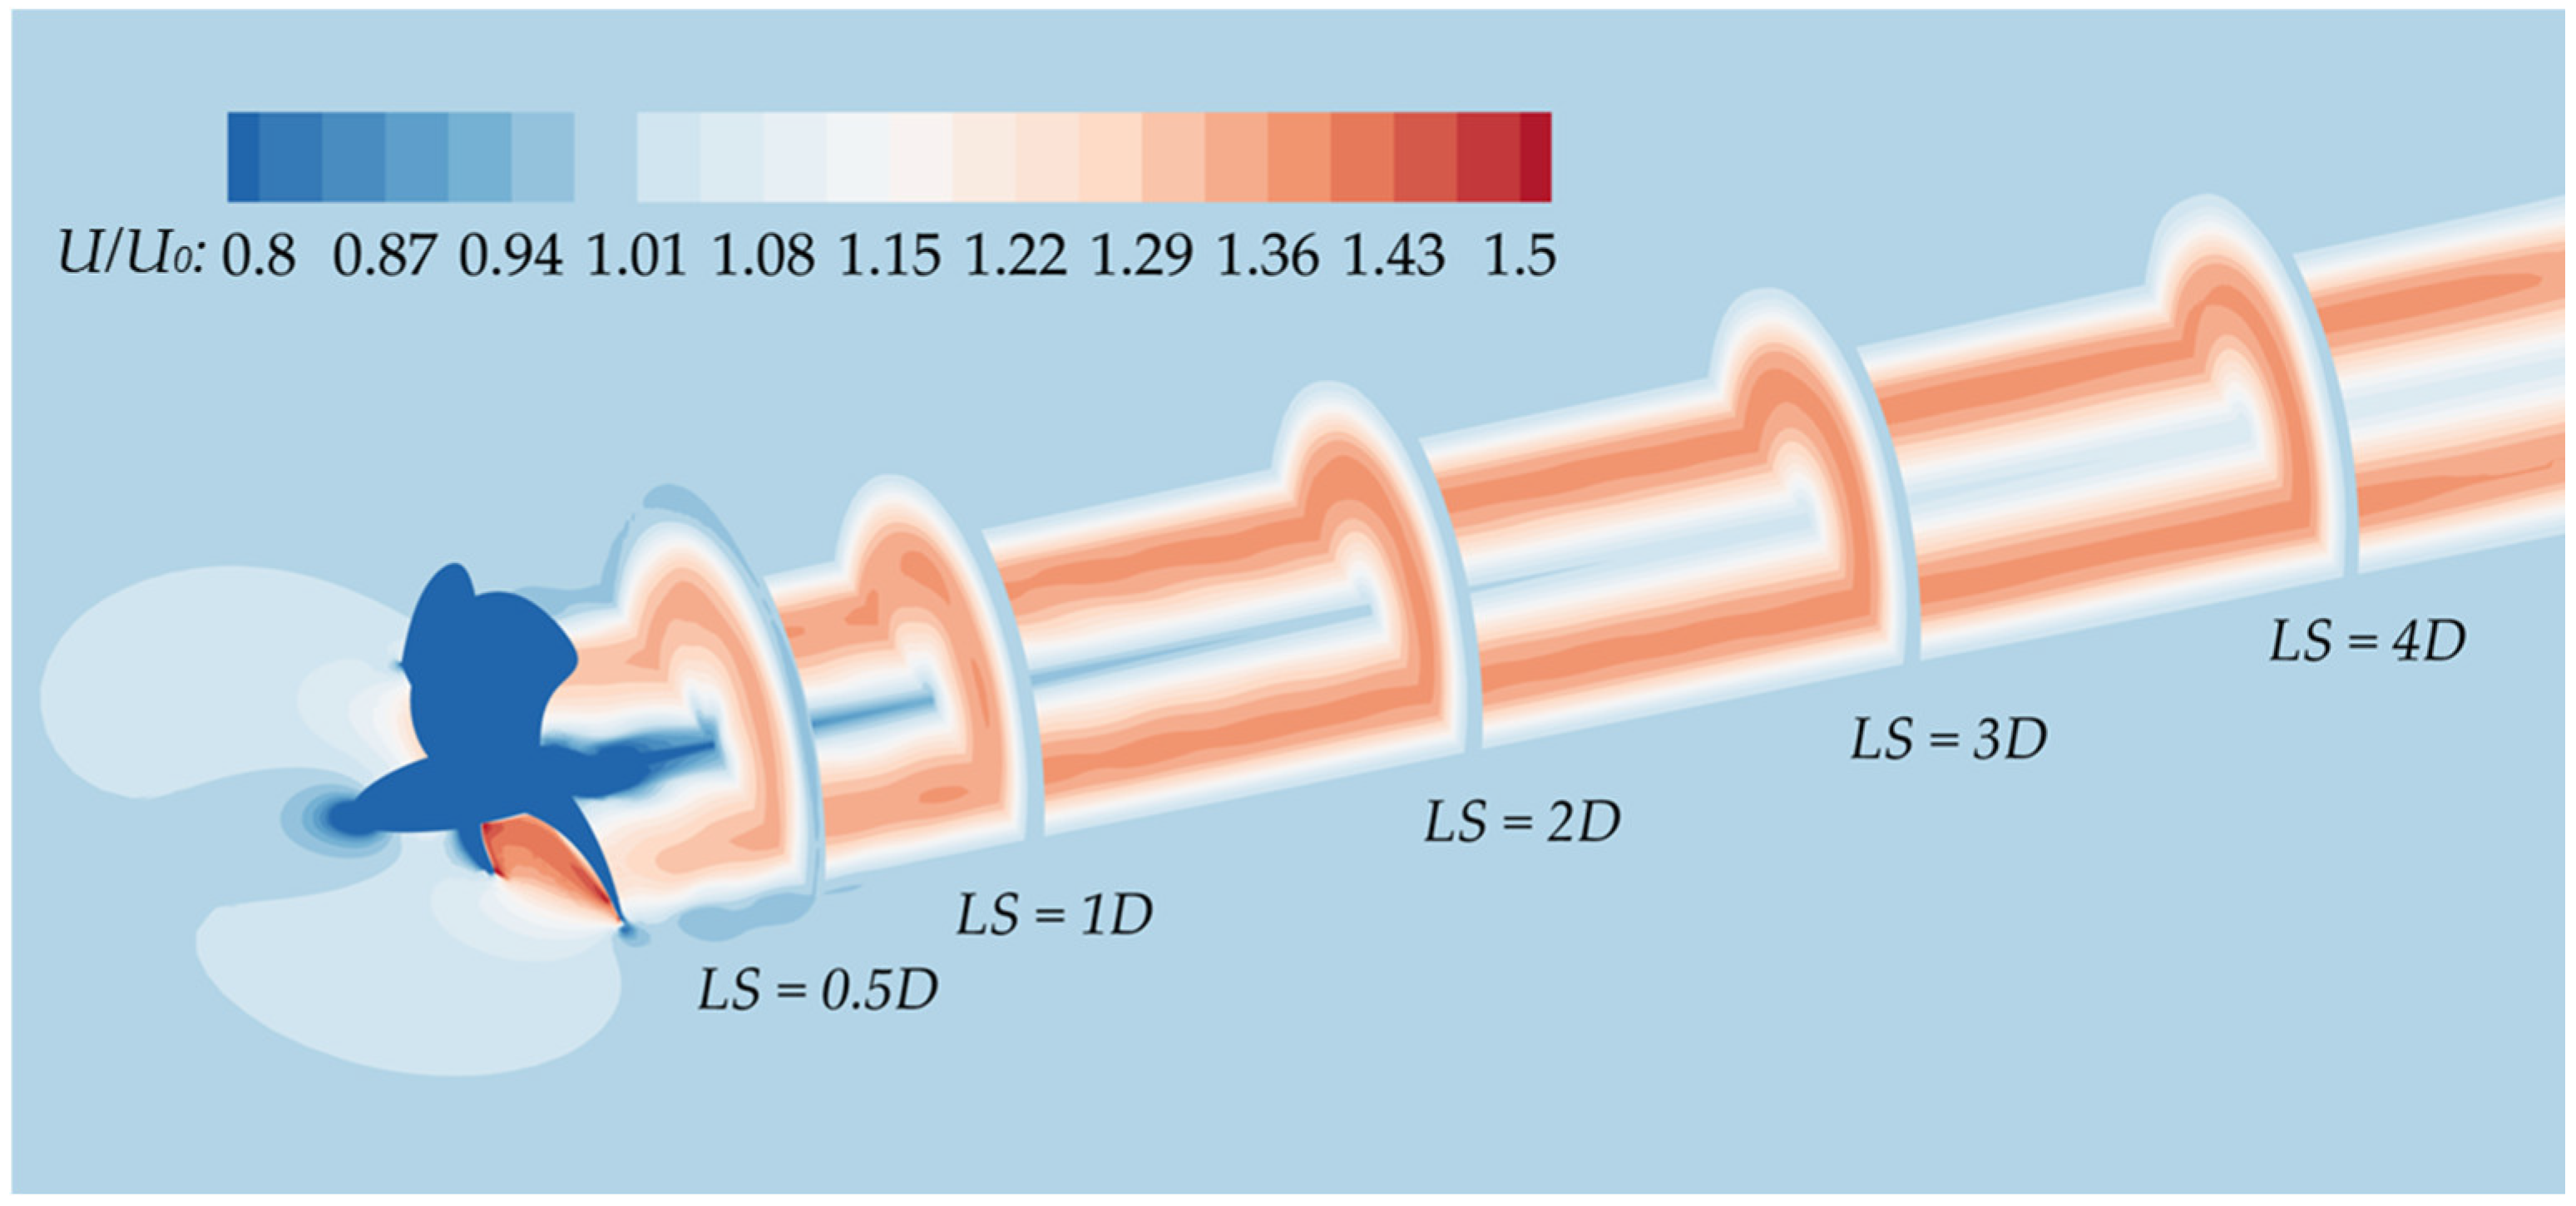
Figure 17.
The axial velocity of the KP505 propeller wake at different longitudinal positions.
Figure 17.
The axial velocity of the KP505 propeller wake at different longitudinal positions.
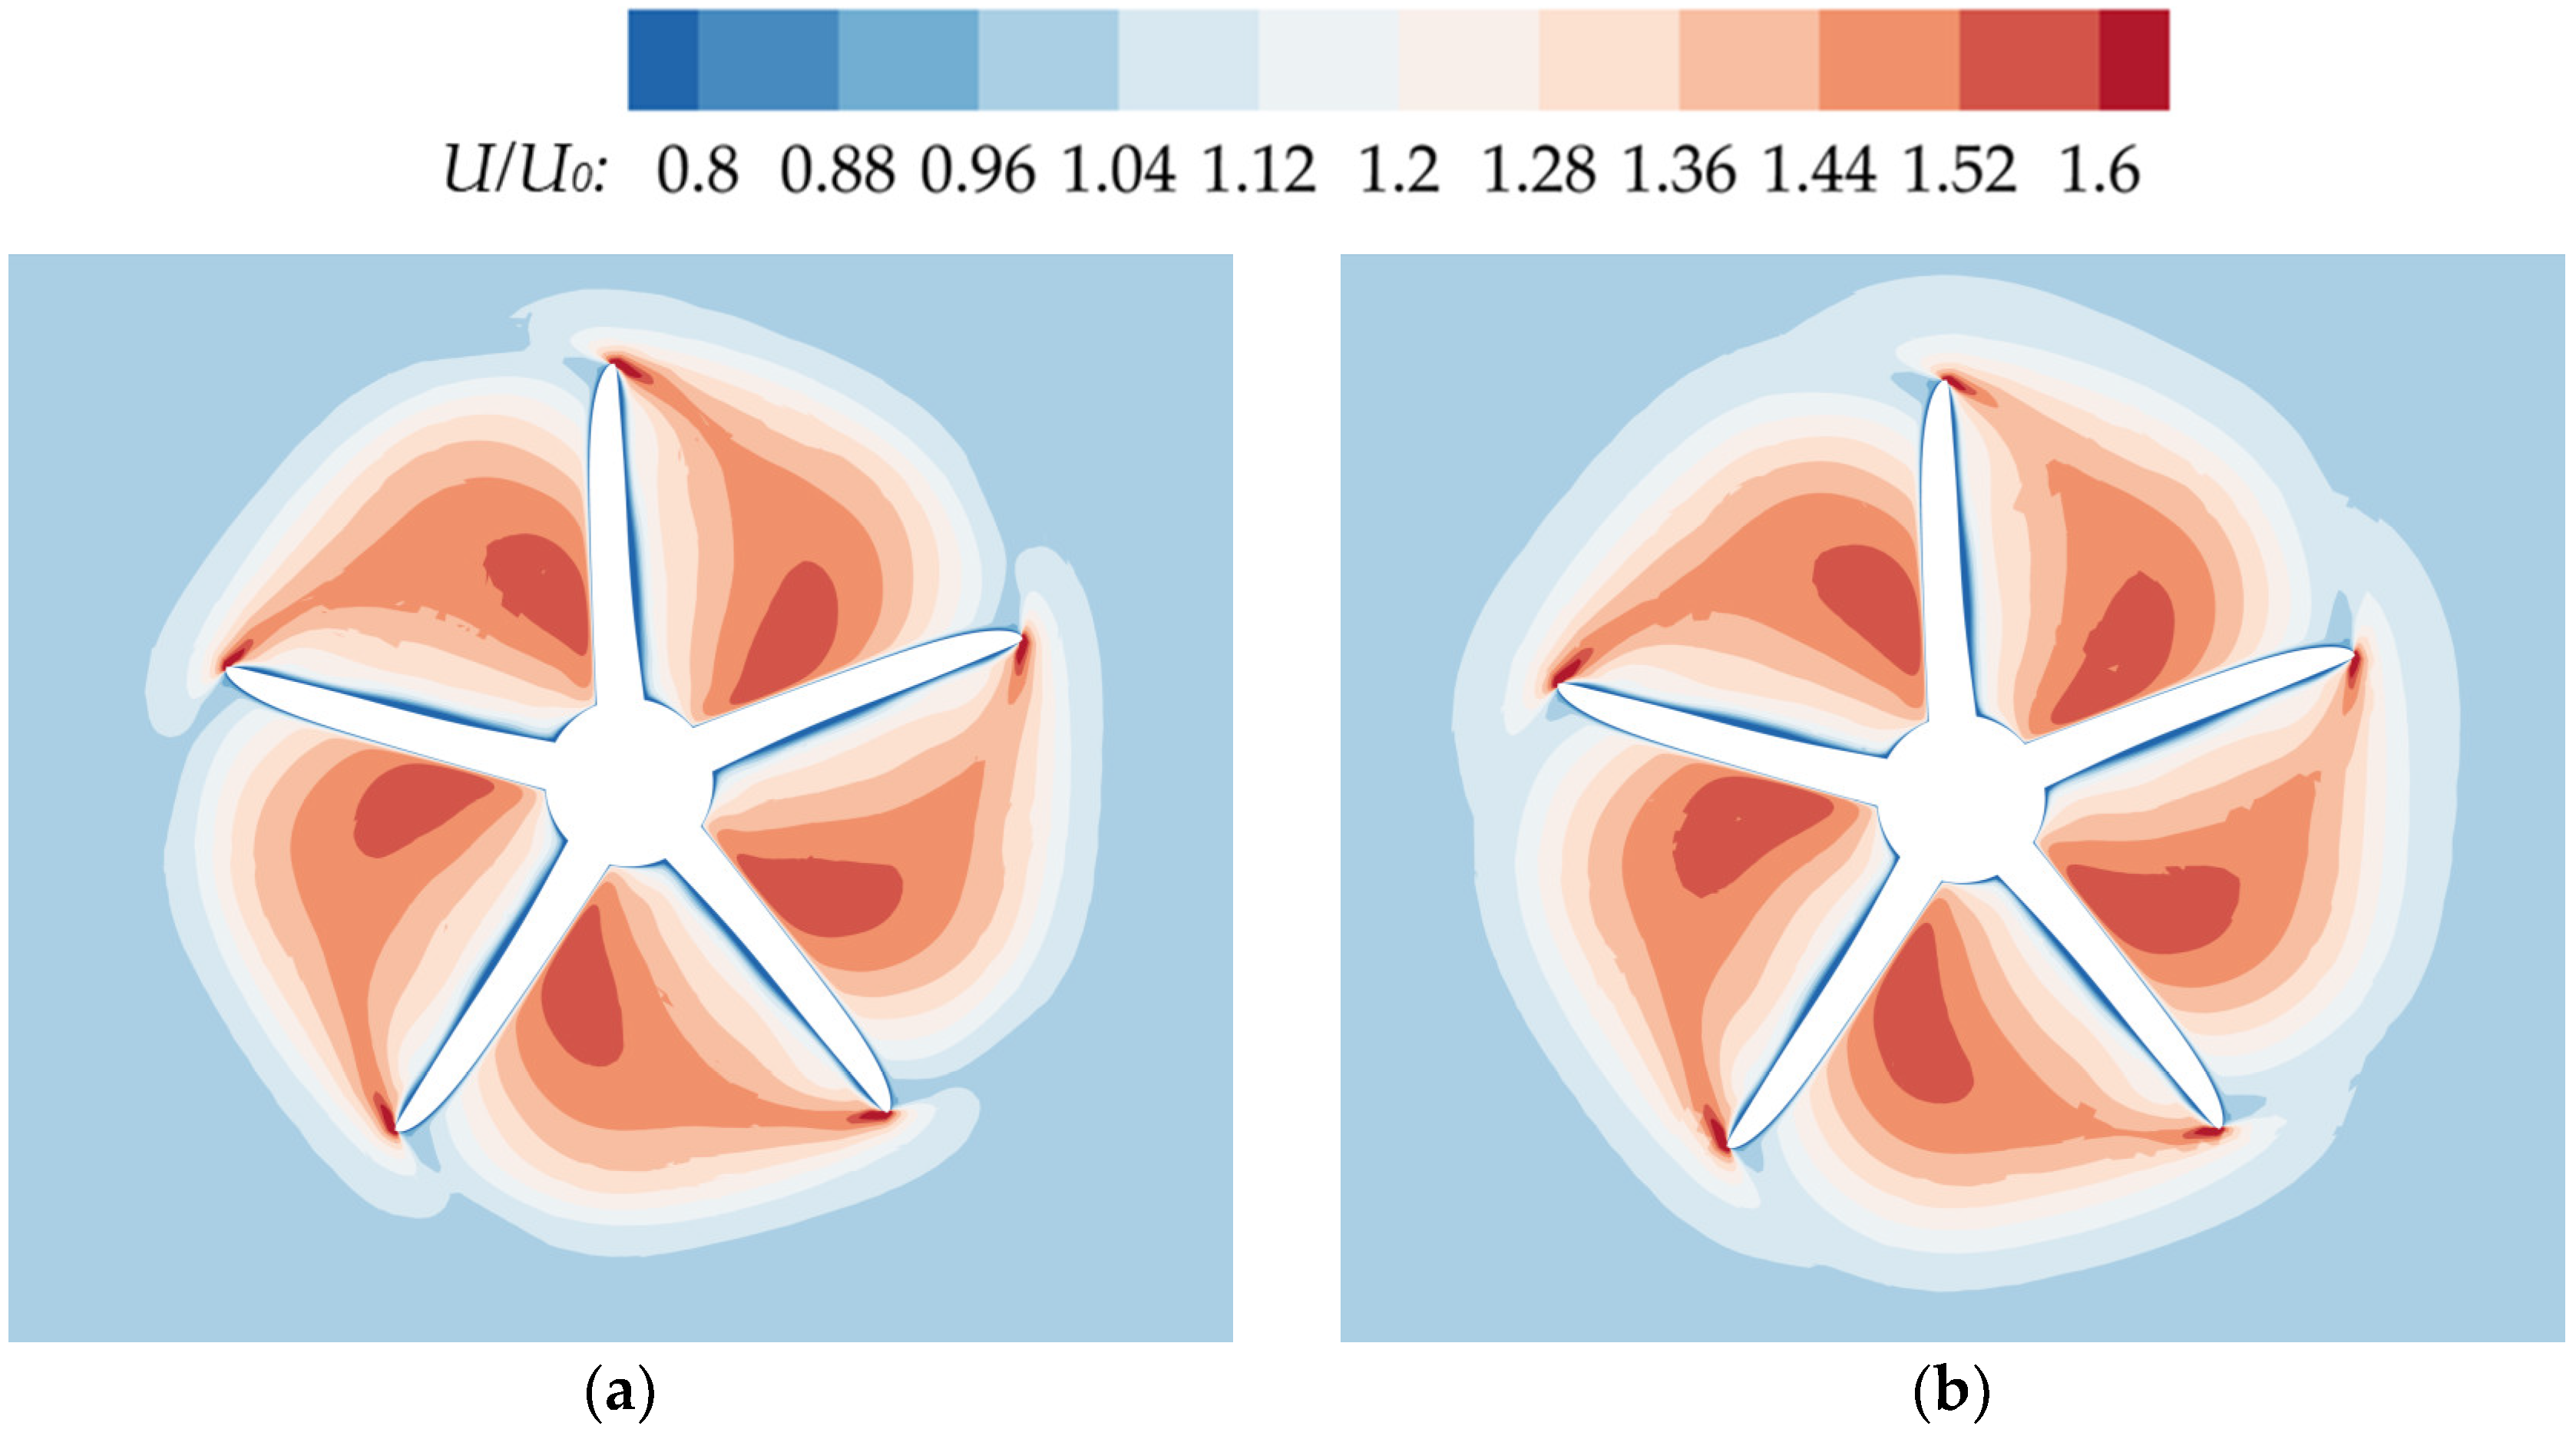
Figure 18.
The axial velocity distributions on the rear propeller plane at different longitudinal spacings: (a) C2 (TS = 0, LS = 1D; (b) C5 (TS = 0, LS = 4D).
Figure 18.
The axial velocity distributions on the rear propeller plane at different longitudinal spacings: (a) C2 (TS = 0, LS = 1D; (b) C5 (TS = 0, LS = 4D).
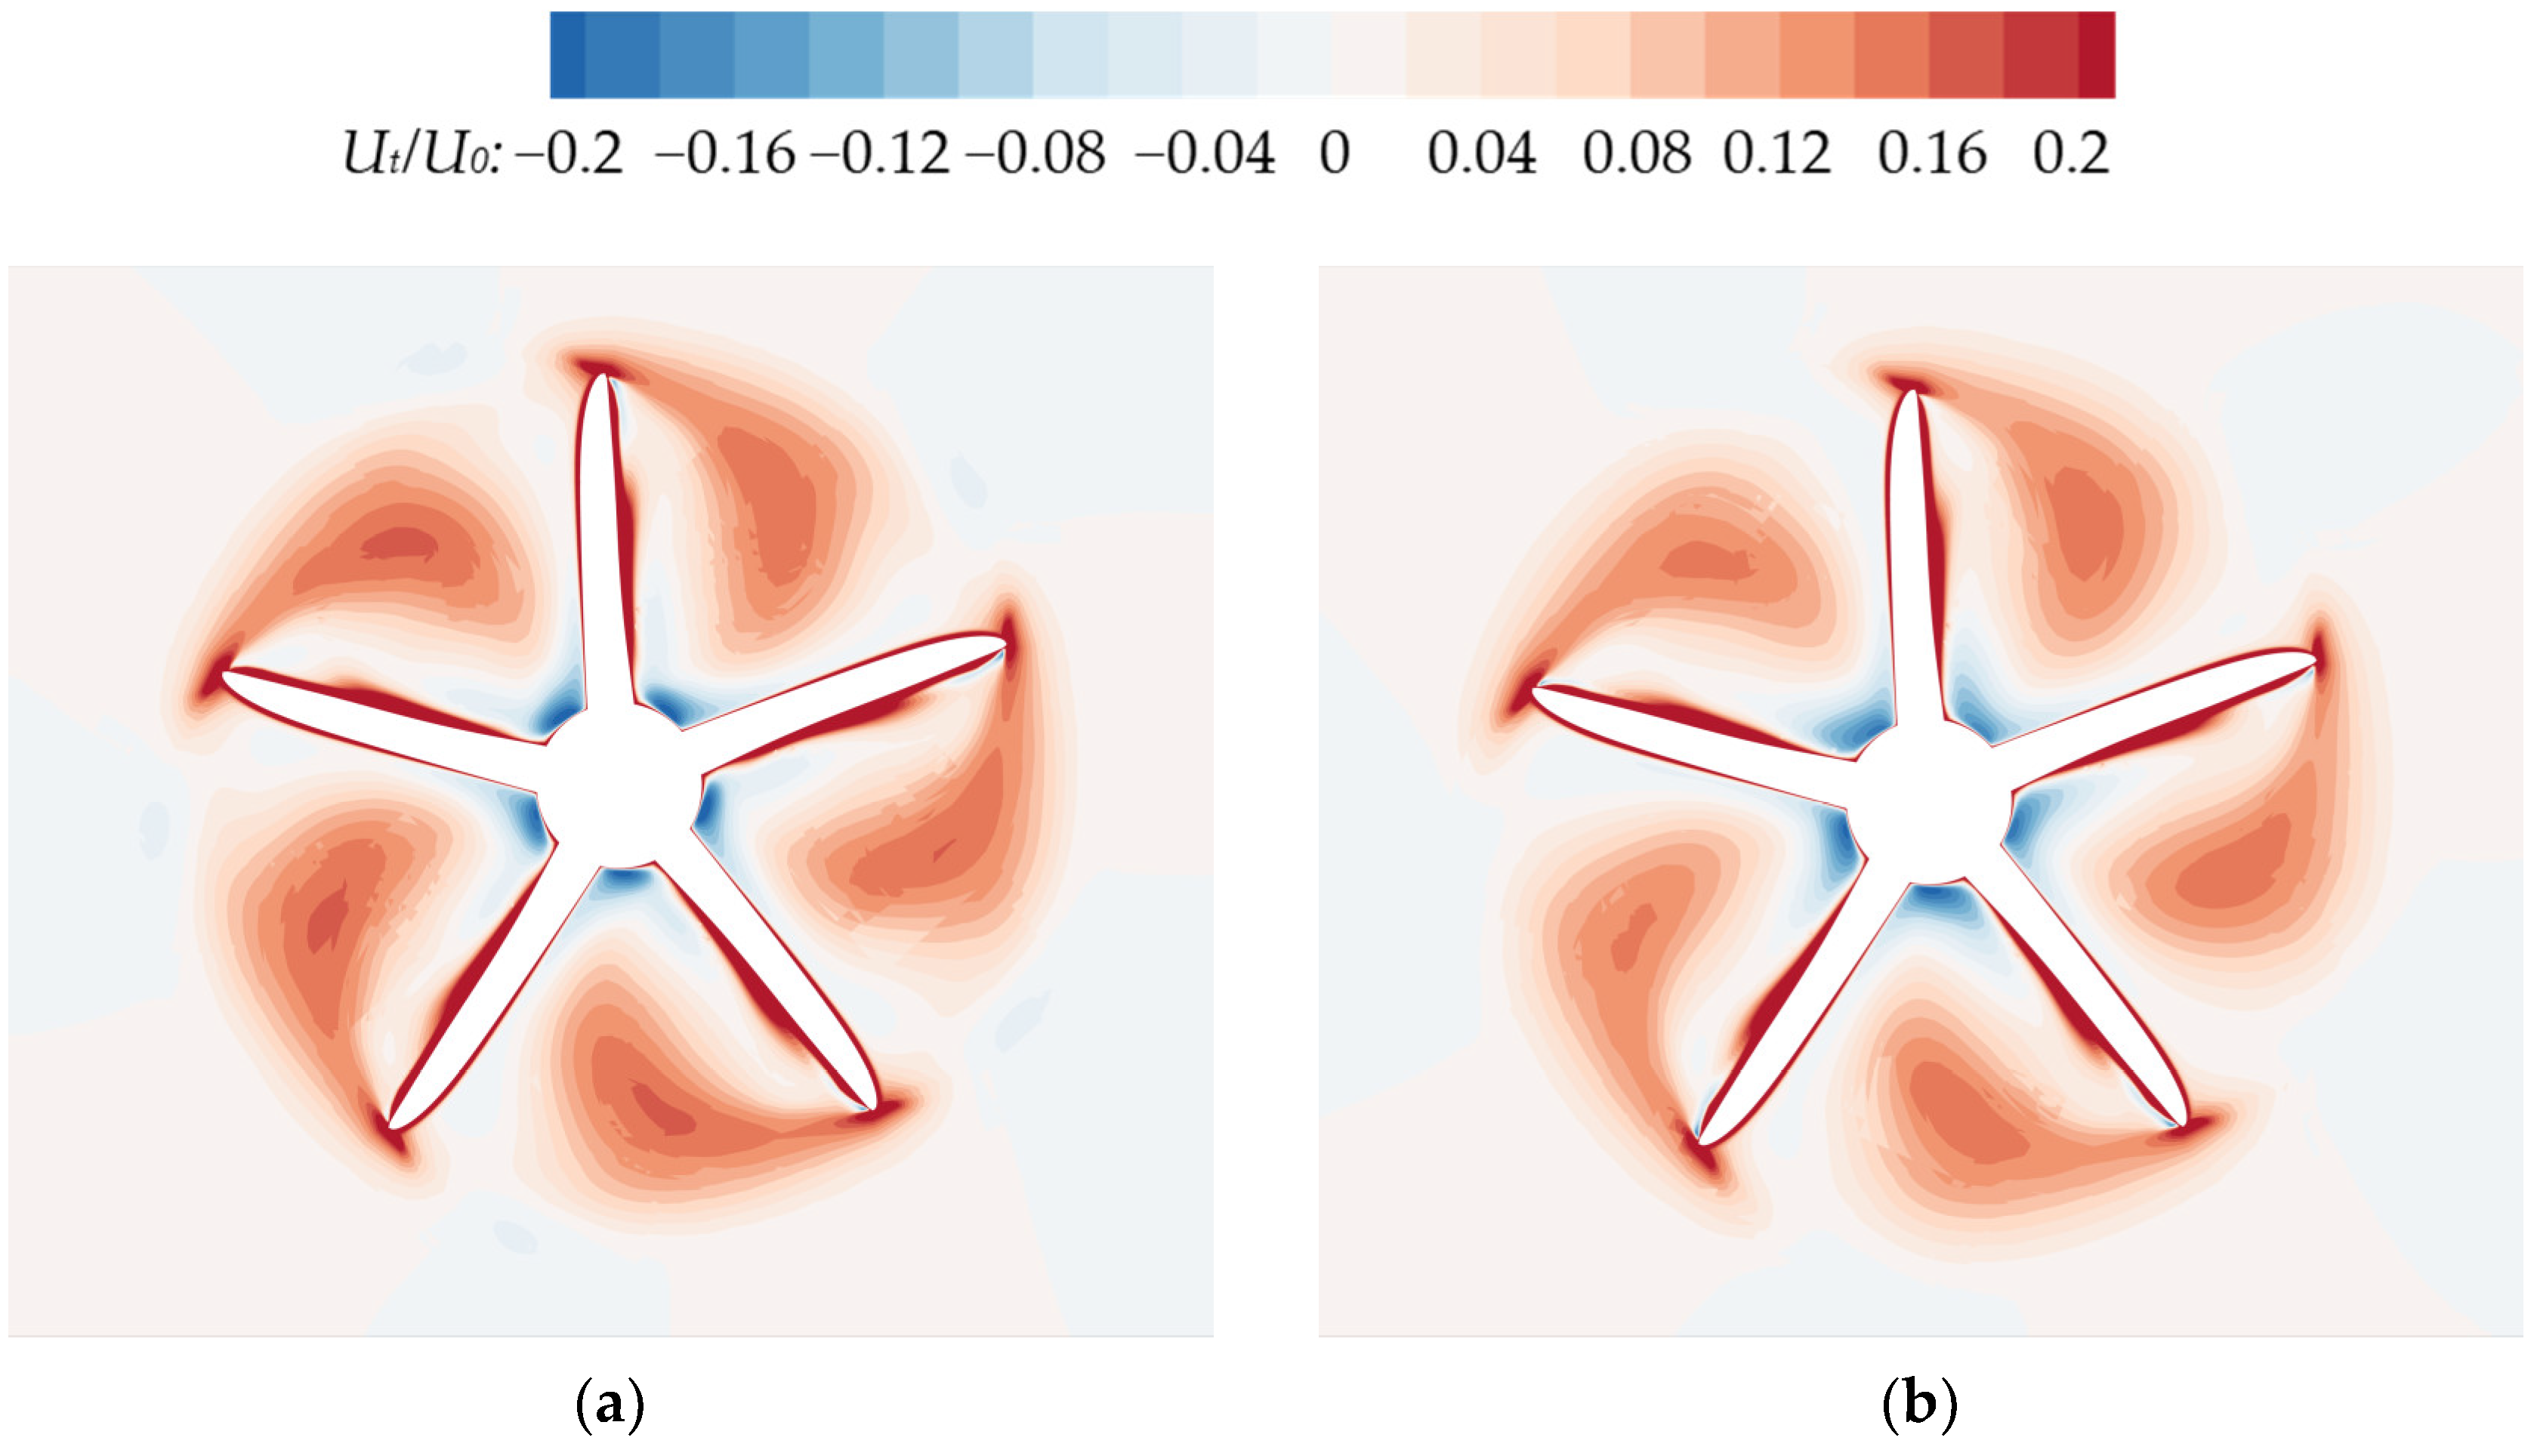
Figure 19.
The tangential velocity distributions on the rear propeller plane at different longitudinal spacings: (a) C2 (TS = 0, LS = 1D; (b) C5 (TS = 0, LS = 4D).
Figure 19.
The tangential velocity distributions on the rear propeller plane at different longitudinal spacings: (a) C2 (TS = 0, LS = 1D; (b) C5 (TS = 0, LS = 4D).
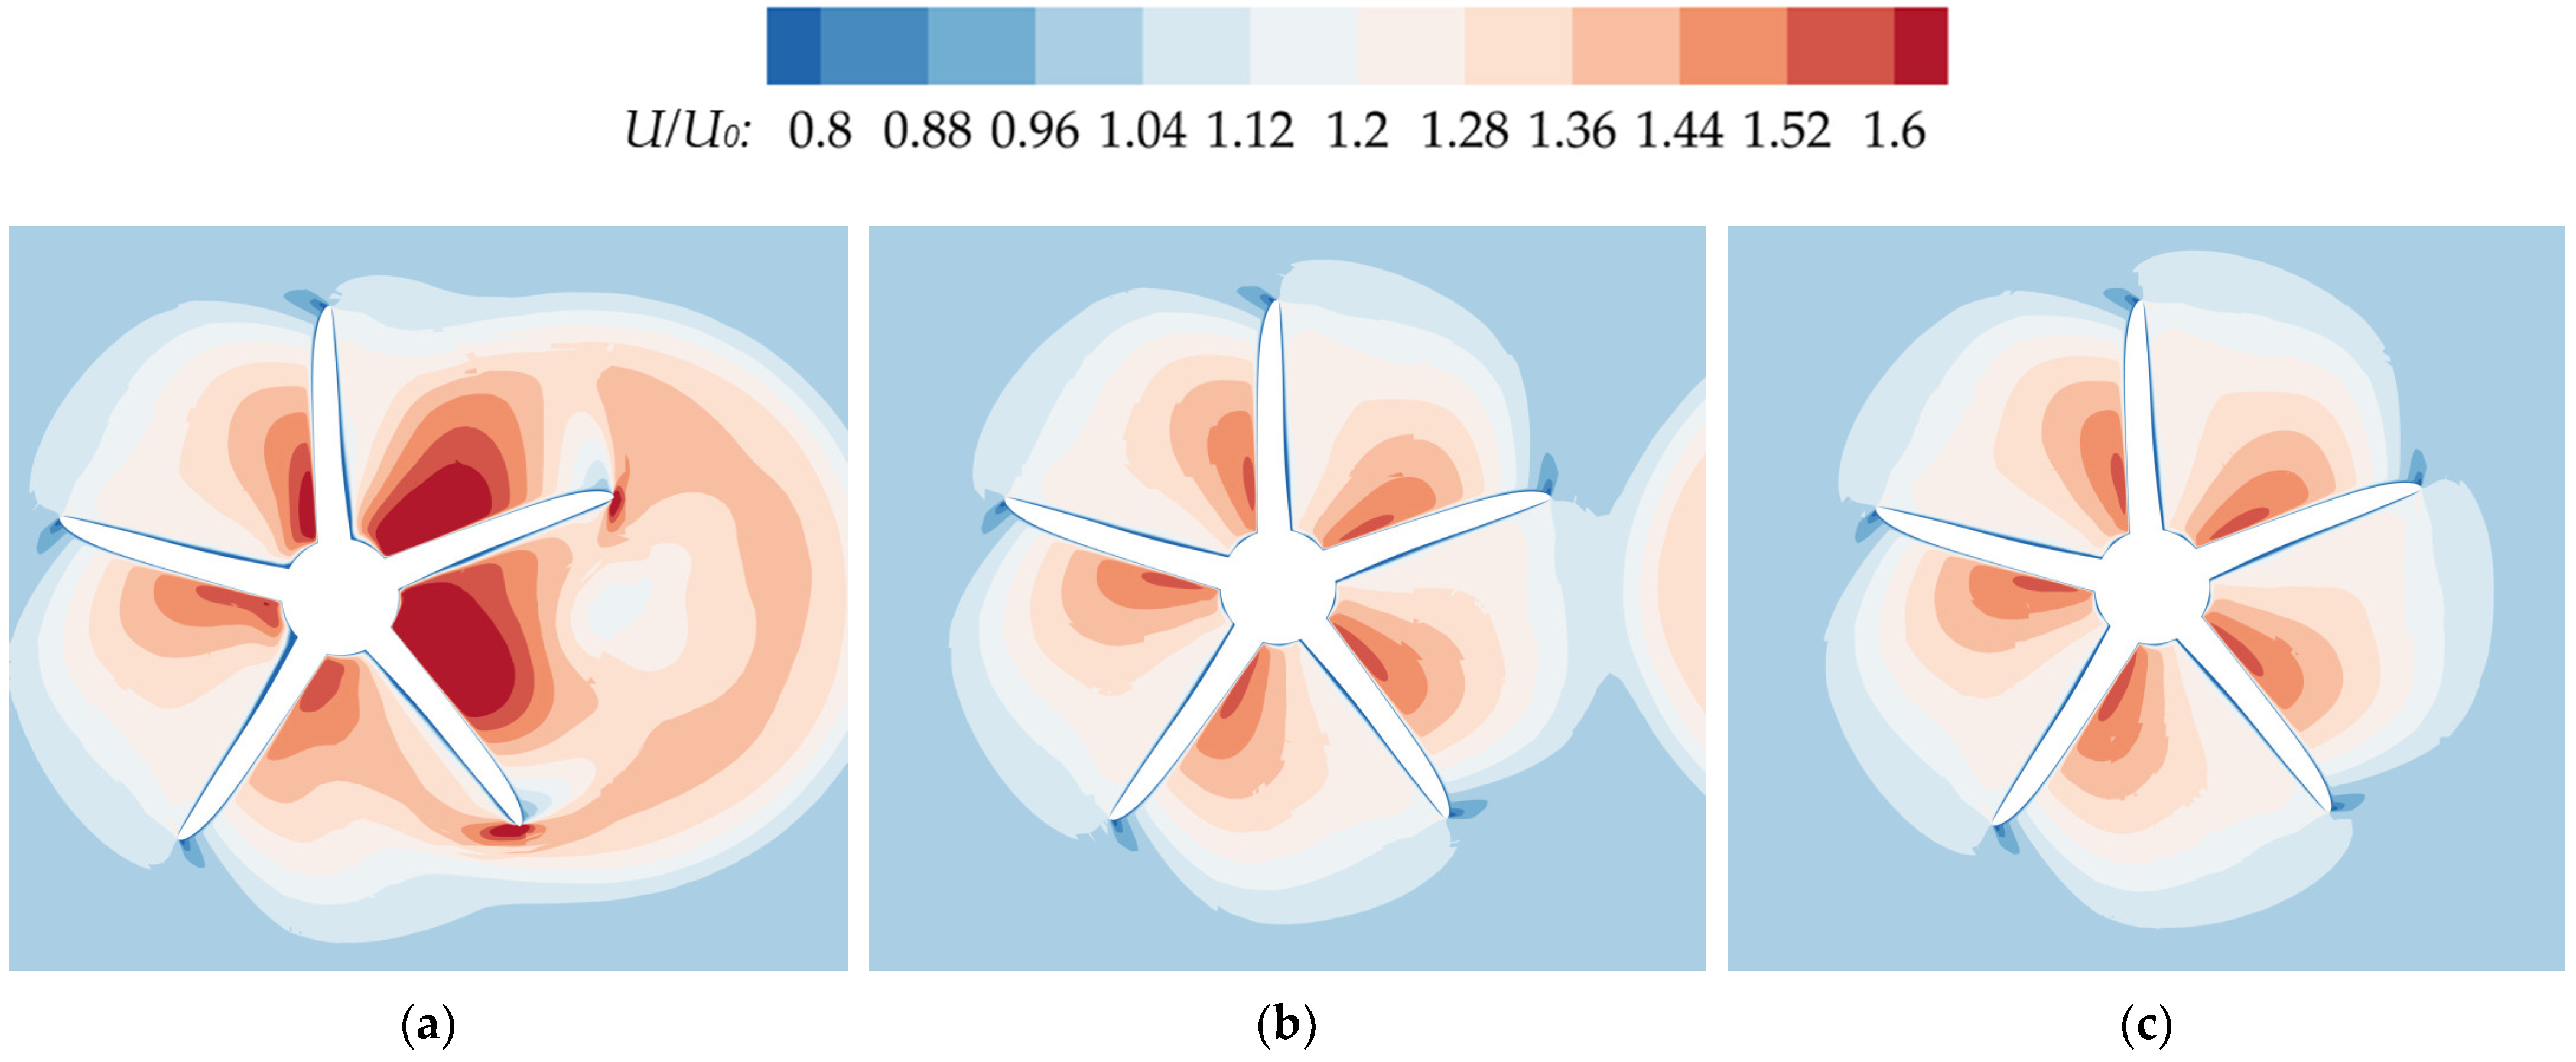
Figure 20.
Comparison of axial velocity distributions between the rear propeller plane under different conditions and a single propeller plane (a) C12 (TS = 0.4D, LS = 1D); (b) C27 (TS = 1D, LS = 1D); (c) Single propeller.
Figure 20.
Comparison of axial velocity distributions between the rear propeller plane under different conditions and a single propeller plane (a) C12 (TS = 0.4D, LS = 1D); (b) C27 (TS = 1D, LS = 1D); (c) Single propeller.
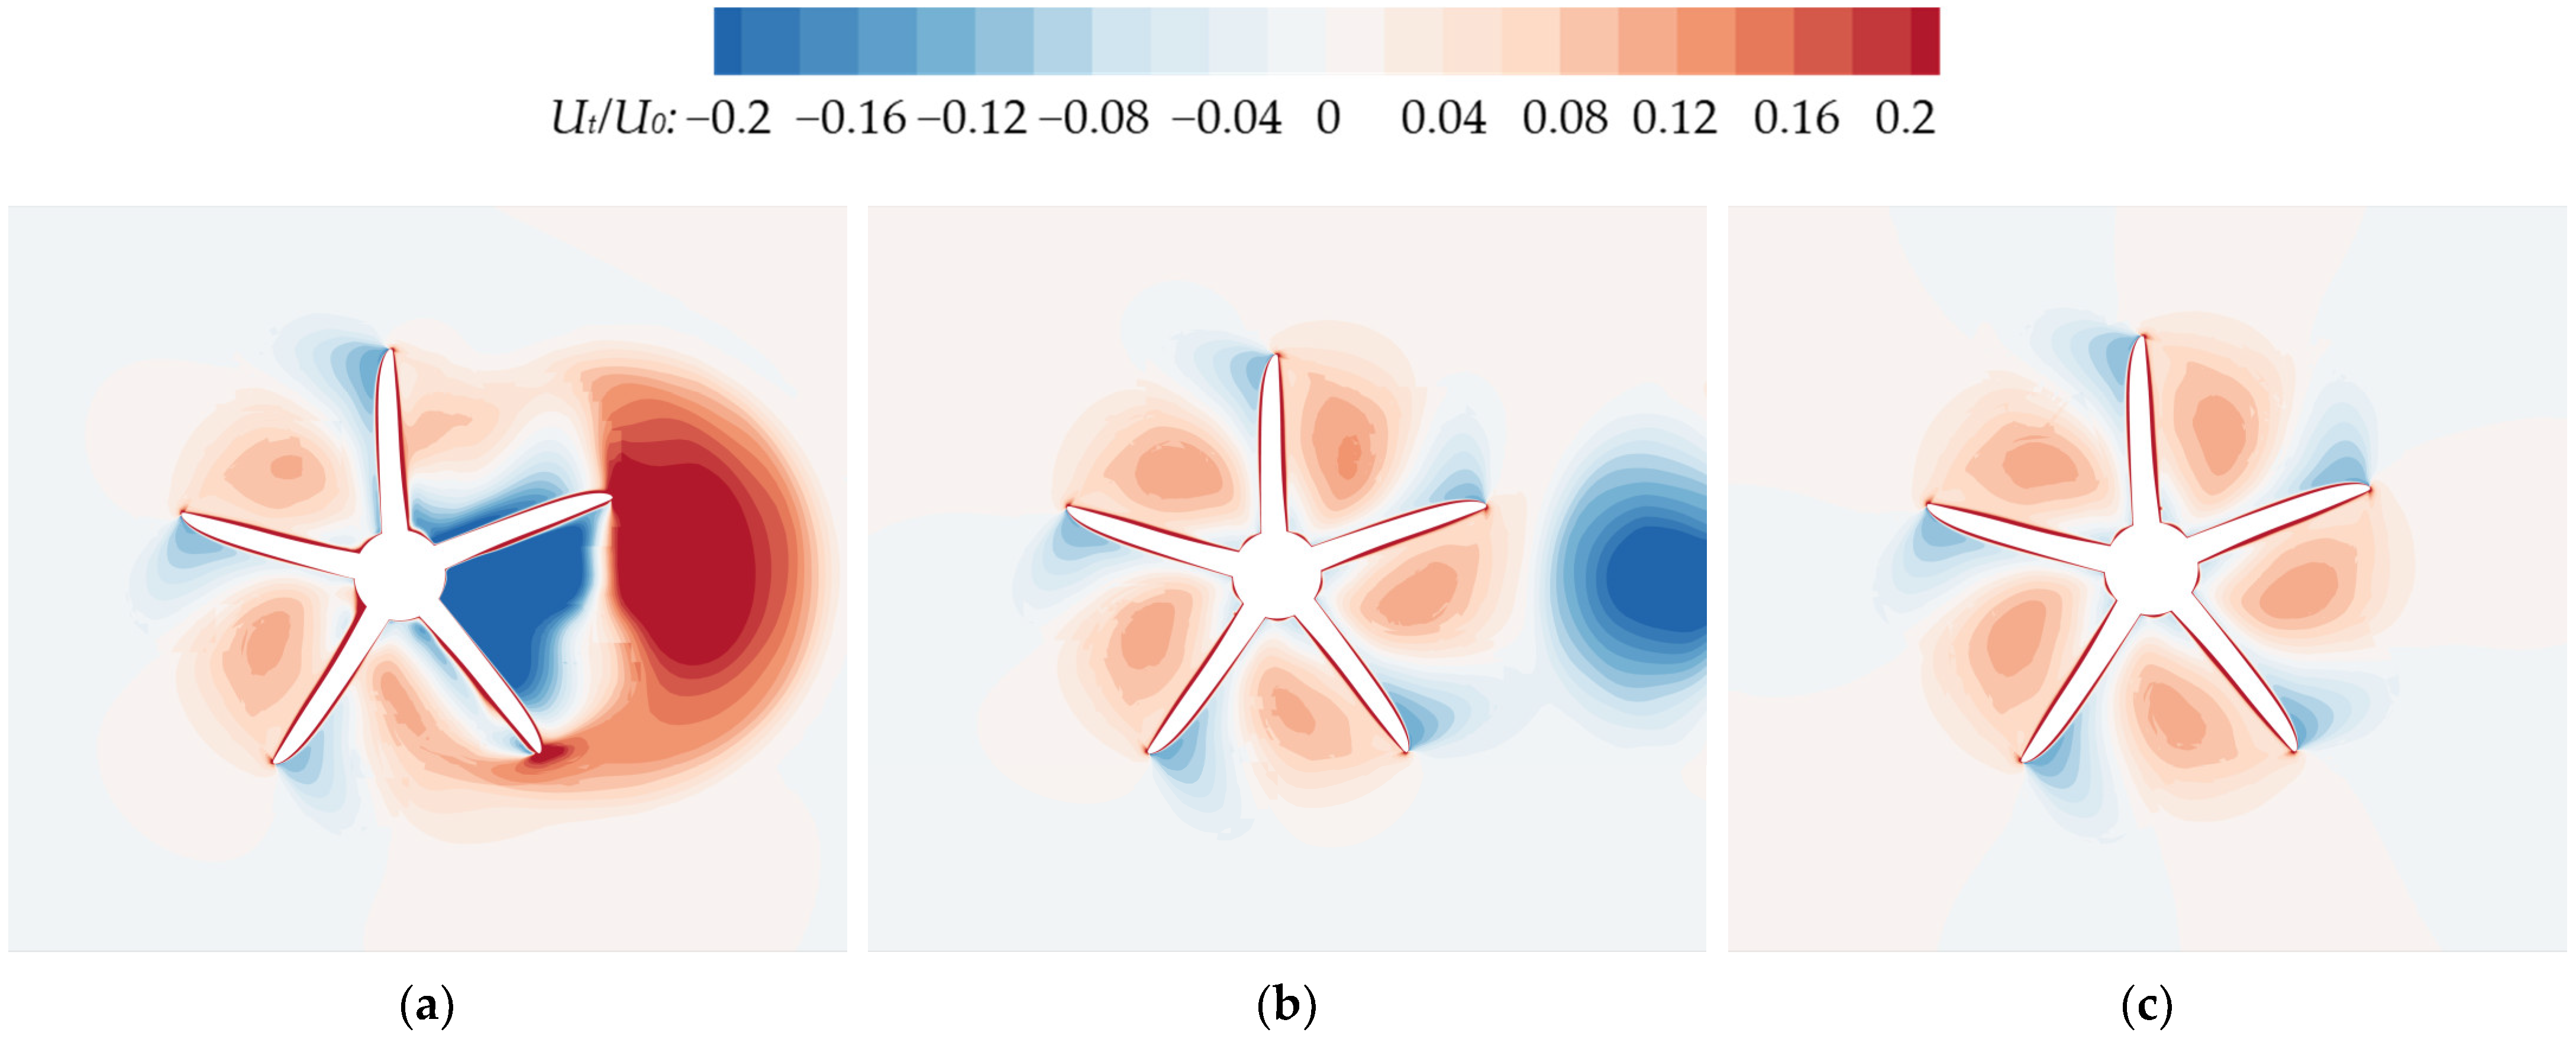
Figure 21.
Comparison of tangential velocity distributions between the rear propeller plane under different conditions and a single propeller plane (a) C12 (TS = 0.4D, LS = 1D); (b) C27 (TS = 1D, LS = 1D); (c) Single propeller.
Figure 21.
Comparison of tangential velocity distributions between the rear propeller plane under different conditions and a single propeller plane (a) C12 (TS = 0.4D, LS = 1D); (b) C27 (TS = 1D, LS = 1D); (c) Single propeller.
Figure 22.
Comparison of the axial velocity distribution on the XOY plane and the pressure distribution on the propeller surface under different conditions (a) C2 (TS = 0, LS = 1D); (b) C12 (TS = 0.4D, LS = 1D); (c) C27 (TS = 1D, LS = 1D).
Figure 22.
Comparison of the axial velocity distribution on the XOY plane and the pressure distribution on the propeller surface under different conditions (a) C2 (TS = 0, LS = 1D); (b) C12 (TS = 0.4D, LS = 1D); (c) C27 (TS = 1D, LS = 1D).
Figure 23.
Pressure distribution on the rear propeller surface under different conditions: (a) C2 (TS = 0, LS = 1D); (b) C12 (TS = 0.4D, LS = 1D); (c) C27 (TS = 1D, LS = 1D).
Figure 23.
Pressure distribution on the rear propeller surface under different conditions: (a) C2 (TS = 0, LS = 1D); (b) C12 (TS = 0.4D, LS = 1D); (c) C27 (TS = 1D, LS = 1D).
Figure 24.
The total KT of the two-propeller configuration in different arrangements.
Figure 24.
The total KT of the two-propeller configuration in different arrangements.
Figure 25.
The total 10KQ of the two-propeller configuration in different arrangements.
Figure 25.
The total 10KQ of the two-propeller configuration in different arrangements.
Figure 26.
The total efficiency of the two-propeller configuration in different arrangements.
Figure 26.
The total efficiency of the two-propeller configuration in different arrangements.
Table 1.
The details of KP505 propeller.
Table 1.
The details of KP505 propeller.
| Description | Values |
|---|
| Blade section | NACA66 |
| Diameter D (m) | 0.25 |
| Pitch ratio P/D (0.7R) | 0.95 |
| Disk expanded area ratio Ae/Ao | 0.8 |
| Number of blades | 5 |
| Hub diameter ratio | 0.18 |
| Rotate speed (rps) | 14 |
| Rotation direction | Right-handed |
Table 2.
Dimensions of three grid cases.
Table 2.
Dimensions of three grid cases.
| Grid Nodes (M 1) | Propeller | Refine | Background | Total |
|---|
| Coarse | 0.55 | 0.44 | 0.42 | 1.41 |
| Medium | 1.51 | 1.26 | 1.19 | 3.96 |
| Fine | 4.17 | 3.55 | 3.33 | 11.05 |
Table 3.
Thrust and torque coefficients results of different grids.
Table 3.
Thrust and torque coefficients results of different grids.
| | Grid Nodes (M 1) | KT | Error | KQ | Error |
|---|
| Coarse | 1.41 | 0.131 | −4.38% | 0.0237 | −4.05% |
| Medium | 3.96 | 0.134 | −2.19% | 0.0242 | −2.02% |
| Fine | 11.05 | 0.135 | −1.46% | 0.0244 | −1.21% |
| EFD | - | 0.137 | - | 0.0247 | - |
Table 4.
Thrust and torque coefficients results of different time steps.
Table 4.
Thrust and torque coefficients results of different time steps.
| | Δt (s) | KT | Error | KQ | Error |
|---|
| Coarse | 0.004 | 0.127 | −7.30% | 0.0235 | −4.86% |
| Medium | 0.002 | 0.134 | −2.19% | 0.0242 | −2.02% |
| Fine | 0.001 | 0.136 | −0.73% | 0.0245 | −0.81% |
| EFD | - | 0.137 | - | 0.0247 | - |
Table 5.
Thrust and torque coefficients numerical uncertainties results.
Table 5.
Thrust and torque coefficients numerical uncertainties results.
| | | rk | R | PDM | UFS (%E) | USN (%E) |
|---|
| KT | Grid | | 0.333 | 1.585 | 4.085 | 4.202 |
| Time step | 2 | 0.286 | 0.904 | 0.982 |
| KQ | Grid | | 0.400 | 1.322 | 3.714 | 4.109 |
| Time step | 2 | 0.429 | 0.611 | 1.759 |
Table 6.
Thrust and torque coefficients validation study results.
Table 6.
Thrust and torque coefficients validation study results.
| | USN (%E) | UE (%E) | UV (%E) | W (%E) |
|---|
| KT | 4.202 | 1.00 | 4.319 | 2.19 |
| KQ | 4.109 | 1.00 | 4.229 | 2.02 |
Table 7.
Comparison of the KT, 10KQ, and η between CFD and EFD data.
Table 7.
Comparison of the KT, 10KQ, and η between CFD and EFD data.
| J | KT | 10KQ | η |
|---|
| EFD | CFD | Error | EFD | CFD | Error | EFD | CFD | Error |
|---|
| 0.1 | 0.482 | 0.470 | 2.49% | 0.677 | 0.671 | 0.89% | 0.113 | 0.112 | 1.30% |
| 0.2 | 0.435 | 0.436 | −0.23% | 0.622 | 0.626 | −0.64% | 0.223 | 0.222 | 0.53% |
| 0.3 | 0.387 | 0.393 | −1.55% | 0.557 | 0.573 | −2.87% | 0.332 | 0.328 | 1.31% |
| 0.4 | 0.336 | 0.345 | −2.68% | 0.497 | 0.514 | −3.42% | 0.431 | 0.428 | 0.81% |
| 0.5 | 0.285 | 0.294 | −3.16% | 0.437 | 0.452 | −3.43% | 0.519 | 0.518 | 0.22% |
| 0.6 | 0.235 | 0.242 | −2.98% | 0.376 | 0.387 | −2.93% | 0.597 | 0.597 | −0.07% |
| 0.7 | 0.185 | 0.188 | −1.62% | 0.311 | 0.316 | −1.61% | 0.665 | 0.663 | 0.28% |
| 0.8 | 0.137 | 0.134 | 2.19% | 0.247 | 0.242 | 2.02% | 0.705 | 0.705 | −0.05% |
| 0.9 | 0.083 | 0.078 | 6.02% | 0.181 | 0.166 | 8.29% | 0.654 | 0.673 | −2.97% |
Table 8.
Propellers arrangement of different conditions.
Table 8.
Propellers arrangement of different conditions.
| Conditions | LS (D) |
|---|
| 0.5 | 1 | 2 | 3 | 4 |
|---|
| TS (D) | 0 | C1 | C2 | C3 | C4 | C5 |
| 0.2 | C6 | C7 | C8 | C9 | C10 |
| 0.4 | C11 | C12 | C13 | C14 | C15 |
| 0.6 | C16 | C17 | C18 | C19 | C20 |
| 0.8 | C21 | C22 | C23 | C24 | C25 |
| 1.0 | C26 | C27 | C28 | C29 | C30 |
| 1.2 | C31 | C32 | C33 | C34 | C35 |
| 1.4 | C36 | C37 | C38 | C39 | C40 |
| 1.6 | C41 | C42 | C43 | C44 | C45 |
Table 9.
The KT of the front propeller in different conditions.
Table 9.
The KT of the front propeller in different conditions.
| KT | LS (D) |
|---|
| 0.5 | 1 | 2 | 3 | 4 |
|---|
| TS (D) | 0 | 0.142 | 0.137 | 0.134 | 0.134 | 0.134 |
| 0.2 | 0.140 | 0.135 | 0.134 | 0.134 | 0.134 |
| 0.4 | 0.133 | 0.133 | 0.133 | 0.133 | 0.134 |
| 0.6 | 0.130 | 0.132 | 0.133 | 0.133 | 0.134 |
| 0.8 | 0.129 | 0.131 | 0.133 | 0.133 | 0.134 |
| 1.0 | 0.130 | 0.132 | 0.133 | 0.133 | 0.134 |
| 1.2 | 0.131 | 0.132 | 0.133 | 0.134 | 0.133 |
| 1.4 | 0.132 | 0.132 | 0.133 | 0.133 | 0.133 |
| 1.6 | 0.133 | 0.133 | 0.133 | 0.133 | 0.133 |
Table 10.
The 10KQ of the front propeller in different conditions.
Table 10.
The 10KQ of the front propeller in different conditions.
| 10KQ | LS (D) |
|---|
| 0.5 | 1 | 2 | 3 | 4 |
|---|
| TS (D) | 0 | 0.250 | 0.245 | 0.243 | 0.243 | 0.243 |
| 0.2 | 0.248 | 0.244 | 0.242 | 0.242 | 0.243 |
| 0.4 | 0.242 | 0.241 | 0.242 | 0.242 | 0.243 |
| 0.6 | 0.238 | 0.240 | 0.242 | 0.242 | 0.243 |
| 0.8 | 0.237 | 0.240 | 0.241 | 0.242 | 0.243 |
| 1.0 | 0.238 | 0.240 | 0.241 | 0.242 | 0.242 |
| 1.2 | 0.240 | 0.240 | 0.241 | 0.243 | 0.242 |
| 1.4 | 0.241 | 0.241 | 0.241 | 0.242 | 0.242 |
| 1.6 | 0.241 | 0.241 | 0.242 | 0.242 | 0.242 |
Table 11.
The KT of the rear propeller in different conditions.
Table 11.
The KT of the rear propeller in different conditions.
| KT | LS (D) |
|---|
| 0.5 | 1 | 2 | 3 | 4 |
|---|
| TS (D) | 0 | −0.035 | −0.037 | −0.037 | −0.036 | −0.035 |
| 0.2 | 0.018 | 0.013 | 0.010 | 0.009 | 0.010 |
| 0.4 | 0.090 | 0.082 | 0.079 | 0.078 | 0.078 |
| 0.6 | 0.116 | 0.111 | 0.108 | 0.107 | 0.107 |
| 0.8 | 0.133 | 0.131 | 0.129 | 0.128 | 0.127 |
| 1.0 | 0.137 | 0.137 | 0.135 | 0.134 | 0.134 |
| 1.2 | 0.136 | 0.136 | 0.135 | 0.135 | 0.134 |
| 1.4 | 0.135 | 0.135 | 0.135 | 0.134 | 0.134 |
| 1.6 | 0.135 | 0.135 | 0.135 | 0.134 | 0.134 |
Table 12.
The 10KQ of the rear propeller in different conditions.
Table 12.
The 10KQ of the rear propeller in different conditions.
| 10KQ | LS (D) |
|---|
| 0.5 | 1 | 2 | 3 | 4 |
|---|
| TS (D) | 0 | 0.035 | 0.032 | 0.031 | 0.032 | 0.034 |
| 0.2 | 0.101 | 0.099 | 0.096 | 0.095 | 0.098 |
| 0.4 | 0.228 | 0.225 | 0.222 | 0.221 | 0.221 |
| 0.6 | 0.265 | 0.263 | 0.261 | 0.260 | 0.260 |
| 0.8 | 0.252 | 0.253 | 0.252 | 0.251 | 0.251 |
| 1.0 | 0.245 | 0.245 | 0.244 | 0.244 | 0.244 |
| 1.2 | 0.244 | 0.244 | 0.244 | 0.243 | 0.243 |
| 1.4 | 0.244 | 0.244 | 0.243 | 0.243 | 0.242 |
| 1.6 | 0.244 | 0.244 | 0.243 | 0.243 | 0.242 |
