3.1. Propulsor Maps Characterisation
A comprehensive characterisation of the propulsor’s operating points is obtained through systematic analyses across a variety of conditions. The aim is to accurately identify critical scenarios to serve as drivers for the multi-point optimisation process. The investigation begins with a single-phase model to map the nominal performance of the propulsor under ambient conditions that prevent cavitation onset.
To trace the characteristic speedlines, the free-stream velocity is held constant, while the mass flow rate boundary condition across the machine is varied in each simulation. Precisely,
is adopted as independent variable and the mass flow rate is estimated from Equation (
1) according to the advance condition. This procedure is applied to four different intake geometries: the baseline and three optimised designs obtained in a previous study [
21] and labelled as
opt1,
opt2 and
opt3. These shapes are selected from opposite ends of the Pareto front resulting from a two-objective optimisation conducted in that study, which targeted forebody drag and PR under cruise conditions. All configurations are paired with the same nozzle profile to eliminate variability associated with exhaust dynamics (
Figure 5).
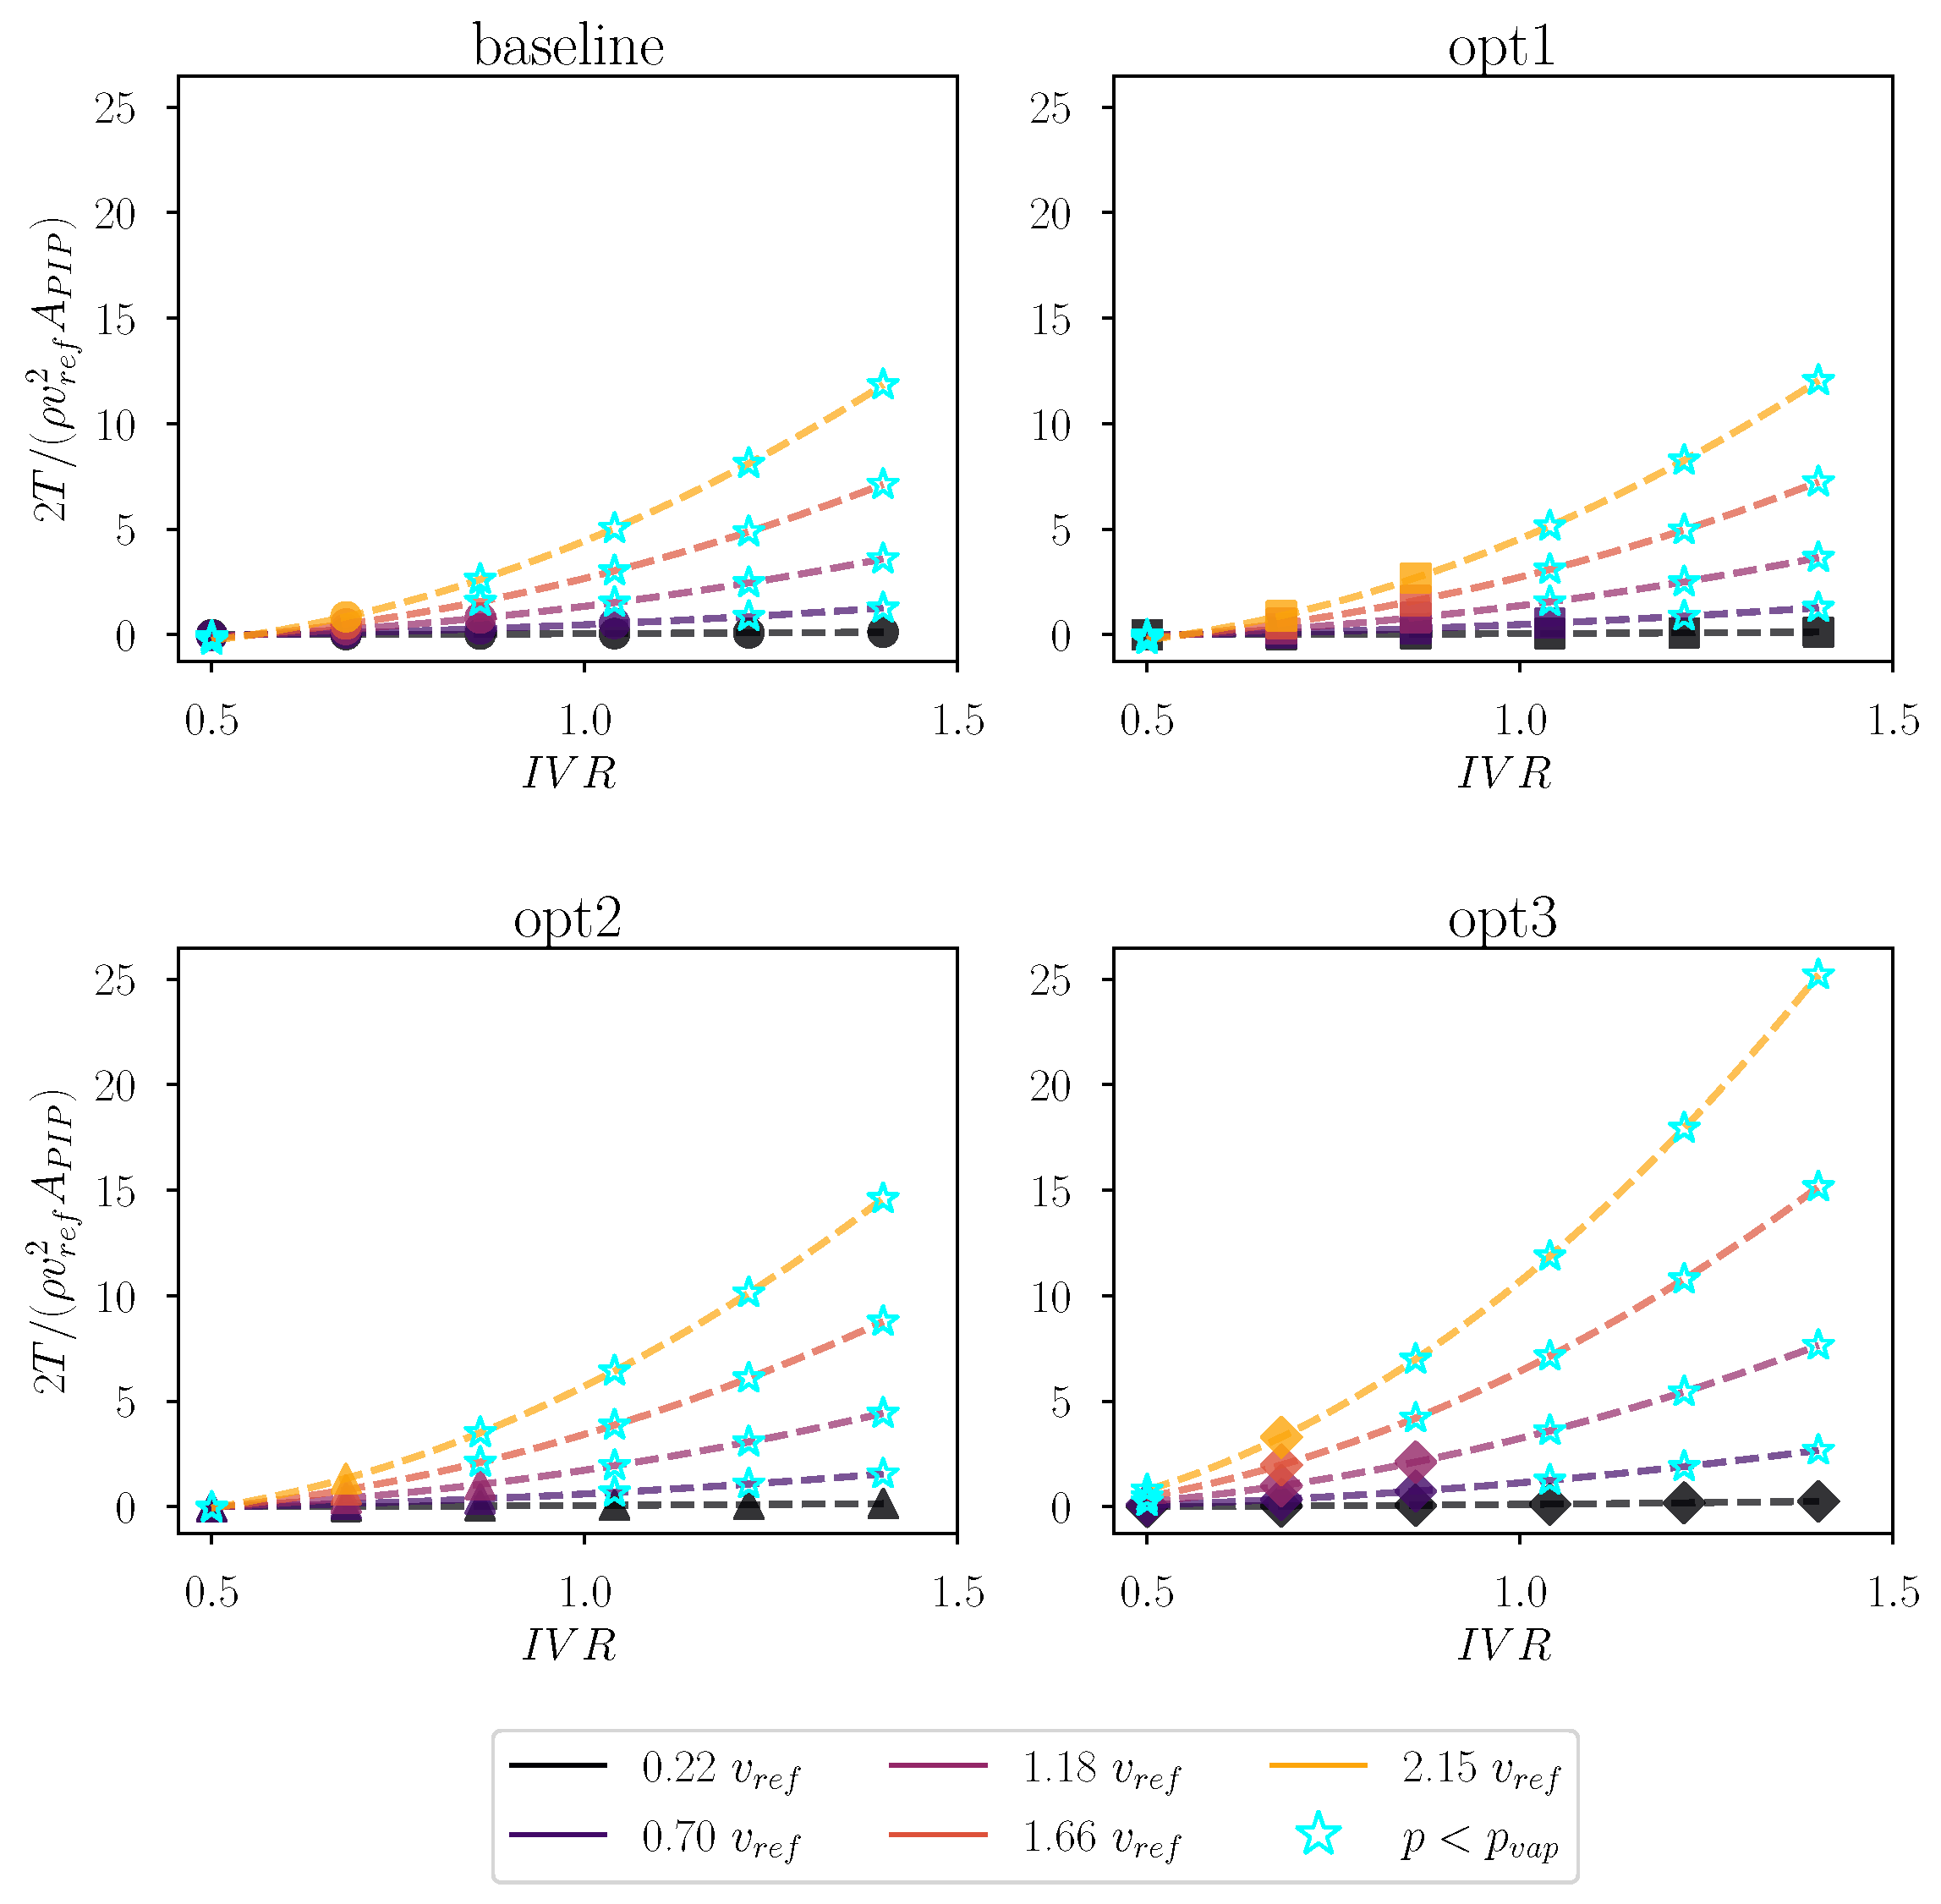
In contrast, the variation in intake geometry is intentionally used to guide the selection of the off-design operating point, capturing the associated effects relevant to the optimisation process. Specifically, the optimised individuals feature progressively increasing highlight areas compared to the baseline. The resulting data are expressed in non-dimensional units, adopting the
as a measure of the flow rate and a thrust coefficient computed as
. Here, the reference velocity,
, corresponds to the cruise condition of the original design presented in Avanzi et al. [
21], which is consistent with
. Although multiple advancing conditions are analysed, the same normalisation parameter is adopted across all speedlines. While the thrust coefficient is conventionally defined with respect to the specific free-stream velocity, such a choice in this case would cause all curves to collapse into a single linear trend with respect to
, thus preventing a distinction between different speedlines. This approach also enables a clear identification of critical operating points with potential for cavitation onset, denoted with blue star labels when pressures lower than the vapour value,
, are detected. Observing the behaviour of the parametric curves for any geometry, it is possible to infer that the net thrust has a monotonic smooth trend with respect to the mass flow rate variation. Data can be fitted with a quadratic law, where the second-degree term coefficient has a positive correlation with the advancing speed. In fact, as this parameter increases, the parabola concavity becomes more emphasised, inducing steeper increment of the non-dimensional thrust with augmenting
. However, the curve shape is not only dependent on the free stream conditions, but also on the geometry outline. Specifically, as the highlight area is increased from the baseline to
opt3, the sensitivity to
becomes stronger. Especially for the last individual, this dependency determines over a
increment of the last operating point at the highest speed, compared to the same condition in
opt2.
Considering that the exhaust region exhibits the same dynamics for any configuration, the propulsive performance different characters are driven by the inlet geometry. Specifically, under the same advancing conditions, an equal
corresponds to higher mass flow rates processed by wider inlet highlight sections. Consequently, the local flow acceleration becomes stronger, inducing lower wall pressures. Since no cavitation is modelled at this stage, pressure values may reach negative values, with no lower limit restricting the evolution of the variable. The related integration results in a positive contribution to thrust, which motivates the gradual up-shift of the curves as the capture sections enlarges from the baseline to the last optimised individual. Evidently, these geometries exhibit greater susceptibility to cavitation onset. However, this behaviour is closely linked to detailed shape features, as critical pressures tend to develop in localised regions depending on the specific wall curvature. Anyhow, cavitation volumes can potentially evolve externally for low mass flow rate operations, while internal regions may be affected at high
. Specifically, the phenomenon is clearly influenced by the advancing condition, according to Equation (
10). As a results, low-speed operations are in general safer across wider ranges of processed mass flow rates, while, as the free stream velocity increases, cavitation becomes more likely, with clear dependency on the local wall shape.
To properly investigate the propulsive behaviour of the system, the same simulations are performed with a two-phase numerical model, including Zwart cavitation formulation. Considering the increased complexity of the flow field evolution, the solution becomes more unstable. Thus, in some simulated points, either divergence or incompatibility with the mentioned convergence criteria determine the rejection of the computed solution. This generally occurs when large cavitation volumes form internally, while external bubbles can be solved with fewer computational issues.
Figure 6 reports the
as a function of the
for the same geometries and free stream conditions analysed in the previous discussion. The results confirm a stronger tendency for cavitation onset at higher free-stream velocities. At low advancing speeds, pressure recovery shows a smooth decreasing trend with increasing
, consistent with the evolution of the captured streamtube. Specifically, when the stagnation point is located inside the intake, the diffuser operates under higher pressure levels, enhancing recovery at the PIP. As the stagnation point moves outward with increasing flow rates, the diffusion process weakens, leading to reduced
values. This trend is highly dependent on the free-stream conditions. As the far-field velocity increases, the
decay becomes more rapid, triggering local phase transitions that cause sudden performance drops. Consequently, as larger capture sections promote local accelerations, the maximum
for which convergence is achieved tends to decrease when simulating optimised geometries. The effect of geometry, however, remains strongly localised, preventing the definition of general predictive laws. Conversely, external cavitation has negligible influence on the current performance parameter. Still, increased capture velocities are associated with greater entrance losses, leading to lower
values at equivalent
conditions.
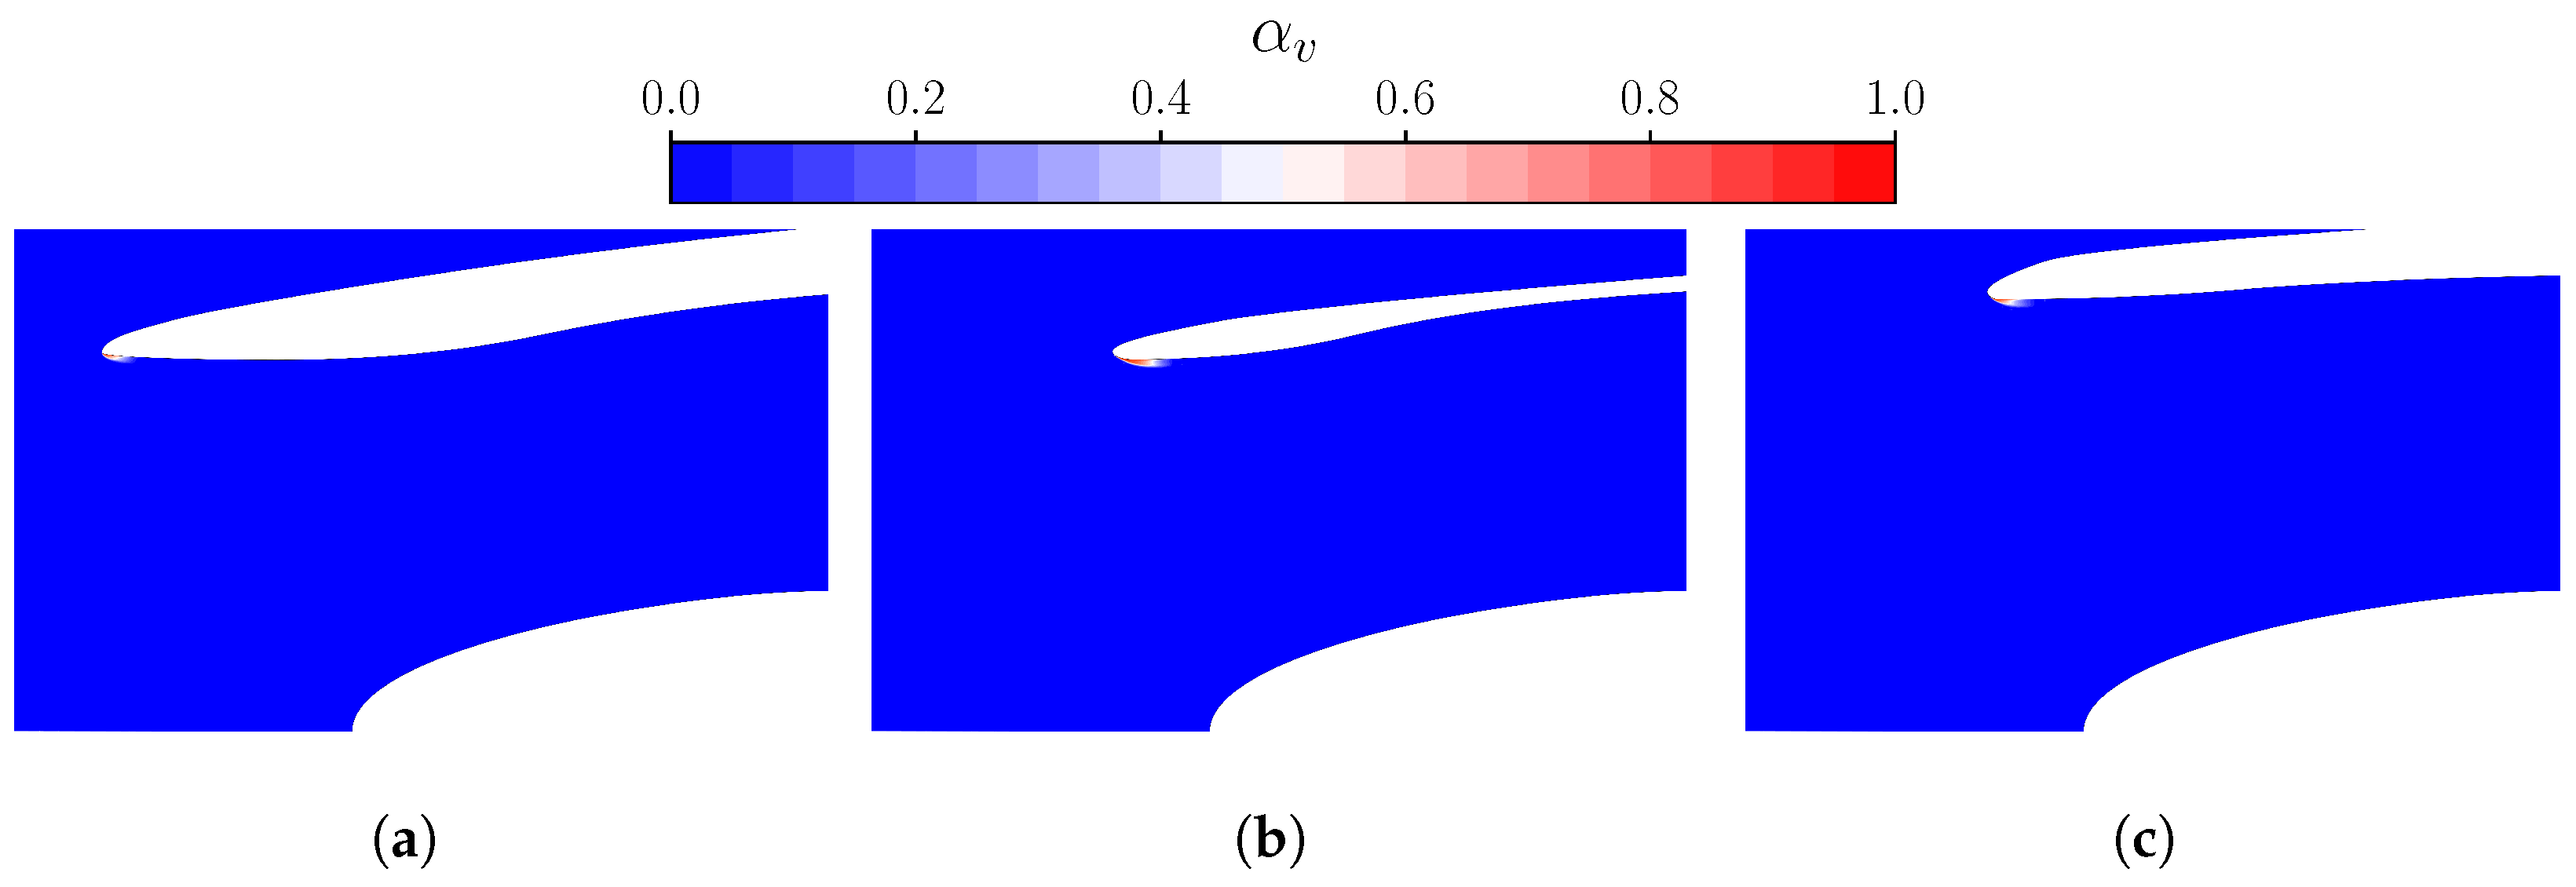
Internal lip cavitation is further examined through contours of vapour volume fractions (
Figure 7). The analysis considers operating conditions at
with
, comparing among three geometries: the baseline (
Figure 7a),
opt1 (
Figure 7b) and
opt3 (
Figure 7c). In fact, although featuring a smaller highlight area than the last geometry,
opt2 local cavitation evolution prevents the satisfaction of the continuity criterion across the machine.
For the reference geometry, vapour bubbles rapidly form near the sharp leading-edge and extend downstream over a limited distance, without reaching the inlet throat. While a rounded edge can mitigate abrupt cavitation development-as seen in the opt1 flow field-the shorter lip length in this case facilitates phase transition. This is because the minimum duct section is located closer to the stagnation point, sustaining local acceleration further downstream. As a result, thicker and longer vapour regions develop, extending beyond the throat and directly reducing pressure recovery compared to the previous configuration. In contrast, the flow field around opt3 suggests that a blunter lip slightly reduces the extent of the vapour region. This geometry partially limits the acceleration through the channel, leading to lower total pressure losses at the PIP.
As the mass flow rate increases, the vapour bubble enlarges and extends downstream into the diffuser. This structure introduces additional obstruction and distortion to the incoming flow. As a result, the reduced passage area near the throat further accelerates the flow, triggering a non-linear amplification of the phase transition that rapidly compromises solution stability. For this reason, computations tend to diverge earlier, leading to fewer valid simulations.
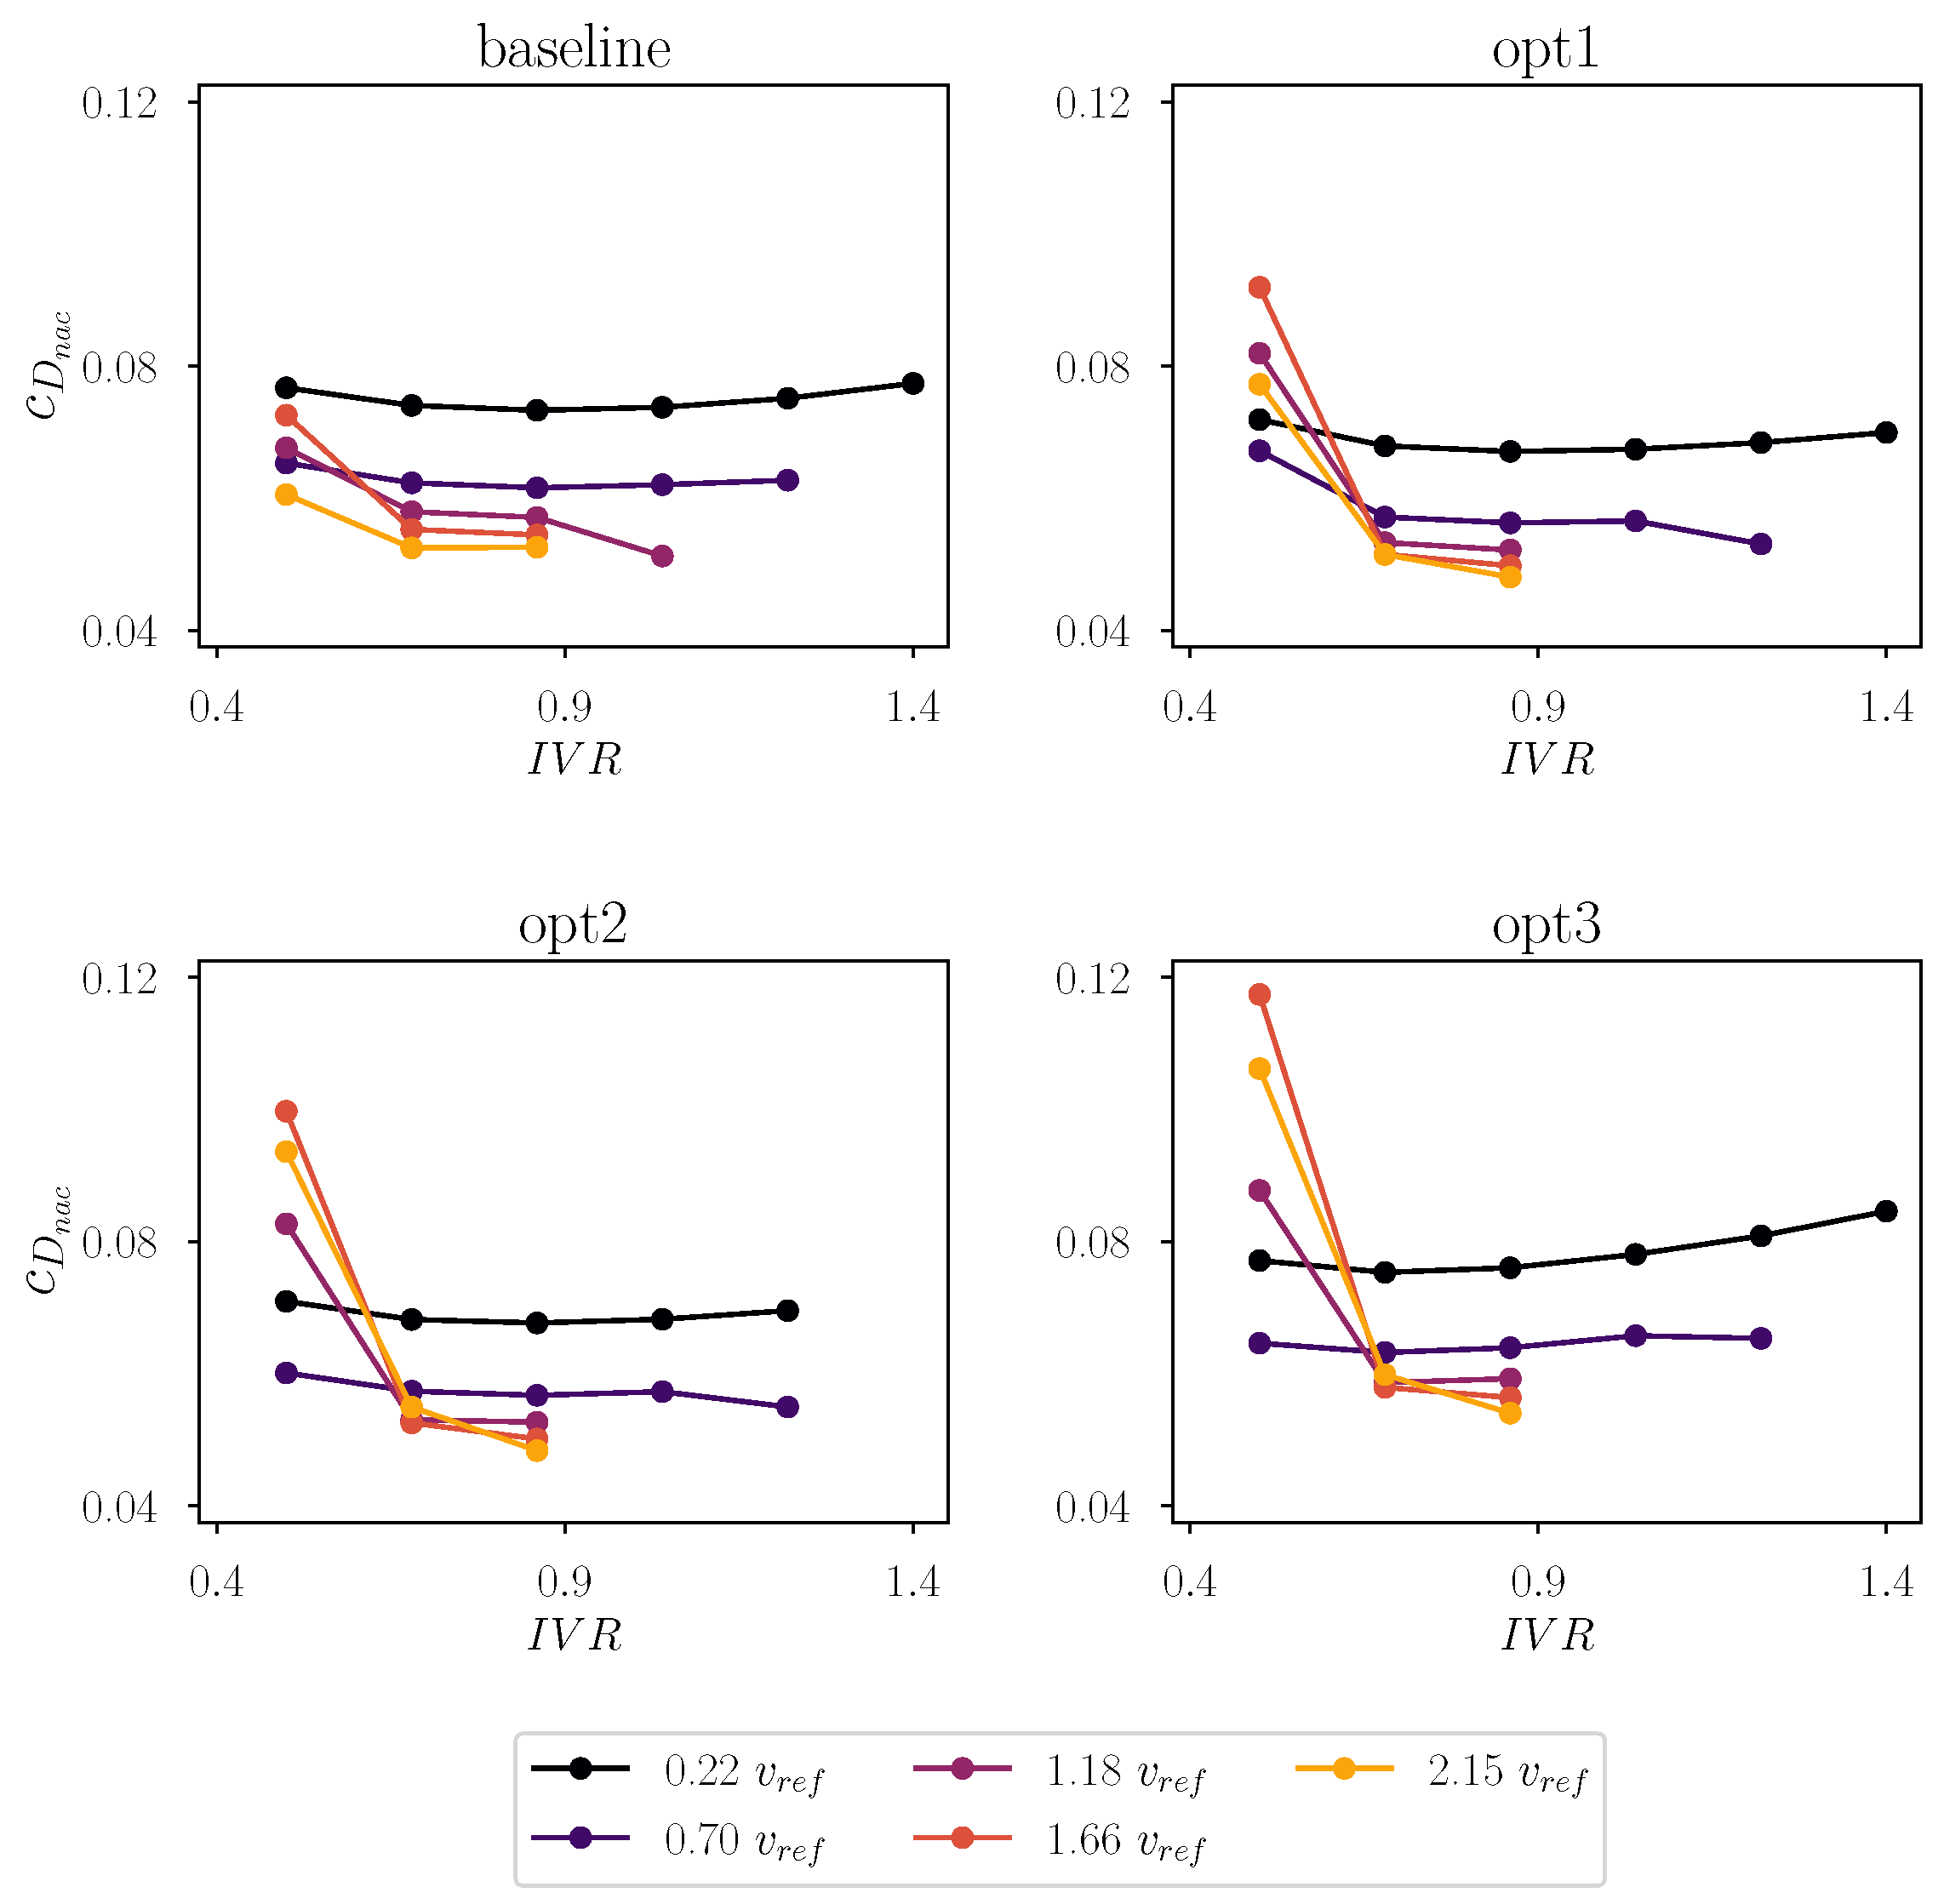
At the same free-stream conditions, the system’s resistance is evaluated by analysing the distribution of the nacelle drag coefficient as a function of the
(
Figure 8). As previously observed, lower free stream velocities mitigate cavitation evolution. Consequently, from speedlines analysis it follows that the corresponding trends are clearly non-monotonic. In fact, the curves generally agree in recognising a minimum around
, which would correspond to the optimal condition predicted by the potential flow theory. Again, the smooth behaviour of each speedline is corrupted as cavitation occurs, which is typical of flow rate conditions different from nominal. At the early stages of internal cavitation, when
, lip phase transition locally reduces the drag component, promoting the overall performance. However, this evolution is only beneficial at low velocities (
,
) where the vapour extension is limited. As cavitation covers large portions, potentially extending downstream inside the diffuser, the entering streamtube is obstructed, inducing instability and feeding distortions and local separations that compromise performance. Differently, at low
, convergence is generally reached. External cavitation significantly affects nacelle resistance, causing abrupt increases in the drag coefficient, with a stronger dependency observed as the free-stream velocity increases. This trend is further supported by the observation that external cavitation has a lesser impact on solution stability, allowing valid simulations even when vapour regions become substantially more extended compared to those formed within internal structures.
3.2. Design Space Definition and Setup
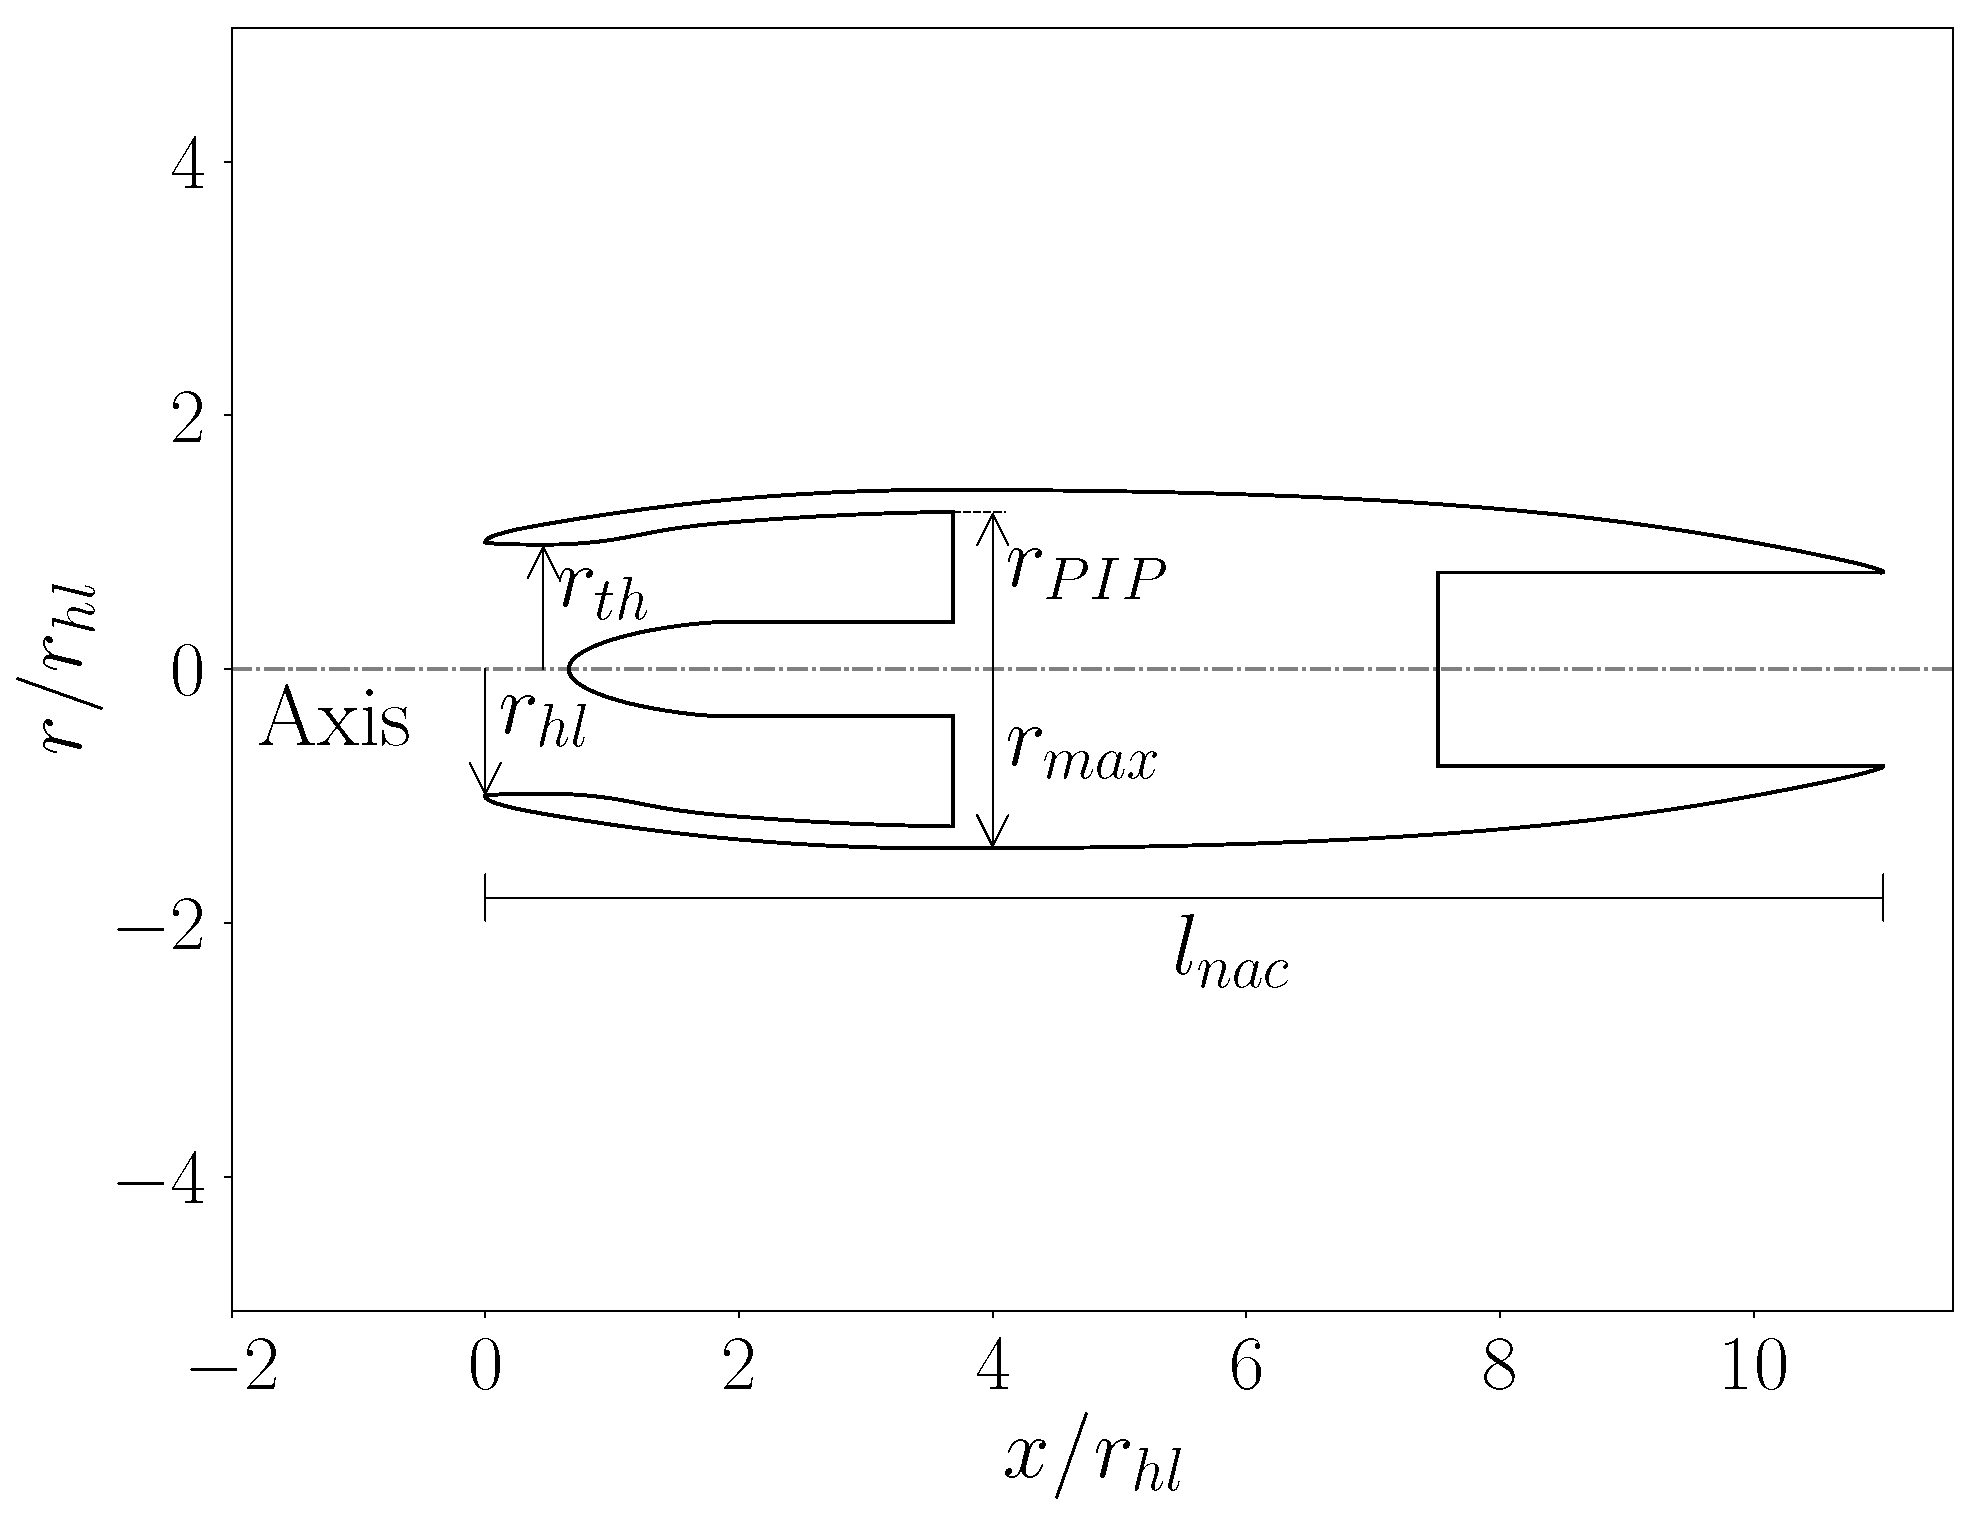
To perform a systematic analysis using a DOE approach, an automatic procedure is used. Specifically, once a database of geometrical variants is generated, the corresponding individuals need to be discretised and simulated using CFD before post-processing. To easily manipulate the geometry, reducing the number of Decision Variables (DV), the original shape is first parameterised using B-splines. Each control point is assigned a specific Degree of Freedom (DOF), which determines its allowed displacement in the
x and/or
y direction from its original position in the reference parameterisation (
Figure 9). Bounding control points, such as the axial and radial coordinates of the highlight radius and the axial coordinate of the nozzle Trailing Edge (TE), are directly modified. Differently, internal control points are first linearly scaled to match the updated global extension. Subsequently, they are further adjusted based on locally defined ranges, specifically determined for each control point. These local bounds are illustrated in
Figure 9a, either as lines or rectangles depending on whether the number of DOFs is 1 or 2, respectively. Concerning the centerbody (
Figure 9b), the geometric variants only account for a rigid axial translation, exerted by applying the same
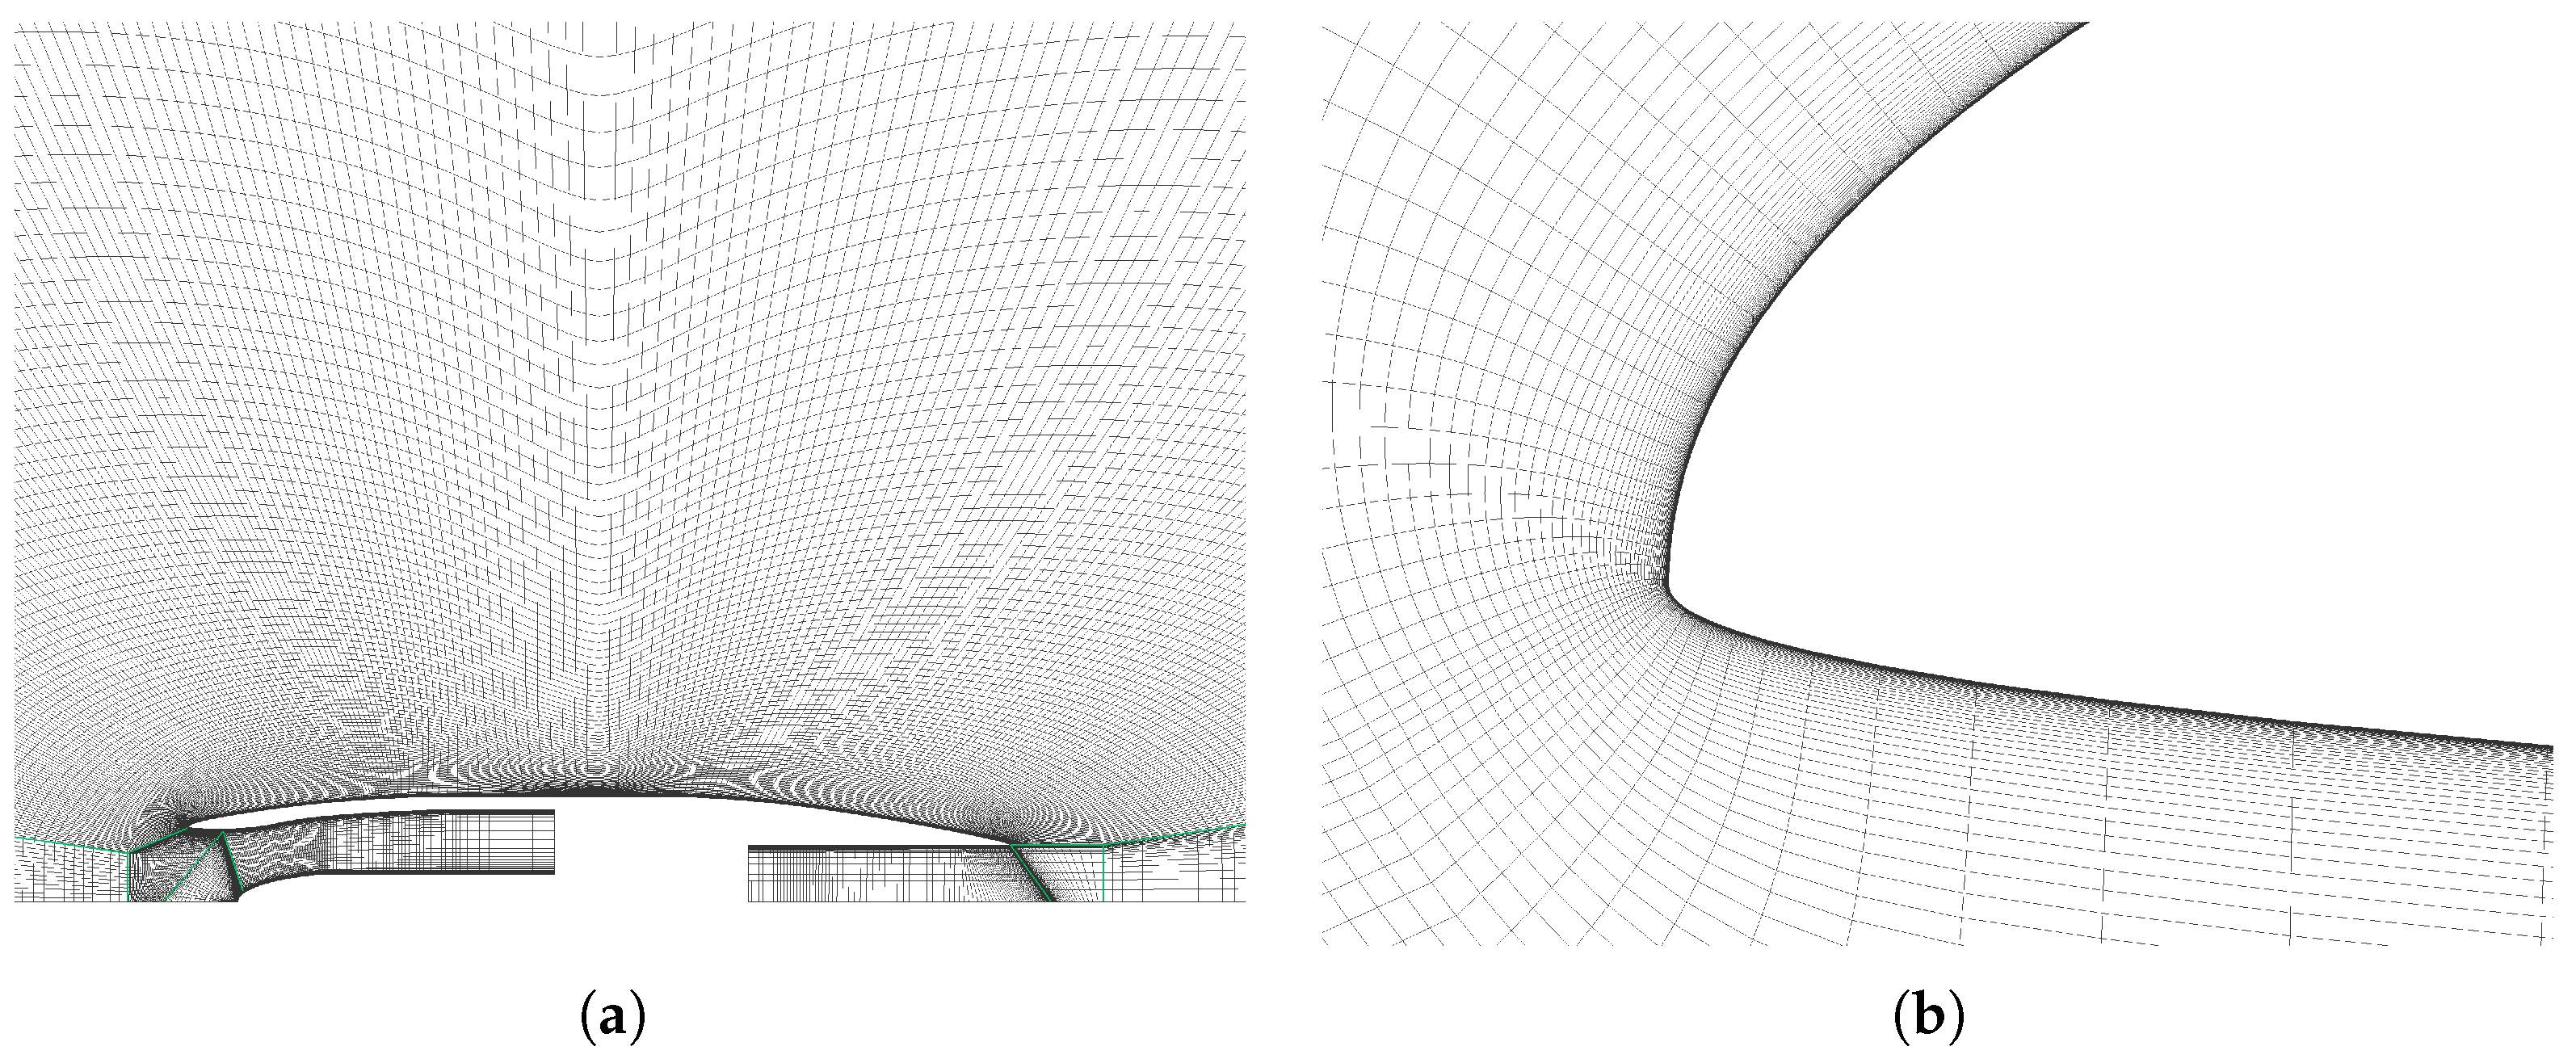
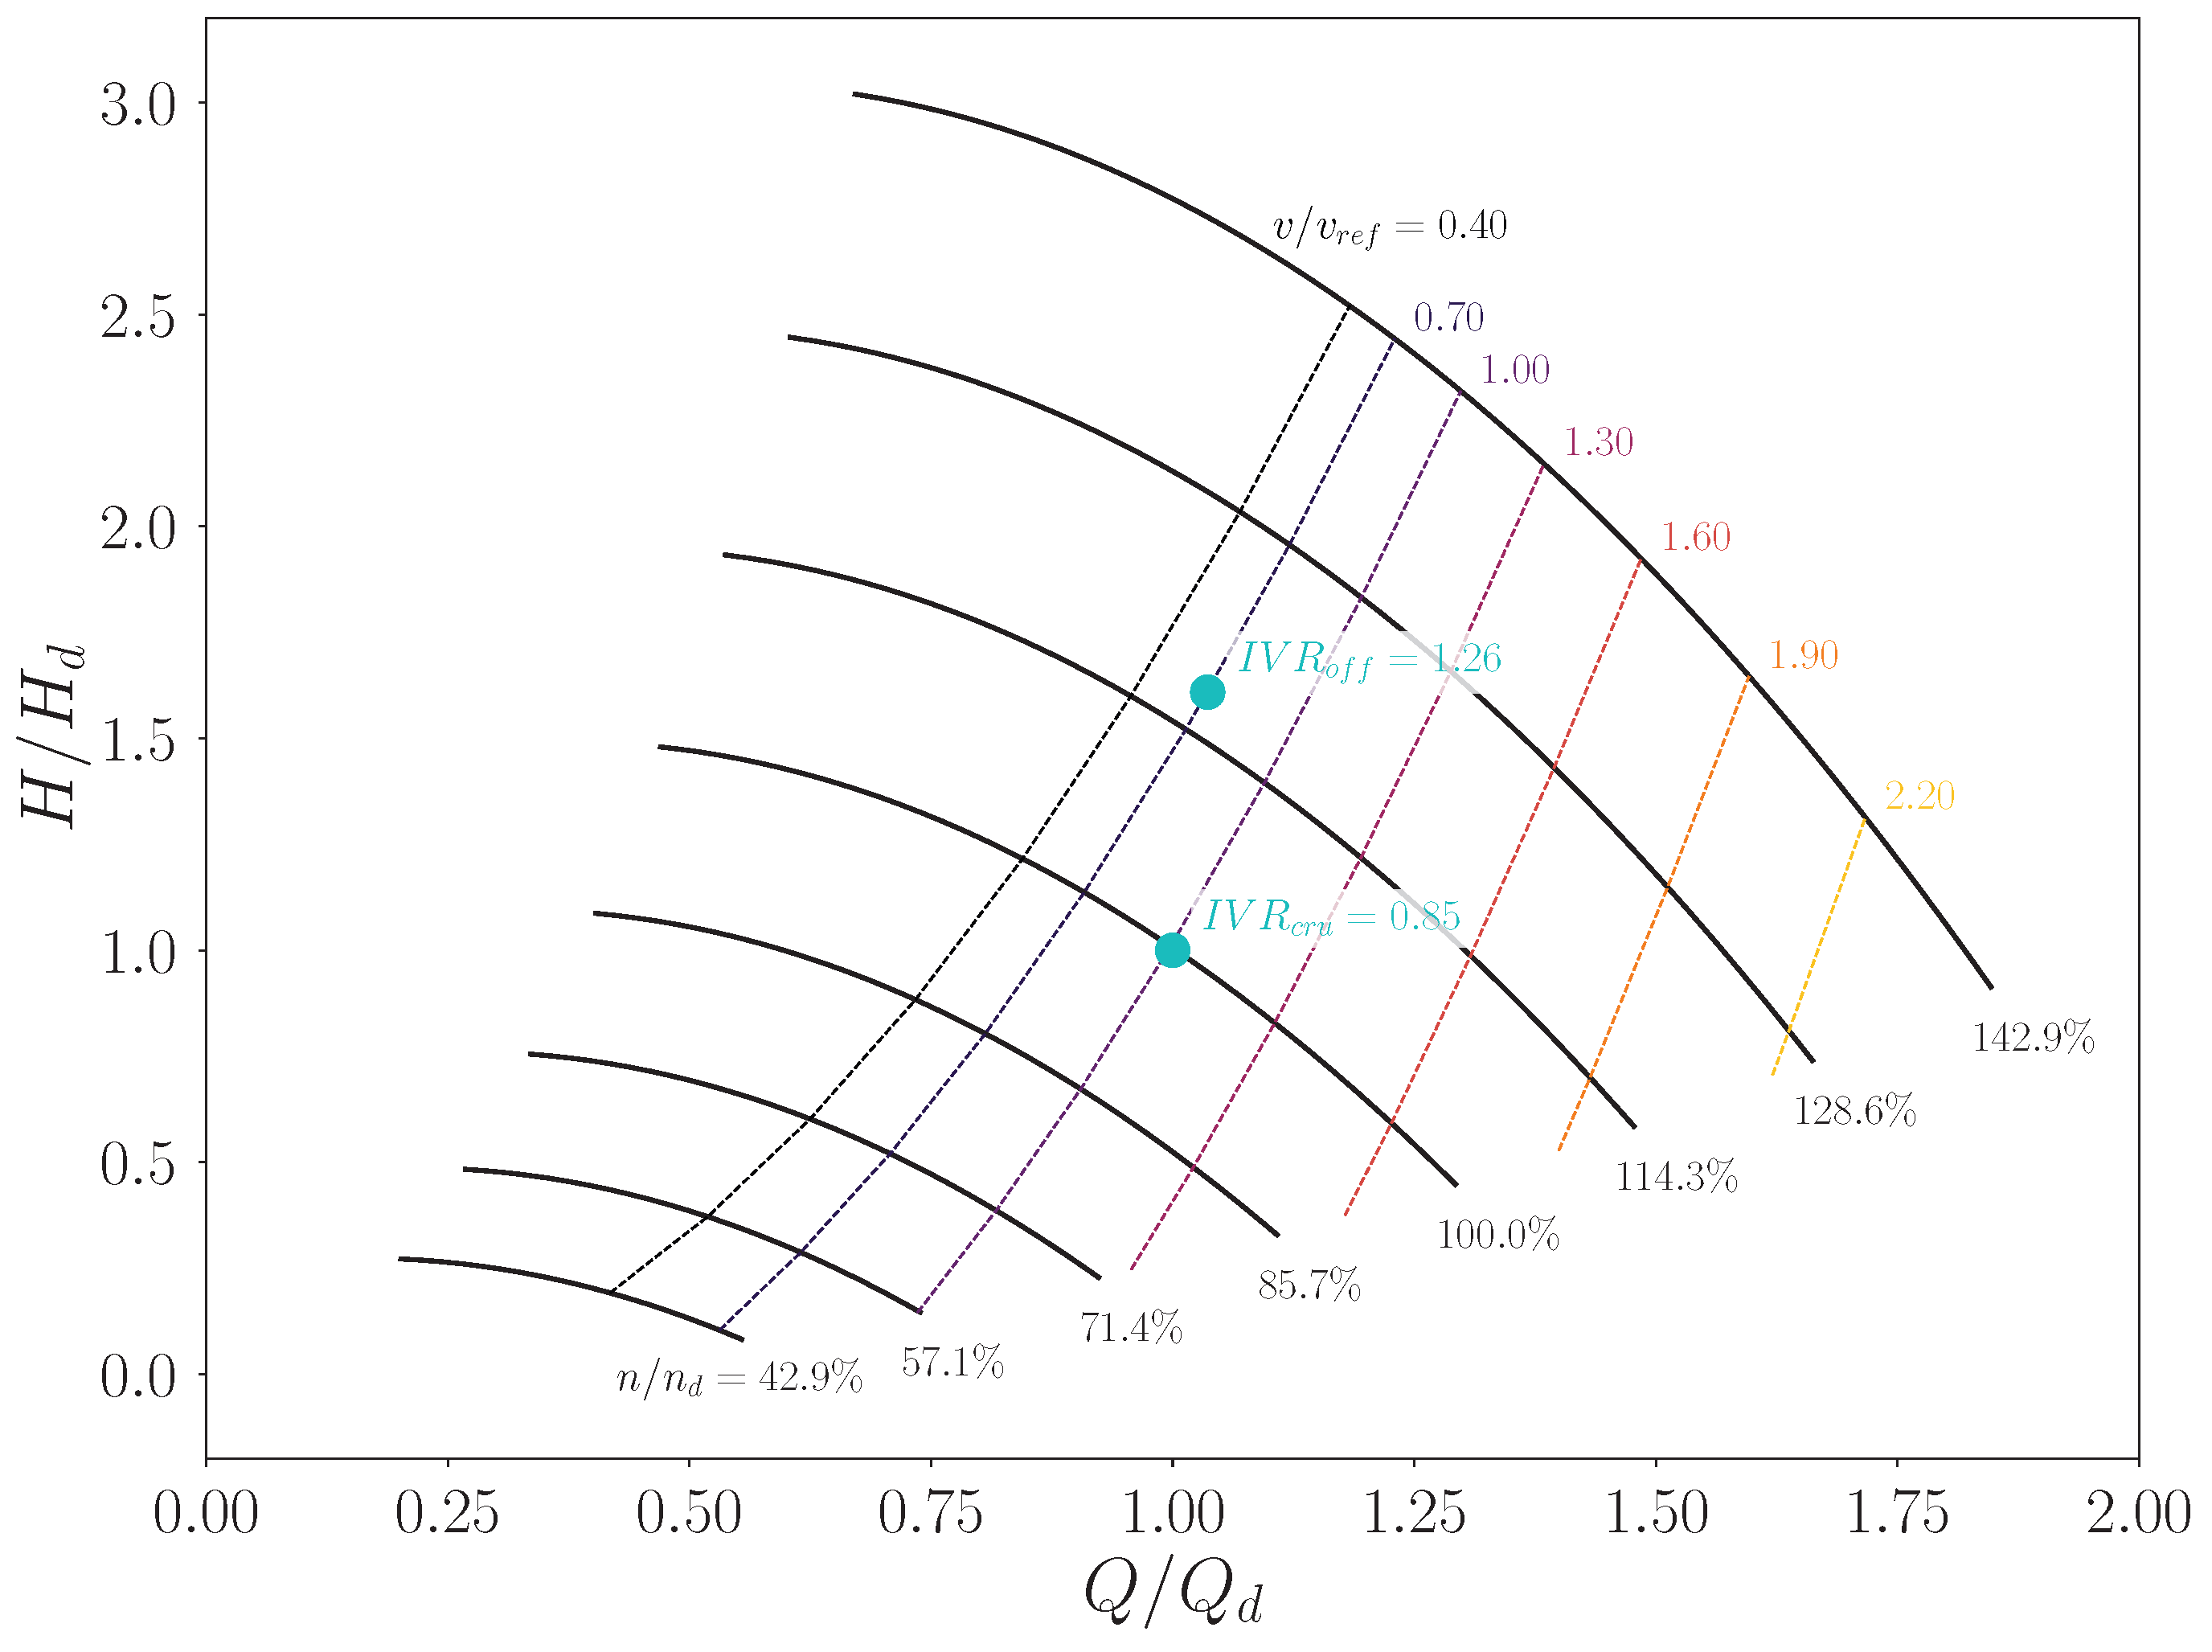
x shift to all control points, while, as aforementioned, the pump sections are left unchanged. Based on this parameterisation, the resulting number of DV adopted for the optimisation is 21. An automatic grid generation process is adopted for each individual, which is characterised by a precise and unique set of DV. The mesh sizing is controlled based on the baseline medium refinement, adjusting local nodes distributions according to the specific B-spline extension. Thus, each case features its peculiar cells count, with an overall range between 166k and 210k. For the multi-point investigation, two operating conditions are considered: a near-cruise configuration with
and
, and an off-design scenario with
and
. Considering the baseline geometry, these points, from CFD simulations, correspond to
and
, respectively. The same conditions are analysed, considering the potential integration between the pump and the propulsor (
Figure 10). The ODW maps are estimated using a meanline approach for different advancing velocities and plotted over the pump characteristic curves, which are propagated from the non-dimensional law for different rotor velocities,
n. The machine flow rate, head (
) and rotational regimes are normalised with the corresponding design values,
,
and
. The selected operating points underscore that, under the chosen off design conditions, the
constrains the performance required from the pump, specifically indicating operations at higher flow rates and rotor speeds. Here, the discrepancy in the reported
value depends on the different accuracy between the meanline method and CFD.
Table 3 summarises the flow configurations corresponding to the two operating points selected for the optimisation, where simulations are performed according to the solution strategy outlined in
Section 2.2.
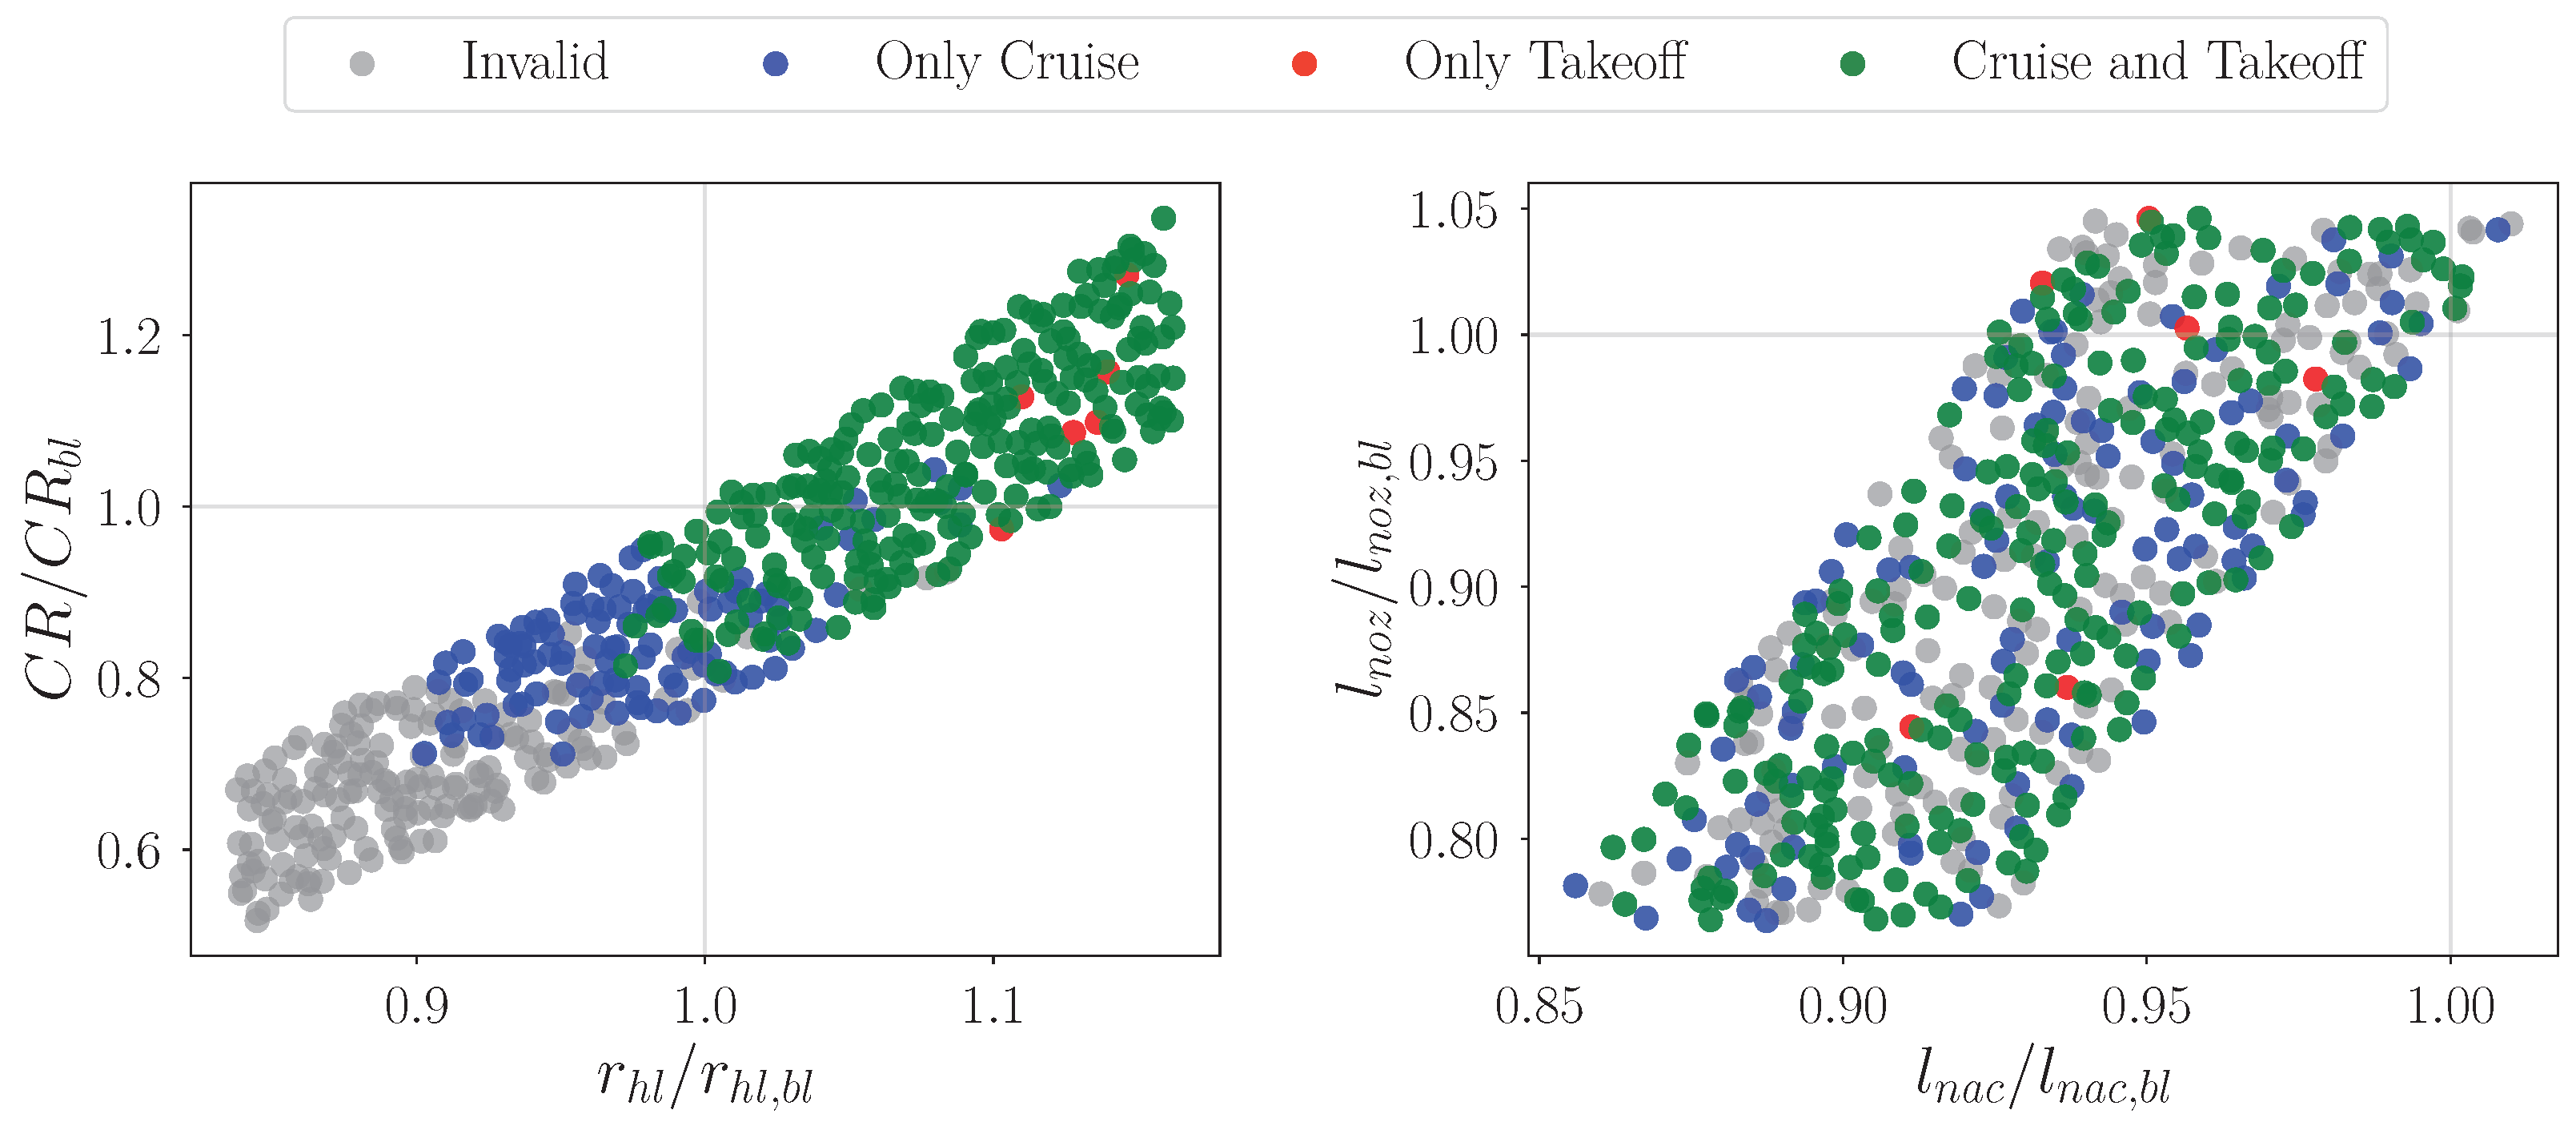
The DOE database comprises 512 individuals, generated using a Sobol sequence [
49]. The design space spanned by the resulting geometric variants is illustrated in
Figure 11, where the exploration bounds of key global dimensions are shown relative to their baseline values. The chart also depicts the distribution of converged individuals according to the acceptable simulation outcome. It is clear that, while a large number of valid solutions are retained, the proportion of non-converged cases remains non-negligible. A potential correlation between simulation invalidity and geometric configuration emerges when considering the intake-specific cross-sectional dimensions. Two key parameters are examined: the Contraction Ratio,
—where
is the throat area—and the highlight radius. Although the overall sampling is symmetric about the baseline, the invalid cases appear predominantly clustered in the lower-left region of this subspace. This is attributed to the boundary condition setup: with a fixed mass flow rate, reducing both CR and highlight radius increases the
, potentially leading to critical lip accelerations. As a result, convergence is often not achieved at cruise conditions, and even less so under off-design scenarios. Conversely, as these two parameters increase, the number of valid individuals rises. Initially, these include cases converging only at cruise, while further enlargement allows convergence under off-design conditions as well. At the upper-right corner of the parameter space, some individuals exhibit convergence exclusively at off-design. This outcome is associated with excessively low cruise
values, which destabilize the flow along the external wall—often due to extensive cavitation or flow separation—thus promoting off-nominal operating regimes. Regarding axial-extension parameters, such as the nacelle length (
) and the nozzle length (
), the design space is largely populated by compact nacelle configurations. While the database includes geometries with longer nozzles, most individuals correspond to shorter overall system lengths, with relatively few solutions representing longer configurations.
3.3. Optimal Geometries for Objectives Optimisation
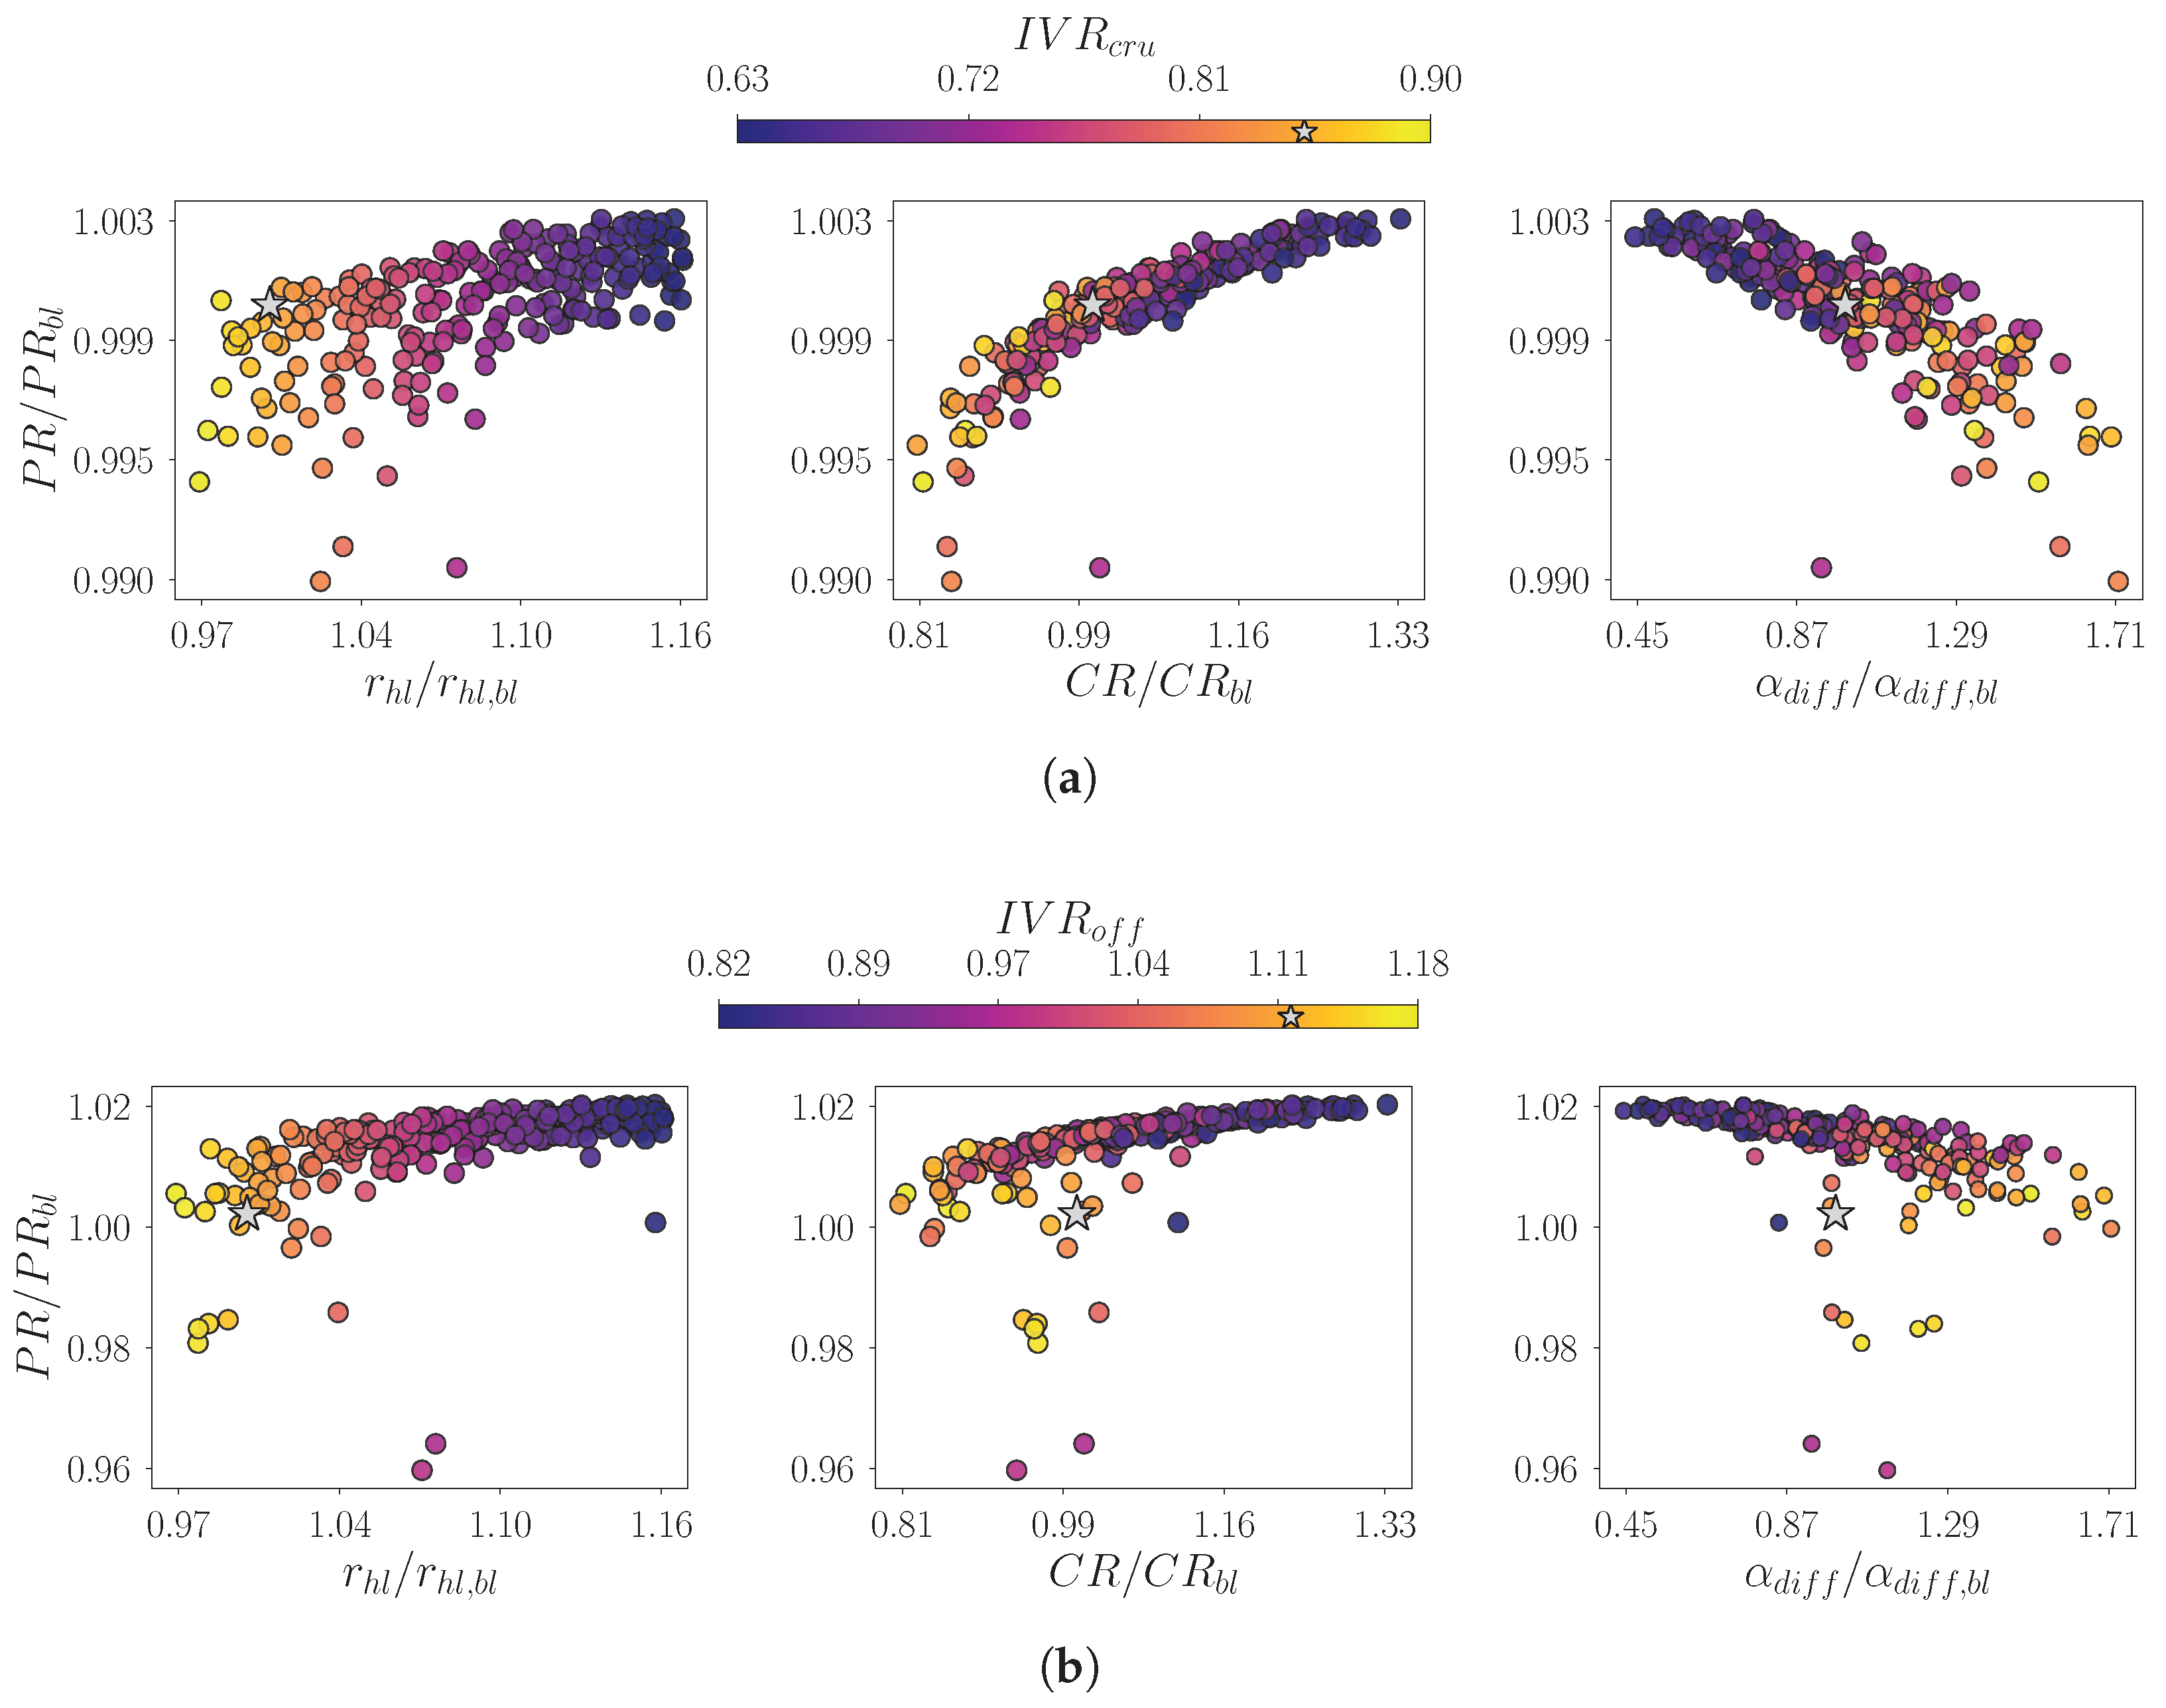
The results of the simulated geometries are analysed to detect potential correlations between propulsive statistics and relevant shape parameters at both in- and off-design operations. Specifically, the recovery sensitivity is initially investigated considering intake relevant dimensions (
Figure 12). These include the highlight radius, the contraction ratio and the equivalent diffuser angle,
, computed from the axial (
x) and radial (
r) coordinates of the PIP and the throat sections, according to the following expression:
At design operations (
Figure 12a), the propulsive statistics exhibits an evident correlation with both
and the
. In fact, under the same flow configuration, increasing the geometric parameter results in lower streamtube capture ratios. This shape variation shows to improve the recovery capability, an evidence which is further confirmed by the reduction of the dots dispersion and the dissipation of outliers. Enhanced
can also be achieved with larger contraction ratios. However, this approach does not show a clear correlation with
, apart from a tendency for lower
values to cluster toward the right side of the chart. Notably, the individuals distribute on a narrow band, clearly indicating a non-linear trend with reduced steepness at higher
values. Conversely, smaller diffuser angles are required to increase the recovery capability. The overall trend again displays a non-linear behaviour, with increased dispersion as the geometric parameter grows—an effect that approximately corresponds to higher capture ratios.
Performing equivalent statistics at off-design conditions, similar considerations can be drawn (
Figure 12b). In fact, the
preserves the same dependencies on the geometrical parameters. However, it is interesting to notice that, in this case, all charts depict distinct correlations, made clearer by considerably narrower dispersion bands. On the other hand, a greater number of outliers arises. Even the baseline solution is evidently outside the clustering of the database individuals, especially when
and
sensitivities are considered. This aspect highlights that most individuals’
values lie above the reference geometry’s performance. Moreover, the trend is flatter compared to the previous analysis. This evidence suggests a wide room for optimisation at non-nominal operations, with potential to improve the parameter by at least
. This represents a clear advancement beyond the cruise design improvements reported in previous studies [
21]. This combined multi-point investigation reveals that the two objectives are mutually consistent, indicating that a geometry improving cruise operations can also optimise off-design performance.
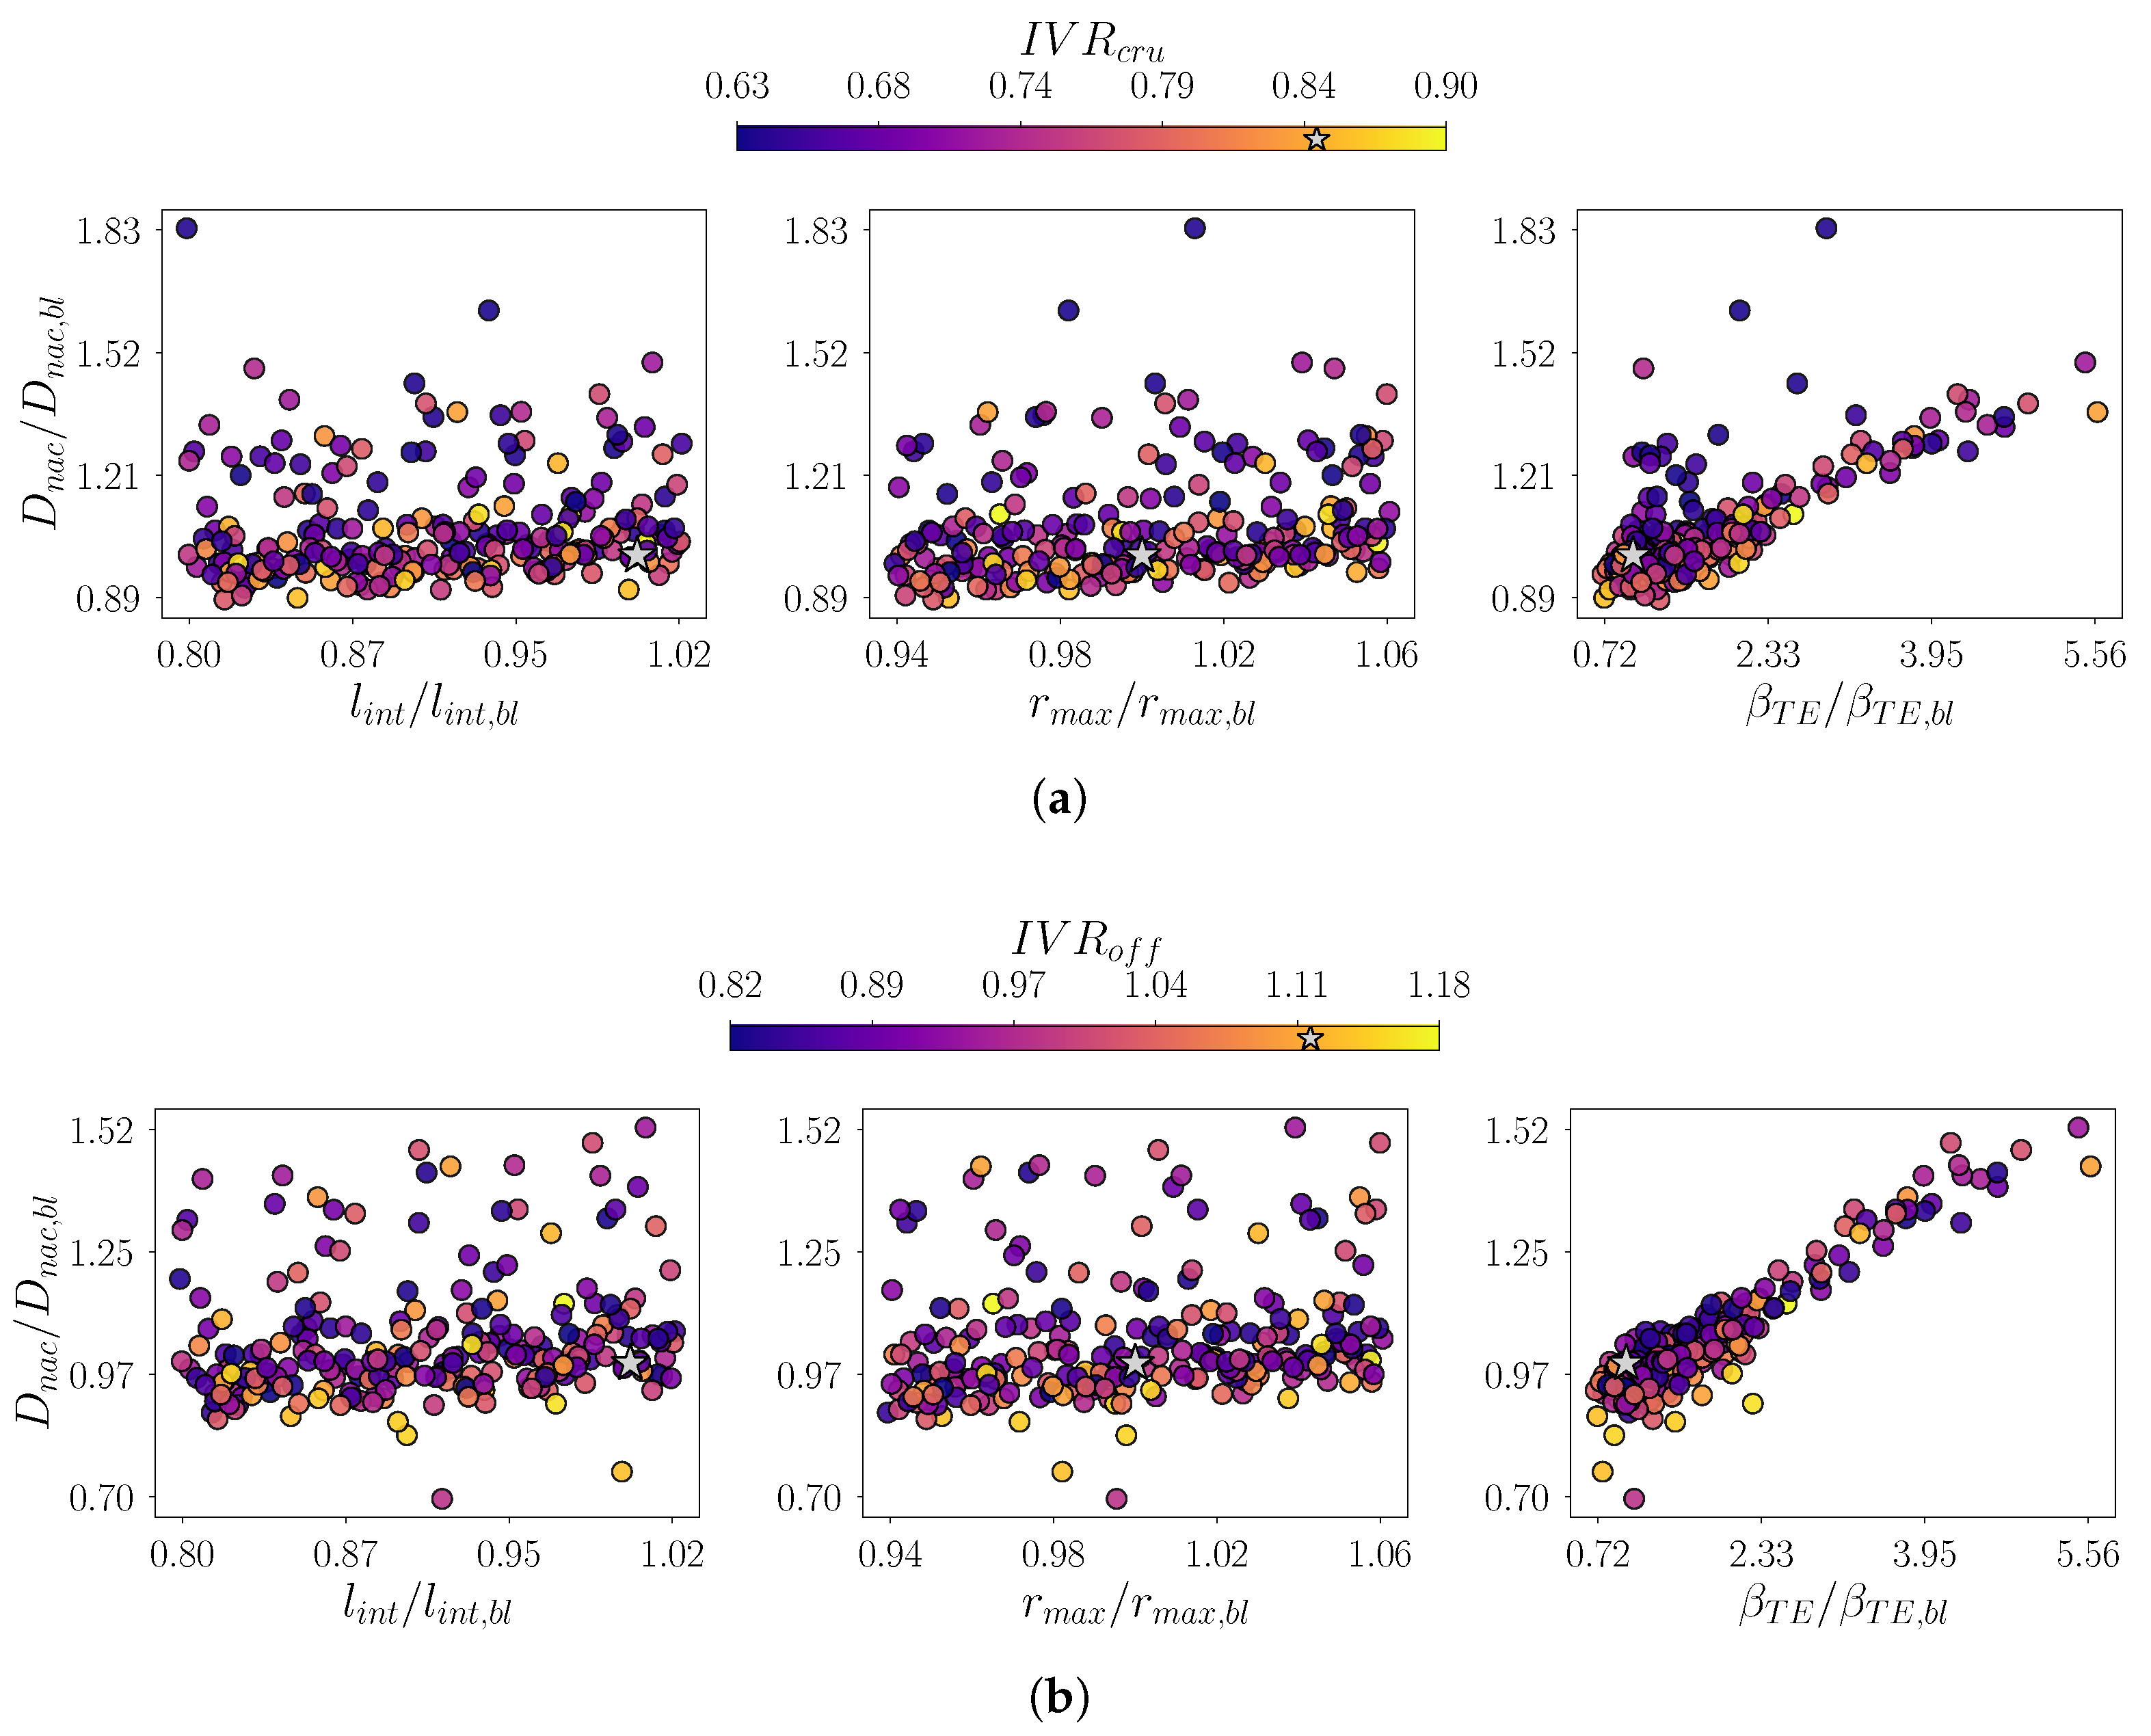
To trace the impact of the overall geometry variation, an equivalent analysis is performed on the nacelle drag,
(
Figure 13). In this case, the chosen geometrical parameters are: the intake length,
, the maximum nacelle radius,
, and the trailing edge cowl angle,
, which can be derived directly as the slope of the segment connecting the ending control points of the external nozzle B-spline.
For in-design operations (
Figure 13a), the statistic’s distribution suggests that shorter intakes generally promote drag reduction. While a significant number of outliers exceed the baseline drag, the majority of individuals cluster within a denser region. This latter exhibits a quasi-linear trend, indicating that reducing axial extension generally leads to design improvement. A comparable pattern emerges when analysing the influence of the maximum nacelle cross-sectional dimension. Although the variations are symmetrically distributed around the reference value, the results reveal a consistent reduction in nacelle drag with decreasing diameter—attributable to an overall thinner body. In contrast, the sensitivity to the boat tail angle presents a more scattered distribution. Most geometries group near the baseline, showing both improved and degraded performance. Although the geometric features of the shape variants complicate establishing a clear correlation, the wider spread across the
range reveals a discernible trend. Steeper wall gradients generally correspond to higher drag on the rear nacelle section, thereby degrading overall performance. Finally, no meaningful correlations are observed between
and any of the three geometric parameters in the charts.
The analysis of statistics related to off-design operations (
Figure 13b) confirms previous observations regarding
. In fact, the sensitivities to the three parameters exhibit trends similar to those observed for cruise performance. However, most of the individuals cluster around values that have lower improvements compared to nominal conditions. Interestingly, in this case all the charts show the presence of few outliers providing significantly better performance, while the ones featuring higher drag are considerably more. Unlike pressure recovery, potential improvements at off-design operations are limited. However, the consistency with cruise design enhancements allows reducing the analysis effort by focusing on a single operating point for each performance metric.
The previous analysis showed that both the
and the nacelle drag exhibit the same sensitivity to the relevant geometrical parameters at the chosen operating points. According to this consideration, the problem is further restricted and the investigation is progressed using a single objective for each advancing regime. Specifically, the
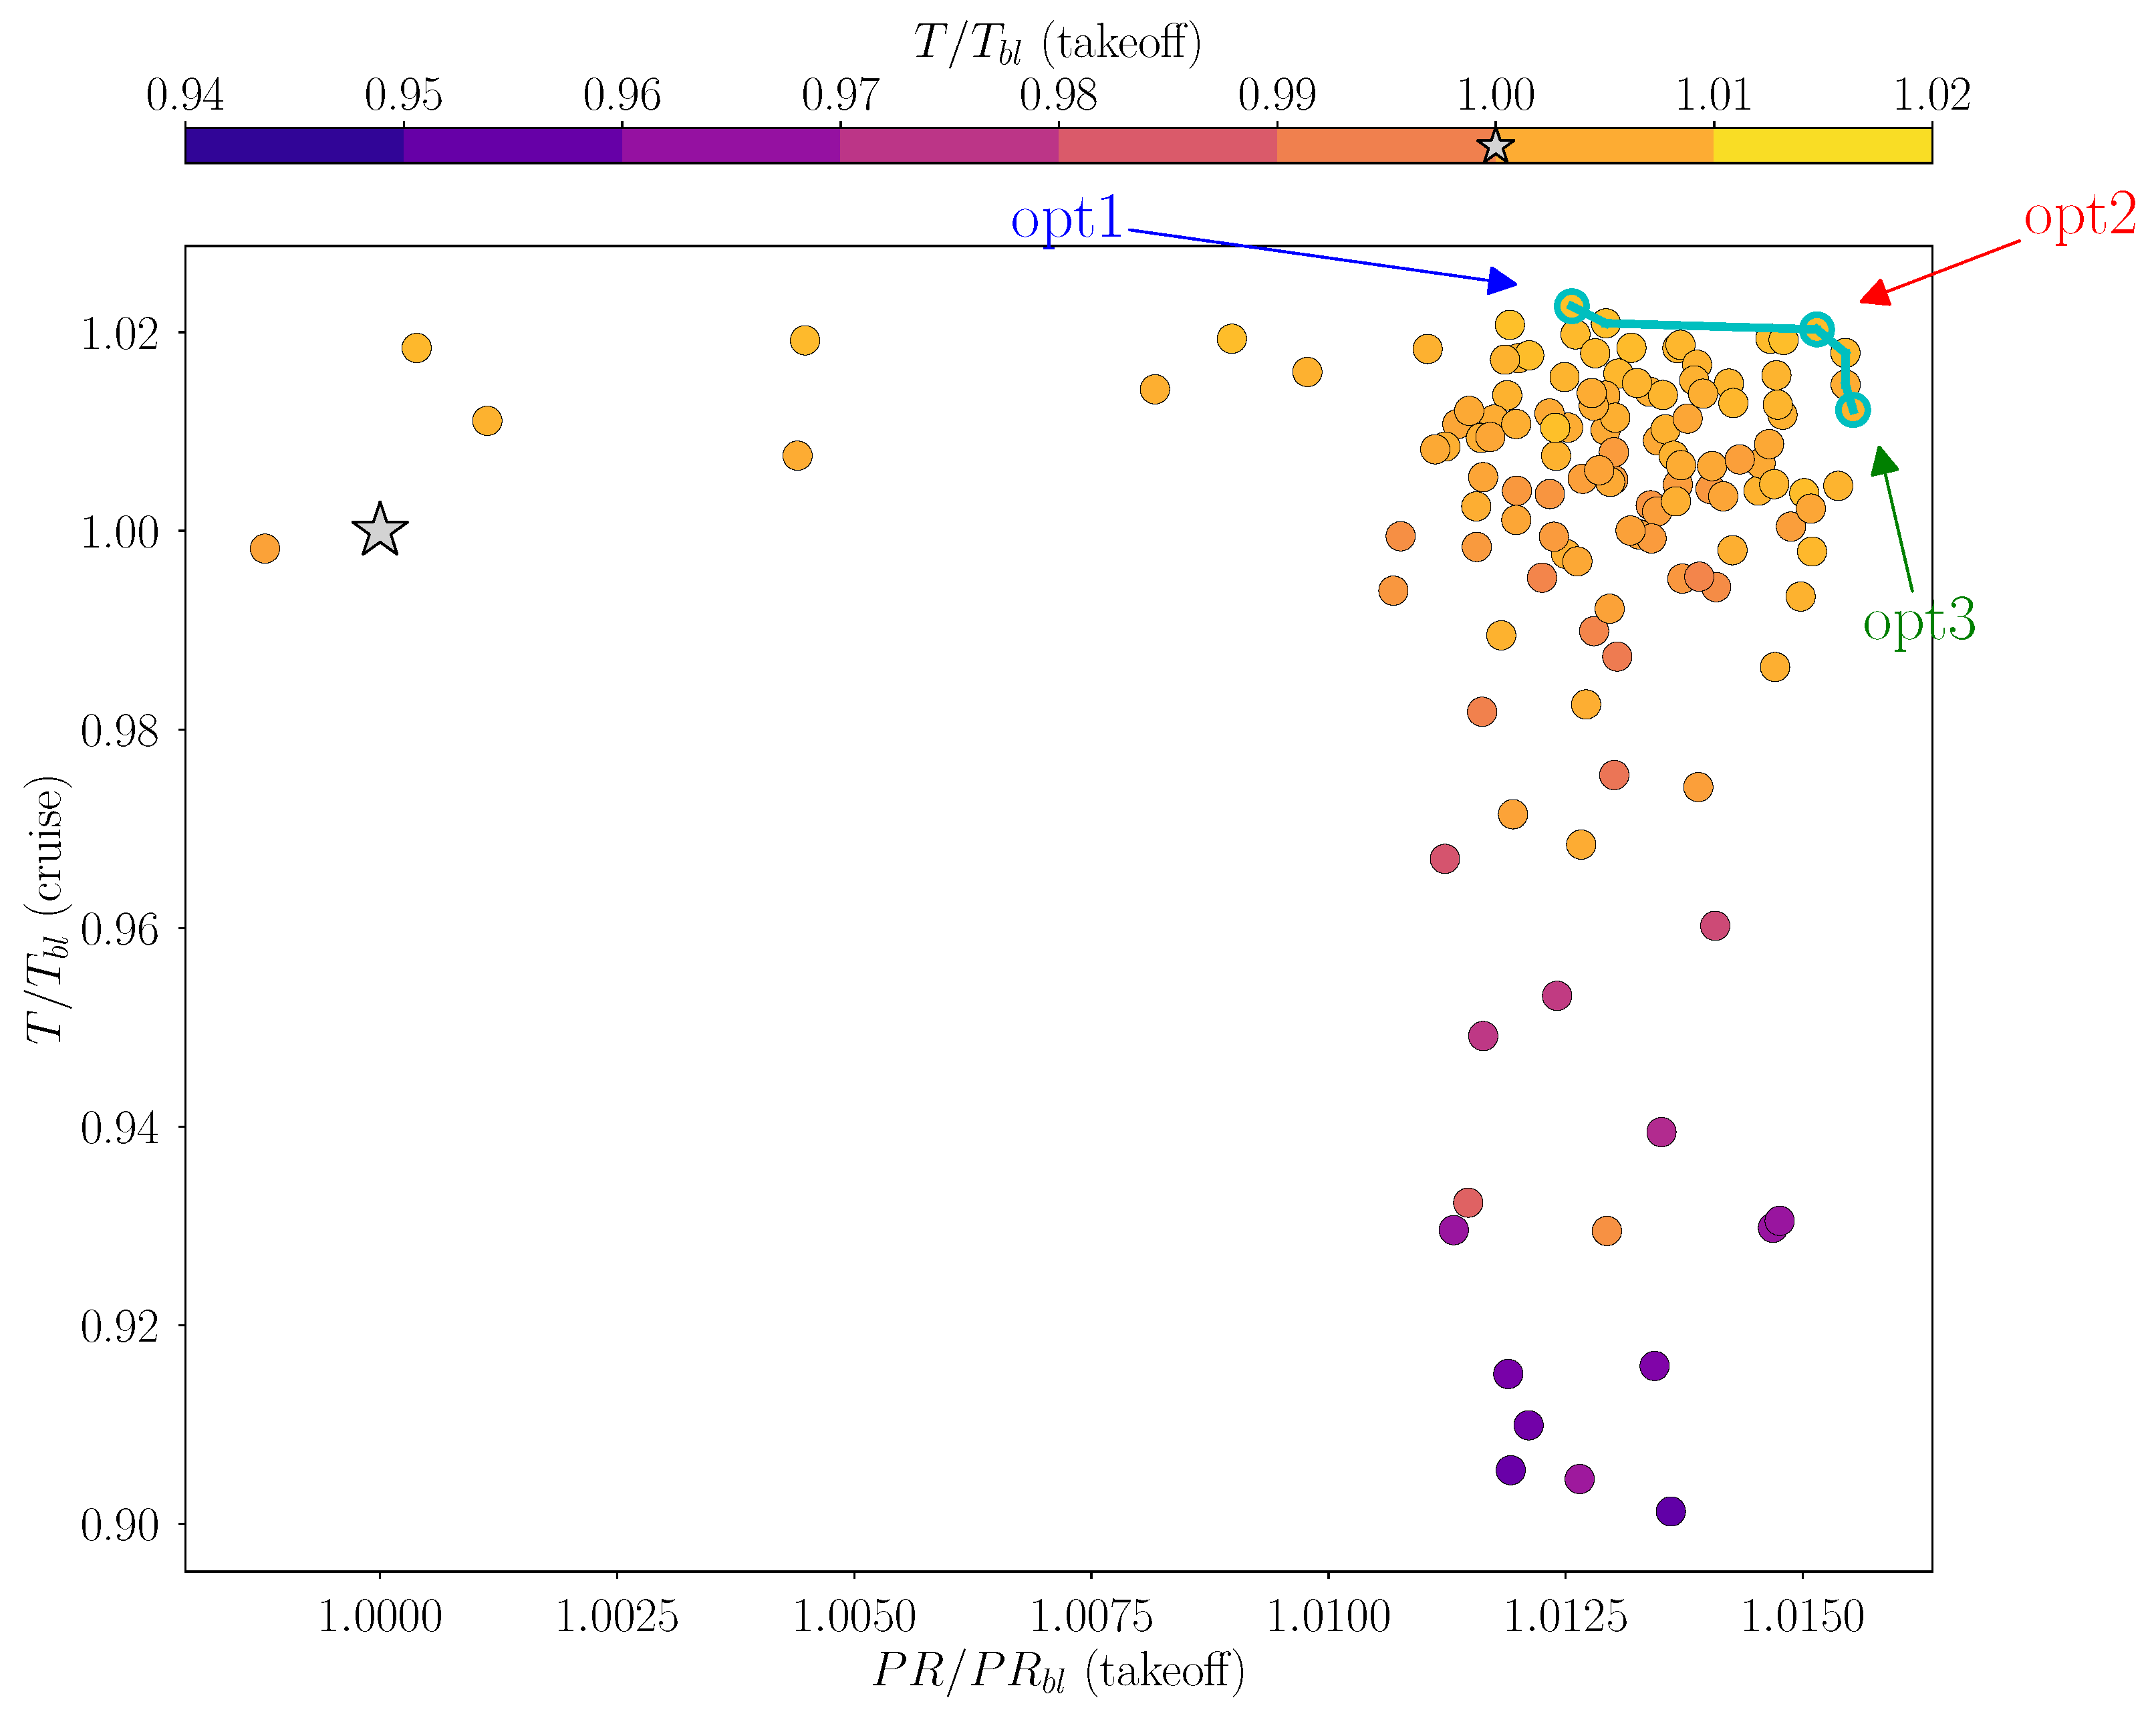
showed to be a fundamental statistic to be considered during off-design operations. Additionally, its tendency to be easily optimised under this operating regime makes it a convenient choice. On the other hand, maximising the net force during long-range operations is recommended to improve propulsive efficiency, which is also supported by the wider potential for drag minimisation at cruise conditions. Plotting the two objectives function space confirms their conflicting nature as a Pareto front emerges on the upper right region (
Figure 14). To preserve the information regarding the excluded statistics, only a selected set of individuals is reported. Specifically, only the geometries featuring cruise
are retained, while the off-design net force is adopted to colourise dots.
The chart indicates that almost the entire set of individuals improves off-design pressure recovery. Concerning thrust, many geometries exhibit worse performance, even though the majority groups at enhanced operations up to . Analysing the colour trend, its smooth distribution confirms that maximising cruise performance is also beneficial for off-design conditions, ensuring a similar range of potential improvements.
Three individuals are then selected for additional investigation, to properly characterise how geometrical properties affect the propulsive objective functions. They are chosen from different locations on the Pareto front, which enables to focus on the proper features of optimal individuals. The first and the last individuals, respectively labelled as
opt1 and
opt3, favour opposite objectives. Specifically, the former has the best drag performance, while the latter provides the highest
increment. A third geometry, named
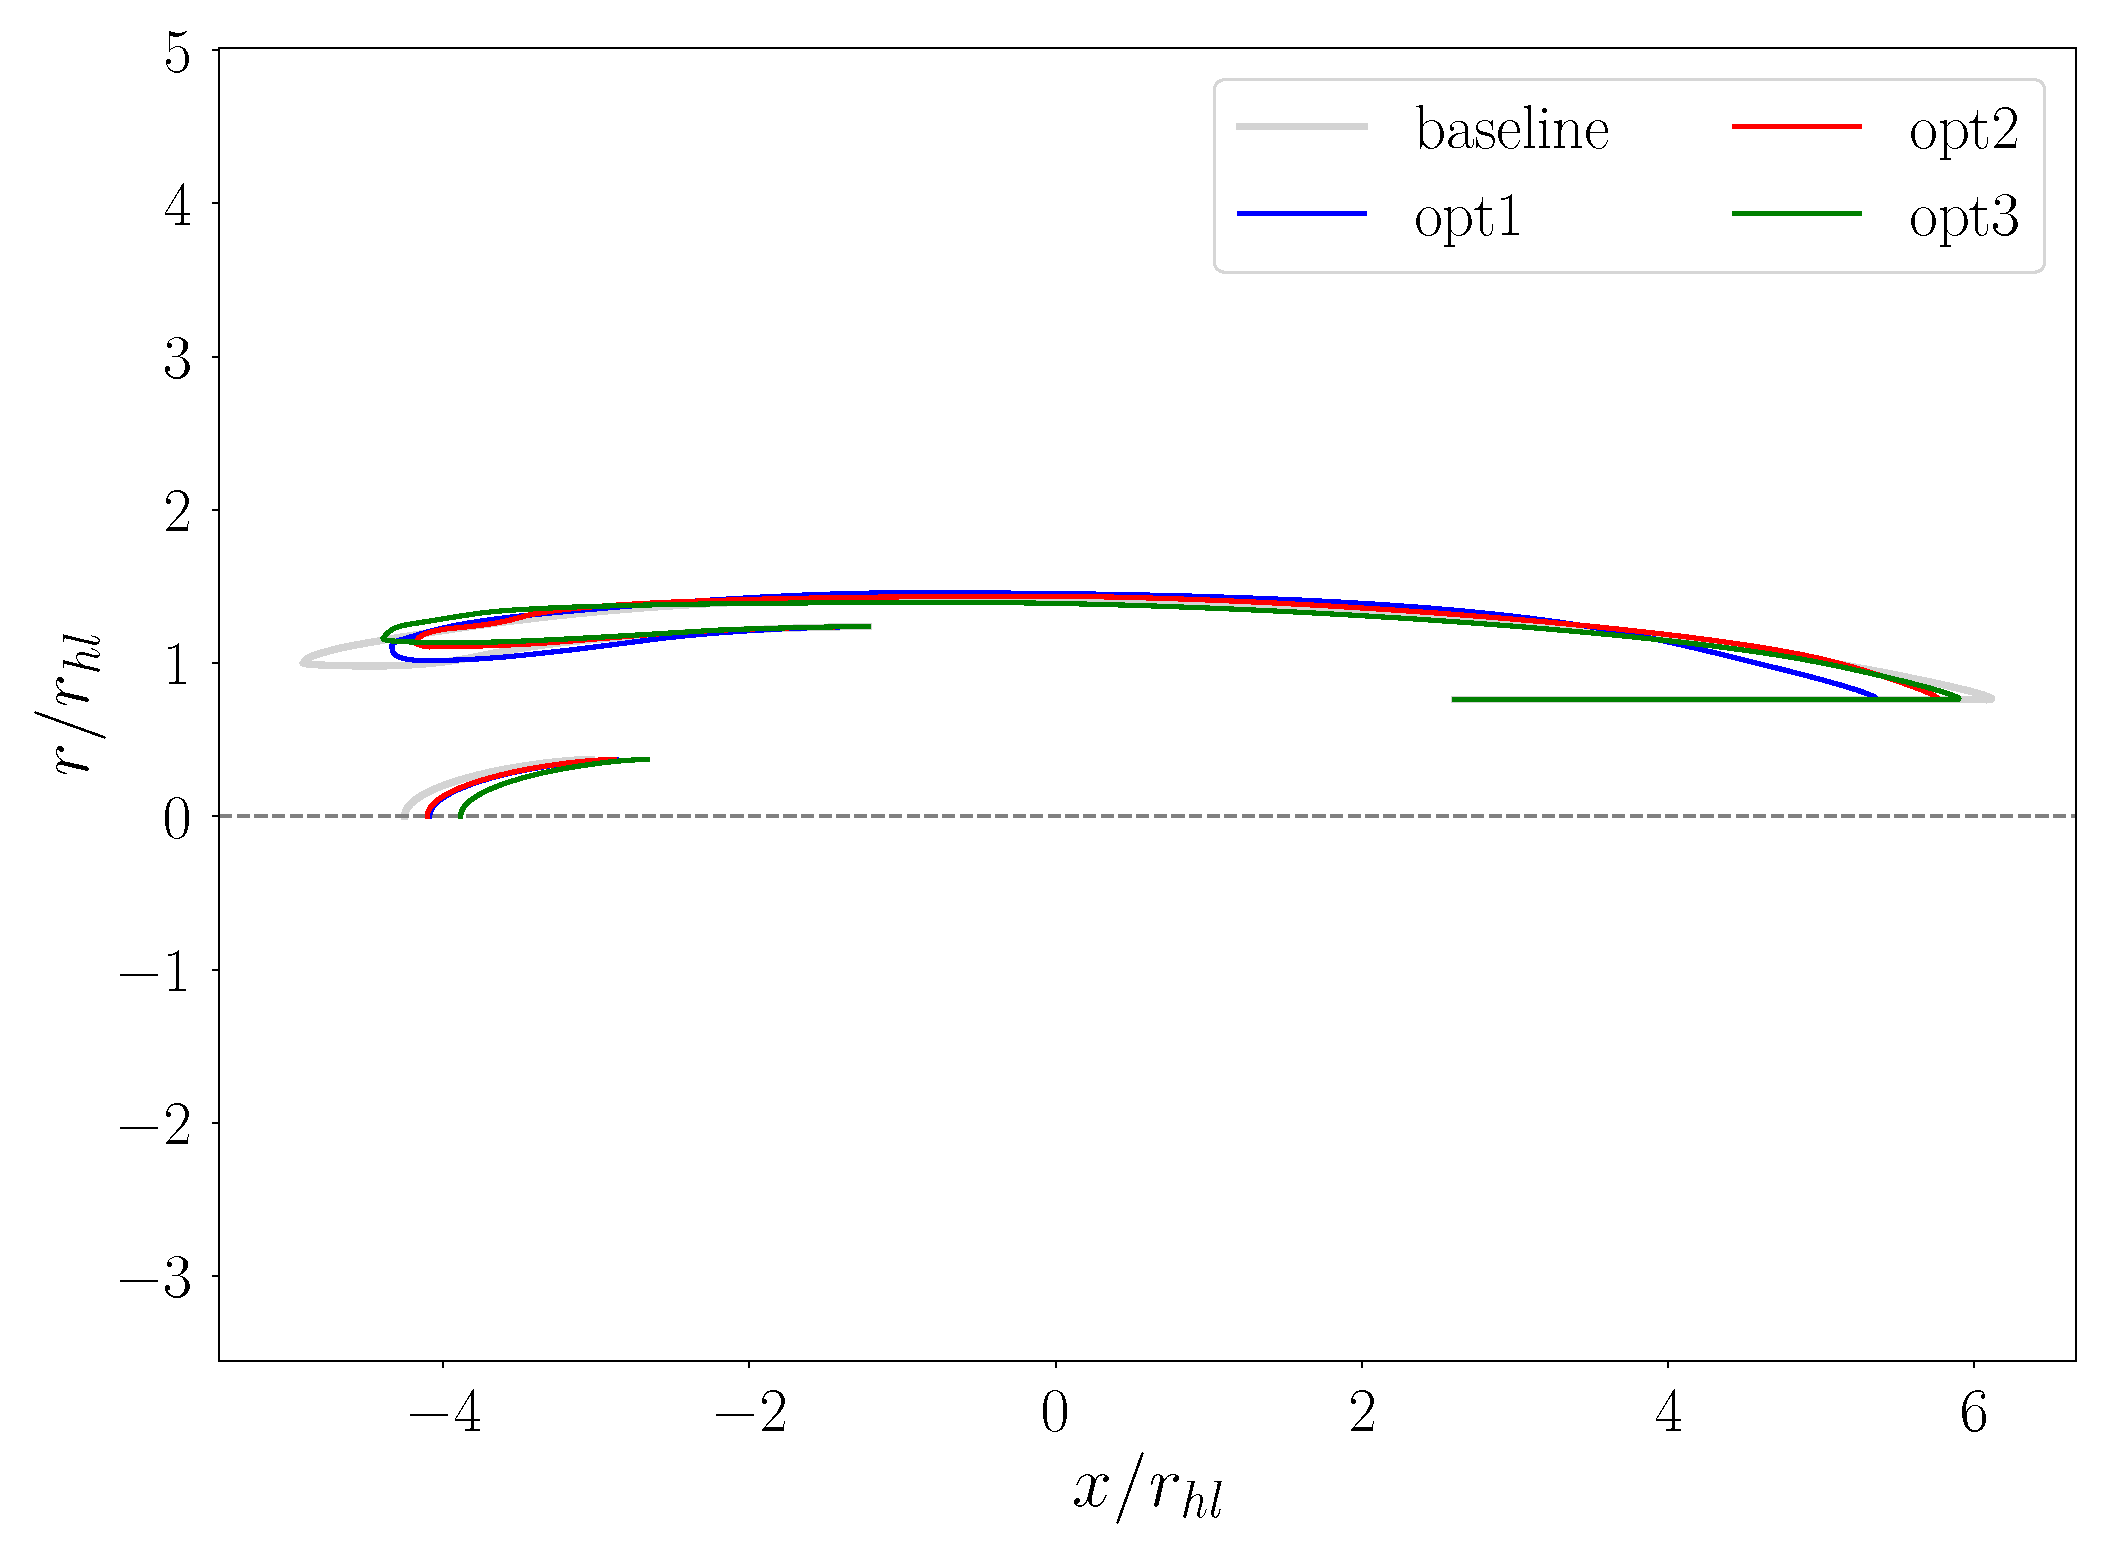
opt2, is chosen at mild conditions to characterise trade-off solutions. The three geometries are compared with the baseline in
Figure 15. Maximum net force solution is characterised by a short intake configuration (
), where the lip extension is minimised and the spinner tip is aligned with the throat section. Compared to the baseline, the highlight section is significantly enlarged by
with blunter leading-edge. The internal diffuser curvature results smoother, while the nozzle extension appears considerably reduced, leading to an overall length decrease by
. On the other hand,
opt3 features a slightly lower intake length reduction, even though the capture section is further increased (
). This results in a overall flat profile of the internal nacelle wall, with a considerably larger lip axial extension. In this case, the sharp profile at the leading-edge is preserved, while the spinner is significantly retracted and separated from the throat section. Concerning the trade-off geometry,
opt2, its specific properties partially combines the others’ characters. In fact, while the nozzle length and capture sections feature mild sizes, the intake length is evidently the smallest among the individuals (
). The spinner location, instead, is almost the same as
opt1.
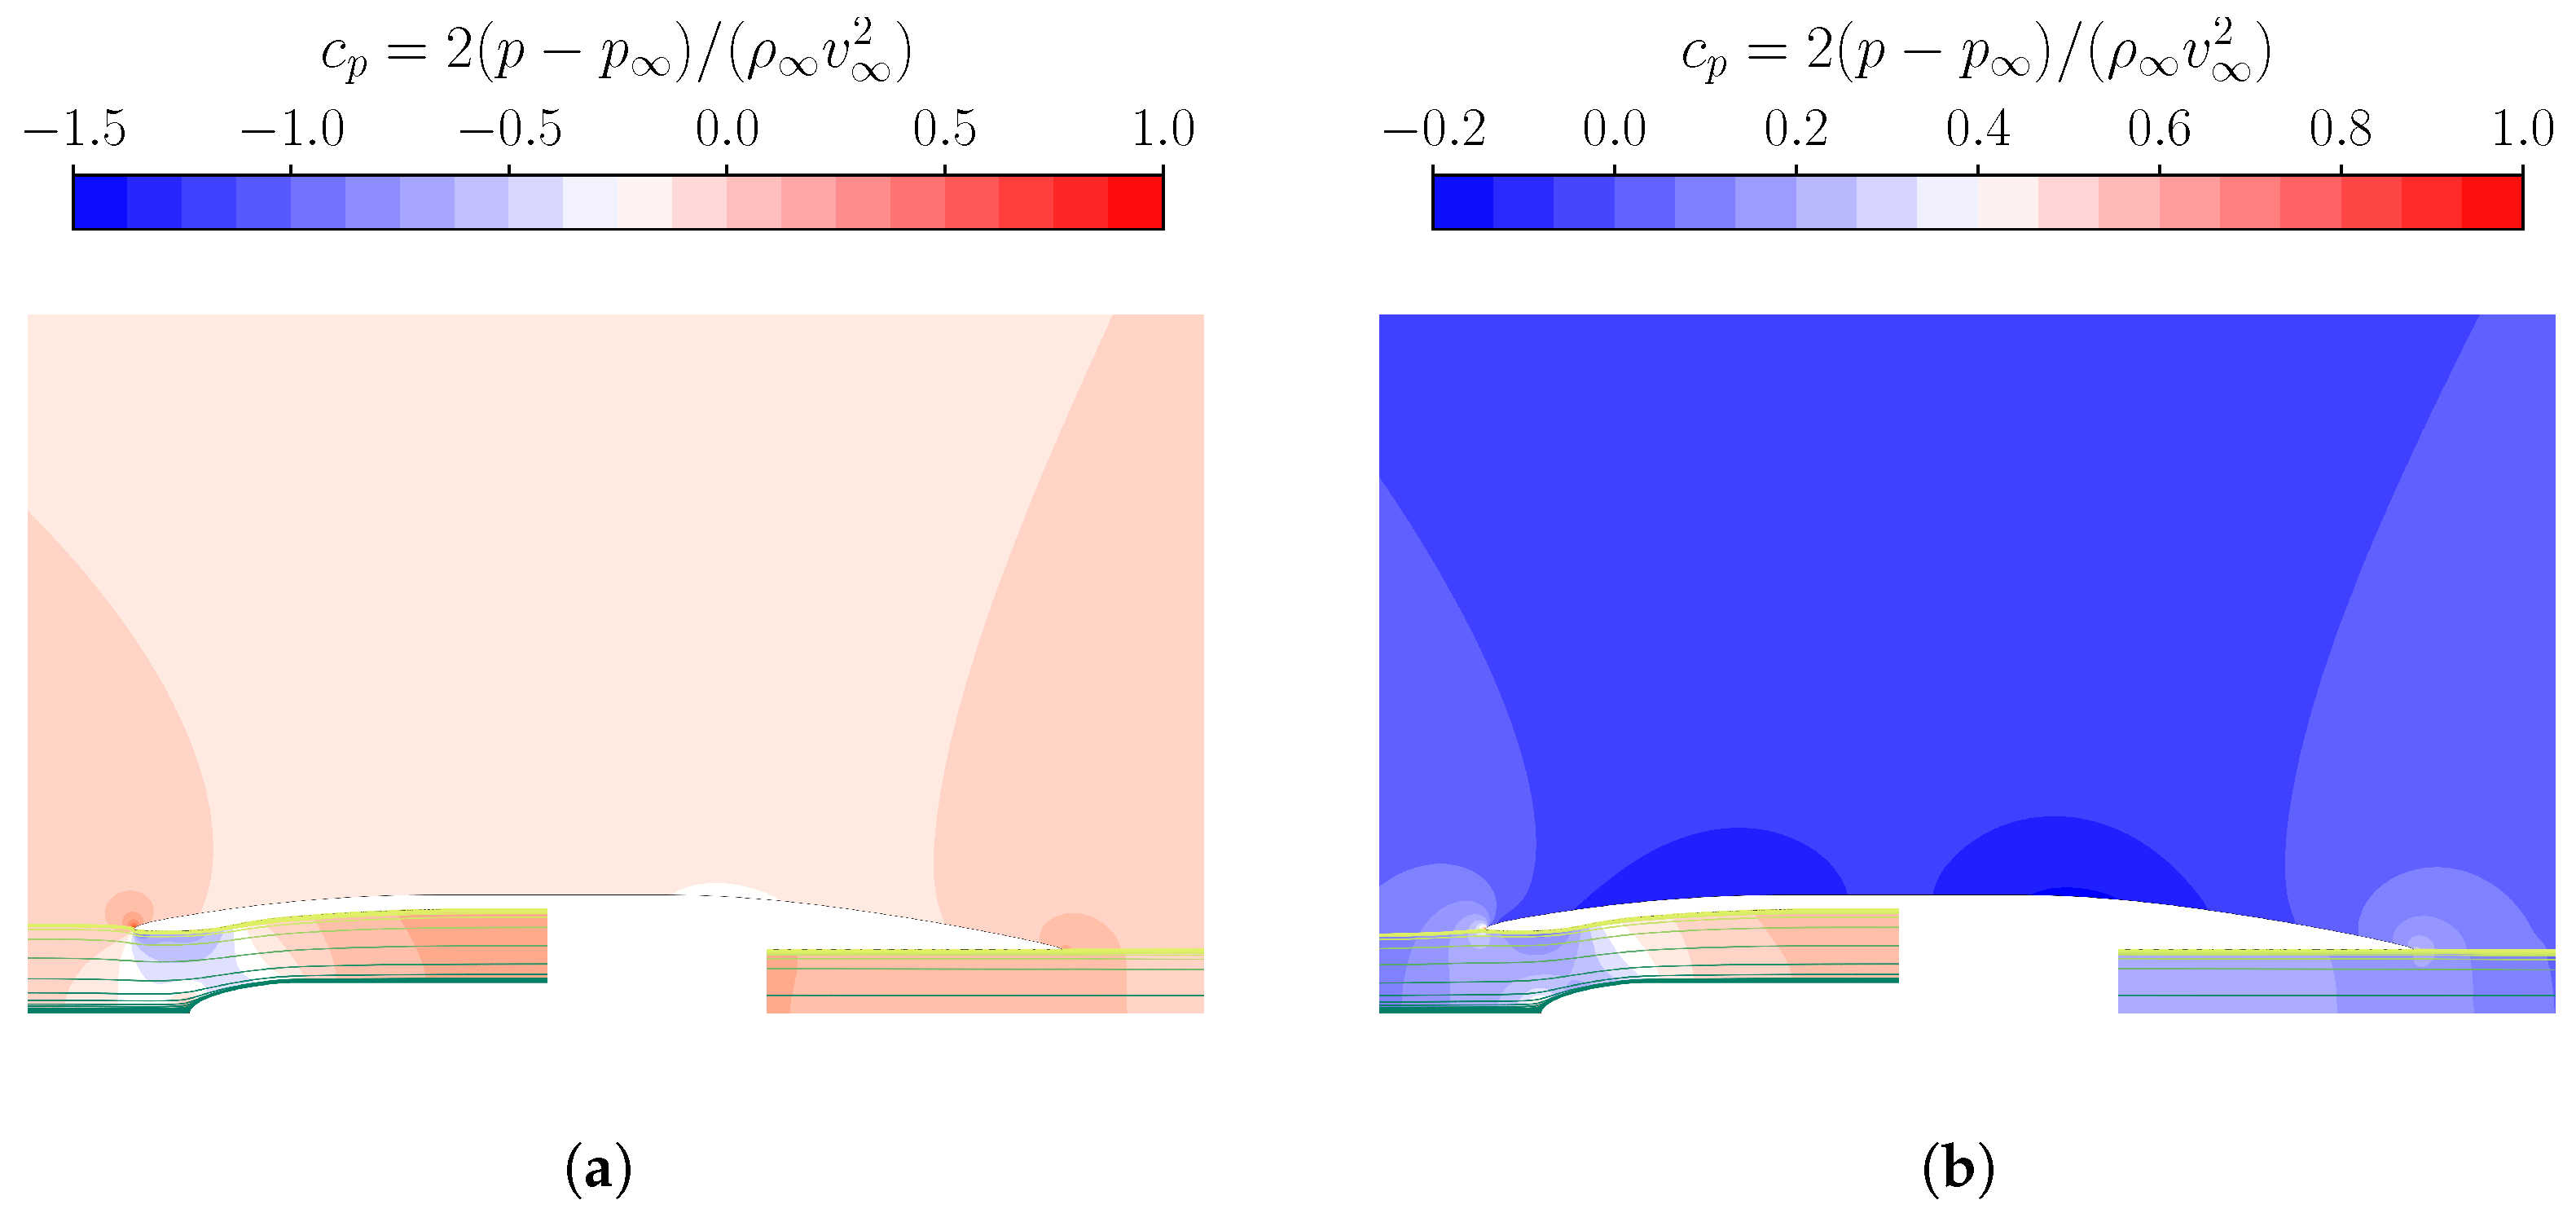
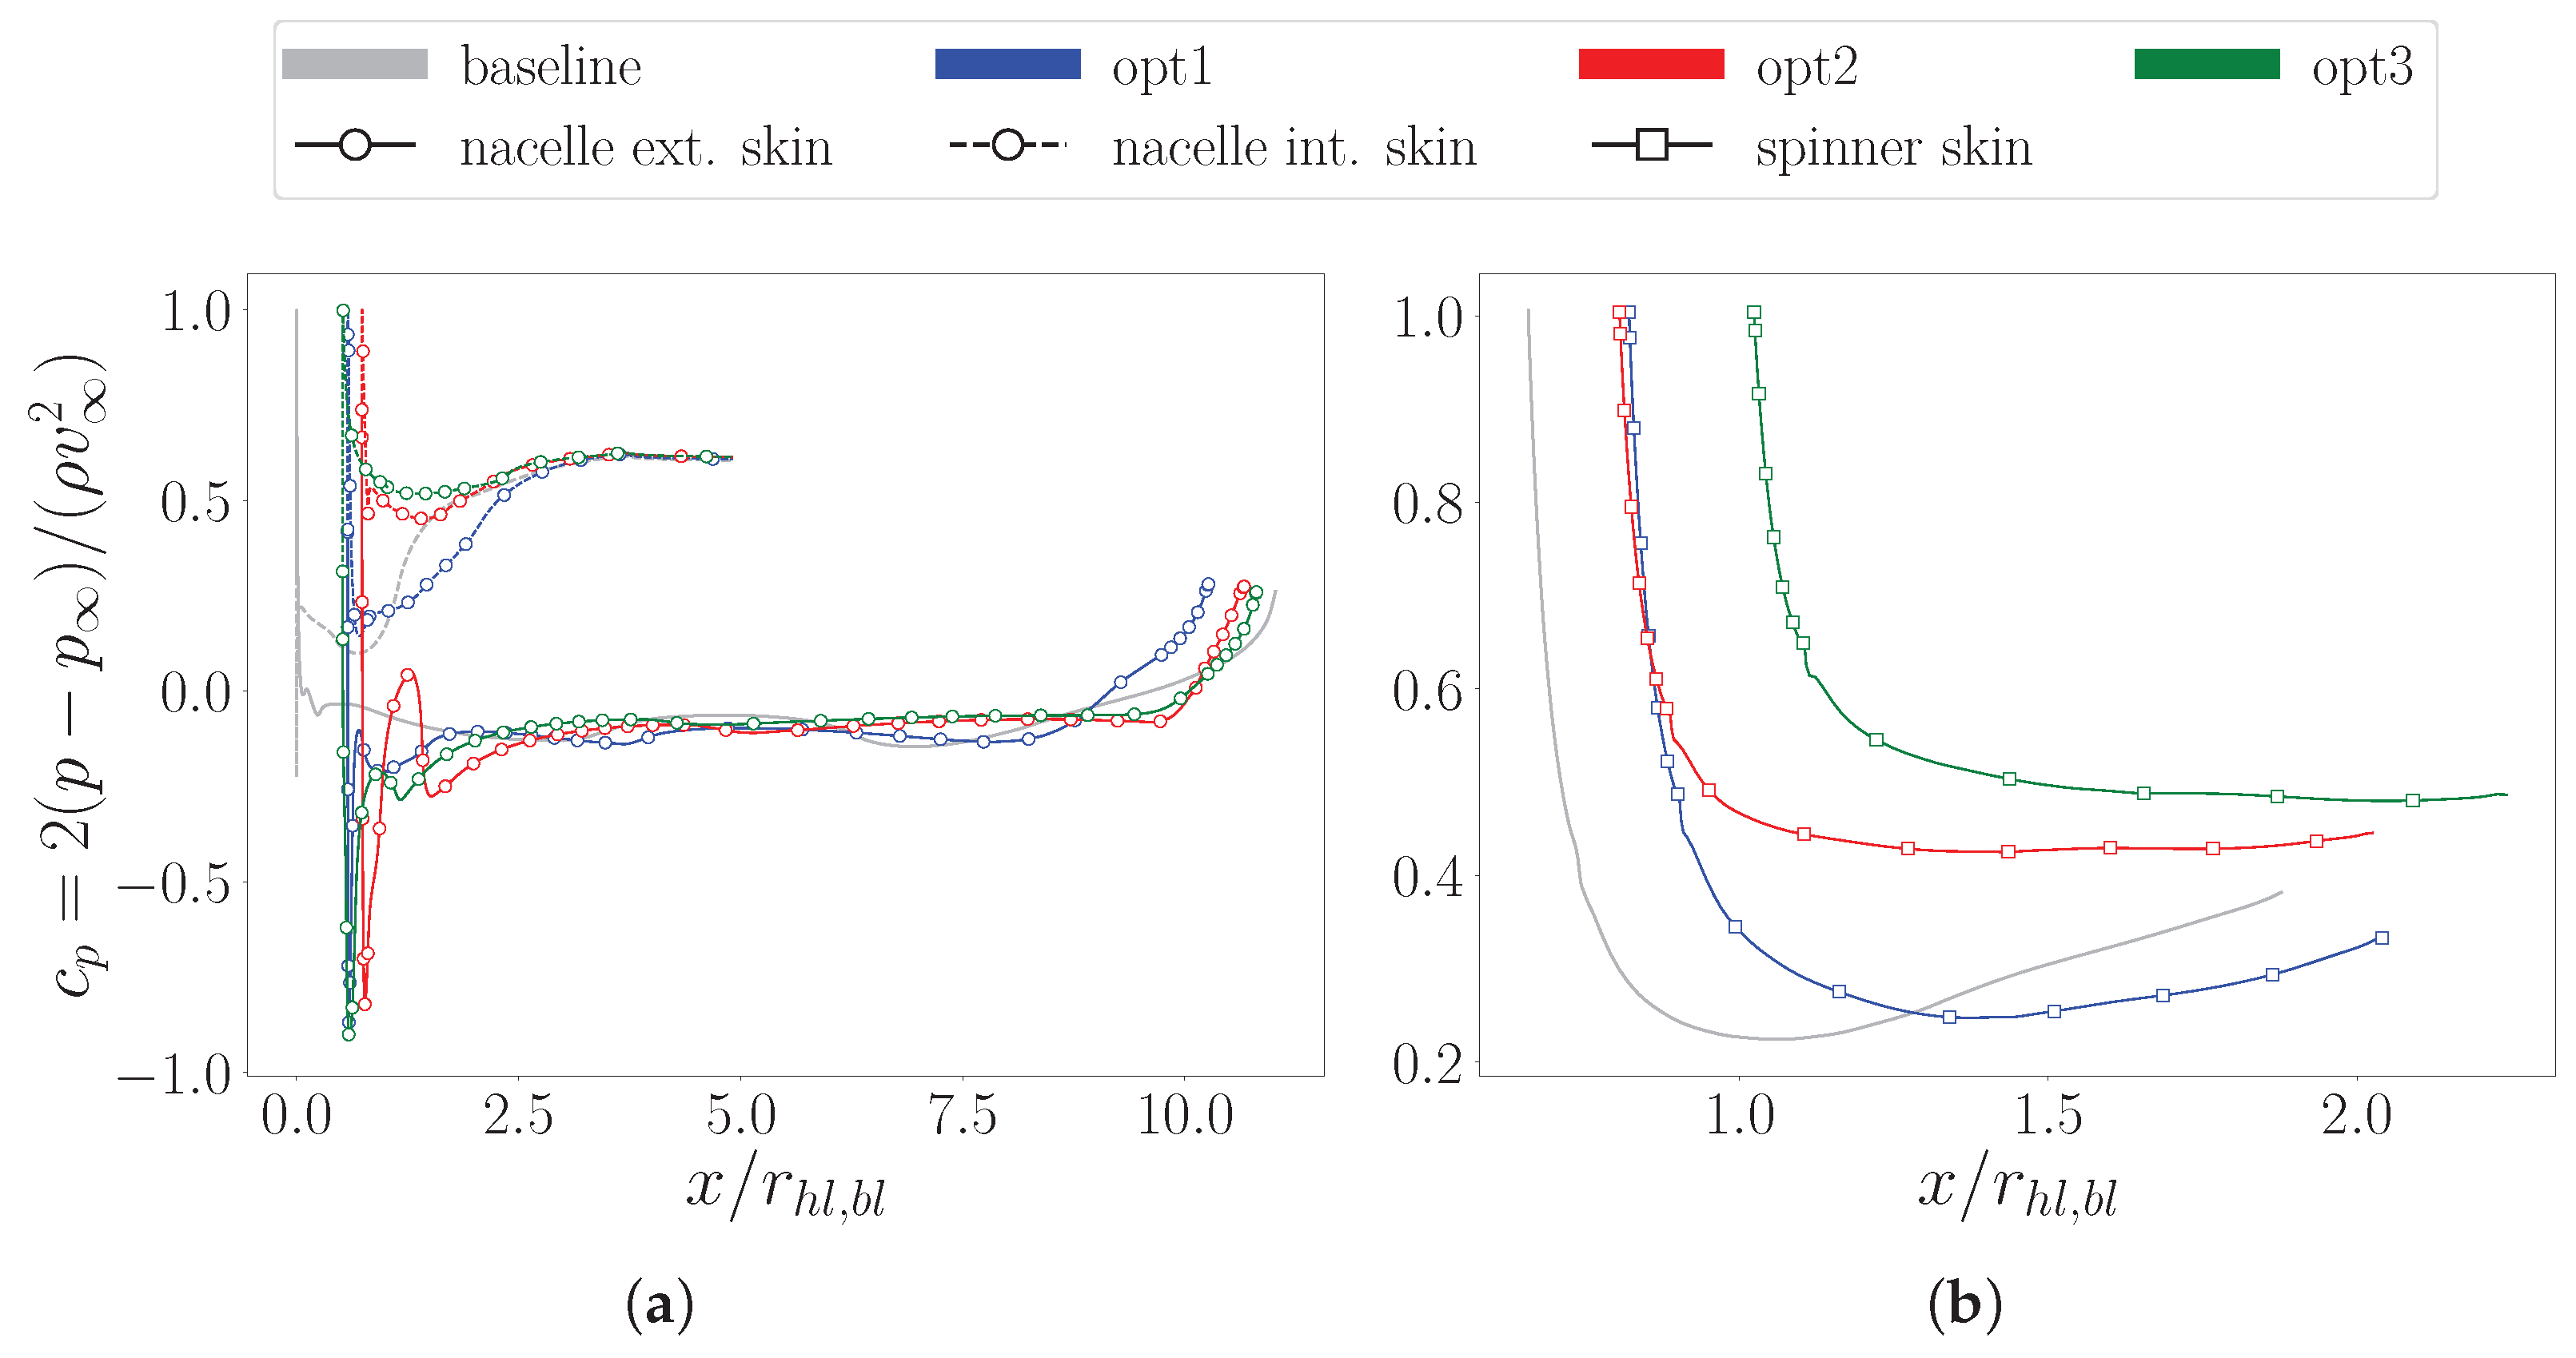
To analyse the flow field distribution locally, the wall pressure coefficient is extracted along the nacelle’s and spinner’s walls. During design operations (
Figure 16), the flow acceleration on the external surface (
Figure 16a) induces similar pressure coefficients values. Despite considerably exceeding the baseline negative coefficient, they do not reach vapour condition: in fact, according to Equation (
10), at cavitation onset
. The evolution then rapidly re-aligns with baseline pressure field, depicting local overshoots, particularly pronounced in the case of
opt2. It should be noted that the use of random sampling for optimisation may introduce irregular local profile curvatures, which could be avoided through more refined, direct approaches.
Major differences can be detected along the internal surface. Specifically,
opt1 exhibits a generally lower curve, gradually matching the other solutions toward the PIP. Especially in the contraction region, this individual exploits higher local acceleration to reduce the resistance force pressure component. This evolution is particularly effective on the spinner walls as well (
Figure 16b). In fact, the pressure distribution is generally lower along the entire profile compared to any other geometry. This enables a consistent reduction of the drag force related to the spinner, favouring the overall net force maximisation.
The evolution at off-design operations is considerably different (
Figure 17). Specifically, as the the stagnation point shifts outward, local accelerations on the external walls result mitigated (
Figure 17a). Conversely, stronger pressure drops occur on the internal surfaces. As a results, the risk of cavitation onset augments in the internal duct, critically inducing the formation of small local vapour bubbles as in the case of baseline geometry. While any other shape prevents this occurrence, the pressure variations are consistent, leading to higher depressions inside the diffuser compared to the outer shroud. The main consequence is that the inlet diffusion process is compromised by highly distorted flows which introduces additional losses, thereby affecting the pressure recovery. In this regard, the advantage of
opt3 is that the internal flow is only marginally influenced compared to cruise conditions. In fact, despite exhibiting lower values, the coefficient curve depicts a similar smooth and flat behaviour. A similar consideration applies to the evolution along the spinner walls (
Figure 17b). As a result, by controlling flow perturbations throughout the internal channel, this geometry ensures high recovery capability when the propulsor processes a non-optimal capture streamtube. However, this comes at the cost of compromised propulsive efficiency.


