1. Introduction
Maritime transportation, accounting for approximately 80% of global trade volume [
1], plays an indispensable role in the global economy. Nevertheless, traditional marine propulsion systems heavily rely on fossil fuels, contributing significantly to carbon emissions and global warming. In response, the International Maritime Organization (IMO) implemented new specifications in 2024 aiming to substantially reduce carbon emissions from international shipping [
2], making the development and application of clean, efficient, and sustainable marine propulsion technology an urgent necessity for the maritime industry.
Currently, various alternative energy technologies, such as fuel cells, lithium batteries, solar photovoltaic systems, wind propulsion, and biofuels [
3], are being explored and implemented in marine vessels. Among these, proton exchange membrane fuel cells (PEMFCs) have emerged as promising candidates due to their high power density, excellent conversion efficiency, rapid start-up, low operating temperature, and zero-emission [
4,
5,
6]. Maritime application of fuel cell technology began in 2003 with Norway’s offshore supply vessel “Viking Lady”, marking a significant milestone for marine fuel cell propulsion. Since then, extensive research efforts have advanced PEMFC technology from conceptual studies to practical maritime applications.
Despite their advantages, PEMFC systems generate substantial heat during operation, presenting significant thermal management challenges, such as localized overheating and non-uniform temperature distribution. Localized overheating accelerates component degradation and increases safety risks, whereas non-uniform temperature distribution creates local hotspots, impeding proton transport and conductivity, thus reducing cell durability and stability [
7]. Therefore, effective thermal management is crucial for reliable PEMFC operation in maritime environments. Various cooling techniques, including air cooling, liquid cooling, heat sink cooling, and phase change cooling, have been investigated for PEMFC thermal management [
8]. While both air and liquid cooling are common methods, large-scale PEMFC stacks typically employ liquid cooling due to their superior cooling capacity compared to air cooling. Cooling plates with internal cooling flow channels effectively dissipate heat, prevent overheating, and promote uniform temperature distribution within PEMFC stacks [
9,
10].
The thermal-hydraulic performance of PEMFC cooling plates significantly depends on the cooling flow channel configuration [
11]. Numerous innovative designs, such as biomimetic leaf-vein branch channels [
12], fin channels [
13], and tree-shaped fractal channels [
14], have been proposed to enhance cooling efficiency. However, these complex structures often introduce manufacturing difficulties and increased costs. Comparatively, conventional parallel and serpentine channels, characterized by simple geometries, have been extensively studied and widely implemented. Many researchers have developed innovative designs based on these conventional flow channels [
15,
16]. Moreover, previous research has consistently shown that serpentine channels typically provide superior cooling effectiveness compared to parallel channels [
17,
18,
19,
20].
Extensive comparative studies have been conducted between conventional serpentine and other innovative serpentine channel configurations, continuously improving serpentine channel designs. Innovative variants, such as multi-pass serpentine [
21,
22], serpentine mini-channel heat sinks (SMCHSs) [
23], and mixed serpentine (V-I) [
24] demonstrate the superior performance of maximum surface temperature and temperature uniformity. To further optimize the thermal performance of serpentine channels, Deng et al. [
25] investigated the effects of cooling channel number, the layout of channels, and the inlet temperature of coolant on the cooling performance of conventional serpentine variants through numerical simulation. Similarly, Hamrang et al. [
26] analyzed the effects of geometric parameters, including the ratio of channel height to channel width and the ratio of rib width to channel width, on common parallel–serpentine and baffled parallel–serpentine flow channels. Researchers have also focused on the layout of the inlet and the outlet. Jaffal et al. [
27] proposed a serpentine flow channel cooling plate with ribs and investigated the effects of rib shape and angle on the thermal performance of the system. The results revealed that ribs with 45° and triangles had the best thermal performance. González-Morán [
28] systematically investigated the thermal performance of serpentine flow channel cooling plates, respectively, with four and six channels, to examine the functional relationship between the Nusselt number and both Reynolds and Graetz numbers. Sheng et al. [
29] developed a novel serpentine channel cooling plate with dual inlets and outlets to further improve temperature uniformity. Although these designs significantly improve thermal performance, they often lead to increased pressure drop and higher pumping power requirements [
30]. Addressing this issue, recent studies have explored hybrid channel designs combining parallel and serpentine structures [
31], as well as serpentine channels with secondary flow channels or elliptical grooves [
32], achieving substantial reductions in pressure drop and pump power consumption without compromising thermal performance significantly. At the same time, studies have summarized and compared the research on serpentine flow channels, as shown in
Table 1.
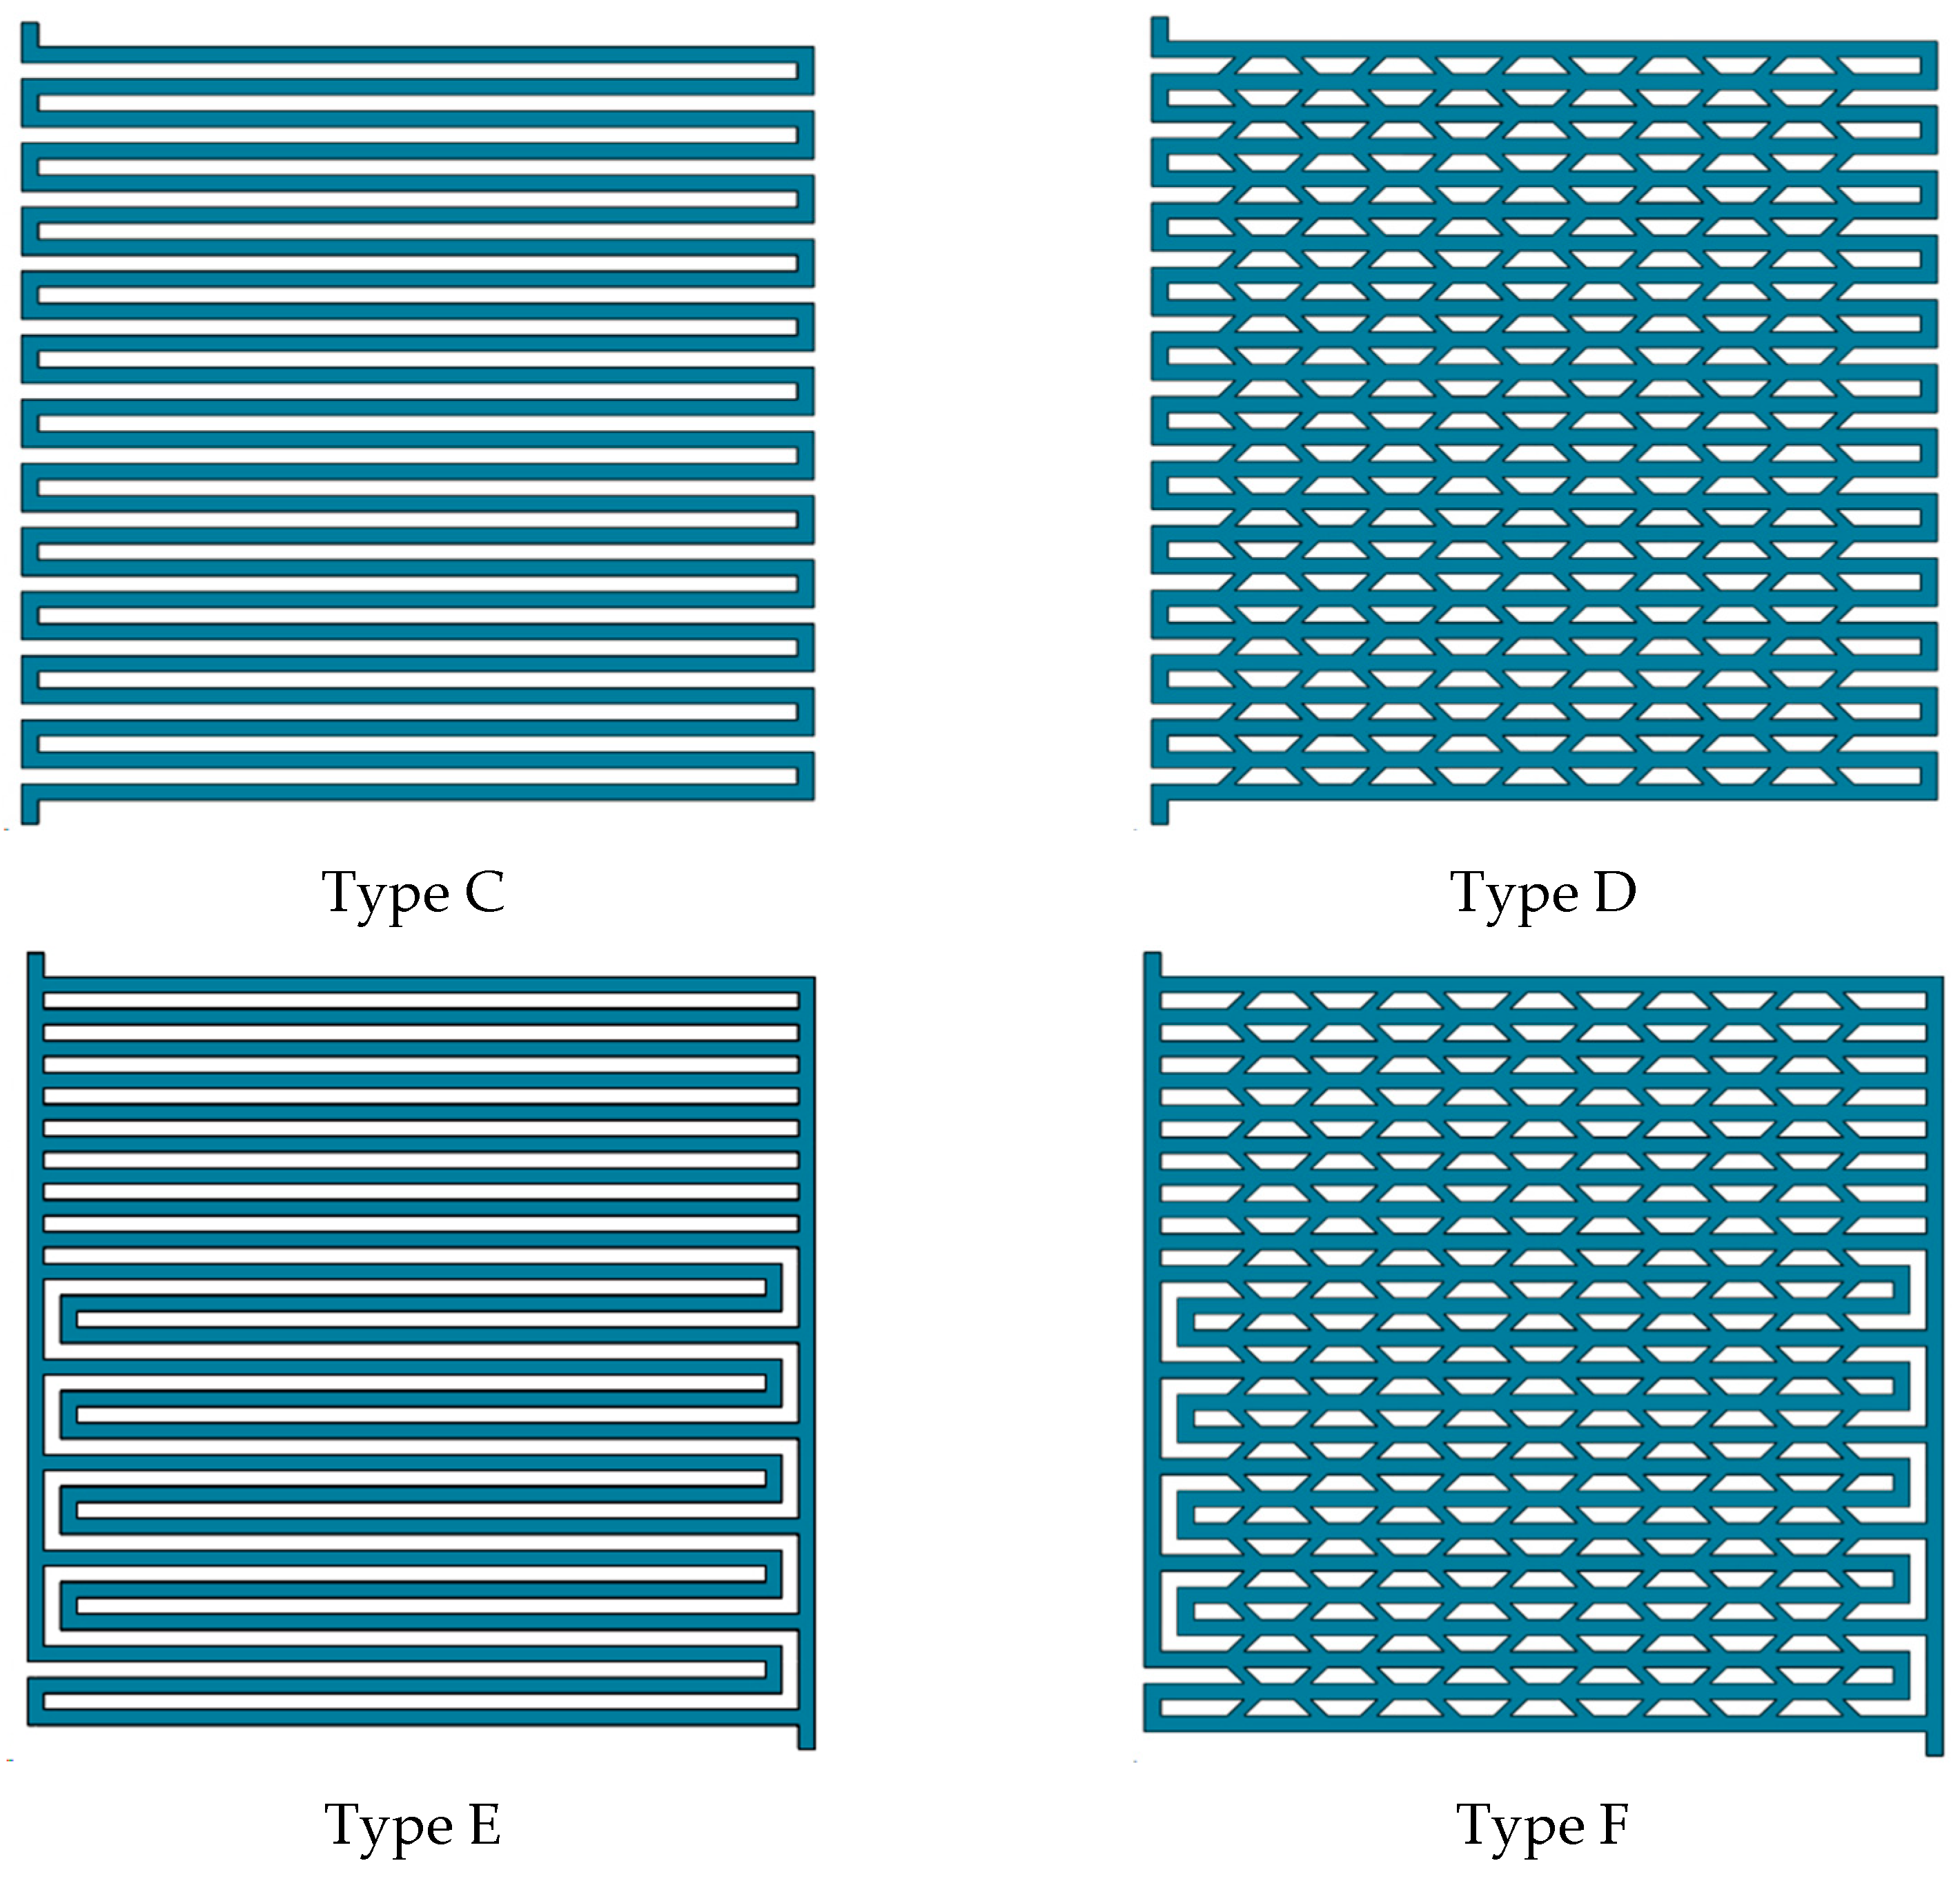
In summary, several key research gaps in the field of PEMFC cooling plate design for maritime applications are as follows: (1) Traditional serpentine channel cooling plates exhibit significant limitations in achieving optimal thermal-hydraulic performance, particularly in balancing heat dissipation with minimized pumping power requirements critical for marine propulsion efficiency. (2) The potential of secondary flow channel configurations as an enhancement strategy for maritime PEMFC cooling remains largely unexplored, with insufficient understanding of geometric parameter effects. To address these research gaps, the key contributions of this study are as follows: (1) Development and systematic evaluation of six specifically designed cooling plate configurations, comprising three baseline designs (parallel, serpentine, and hybrid channels) and three enhanced designs incorporating secondary flow channels. (2) Comprehensive parametric analysis investigating the influence of four geometric parameters characterizing secondary flow channels on thermal-hydraulic performance: the number of channels (N), channel angle (α), channel width (d), and channel spacing (L). (3) Implementation of a four-factor five-level orthogonal experimental design coupled with range analysis to quantitatively rank parameter sensitivity and identify optimal parameter combinations. These contributions significantly advance the understanding of cooling plate design for maritime PEMFCs and offer practical solutions to the thermal management challenges that currently limit their widespread adoption in marine propulsion systems.
The remainder of this paper is organized as follows:
Section 2 presents the numerical simulation model, detailing the geometric and mathematical model and validation methodology employed in this study.
Section 3 introduces the evaluation parameters that serve as quantitative metrics for assessing the thermal-hydraulic performance of various cooling plate designs.
Section 4 provides comprehensive result analysis. Finally,
Section 5 summarizes the key findings, and suggests directions for future research.
3. Evaluation Parameters
The evaluation parameters defined in this study to evaluate the cooling plate include the maximum surface temperature, maximum temperature difference, temperature uniformity index, inlet–outlet pressure drop, and cooling efficiency coefficient. To evaluate the temperature uniformity of the cooling plate, the temperature uniformity index (TUI) is introduced as one of the evaluation parameters. A smaller temperature uniformity index indicates more uniform temperature distribution on the cooling plate surface, which is expressed as Equation (7):
where
A is the bottom surface area of the cooling plate and
is the average temperature of the cooling plate, defined by Equation (8):
To comprehensively evaluate the cooling plate’s performance, Fan et al. [
32] have employed evaluation parameters to assess its heat dissipation capacity and power consumption. The ratio between these two factors defines the cooling efficiency coefficient, which reflects the effectiveness of heat transfer per unit pump work, as expressed in Equation (9):
where
is the heat removed by the coolant and
is the pump work consumed at the coolant inlet and outlet, defined by Equations (10) and (11):
Substituting Equations (10) and (11) into Equation (9), the cooling efficiency coefficient can be simplified to Equation (12):
where
is the mass flow rate of the inlet coolant. A larger
indicates better comprehensive performance of the cooling plate.
4. Result Analysis and Discussion
Through numerical simulations, the performance of the cooling plate was evaluated using the above evaluation parameters. The effects of heat flux, coolant inlet velocity, and secondary flow channel structural parameters on cooling plate performance were systematically analyzed. Subsequently, an orthogonal experimental design with four factors at five levels was established. Range analysis was employed to investigate the sensitivity of these four factors under different optimization objectives when acting simultaneously. Finally, optimal combinations of secondary flow channel structural parameters were proposed for different optimization objectives.
4.1. Effect of Heat Flux on the Performance of Cooling Plates
This section analyzes the heat dissipation performance of six cooling plate designs under four different heat flux conditions (0.107, 0.195, 0.296, and 0.404 W·cm
−2) with a coolant inlet velocity of 0.6 m·s
−1. As shown in
Figure 10, under the same heat flux, the Type A cooling plate exhibits the highest maximum surface temperature and maximum temperature difference, followed by Type D, while Type C shows the lowest values. At a heat flux of 0.107 W·cm
−2, the maximum surface temperatures of the six cooling plates, in descending order, are as follows: Type A (63.81 °C), Type D (63.74 °C), Type B (63.49 °C), Type F (63.30 °C), Type E (62.78 °C), and Type C (62.72 °C). The maximum temperature differences among the six designs are relatively small at a low heat flux, with variations of approximately 1 °C. The trend in maximum temperature difference mirrors that of the maximum surface temperature. At 0.107 W·cm
−2, the difference in maximum temperature variation between Type A and Type C cooling plates is 1.1 °C. When the heat flux increases to 0.404 W·cm
−2, Type A still maintains the highest maximum surface temperature and temperature difference, with increases of 10.59 °C and 10.65 °C, respectively. However, Type B, which incorporates secondary flow channels based on Type A, shows smaller increases of 9.02 °C and 9.07 °C, respectively.
Furthermore, as heat flux increases, both the average temperature and temperature uniformity index of all six designs increase, indicating that higher heat flux compromises the uniform temperature distribution across the cooling plate surface. Under the same heat flux, Type A exhibits the highest temperature uniformity index, while Type E shows the lowest. At 0.107 W·cm−2, the temperature uniformity index for Type A is 0.81 and 0.49 for Type E, with other designs showing similar values. When heat flux density increases to 0.404 W·cm−2, Type A’s temperature uniformity index increases by 2.26, while Types B (2.10), F (1.95), and D (1.86) demonstrate similar temperature uniformity performance. Types C (1.58) and E (1.35) show the smallest increase in temperature uniformity index, indicating superior temperature uniformity performance under varying heat flux.
Comprehensive analysis reveals that the Type C cooling plate demonstrates superior heat dissipation performance with increasing heat flux, attributed to its secondary flow channel structures. These structures generate vortices that enhance mixing and contact between the coolant and cooling plate, thereby promoting heat transfer. However, as heat flux increases, only parallel flow channels with secondary flow structures show improved thermal performance, while the other two traditional channel designs with additional structures do not exhibit enhanced thermal performance.
4.2. Effect of Coolant Inlet Velocity on the Thermal-Hydraulic Performance of Cooling Plates
4.2.1. Effect of Coolant Inlet Velocity on the Thermal Performance of Cooling Plates
Figure 11 illustrates the surface temperature distribution contours of six cooling plate configurations at an inlet flow velocity of 0.5 m·s
−1. The coolant inlet is positioned in the upper-left corner of each cooling plate, with the outlet located in the lower-right corner. As coolant flows through the channels, it effectively removes excess heat, causing its temperature to increase progressively while its heat transfer capacity diminishes. Consequently, a temperature gradient develops along the flow direction toward the outlet.
Notably, Type A and Type E cooling plates exhibit distinct local hotspots on their right sides, resulting in non-uniform temperature distributions. In contrast, Type B and Type F plates, which incorporate secondary flow channels, demonstrate significant mitigation of these localized hotspots. The serpentine structures of Type C and Type D channels feature multiple turns that enhance heat transfer during fluid directional changes, resulting in superior temperature uniformity. However, this improved thermal performance implies that these configurations will likely experience higher inlet–outlet pressure drops due to their complex flow paths.
As shown in
Figure 12, the heat dissipation performance of all six cooling plates improves with increasing coolant inlet velocity, which is attributed to enhanced heat exchange capacity at higher flow rates. Before the inlet velocity reaches 0.5 m·s
−1, the Type D cooling plate exhibits the highest surface maximum temperature and temperature difference, reaching 75.23 °C and 14.34 °C, respectively, at 0.3 m·s
−1, significantly higher than other designs. Above 0.5 m·s
−1, the Type A cooling plate surpasses Type D, showing the highest surface temperature among all designs, with values of 68.09 °C and 7.13 °C for maximum surface temperature and temperature difference, respectively, at 0.7 m·s
−1. Type C consistently maintains the lowest values for both parameters. When inlet velocity increases from 0.3 m·s
−1 to 0.7 m·s
−1, the Type D cooling plate demonstrates the largest reduction in surface maximum temperature and temperature difference, decreasing by 7.50 °C and 7.57 °C, respectively.
Furthermore, the average temperature of all six cooling plates gradually decreases with increasing inlet velocity, though the rate of decrease diminishes, indicating saturation in convective heat transfer effectiveness. At identical inlet velocities, Type A exhibits the highest average temperature, reaching 65.90 °C at 0.5 m·s−1, followed by Type E (65.38 °C), Type D (64.78 °C), Type B (64.70 °C), Type F (64.63 °C), and Type C (64.23 °C). The consistently lower average temperature of Type C can be attributed to its serpentine channel structure, which provides multiple convective heat transfer opportunities at the bends.
Similarly, the temperature uniformity index of all designs shows a decreasing trend with increasing inlet velocity. At 0.3 m·s−1, Type E demonstrates the lowest temperature uniformity index (2.26), while Type D shows the highest (2.98), with other designs ranging from high to low as follows: Type A (2.88), Type B (2.79), Type F (2.67), and Type C (2.59). However, beyond 0.4 m·s−1, Type A exhibits the highest temperature uniformity index. Notably, Type D shows the most significant reduction in temperature uniformity index (54.4%) when the inlet velocity increases from 0.3 m·s−1 to 0.7 m·s−1.
Analysis from the perspective of secondary flow channel structure reveals that only parallel channels demonstrate improved thermal characteristics (reduced maximum surface temperature, temperature difference, and temperature uniformity index) after incorporating secondary flow structures, while the other two traditional channel designs show no thermal performance enhancement.
4.2.2. Effect of Coolant Inlet Velocity on the Inlet–Outlet Pressure Drop of Cooling Plates
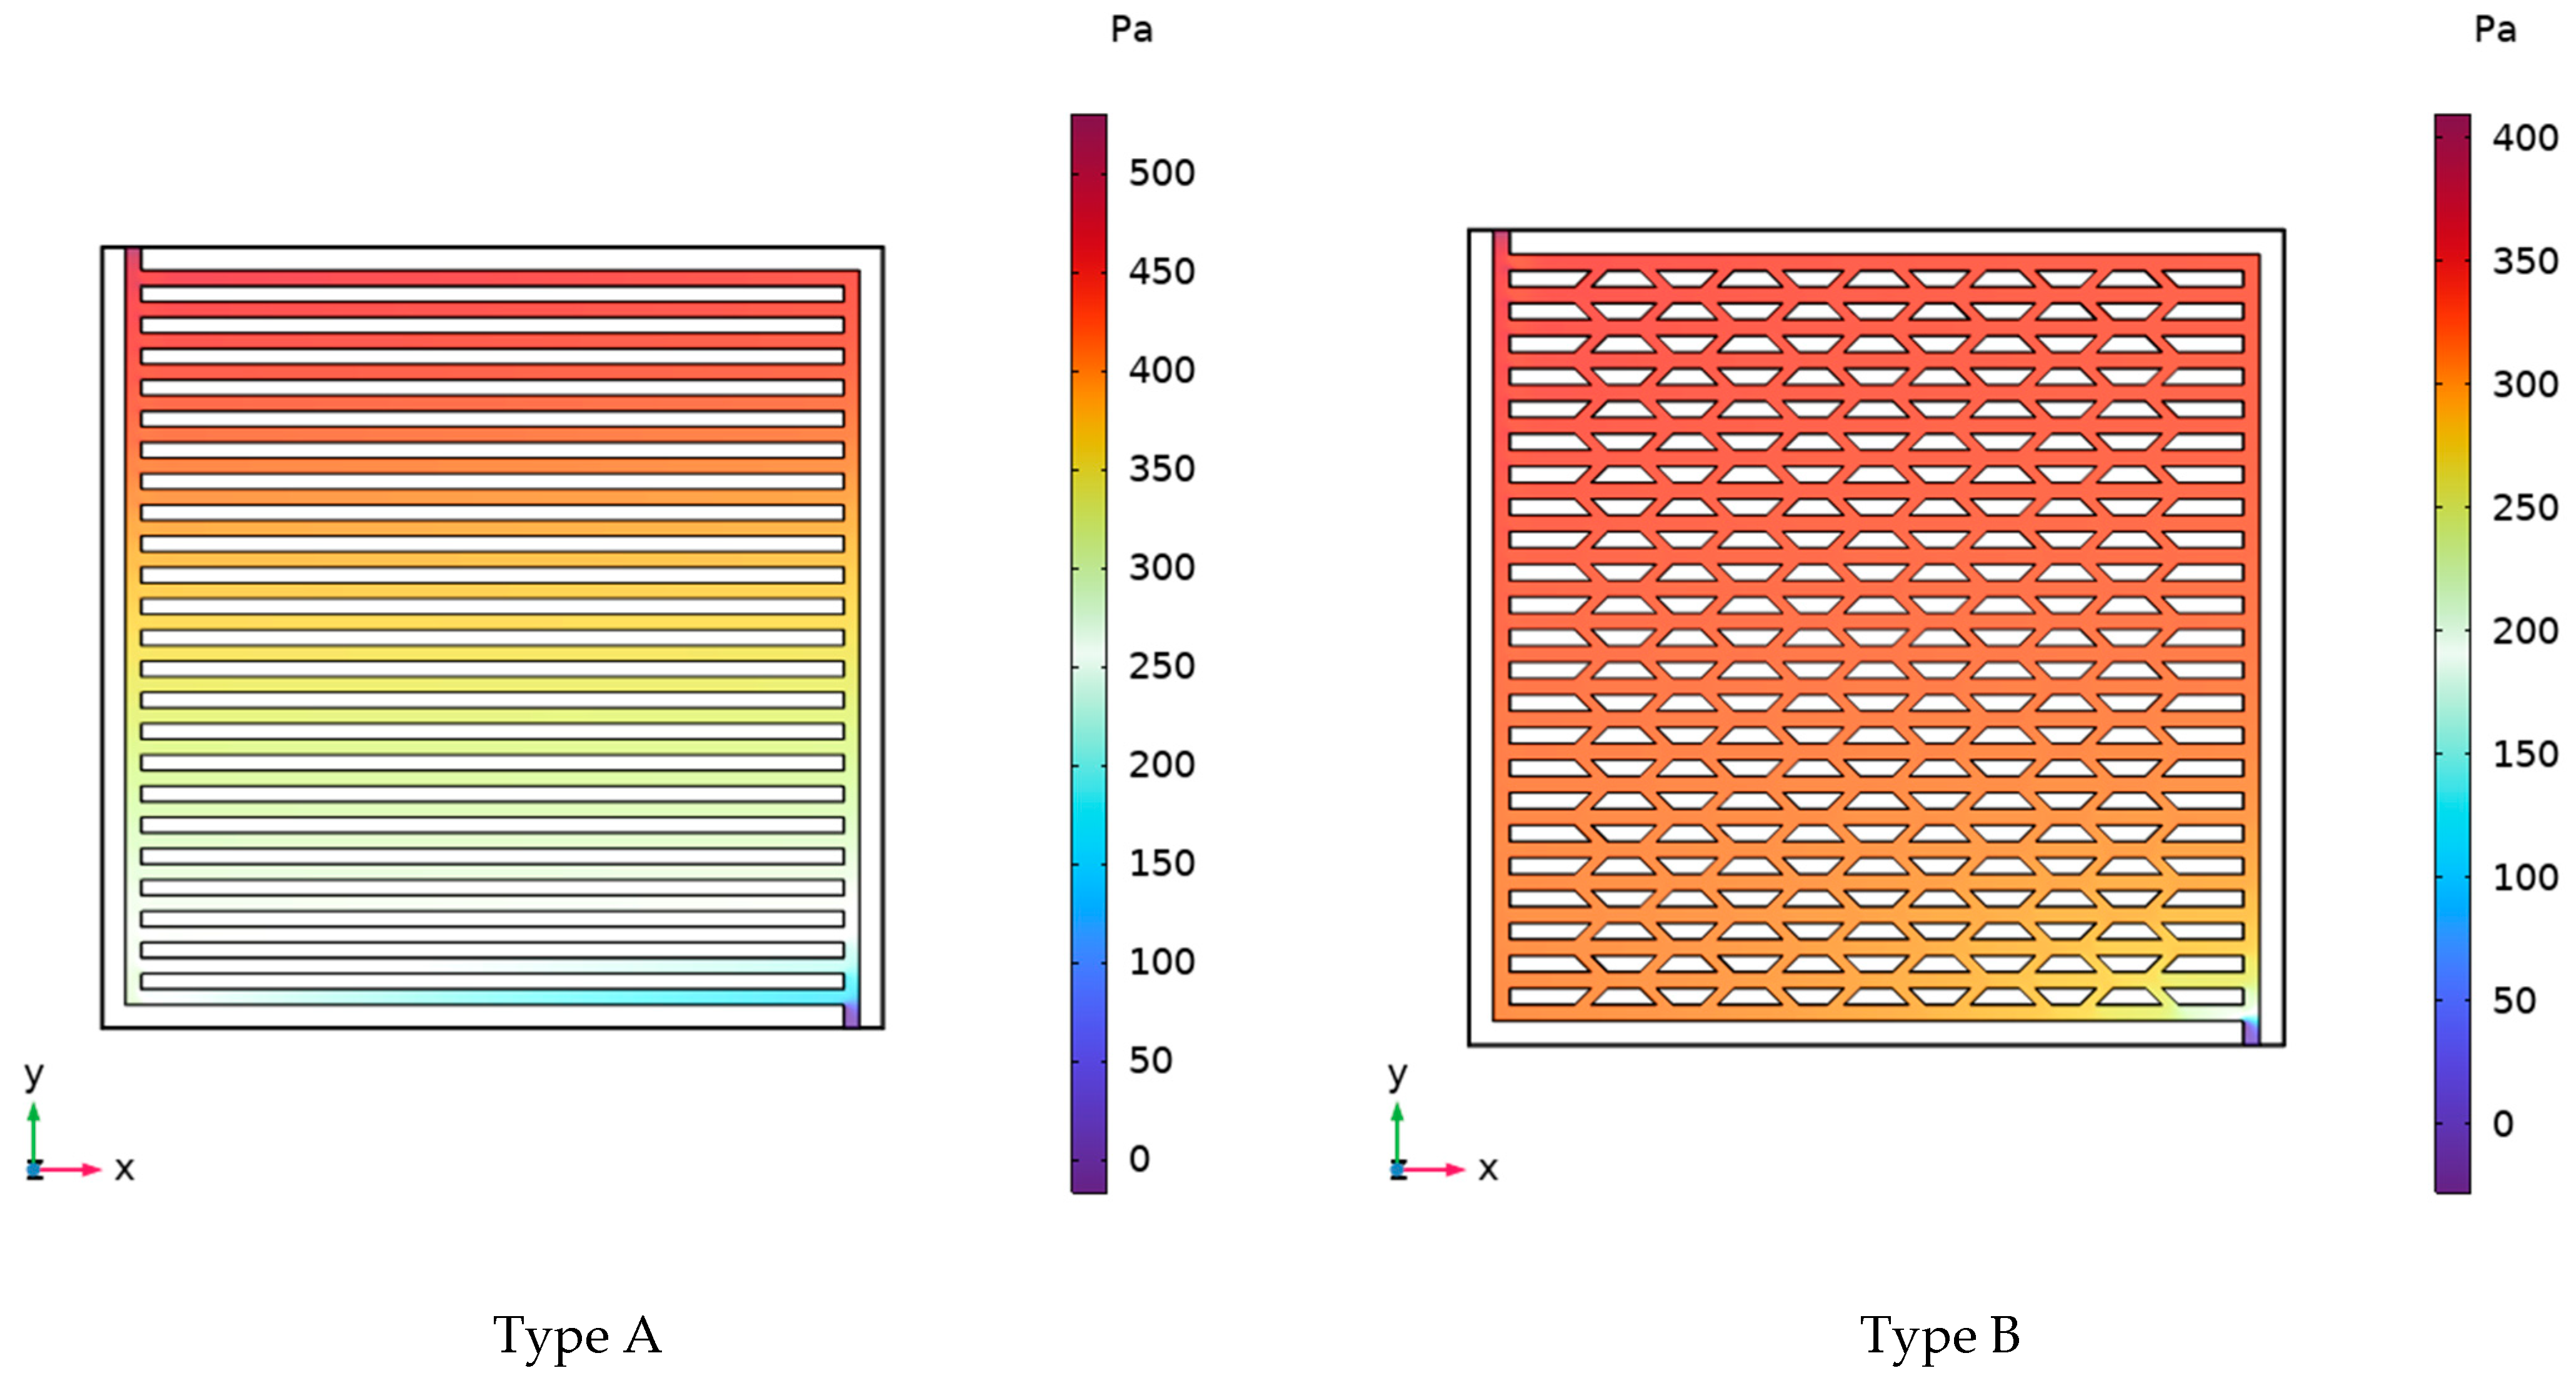
Figure 13 presents the pressure distribution contours of six channel configurations at an inlet flow velocity of 0.5 m·s
−1. In PEMFC liquid cooling systems, the power required by the coolant pump is supplied by the fuel cell itself. Consequently, increased inlet–outlet pressure drops lead to higher pump power consumption, resulting in reduced net power output from the fuel cell.
As observed in
Figure 13, pressure gradually decreases along the flow direction, with maximum values at the inlet and minimum values at the outlet. The addition of secondary flow channels creates intersecting flow paths that effectively increase the coolant flow area and promote more uniform pressure distribution. Furthermore, all traditional channel designs exhibit reduced pressure drops when supplemented with secondary flow channels. This effect is particularly pronounced in serpentine channels, where Type D configuration demonstrates a pressure drop approximately one order of magnitude lower than Type C. Therefore, incorporating secondary flow channel structures contributes to pressure drop reduction and more uniform pressure distribution, ultimately achieving the objective of lower parasitic power consumption.
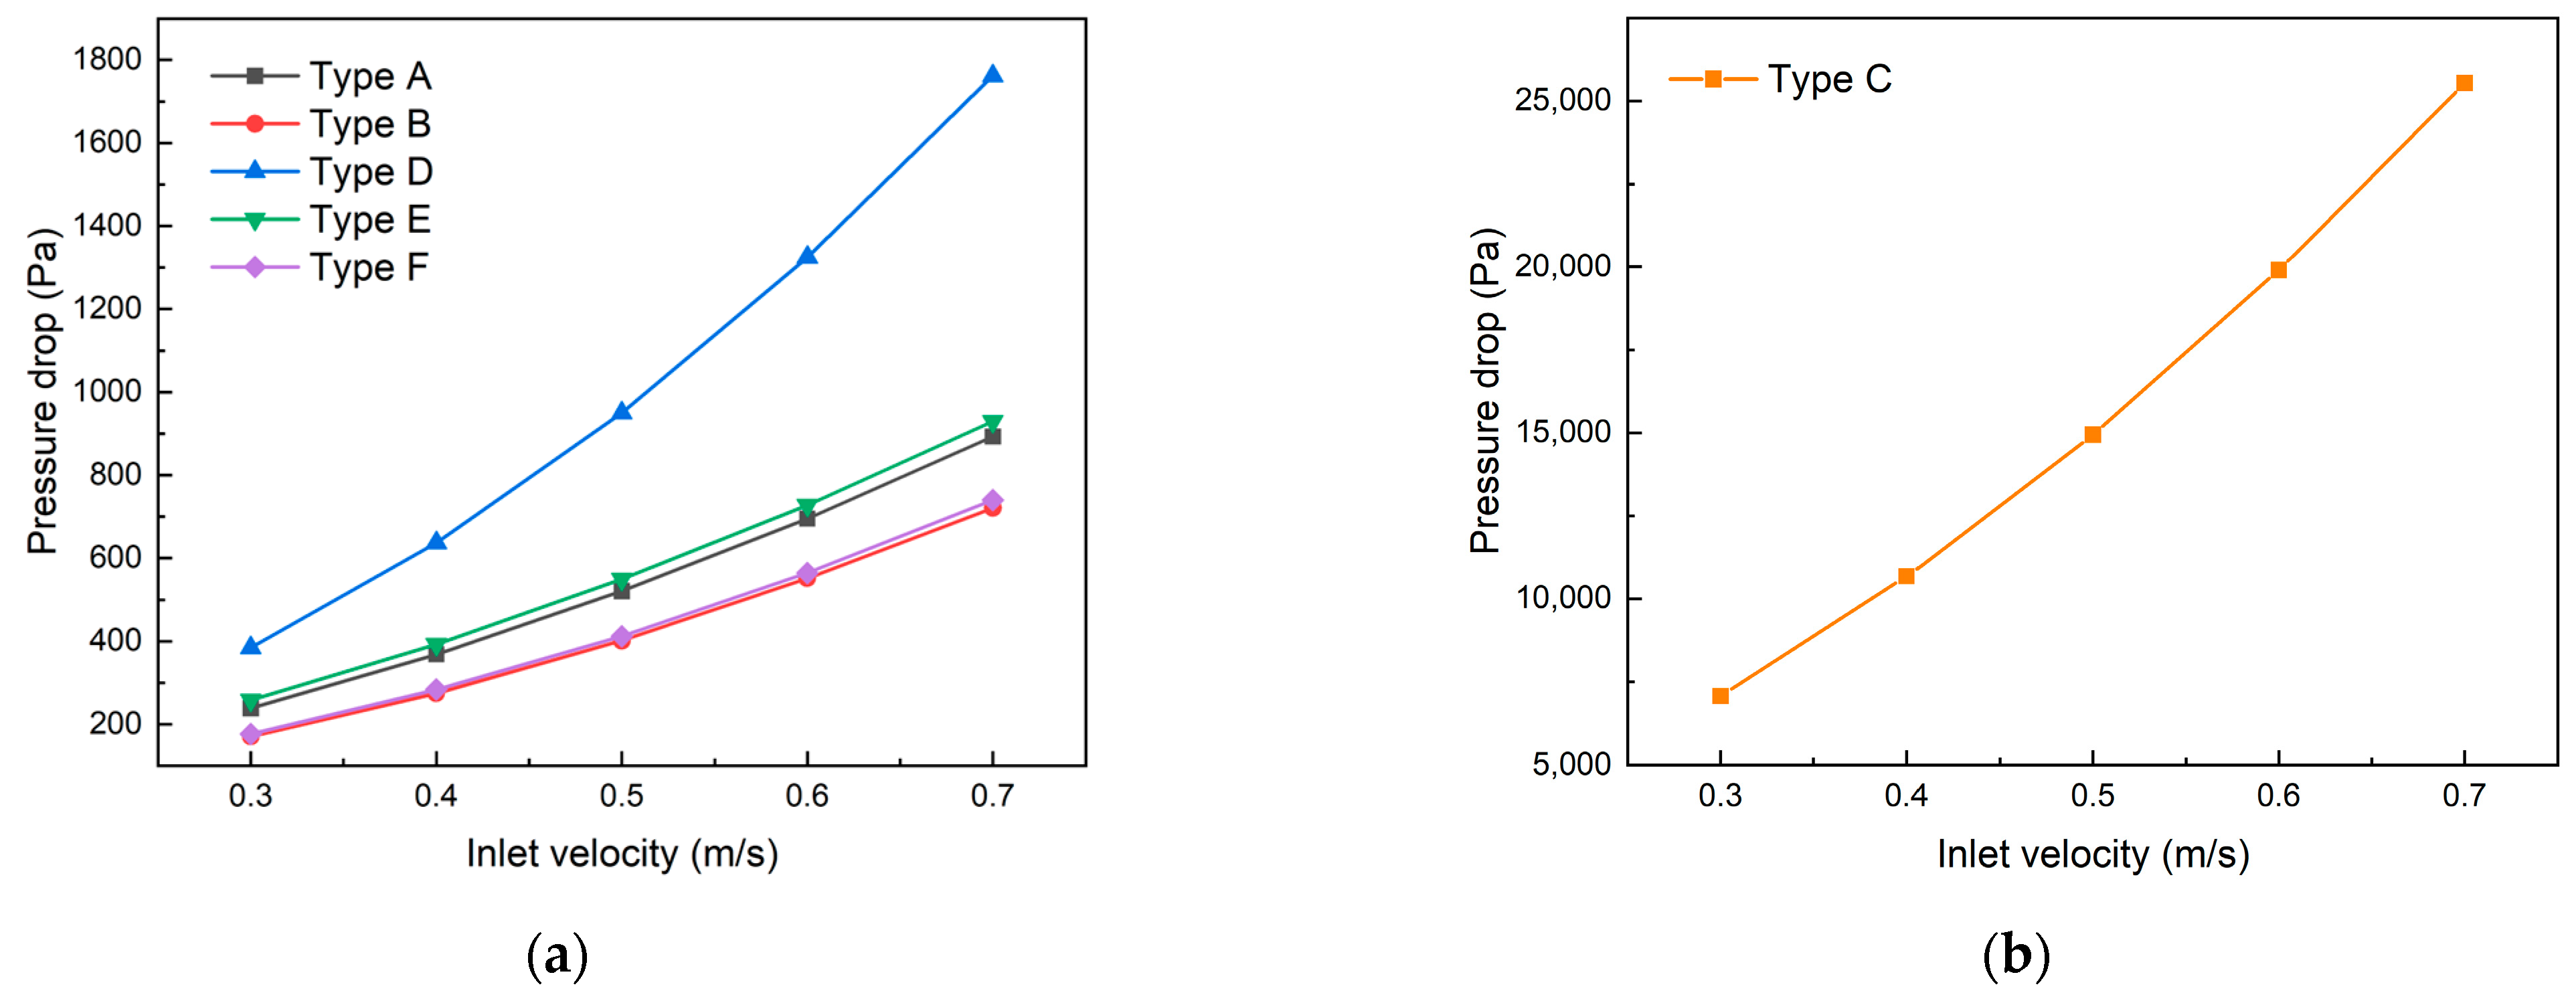
Figure 14 illustrates the variation trends of inlet–outlet pressure drop across six channel designs under different coolant inlet velocities. Due to the pressure drop in the Type C channel being one to two orders of magnitude higher than the other five designs, the results are presented in two separate graphs. The analysis reveals that the inlet–outlet pressure drops of all six channels increase with increasing coolant inlet velocity. Under identical flow velocities, the Type C channel exhibits the highest pressure drop, followed by Type D; this is attributed to their serpentine structures, which extend the coolant flow path and, consequently, increase the frictional resistance. In contrast, Types B and F channels demonstrate the lowest pressure drops. At an inlet velocity of 0.3 m·s
−1, the pressure drop in the Type C channel reaches 7068 Pa, while Types B and F channels show significantly lower values of only 171 Pa and 177 Pa, respectively. When the inlet velocity increases to 0.7 m·s
−1, the pressure drop in the Type C channel escalates to 25,542 Pa, an increase of 18,474 Pa compared to its value of 0.3 m·s
−1. Meanwhile, the Type B channel maintains the lowest pressure drop among all designs at 721 Pa, representing a modest increase of only 550 Pa from its value at 0.3 m·s
−1.
Furthermore, the incorporation of secondary flow channels significantly reduces the pressure drops in all three traditional channel designs. This effect is most pronounced at an inlet velocity of 0.3 m·s−1, where Type D channel shows a 94.6% reduction in pressure drop compared to Type C, followed by Type F with a 31.4% reduction compared to Type E, and Type B with a 28.3% reduction compared to Type A. The study demonstrates that the introduction of secondary flow channels effectively optimizes pressure distribution, reduces coolant flow resistance, and thereby enhances overall system performance.
4.2.3. Effect of Coolant Inlet Velocity on the Cooling Efficiency Coefficient of Cooling Plates
In this section, the cooling efficiency coefficient was employed to evaluate the heat dissipation capacity and power consumption of the cooling plates. This coefficient indicates the effectiveness of heat transfer per unit pumping power, where a higher value represents better heat transfer performance per unit pumping power.
As shown in
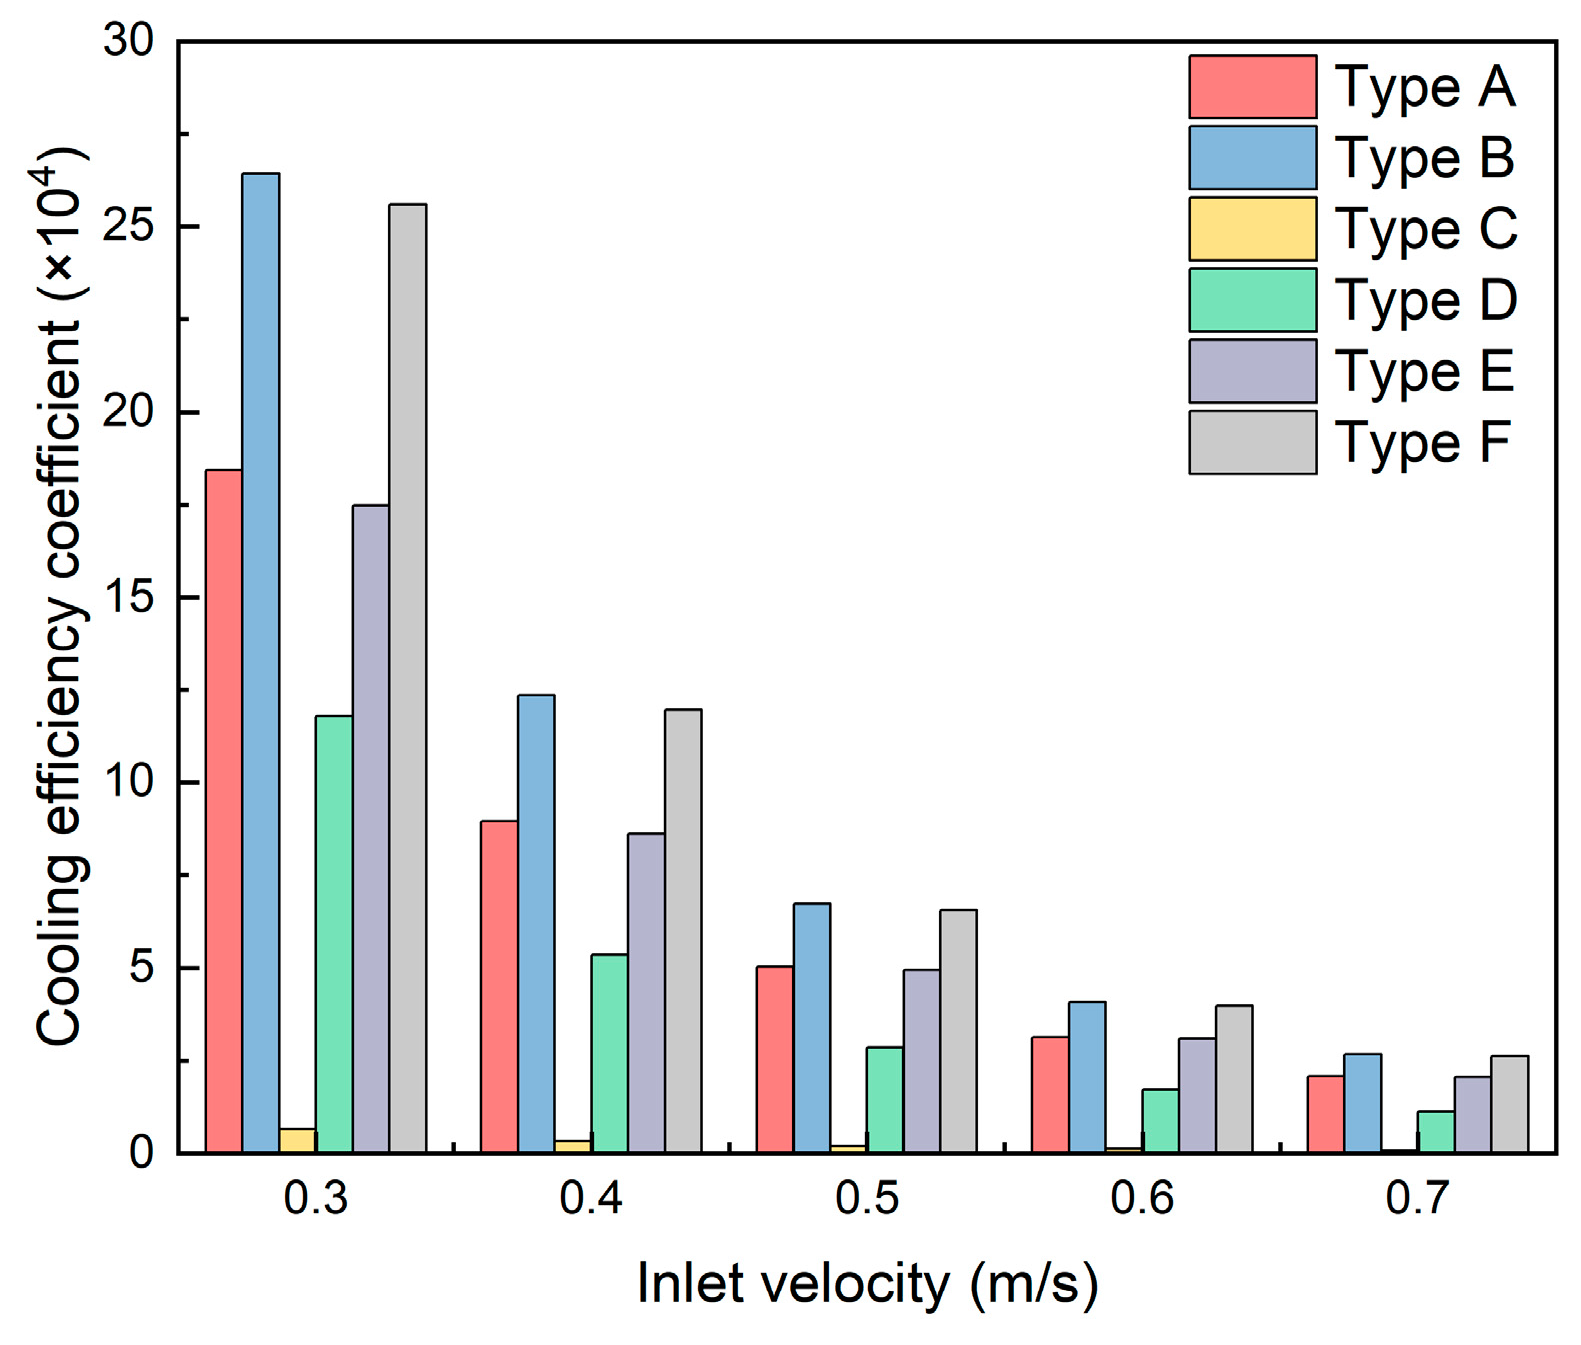
Figure 15, the cooling efficiency coefficients of all six cooling plates decrease with increasing inlet velocity, indicating a decline in heat transfer effectiveness per unit pumping power. Although the heat removal by coolant increases, the pumping power consumption increases more significantly. In other words, the heat transfer per unit pumping power decreases, leading to reduced system energy utilization efficiency. This phenomenon is particularly evident in the Type C channel, which, despite having superior thermal characteristics compared to other designs, exhibits an inlet–outlet pressure drop one to two orders of magnitude higher than the other five channels. This results in the lowest cooling efficiency coefficient (0.08 × 10
4 at 0.7 m·s
−1 inlet velocity), implying that the Type C channel requires substantially more pumping power to transfer the same amount of heat. Conversely, the Type B channel demonstrates the highest cooling efficiency coefficient (2.66 × 10
4 at 0.7 m·s
−1 inlet velocity), indicating maximum heat removal per unit of pumping power.
Furthermore, at the same inlet velocity, all three traditional channels show increased cooling efficiency coefficients after incorporating secondary flow channels. At an inlet velocity of 0.3 m·s−1, Type B channel’s cooling efficiency coefficient increases by 43.4% compared to Type A, Type D’s coefficient is 18.1 times that of Type C, and Type F’s coefficient increases by 46.3% compared to Type E. Therefore, the addition of secondary flow channel structures effectively improves the heat transfer efficiency per unit of pumping power. Based on this comprehensive analysis, the Type B channel exhibits the best overall performance among the six cooling channel designs and is selected for subsequent secondary flow channel optimization analysis.
4.3. Effect of Secondary Flow Channel Structural Parameters on the Performance of Cooling Plates
Based on the secondary flow channel structure in the Type B channel, this section employs a single-factor control variable method to investigate the effects of secondary channel parameters on cooling plate heat dissipation performance and inlet–outlet pressure drop. The parameters studied include channel number (N), angle (α), width (d), and spacing (L).
4.3.1. Effect of the Number (N) of Secondary Flow Channels on the Thermal-Hydraulic Performance of Cooling Plates
Based on the Type B channel, five cooling plate geometric models were established with secondary channel quantities of 4, 5, 6, 7, and 8, while other parameters remained constant: channel angle at 45°, channel width at 1 mm, channel spacing at 2 mm, and heat flux at 0.25 W·cm−2. All other boundary conditions and material properties remained unchanged from previous settings.
As shown in
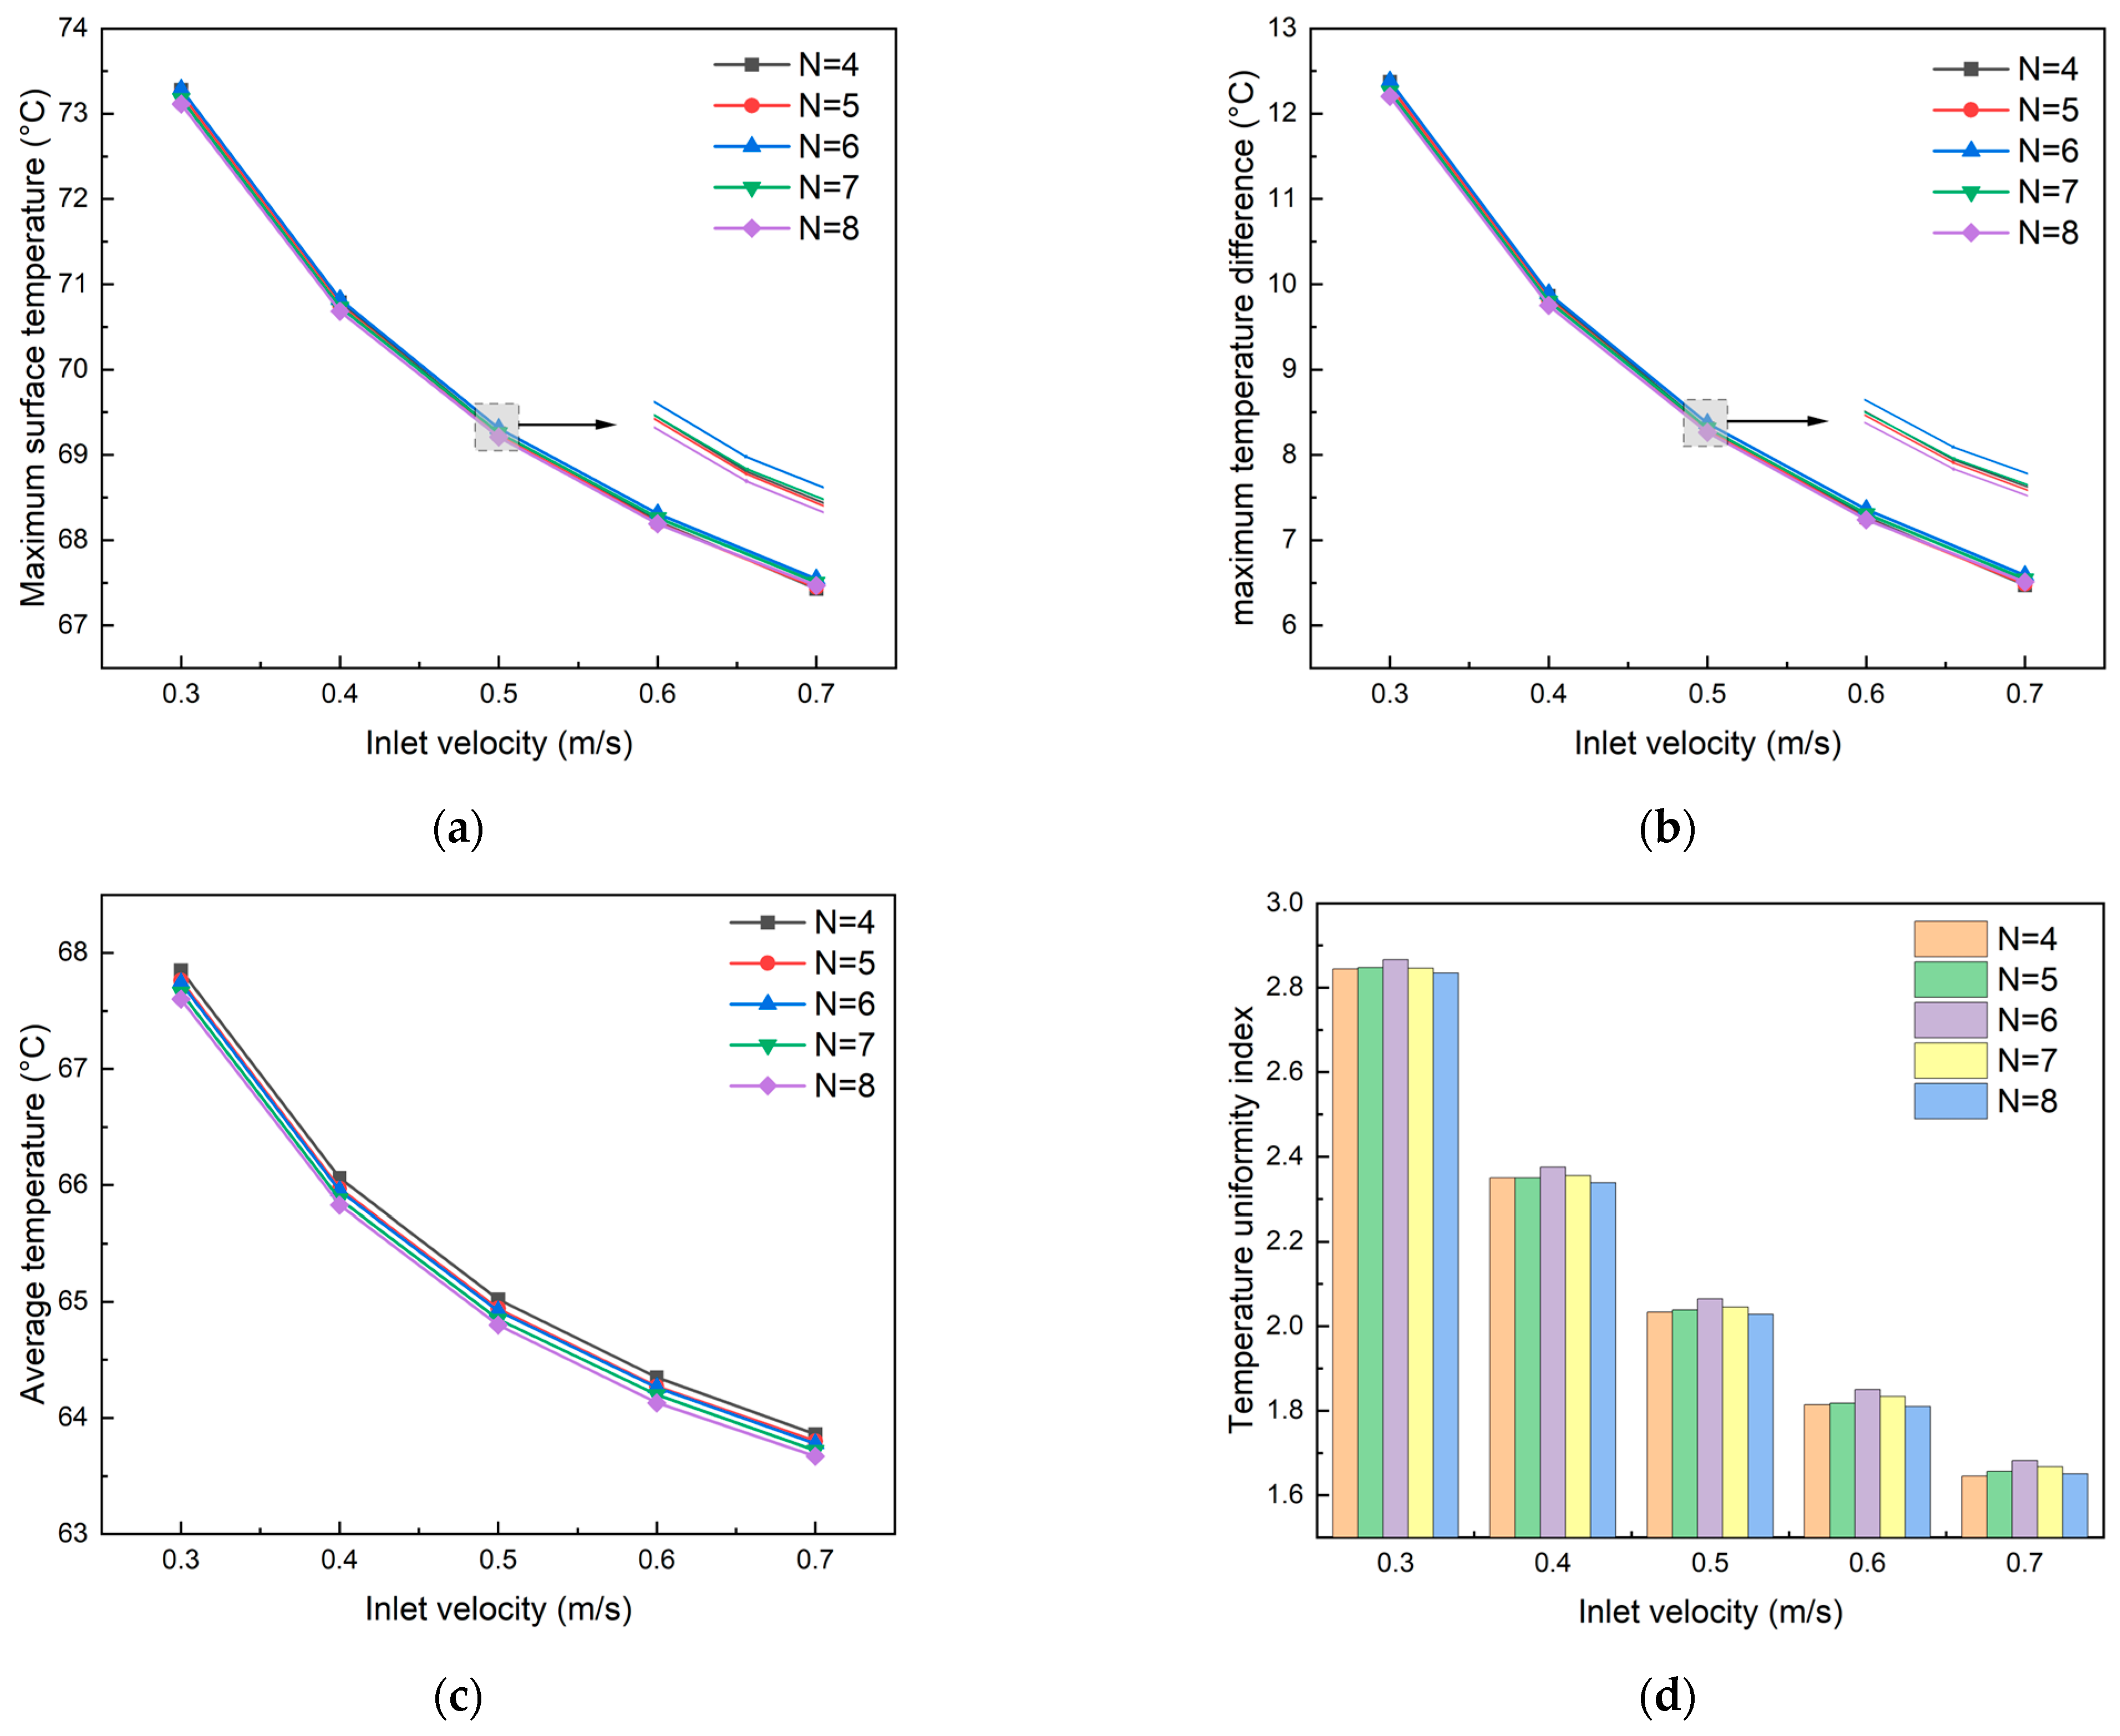
Figure 16, under the same coolant inlet velocity, the cooling plate with 8 secondary channels exhibited the lowest values across all four thermal performance indicators, although the impact of varying channel quantities on heat dissipation performance was relatively minor. At an inlet velocity of 0.5 m·s
−1, the eight-channel configuration demonstrated the lowest surface maximum temperature (69.21 °C) and temperature difference (8.27 °C), while the six-channel configuration showed the highest values (69.31 °C and 8.37°C, respectively), with only approximately 0.1 °C difference between them. The average temperature of the cooling plate decreased with an increase in the number of channels, but the variation was not significant. At an inlet velocity of 0.3 m·s
−1, the maximum temperature difference between the eight-channel and four-channel configurations was 0.25 °C, and this difference decreased with increasing flow velocity, reaching only 0.19 °C at 0.7 m·s
−1. As shown in
Figure 16d, the number of channels had minimal impact on the temperature uniformity index. This limited effect can be attributed to the existing thermal load and coolant flow velocity conditions, which already provided relatively uniform temperature distribution, thereby limiting the potential improvements from increasing the number of channels. Overall, the influence of channel number variation on cooling plate heat dissipation performance was not substantial.
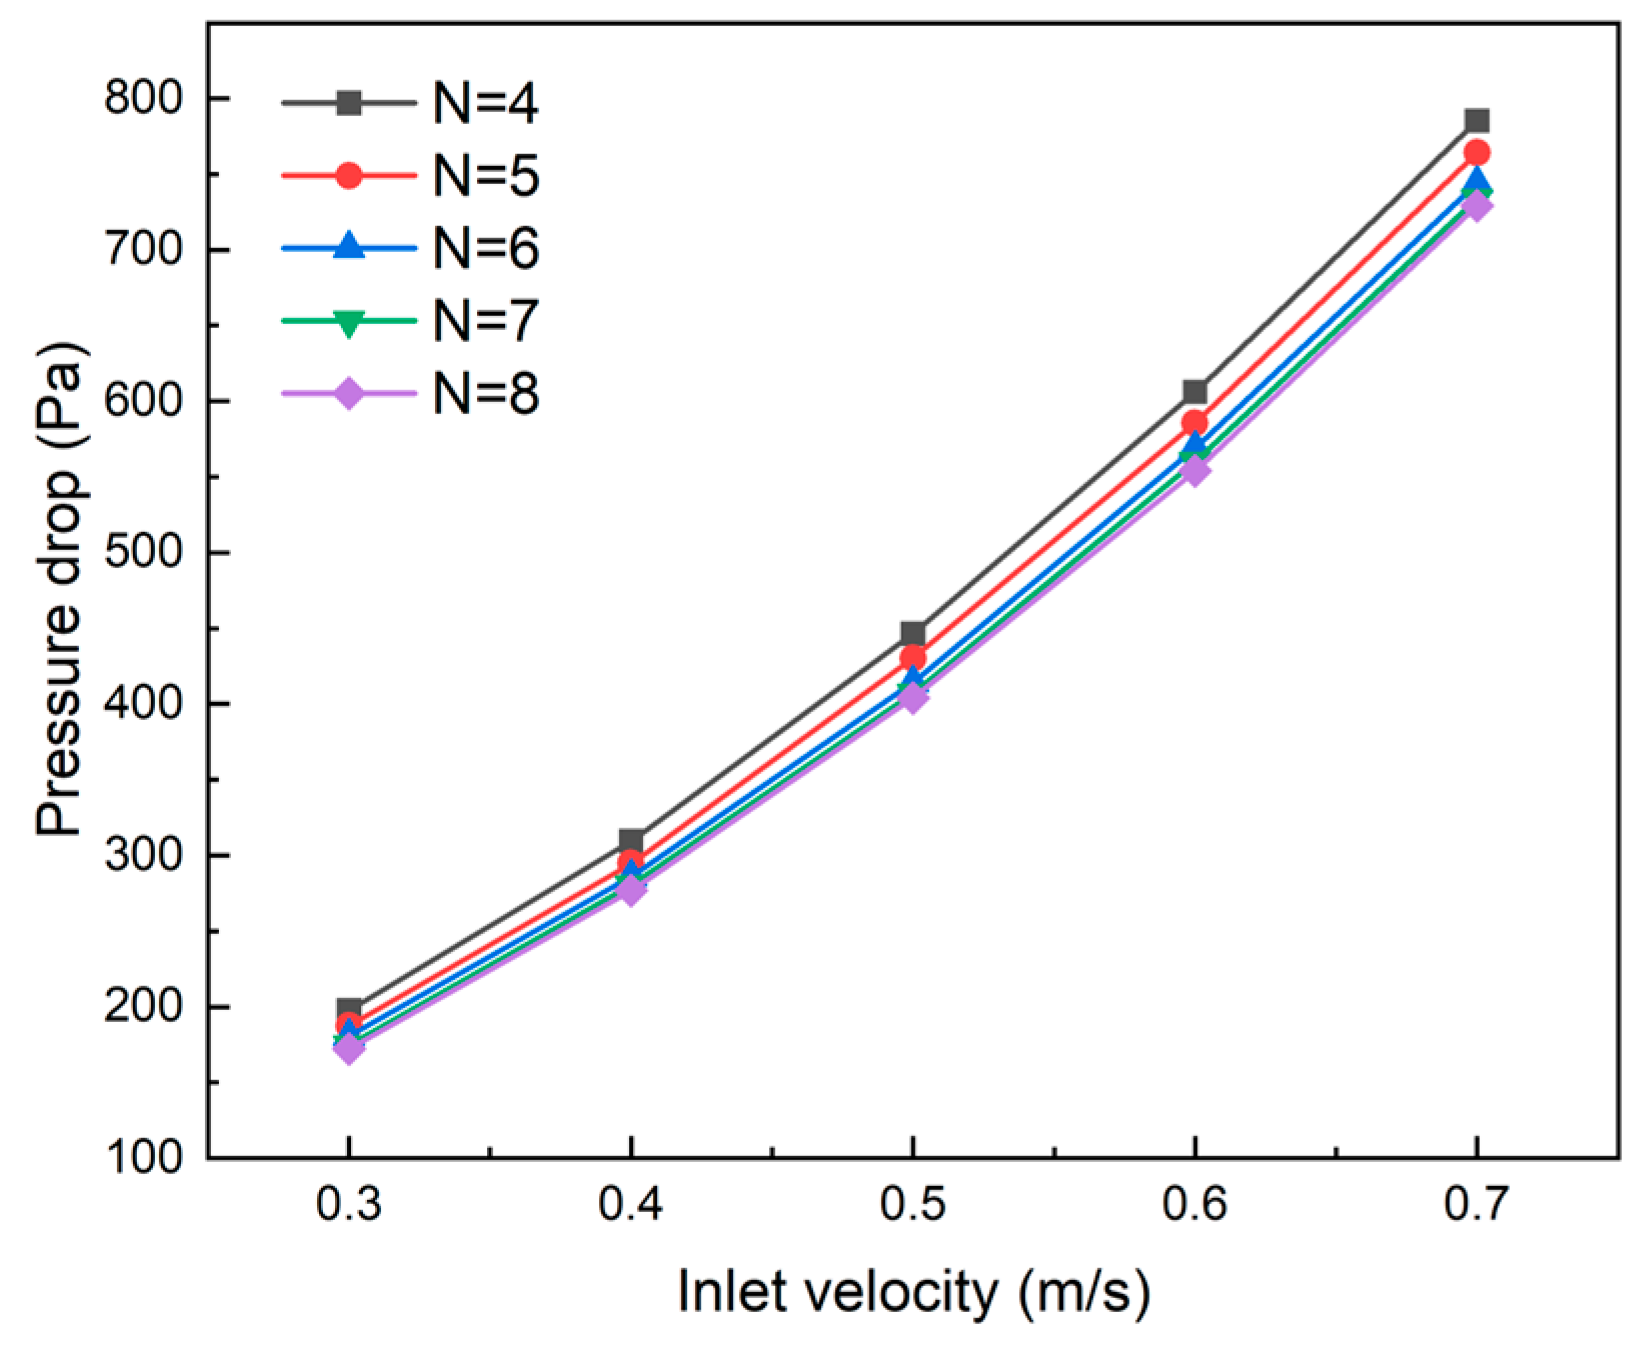
As illustrated in
Figure 17, under the same flow velocity, the inlet–outlet pressure drop decreased as the number of secondary channels increased, achieving a maximum reduction of 12.7% (at 0.3 m·s
−1 inlet velocity). This reduction occurred because the increased number of channels decreased the coolant velocity in the main channels, thereby reducing fluid frictional resistance losses. However, when the number of channels exceeded six, the pressure drop reduction became less pronounced. At an inlet velocity of 0.5 m·s
−1, the six-channel configuration showed a 7.2% pressure drop reduction compared to the four-channel design, while the eight-channel configuration only achieved a 2.4% further reduction compared to the six-channel design. Based on the comprehensive analysis of the effects of secondary channel number on both heat dissipation performance and pressure drop characteristics, the eight-channel configuration was selected for subsequent single-factor studies due to its optimal thermal characteristics and minimal inlet–outlet pressure drop.
4.3.2. Effect of the Angle (α) of the Secondary Flow Channels on the Thermal-Hydraulic Performance of Cooling Plates
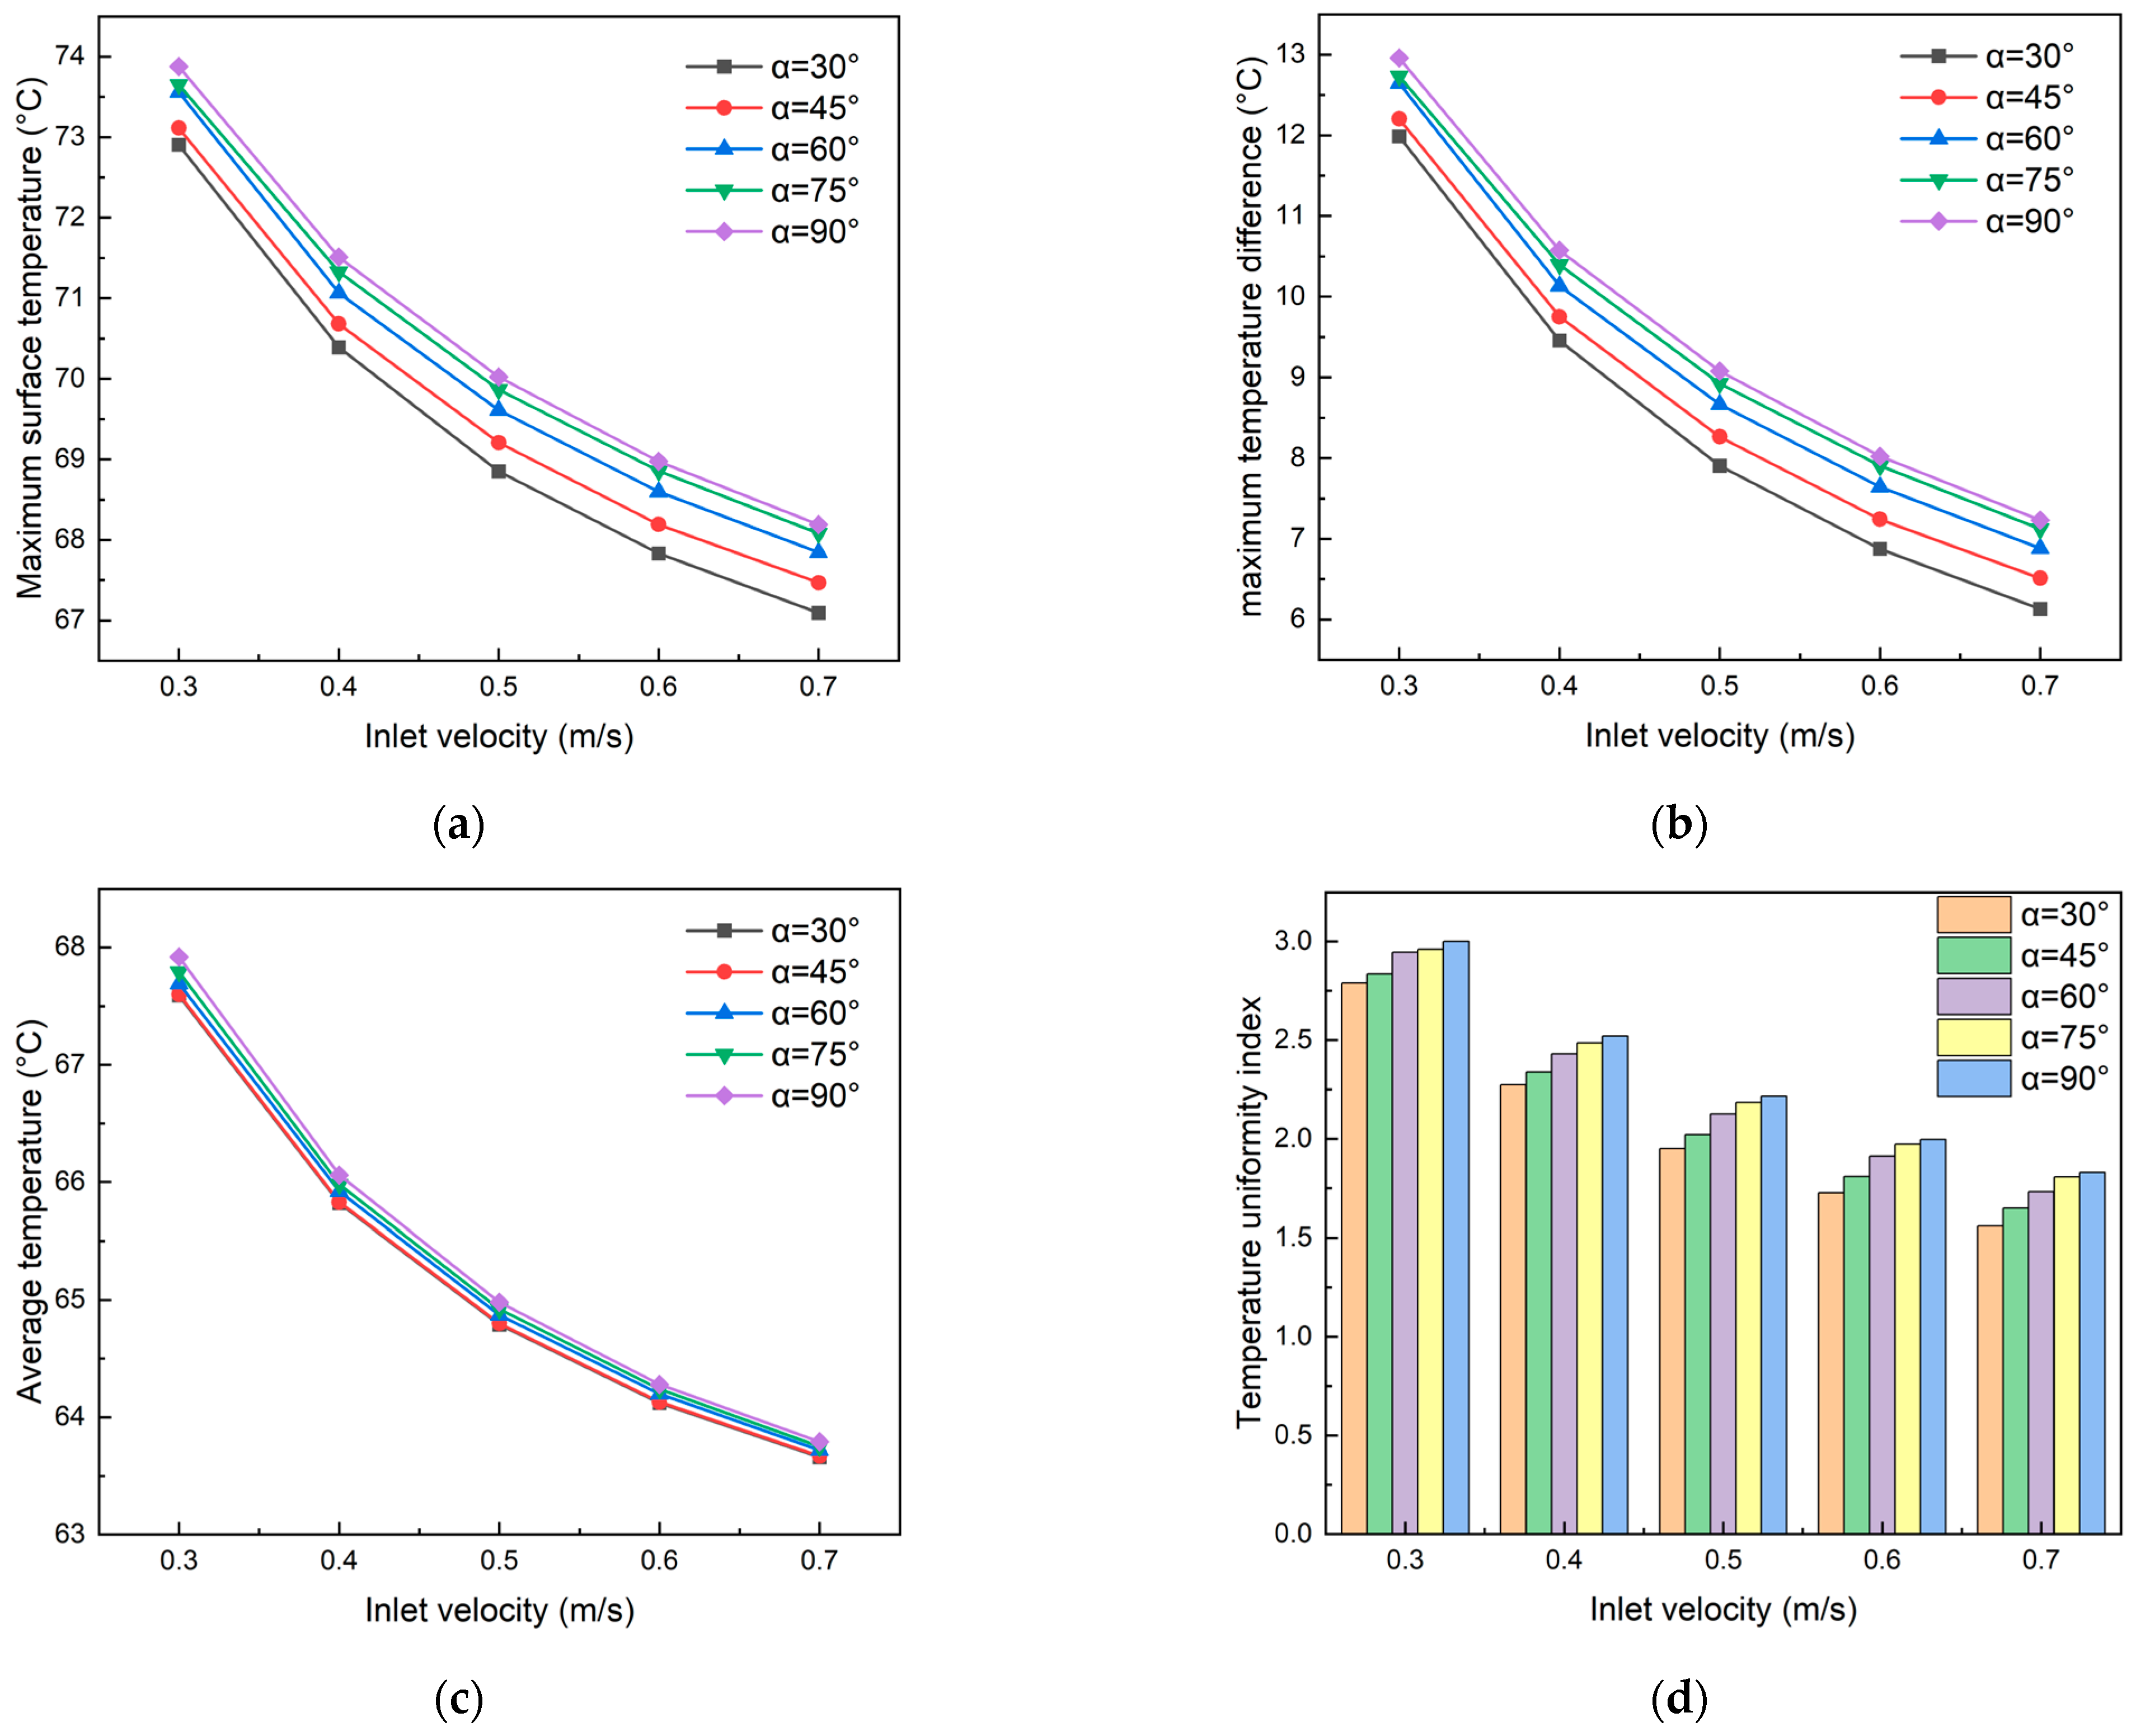
In this section, the cooling plate model was configured with eight secondary channels, with channel angles varying among 30°, 45°, 60°, 75°, and 90°, while maintaining a channel width of 1 mm and channel spacing of 2 mm. All other boundary conditions remained unchanged. The analysis focused on examining the effects of secondary channel angle (α) on both heat dissipation performance and pressure drop characteristics.
As shown in
Figure 18, under the same temperature conditions, both the maximum surface temperature and temperature difference in the cooling plate exhibited an increasing trend with an increasing channel angle. At an inlet velocity of 0.5 m·s
−1, the cooling plate with a 90° channel angle showed increases of 1.17 °C in maximum surface temperature and 1.18 °C in temperature difference compared to the 30° configuration. As illustrated in
Figure 18c, the channel angle’s impact on the average temperature was minimal. At an inlet velocity of 0.3 m·s
−1, the maximum temperature difference between 90° and 30° channel angles was 0.33 °C, which decreased to merely 0.13 °C when the inlet velocity increased to 0.7 m·s
−1. Furthermore, increasing the channel angle led to a higher temperature uniformity index, indicating deteriorating temperature consistency across the cooling plate surface. This phenomenon can be attributed to reduced fluid volume in secondary channels at larger angles, which decreases effective heat transfer area. Additionally, larger channel angles weaken fluid rotation and vortex intensity, reducing fluid mixing and resulting in less uniform temperature distribution within the cooling plate. However, when the channel angle exceeded 60°, the rate of change in this index decreased, indicating stabilized fluid mixing effects and thermal conduction equilibrium.
As demonstrated in
Figure 19, under constant flow velocity, the inlet–outlet pressure drop decreased as the channel angle increased. This reduction occurs because larger channel angles shorten the fluid path through secondary channels while reducing vortex intensity and frictional resistance. However, this trend became less pronounced beyond 45°. At an inlet velocity of 0.5 m·s
−1, the 45° channel configuration showed a 6.0% pressure drop reduction compared to the 30° configuration, while the 90° configuration only achieved a further 2.0% reduction compared to the 45° configuration. This diminishing effect occurs because fluid mixing stabilizes and pressure distribution becomes uniform at larger angles, making further angle increases less impactful on pressure drop characteristics.
Based on the comprehensive analysis of channel angle effects on both heat dissipation and pressure drop characteristics, a channel angle of 45° was selected as the optimal configuration for subsequent single-factor studies of cooling plate performance.
4.3.3. Effect of the Width (d) of Secondary Flow Channels on the Thermal-Hydraulic Performance of Cooling Plates
In this section, the cooling plate model incorporates eight secondary channels with a channel angle of 45°. The channel width varies between 0.5 mm, 0.75 mm, 1 mm, 1.25 mm, and 1.5 mm, while maintaining a constant channel spacing of 2 mm and other boundary conditions are unchanged. This analysis examines the effects of secondary channel width (d) on both heat dissipation performance and pressure drop characteristics.
As shown in
Figure 20, under the same flow velocity, both the maximum surface temperature and temperature difference in the cooling plate increase with the channel width. At a coolant inlet velocity of 0.5 m·s
−1, the cooling plate with 1.5 mm channel width exhibits maximum temperature and temperature difference values 0.64 °C higher than those with 0.5 mm channel width. This phenomenon occurs because wider channels reduce fluid velocity within the channels, leading to heat stagnation or non-uniform heat transfer, thereby weakening the heat exchange capacity of the coolant. Conversely, in narrower secondary channels, dramatic local velocity variations promote vortex formation, enhancing heat exchange efficiency. As shown in
Figure 20c, channel width has minimal impact on the average plate temperature, with maximum temperature variations of only 0.12 °C among different channel widths at an inlet velocity of 0.7 m·s
−1.
Figure 20d demonstrates that at constant flow velocities (>0.4 m·s
−1), the temperature uniformity index increases with increasing channel width, indicating deteriorating temperature consistency. However, this effect becomes negligible beyond 1.25 mm channel width, as the fluid flow reaches a stable state and mixing effects become saturated, resulting in no further changes in heat exchange capacity or temperature uniformity.
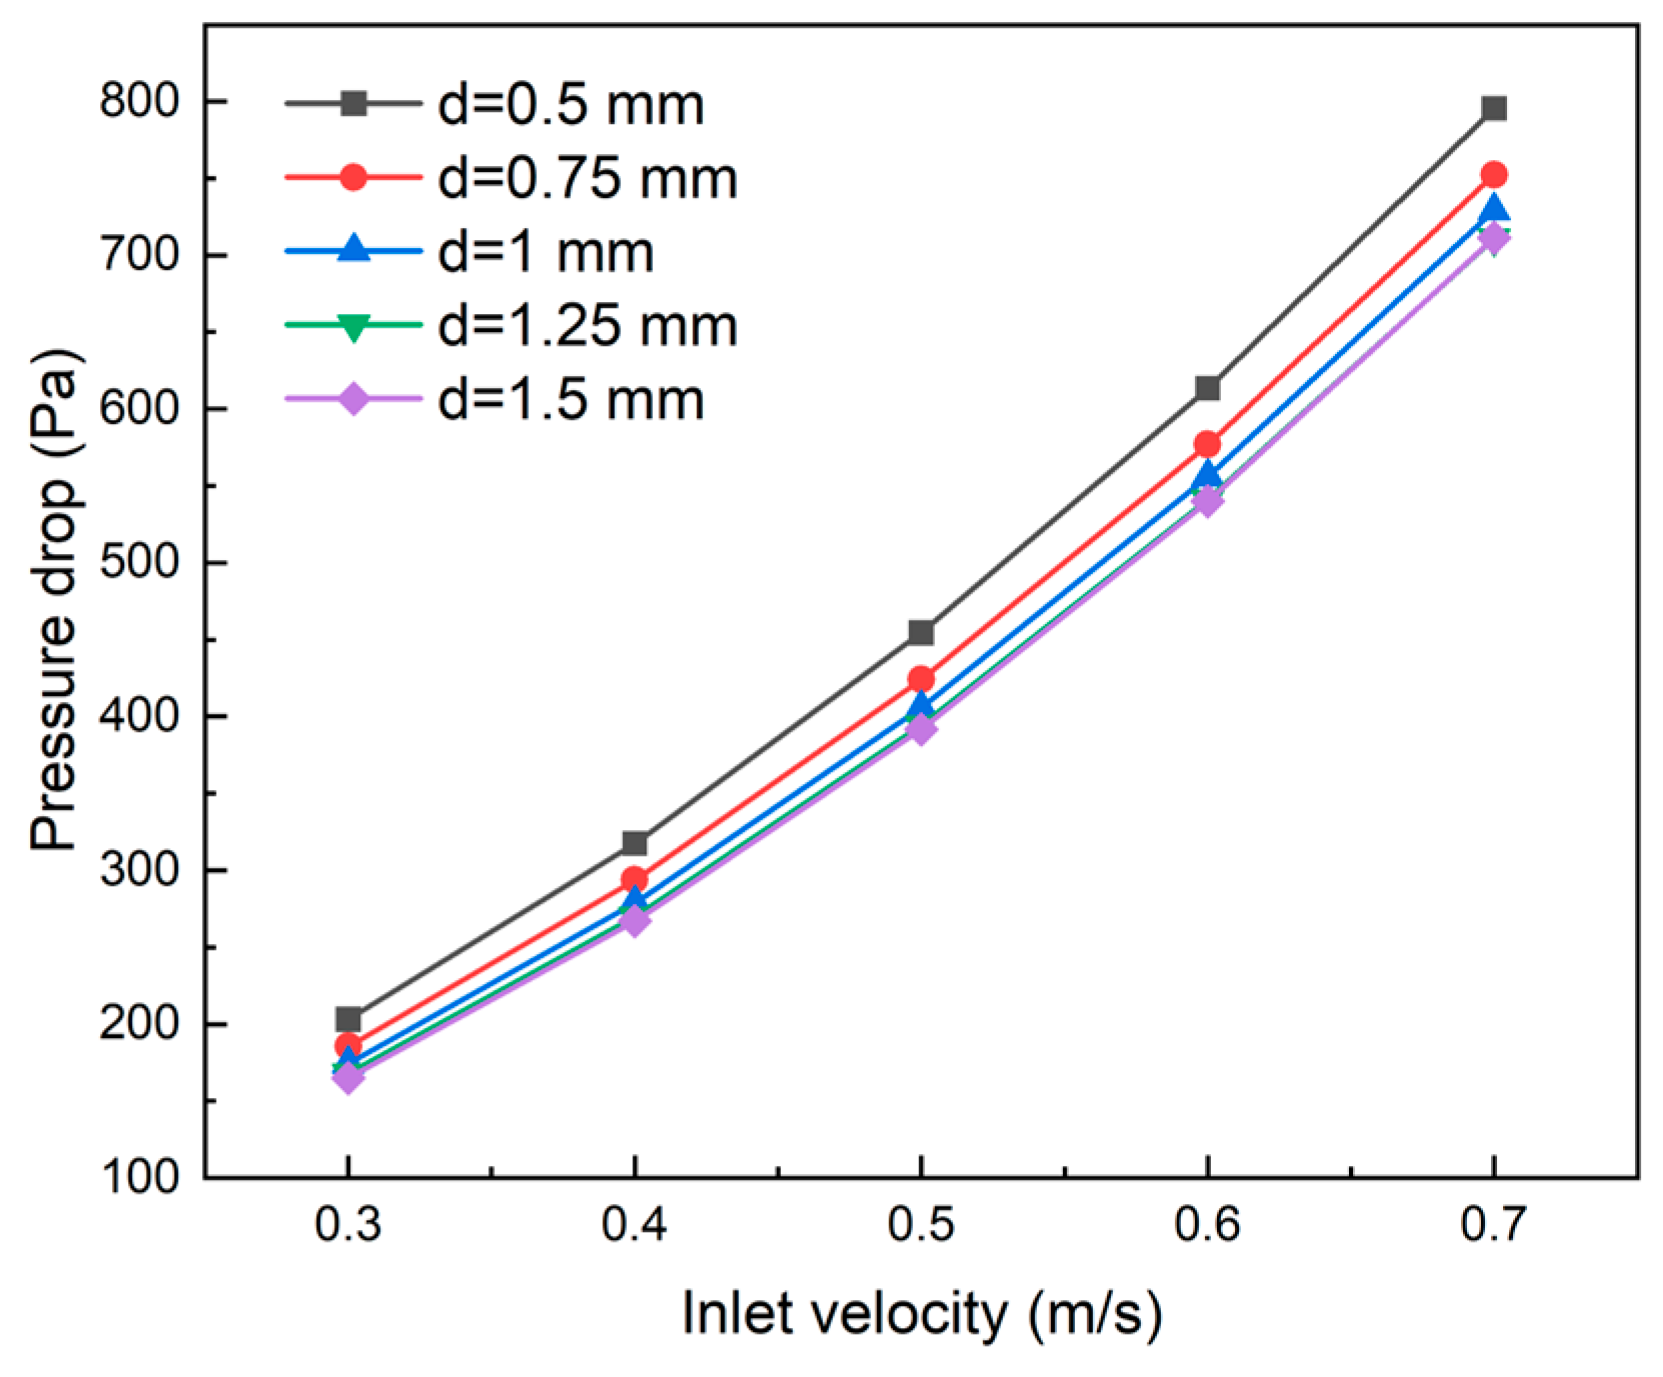
As illustrated in
Figure 21, under constant flow velocity, the inlet–outlet pressure drops decrease with increasing channel width, though at a diminishing rate. At a coolant inlet velocity of 0.5 m·s
−1, the pressure drop for the 1 mm channel width is 10.7% lower than that for 0.5 mm, while the 1.5 mm channel width shows only a 3.45% further reduction compared to 1 mm. This trend occurs because beyond a certain channel width, fluid velocity stabilizes within the channels, and the influence of fluid viscosity on pressure drop becomes constant, resulting in minimal pressure drop variations with further width increases.
Based on the comprehensive analysis of secondary channel width effects on both heat dissipation performance and pressure drop characteristics, a channel width of 1 mm is selected as the optimal configuration for subsequent research, balancing optimal cooling performance with pump power efficiency.
4.3.4. Effect of the Spacing (L) of Secondary Flow Channels on the Thermal-Hydraulic Performance of Cooling Plates
In this section, the cooling plate model incorporates eight secondary channels with a channel angle of 45° and a channel width of 1 mm. The channel spacing varies between 1 mm, 1.5 mm, 2 mm, 2.5 mm, and 3 mm, while other boundary conditions remain unchanged. This analysis examines the effects of secondary channel spacing (L) on both heat dissipation performance and pressure drop characteristics.
As shown in
Figure 22, under the same flow velocity, the heat dissipation performance improves with increasing channel spacing. At a coolant inlet velocity of 0.5 m·s
−1, the cooling plate with 1 mm channel spacing exhibits maximum temperature and temperature difference values 0.65 °C higher than those with 3 mm spacing. As illustrated in
Figure 22c, channel spacing has minimal impact on the average plate temperature, with the maximum temperature difference between 1 mm and 3 mm spacing configurations being only 0.22 °C at 0.5 m·s
−1.
Figure 22d demonstrates that the temperature uniformity index decreases with increasing channel spacing, and this reduction becomes slightly more pronounced at higher inlet velocities. This improvement in temperature uniformity can be attributed to the influence of channel spacing on local flow patterns and vortex effects. At an inlet velocity of 0.3 m·s
−1, the difference in temperature uniformity index between 3 mm and 1 mm spacing configurations is 0.15, which increases to 0.18 at 0.7 m·s
−1.
As shown in
Figure 23, the inlet–outlet pressure drops increase with increasing coolant inlet velocity for all channel spacing configurations, with approximately consistent growth rates. From a vertical perspective, at constant inlet velocity, channel spacing variations have minimal impact on pressure drop characteristics. At an inlet velocity of 0.7 m·s
−1, the maximum pressure drop difference among different channel spacing configurations is only 12.39 Pa. This minimal effect occurs because changes in channel spacing do not significantly alter the flow regime within secondary channels or the frictional resistance, resulting in a minimal impact on pressure distribution.
Comprehensive analysis of secondary channel spacing effects on both heat dissipation and pressure drop characteristics reveals that while modifying channel spacing can improve heat dissipation performance to some extent, its impact on inlet–outlet pressure drop remains minimal.
4.4. Parameter Optimization of Secondary Flow Channel Parameters Based on Orthogonal Experiment
This section employs both orthogonal experimental design and range analysis methods to examine the sensitivity and optimal parameter combinations of cooling plates under different optimization objectives when four factors interact simultaneously, thereby providing optimization strategies for PEMFC cooling plate design.
Compared to single-factor analysis, orthogonal experimental design enables a more comprehensive evaluation of multiple concurrent parameter variations, avoiding the limitations of isolated parameter studies. To investigate the effects of multiple factors on different optimization objectives, this study implements a four-factor, five-level orthogonal experimental design, comprising 25 test conditions. The factor levels are presented in
Table 5, and the 25 experimental configurations are detailed in
Table 6.
According to the experimental design outlined above, numerical simulations were conducted using COMSOL Multiphysics for 25 cooling plate configurations with varying secondary channel structural parameters. The boundary conditions remained consistent with previous simulations, and the simulation results are presented in
Table 7.
The range analysis method was employed to evaluate the effects of four structural parameters on both heat dissipation capacity and pressure drop characteristics of the cooling plate. This method enables the determination of primary–secondary order and optimal combinations of influencing factors on experimental indicators. The specific equations are as follows Equations (13)–(15):
where
represents the experimental result corresponding to the factor in column
i at level
j,
denotes the sum of experimental results for the factor in column
i at level
j,
represents the mean value of the evaluation index sum, and
R indicates the range value of factors, calculated as the difference between the maximum and minimum mean values under different levels for the factor in column
i.
The range R represents the maximum difference of for each factor, with larger range values indicating greater influence of the corresponding factor level on the evaluation index. Therefore, the primary–secondary order of factors affecting the evaluation indices can be determined based on the magnitude of range values R.
4.4.1. Range Analysis of Maximum Surface Temperature in the Cooling Plate
Table 8 presents the range analysis results using the maximum surface temperature of the cooling plate as the evaluation index. The analysis reveals that channel width (
d) has the most significant impact on the maximum surface temperature, followed by channel angle (
α) and channel spacing (
L), while the channel number (
N) demonstrates the least influence. Through analysis of the mean value
at different levels for each factor, where lower values indicate better performance for the maximum surface temperature index, the optimal combination of secondary channel structural parameters was determined to be
N = 7,
α = 30°,
d = 0.5 mm, and
L = 2.5 mm.
4.4.2. Range Analysis of Maximum Temperature Difference in the Cooling Plate
Table 9 presents the range analysis results using the maximum temperature difference across the cooling plate surface as the evaluation index. Analysis of the range values reveals that the influence pattern of various factors on the maximum temperature difference mirrors that of the maximum surface temperature. The sensitivity ranking of factors affecting the maximum temperature difference is as follows: channel width (
d) > channel angle (
α) > channel spacing (
L) > channel number (
N). Through comparison of the mean value
for each factor, the optimal configuration of secondary channel structural parameters for minimizing surface temperature difference was determined to be
N = 7,
α = 30°,
d = 0.5 mm, and
L = 2.5 mm.
4.4.3. Range Analysis of Temperature Uniformity Index in the Cooling Plate
Table 10 presents the range analysis results using the temperature uniformity index of the cooling plate as the evaluation index. A lower temperature uniformity index indicates more uniform temperature distribution across the cooling plate surface. Comparison of range values among the four factors reveals the sensitivity ranking of factors affecting the temperature uniformity index as follows: channel width (
d) > channel angle (
α) > channel spacing (
L) > channel number (
N). Through analysis of the mean value
for each factor, the optimal configuration of secondary channel structural parameters for minimizing the temperature uniformity index was determined to be
N = 7,
α = 30°,
d = 0.5 mm, and
L = 2.5 mm.
4.4.4. Range Analysis of the Inlet–outlet Pressure Drops in the Cooling Plate
Table 11 presents the range analysis results using the inlet–outlet pressure drop of the coolant as the evaluation index. Comparison of range values among the four factors reveals the sensitivity ranking of factors affecting the pressure drop as follows: channel width (
d) > channel number (
N) > channel angle (
α) > channel spacing (
L). Through analysis of the mean value
at different levels for each factor, the optimal configuration of secondary channel structural parameters for optimizing inlet–outlet pressure drop was determined to be
N = 8,
α = 75°,
d = 1.5 mm, and
L = 2.5 mm.
4.4.5. Range Analysis of the Cooling Efficiency Coefficient in the Cooling Plate
Table 12 presents the range analysis results using the cooling efficiency coefficient of the cooling plate as the evaluation index. Comparison of range values among the four factors reveals the sensitivity ranking of factors affecting the cooling efficiency coefficient as follows: channel width (
d) > channel number (
N) > channel angle (
α) > channel spacing (
L). A higher cooling efficiency coefficient indicates enhanced heat transfer capacity per unit pumping power, and thus better cooling performance of the plate. Through analysis of the mean value
at different factor levels, the optimal configuration of secondary channel structural parameters for maximizing the cooling efficiency coefficient was determined to be
N = 8,
α = 90°,
d = 1.5 mm, and
L = 2.5 mm.
The parametric analysis revealed distinct relationships between structural parameters and thermal-hydraulic performance. The channel number exhibited minimal impact on thermal performance (a maximum temperature difference of only 0.1 °C between cooling plates) while significantly reducing inlet–outlet pressure drop by up to 12.7% with an increased number of channels. This suggests that optimizing the channel number can improve hydraulic performance without compromising thermal performance. Both channel angle and width demonstrated an inverse relationship between thermal and hydraulic performance: increases in either parameter degraded heat dissipation capability while reducing the pressure drop. However, a notable threshold effect was observed where pressure drop benefits diminished beyond 45° angles and 1 mm widths, indicating practical upper limits for these parameters. Channel spacing showed a positive correlation with thermal performance but negligible impact on hydraulic performance. The orthogonal experimental design provided critical insights into parameter sensitivity under simultaneous variation. For temperature-related optimization objectives, parameter sensitivity ranked as follows: d > α > L > N. For objectives related to pressure drop and cooling efficiency coefficient, the influence ranking shifted to d > N > α > L. These findings demonstrate that channel width (d) consistently exerts the dominant influence across all performance metrics, making it the primary design parameter for cooling plate optimization. The contrasting influence rankings between thermal and hydraulic objectives highlight the trade-offs in cooling plate design and underscore the importance of parameter-specific optimization based on application priorities in marine PEMFC systems.


