Article

Numerical Simulation Study on Combustion Characteristics of a Low-Speed Marine Engine Using Biodiesel

Merchant Marine College, Shanghai Maritime University, Shanghai 201306, China
*
Author to whom correspondence should be addressed.
J. Mar. Sci. Eng. 2025, 13(4), 824; https://doi.org/10.3390/jmse13040824
Submission received: 26 March 2025 / Revised: 16 April 2025 / Accepted: 18 April 2025 / Published: 21 April 2025

Abstract

:
The growth of global trade has fueled a booming shipping industry, but high pollutant emissions from low-speed marine diesel engines have become a global concern. In this study, it is hypothesized that the combustion efficiency of biodiesel B10 in low-speed two-stroke diesel engines can be improved and pollutant emissions can be reduced by optimizing the exhaust gas recirculation (EGR) rate and injection time. This study systematically analyzed the effects of EGR rate (5%, 10%, and 20%) and injection time (0 °CA to 6 °CA delay) on combustion and emission characteristics using numerical simulation combined with experimental validation. The results showed that the in-cylinder combustion temperature and NOx emission decreased significantly with the increase in EGR rate, but the soot emission increased. Specifically, NOx emissions decreased by 35.13%, 59.95%, and 85.21% at EGR rates of 5%, 10%, and 15%, respectively, while soot emissions increased by 12.25%, 26.75%, and 58.18%, respectively. Delaying the injection time decreases the in-cylinder pressure and temperature peaks, decreasing NOx emissions but increasing soot emissions. Delaying the injection time from 2 °CA to 4 °CA and 6 °CA decreased NOx emission by 16.01% and 25.44%, while increasing soot emission by 4.98% and 11.64%, respectively. By combining numerical simulation and experimental validation, this study provides theoretical support for the combustion optimization of a low-speed two-stroke diesel engine when using biodiesel, and is of great significance for the green development of the shipping industry.

1. Introduction

The continuous growth of global trade has propelled the shipping industry’s prosperity. Marine low-speed diesel engines, known for efficiency, reliability, and durability, are widely used in ocean-going vessels like large commercial ships, container ships, and tankers [1]. However, the rapid development of the shipping industry has caused severe environmental issues, especially the large-scale emission of pollutants during ocean voyages. Statistics show that ocean transportation consumes about 300 million tons of fossil fuels annually, leading to 356.4 million tons of CO2 emissions, around 2.2% of the global total [2]. As international concern over ship pollution rises, organizations like IMO have set new emission targets. They require international shipping’s annual GHG emissions to decrease by at least 20% by 2030 and at least 70% by 2040 compared to 2008, with an aim to reach 80%. Thus, reducing pollutants from marine low-speed diesel engines is an urgent task for the shipping industry.
Under such circumstances, finding a clean and renewable alternative fuel is crucial to solving the pollutant emission problem of marine low-speed diesel engines. Biodiesel, a clean energy source with good renewability and biodegradability, has garnered significant attention. It has physical and chemical properties similar to conventional diesel and features a higher cetane number, oxygen content, and flash point, with extremely low sulfur content. These characteristics enable biodiesel to excel in combustion and emission performance. Numerous studies have demonstrated that the use of biodiesel can effectively reduce the emissions of carbon monoxide (CO), hydrocarbons (HCs), nitrogen oxide (NOx), and particulate matter (PM) from diesel engines. For instance, Nikolic et al. [3] investigated the impact of second-generation biodiesel on marine low-speed engines and found that blends with 7% and 20% biodiesel reduced NOx, CO, and SO2 emissions. Ayatallah et al. [4] examined the effects of waste fish oil biodiesel and its blends on single-cylinder diesel engines, revealing significant reductions in HC and CO emissions compared to diesel. Nabi et al. [5] studied the impact of biodiesel from waste cooking oil on PM emissions from a six-cylinder turbocharged diesel engine, observing substantial PM emission reductions across all modes, with a maximum decrease of 84%. Yusuf et al. [6] experimentally investigated the effect of different blending ratios of biodiesel and diesel (B0, B25, and B50) on the emissions of EPA Tier II marine propulsion engines. The effect of different blending ratios of biodiesel and diesel on the emissions of marine propulsion engines was significant; the emissions of HC and CO were reduced but those of NOx were increased for B50 at high loads, and the higher the biodiesel ratio, the higher the number of ultrafine particles and multi-metal oxide catalyst activity. Biodiesel has a slightly lower heating value than conventional diesel. Yet, in practice, its excellent combustion performance and high oxygen content can effectively enhance combustion efficiency, partly offsetting the lower heating value. Moreover, biodiesel can be used directly in diesel engines without modifications, aligning with the current global advocacy for environmental protection [7,8,9].
However, the practical use of biodiesel in marine low-speed diesel engines faces technological challenges. Numerical simulation is an important method for studying the combustion and emission characteristics of biodiesel. It allows for in-depth analysis of the combustion process of biodiesel in low-speed diesel engines, including temperature, pressure, fuel injection, and distribution of combustion products in the combustion chamber, thereby effectively predicting emissions under different combustion conditions. Previous studies have validated the impact of biodiesel on the combustion and emission characteristics of diesel engines through experiments and modeling [10,11,12,13]. Yet, research on two-stroke low-speed engines is limited. Numerical simulation can adjust injection strategies and combustion parameters to assess their effects on biodiesel performance, offering a theoretical basis for improving combustion technology. Thus, it is a key method for studying biodiesel’s application in marine low-speed diesel engines.
In recent years, exhaust gas recirculation (EGR) and optimized injection strategies have been deemed effective in improving the combustion and emission characteristics of low-speed diesel engines running on biodiesel. Alosius et al. [14] discovered that with used cooking oil and chicken fat biodiesel at 20% EGR, CO, HC, and soot emissions rose. NO emissions climbed with injection pressure but fell with EGR rate, hitting the lowest at 20% EGR and 300 bar pressure. Gu et al. [15] found, through experiments and simulation studies using CONVERGE software, that the introduction of exhaust gases into a four-cylinder diesel engine at 10%, 20%, and 30% EGR rates reduces the combustion chamber temperature and oxygen concentration, which destroys the conditions for NOx generation and, thus, reduces NOx emissions. Yu et al. [16] found that n-pentanol–biodiesel blends significantly reduced NOX emissions (71% reduction at 40% n-pentanol and 30% EGR rate) by establishing a n-pentanol simplification mechanism and using converge software simulation, but a high EGR rate increased carbon smoke emissions. Ji et al. [17] found that rising EGR rates lowered heat release rate peaks, maximum explosion pressure, and combustion temperature. NOx emissions dropped to 2.58 g/kW·h at a 30% EGR rate. Jiang et al. [18] determined that at a 35% EGR rate, marine diesel engines met Tier III NOx limits, with emissions continually falling as EGR rates rose. Yet, fuel consumption and soot emissions increased due to incomplete combustion from low oxygen in the chamber. Mourad et al. [13] showed that preheating biodiesel via a heat exchanger and adjusting the EGR rate improved engine performance and cut emissions. At 25% EGR, NOx emissions fell by 22.2%, CO by 8.16%, and HC by 6.13%. In summary, while adjusting the EGR rate can reduce NOx emissions, it may increase fuel consumption and soot emissions. Therefore, it is crucial to conduct in-depth research on the impact of the EGR rate on the biodiesel combustion process.
Adjustment of injection strategies, including timing, pressure, and quantity, also significantly impacts biodiesel combustion efficiency and emission characteristics. Optimization of these parameters enables precise control of the combustion process, reducing pollutant emissions and boosting efficiency. Sun et al. [19] used CONVERGE software simulation to conclude that combining advanced injection timing with high EGR rates could cut NOx emissions and fuel consumption, enhancing marine diesel engine performance. Ji et al. [20] used CONVERGE software simulation to find that Miller cycle, EGR, and water addition lower NOx emissions. High injection pressure, early injection, and multiple injections offset increase fuel consumption. Optimizing spray atomization improves efficiency and reduces fuel use and pollutants. Yang et al. [21] discovered that at 75% load, varying EGR levels (0%, 5%, 10%, 15%) with biodiesel (B10–B40) showed that an increased injection lead angle optimizes combustion, reducing soot and CO emissions.
However, to achieve efficient application of biodiesel in these engines, in-depth research on its combustion and emission characteristics is essential. Using numerical simulation to explore the impacts of EGR and injection strategy optimization can provide effective solutions for the industry’s green development. This paper presents the first systematic study of the combustion characteristics of biodiesel B10 in a MAN B&W 6S35ME-B9 low-speed two-stroke diesel engine. The effects of exhaust gas recirculation (EGR) rate and injection time on combustion efficiency, nitrogen oxides (NOx) emission, and soot formation are thoroughly analyzed through numerical simulations. This study combines experimental data and numerical simulations to verify the accuracy of the model, and further explores the temperature distribution, equivalence ratio distribution, and pollutant formation mechanism during the combustion process. This study provides a new perspective for the combustion optimization of low-speed two-stroke engines and theoretical support for the green development of the shipping industry.

2. Materials and Methods

2.1. Testing Equipment

To analyze the effects of biodiesel from waste cooking oil on marine low-speed engine performance and emissions, experiments were conducted at Shanghai Maritime University’s automated engine room on an MAN B&W 6S35ME-B9 (MAN Energy Solutions, Augsburg, Germany) low-speed diesel engine. This engine, characterized by a 1550 mm piston stroke and 350 mm bore, is a large-bore, long-stroke design. Detailed parameters are given in Table 1. Figure 1 shows the experimental setup, which included a CAI gas analyzer(California Analytical Instruments, Orange, CA, USA), a Kistler pressure vibration sensor (Kistler Precision Machinery Equipment (Shanghai) Co. Shanghai, China), and an NCK2000 dynamometer (Qidong Changsheng Dynamometer Co., Ltd., Qidong, China) (parameters in Table 2 and Table 3). The experimental results were published earlier [22], and this study further validated the numerical simulation of marine low-speed engines. In this study, base diesel D100 (National VI 0# diesel) was used, and kitchen waste grease biodiesel B10, produced by SGS Standard Technical Services (Shanghai) Co., Ltd. (Shanghai, China), was a biodiesel blend obtained by formulating base diesel D100 with biodiesel in volume ratio, shown in Table 4.

2.2. Geometric Model Establishment and Mesh Generation

This study focuses on the low-speed two-stroke diesel engine 6S35. Its geometric model, based on engineering drawings of low-speed engines, is built in Solidworks. Given the large size and complex structure of marine low-speed engines, creating a full model for simulation would be time-consuming and demanding on computing resources. Thus, to save time, the model is simplified by ignoring the intake and exhaust phases, omitting the scavenge port, scavenge box, and exhaust passage, and only modeling the combustion chamber.

2.3. Initial and Boundary Conditions

The initial and boundary conditions for the simulation were derived from experimental data and empirical values. As shown in Table 5, the initial conditions were set accordingly. As the simulation focuses solely on the combustion chamber, the boundary conditions specify the wall temperatures of the cylinder head, cylinder wall, and piston top at 823 K, 498 K, and 773 K, respectively. The 6S35 low-speed engine has an opposed double injector. The injection timing is 2 °CA after top dead center, with an injection pressure of 47 MPa and an injection duration of 15.28 °CA. The biodiesel mechanism file includes 266 reactions and 75 species. For B10 biodiesel, n-heptane represents diesel, while n-decane, methyl decanoate, and methyl 5-decenoate represent biodiesel, with proportions of 0.9, 0.0351, 0.0032, and 0.0617, respectively [23].The model selection in the simulations is shown in Table 6.

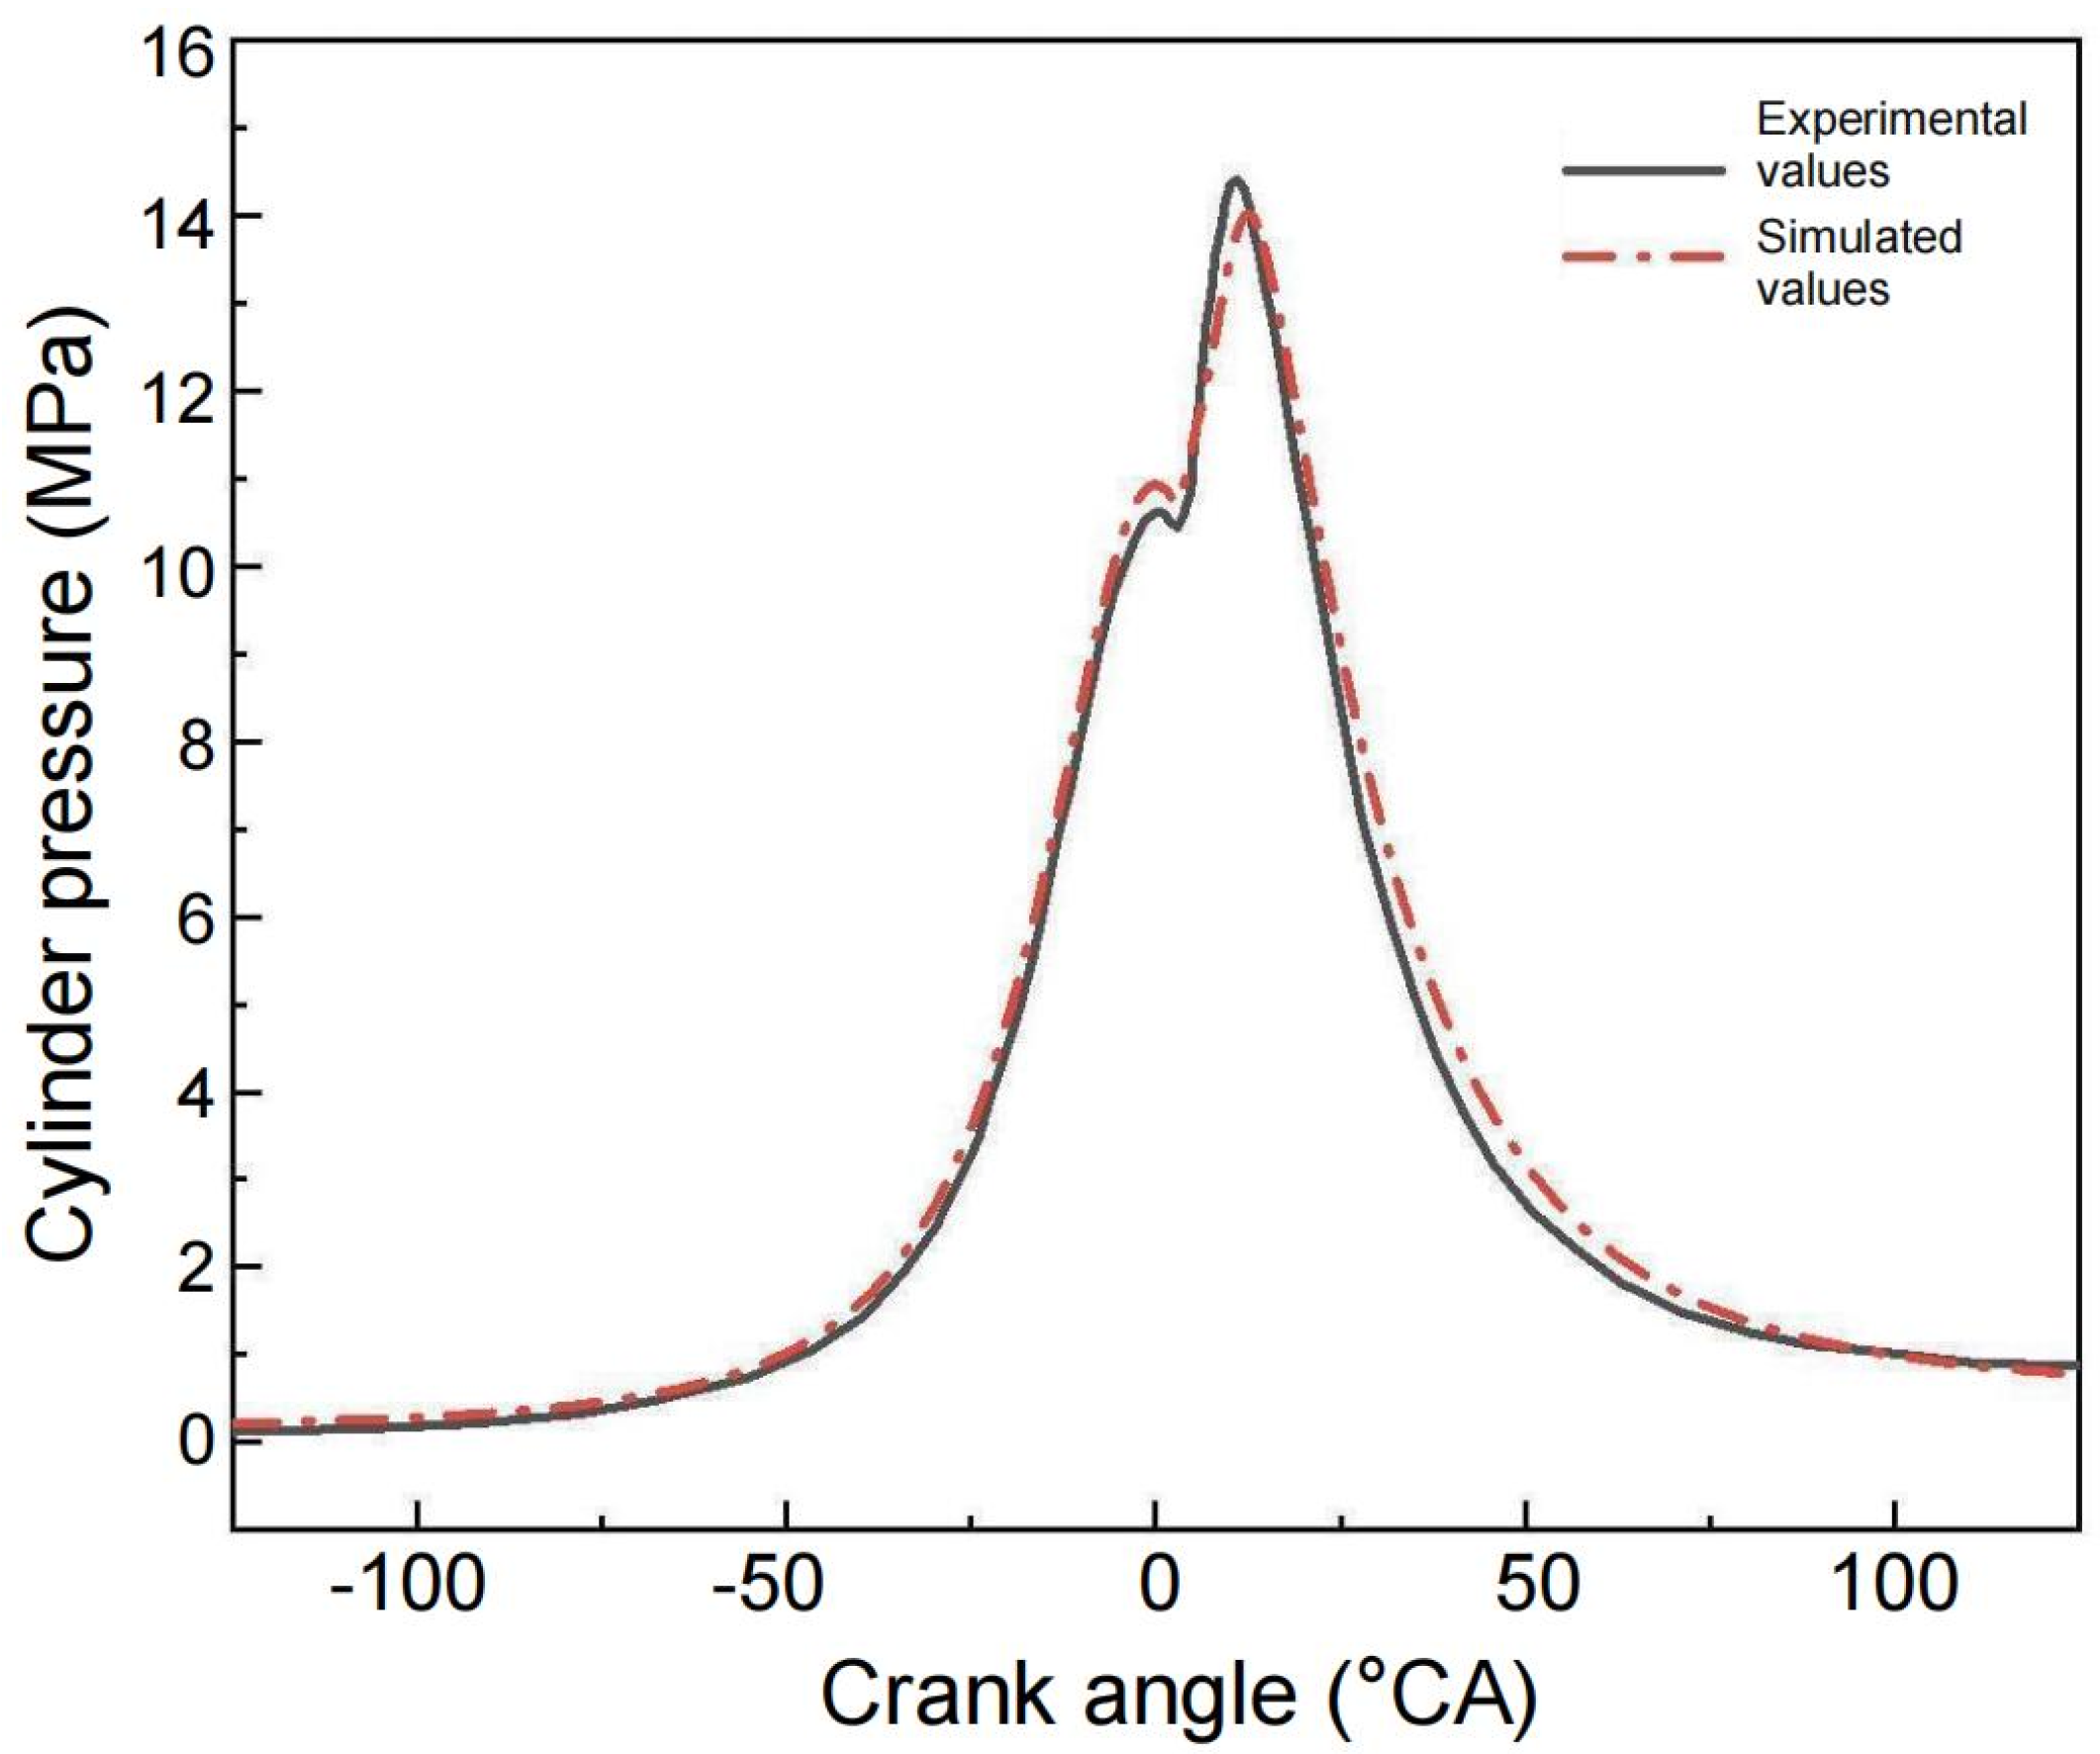
2.4. Verification of Simulation Model

In CONVERGE software, grid count significantly impacts computations. More grids enhance accuracy but increase computational load. During grid independence verification, results from different grid counts are compared to ensure acceptable errors. A grid size of 0.02 m was chosen as it offers high accuracy and efficiency. When selecting grid count, one must balance resource availability and result accuracy to achieve a balance between efficiency and precision [24]. Figure 2 shows grid independence verification. At 75% load, cylinder pressure changes with grid size of 0.01 m, 0.02 m, and 0.03 m are compared. The base grid of 0.02 m shows almost no difference in cylinder pressure compared to 0.01 m. Thus, the grid size is set at 0.02 m to meet simulation requirements and ensure precision with limited resources.
Figure 3 and Table 7 present the comparison between experimental and simulated cylinder pressures, and key parameters for B10 biodiesel at 75% load. The simulated cylinder pressure curve from CONVERGE software aligns with the experimental curve. The simulation errors for peak compression pressure, peak firing pressure, and NOx emissions are all kept within 5%, confirming the model’s accuracy.

3. Results and Discussion

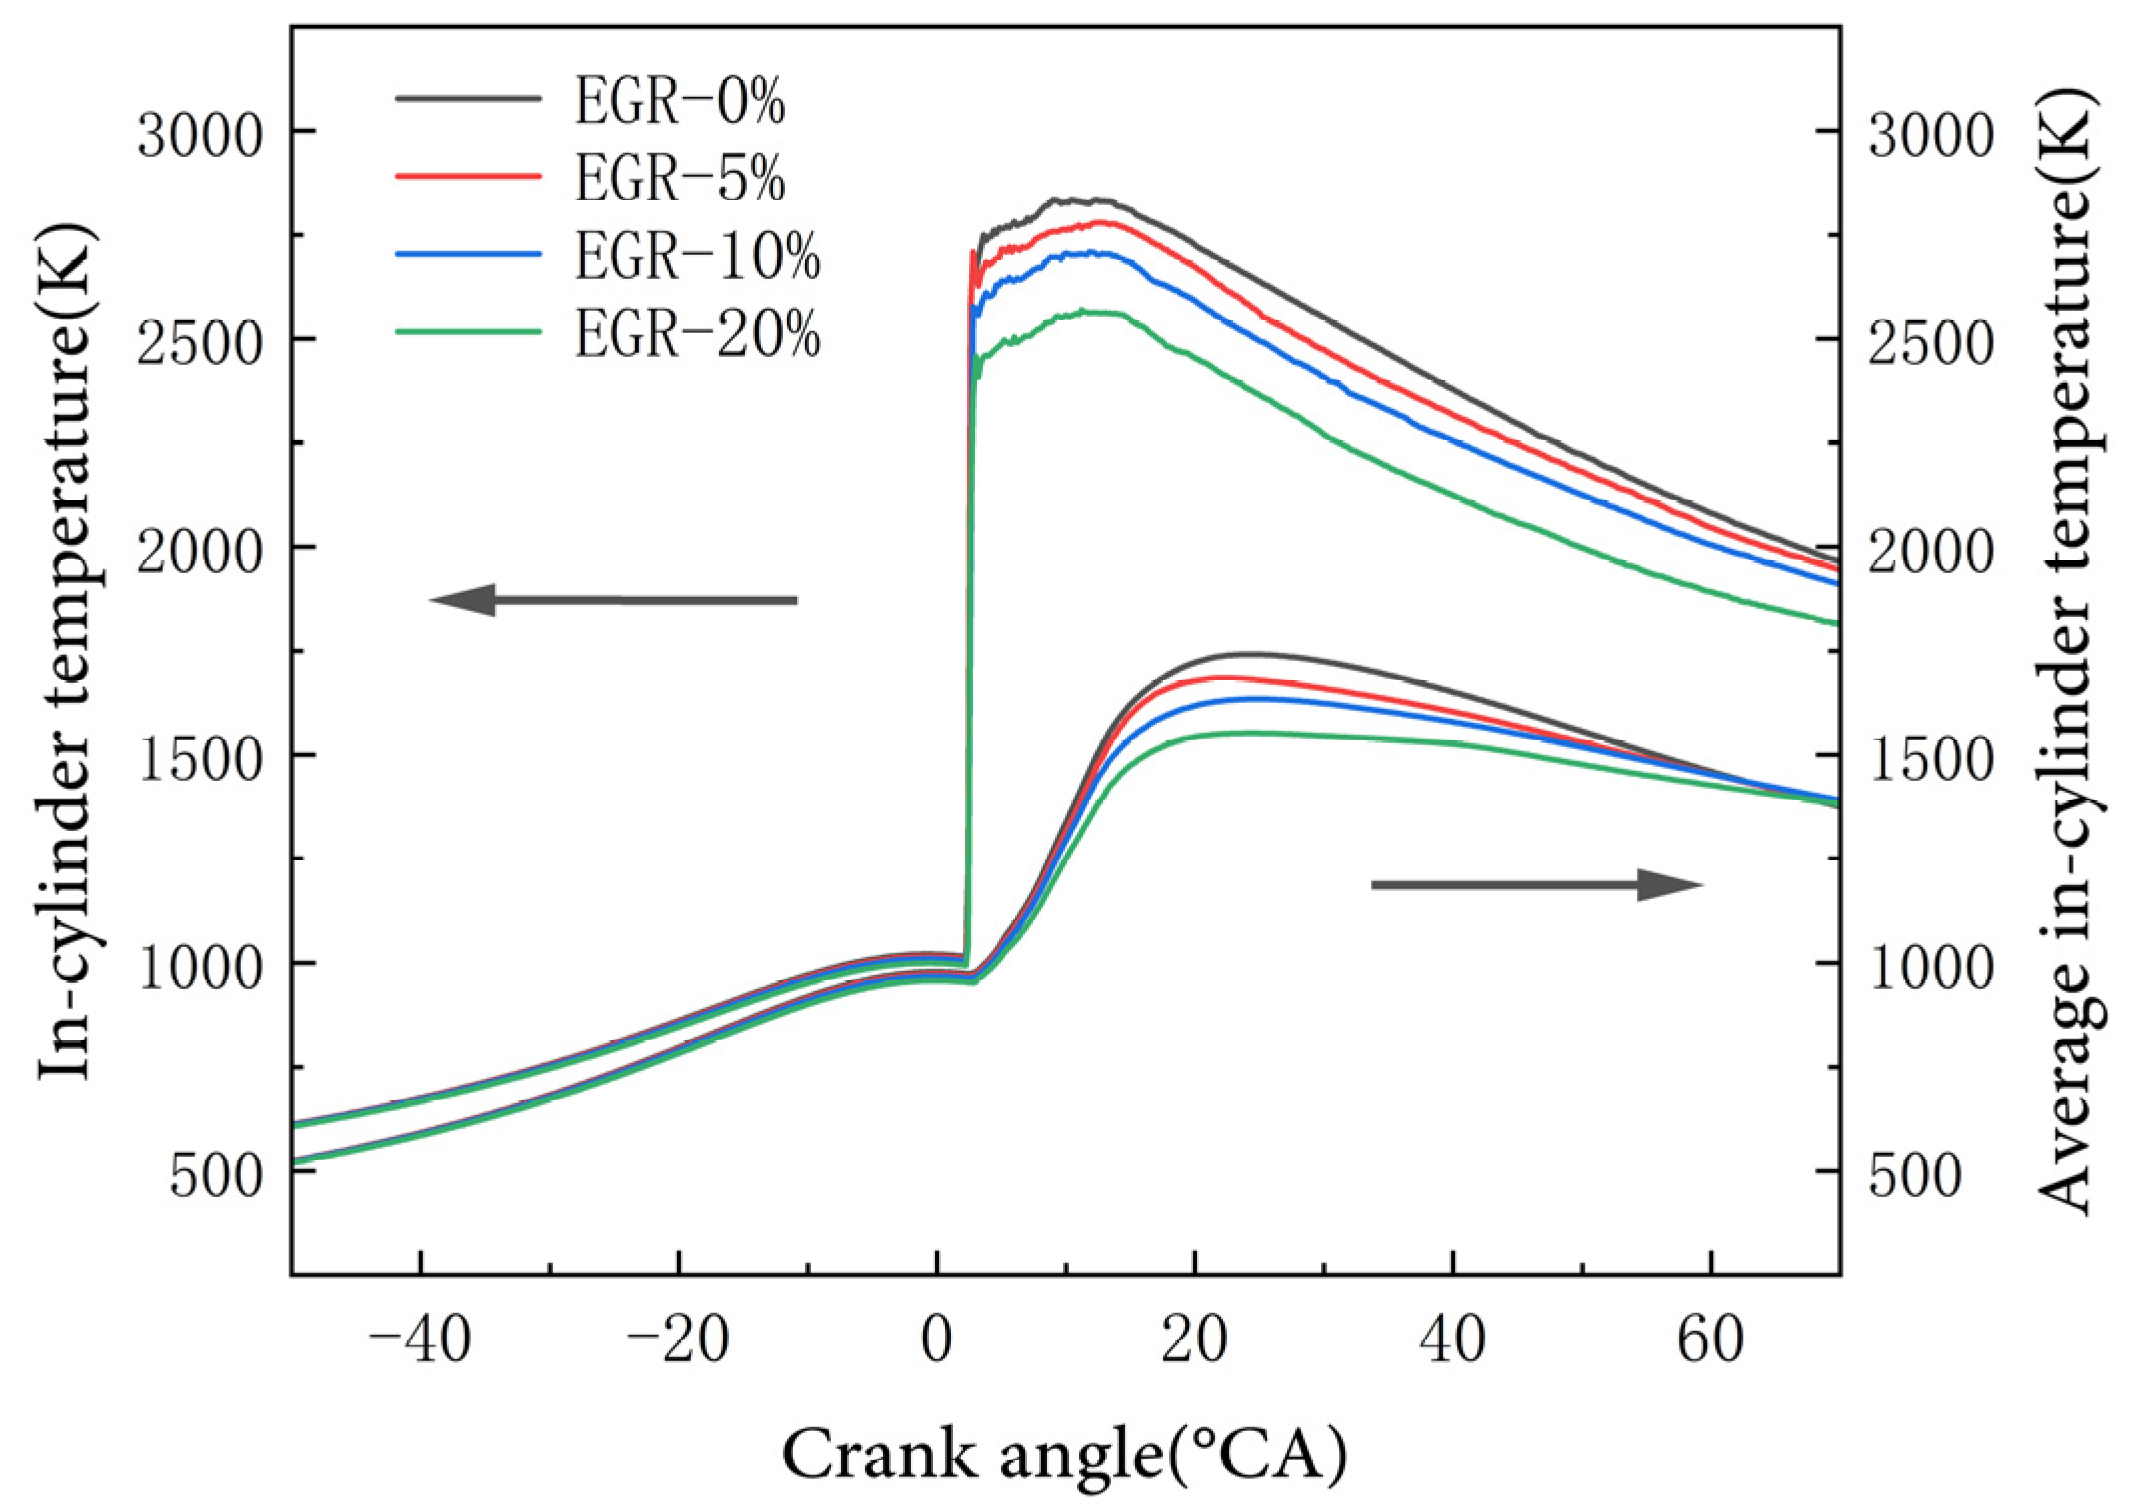
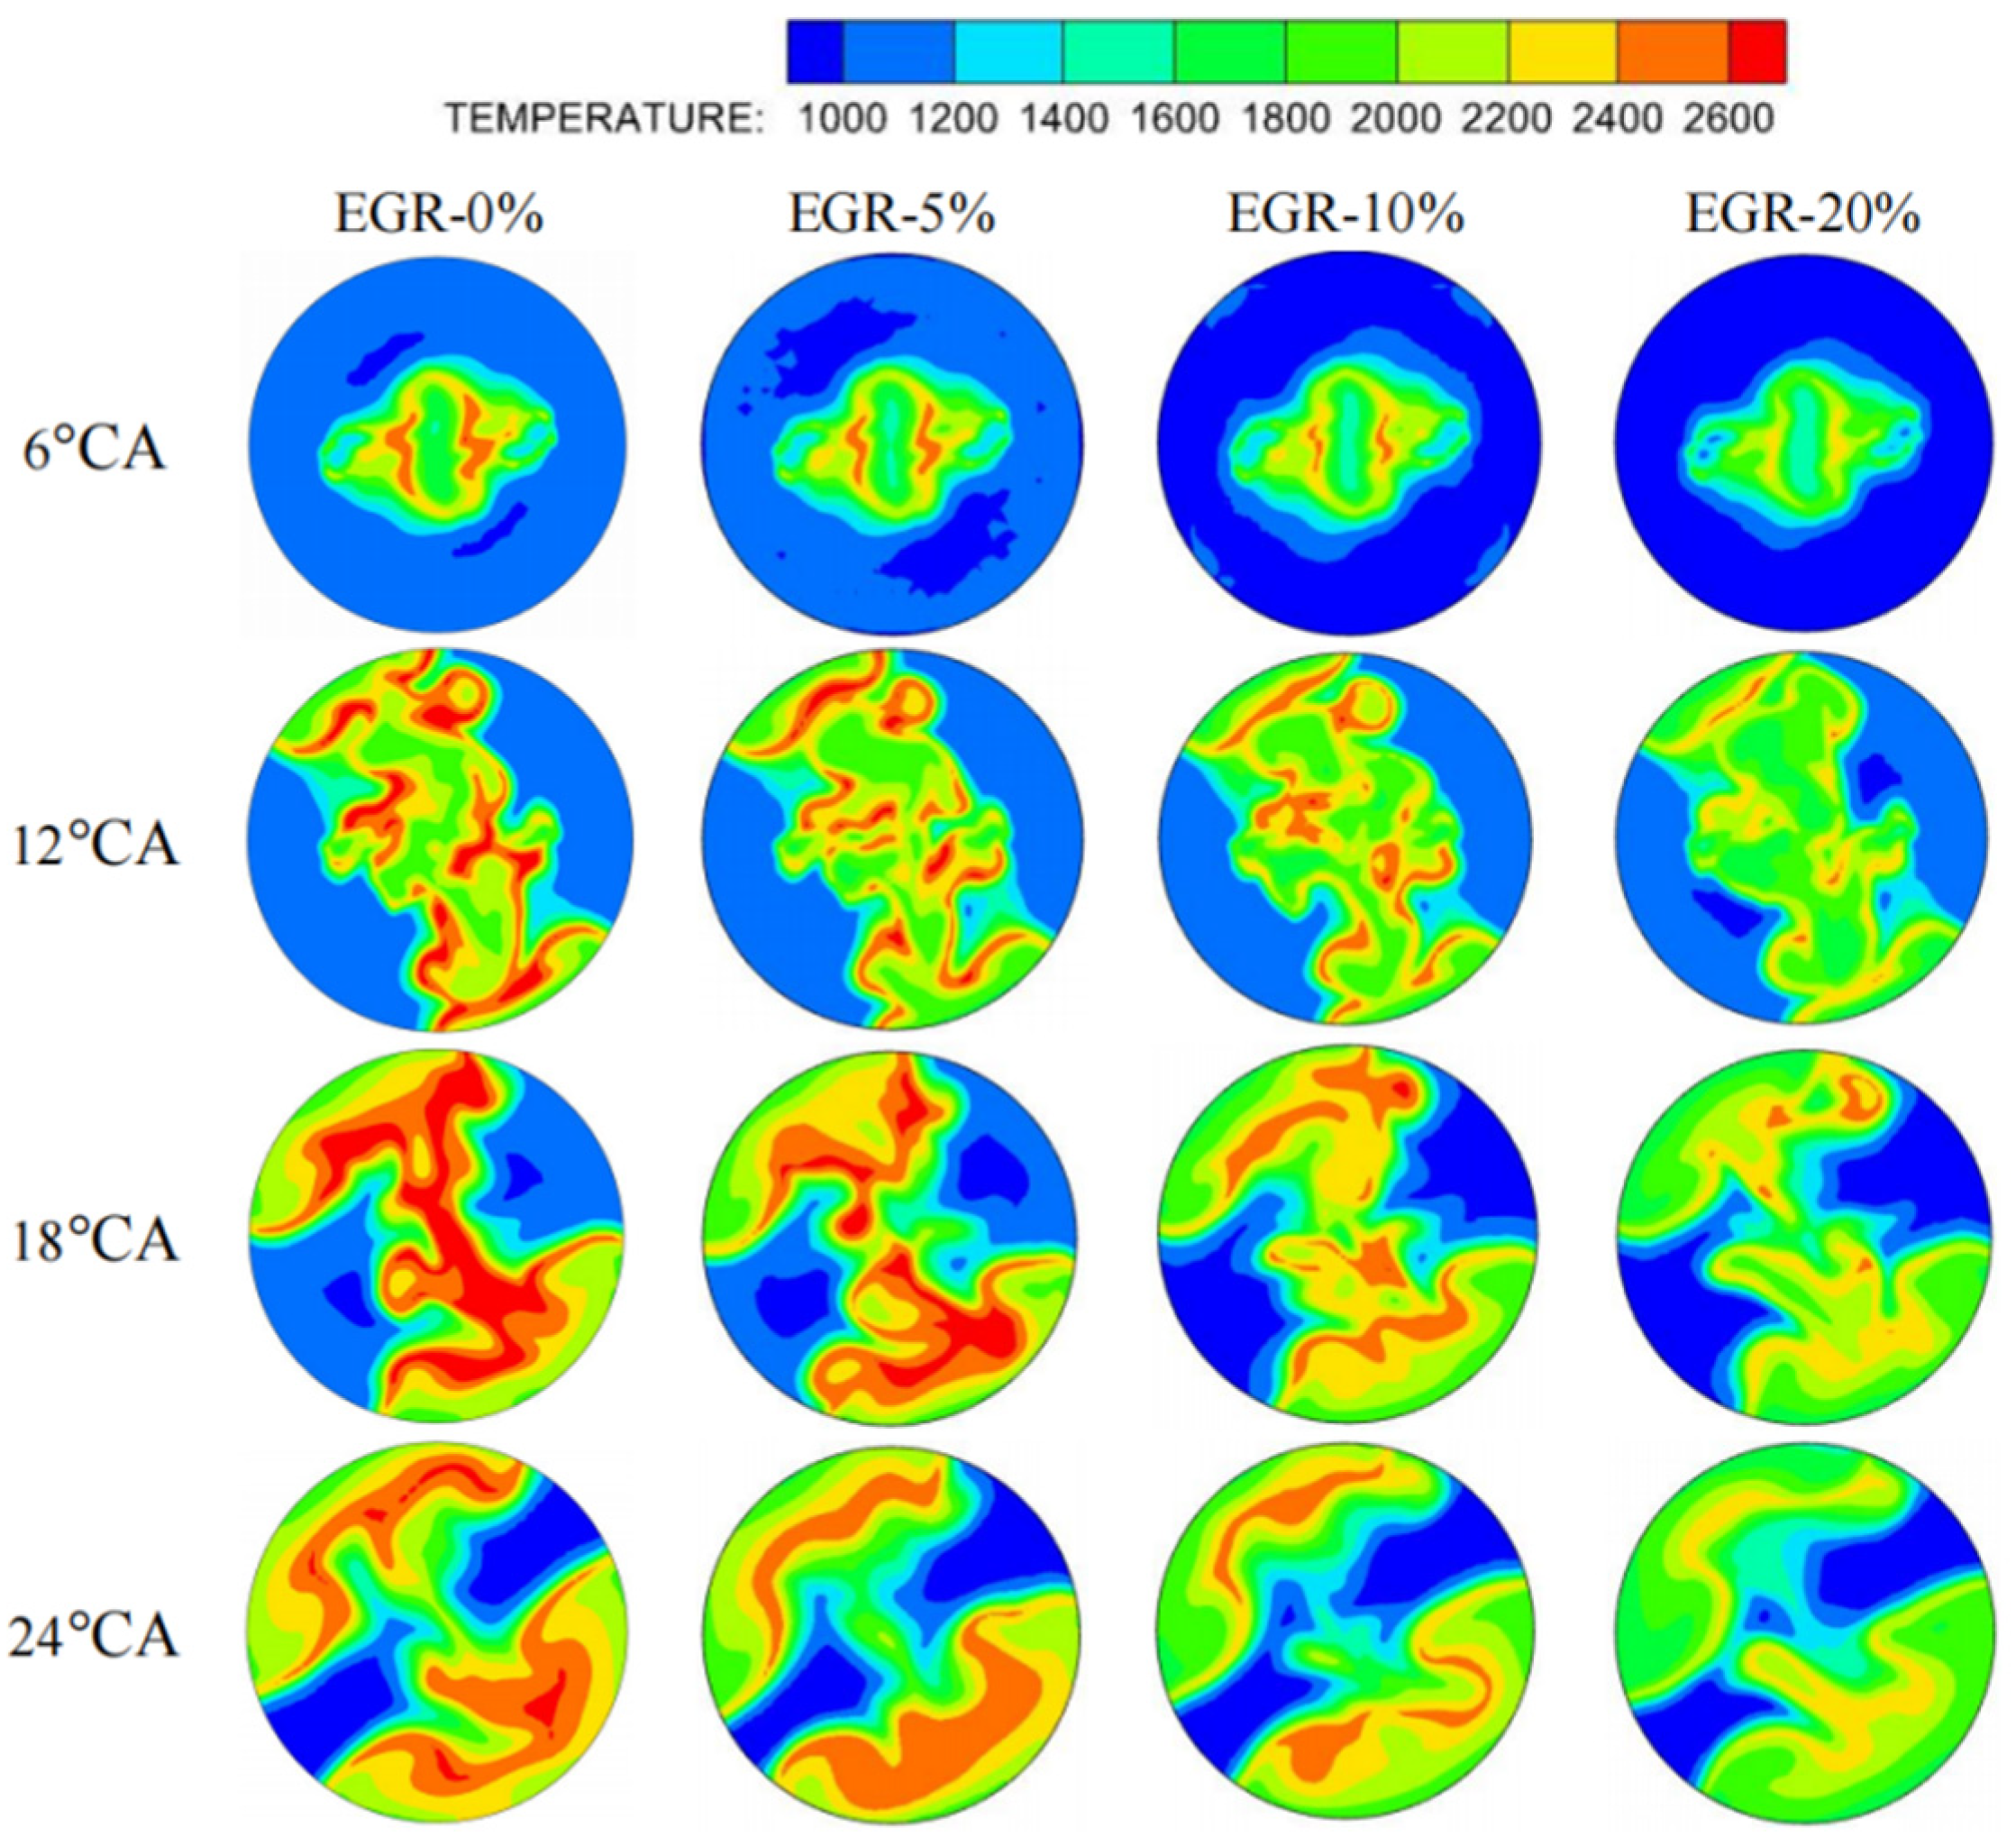
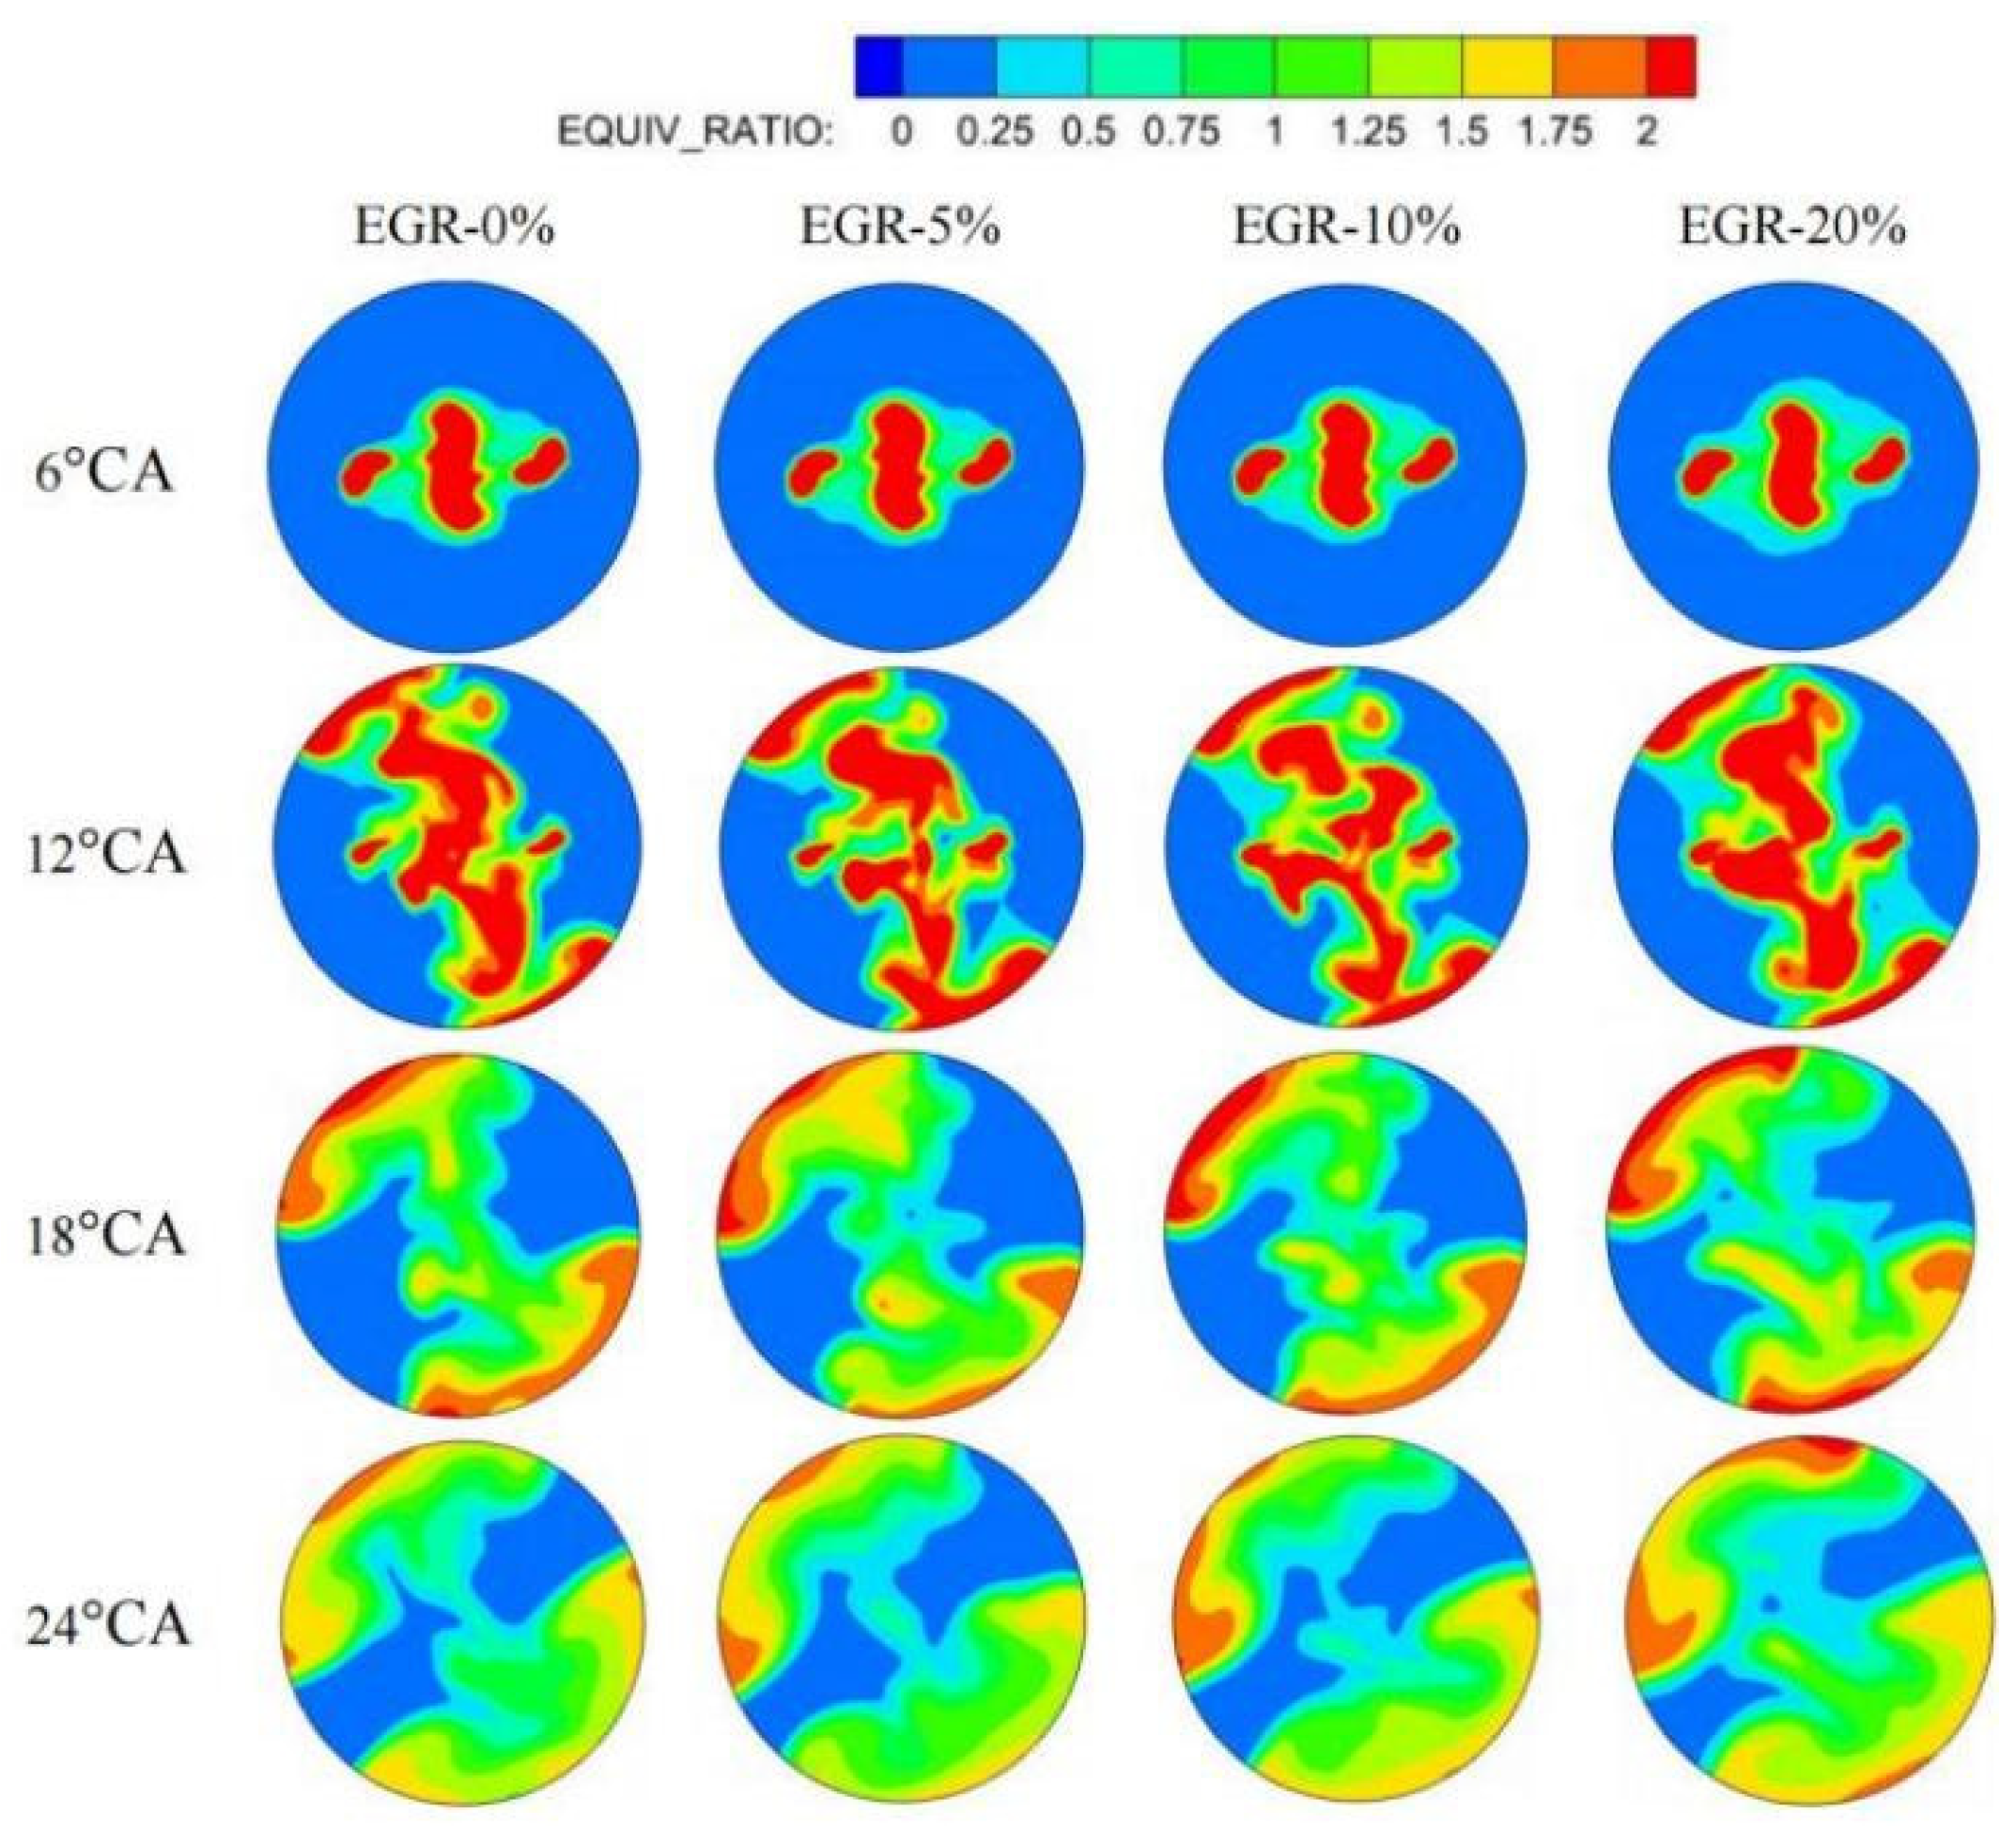
3.1. Impact of Different EGR Rates on Combustion in Low-Speed Engines

With B10 biodiesel as the research subject, the impacts of setting the EGR rate at 5%, 10%, and 20% were analyzed. The temperature downstream of the EGR cooler is 353 K. Figure 4 shows how varying EGR rates affect cylinder pressure changes. As the EGR rate increases, the peak compression pressure remains relatively constant, while the peak firing pressure decreases; this phenomenon is similar to the trend of research on four-stroke engines [15]. An increased EGR rate raises the proportion of non-combustible components in the mixture, lowering gas density and, thus, reducing cylinder pressure. Additionally, the non-combustible components in exhaust gases dilute oxygen concentration, slowing down the combustion rate and further reducing the rate of pressure rise. Certain components in the exhaust gases also lower the in-cylinder combustion temperature, leading to a decrease in peak pressure.
Figure 5 presents the effect of varying EGR rates on cylinder temperature. As the EGR rate rises, the maximum and average cylinder temperatures both drop. The exhaust gases introduced by EGR contain large amounts of CO2 and H2O, which lower the oxygen concentration in the cylinder’s mixture, slowing down the combustion reaction and reducing the temperature. Moreover, these exhaust components increase the mixture’s specific heat capacity, absorbing more heat during combustion and helping to lower the cylinder temperature.
Figure 6 shows the influence of different EGR rates on the temperature distribution in the cylinder. As the EGR rate increases, local high-temperature areas decrease. A higher EGR rate increases the mixture’s specific heat capacity and reduces oxygen concentration, which prevents complete fuel combustion and lowers the combustion temperature. EGR reduces the in-cylinder temperature through dilution and specific heat capacity effects, which is also consistent with the findings in the literature [16]. Lowering the cylinder temperature via EGR helps slow combustion, reduce NOx formation, improve combustion efficiency, and enhance emissions performance. Figure 7 presents the equivalence ratio distribution in the cylinder at different EGR rates. At crank angles of 6 °CA, 12 °CA, 18 °CA, and 24 °CA, there is little variation in the equivalence ratio across EGR rates, indicating that the EGR rate has a minimal effect on the formation of the in-cylinder mixture. The increased EGR rate reduces the in-cylinder combustion temperature through the triple mechanism of oxygen dilution, specific heat capacity enhancement, and mixture inhomogeneity, which in turn leads to a decrease in exhaust gas temperature. This phenomenon is more significant in low-speed two-stroke engines due to the long stroke and diffusion-combustion-dominated characteristics.

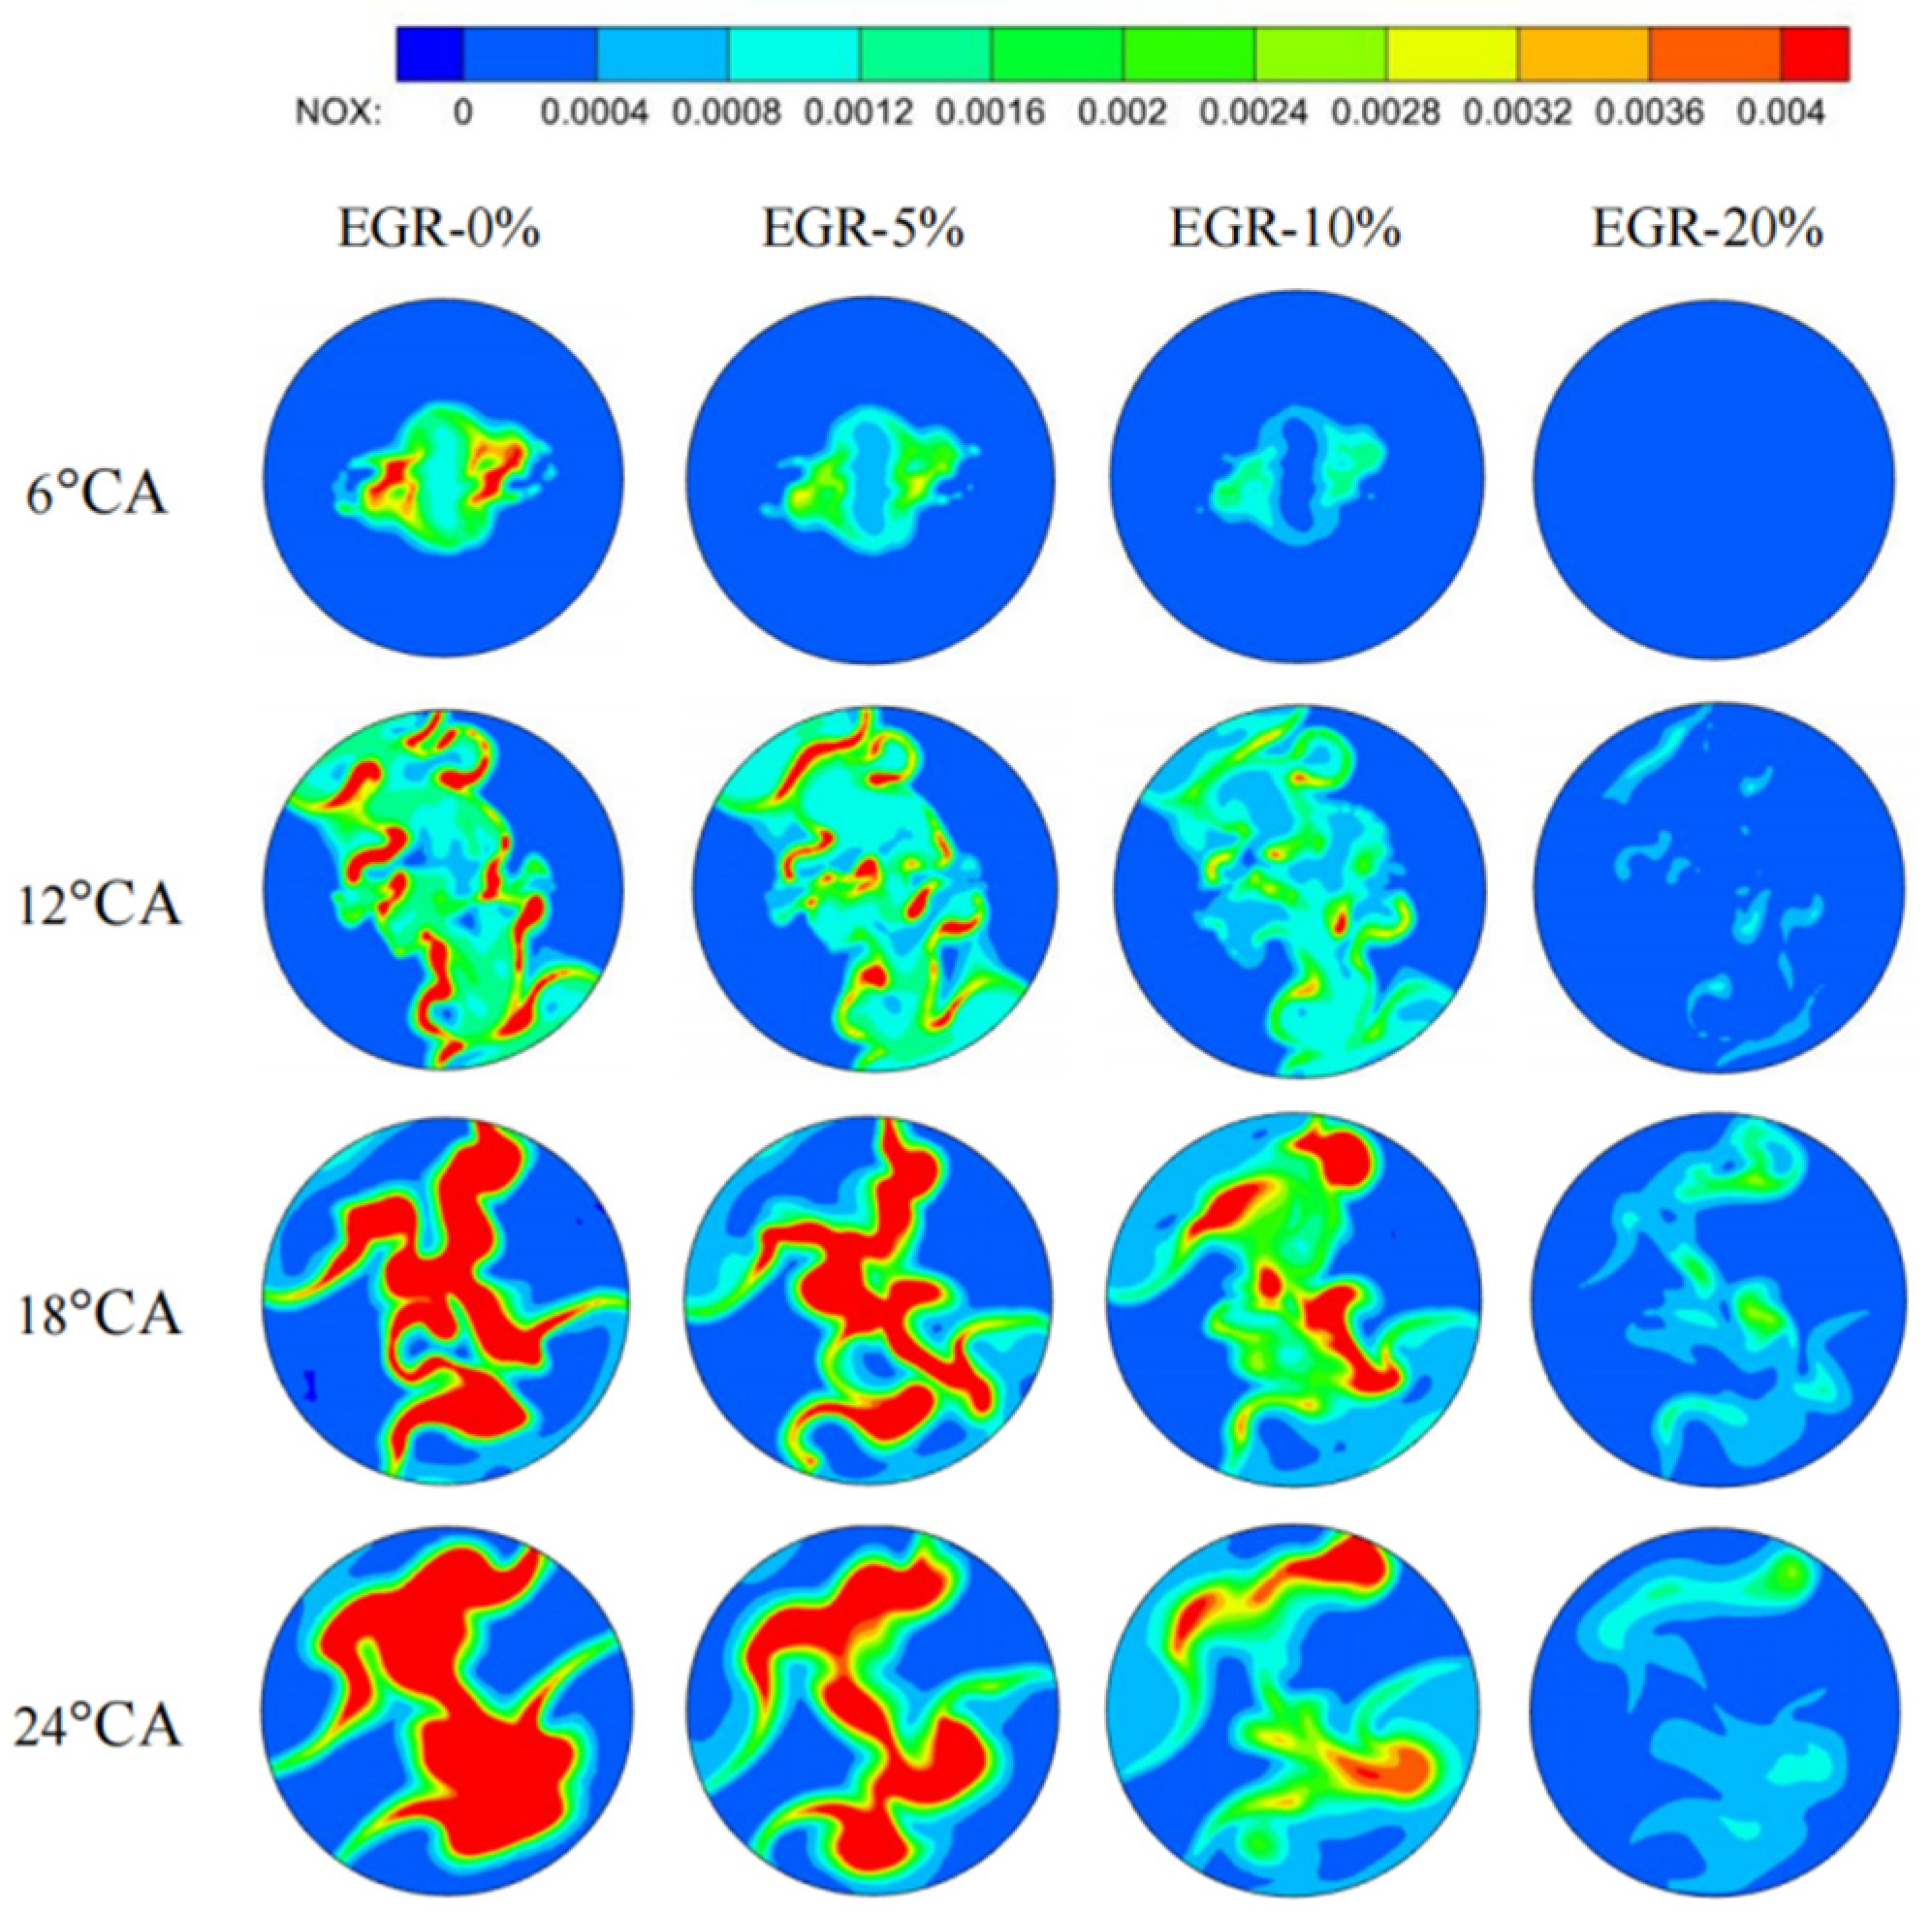
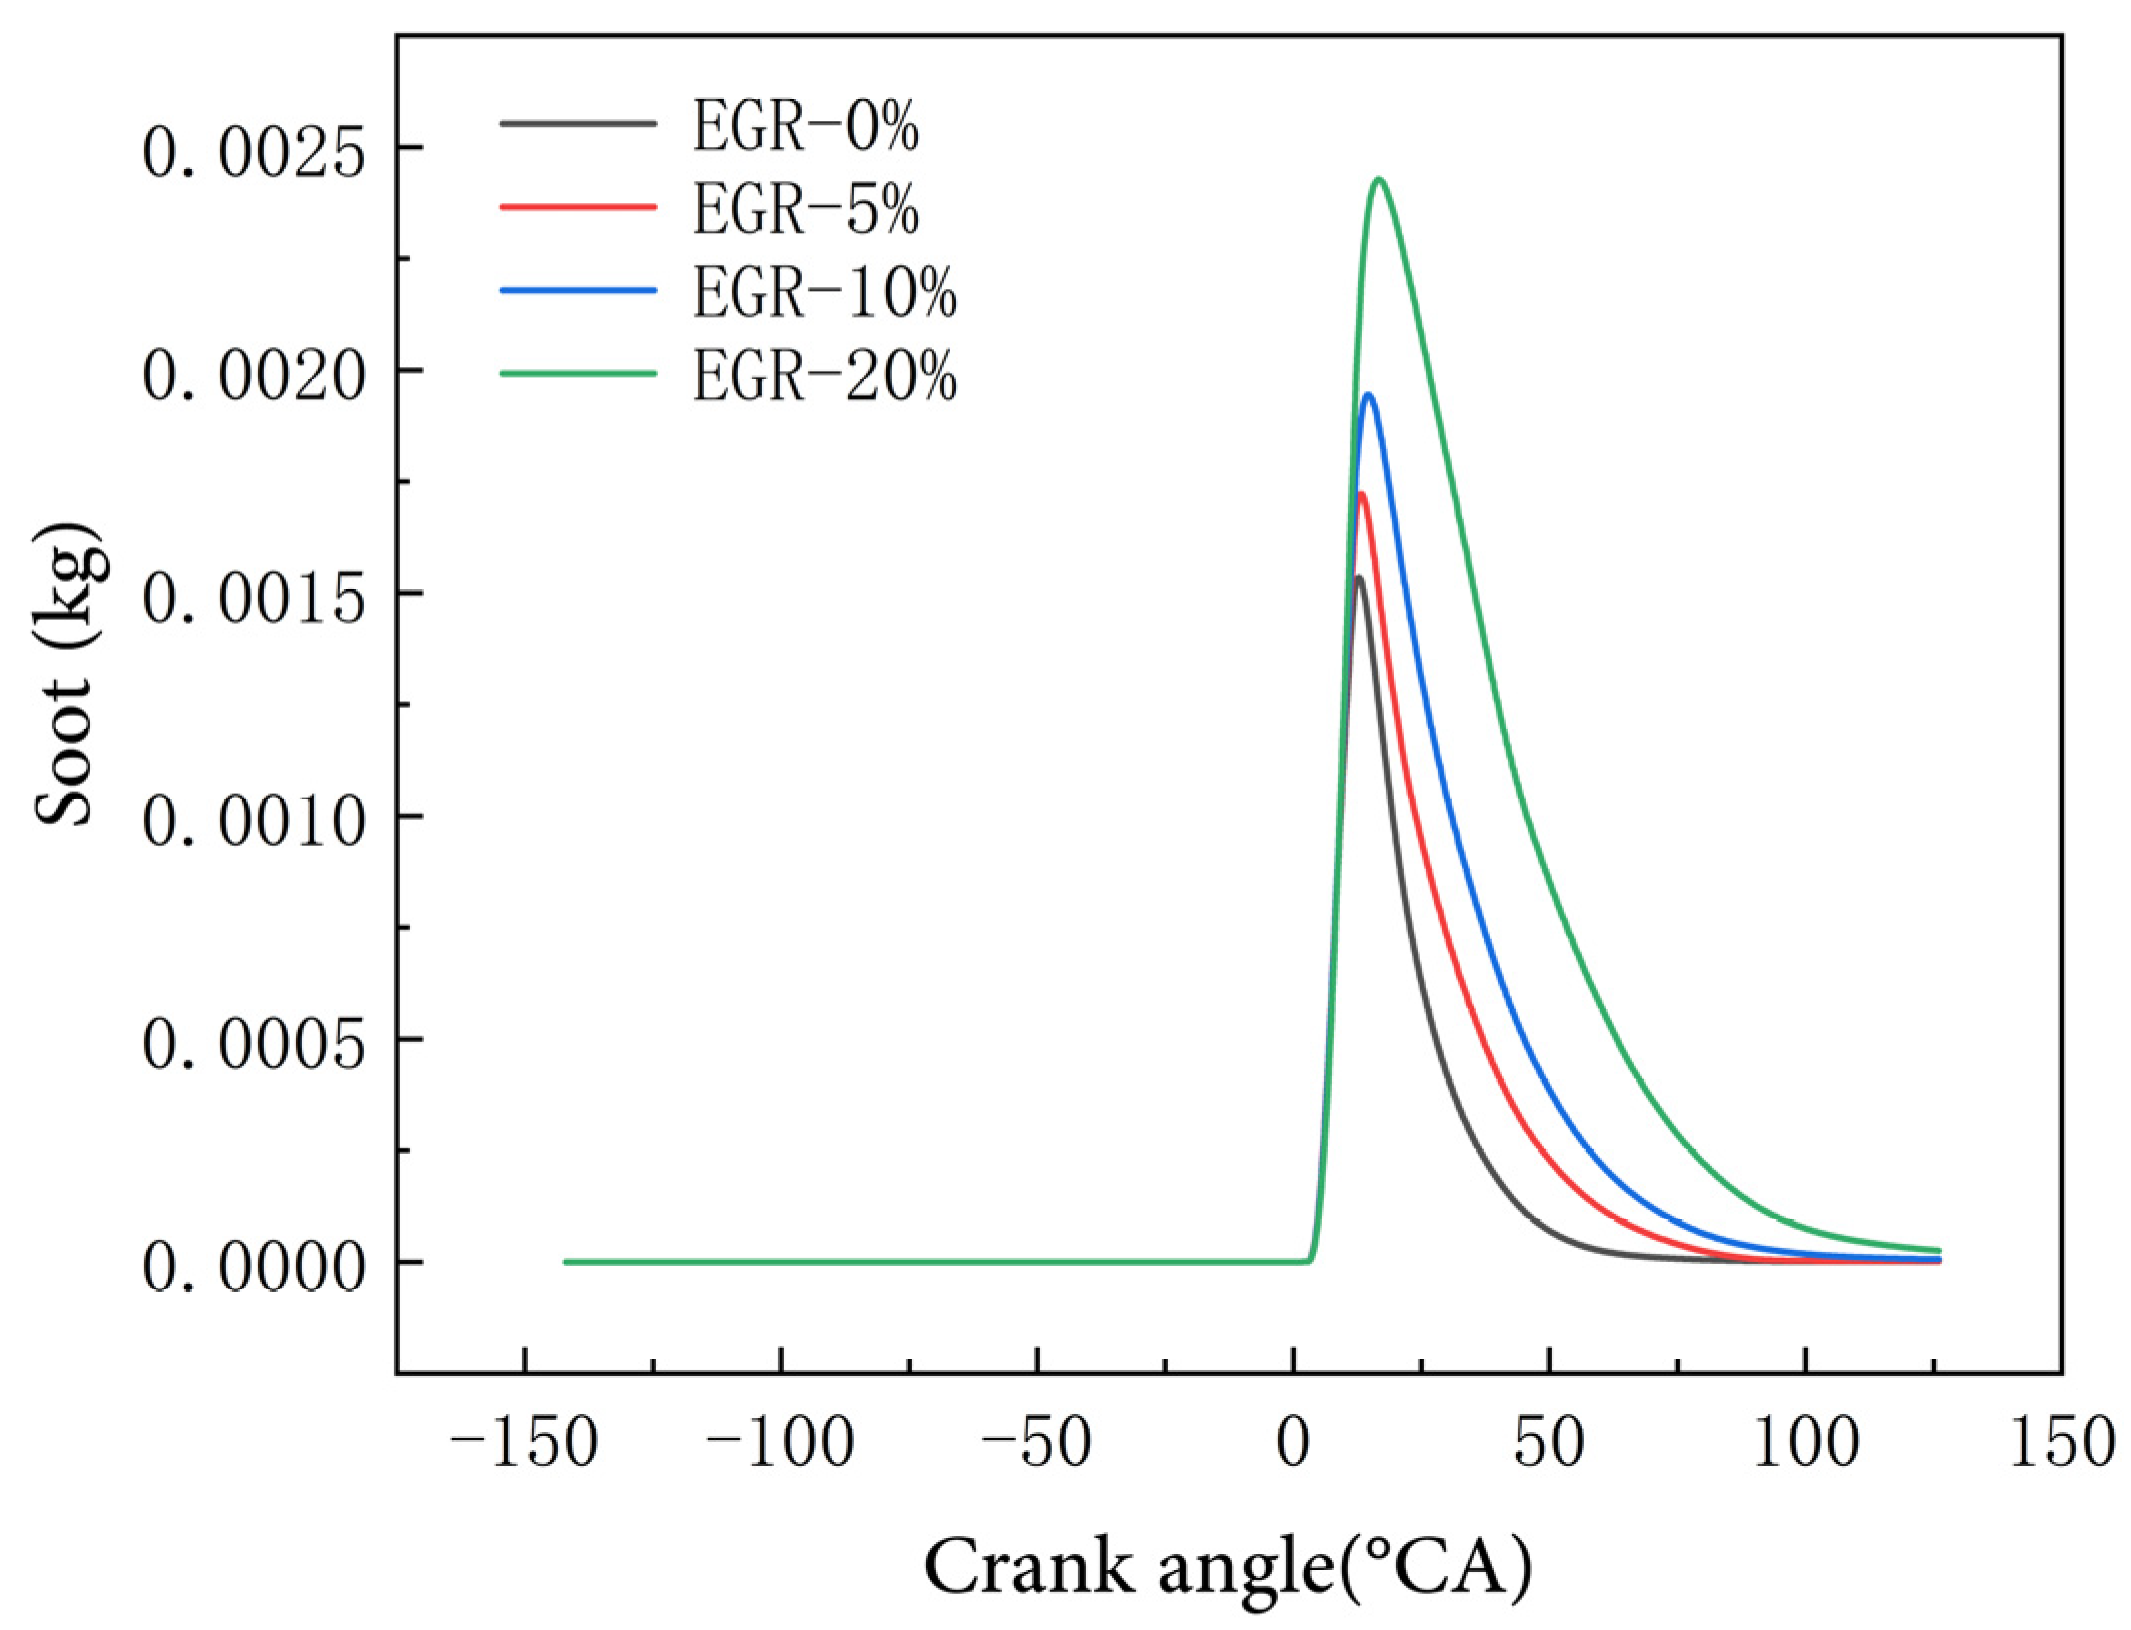
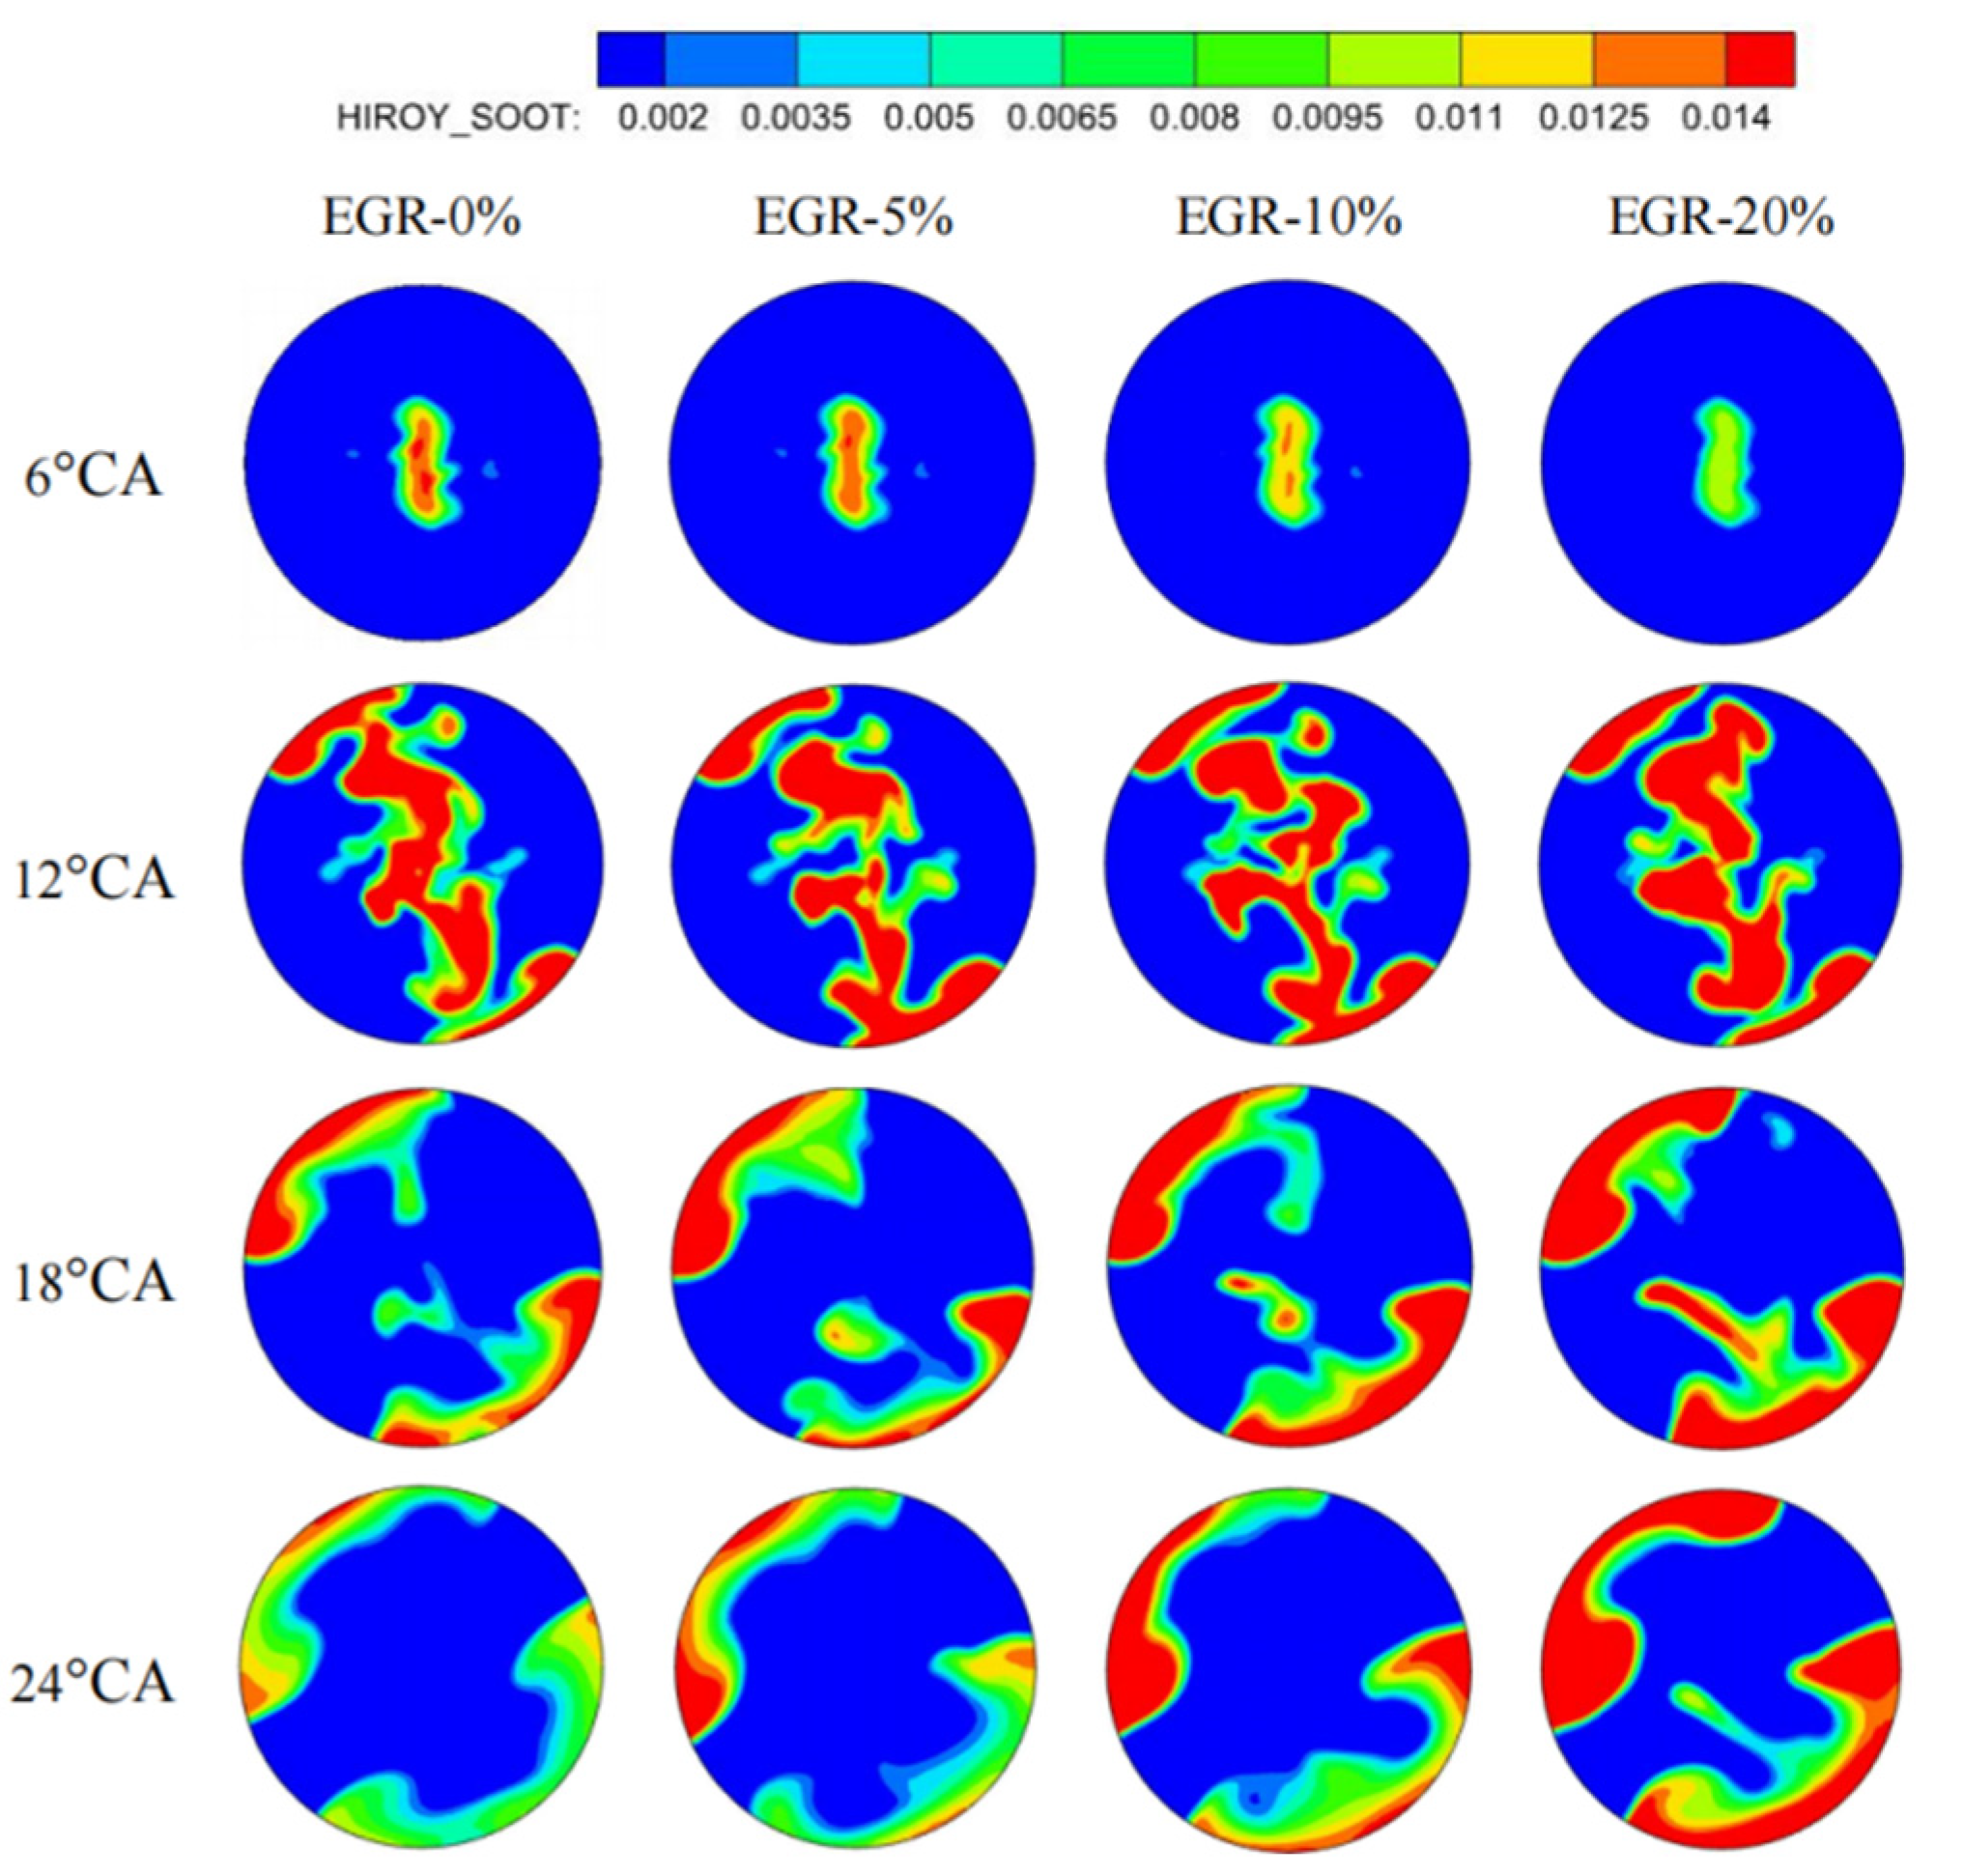
3.2. Effects of Different EGR Rates on Emission Characteristics

Figure 8 presents the effect of varying EGR rates on NOx emissions. Compared to B10 biodiesel without EGR, NOx emissions drop significantly as the EGR rate rises. NOx emissions are mainly influenced by cylinder temperature, oxygen content, and reaction time. An increased EGR rate lowers the oxygen concentration in the intake air and the cylinder temperature, jointly suppressing NOx formation and reducing its emissions.
Figure 9 visually presents NOx formation under different EGR rates. As the EGR rate increases, the areas of NOx formation shrink, especially at 20%. When the combustion temperature exceeds 2000 K, NOx formation rate escalates, doubling for every 100 K rise [25]. Given the significant impact of cylinder temperature distribution on NOx distribution, higher temperatures lead to more pronounced NOx formation. An increased EGR rate reduces in-cylinder high-temperature zones. Notably, at a 20% EGR rate, cylinder temperatures generally stay below 2000 K, effectively curbing NOx formation and emissions. EGR inhibits NOx production by reducing the oxygen concentration and combustion temperature, and although the high oxygen content of biodiesel may slightly increase the local temperature, its effect of promoting complete combustion reduces the high-temperature duration [18].
Figure 10 contrasts the impact of different EGR rates on soot emissions. As the EGR rate rises, soot formation progressively increases. A higher EGR rate reduces the oxygen concentration and temperature in the combustion chamber, leading to incomplete combustion and more soot generation.
Figure 11 presents the soot emission formation under different EGR rates via a cloud map. At 6 °CA crank angle, EGR does not significantly reduce soot. The soot emission curve shows that at this crank angle, soot emissions rise across all EGR rates, with no significant difference in formation. However, at 12 °CA, 18 °CA, and 24 °CA, the cloud map indicates enlarged soot formation areas, signaling increased soot emissions.

3.3. Effects of Different Injection Timings on Combustion Characteristics

Injection timing critically controls the phase and process of fuel combustion in the cylinder, directly impacting the firing pressure and temperature, and, thus, the engine’s performance. Proper ignition timing enhances both combustion efficiency and engine power [26]. Figure 12 shows that delaying injection timing from 0 °CA to 6 °CA reduces the peak cylinder pressure and delays its occurrence. This delay shortens the ignition delay period, reduces fuel–air mixing time, lowers combustion efficiency, and decreases cylinder pressure.
Figure 13 shows the effect of injection timing on the maximum and average cylinder temperatures. Delaying injection timing from 0 °CA to 6 °CA shifts the peak temperatures backward and lowers their values. This delay shortens the ignition delay period, reduces premixed mixture quantity, slows the heat release rate, and, thus, lowers the temperature. However, further delaying the timing increases diffusion combustion proportion, improves efficiency, and raises heat output, slightly increasing the cylinder temperature. Figure 14 indicates that delayed injection timing reduces the high-temperature areas in the cylinder, showing a significant impact of injection timing adjustment on the cylinder’s temperature distribution.
Figure 15 presents the in-cylinder equivalence ratio distribution under different injection timings. At 6 °CA and 12 °CA crank angles, the equivalence ratio decreases with injection timing delay; at 18 °CA and 24 °CA, it increases. This is because delayed injection shortens the ignition delay period, reducing the proportion of premixed-phase fuel in the total injected fuel.

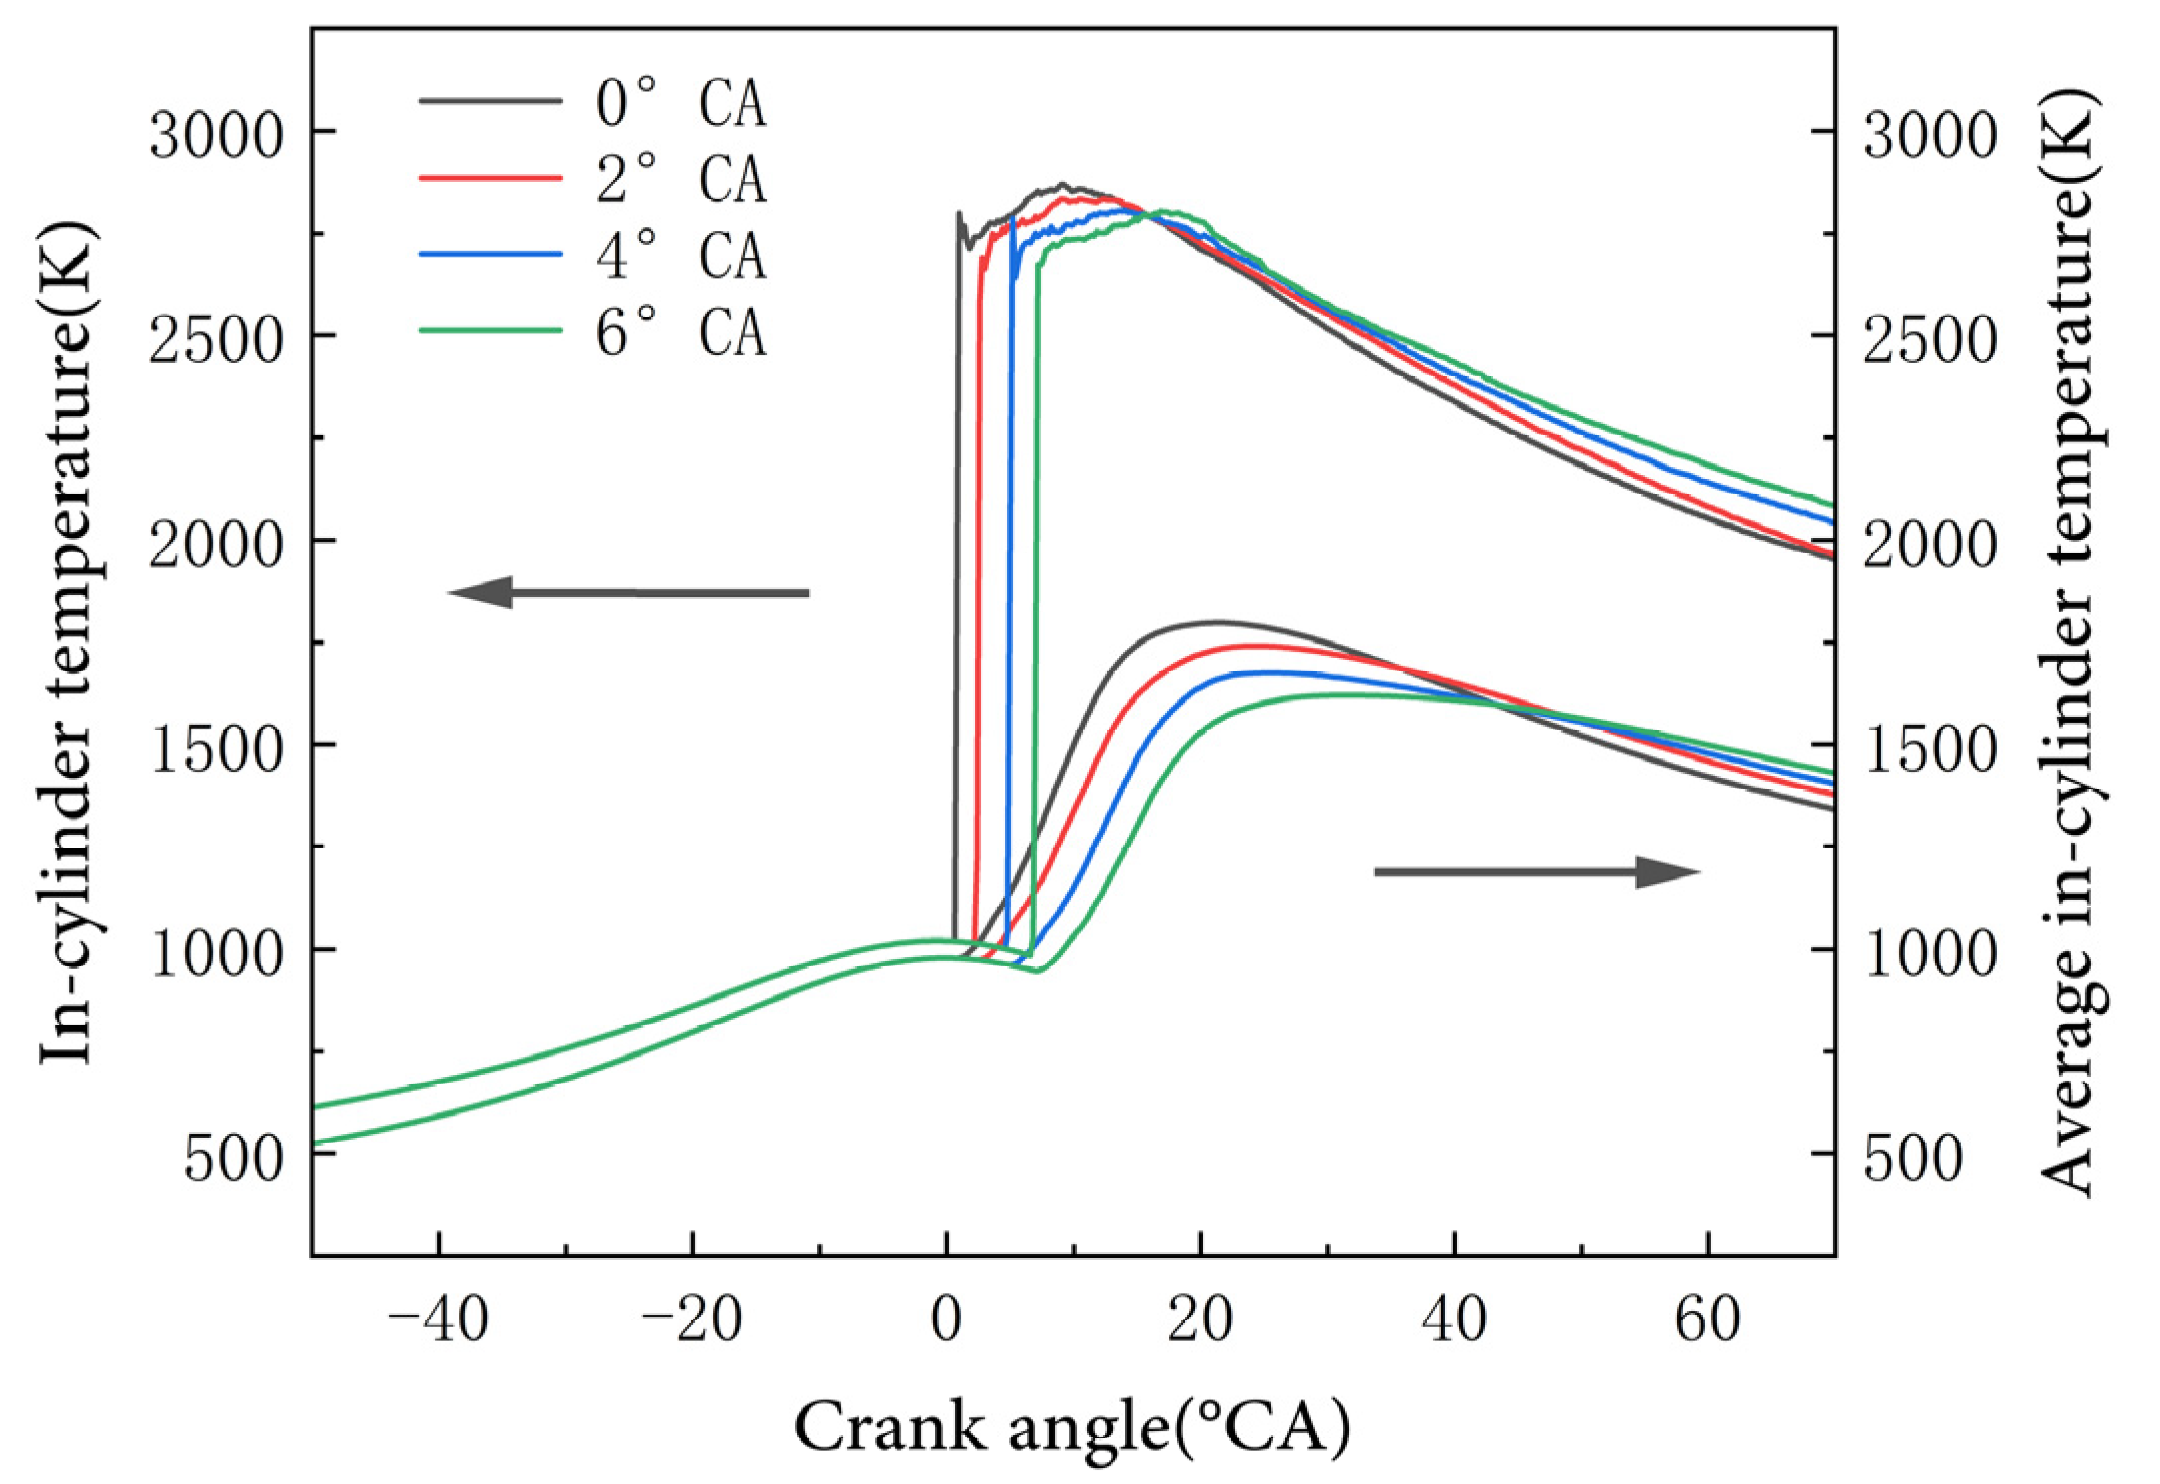
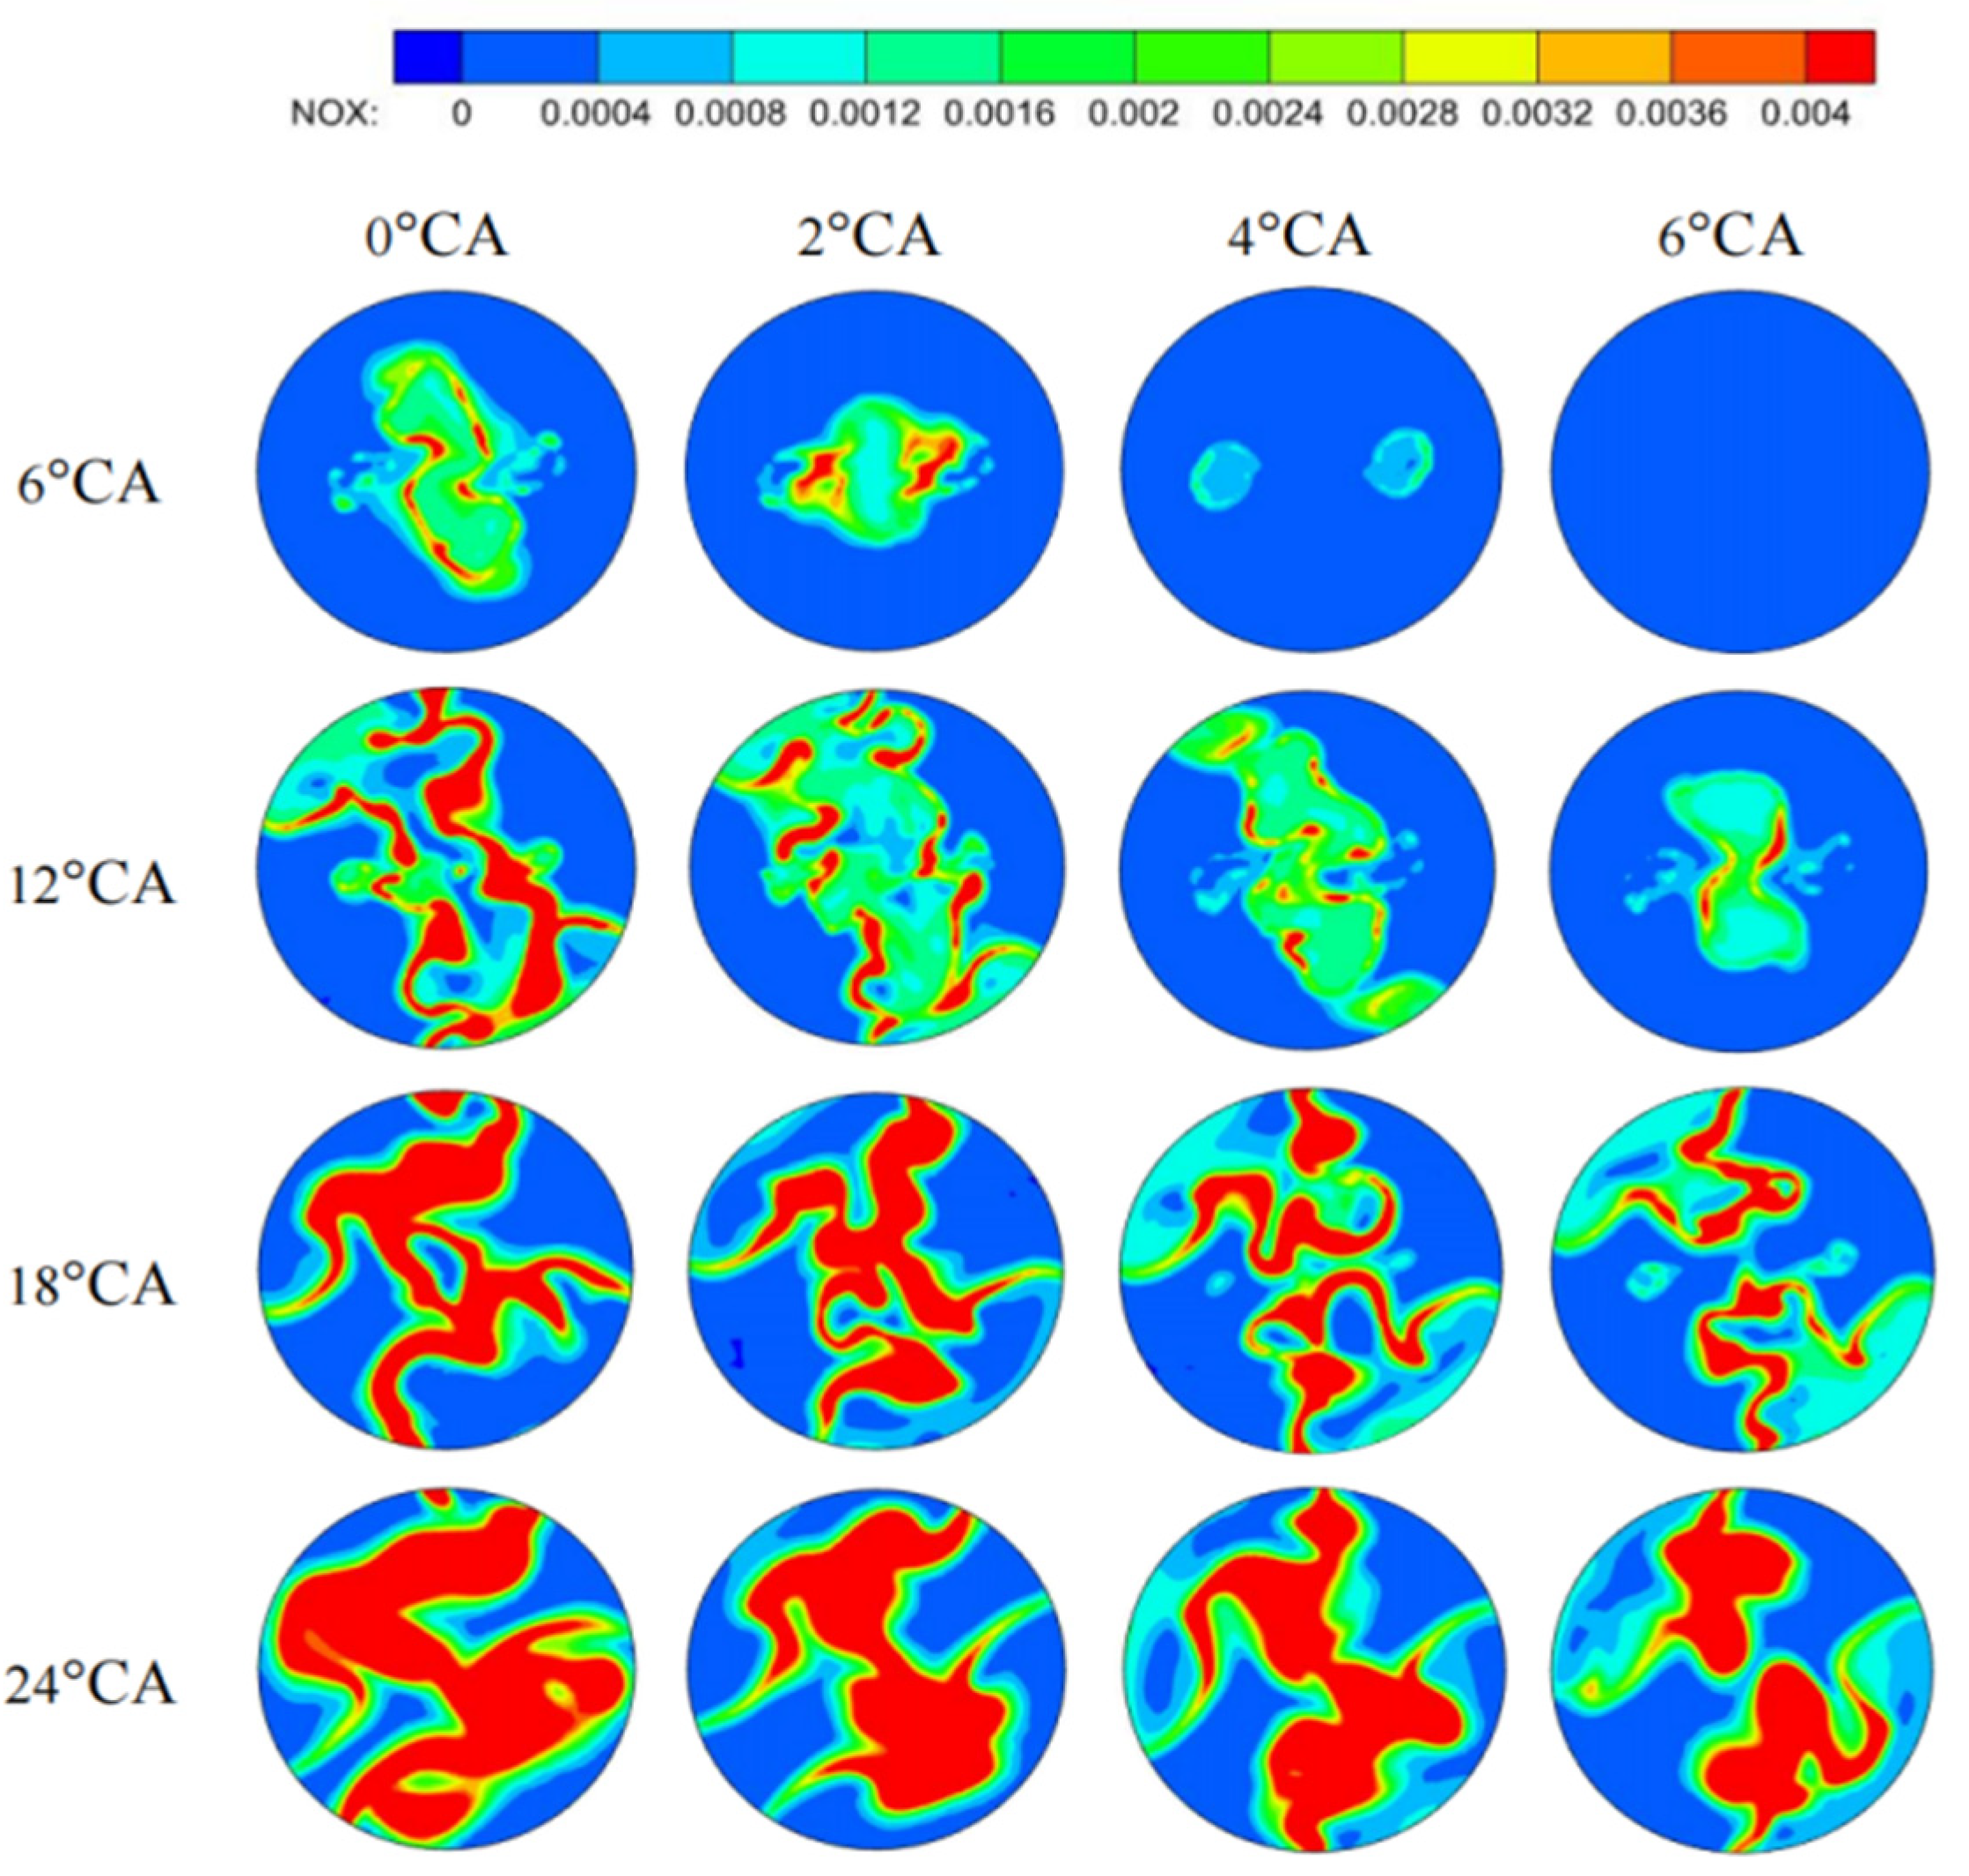
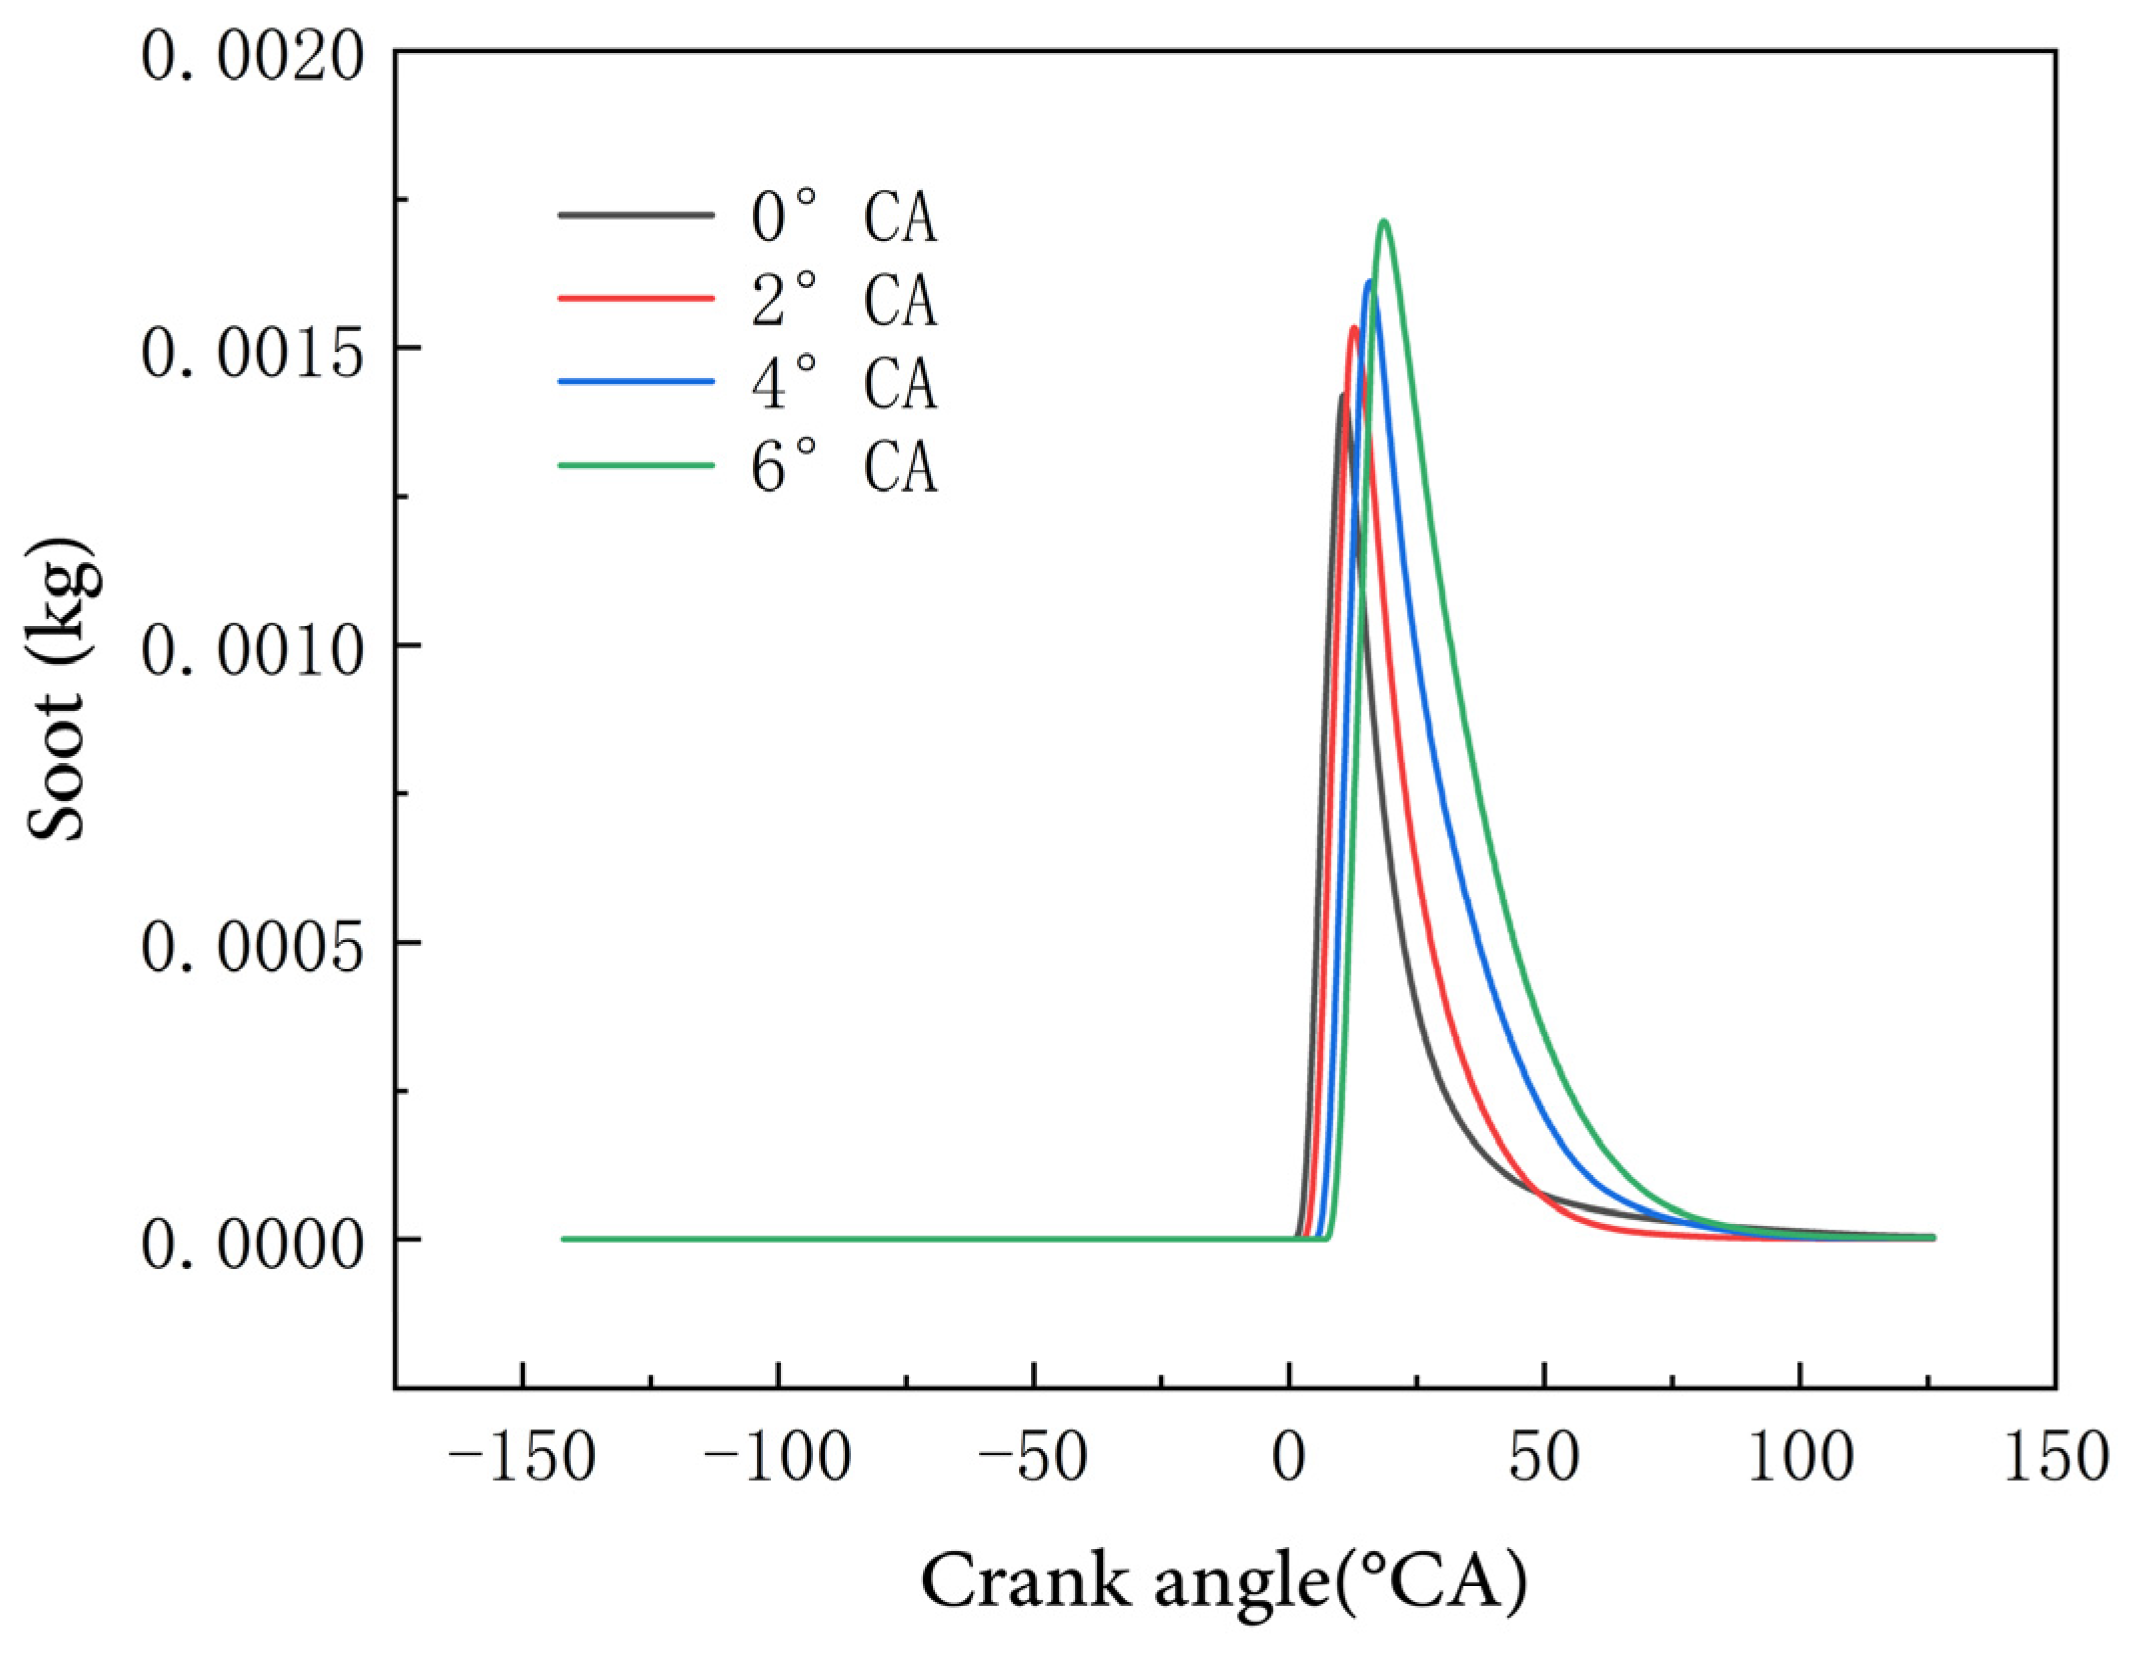
3.4. Effects of Different Injection Timings on Emission Characteristics

Figure 16 shows a comparative curve of NOx emissions under different injection timings. NOx emissions decrease as injection timing is delayed. Compared to 2 °CA, NOx emissions increase by 23.04% at 0 °CA, but decrease by 16.01% and 25.44% at 4 °CA and 6 °CA, respectively. Delayed injection timing shortens the ignition delay period, increases the diffusion-phase fuel proportion, raises the equivalence ratio, and lowers the in-cylinder combustion temperature, making it less conducive for NOx formation and, thus, reducing NOx emissions.
Figure 17 offers a visual comparison of NOx emission formation under different injection timings. Delaying the injection timing reduces NOx emissions. Compared to 2 °CA, NOx emissions rise by 23.04% at 0 °CA but drop by 16.01% and 25.44% at 4 °CA and 6 °CA, respectively. This is because delayed injection shortens the ignition delay, increases the fuel proportion in the diffusion combustion phase, raises the equivalence ratio, and lowers the in-cylinder combustion temperature, making NOx formation less favorable and, thus, decreasing NOx emissions.
Figure 18 shows the effect of injection timing on soot emissions. As injection timing is delayed from 0 °CA to 6 °CA, soot formation timing and peak crank angle shift, with overall soot emissions increasing. Compared to 2 °CA, soot emissions decrease by 7.42% at 0 °CA but rise by 4.98% and 11.64% at 4 °CA and 6 °CA. At 0 °CA injection timing, the longer ignition delay increases premixed combustion and reduces diffusion combustion, suppressing soot formation. However, as injection timing is delayed, the shorter ignition delay and increased diffusion combustion lead to more rich mixture zones in the cylinder, increasing soot emissions. Figure 19 visually illustrates this phenomenon with soot emission formation cloud maps under different injection timings.

4. Conclusions

This study simulated the effects of EGR rates and injection timing on the combustion and emissions of B10 biodiesel in marine low-speed engines, drawing the following conclusions:
(1)
As the EGR rate climbs, the oxygen level in the intake air drops, slowing the combustion rate. The exhaust components also lower the in-cylinder combustion temperature. Specifically, at EGR rates of 5%, 10%, and 15%, the cylinder pressure decreases by 2.17%, 4.61%, and 9.03%, respectively; the peak average in-cylinder temperature reduces by 3.27%, 6.15%, and 10.9%, respectively; NOx emissions drop by 35.13%, 59.95%, and 85.21%, respectively; while soot emissions increase by 12.25%, 26.75%, and 58.18%, respectively.
(2)
Delaying the injection timing shortens the ignition delay period, increases the proportion of diffusion combustion, and causes uneven fuel–air distribution. When the injection timing is advanced to 0 °CA, the peak cylinder pressure rises by 10.27%, the peak average temperature increases by 3.23%, NOx emissions go up by 23.04%, and soot emissions drop by 7.42%. When it is delayed to 4 °CA and 6 °CA, the peak cylinder pressure falls by 12.17% and 20.90%, respectively; the peak average temperature decreases by 3.77% and 6.93%, respectively; NOx emissions are cut by 16.01% and 25.44%, respectively; and soot emissions rise by 4.98% and 11.64%, respectively.
These results indicate that both the increase in EGR rate and the delay in injection time are effective in reducing NOx emissions, but may lead to an increase in soot emissions. Compared with previous studies, this study further quantifies the specific effects of EGR rate and injection time on combustion pressure, temperature, and emissions, providing more detailed data to support the optimization of the combustion process in marine low-speed engines.
Despite the remarkable results of this study, there are still some research gaps. This study mainly focuses on the effects of EGR rate and injection time on combustion and emissions, but does not explore the combined effects of other combustion parameters (e.g., injection pressure and injection volume) in depth. Meanwhile, the simulation model of this simulation is simplified, and a more complete and accurate simulation model can be established in the future to carry out a more in-depth study. The experimental and simulation conditions can also be further extended to test the effects of combinations of different biodiesel compositions and injection strategies, as well as to carry out long-term performance evaluations in order to fully optimize the combustion efficiency and emission performance of marine low-speed engines. These research directions will provide more comprehensive technical support for the green development of the shipping industry.

Author Contributions

Conceptualization, G.J. and G.W.; Methodology, Y.Y. and H.G.; Validation, H.G.; Formal analysis, G.W. and J.C.; Investigation, Y.Y.; Resources, G.J.; Data curation, Y.Y. and Y.L.; Writing—original draft, H.G. and Y.L.; Writing—review & editing, G.W.; Visualization, Y.Y.; Supervision, G.J.; Project administration, G.J.; Funding acquisition, J.C. All authors have read and agreed to the published version of the manuscript.

Funding

The authors disclose the receipt of the following financial support for the research, authorship, and/or publication of this article. This work was supported by the Science & Technology Commission of Shanghai Municipality and Shanghai Engineering Research Center of Ship Intelligent Maintenance and Energy Efficiency (grant no. 20DZ2252300), and Shanghai Maritime University.

Data Availability Statement

The original contributions presented in this study are included in the article. Further inquiries can be directed to the corresponding author.

Conflicts of Interest

The authors declare no conflict of interest.

References

  1. Qian, Y.; Liu, B.; Wu, Z. Review of the development of marine low-speed engine technology. J. Propuls. Technol. 2020, 41, 2418–2426. [Google Scholar]
  2. Deng, J.; Wang, X.; Wei, Z.; Wang, L.; Wang, C.; Chen, Z. A review of NOx and SOx emission reduction technologies for marine diesel engines and the potential evaluation of liquefied natural gas fuelled vessels. Sci. Total Environ. 2021, 766, 144319. [Google Scholar] [CrossRef] [PubMed]
  3. Nikolić, D.; Marstijepović, N.; Cvrk, S.; Gagić, R.; Filipović, I. Evaluation of pollutant emissions from two-stroke marine diesel engine fueled with biodiesel produced from various waste oils and diesel blends. Brodogradnja 2017, 67, 81–90. [Google Scholar] [CrossRef]
  4. Gharehghani, A.; Mirsalim, M.; Hosseini, R. Effects of waste fish oil biodiesel on diesel engine combustion characteristics and emission. Renew. Energy 2017, 101, 930–936. [Google Scholar]
  5. Nabi, M.N.; Zare, A.; Hossain, F.M.; Ristovski, Z.D.; Brown, R.J. Reductions in diesel emissions including PM and PN emissions with diesel-biodiesel blends. J. Clean. Prod. 2017, 166, 860–868. [Google Scholar] [CrossRef]
  6. Yusuf, A.A.; Inambao, F.L.; Ampah, J.D. Evaluation of biodiesel on speciated PM2.5, organic compound, ultrafine particle and gaseous emissions from a low-speed EPA Tier II marine diesel engine coupled with DPF, DEP and SCR filter at various loads. Energy 2022, 239 Pt A, 121837. [Google Scholar] [CrossRef]
  7. Nghia, N.T.; Khoa, N.X.; Cho, W.; Lim, O. A Study the Effect of Biodiesel Blends and the Injection Timing on Performance and Emissions of Common Rail Diesel Engines. Energies 2021, 15, 242. [Google Scholar] [CrossRef]
  8. Visan, N.A.; Carlanescu, R.; Niculescu, D.C.; Chiriac, R. Study on the Cumulative Effects of Using a High-Efficiency Turbocharger and Biodiesel B20 Fuelling on Performance and Emissions of a Large Marine Diesel Engine. J. Mar. Sci. Eng. 2022, 10, 1403. [Google Scholar] [CrossRef]
  9. Zhang, D.; Qi, D.H.; Liu, Z.C.; Liu, G.; Shen, Y.J. Experimental study on diesel engine fueled with rapeseed oil-diesel blended fuel. Renew. Energy Resour. 2023, 41, 725–730. [Google Scholar] [CrossRef]
  10. Zhao, X.; Jiaqiang, E.; Liao, G.; Zhang, F.; Chen, J.; Deng, Y. Numerical simulation study on soot continuous regeneration combustion model of diesel particulate filter under exhaust gas heavy load. Fuel 2021, 290, 119795. [Google Scholar] [CrossRef]
  11. Jensen, M.V.; Cordtz, R.F.; Schramm, J. Numerical analysis of methane slip source distribution in a four-stroke dual-fuel marine engine. J. Mar. Sci. Technol. 2020, 26, 606–617. [Google Scholar] [CrossRef]
  12. Namitha, B.; Sathish, A.; Kumar, P.S.; Nithya, K.; Sundar, S. Micro algal biodiesel synthesized from Monoraphidium sp., and Chlorella sorokiniana: Feasibility and emission parameter studies. Fuel 2021, 301, 121063. [Google Scholar] [CrossRef]
  13. Mourad, M.; Mahmoud, K.R.M.; NourEldeen, E.-S.H. Improving diesel engine performance and emissions characteristics fuelled with biodiesel. Fuel 2021, 302, 121097. [Google Scholar] [CrossRef]
  14. Alosius, M.A.; Thomai, P.; Thomas, J.J.; Sharma, V. Impact of Combined Effects of Injection Pressure and EGR on Modified Stationary Engine Fuelled with Biodiesel Blend Made of Waste Feedstock Oils. Arab. J. Sci. Eng. 2023, 48, 12389–12405. [Google Scholar] [CrossRef]
  15. Gu, Y.L.; Zheng, P.; Wu, X.X. Effect of EGR rate on combustion performance and emission characteristics of biodiesel. Small Int. Combust. Engine Motorcycle 2019, 6, 59–64. [Google Scholar] [CrossRef]
  16. Yu, J.S.; Li, W.H.; Yan, F.W. Effect of EGR on combustion and emission performance of n-pentanol-biodiesel blended fuel. Combust. Sci. Technol. 2021, 27, 279–288. [Google Scholar]
  17. Ji, W.X.; Zhu, L.; Lv, X.C.; Huang, Z. Effect of EGR rate on combustion and emission characteristics of low-speed two-stroke marine diesel engine. Ship Eng. 2019, S1, 4. [Google Scholar]
  18. Jiang, X.X.; Wei, H.Q.; Zhou, L. Numerical Study on the Effects of Multiple-Injection Coupled with EGR on Combustion and NOx Emissions in a Marine Diesel Engine. Energy Procedia 2019, 158, 4429–4434. [Google Scholar] [CrossRef]
  19. Sun, X.X.; Liang, X.Y.; Shu, G.Q.; Lin, J.; Wang, Y.; Wang, Y. Numerical investigation of two-stroke marine diesel engine emissions using exhaust gas recirculation at different injection time. Ocean Eng. 2017, 144, 90–97. [Google Scholar] [CrossRef]
  20. Ji, W.X.; Li, A.; Lu, X.C.; Huang, Z.; Zhu, L. Numerical study on NOx and ISFC co-optimization for a low-speed two-stroke engine via Miller cycle, EGR, intake air humidification, and injection strategy implementation. Appl. Therm. Eng. 2019, 153, 398–408. [Google Scholar] [CrossRef]
  21. Yang, J.B.; Wang, B.B.; Gao, Z.B.; Mao, J.; Tang, M.Y.; Wo, X.Z. Optimization of the Effect of Blending Biodiesel Coupled with EGR on Diesel Engine Performance. Ship Eng. 2022, 44, 9. [Google Scholar]
  22. Sun, Y.; Lv, L.; Wen, M. Experimental study on reducing BC emissions from a low-speed marine engine by using blended biodiesel and a nitro additive. Process Saf. Environ. Prot. 2024, 185, 1232–1249. [Google Scholar] [CrossRef]
  23. Chang, Y.C.; Jia, M.; Li, Y.P.; Zhang, Y.; Xie, M.; Wang, H.; Reitz, R.D. Development of a skeletal oxidation mechanism for biodiesel surrogate. Proc. Combust. Inst. 2015, 35, 3037–3044. [Google Scholar] [CrossRef]
  24. Lu, Z.; Liu, M.Y.; Shi, L.; Wang, T.; Lu, T.; Wang, H. Numerical research of the injected exhaust gas recirculation strategy on a two-stroke low-speed marine diesel engine. Energy 2022, 244, 122731. [Google Scholar] [CrossRef]
  25. Yang, K. Numerical Study on Combustion Process of Large Bore Low Speed Two Stroke Marine Diesel Engine. Master’s Thesis, Tianjin University, Tianjin, China, 2019. [Google Scholar] [CrossRef]
  26. Jin, W. Numerical Simulation of Knocking in Two-Stroke Marine Dual-Fuel Engine. Master’s Thesis, Dalian Maritime University, Dalian, China, 2023. [Google Scholar] [CrossRef]
Figure 1. Schematic diagram of the marine low-speed engine 6S35 test bench system and testing equipment.
Jmse 13 00824 g001
Figure 2. Comparison of experimental and simulated in-cylinder pressure.
Jmse 13 00824 g002
Figure 3. Comparison of in-cylinder pressure between test and simulated values.
Jmse 13 00824 g003
Figure 4. Comparison of in-cylinder pressure at different EGR rates.
Jmse 13 00824 g004
Figure 5. Curves of maximum and average in-cylinder temperatures at different EGR rates.
Jmse 13 00824 g005
Figure 6. Comparison of in-cylinder temperature distribution at different EGR rates.
Jmse 13 00824 g006
Figure 7. Comparison of in-cylinder equivalence ratio distribution at different EGR rates.
Jmse 13 00824 g007
Figure 8. Comparison of NOx emissions at different EGR rates.
Jmse 13 00824 g008
Figure 9. NOx emission formation cloud map at different EGR rates.
Jmse 13 00824 g009
Figure 10. Comparison of soot emissions at different EGR rates.
Jmse 13 00824 g010
Figure 11. Soot emission formation cloud map at different EGR rates.
Jmse 13 00824 g011
Figure 12. Comparison of in-cylinder pressure at different injection timings.
Jmse 13 00824 g012
Figure 13. Curves of maximum and average in-cylinder temperatures at different injection timings.
Jmse 13 00824 g013
Figure 14. Comparison of in-cylinder temperature distribution at different injection timings.
Jmse 13 00824 g014
Figure 15. Comparison of in-cylinder equivalence ratio distribution at different injection timings.
Jmse 13 00824 g015
Figure 16. Comparison of NOx emissions at different injection timings.
Jmse 13 00824 g016
Figure 17. NOx emission formation cloud map at different injection timings.
Jmse 13 00824 g017
Figure 18. Comparison of soot emissions at different injection timings.
Jmse 13 00824 g018
Figure 19. Soot emission formation cloud map at different injection timings.
Jmse 13 00824 g019
Table 1. Performance parameters of two-stroke low-speed diesel engine.
ItemParameter
TypeIn-line 6-cylinder
Number of strokes2
Firing order (from free end)1-5-3-4-2-6
Rated power/kW3570
Continuous power/kW3250
Rated speed/(r/min)142
Connecting rod ratio0.5
Compression ratio17
Piston/L894
stroke/mm1550
Cylinder bore/mm350
Maximum firing pressure/bar180
Table 2. Technical parameters of CAI gas analyzer.
Item Parameter
DetectorChemiluminescence (CLD) photodiode
NO/NOx measurement range0–3000 ppm
Repeatability error<0.5% range
Linearity error<0.5% range
Noise effect<1% range
Ambient temperature5~40 °C
Preheating duration1 h
Table 3. Parameters of Kistler pressure and vibration sensor.
ItemParameter
Model6613CG2
Sensitivity0.05 mA/bar
Measurement range0~250 bar
Mass165 g
Temperature−20~350 °C
Table 4. Fuel composition analysis.
TypeD100B10
Density (20 °C) kg/m3837.3842.8
Viscosity (40 °C) mm2/s3.2873.267
cetane index49.553.0
Low heat value MJ/kg42.65241.697
Flash point °C70.077.0
Table 5. Model initial conditions.
ItemParameter
In-cylinder pressure/MPa0.976
In-cylinder temperature/K962
Exhaust valve opening/°CA117.3
Exhaust valve closing/°CA275.9
Scavenging port opening/°CA140
Scavenging port closing/°CA220
Table 6. Submodels in simulation calculation.
ItemParameter
Turbulence modelRNG k-ε model
Combustion modelSAGE model
Spray evaporation modelFrossling model
Droplet collision modelNTC collision model
Droplet wall impingement modelWall film model
Droplet breakage modelKH-RT model
NOx emission modelExtended Zeldovich model
Soot emission modelHiroyasu-NSC model
Table 7. Comparison of key parameters between experimental and simulated values.
ParameterExperimental ValueSimulated ValueError
Compression pressure
peak (MPa)
10.6210.912.73%
Firing pressure peak (MPa)14.4014.03−2.57%
NOx emission (g/KW·h)14.5415.204.54%
Disclaimer/Publisher’s Note: The statements, opinions and data contained in all publications are solely those of the individual author(s) and contributor(s) and not of MDPI and/or the editor(s). MDPI and/or the editor(s) disclaim responsibility for any injury to people or property resulting from any ideas, methods, instructions or products referred to in the content.

