
Formal Safety Assessment for Ammonia Fuel Storage Onboard Ships Using Bayesian Network

 , ,
, ,  ,
,  and
and 
Abstract
1. Introduction
2. Literature Review
2.1. Ammonia as a Marine Fuel
2.2. Formal Safety Assessment Methodology
2.3. Gap Analysis
- A formal safety assessment framework integrating an HAZOP and BN was proposed to identify and assess the hazards associated with ammonia storage and utilization in ship operations.
- A list of hazards that may result in ammonia fuel leakage was identified and the level of risk was accurately modeled, reflecting the criticality of various risks.
- The methodological framework of this study provides a new perspective for the risk assessment of ammonia storage, enabling decision-makers to make wiser decisions in complex navigational environments, thereby ensuring the safety and reliability of ammonia storage and utilization onboard ships.
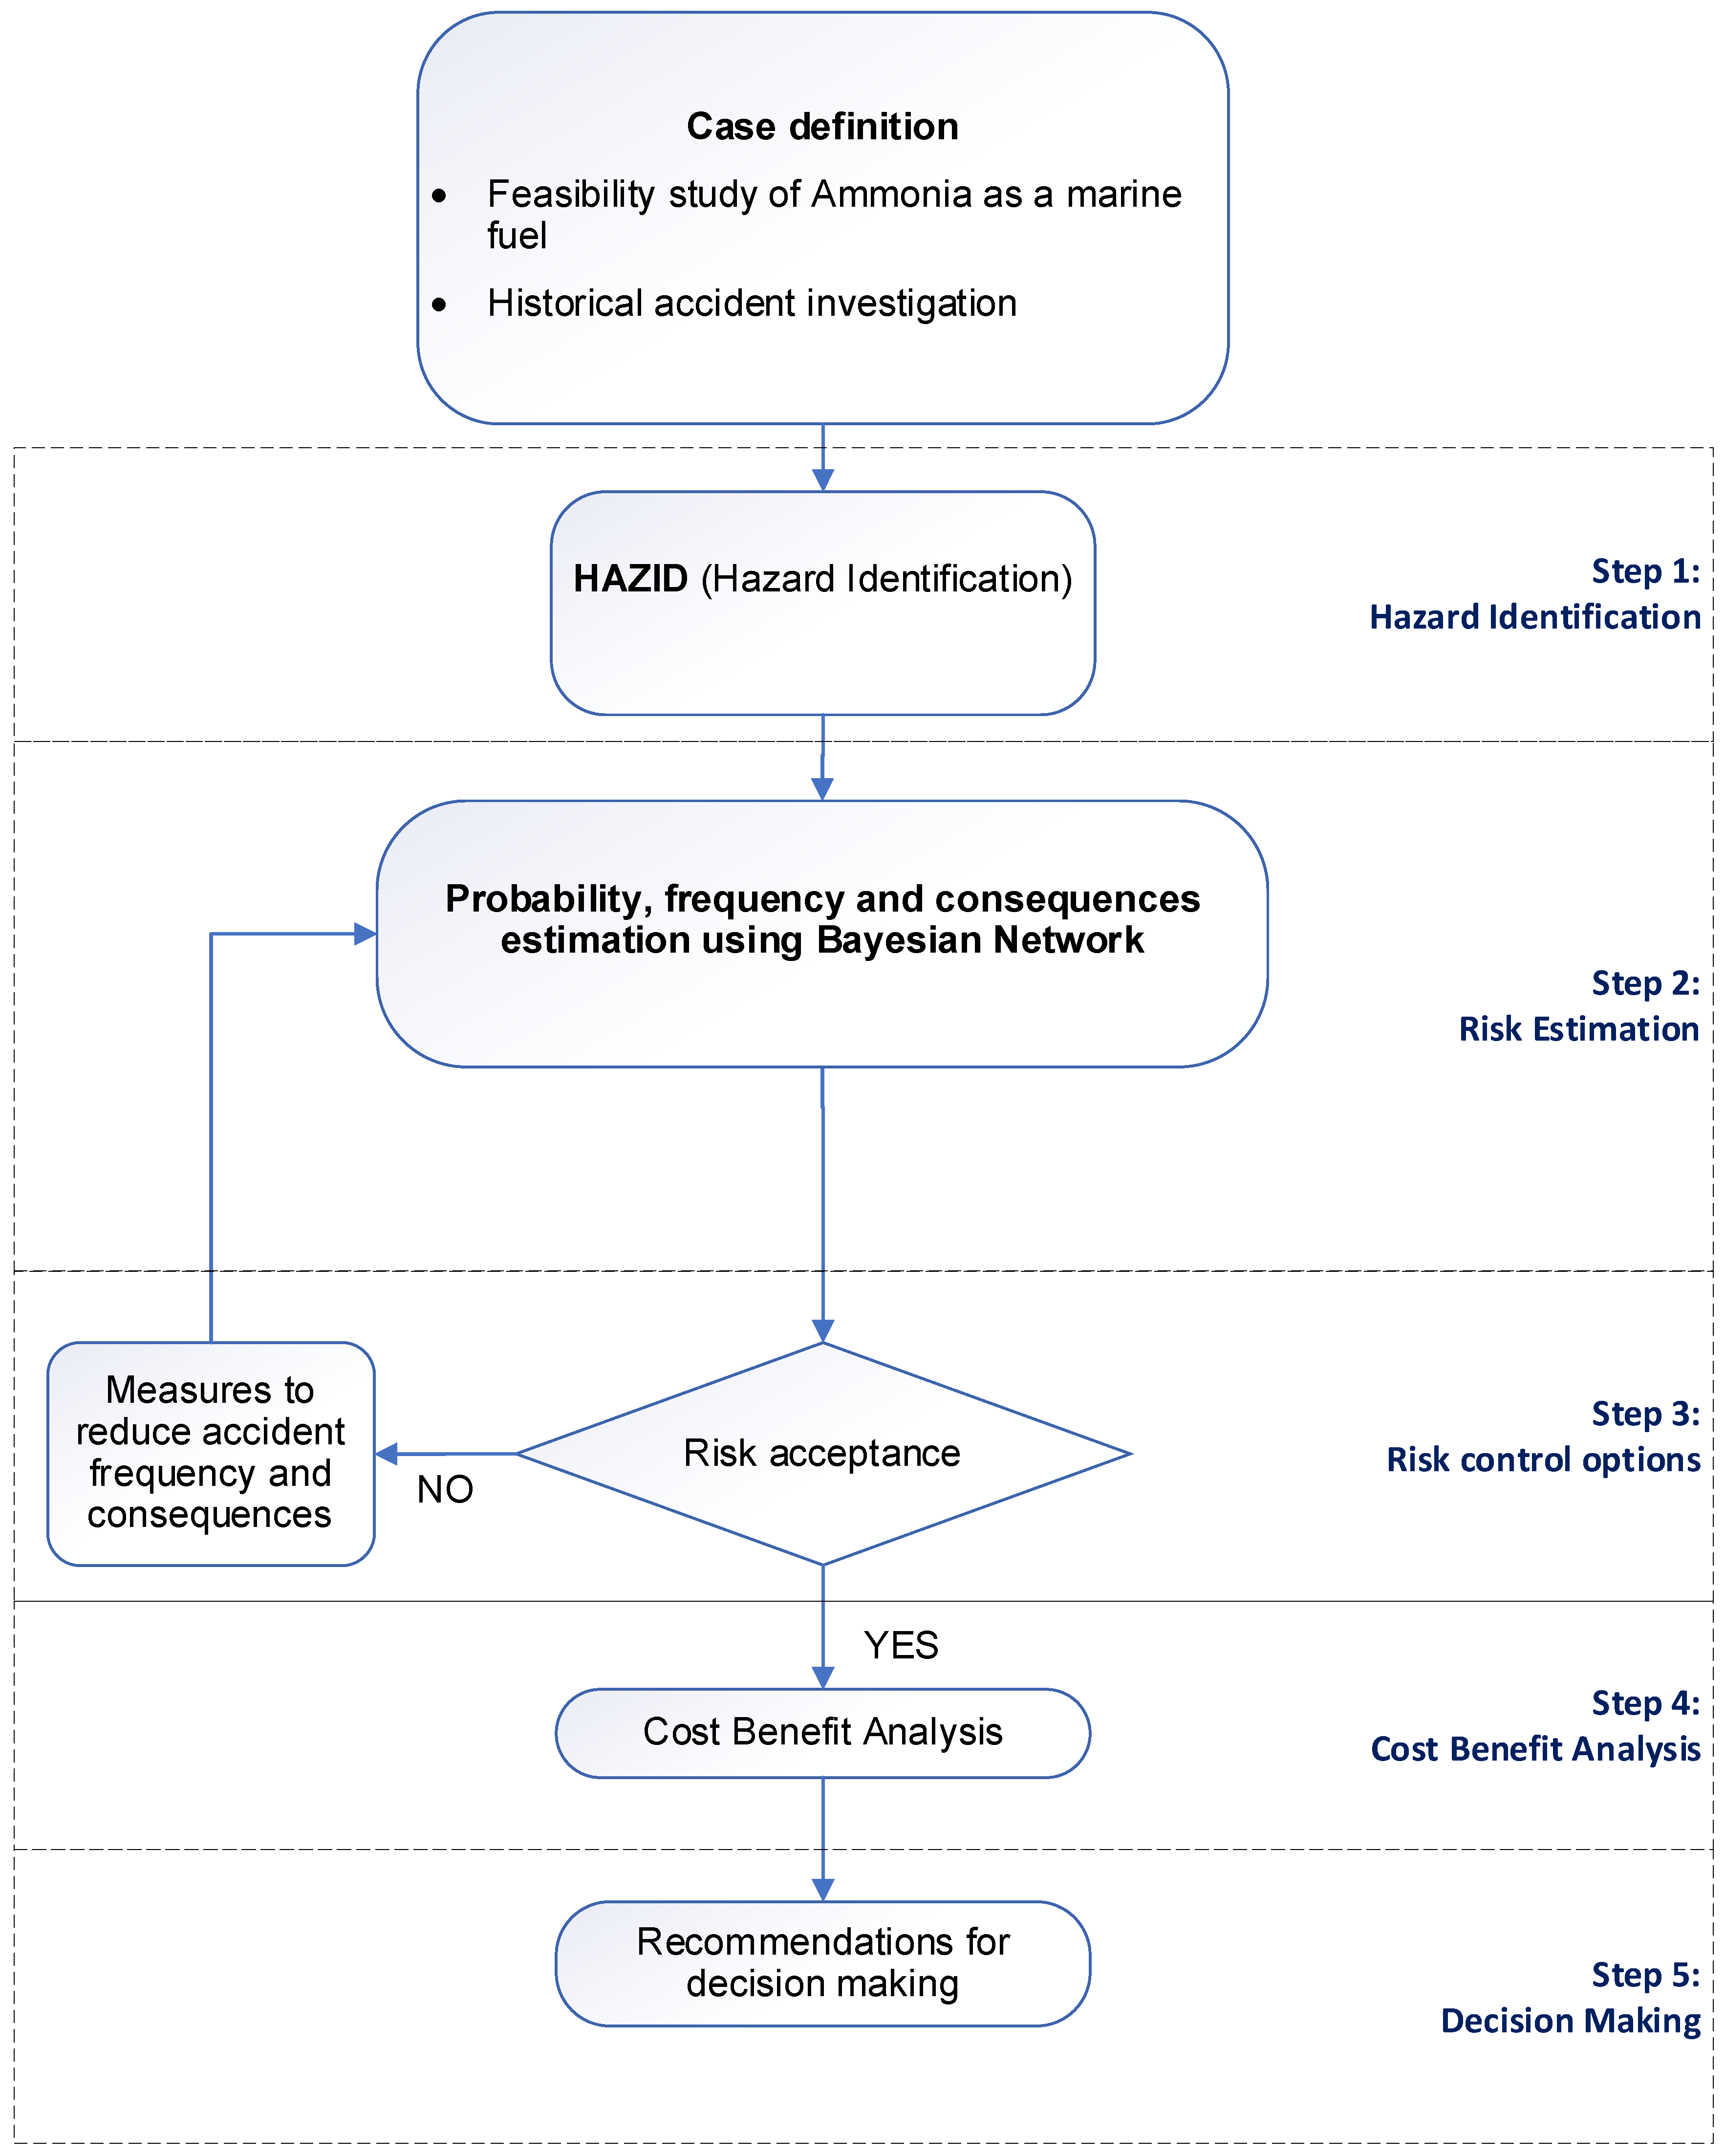
3. Research Methodology
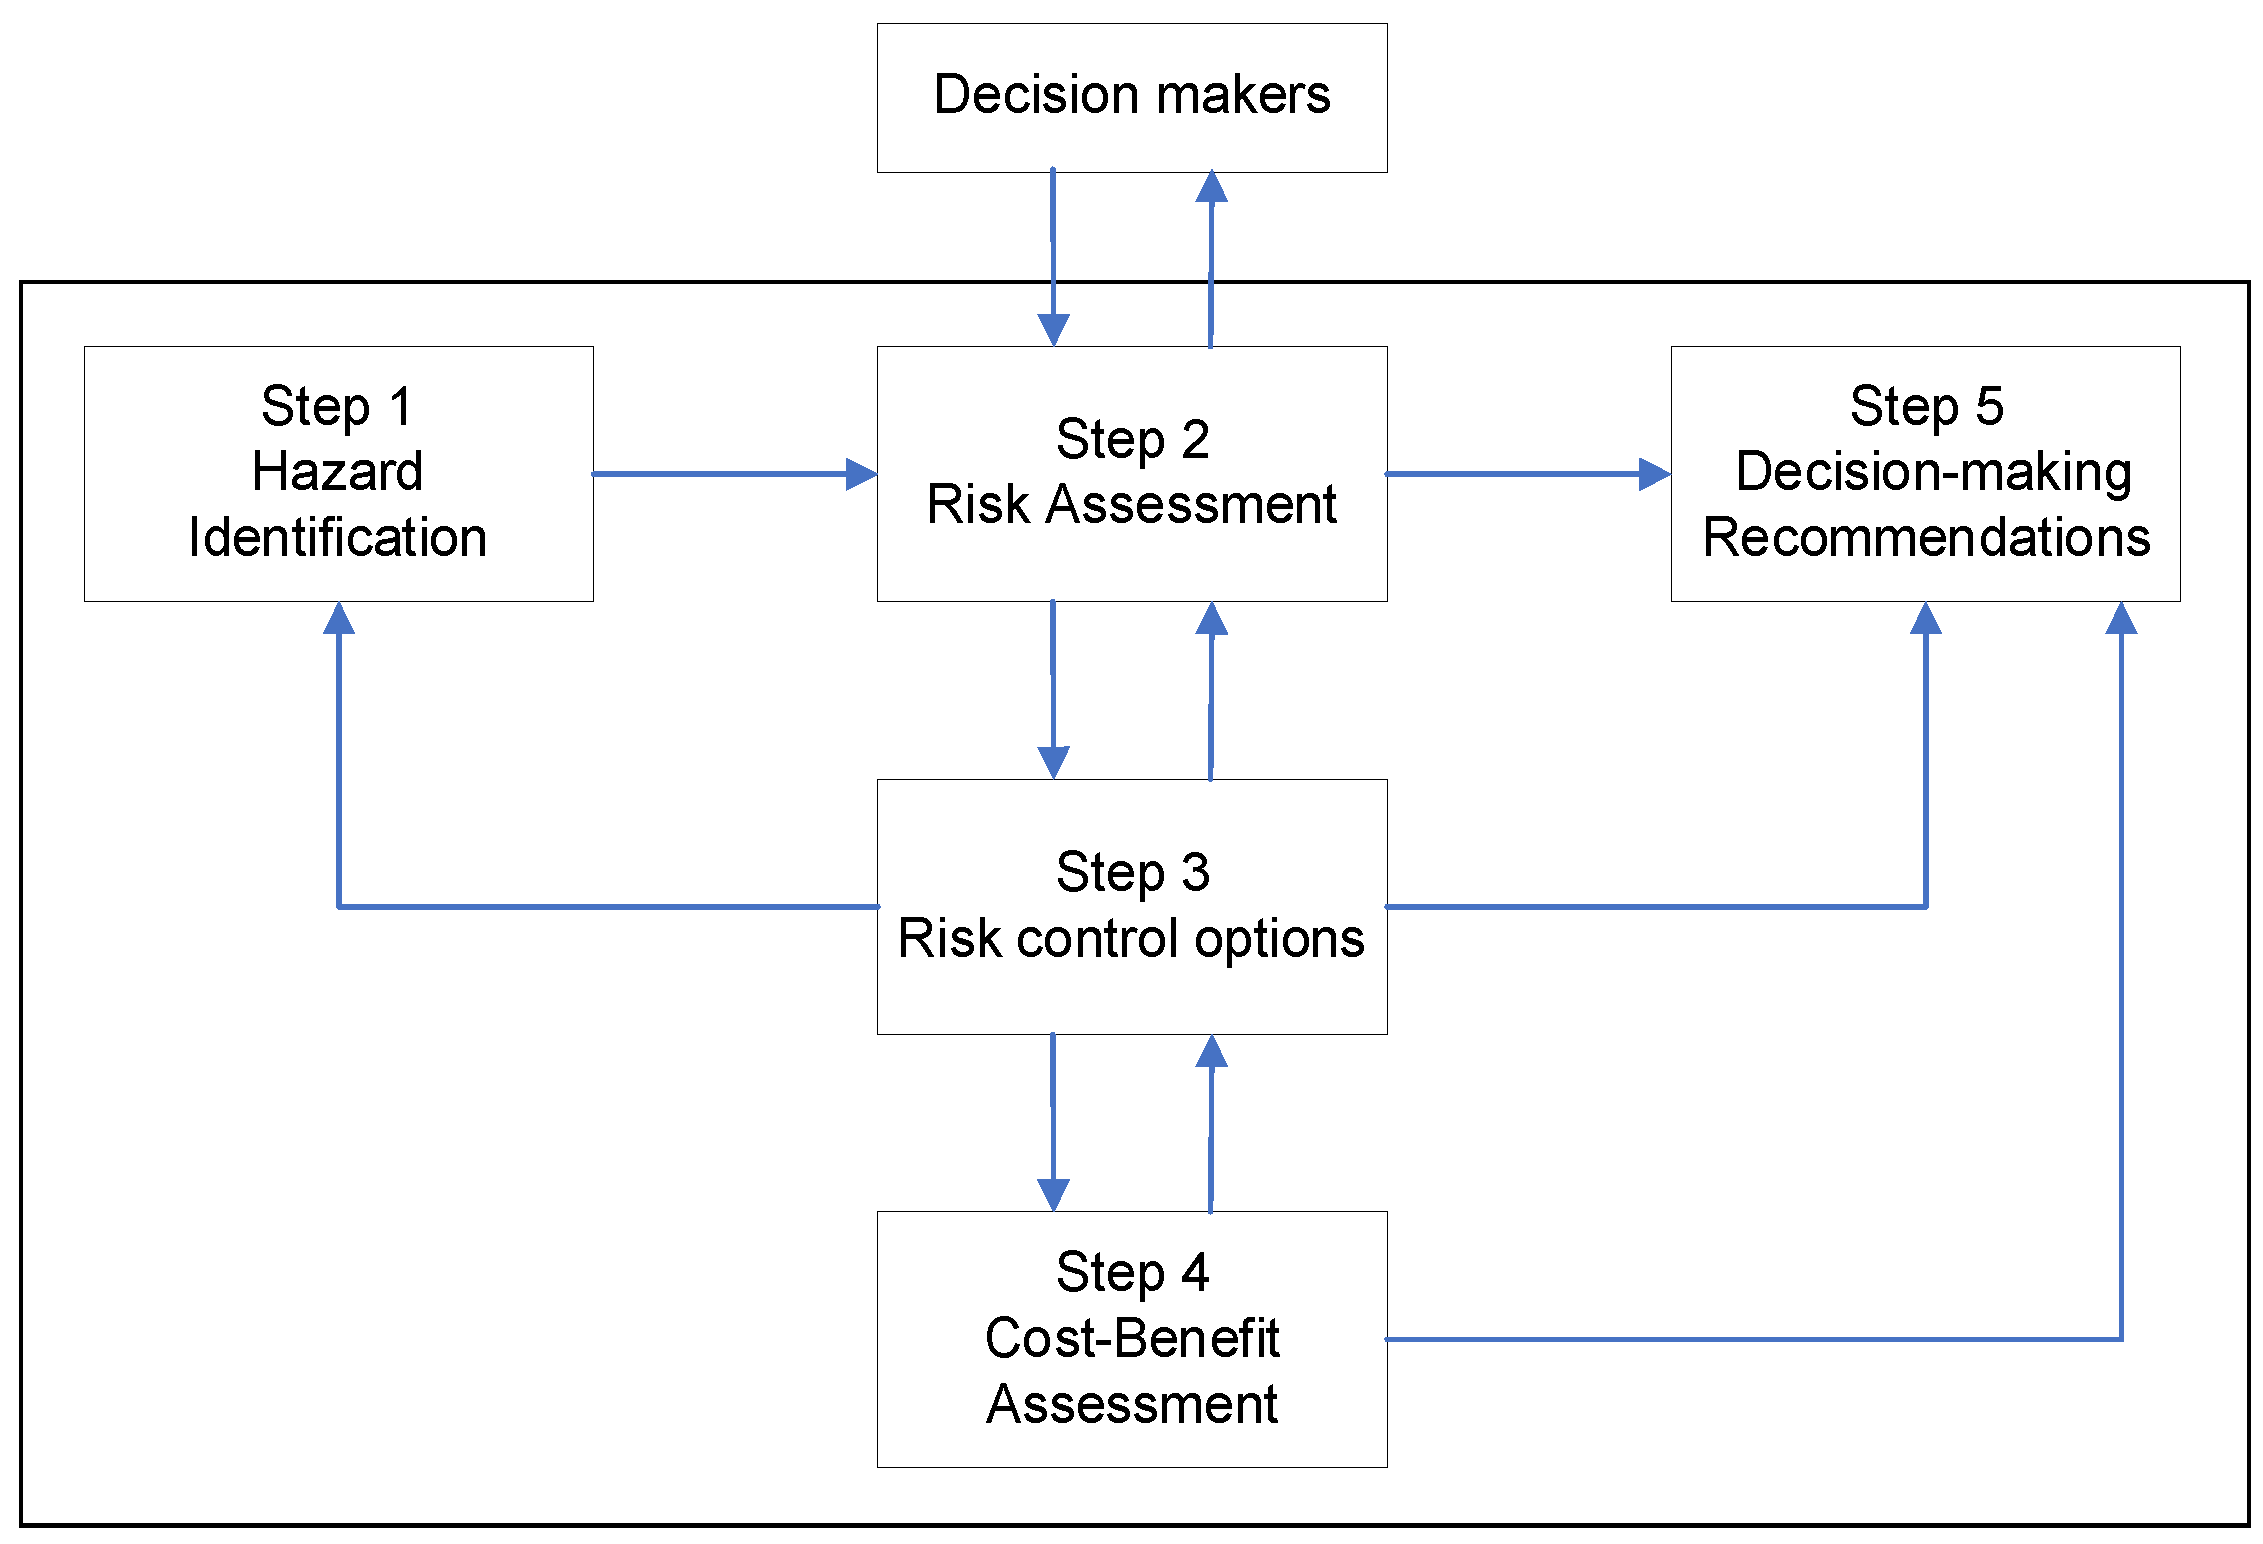
3.1. Formal Safety Assessment
3.1.1. Hazard Identification
3.1.2. Risk Estimation
3.1.3. Risk Acceptance Criteria RCOs
3.1.4. Cost–Benefit Analysis Toward Decision Making
3.1.5. Recommendation and Decision Making
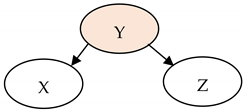
3.2. Bayesian Network
- P(A): Probability of A;
- P(B): Probability of B;
- P(A|B): Probability of A given that B already happened;
- P(B|A): Probability of B given that A already happened.
3.2.1. Marginalization of Probabilities
3.2.2. Conditional Probability
3.2.3. Noisy-Or Approach
- I.
- Casual inhibition: If the effect is present, the cause should also be present except when the system is disabled.
- II.
- Independence of exception: Causes (parent nodes) are independent of each other.
- III.
- Accountability: Child nodes only exist if any of the parent nodes are present.
4. Case Study
4.1. System Description
- Refrigeration systems. To ensure safety and reliability, it is advised to incorporate two separate reliquefying systems when using ammonia, as it is highly sensitive to temperature as described previously. It is also crucial to have two sets of suction pipes and pumps, as well as a dedicated pump room. This will prevent a single failure from causing a complete breakdown.
- Ammonia detection sensors.
- Ventilation.
- Pressure relief.
- Remote operation and isolation valves.
- Piping with sufficient distance.
- Locating piping in unmanned space.
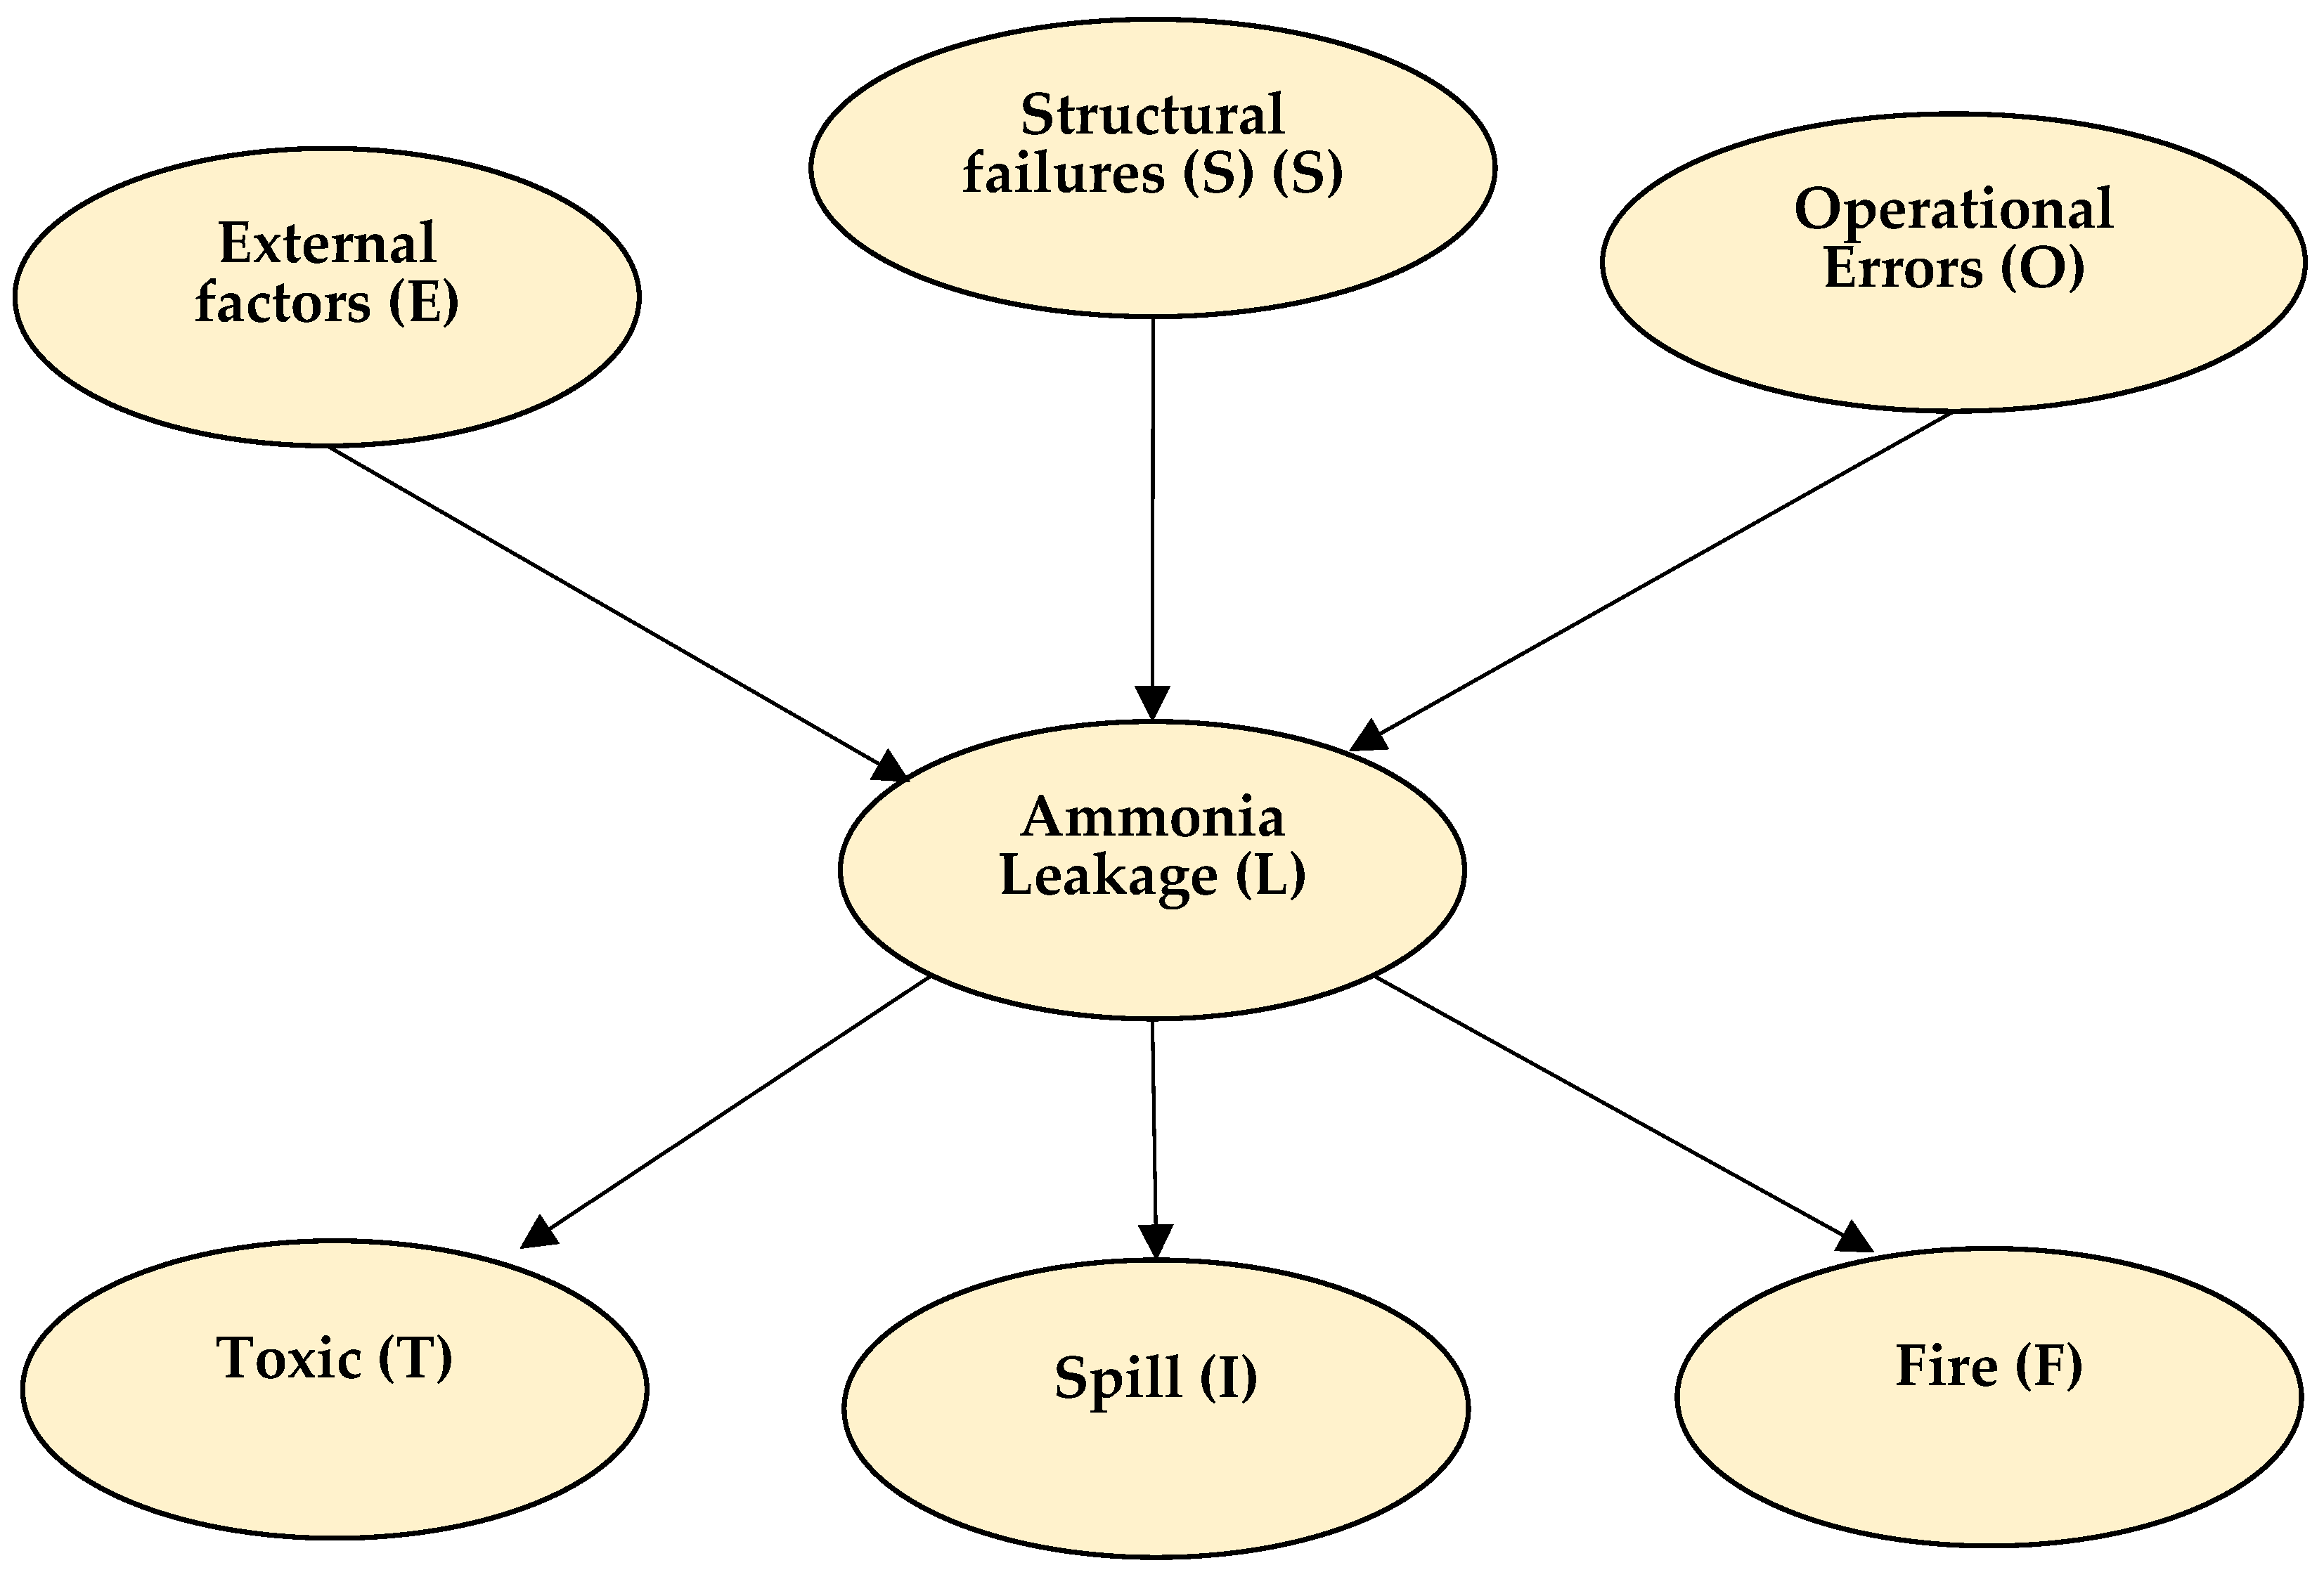
4.2. Hazard Identification
4.3. Dynamic Risk Assessment
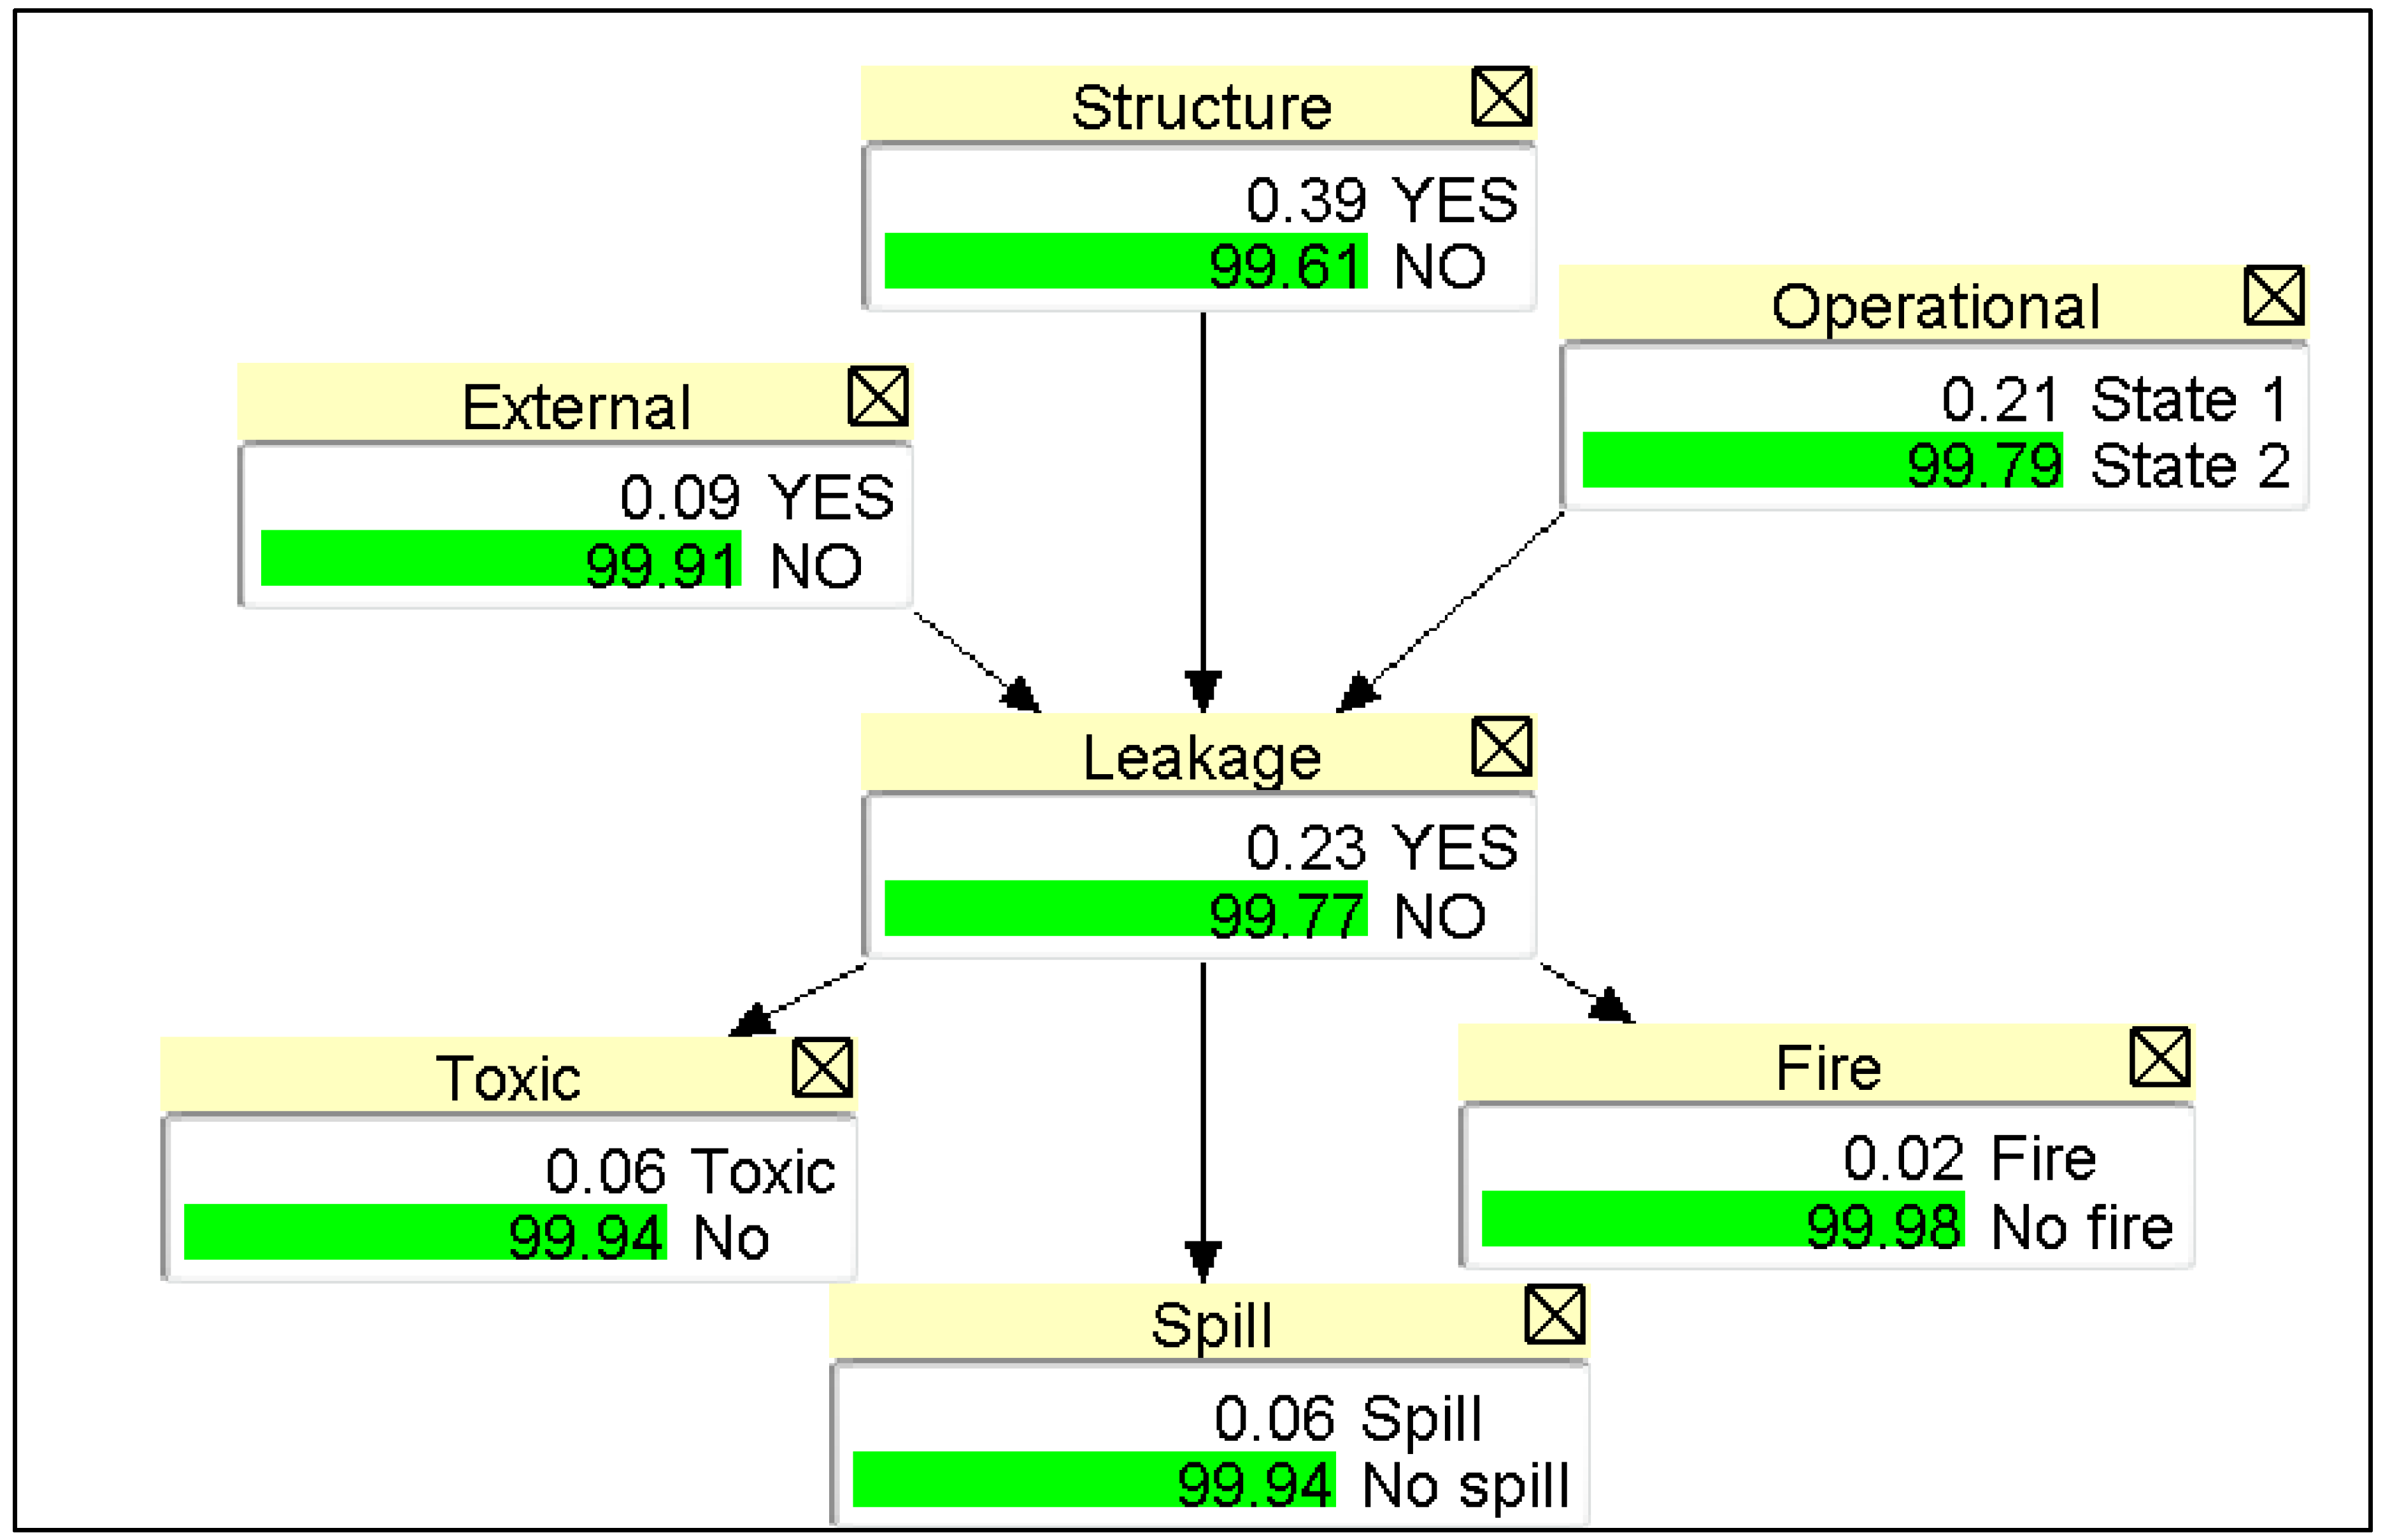
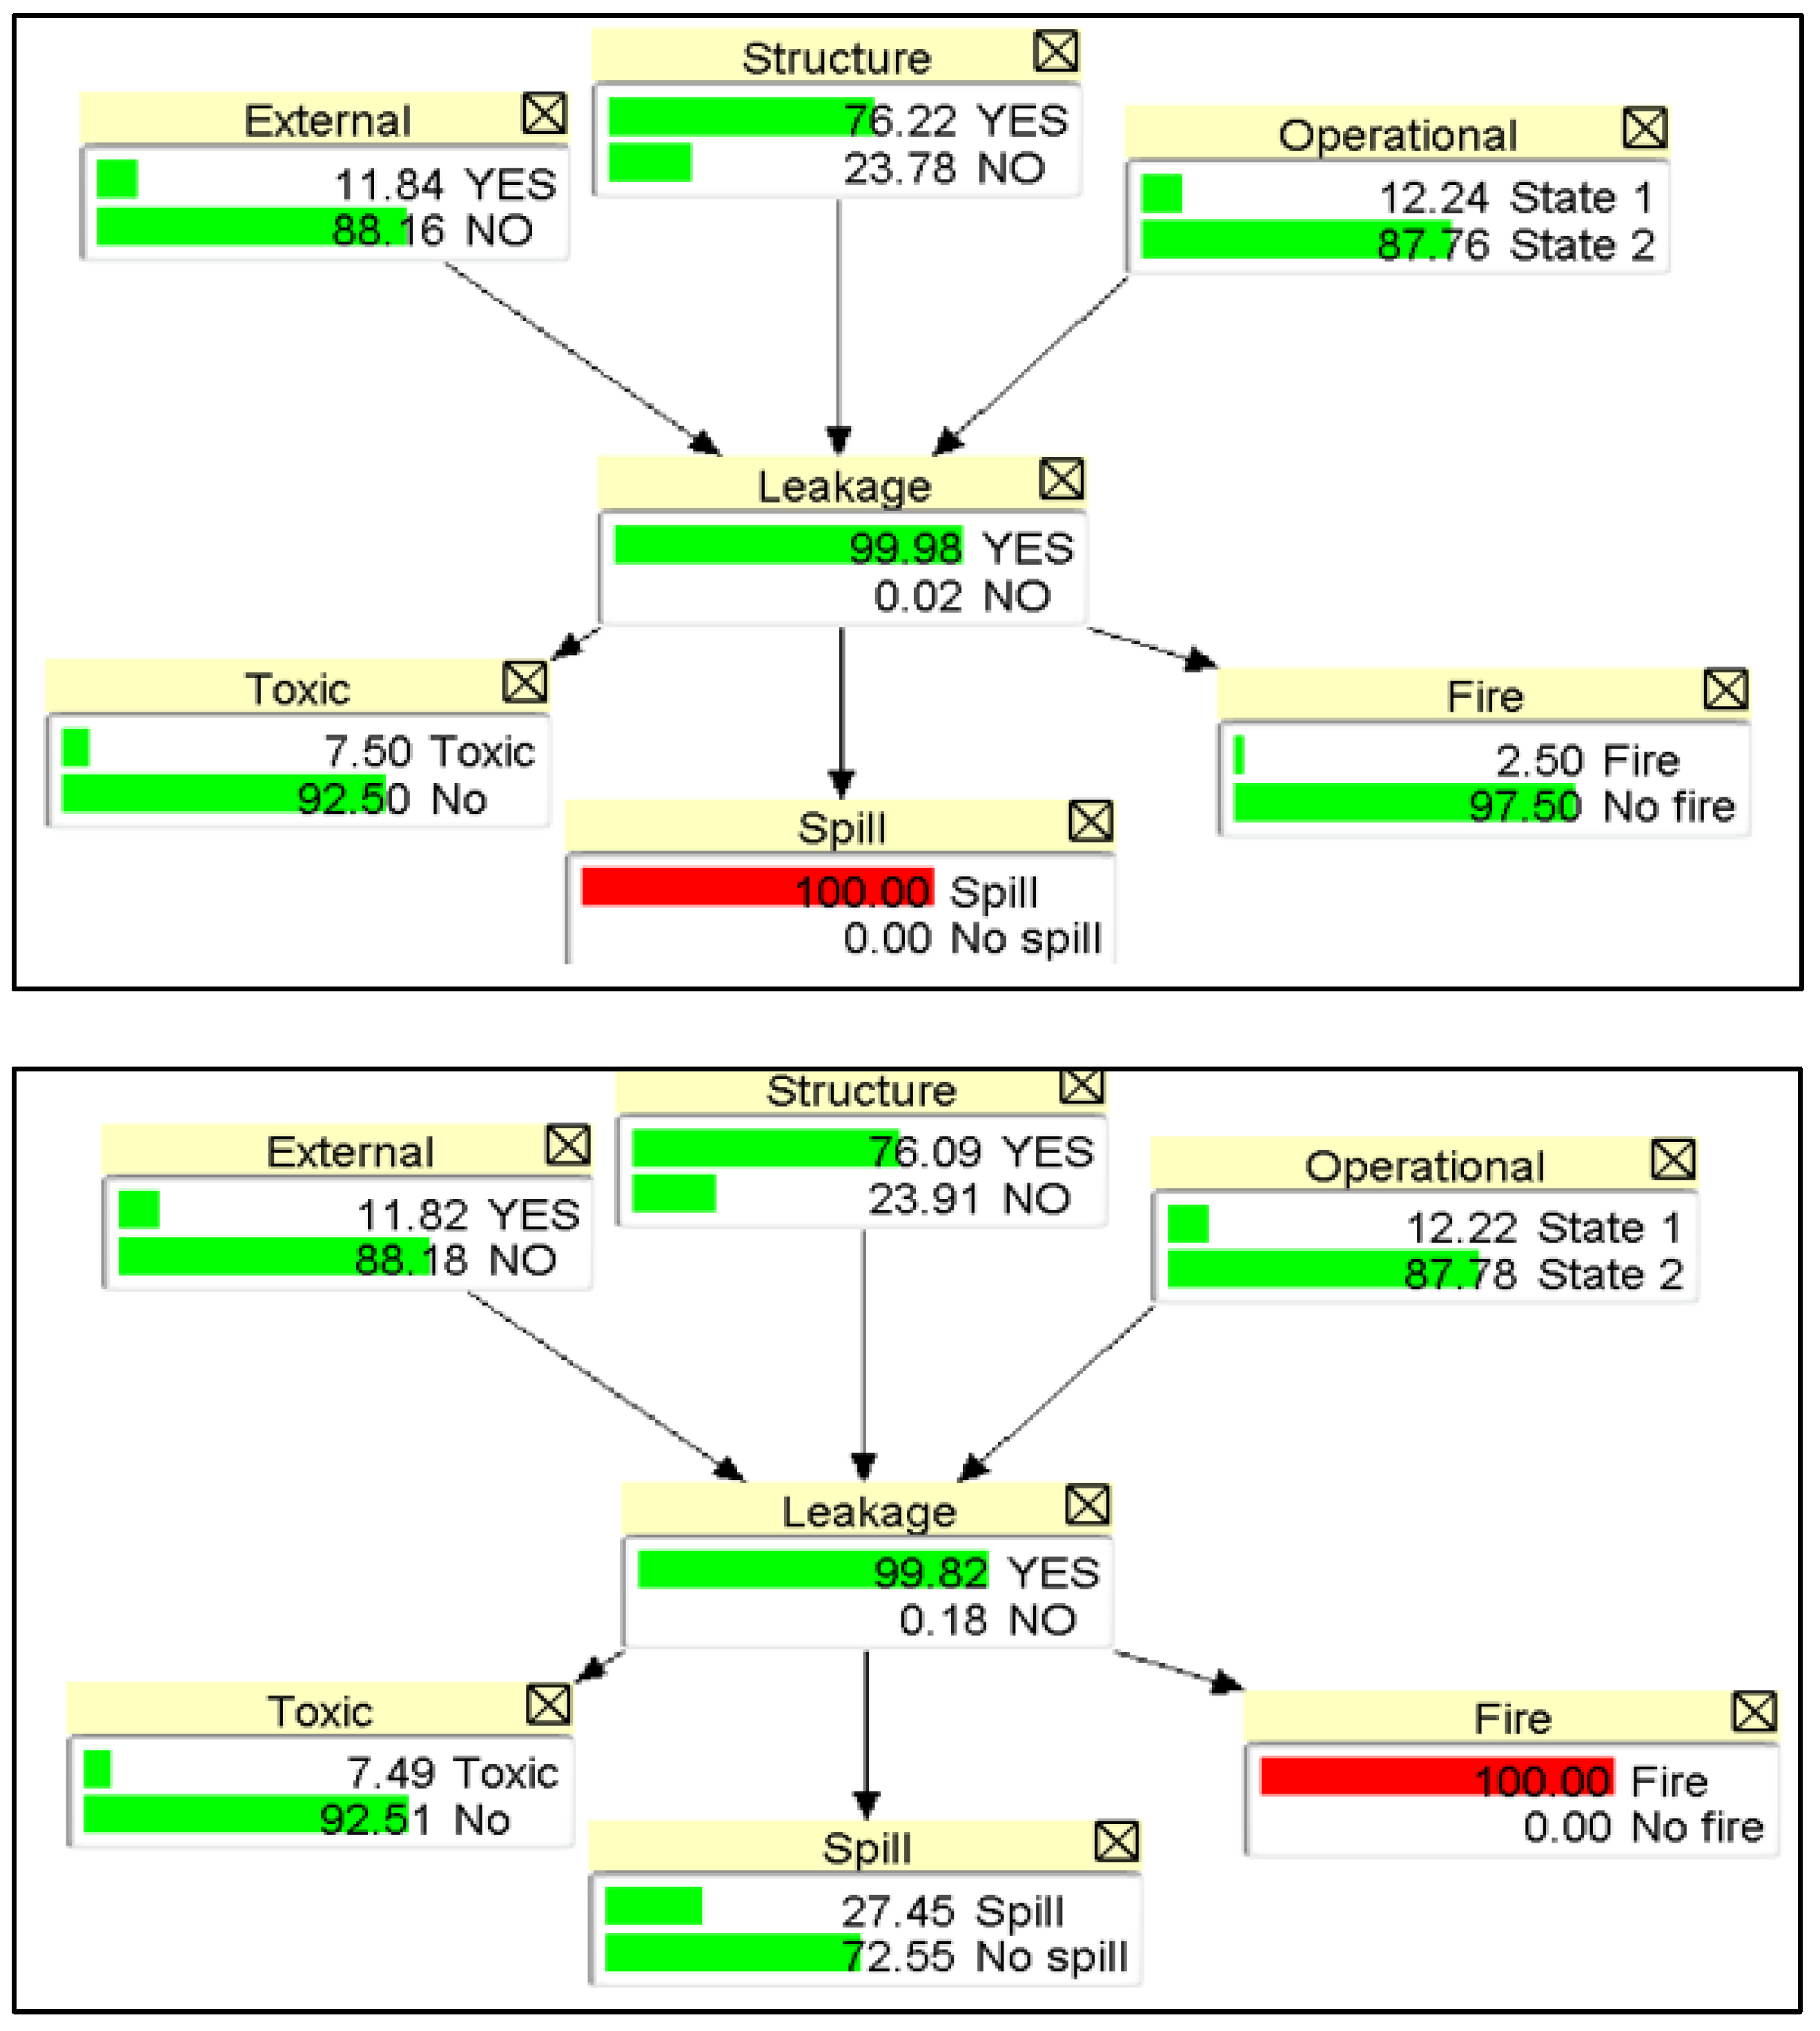
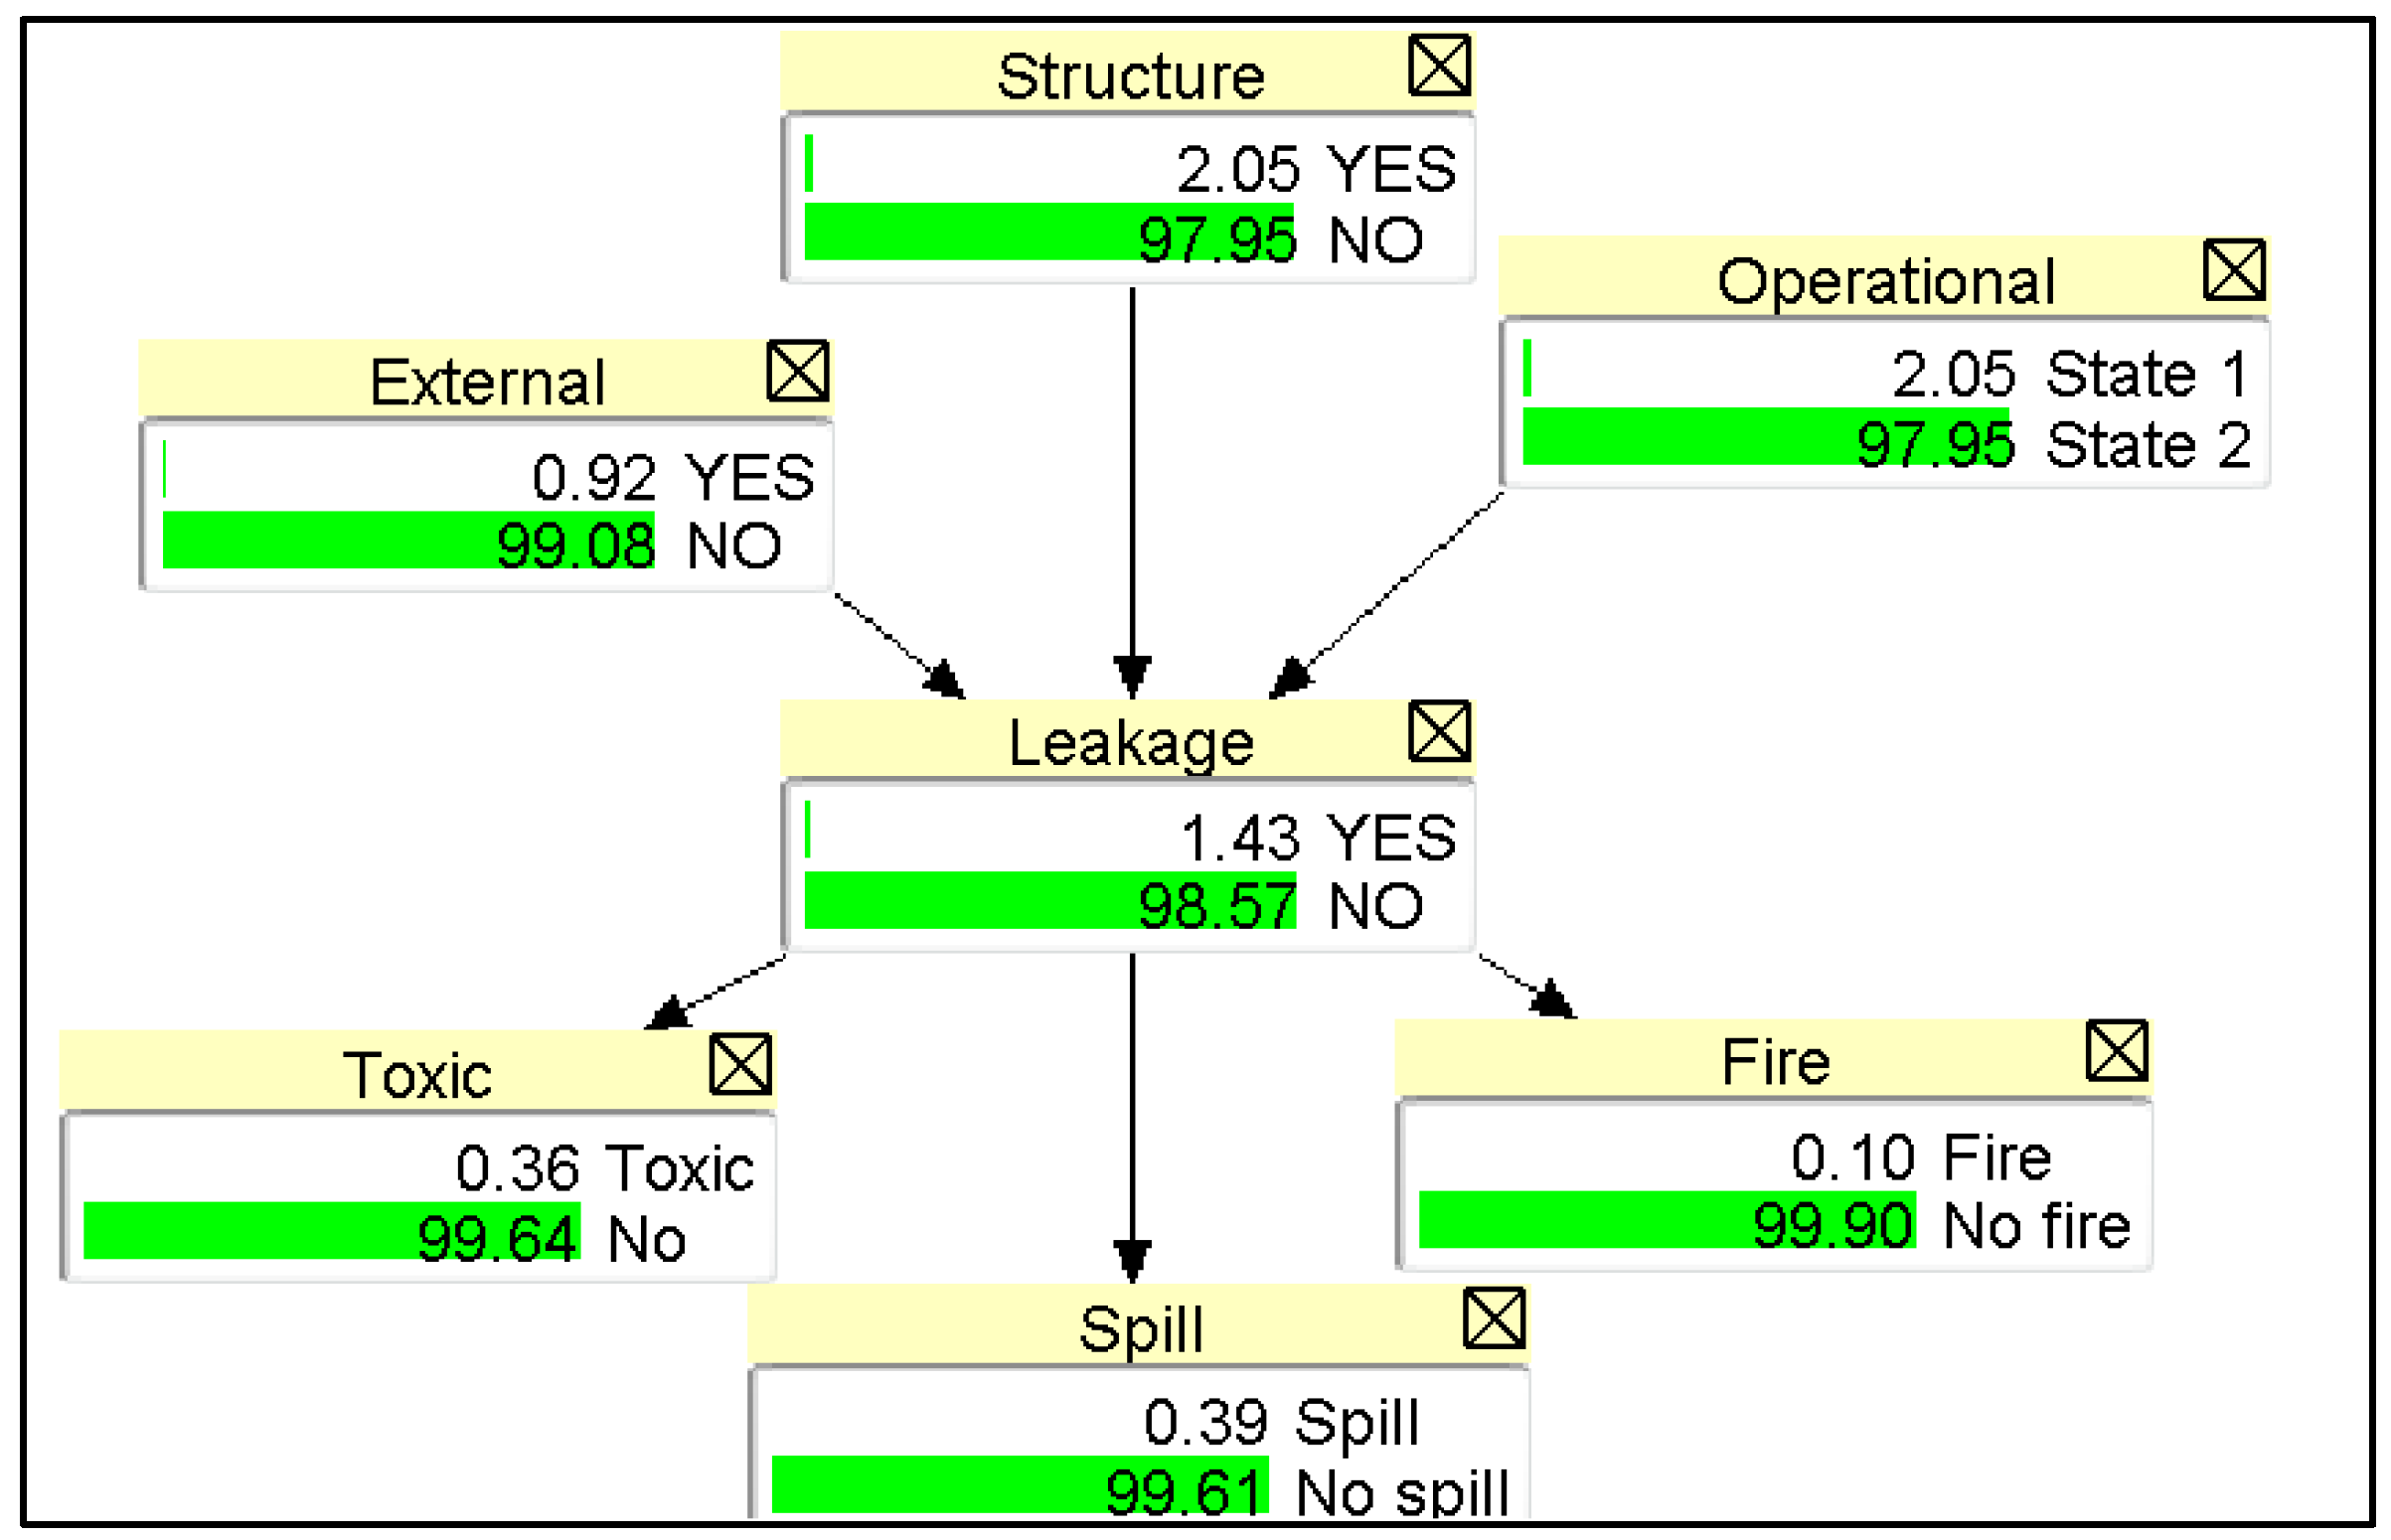
4.3.1. Bayesian Network
4.3.2. Conditional Probability
Noisy-Or Approach
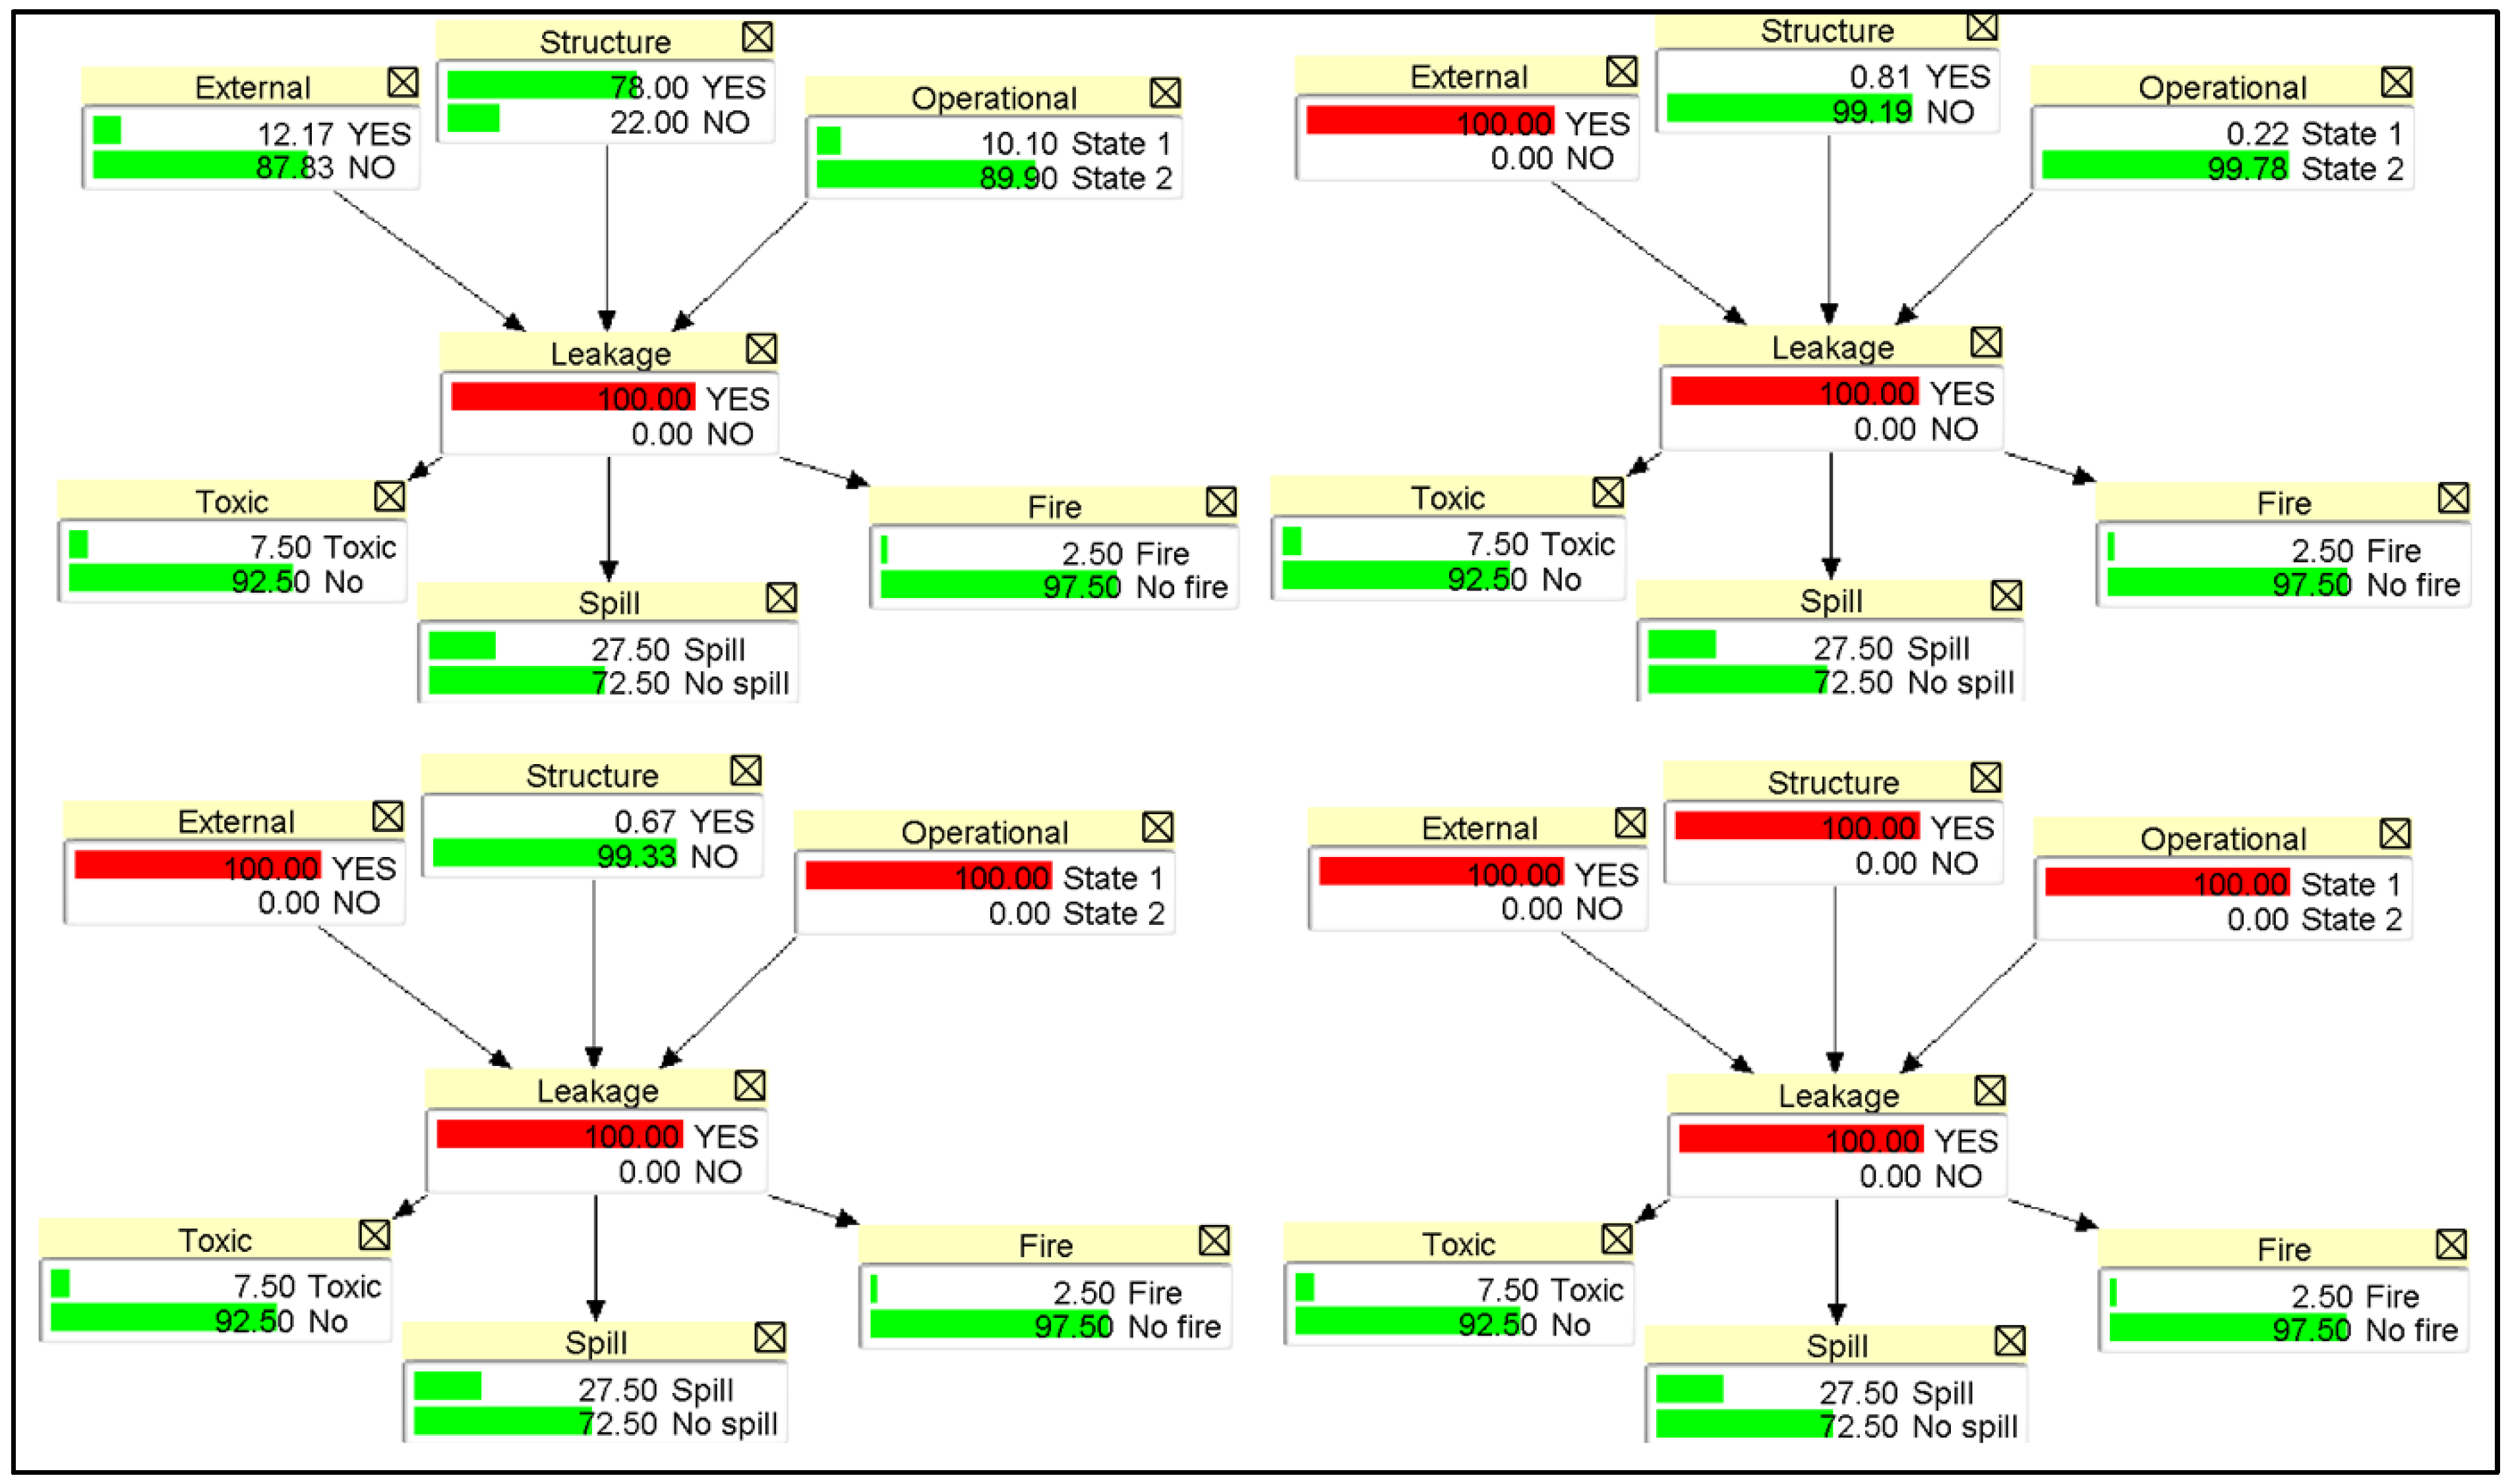
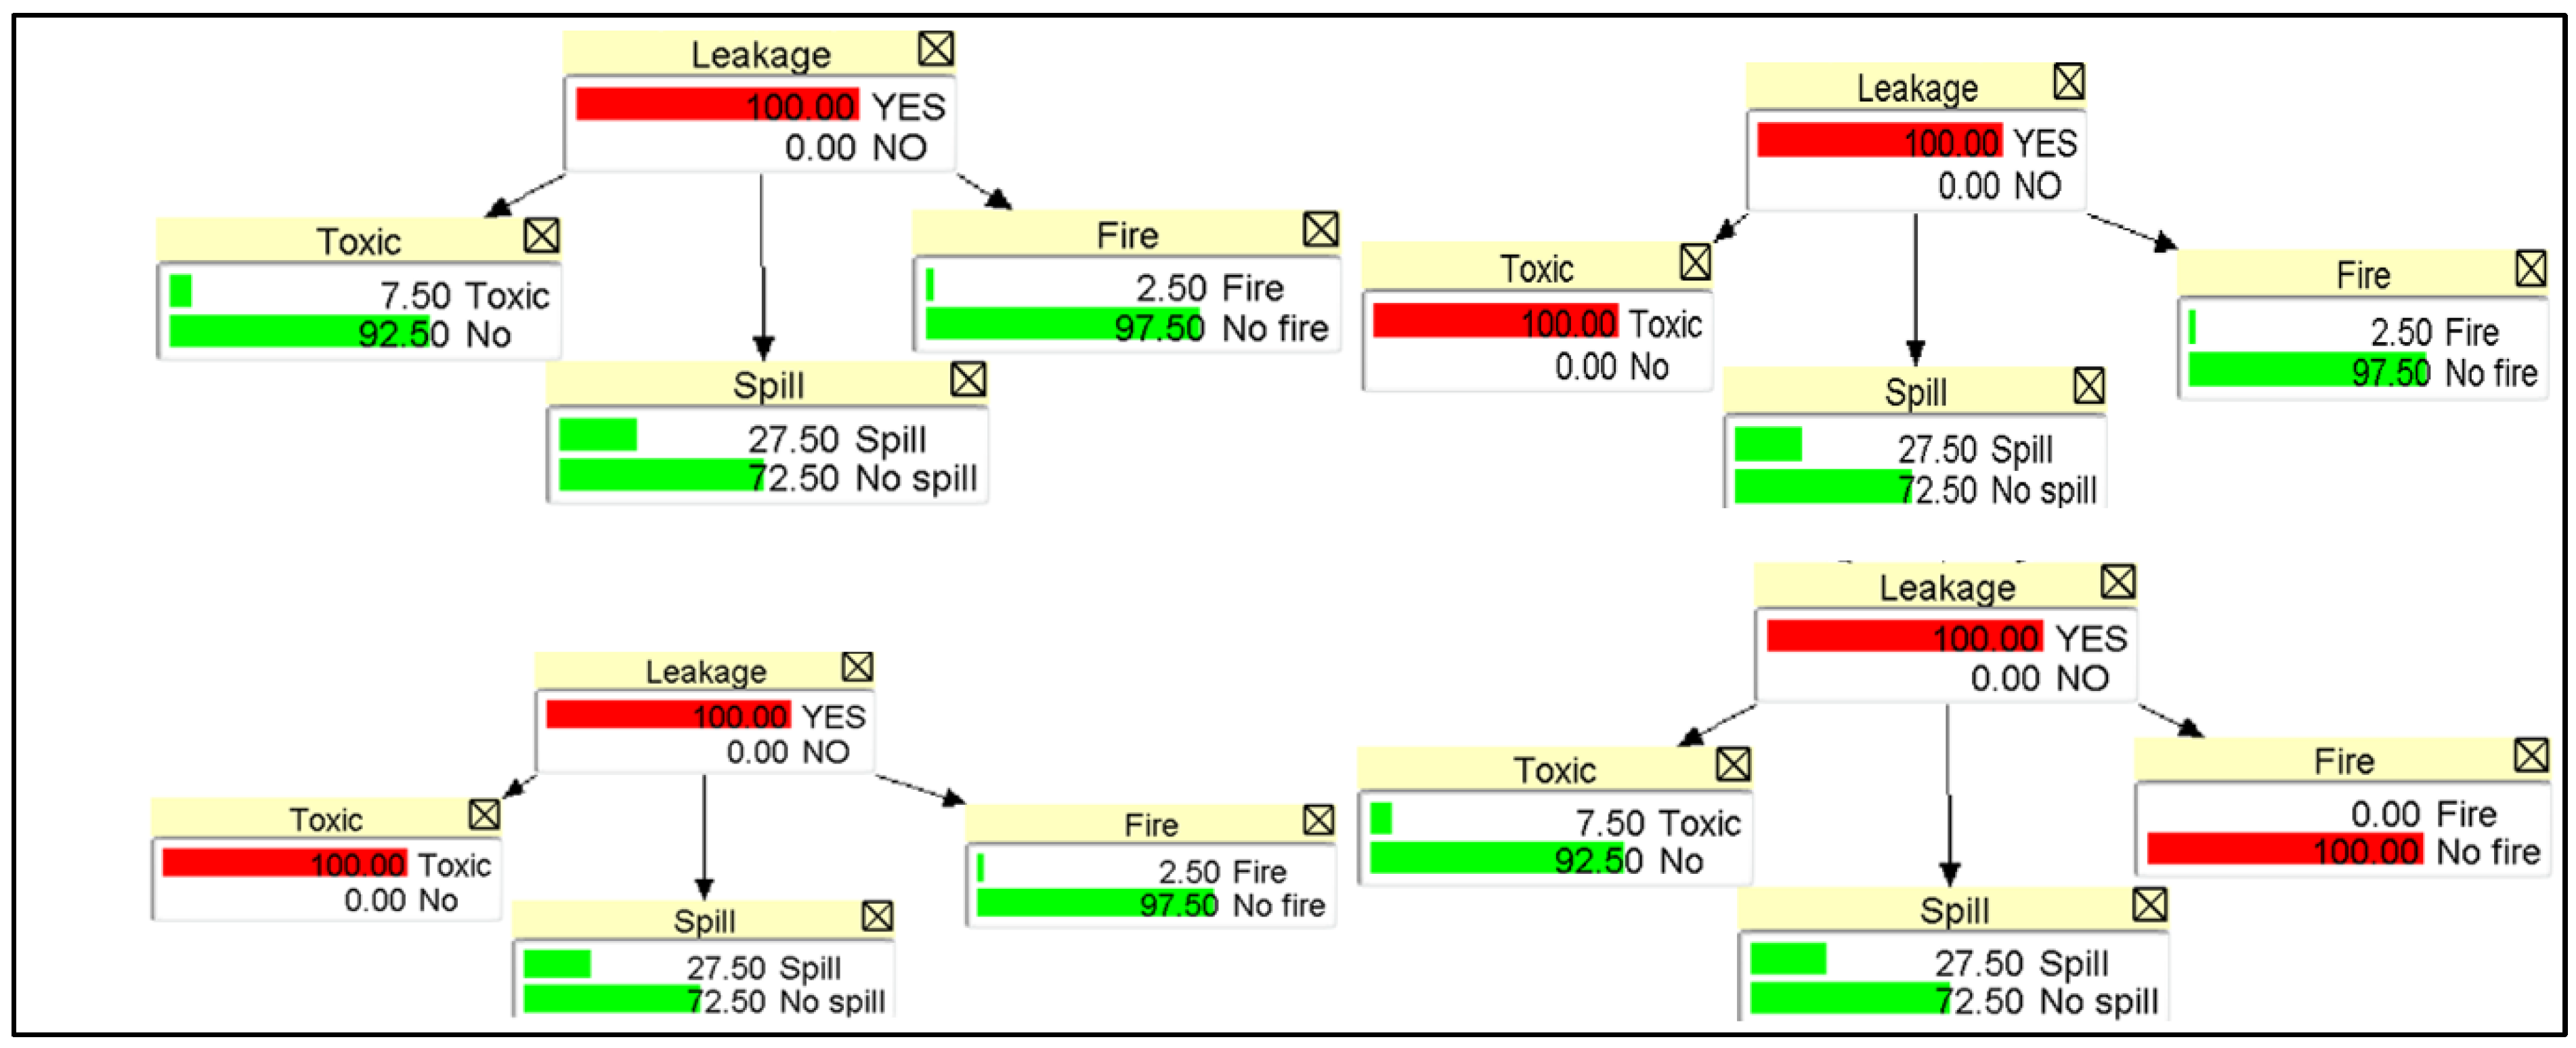
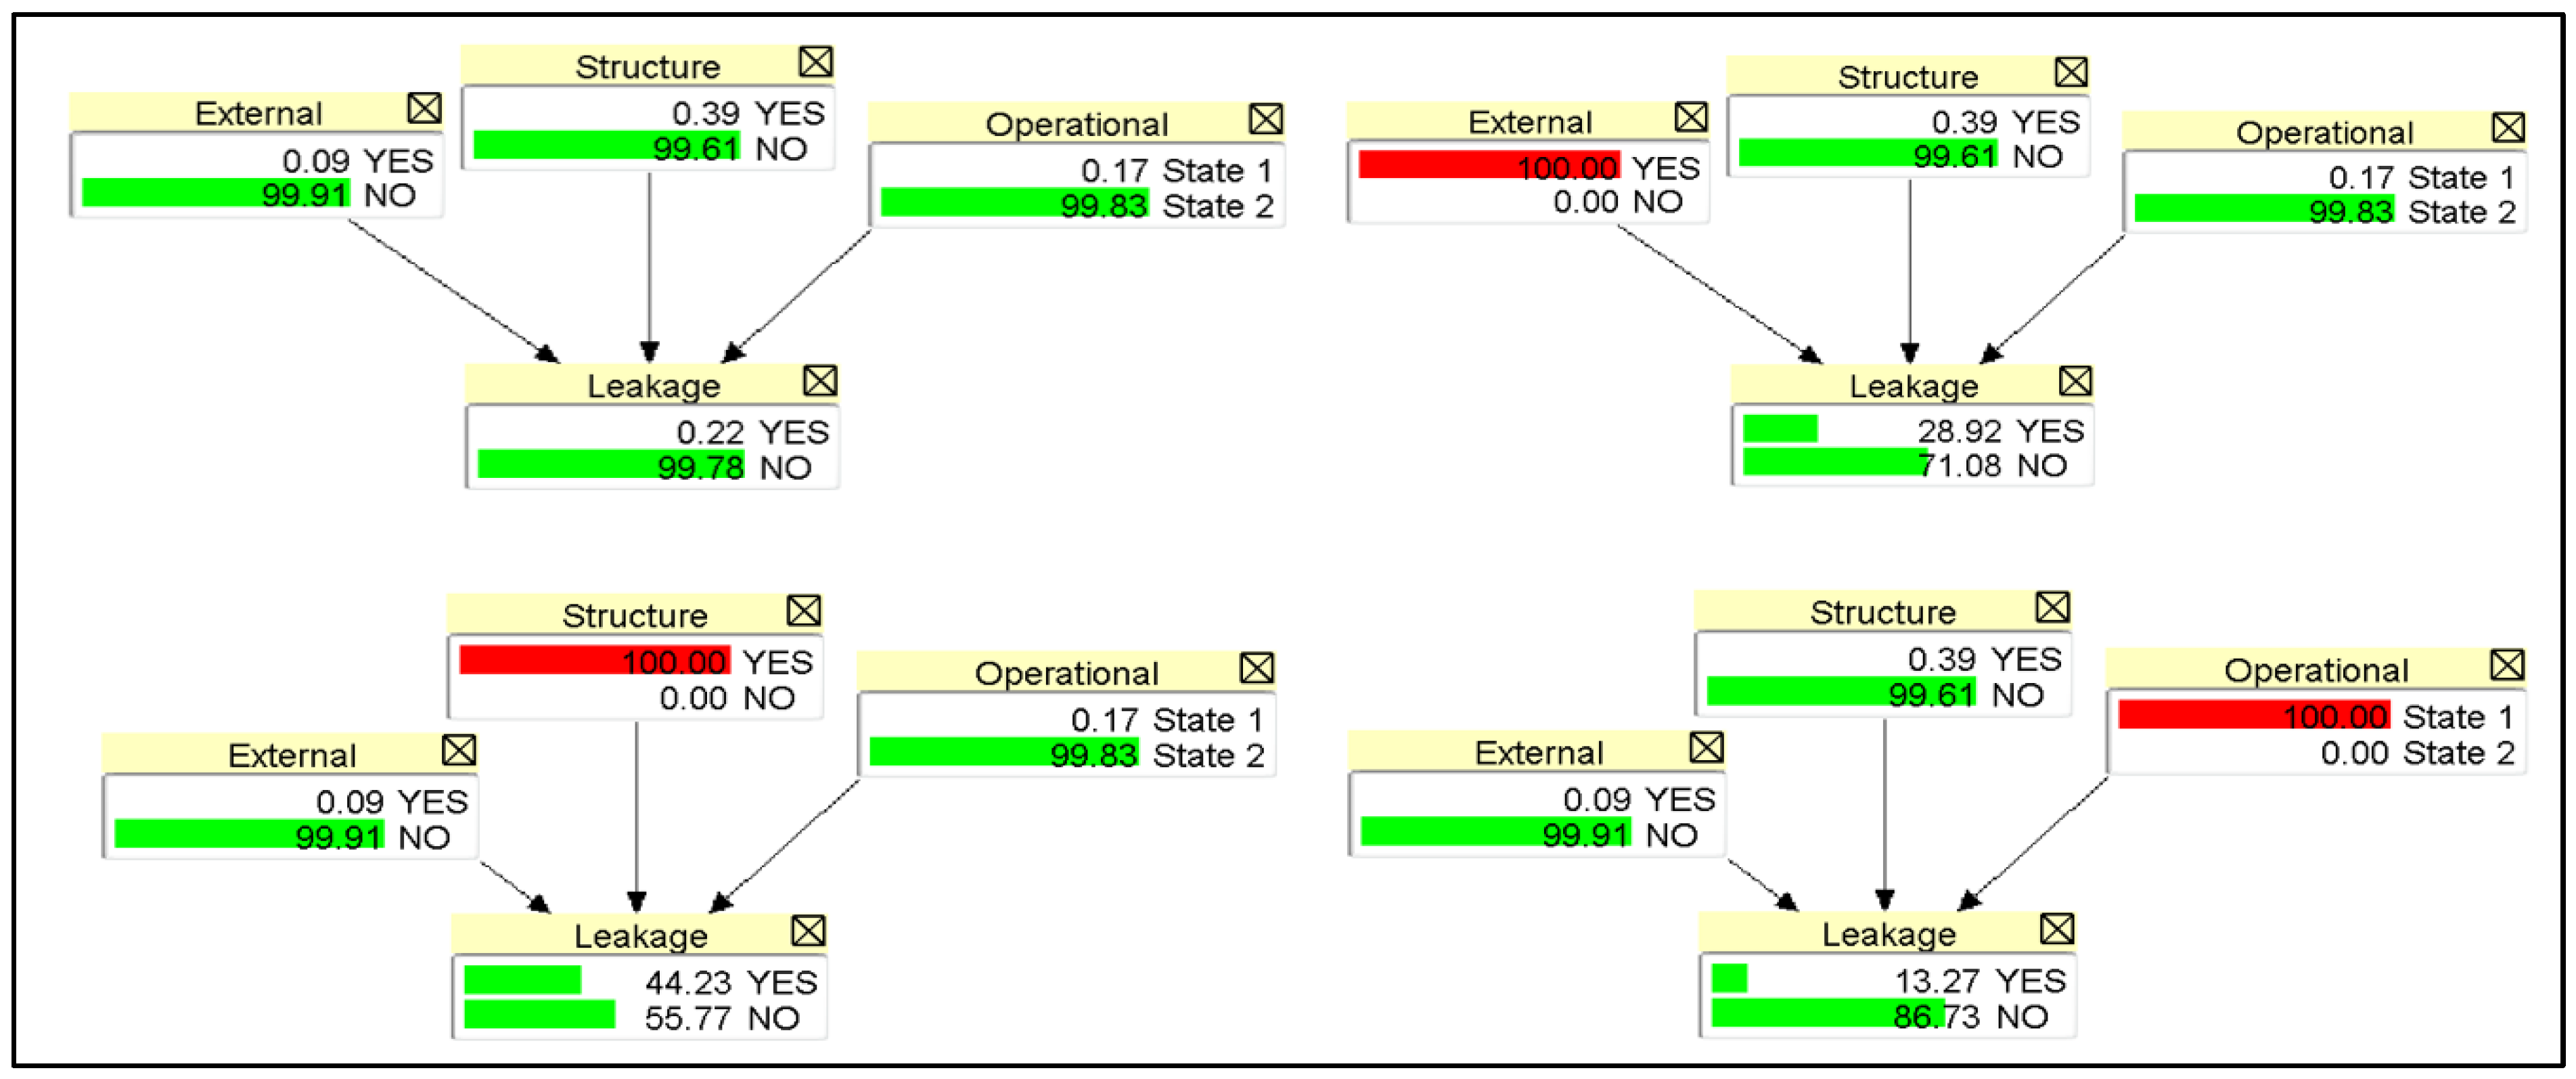
4.3.3. Model Validation
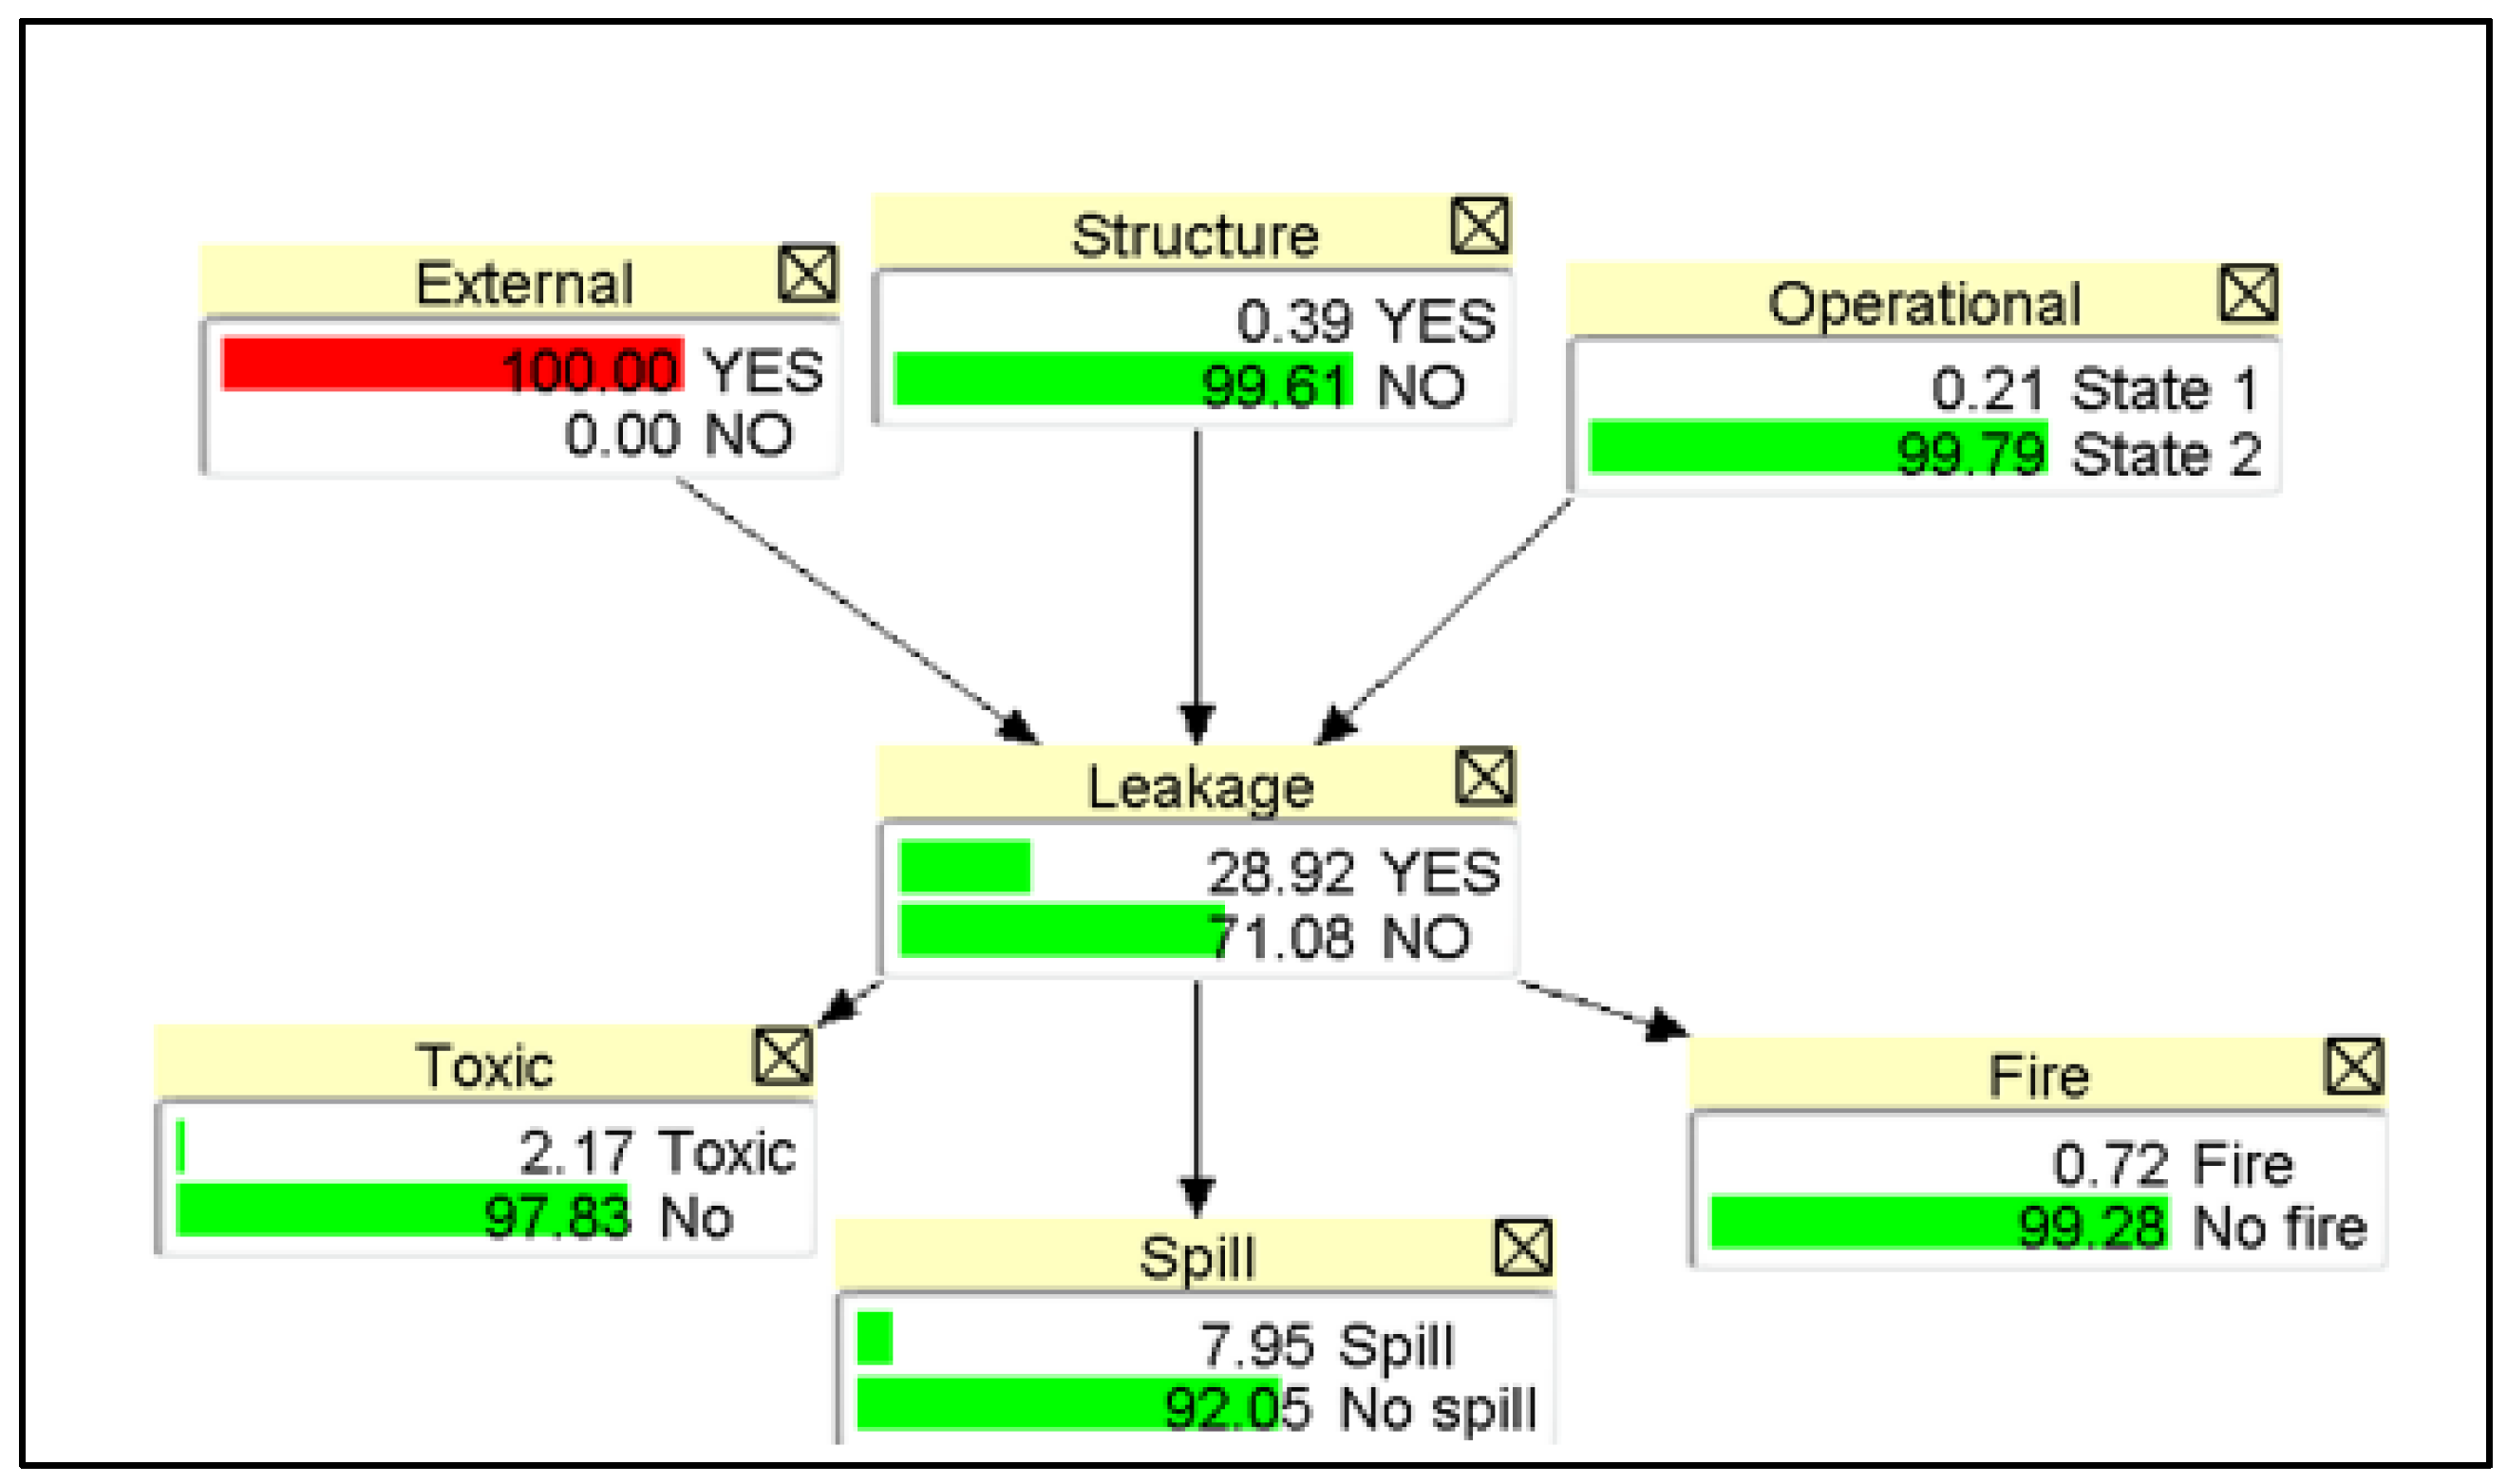
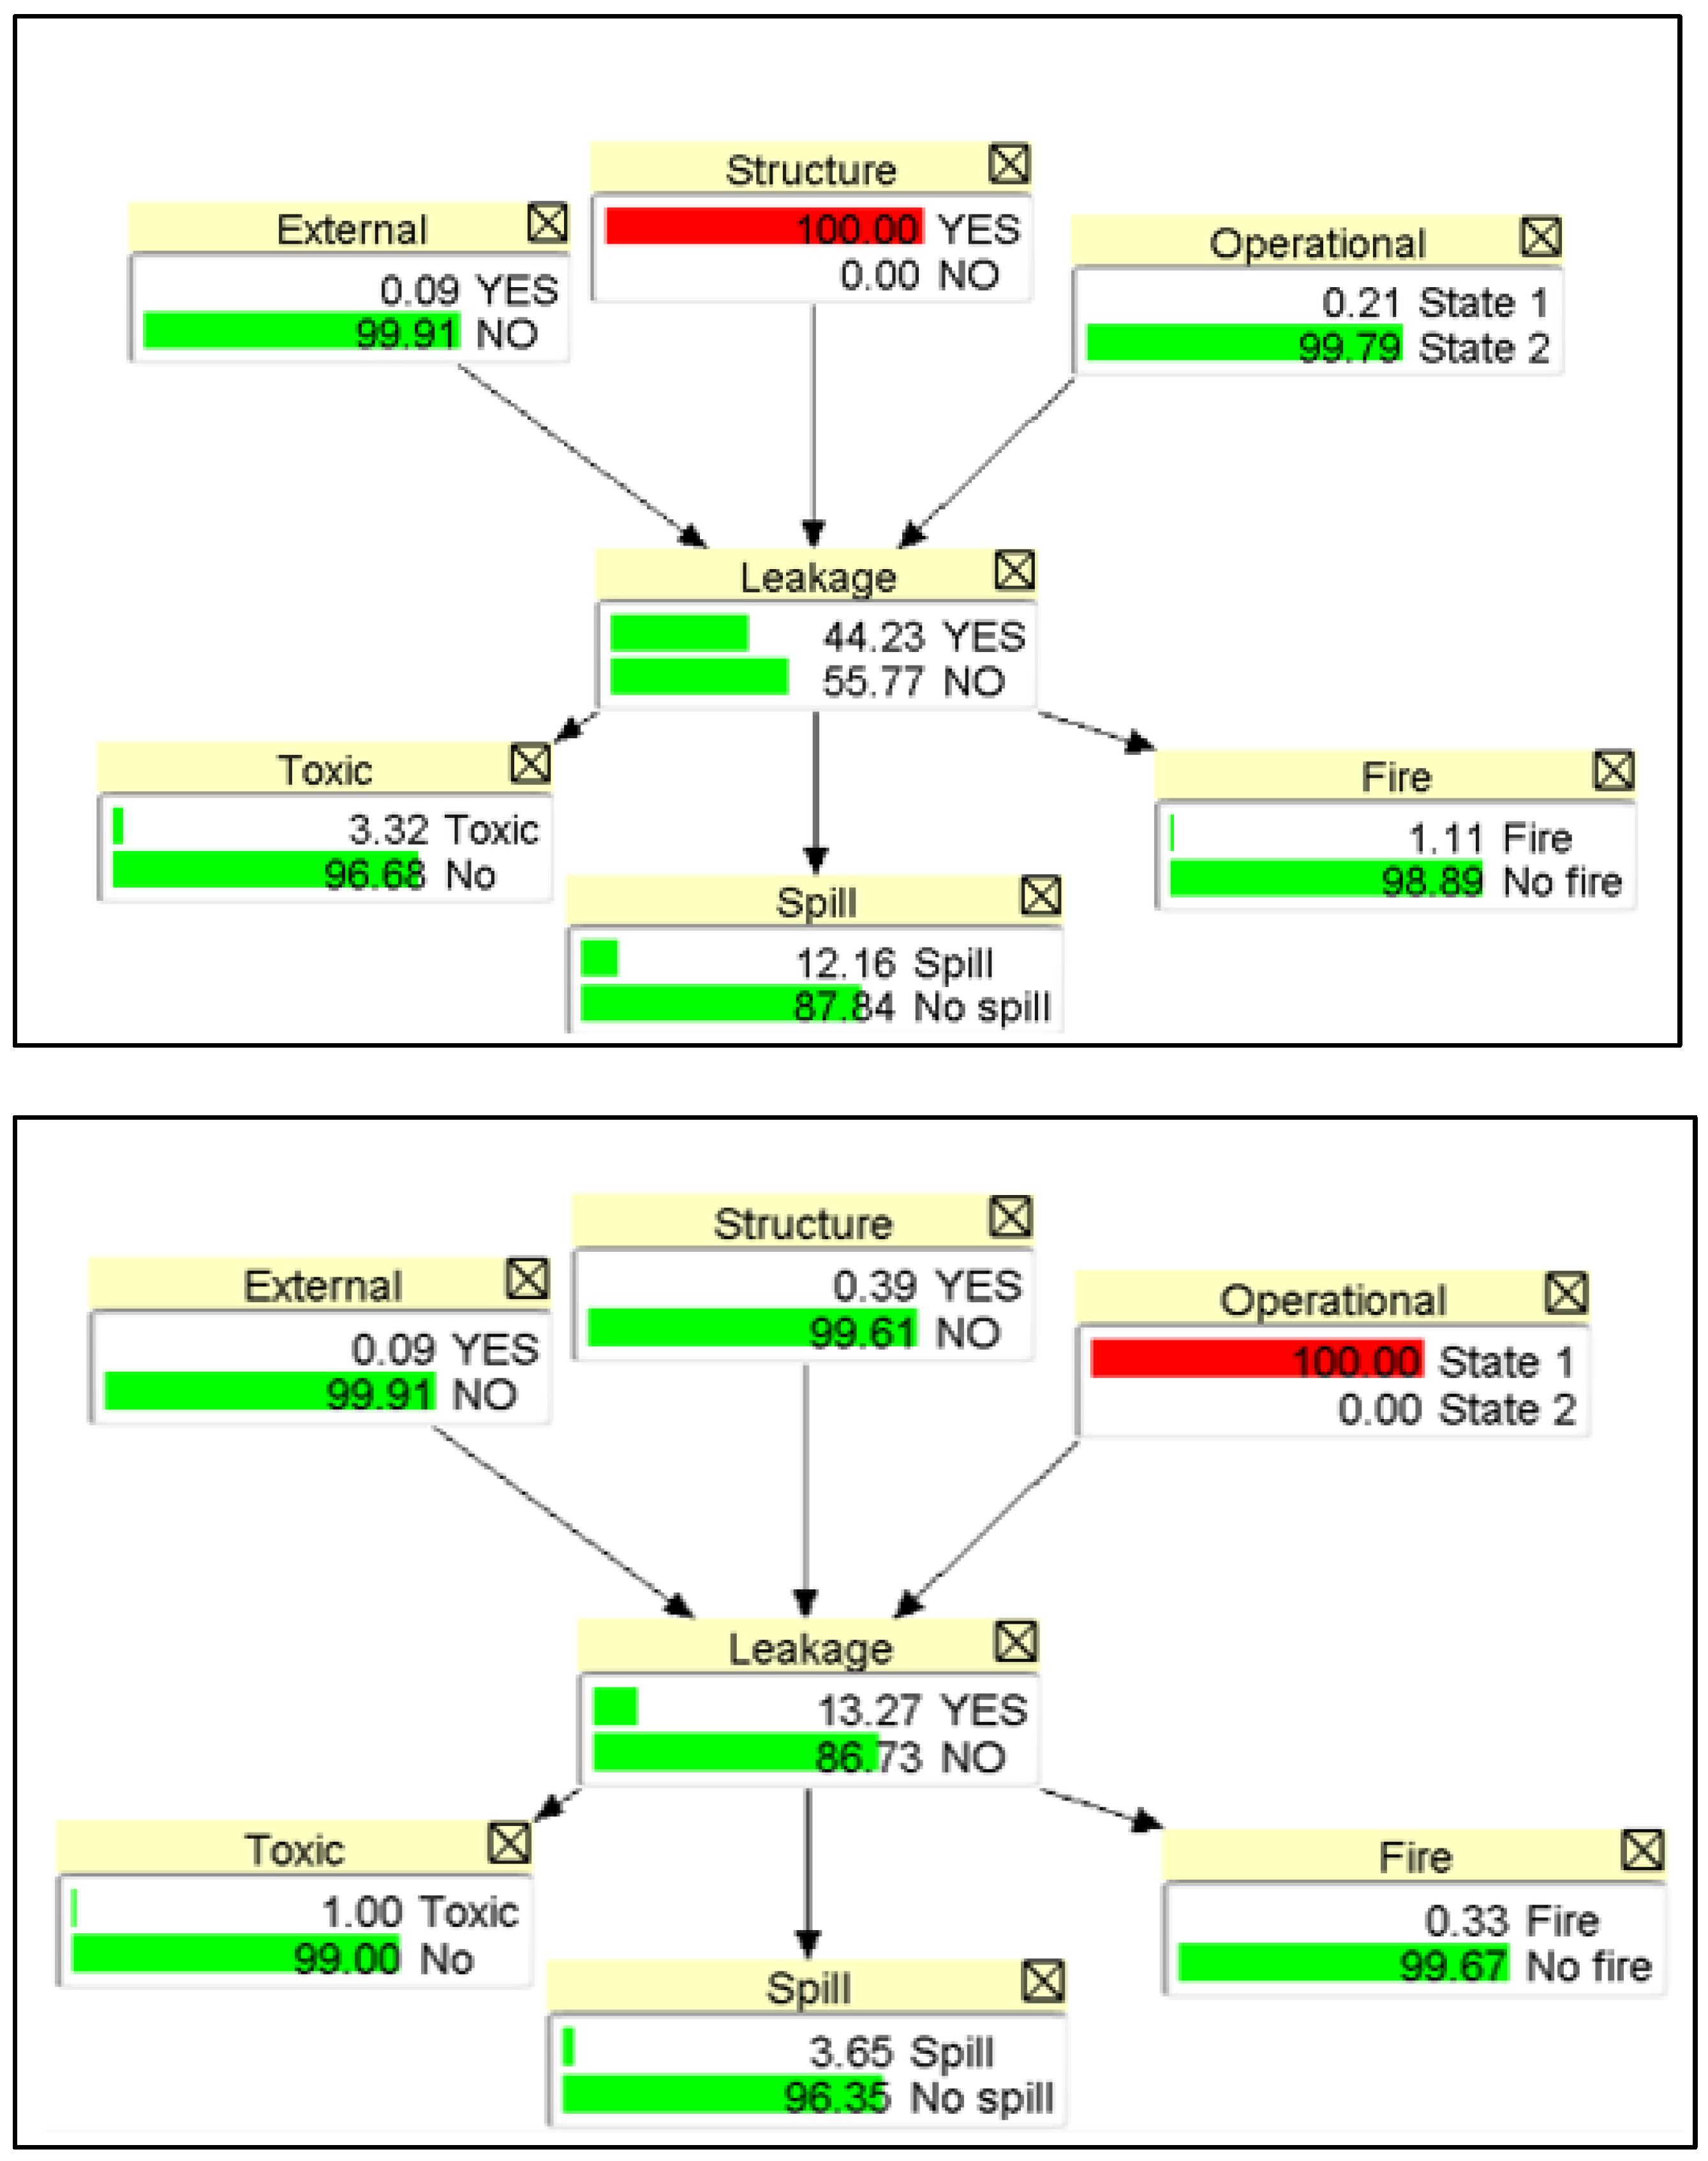
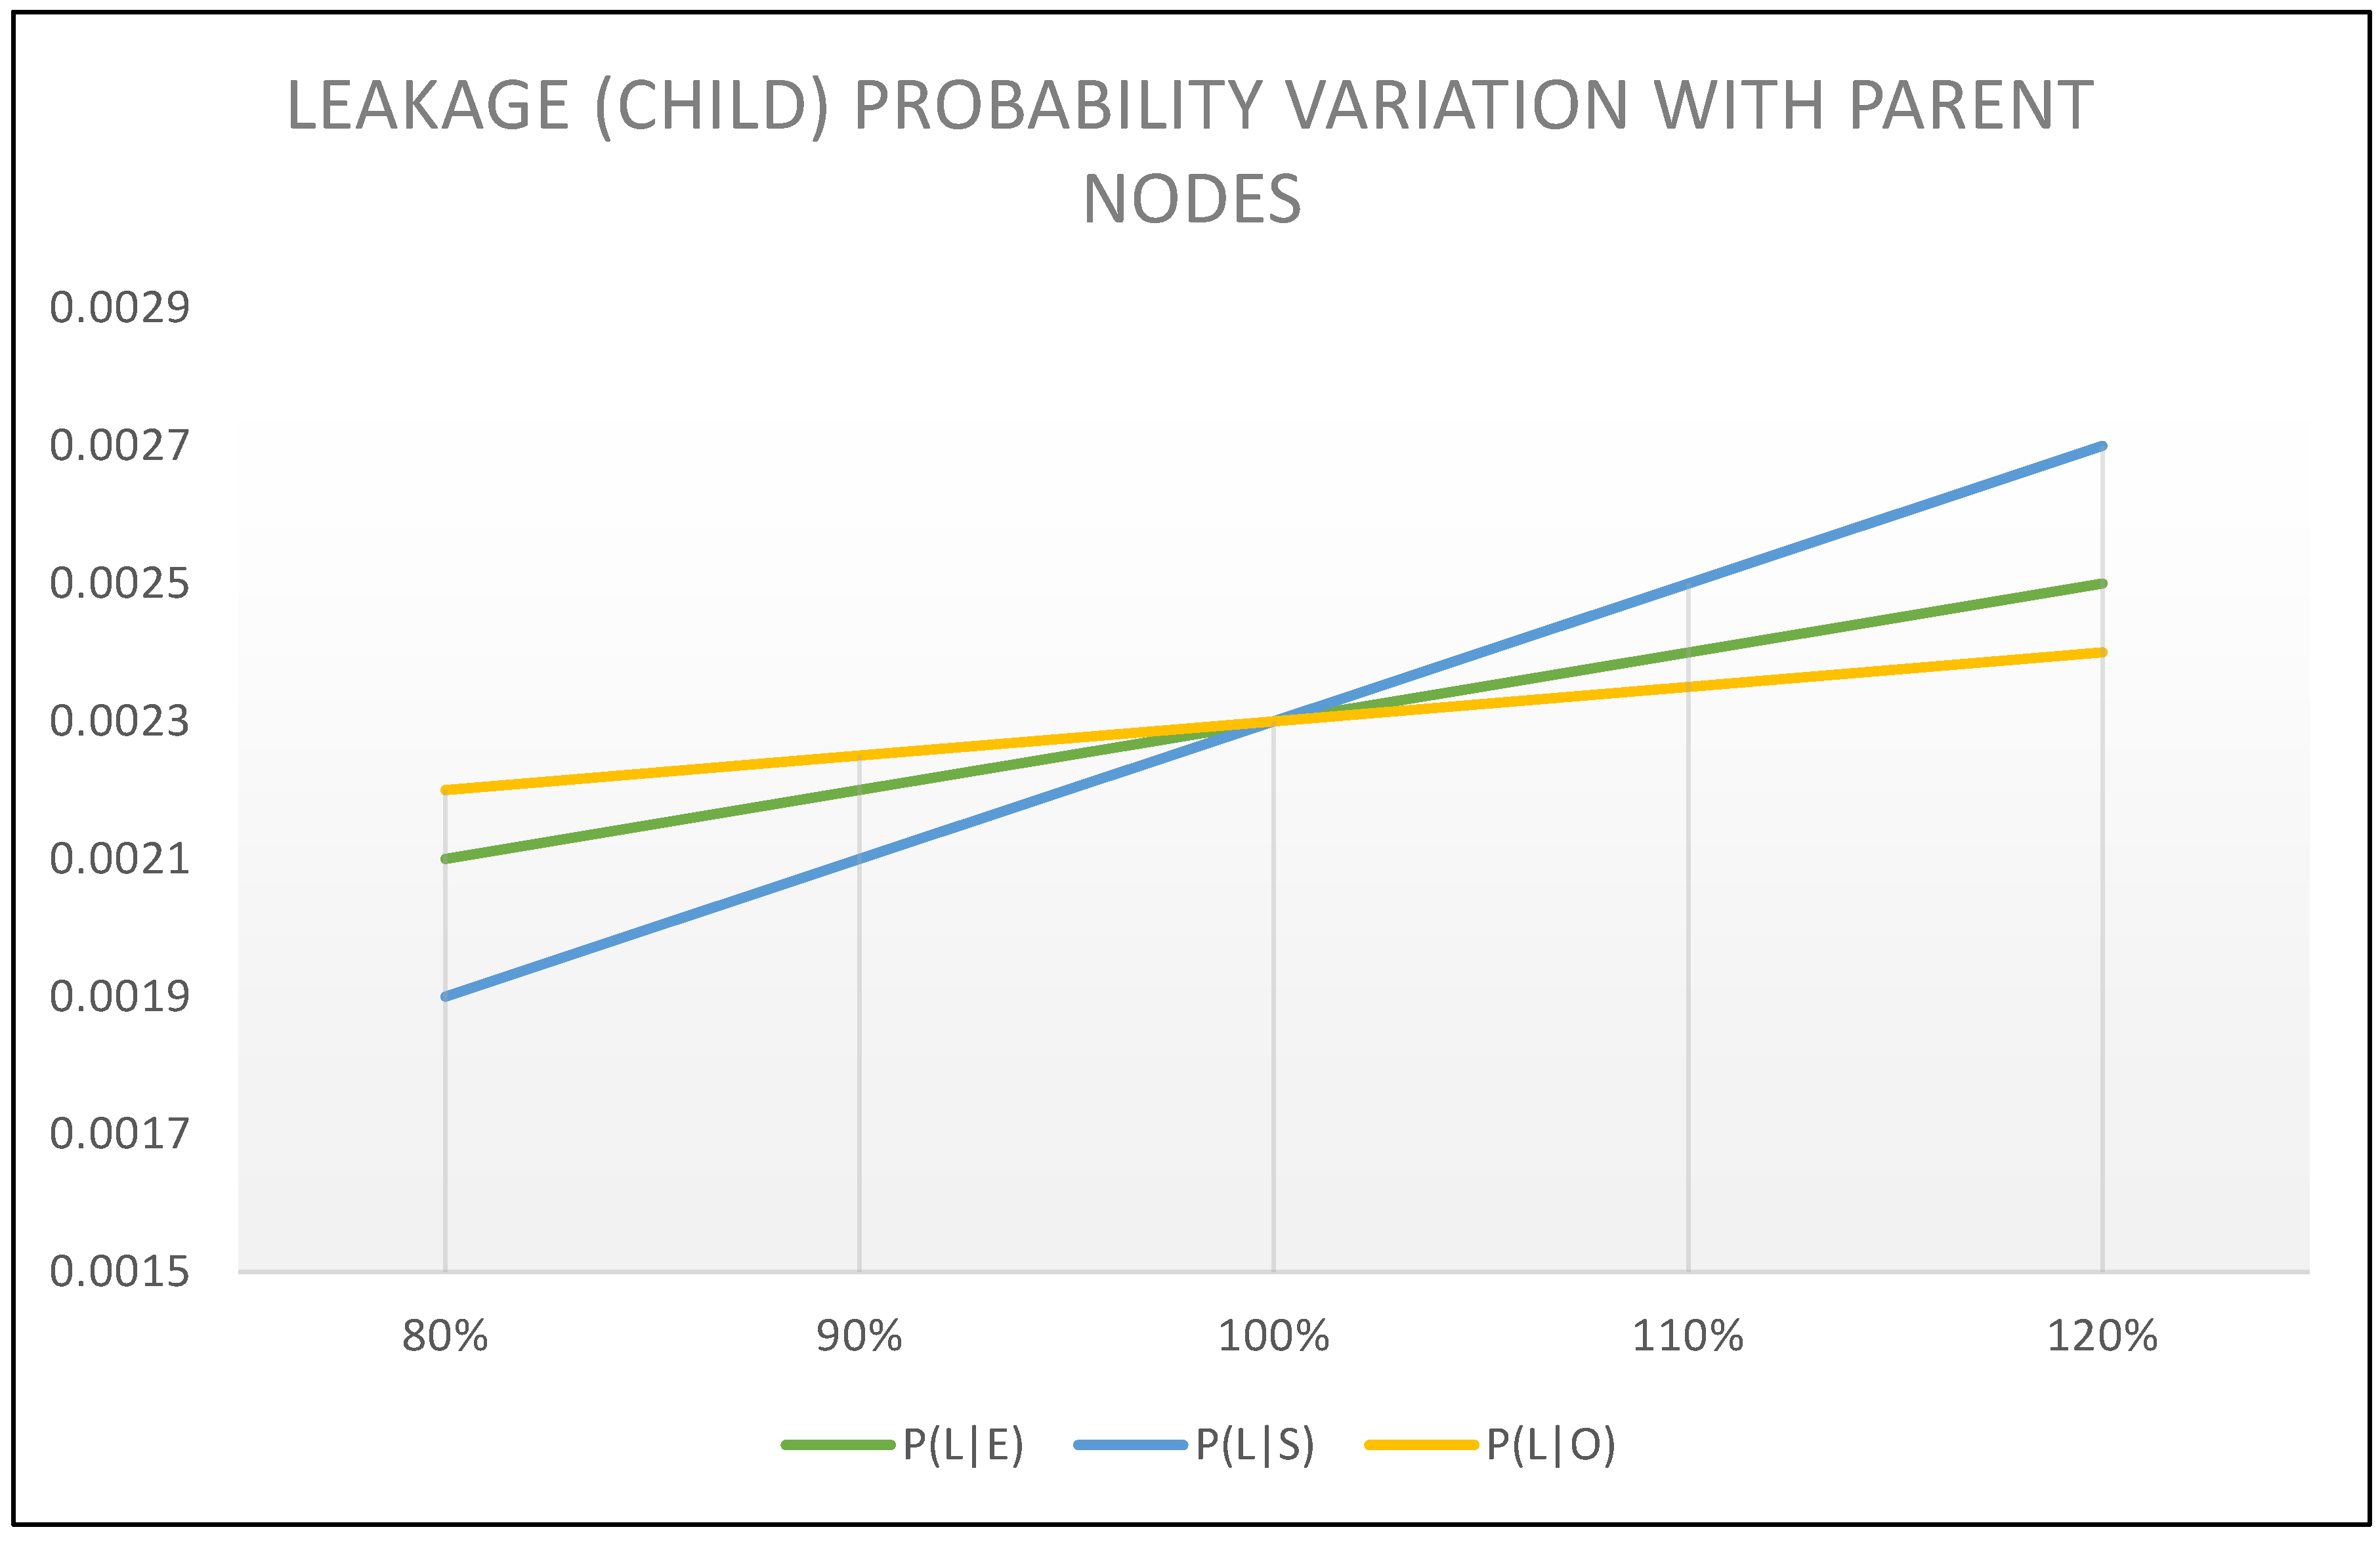
Sensitivity Analysis (SA)
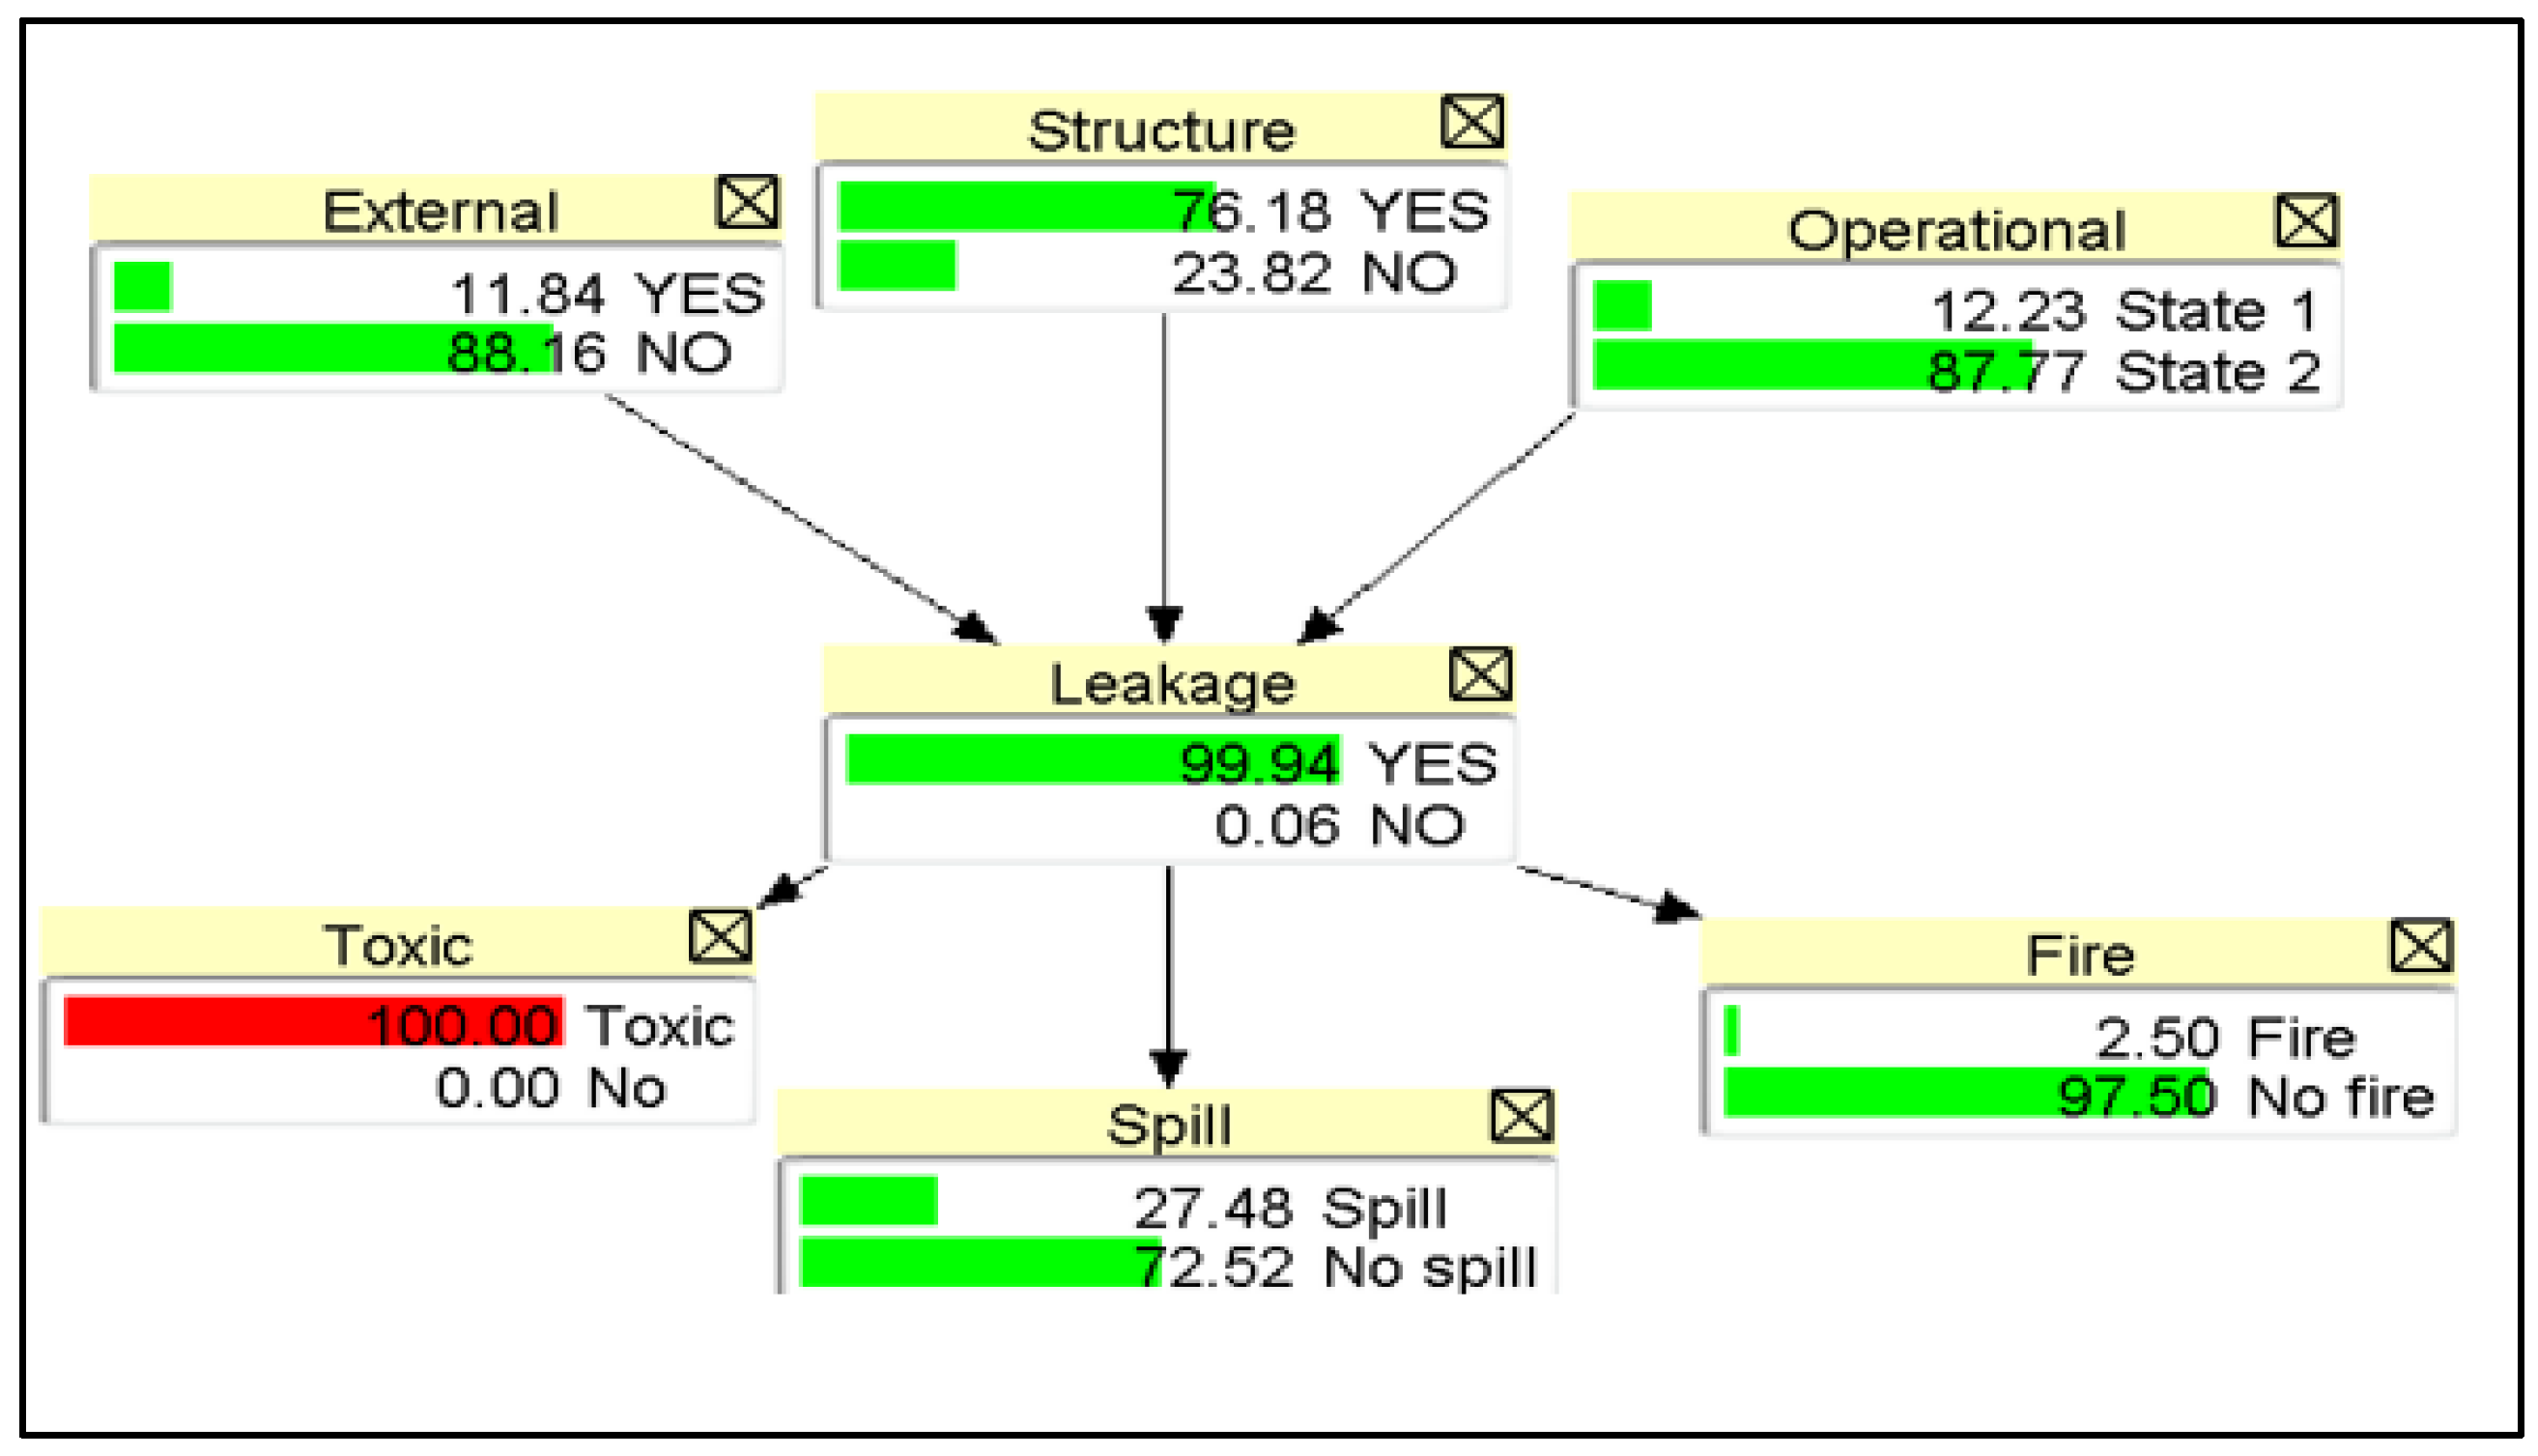
D-Separation
- i.
- Serial type (Axiom i)

- ii.
- Diverging type (Axiom ii)
- iii.
- Converging type (Axiom iii)

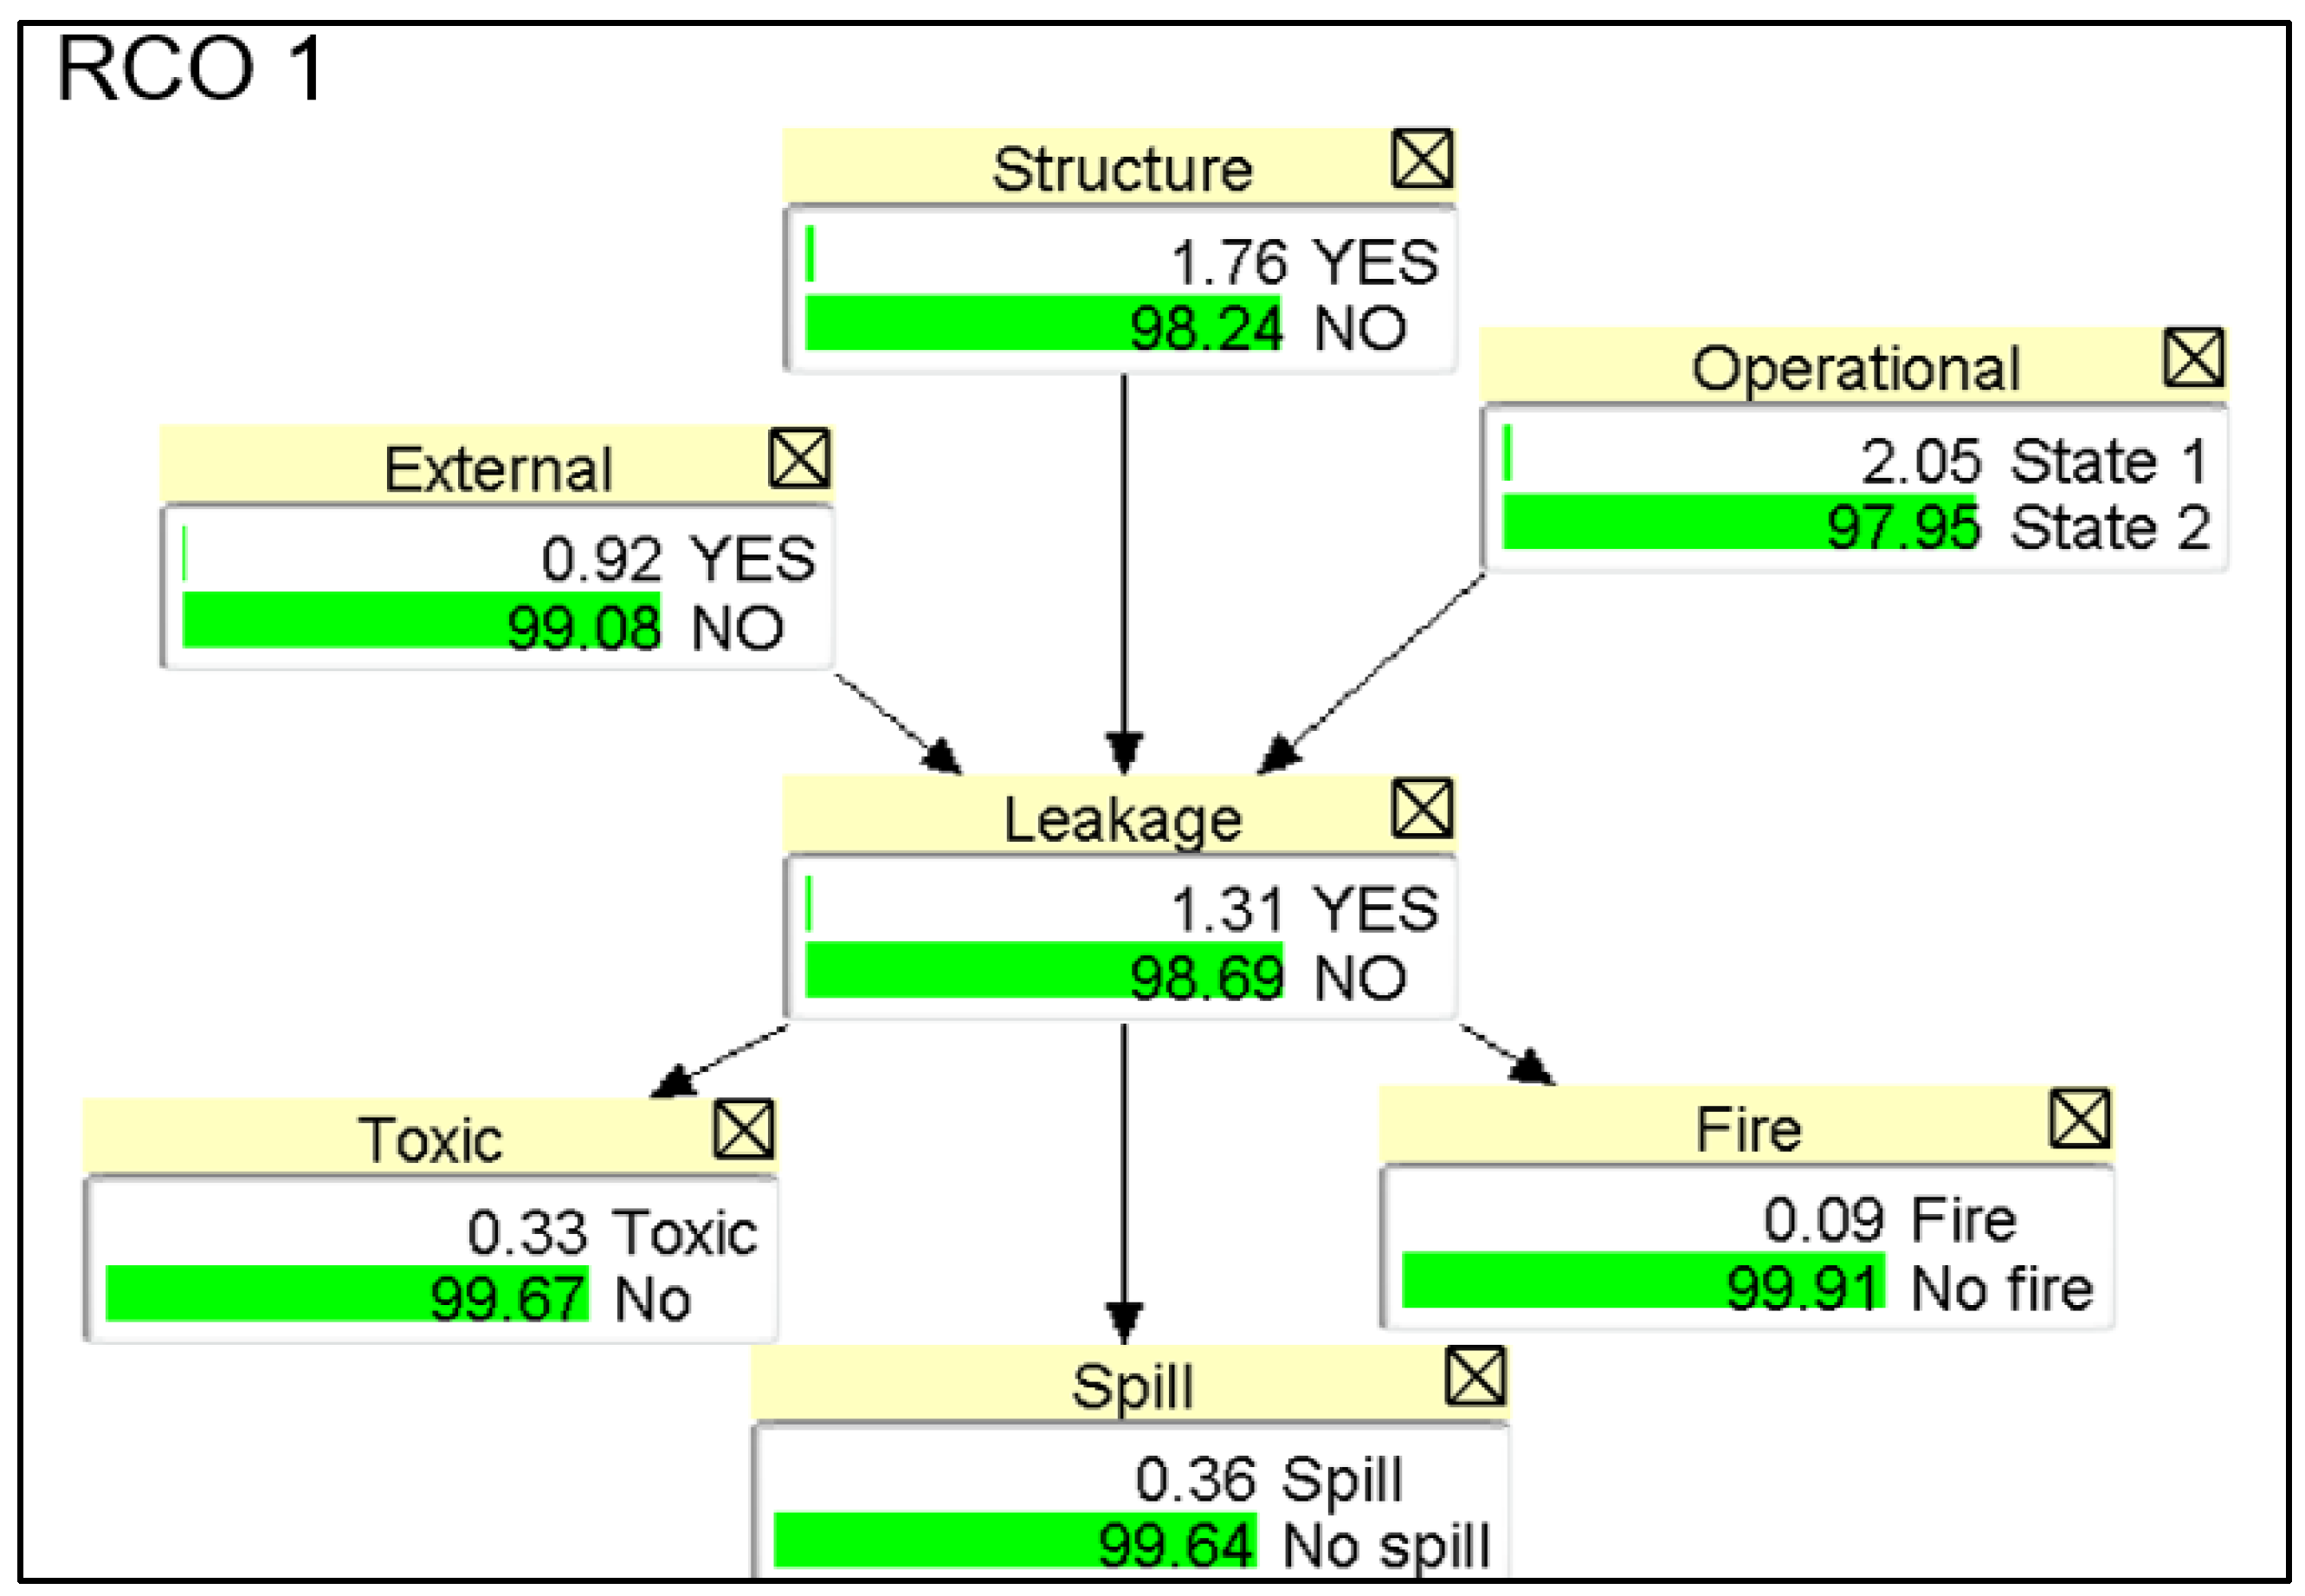
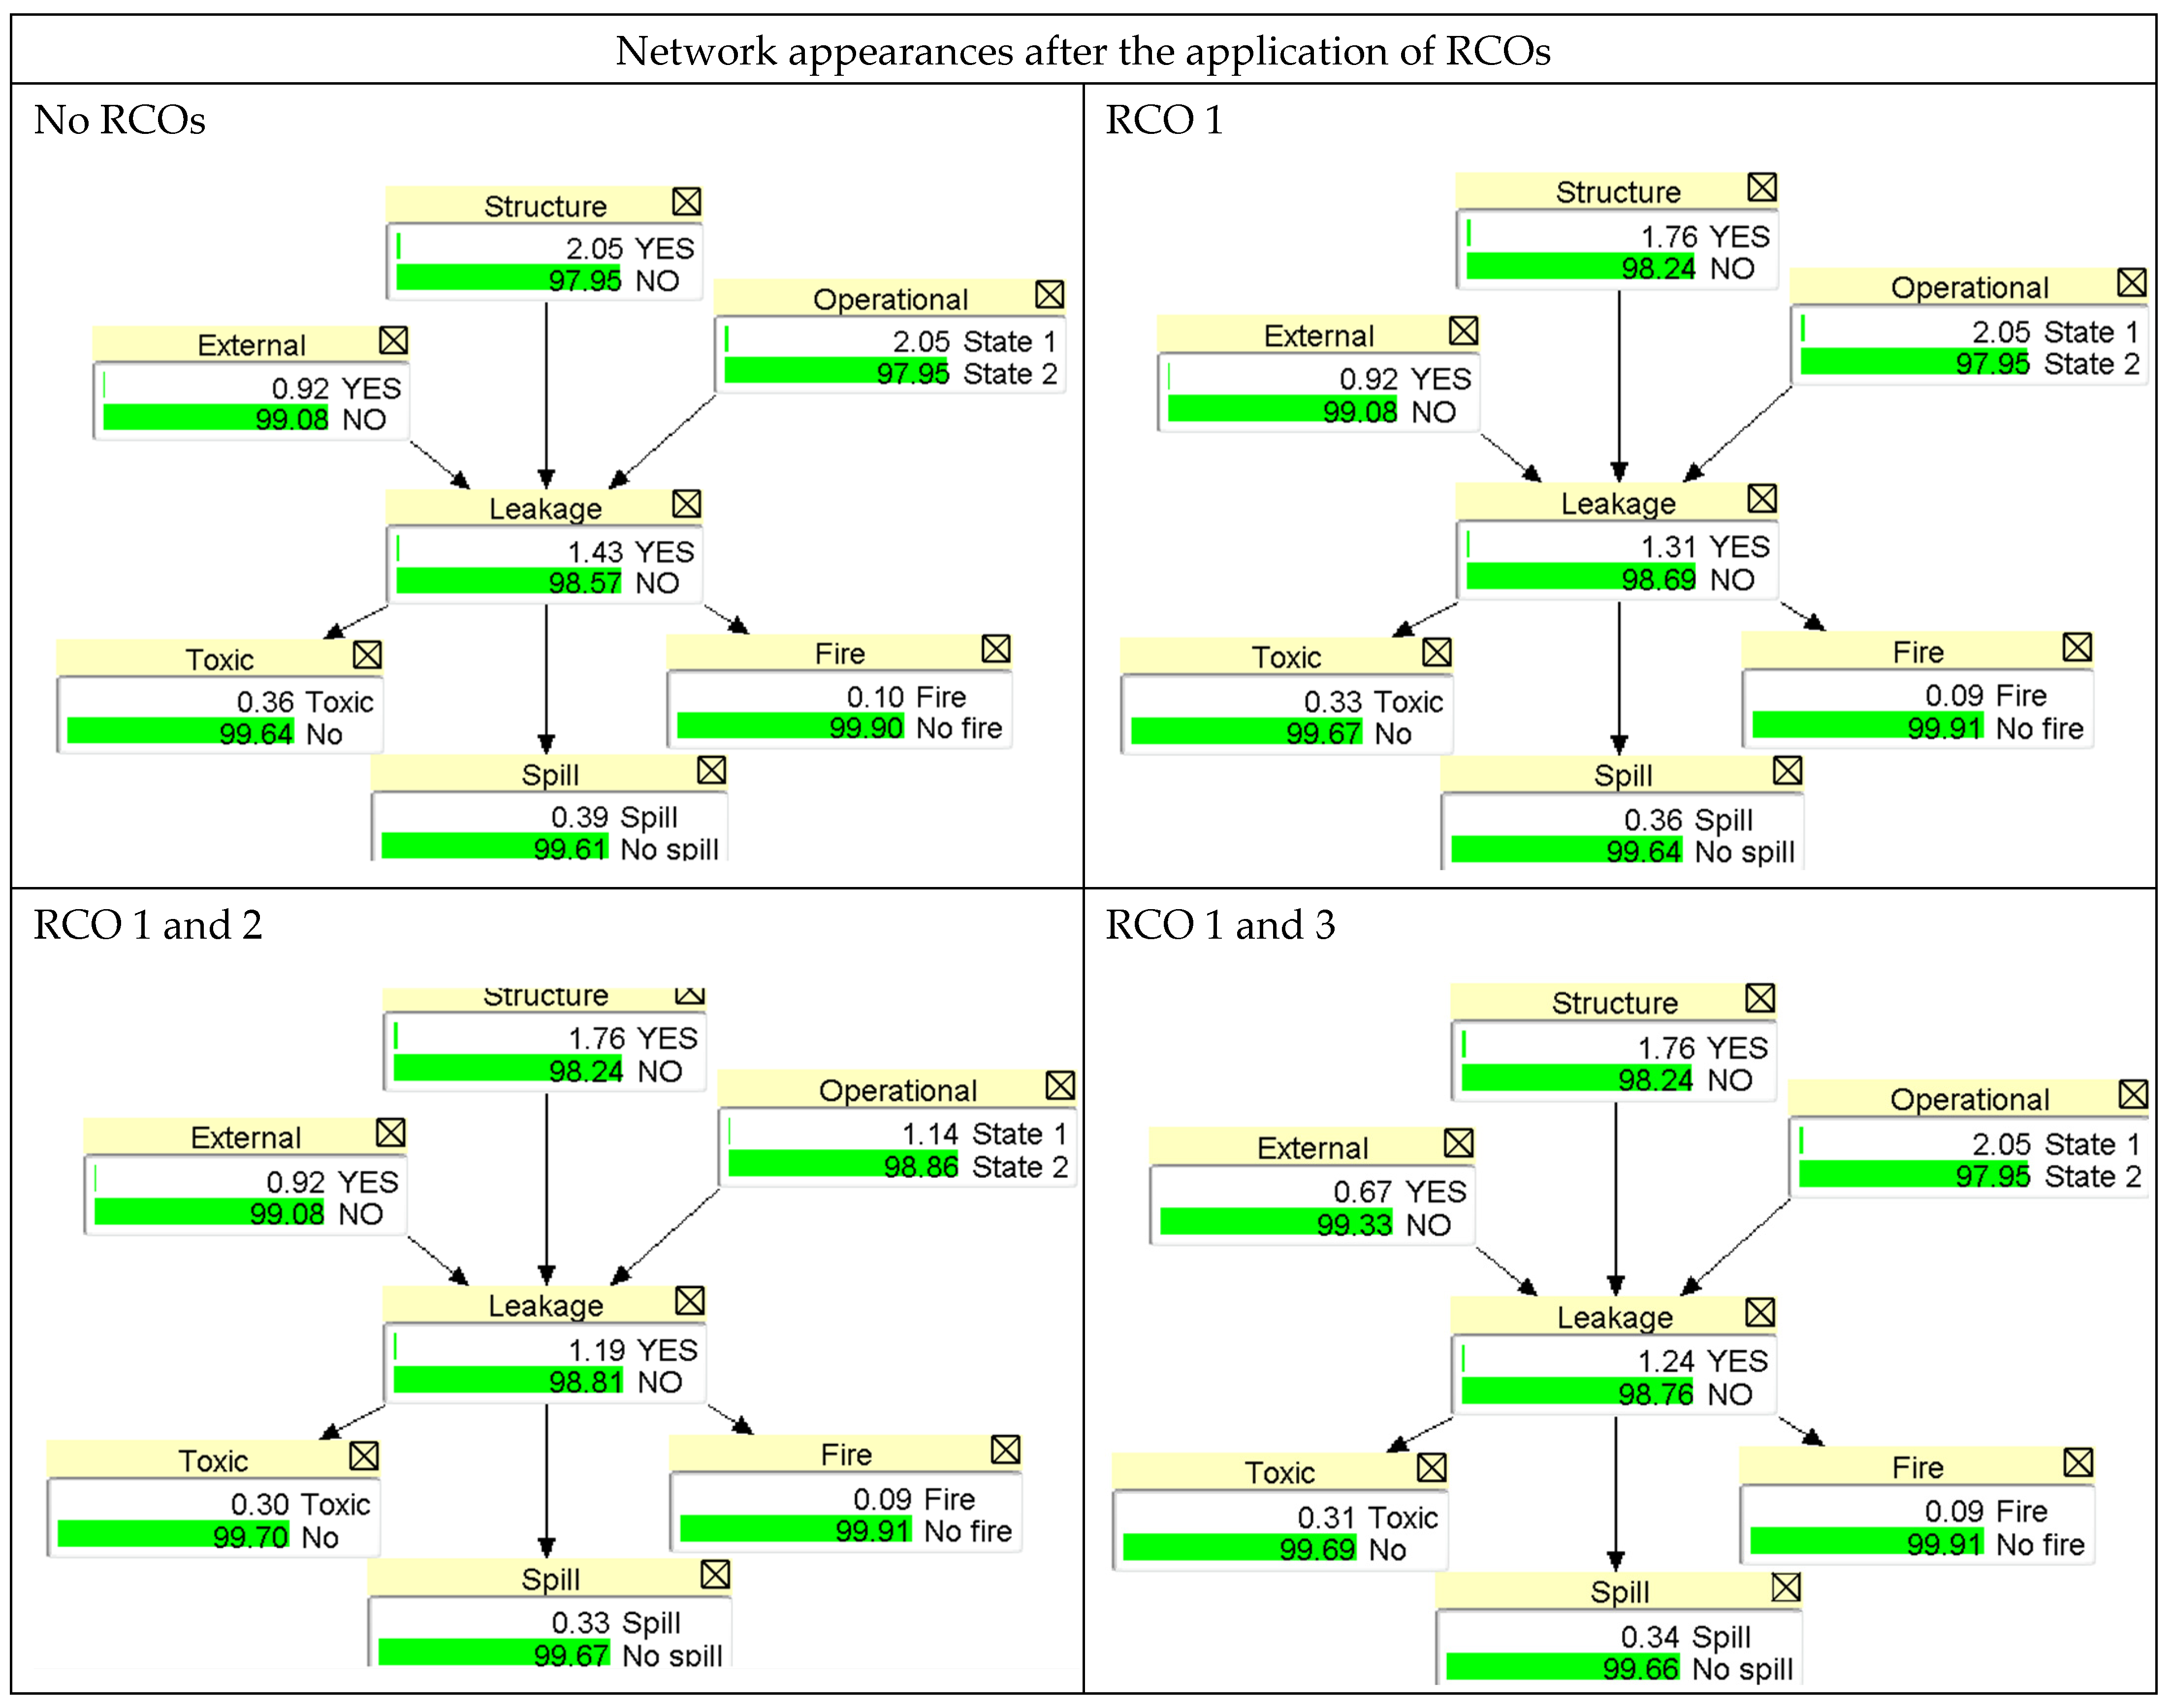
4.3.4. Risk Control Options
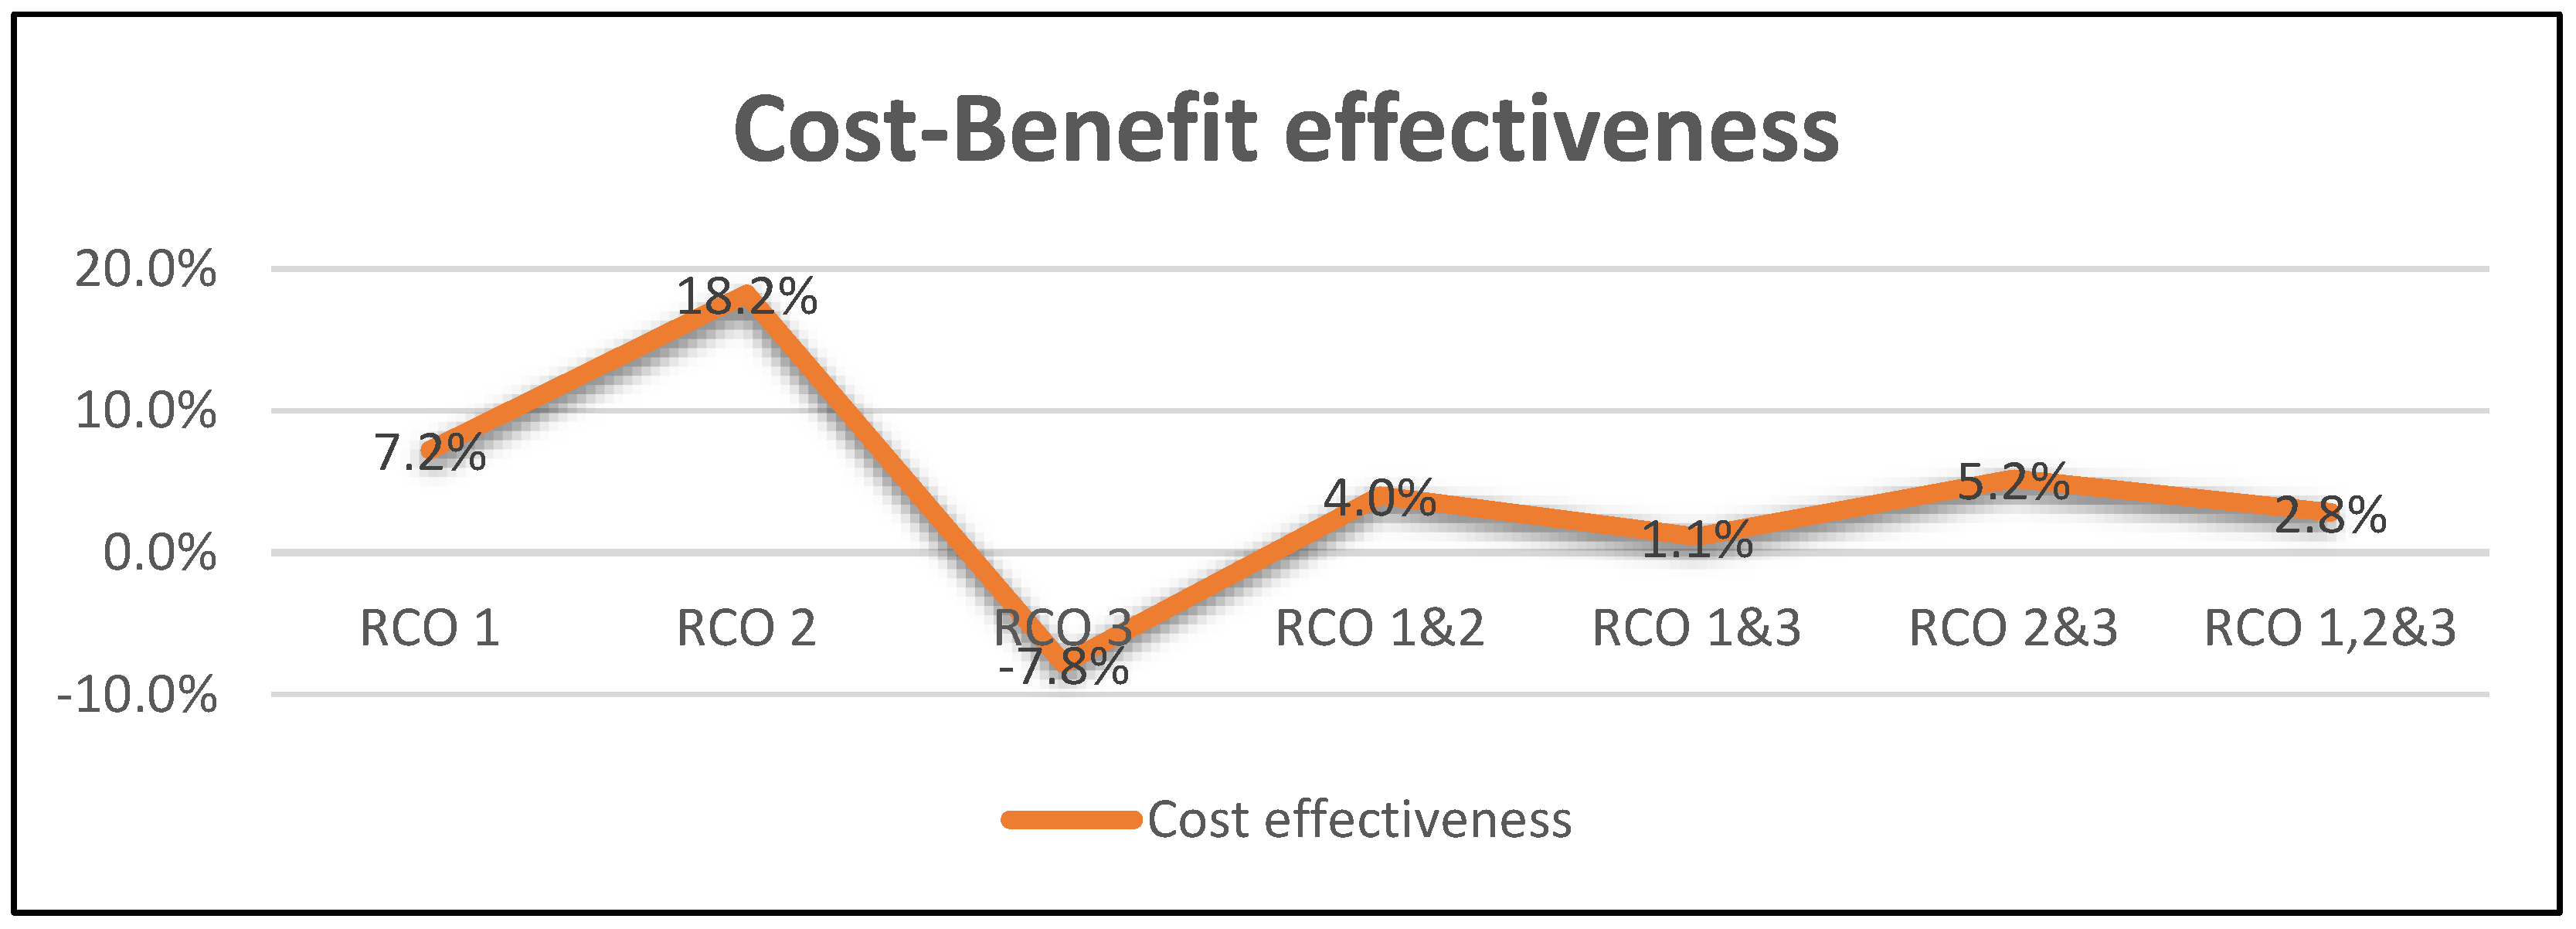
4.4. Cost–Benefit Analysis
- Human fatality: USD 3,000,000 [34];
- Spill: USD 67,275 × V0.5893 = USD 261,308 (USD 260,000);
- Fire damage: USD 5,000,000 (typical cost estimation of a major fire).
- Cost of RCO 1: USD 200,000;
- Cost of RCO 2: USD 25,000;
- Cost of RCO 3: USD 25,000.
4.5. Decision Making
5. Conclusions
Author Contributions
Funding
Data Availability Statement
Conflicts of Interest
References
- IMO. Revised GHG Reduction Strategy for Global Shipping Adopted. 2023. Available online: https://www.imo.org/en/MediaCentre/PressBriefings/pages/Revised-GHG-reduction-strategy-for-global-shipping-adopted-.aspx (accessed on 20 July 2023).
- Delft, C.E. Action, Study on methods and considerations for the determination of greenhouse gas emission reduction targets for international shipping. Publ. Off. Eur. Union Luxemb. 2019. [Google Scholar]
- Bicer, Y.; Dincer, I. Clean fuel options with hydrogen for sea transportation: A life cycle approach. Int. J. Hydrogen Energy 2018, 43, 1179–1193. [Google Scholar] [CrossRef]
- Noor, C.W.M.; Noor, M.M.; Mamat, R. Biodiesel as alternative fuel for marine diesel engine applications: A review. Renew. Sustain. Energy Rev. 2018, 94, 127–142. [Google Scholar] [CrossRef]
- Burel, F.; Taccani, R.; Zuliani, N. Improving sustainability of maritime transport through utilization of Liquefied Natural Gas (LNG) for propulsion. Energy 2013, 57, 412–420. [Google Scholar] [CrossRef]
- van Biert, L.; Godjevac, M.; Visser, K.; Aravind, P.V. A review of fuel cell systems for maritime applications. J. Power Sources 2016, 327, 345–364. [Google Scholar] [CrossRef]
- Franks, A.; Parkar, S.; Hansen, C.R. Use of quantitative risk assessment to enhance the safety of ships using ammonia as fuel. J. Saf. Sustain. 2024, 1, 127–140. [Google Scholar] [CrossRef]
- Tawalbeh, M.; Murtaza, S.Z.M.; Al-Othman, A.; Alami, A.H.; Singh, K.; Olabi, A.G. Ammonia: A versatile candidate for the use in energy storage systems. Renew. Energy 2022, 194, 955–977. [Google Scholar] [CrossRef]
- UN. Adoption of the Paris Agreement; UN: New York, NY, USA, 2015. [Google Scholar]
- IMO. Future Fuels and Technology. 2023. Available online: https://www.imo.org/en/OurWork/Environment/Pages/Future-Fuels-And-Technology.aspx (accessed on 24 July 2023).
- IMO. UN Body Adopts Climate Change Strategy for Shipping; IMO: London, UK, 2018. [Google Scholar]
- Hussain, M.; Abdelhafez, A.; Nemitallah, M.A.; Araoye, A.A.; Ben-Mansour, R.; Habib, M.A. A highly diluted oxy-fuel micromixer combustor with hydrogen enrichment for enhancing turndown in gas turbines. Appl. Energy 2020, 279, 115818. [Google Scholar] [CrossRef]
- Ditaranto, M.; Heggset, T.; Berstad, D. Concept of hydrogen fired gas turbine cycle with exhaust gas recirculation: Assessment of process performance. Energy 2020, 192, 116646. [Google Scholar] [CrossRef]
- Bradley, T.H.; Moffitt, B.A.; Mavris, D.N.; Parekh, D.E. Development and experimental characterization of a fuel cell powered aircraft. J. Power Sources 2007, 171, 793–801. [Google Scholar] [CrossRef]
- Kurien, C.; Mittal, M. Review on the production and utilization of green ammonia as an alternate fuel in dual-fuel compression ignition engines. Energy Convers. Manag. 2022, 251, 114990. [Google Scholar] [CrossRef]
- Juangsa, F.B.; Irhamna, A.R.; Aziz, M. Production of ammonia as potential hydrogen carrier: Review on thermochemical and electrochemical processes. Int. J. Hydrogen Energy 2021, 46, 14455–14477. [Google Scholar] [CrossRef]
- Parkinson, B.; Tabatabaei, M.; Upham, D.C.; Ballinger, B.; Greig, C.; Smart, S.; McFarland, E. Hydrogen production using methane: Techno-economics of decarbonizing fuels and chemicals. Int. J. Hydrogen Energy 2018, 43, 2540–2555. [Google Scholar] [CrossRef]
- Nosherwani, S.A.; Neto, R.C. Techno-economic assessment of commercial ammonia synthesis methods in coastal areas of Germany. J. Energy Storage 2021, 34, 102201. [Google Scholar] [CrossRef]
- Duong, P.A.; Ryu, B.R.; Song, M.K.; Van Nguyen, H.; Nam, D.; Kang, H. Safety Assessment of the Ammonia Bunkering Process in the Maritime Sector: A Review. Energies 2023, 16, 4019. [Google Scholar] [CrossRef]
- Adnan, M.A.; Kibria, M.G. Comparative techno-economic and life-cycle assessment of power-to-methanol synthesis pathways. Appl. Energy 2020, 278, 115614. [Google Scholar] [CrossRef]
- Garagounis, I.; Kyriakou, V.; Anagnostou, C.; Bourganis, V.; Papachristou, I.; Stoukides, M. Solid Electrolytes: Applications in Heterogeneous Catalysis and Chemical Cogeneration. Ind. Eng. Chem. Res. 2011, 50, 431–472. [Google Scholar] [CrossRef]
- Pickett, C.J.; Talarmin, J. Electrosynthesis of ammonia. Nature 1985, 317, 652–653. [Google Scholar] [CrossRef]
- Huang, J.; Fan, H.; Xu, X.; Liu, Z. Life Cycle Greenhouse Gas Emission Assessment for Using Alternative Marine Fuels: A Very Large Crude Carrier (VLCC) Case Study. J. Mar. Sci. Eng. 2022, 10, 1969. [Google Scholar] [CrossRef]
- Zhang, Y.; Liu, H.; Li, J.; Deng, Y.; Miao, X.; Xu, D.; Liu, S.; Xie, K.; Tian, Y. Life cycle assessment of ammonia synthesis in China. Int. J. Life Cycle Assess. 2022, 27, 50–61. [Google Scholar] [CrossRef]
- Ni, S.; Zhao, D.; You, Y.; Huang, Y.; Wang, B.; Su, Y. NOx emission and energy conversion efficiency studies on ammonia-powered micro-combustor with ring-shaped ribs in fuel-rich combustion. J. Clean. Prod. 2021, 320, 128901. [Google Scholar] [CrossRef]
- Saika, T.; Nakamura, M.; Nohara, T.; Ishimatsu, S. Study of Hydrogen Supply System with Ammonia Fuel. JSME Int. J. Ser. B Fluids Therm. Eng. 2006, 49, 78–83. [Google Scholar] [CrossRef]
- Bae, S.; Lee, J.; Wilailak, S.; Lee, G.; Lee, C. Design-based risk assessment on an ammonia-derived urban hydrogen refueling station. Int. J. Energy Res. 2022, 46, 12660–12673. [Google Scholar] [CrossRef]
- Fecke, M.; Garner, S.; Cox, B. Review of Global Regulations for Anhydrous Ammonia Production, Use, and Storage. Inst. Chem. Eng. Symp. Ser. 2016, 2016, 1–11. [Google Scholar]
- ARIA. Accidents Involved with Ammonia; ARIA: Las Vegas, NV, USA, 2013. [Google Scholar]
- Technicalsafetybc, Case Study: Ammonia Release Incidents (2007–2017). 2019. Available online: https://www.ipe.org/docs/default-source/refrigeration/bc/sos_2016_casestudy_ammonia_final.pdf?sfvrsn=fc5315d1_0 (accessed on 24 July 2023).
- Franks, A.P. Quantitative Risk Assessment of Ammonia-Fuelled Vessels. 2022. Available online: https://www.lr.org/en/knowledge/research-reports/2022/conference-paper-quantitative-risk-assessment-of-ammonia-fuelled-vessels/ (accessed on 24 July 2023).
- Pillay, A.; Wang, J. Chapter 5 Formal safety assessment. In Elsevier Ocean Engineering Series; Pillay, A., Wang, J., Eds.; Elsevier: Amsterdam, The Netherlands, 2003; pp. 81–115. [Google Scholar]
- IMO. Formal Safety Assessment. 2019. Available online: https://www.imo.org/en/OurWork/Safety/Pages/FormalSafetyAssessment.aspx (accessed on 18 July 2023).
- IMO. Revised Guidelines for Formal Safety Assessment (FSA) for Use in the IMO Rule-Making Process; IMO: London, UK, 2018. [Google Scholar]
- Wang, J. Offshore safety case approach and formal safety assessment of ships. J. Saf. Res. 2002, 33, 81–115. [Google Scholar] [CrossRef] [PubMed]
- IMO. 83/21/1 FSA for Liquefied Natural Gas (LNG) Carriers. 2007. Available online: https://docplayer.net/4729415-Imo-formal-safety-assessment-fsa-liquefied-natural-gas-lng-carriers-details-of-the-formal-safety-assessment-submitted-by-denmark.html (accessed on 18 July 2023).
- IMO. MSC 83/21/2 Formal Safety Assessment for a for Container Vessels. 2007. Available online: http://martrans.org/documents/2011/fsa/MSC_83-21-2.pdf (accessed on 21 July 2023).
- IMO. MEPC 58/17/2, FSA for Crude Oil Tankers. 2008. Available online: http://martrans.org/documents/2011/fsa/MEPC%2058-17-2.pdf (accessed on 30 July 2023).
- IMO. MSC 85/17/1, FSA for Cruise Ships. 2008. Available online: http://martrans.org/documents/2011/fsa/MSC_85-17-1.pdf (accessed on 15 July 2023).
- IMO. MSC 85/INF.3, FSA for RoPax Ships. 2008. Available online: http://martrans.org/documents/2011/fsa/MSC_85-INF-3.pdf (accessed on 24 July 2023).
- IMO. MSC87 /18/1, FSA for Transport of Hazardous Cargoes for Open Top Containerships. 2009. Available online: http://martrans.org/documents/2011/fsa/MSC87-18-1.pdf (accessed on 24 July 2023).
- Yeo, S.; Jeong, B.; Lee, W.-J. Improved formal safety assessment methodology using fuzzy TOPSIS for LPG-fueled marine engine system. Ocean Eng. 2023, 269, 113536. [Google Scholar] [CrossRef]
- Agamy, K.; Youssef, S.; Abdelkader, S. Hazard identification for self-unloading bulk carriers. Ships Offshore Struct. 2022, 18, 1104–1115. [Google Scholar] [CrossRef]
- Psaraftis, H.N. Formal Safety Assessment: An updated review. J. Mar. Sci. Technol. 2012, 17, 390–402. [Google Scholar] [CrossRef]
- Njumo, D.A. Fault Tree Analysis (Fta)—Formal Safety Assessment (Fsa) in Ship Repair Industry a Made Easy Approach. Int. J. Marit. Eng. 2013, 155, A23–A32. [Google Scholar] [CrossRef]
- American Institute of Chemical Engineers. Guidelines for Hazard Evaluation Procedures, 3rd ed.; Wiley-Interscience: Hoboken, NJ, USA, 2008. [Google Scholar]
- Pearl, J. Chapter 2—Bayesian Inference. In Probabilistic Reasoning in Intelligent Systems; Pearl, J., Ed.; Morgan Kaufmann: San Francisco, CA, USA, 1988; pp. 29–75. [Google Scholar]
- Riahi, R. Enabling Security and Risk-Based Operation of Container Line Supply Chains Under High Uncertainties. Ph.D. Thesis, Liverpool John Moores University, Liverpool, UK, 2010. [Google Scholar]
- Hugin Expert. A/S. 1989. Available online: https://www.hugin.com/ (accessed on 22 March 2023).
- Yang, Z.; Yang, Z.; Smith, J.; Robert, B.A.P. Risk analysis of bicycle accidents: A Bayesian approach. Reliab. Eng. Syst. Saf. 2021, 209, 107460. [Google Scholar] [CrossRef]
- Jones, B.; Jenkinson, I.; Yang, Z.; Wang, J. The use of Bayesian network modelling for maintenance planning in a manufacturing industry. Reliab. Eng. Syst. Saf. 2010, 95, 267–277. [Google Scholar] [CrossRef]
- Cintron, D.W. Bayesian networks. In International Encyclopedia of Education, 4th ed.; Tierney, R.J., Rizvi, F., Ercikan, K., Eds.; Elsevier: Oxford, UK, 2023; pp. 119–129. [Google Scholar]
- Lee, S.-H.; Yang, K.-M.; Cho, S.-B. Integrated modular Bayesian networks with selective inference for context-aware decision making. Neurocomputing 2015, 163, 38–46. [Google Scholar] [CrossRef]


| Deviation | Cause | Consequences | Actions Required |
|---|---|---|---|
| External Events | Collision Grounding Falling heavy object from the shore crane Terrorist attack | Damage to the storage tank, pipes, and fittings | All ammonia piping on the deck should be fitted with guards to avoid external damage |
| Structural failure | Material failures Defects in the fittings Design failures | Damage to the storage tank, pipes, and fittings | All piping on the deck is covered with a gas-tight enclosure |
| Operational error | Overfilling Wrong valve setting Maintaining incorrect temperatures | Damage to the storage tank, pipes, and fittings | Carry out regular crew training Maintain sufficient competent crew onboard Follow ship-specific procedures |
| CP | Probability |
|---|---|
| P(leakage = ‘yes’|Structural fail = ‘yes’), P(L|S) | 0.4420 |
| P(leakage = ‘yes’|External event = ‘yes’), P(L|E) | 0.2878 |
| P(leakage = ‘yes’|Operational error = ‘yes’), P(L|O) | 0.1310 |
| Scenario 1 | P (1) | = 1 − [(1 − X) (1 − Y) (1 − Z)] |
| P (2) | = 1 − P (1) | |
| Scenario 2 | P (3) | =1 − [(1 − X) (1 − Y) (1 − 0)] |
| P (4) | = 1 − P (3) | |
| Scenario 3 | P (5) | = 1 − [(1 − X) (1 − 0) (1 − Z)] = X + Z − X×Z |
| P (6) | = 1 − P (5) | |
| Scenario 4 | P (7) | = 1 − [(1 − X) (1 − 0) (1 − 0)] = X |
| P (8) | = 1 − P (7) | |
| Scenario 5 | P (9) | = 1 − [(1 − 0) (1 − Y) (1 − Z)] = Y + Z − Y × Z |
| P (10) | = 1 − P (9) | |
| Scenario 6 | P (11) | = 1 − [(1 − 0) (1 − Y) (1 − 0)] = Y |
| P (12) | = 1 − P (11) | |
| Scenario 7 | P (13) | = 1 − [(1 − 0) (1 − 0) (1 − Z)] = P (Z) |
| P (14) | = 1 − P (13) | |
| Scenario 8 | P (15) | = 1 − [(1 − 0) (1 − 0) (1 − 0)] = 0 |
| P (16) | = 1 |
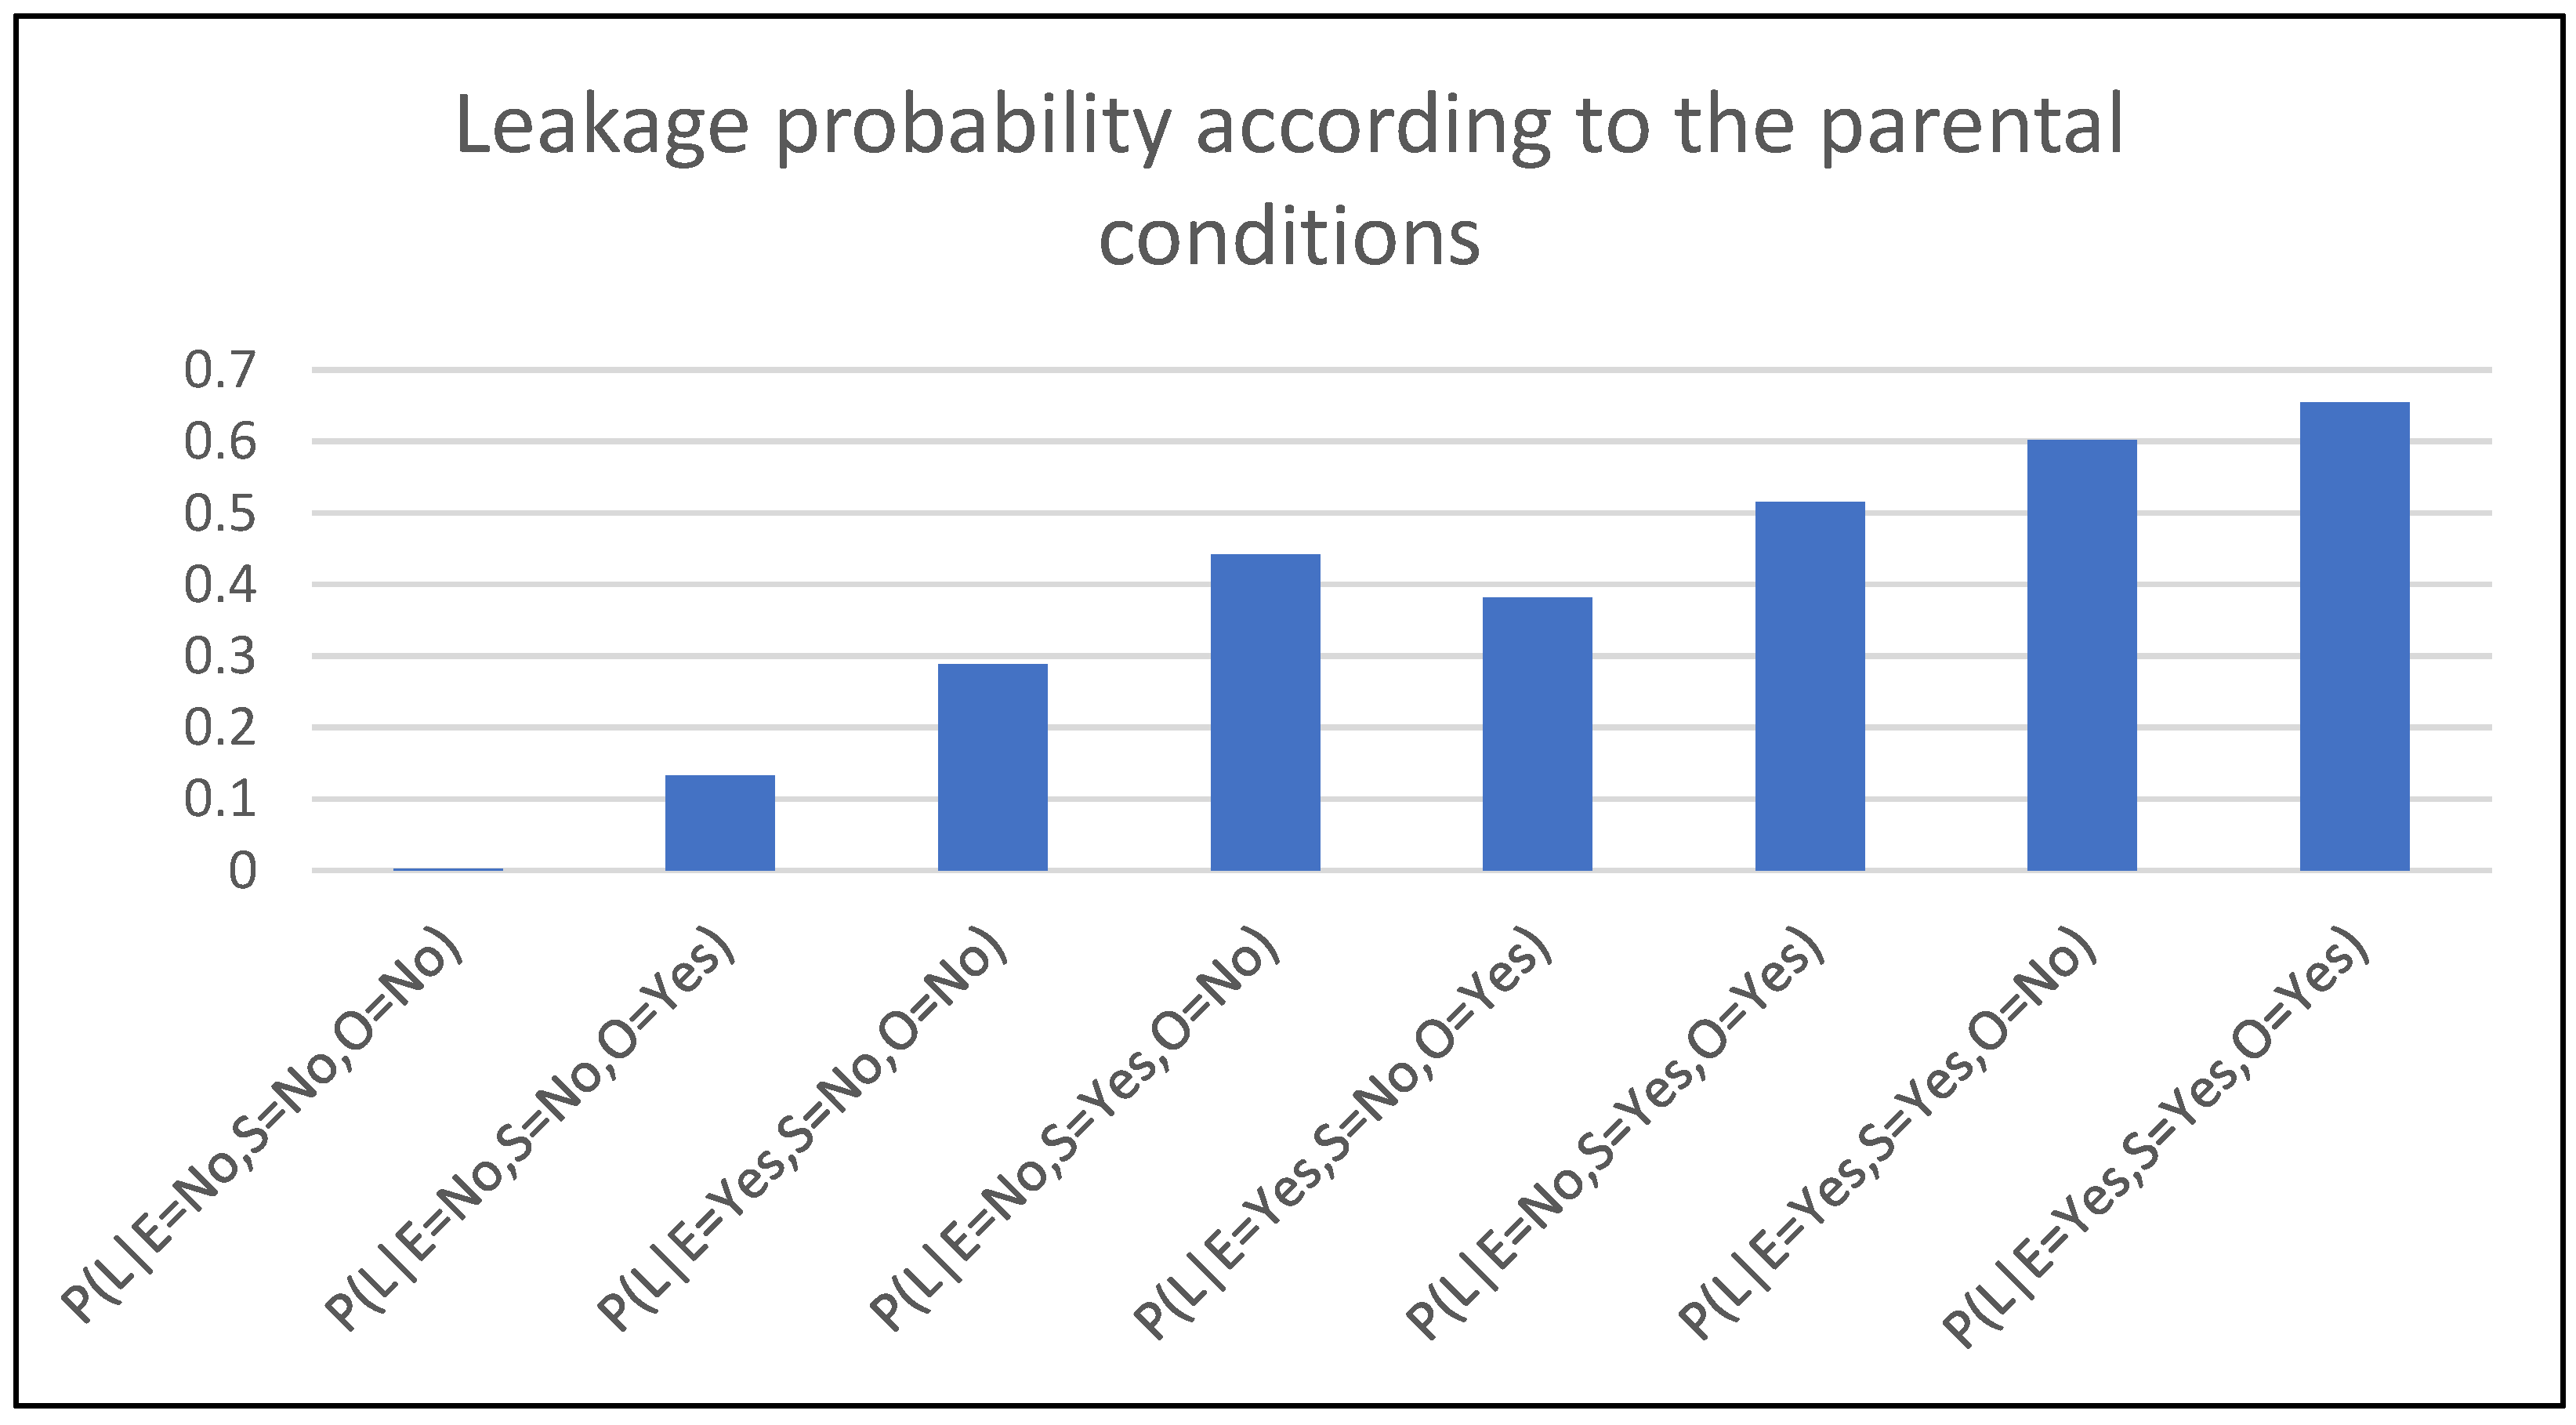
| External (E) | Yes | No | |||||||
|---|---|---|---|---|---|---|---|---|---|
| Structure (S) | Yes | No | Yes | No | |||||
| Operational (O) | Yes | No | Yes | No | Yes | No | Yes | No | |
| Leakage (L) | Yes | P(1) 0.6547 | P(3) 0.6026 | P(5) 0.3811 | P(7) 0.2878 | P(9) 0.5151 | P(11) 0.4420 | P(13) 0.1310 | P(15) 0.0000 |
| No | P(2) 0.3453 | P(4) 0.3974 | P(6) 0.6189 | P(8) 0.7122 | P(10) 0.4849 | P(12) 0.5580 | P(14) 0.8690 | P(16) 1.0000 | |
| 80% | 90% | 100% | 110% | 120% | |
|---|---|---|---|---|---|
| P(L|E) | 0.0021 | 0.0022 | 0.0023 | 0.0024 | 0.0025 |
| P(L|S) | 0.0019 | 0.0021 | 0.0023 | 0.0025 | 0.0027 |
| P(L|O) | 0.0022 | 0.0023 | 0.0023 | 0.0024 | 0.0024 |
| Failure Mode | Prior Failure Rate | RCO Application | Posterior Failure Rate |
|---|---|---|---|
| Structural | 0.0205 | RCO 1 | 0.0176 |
| Operational | 0.0205 | RCO 2 | 0.0114 |
| External | 0.0092 | RCO 3 | 0.0067 |
| Posterior Probability of Consequences with RCOs | ||||||||
|---|---|---|---|---|---|---|---|---|
| Consequences of Leakage | Prior Probability | RCO 1 | RCO 2 | RCO 3 | RCOs 1 and 2 | RCOs 1 and 3 | RCOs 2 and 3 | RCOs 1, 2, and 3 |
| Toxic | 0.0055 | 0.0033 | 0.0052 | 0.0053 | 0.0030 | 0.0031 | 0.0050 | 0.0028 |
| Spill | 0.0060 | 0.0036 | 0.0057 | 0.0058 | 0.0033 | 0.0034 | 0.0055 | 0.0031 |
| Fire | 0.0016 | 0.0009 | 0.0015 | 0.0015 | 0.0009 | 0.0009 | 0.0014 | 0.0008 |
| Probability Reduction Due to RCO | |||||||
|---|---|---|---|---|---|---|---|
| Consequences of Leakage | RCO 1 | RCO 2 | RCO 3 | RCOs 1 and 2 | RCOs 1 and 3 | RCOs 2 and 3 | RCOs 1, 2, and 3 |
| Toxic | 0.0022 | 0.0003 | 0.0002 | 0.0025 | 0.0024 | 0.0005 | 0.0027 |
| Spill | 0.0024 | 0.0003 | 0.0002 | 0.0027 | 0.0026 | 0.0005 | 0.0029 |
| Fire | 0.0007 | 0.0001 | 0.0001 | 0.0007 | 0.0007 | 0.0002 | 0.0008 |
| Consequences of Leakage | Financial Benefit per Year Due to RCOs | ||||||
|---|---|---|---|---|---|---|---|
| RCO 1 | RCO 2 | RCO 3 | RCO 1 and 2 | RCO 1 and 3 | RCO 2 and 3 | RCO 1, 2, and 3 | |
| Toxic | USD 6600 | USD 900 | USD 600 | USD 7500 | USD 7200 | USD 1500 | USD 8100 |
| Spill | USD 624 | USD 78 | USD 52 | USD 702 | USD 676 | USD 130 | USD 754 |
| Fire | USD 3500 | USD 500 | USD 500 | USD 3500 | USD 3500 | USD 1000 | USD 4000 |
| Total benefit | USD 10,724 | USD 1478 | USD 1152 | USD 11,702 | USD 11,376 | USD 2630 | USD 12,854 |
| RCO 1 | RCO 2 | RCO 3 | RCO 1 and 2 | RCO 1 and 3 | RCO 2 and 3 | RCO 1, 2, and 3 | |
|---|---|---|---|---|---|---|---|
| Total RCO cost for 20 years | USD 200,000 | USD 25,000 | USD 25,000 | USD 225,000 | USD 225,000 | USD 50,000 | USD 250,000 |
| Cost per year | USD 10,000 | USD 1250 | USD 1250 | USD 11,250 | USD 11,250 | USD 2500 | USD 12,500 |
| Benefit per year | USD 10,724 | USD 1478 | USD 1152 | USD 11,702 | USD 11,376 | USD 2630 | USD 12,854 |
| Actual benefit per year | USD 724 | USD 228 | USD 98 | USD 452 | USD 126 | USD 130 | USD 354 |
| Cost effectiveness | 7.2% | 18.2% | −7.8% | 4.0% | 1.1% | 5.2% | 2.8% |
Disclaimer/Publisher’s Note: The statements, opinions and data contained in all publications are solely those of the individual author(s) and contributor(s) and not of MDPI and/or the editor(s). MDPI and/or the editor(s) disclaim responsibility for any injury to people or property resulting from any ideas, methods, instructions or products referred to in the content. |
© 2025 by the authors. Licensee MDPI, Basel, Switzerland. This article is an open access article distributed under the terms and conditions of the Creative Commons Attribution (CC BY) license (https://creativecommons.org/licenses/by/4.0/).
Share and Cite
Lankahaluge, A.S.; Graham, T.; Wang, H.; Bashir, M.; Blanco-Davis, E.; Wang, J. Formal Safety Assessment for Ammonia Fuel Storage Onboard Ships Using Bayesian Network. J. Mar. Sci. Eng. 2025, 13, 768. https://doi.org/10.3390/jmse13040768
Lankahaluge AS, Graham T, Wang H, Bashir M, Blanco-Davis E, Wang J. Formal Safety Assessment for Ammonia Fuel Storage Onboard Ships Using Bayesian Network. Journal of Marine Science and Engineering. 2025; 13(4):768. https://doi.org/10.3390/jmse13040768
Chicago/Turabian StyleLankahaluge, Amanda Sankalpa, Tony Graham, Huanxin Wang, Musa Bashir, Eddie Blanco-Davis, and Jin Wang. 2025. "Formal Safety Assessment for Ammonia Fuel Storage Onboard Ships Using Bayesian Network" Journal of Marine Science and Engineering 13, no. 4: 768. https://doi.org/10.3390/jmse13040768
APA StyleLankahaluge, A. S., Graham, T., Wang, H., Bashir, M., Blanco-Davis, E., & Wang, J. (2025). Formal Safety Assessment for Ammonia Fuel Storage Onboard Ships Using Bayesian Network. Journal of Marine Science and Engineering, 13(4), 768. https://doi.org/10.3390/jmse13040768