1. Introduction
IODP Ex. 323 recovered 5741 m of Quaternary and Pliocene deep-sea sediments from seven sites in the Bering Sea (
Figure 1) [
1]. These sediments provide the longest-duration and highest-resolution record of oceanographic and environmental variability adjacent to Alaska and eastern Siberia ever recovered [
1]. Four of these sites (U1339, U1343, U1344, and U1345) are situated along the northern margin of the Bering Sea and are termed the Bering Slope sites (
Figure 1), while three of the sites are situated along the deep-sea Bowers Ridge (
Figure 1). The Bering Sea slope sites are situated adjacent to deep-sea canyons that occur along the margin of the northern Bering Sea shelf. All the Bering Slope sites have sediment accumulation rates about three times that of the Bowers Ridge sites. These clastic sediments are derived from the continental shelf and slope. Shipboard studies [
1] and subsequent sedimentologic studies [
2,
3] identified a dramatic bimodal pattern to the sedimentation. Magnetic susceptibility changes occur on a decimeter scale (
Figure 2) that must be related to glacial/interglacial alternations in local climate. One focus of early post-cruise studies was to determine whether intervals of enhanced clastic content at the Bering Slope sites reflect ice sheet expansion (stadials/glacials) or increased runoff (interstadials/interglacials).
Two studies [
4,
5] have developed oxygen isotope stratigraphies that delineate marine isotope stages (MIS) for sites 1343 and 1345. We [
2] have also developed an initial magnetic chronostratigraphy for all the sites using rock magnetic correlations and relative paleointensity dating. These chronologies indicated that the high magnetic susceptibility intervals are largely associated with interstadial/interglacial time intervals.
Several more recent studies [
6,
7,
8,
9] have developed high-resolution paleomagnetic secular variation (PSV) records for slope sites U1343, U1344, and U1345 (58–60° N) for the last ~400 ky. These studies have used the previously published [
4,
5] oxygen isotope records to delineate MIS 1–11 boundaries. They have also used the relative paleointensity variability developed as part of their PSV records and correlation to the oxygen isotope-dated PISO-1500 global paleointensity record [
10] to further refine that chronostratigraphy at the sub-stage level. The composite chronostratigraphy that they developed provides a higher-resolution record of the Bering Sea deep-sea sediments over the last ~400 ky, with an uncertainty of ~±2000 years.
This study details the timing and pattern of high-magnetic-susceptibility intervals in Interstadial 3 and Interglacials 5, 7, and 9. These intervals are separated by continuous low-magnetic-susceptibility intervals that should be considered full-glacial intervals. The high-magnetic-susceptibility intervals have significant millennial-scale variability that must indicate some complexity to high-latitude interstadial/interglacial climate conditions in the Eastern Siberia/Alaska region. We also compare our results with similar patterns of distinctive interstadial/interglacial variability noted in Lake Elgygytgyn, Siberia (67° N) [
11,
12,
13,
14,
15,
16] and the North Atlantic sediments associated with Ocean Drilling Project 172 (28–33° N) [
17,
18]. Current ongoing global warming is enhanced in high-latitude regions, and the Bering Sea and the correlative records presented here can serve as a testbed for studies of paleoceanographic/paleoclimatic processes that amplify high-latitude climatic responses to radiative forcing, particularly during the interglacials [
1].
2. Processes of Bering Sea Siliciclastic Sedimentation
Sedimentation in the Bering Sea is dominated by clastic flux from its margins, particularly the northern Bering Sea shelf, and biogenic flux from the surface ocean [
1,
19]. The sediments are distributed in the surface Bering Sea by polar easterly winds that create a large-scale counterclockwise gyre circulation in the upper ~1 km and on the Bering Sea shelf. The sediments are also distributed at depth (~1000–4000 m) by deep and intermediate water masses that also ciculate counterclockwise [
5,
20,
21,
22]. These deep-water masses have caused development of the Meiji Drift in the Northwest Pacific Ocean as they exit the southwestern edge of the Bering Sea and are constrained by the Emperor Seamounts, which act as a western boundary [
23].
Detailed clastic sediment analysis [
3] identified a distinctly different clastic grain size distribution in the high-magnetic-susceptibility sediment, largely associated with interglacial conditions, versus the low-magnetic-susceptibility sediment, largely associated with glacial conditions (
Figure 2). The glacial sediments have an average clastic grain size of ~20 microns (fine silt range) with a unimodal distribution between ~1 and 30 microns. The interglacial sediments have an average clastic grain size average of ~50 microns (coarse silt/fine sand) with almost a bimodal distribution. About ¼ of the grains are in the range of 1–30 microns (like the glacial sediments), with the rest in the range of 30–300 microns.
The glacial sediment is probably distributed and deposited by deep-sea bottom contour currents. Their grain size distribution is consistent with deep-sea sediments along the Blake/Bahama Outer Ridge in the North Atlantic Ocean [
24,
25,
26], associated with the Western Boundary Undercurrent (WBUC). The lack of significant coarse clastic sediment during the glacials is due to somewhat permanent ice covering the Bering Sea continental shelf and most of the deep Bering Sea basin.
The interglacial sediment is dominated by notably coarser grain size (coarse silt/sand) that is derived from the Bering Sea shelf and shunted into the deep Bering Sea by submarine canyons along the northern margin of the Bering Sea shelf and adjacent to sites U1343, U1344, and U1345 during seasonal to permanent ice-free conditions. This pattern of interglacial high clastic flux is not constant. There is variability in the concentration of coarse clastic flux, with some intervals having higher magnetic susceptibility and other intervals having lower susceptibility. We associate the variability in coarse interstadial/interglacial sediment flux (estimated by magnetic susceptibility) with variable warm/wetter versus cool/drier interstadial/interglacial continental conditions in Alaska and eastern Siberia.
3. Detailed Bering Sea Interstadial/Interglacial Variability
We focused on the magnetic susceptibility records for sites U1343, U1344, and U1345 in specific time intervals: 0–70 ka (centered on interstadial MIS 3), 65–135 ka (containing interglacial MIS 5), 135–240 ka (containing interglacial MIS 7), and 240–360 ka (containing MIS 9). Each of the interstadial/interglacial intervals shows millennial-scale variability in the high-magnetic-susceptibility records. These individual high/low oscillations are synchronous to ~±2000 years among our IODP Ex. 323 sites, the uncertainty limit of our chronostratigraphic framework [
6,
7,
8,
9].
The magnetic susceptibility records for our three sites during the last 70 ka are shown in
Figure 3. Key correlative magnetic susceptibility highs are labeled A–G, with two older questionable highs indicated by question marks in
Figure 3. The ages of the centers of each high are also shown. There are five clear magnetic susceptibility highs at all three sites: 25, 30, 34, 39, and 44 ka. There is a notable ~4750- ± 500-year quasi-cyclicity in their recurrence, based on peak-to-peak average interval age. Such a ~4000-year quasi-cyclicity in MIS 3 was first noticed in the North Atlantic Ocean [
27] (see below).
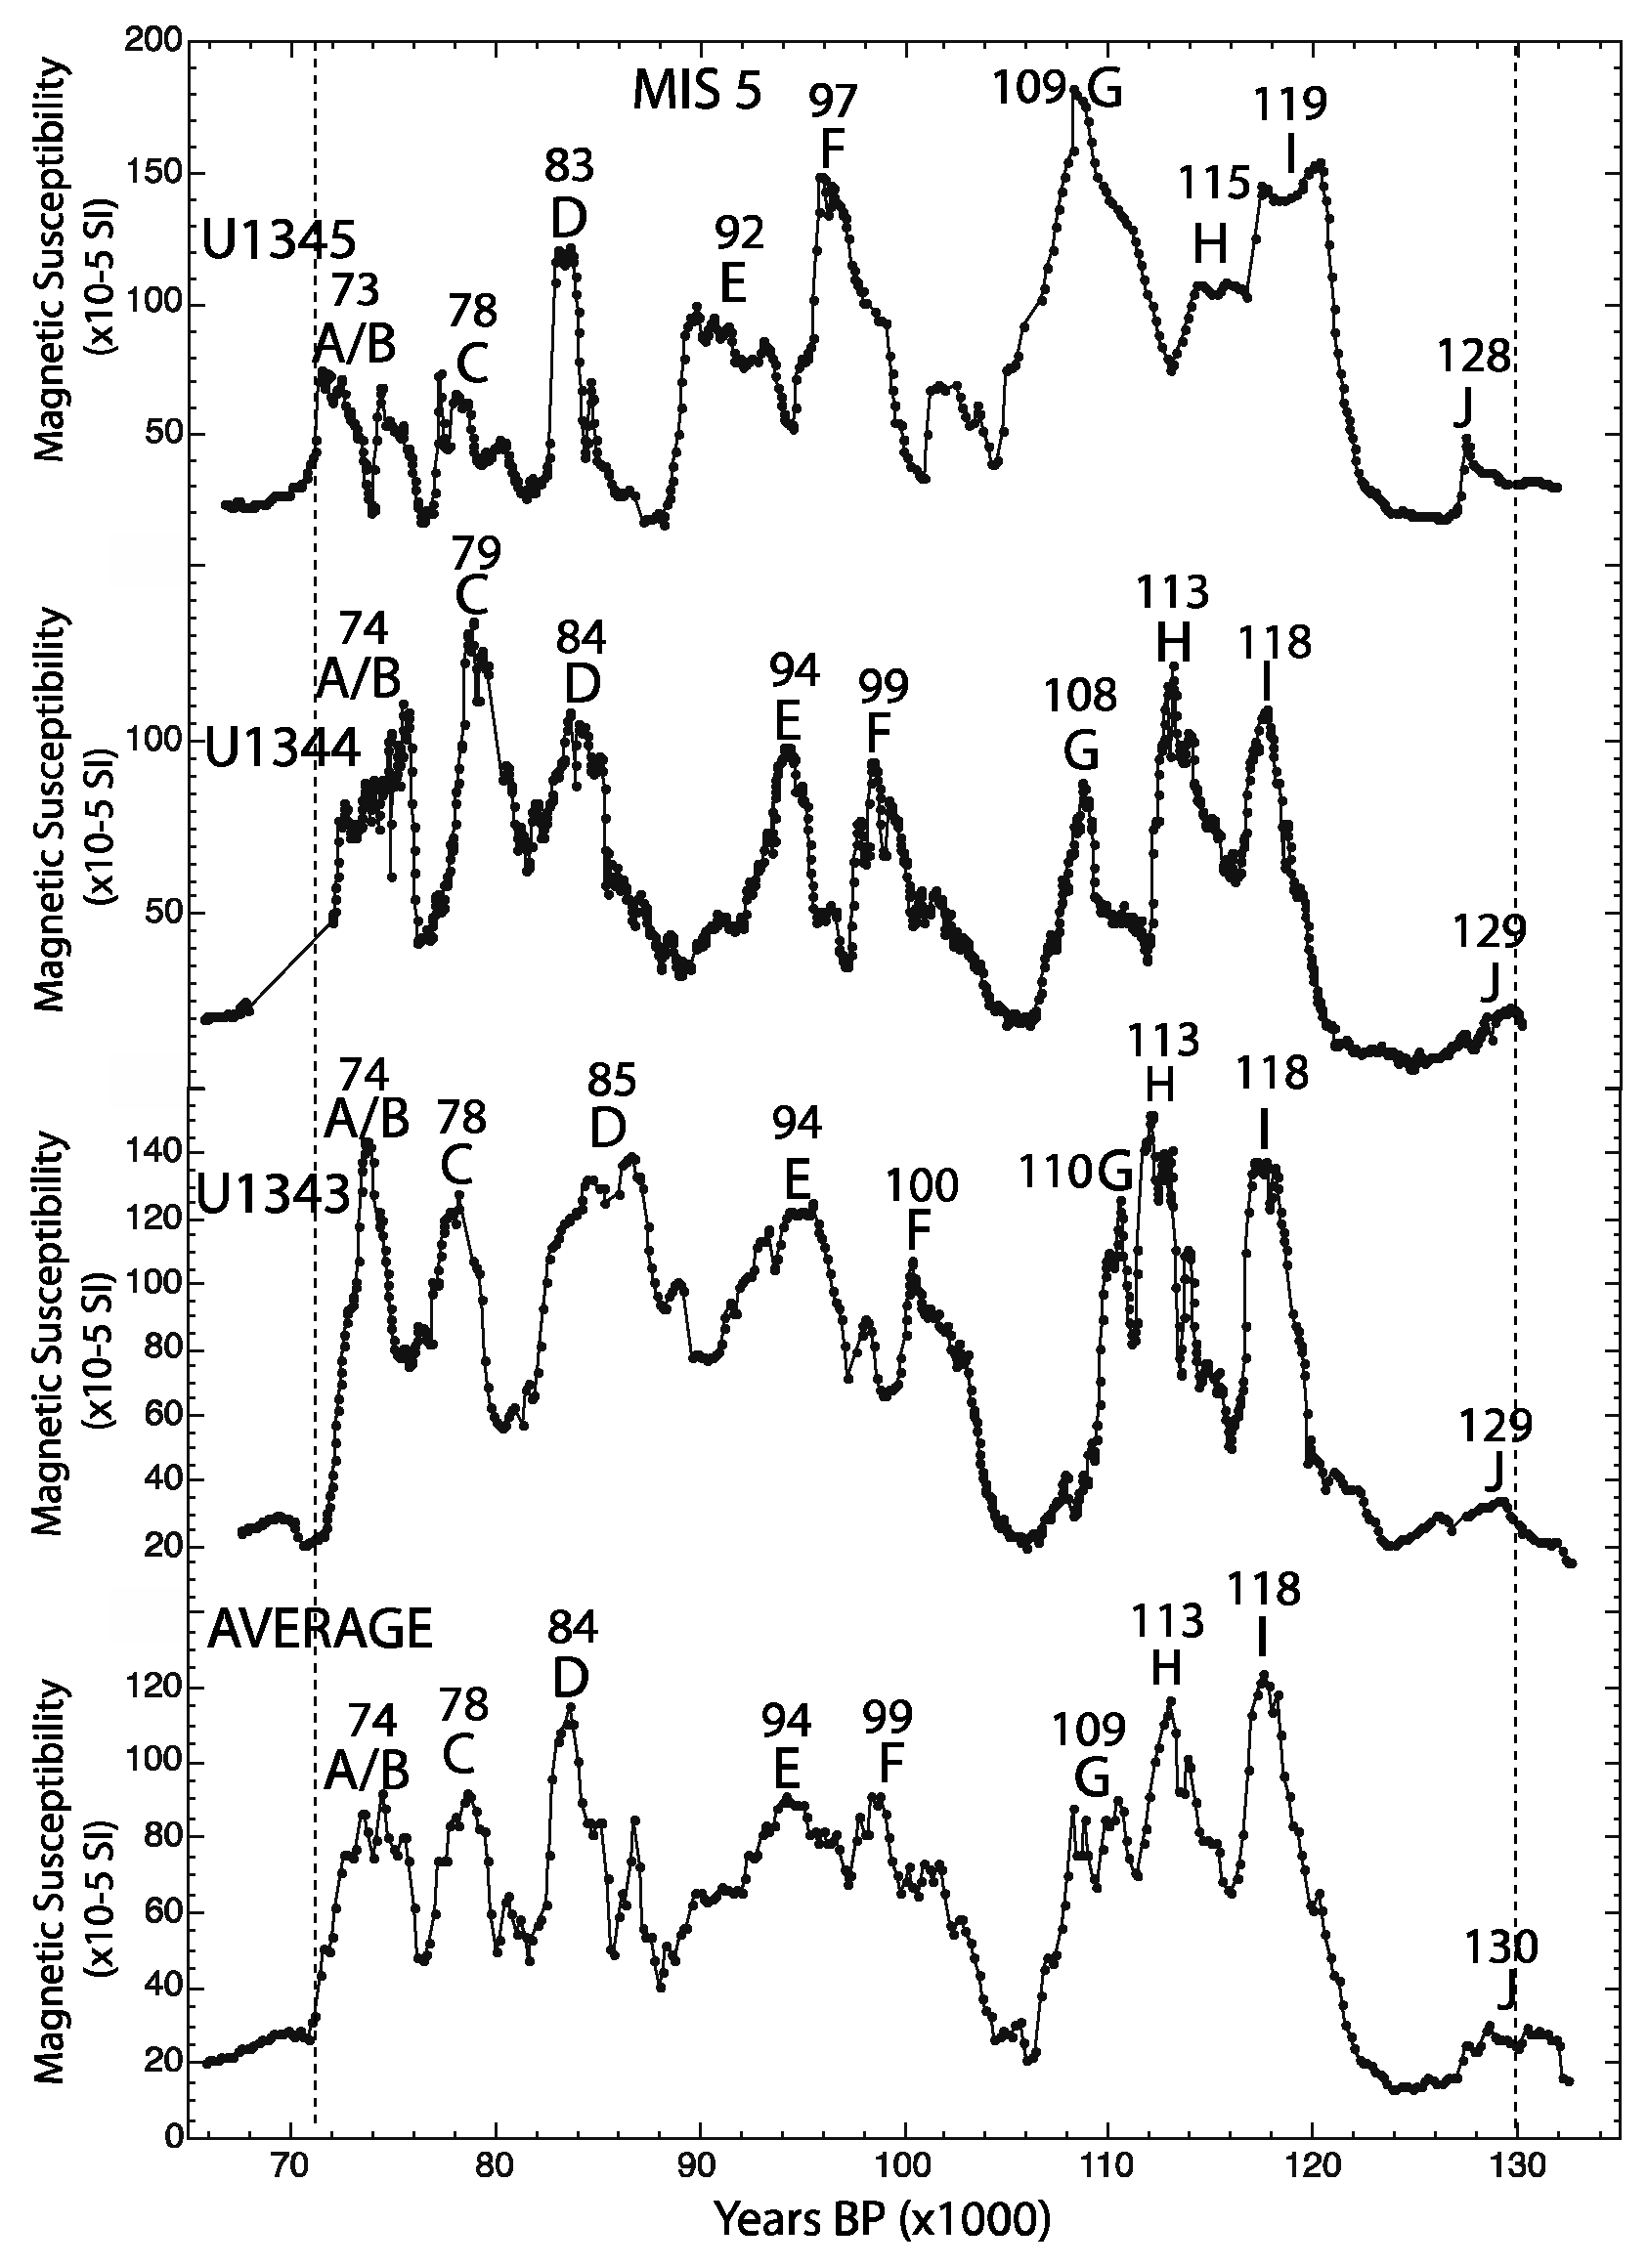
The magnetic susceptibility records for 65–140 ka centered on MIS 5 are shown in
Figure 4. Key correlative susceptibility highs are labeled A/B–J. The ages of the centers of each high are also shown. There are 9 clear magnetic susceptibility highs at all three sites. There are 10 ky intervals between highs D and E, highs F and G, and highs I and J. The remaining eight highs have an average recurrence of 4800 ± 800 years based on peak-to-peak average time intervals. There is some evidence for small magnetic susceptibility highs between highs D and E, highs F and G, and highs I and J, but they are not significant. The eight notable highs indicating warmer/wetter MIS 5 interglacial conditions in the Bering Sea region are more frequent than the orbital MIS 5 substage structure of warmer 5A, 5C, and 5E, with intervening cooler intervals 5B and 5D.
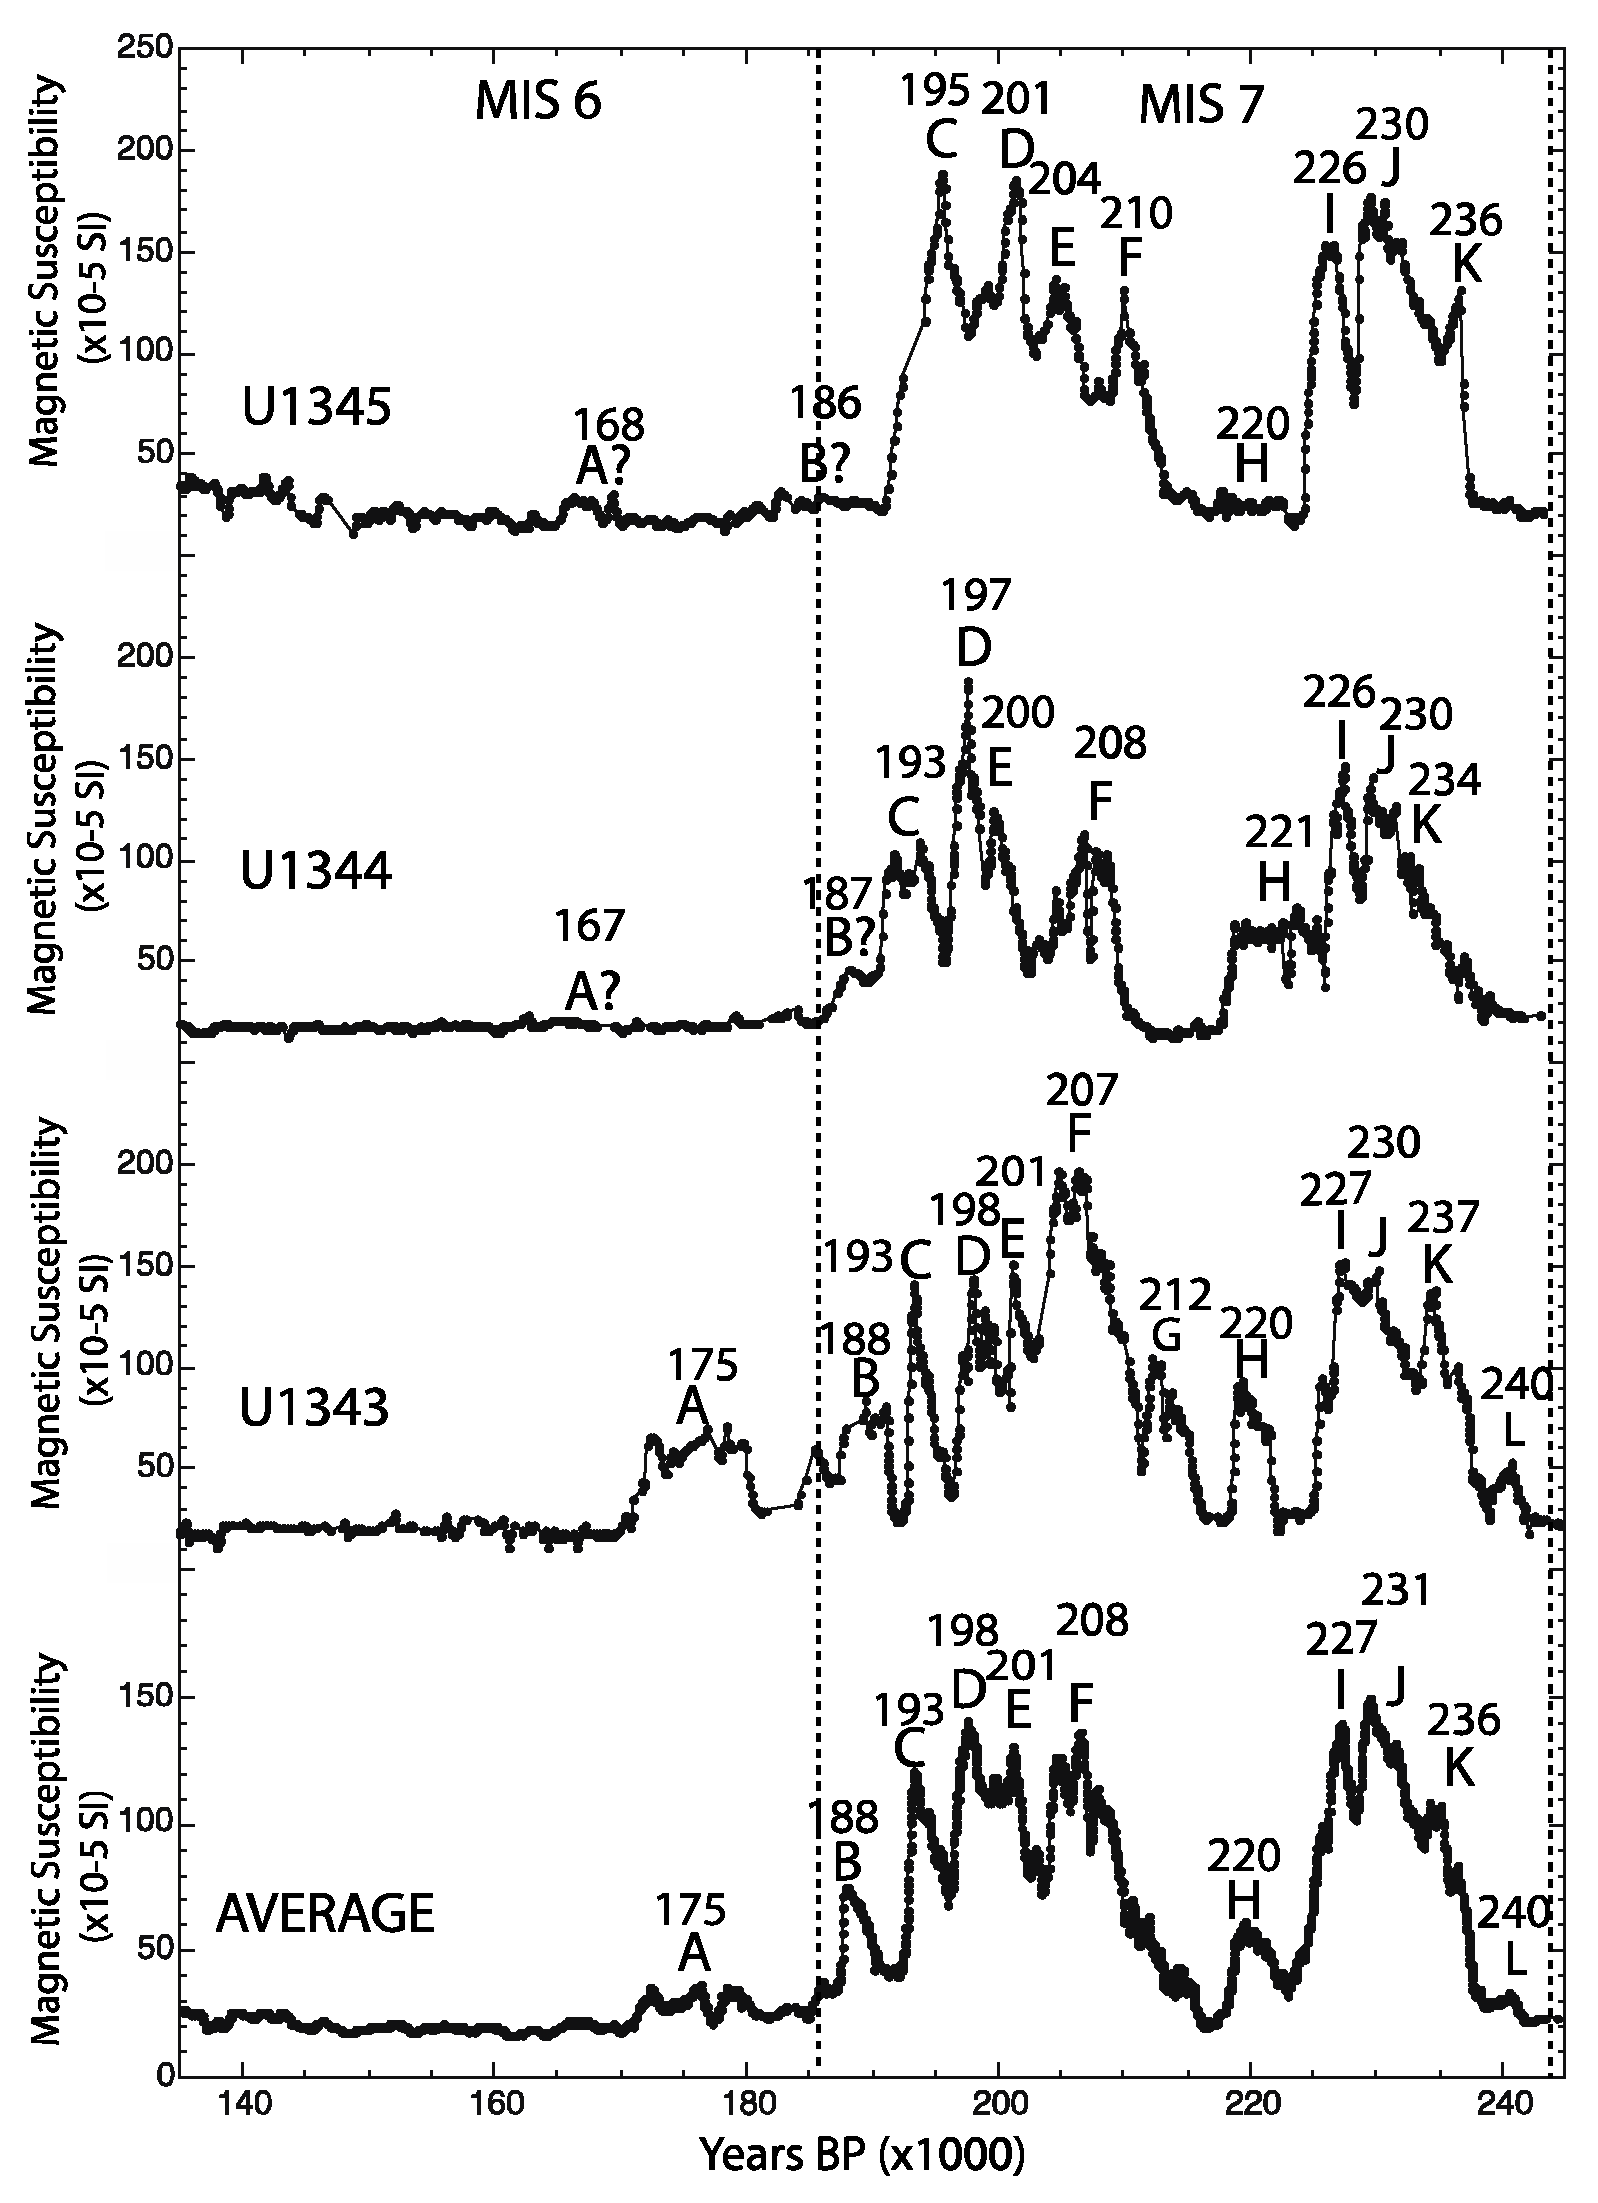
The magnetic susceptibility records for 140–245 ka centered on MIS 7 are shown in
Figure 5. Key correlative susceptibility highs in MIS 7 are labeled B–K. The ages of the centers of each high are also shown. There are nine clear magnetic susceptibility highs in MIS 7 are all three sites. There are 2~10 ky gaps between highs A and B and highs F to H. Only one record (U1343) shows an intervening high between highs F and H. The nine notable highs indicating warmer/wetter MIS 7 conditions have an average recurrence interval of 5000 ± 1400 years. There is evidence of one magnetic susceptibility high (A) in early MIS 6.
The magnetic susceptibility records for 250–350 ka centered on MIS 9 are shown in
Figure 6. Key correlative susceptibility highs are labeled B–M. This interval is distinctive in having magnetic susceptibility highs in both glacial MIS 8 (seven highs, B–H) and interglacial MIS 9 (five highs, I–M). The ages of the centers of each high are also shown. The MIS 8 highs have a recurrence interval of 5400 ± 1000 years, while the four largest MIS 9 highs have a recurrence interval of 11,000 ± 1000 years. The MIS 8 recurrence intervals are not significantly different from the MIS 3, 5, and 7 recurrence intervals, but the MIS 9 recurrence intervals are twice as long.
4. Ocean Drilling Project Leg 172
We can compare our Bering Sea interstadial/interglacial environmental results with those of two other regions: Subtropical North Atlantic Ocean (28° N–33° N) and Lake Elgygytgyn, Siberia (67° N). The North Atlantic sites are associated with Ocean Drilling Project (ODP) Leg 172 and its site survey cruises, which recovered Quaternary and Late Pliocene deep-sea sediments from 10 sites [
17]. The North Atlantic sediments have a distinctive glacial/interglacial alternation between high magnetic susceptibility/low carbonate in the glacials and low magnetic susceptibility/high carbonate in the interglacials. High magnetic susceptibility is due to high clastic flux with lower sea level in the glacials; high carbonate content is associated with lower clastic flux and higher biological productivity in the interglacials.
The chronostratigraphy for the site survey cores (MISs 1–5) was determined from a combination of magnetic susceptibility, calcium carbonate content, and oxygen isotope stratigraphy [
27,
28,
29]. The age uncertainties in the MIS 1–5 interval are probably ~±1000 years. The most complete chronostratigraphy for the Leg 172 sequences is the carbonate stratigraphy [
18] that was developed by tuning environmental variability (calcium carbonate content) at each ODP Leg 172 site to the Milankovich cycles of obliquity and precession. The age uncertainties of these chronologies were estimated to be ~±10,000 years. Lund [
30] carried out detailed paleomagnetic secular variation (PSV) studies of ODP sites 1060–1063 in MISs 6–12. The relative paleointensity records provided an independent chronology for this interval based on correlation to the oxygen isotope-dated PISO-1500 paleointensity record [
10]. The PSV paleointensity ages were almost always within ±2000 years of the Gruetzner chronology [
18]. That more refined chronology has been used to compare our Bering Sea magnetic susceptibility variations with the North Atlantic carbonate variations.
Carbonate variability in MIS 3 from the North Atlantic Ocean is shown in
Figure 7. Piston cores CH88-10P and 11P [
25,
28,
31] are near ODP sites 1060 and 1061. More detailed carbonate records [
27,
32] come from piston core GPC9 (near ODP site 1062) and piston core GPC5 (near ODP site 1063). Keigwin and Jones [
27] identified 10 carbonate peaks in GPC5 and GPC9, labeled a–j in
Figure 7. The average carbonate record from GPC5 and GPC9 is shown at the bottom of
Figure 7. The six highest carbonate peaks are labeled by age as well. The ages of these North Atlantic events and their recurrence intervals (~5500 ± 1500 years) are not significantly different from magnetic susceptibility peaks in Bering Sea MIS 3. Keigwin and Jones [
27] carried out spectral analysis of the carbonate variability in GPC5 and identified a ‘double spectral peak’ at 4500 and 3600 years. Keigwin and Boyle [
32] compared the carbonate variability in GPC5 to oxygen isotope variability and noted that the carbonate peaks varied in and out of phase with Daansgard/Oeschger warm cycles 7–16.
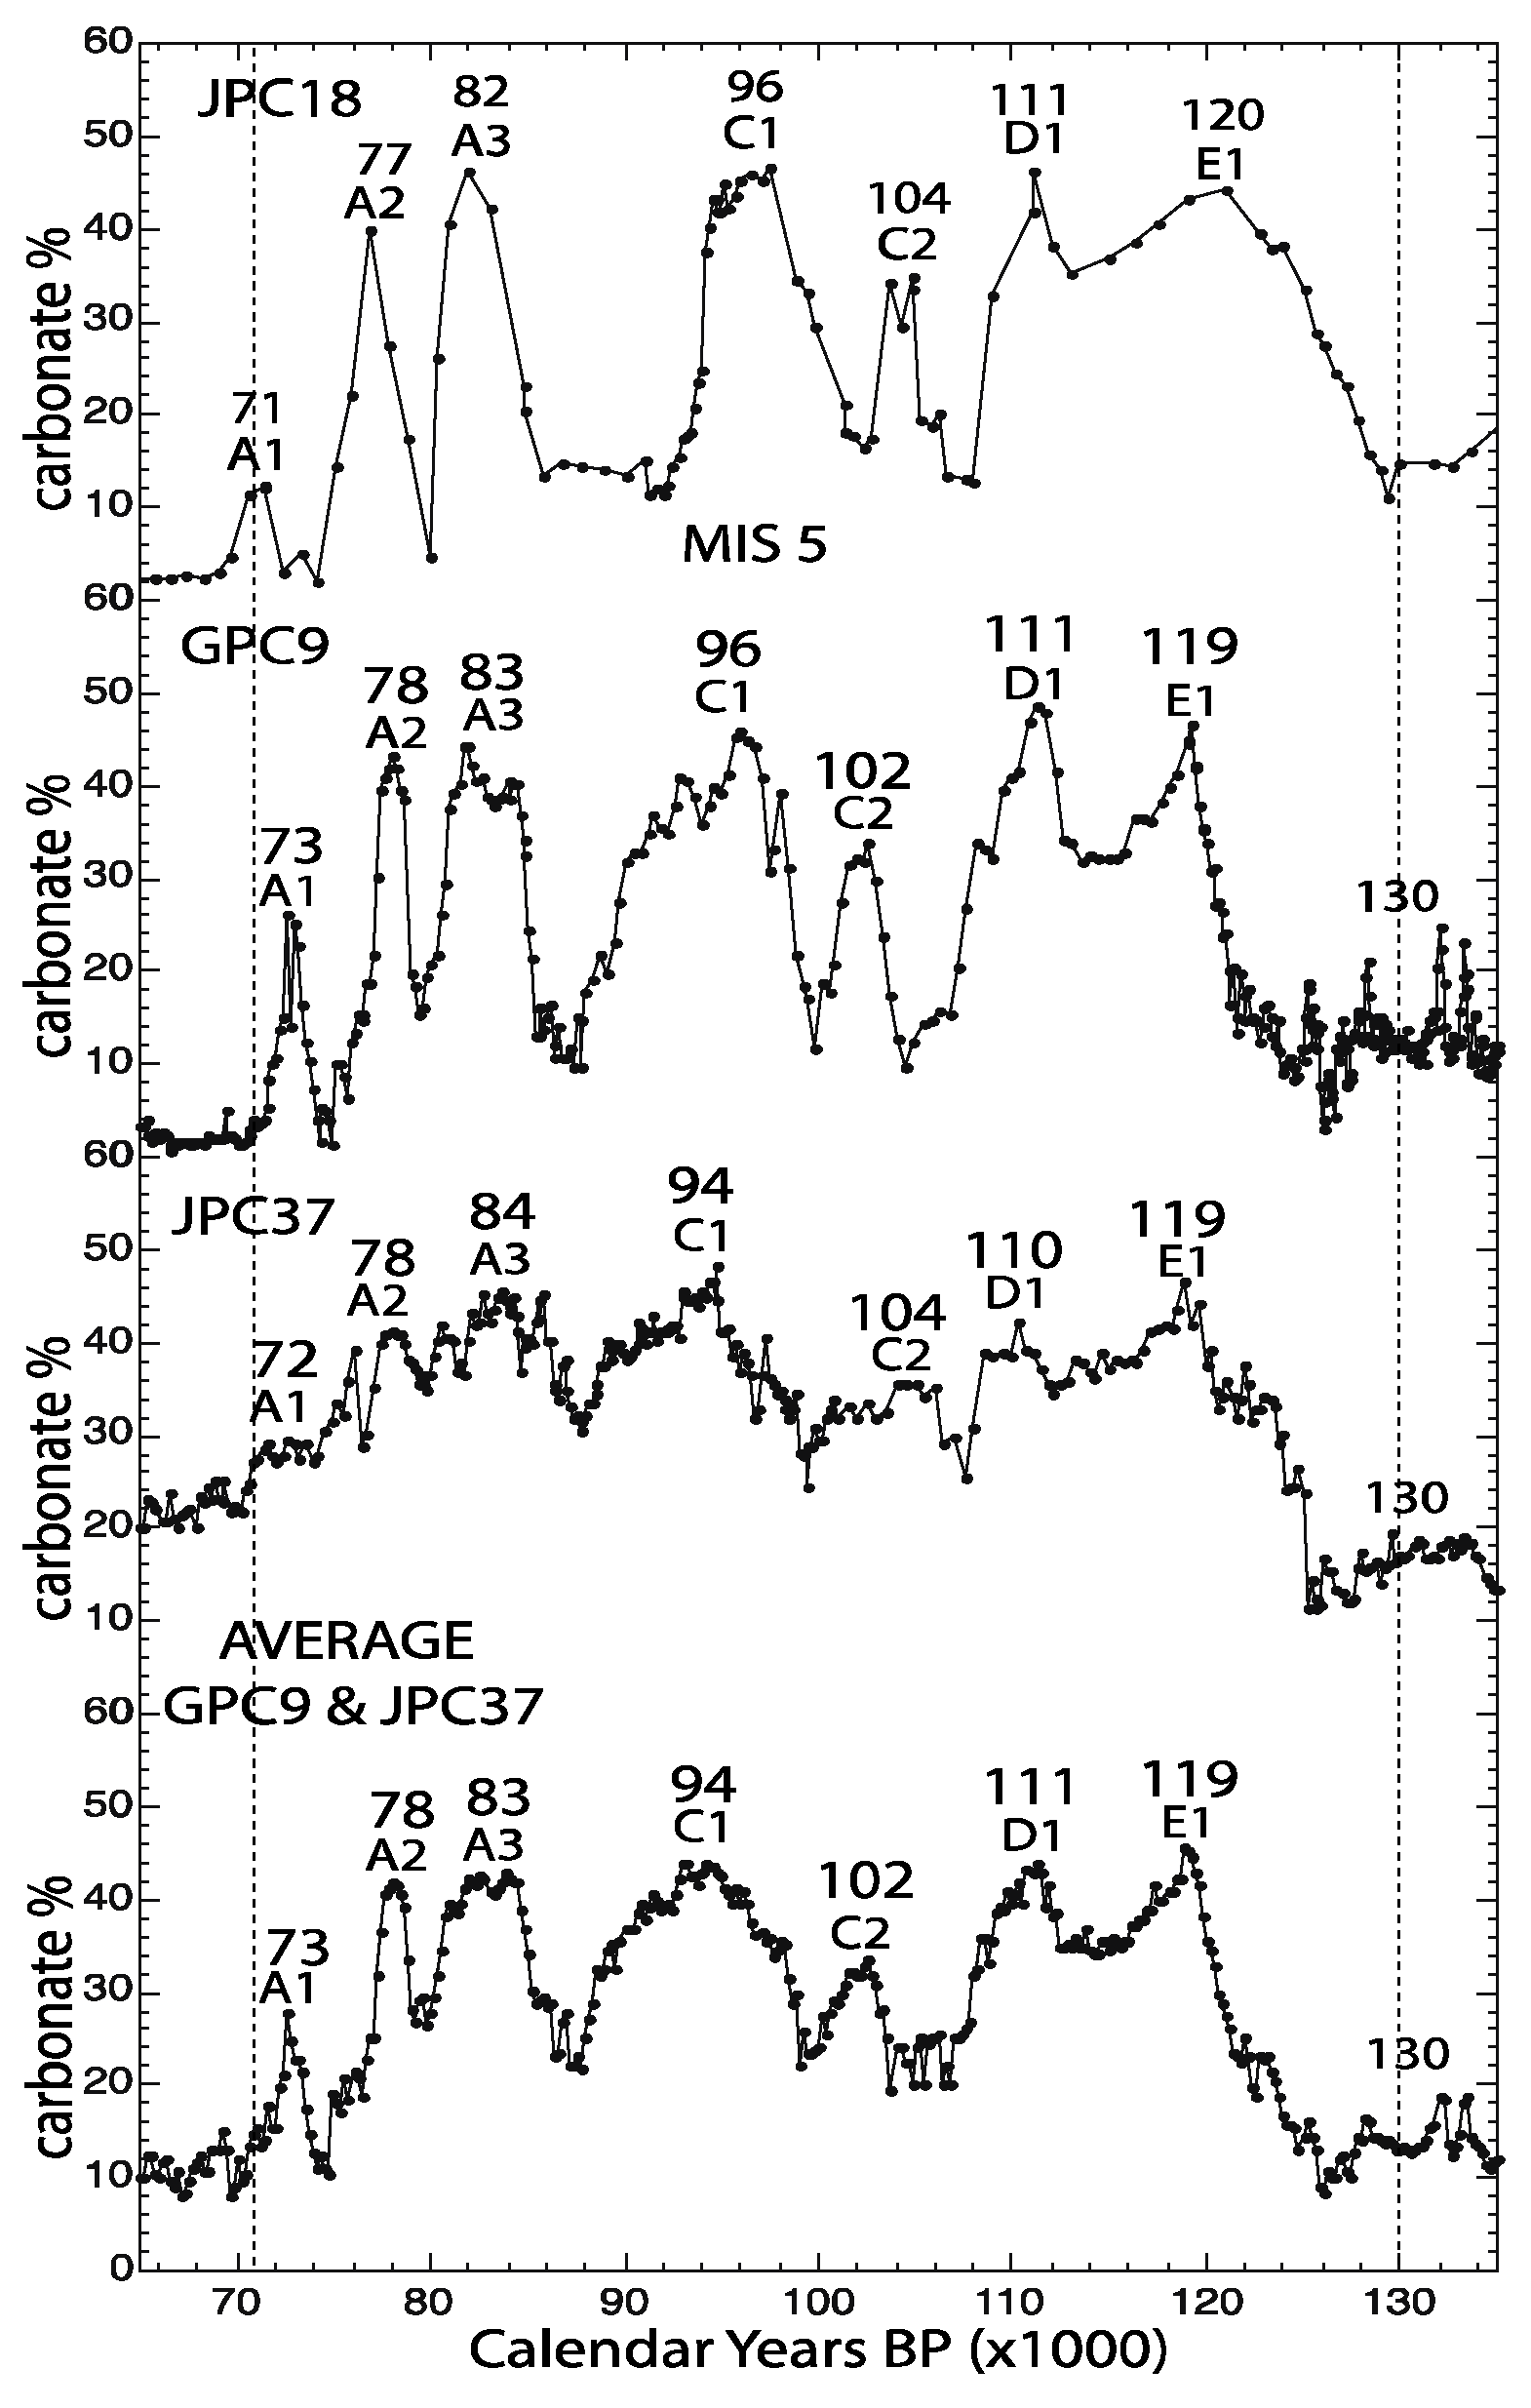
Figure 8 presents master curves for North Atlantic records of calcium carbonate in MIS 5 based on cores JPC18 (near ODP site 1062), GPC9 (near ODP site 1062), and JPC37 (near ODP site 1060) [
27,
33]. The two most detailed records are from GPC9 and JPC37 (
Figure 8, bottom), where there are seven high-carbonate intervals noted by Keigwin and Jones [
27]. These seven carbonate maxima are not significantly different from high-magnetic-susceptibility intervals in MIS 5 of the Bering Sea (
Figure 4). There is also a modest carbonate high at ~130 ka that is consistent with feature j of the Bering Sea (
Figure 4). As noted for the Bering Sea, there are three gaps of ~10,000 years between features A3 and C1, features C1 and C2, and feature E1 and the small feature at 130 ka. The average recurrence interval otherwise is 6500 ± 1700 years, which is not significantly different from the case of the Bering Sea. The seven lettered carbonate peaks (presumably associated with warm, productive intervals) are out of phase with the traditional three warm MIS 5 substages (5A, 5C, and 5E).
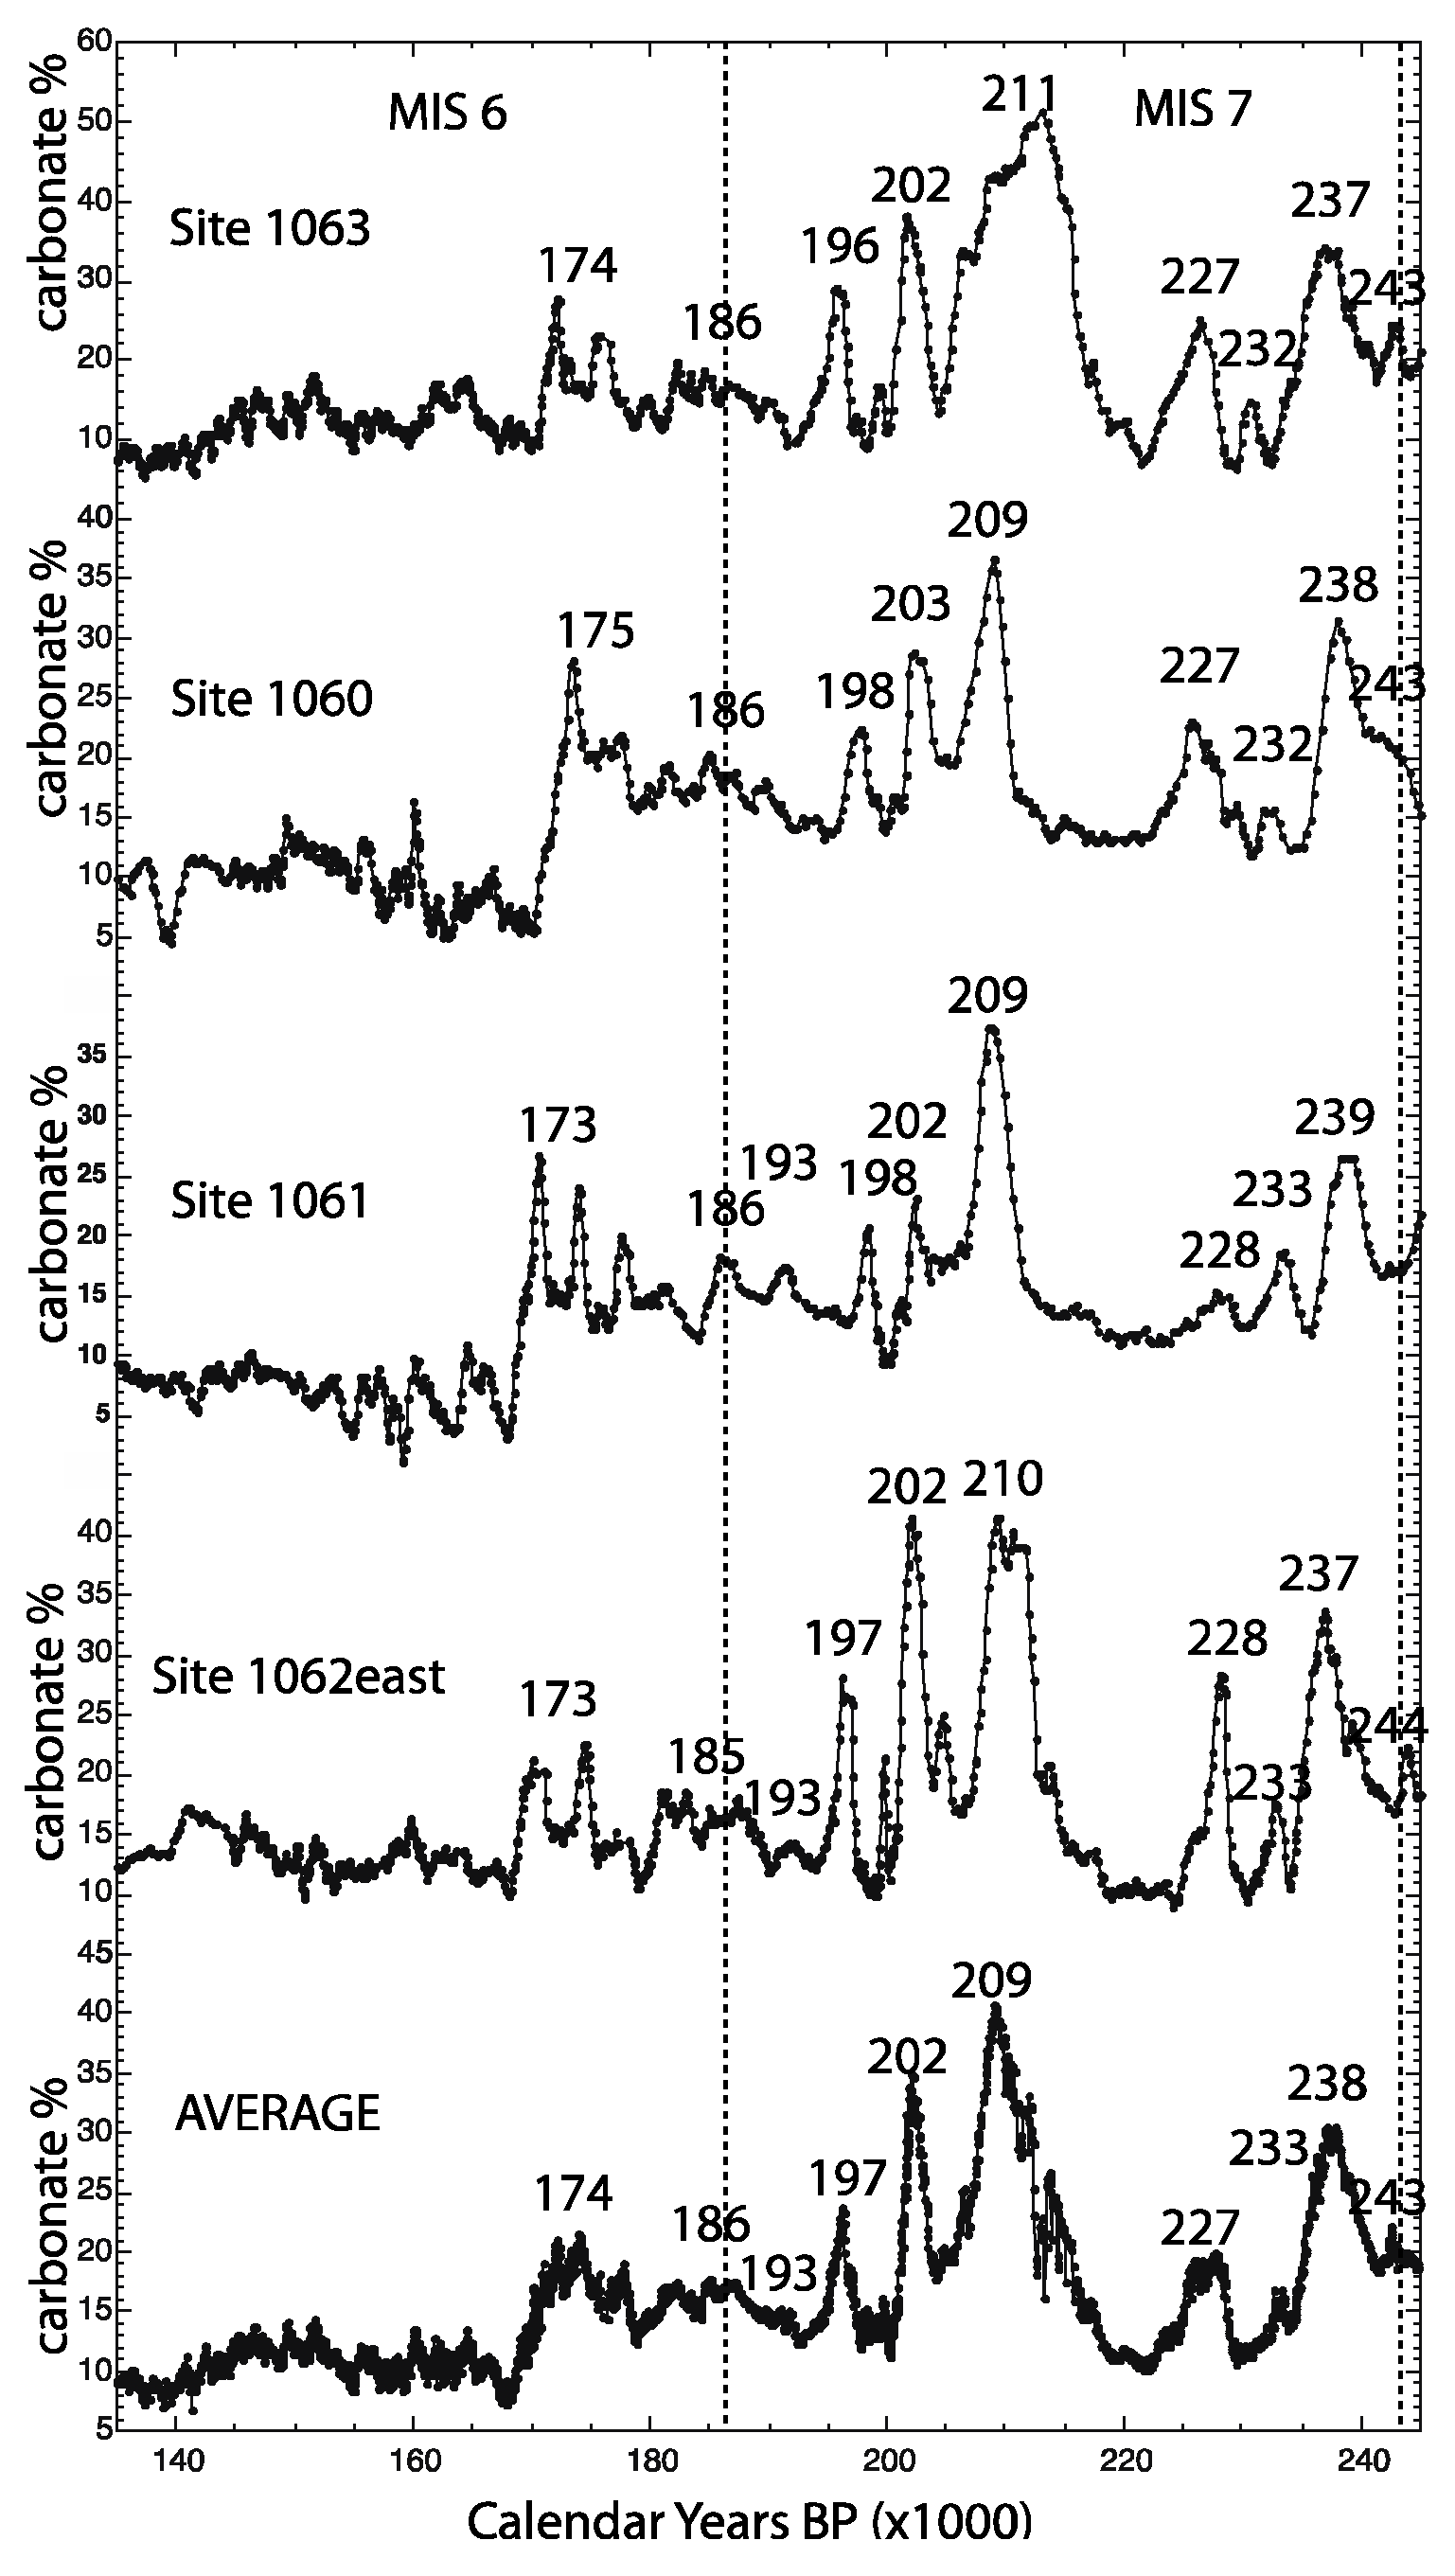
Carbonate variability for North Atlantic sediments older than MIS 5 comes from [
18].
Figure 9 shows the estimated carbonate variability for ODP sites 1060–1063 in the interval 135–245 ka. These sites are close to the site survey cores studied for MIS 3 and MIS 5. The average carbonate variability for the four sites is shown at the bottom of
Figure 9. There is one peak in earliest stage 6 and 9 peaks in MIS 7. The Bering Sea also has one peak in early MIS 6, but there are ten peaks in MIS 7. There is one large gap in both regions between 208 and 220 ka. The 10 peaks are dated in
Figure 9; they are not significantly different from peaks in the Bering Sea. Their average recurrence interval is 5500 ± 1000 years, not significantly different from the pattern in the Bering Sea.
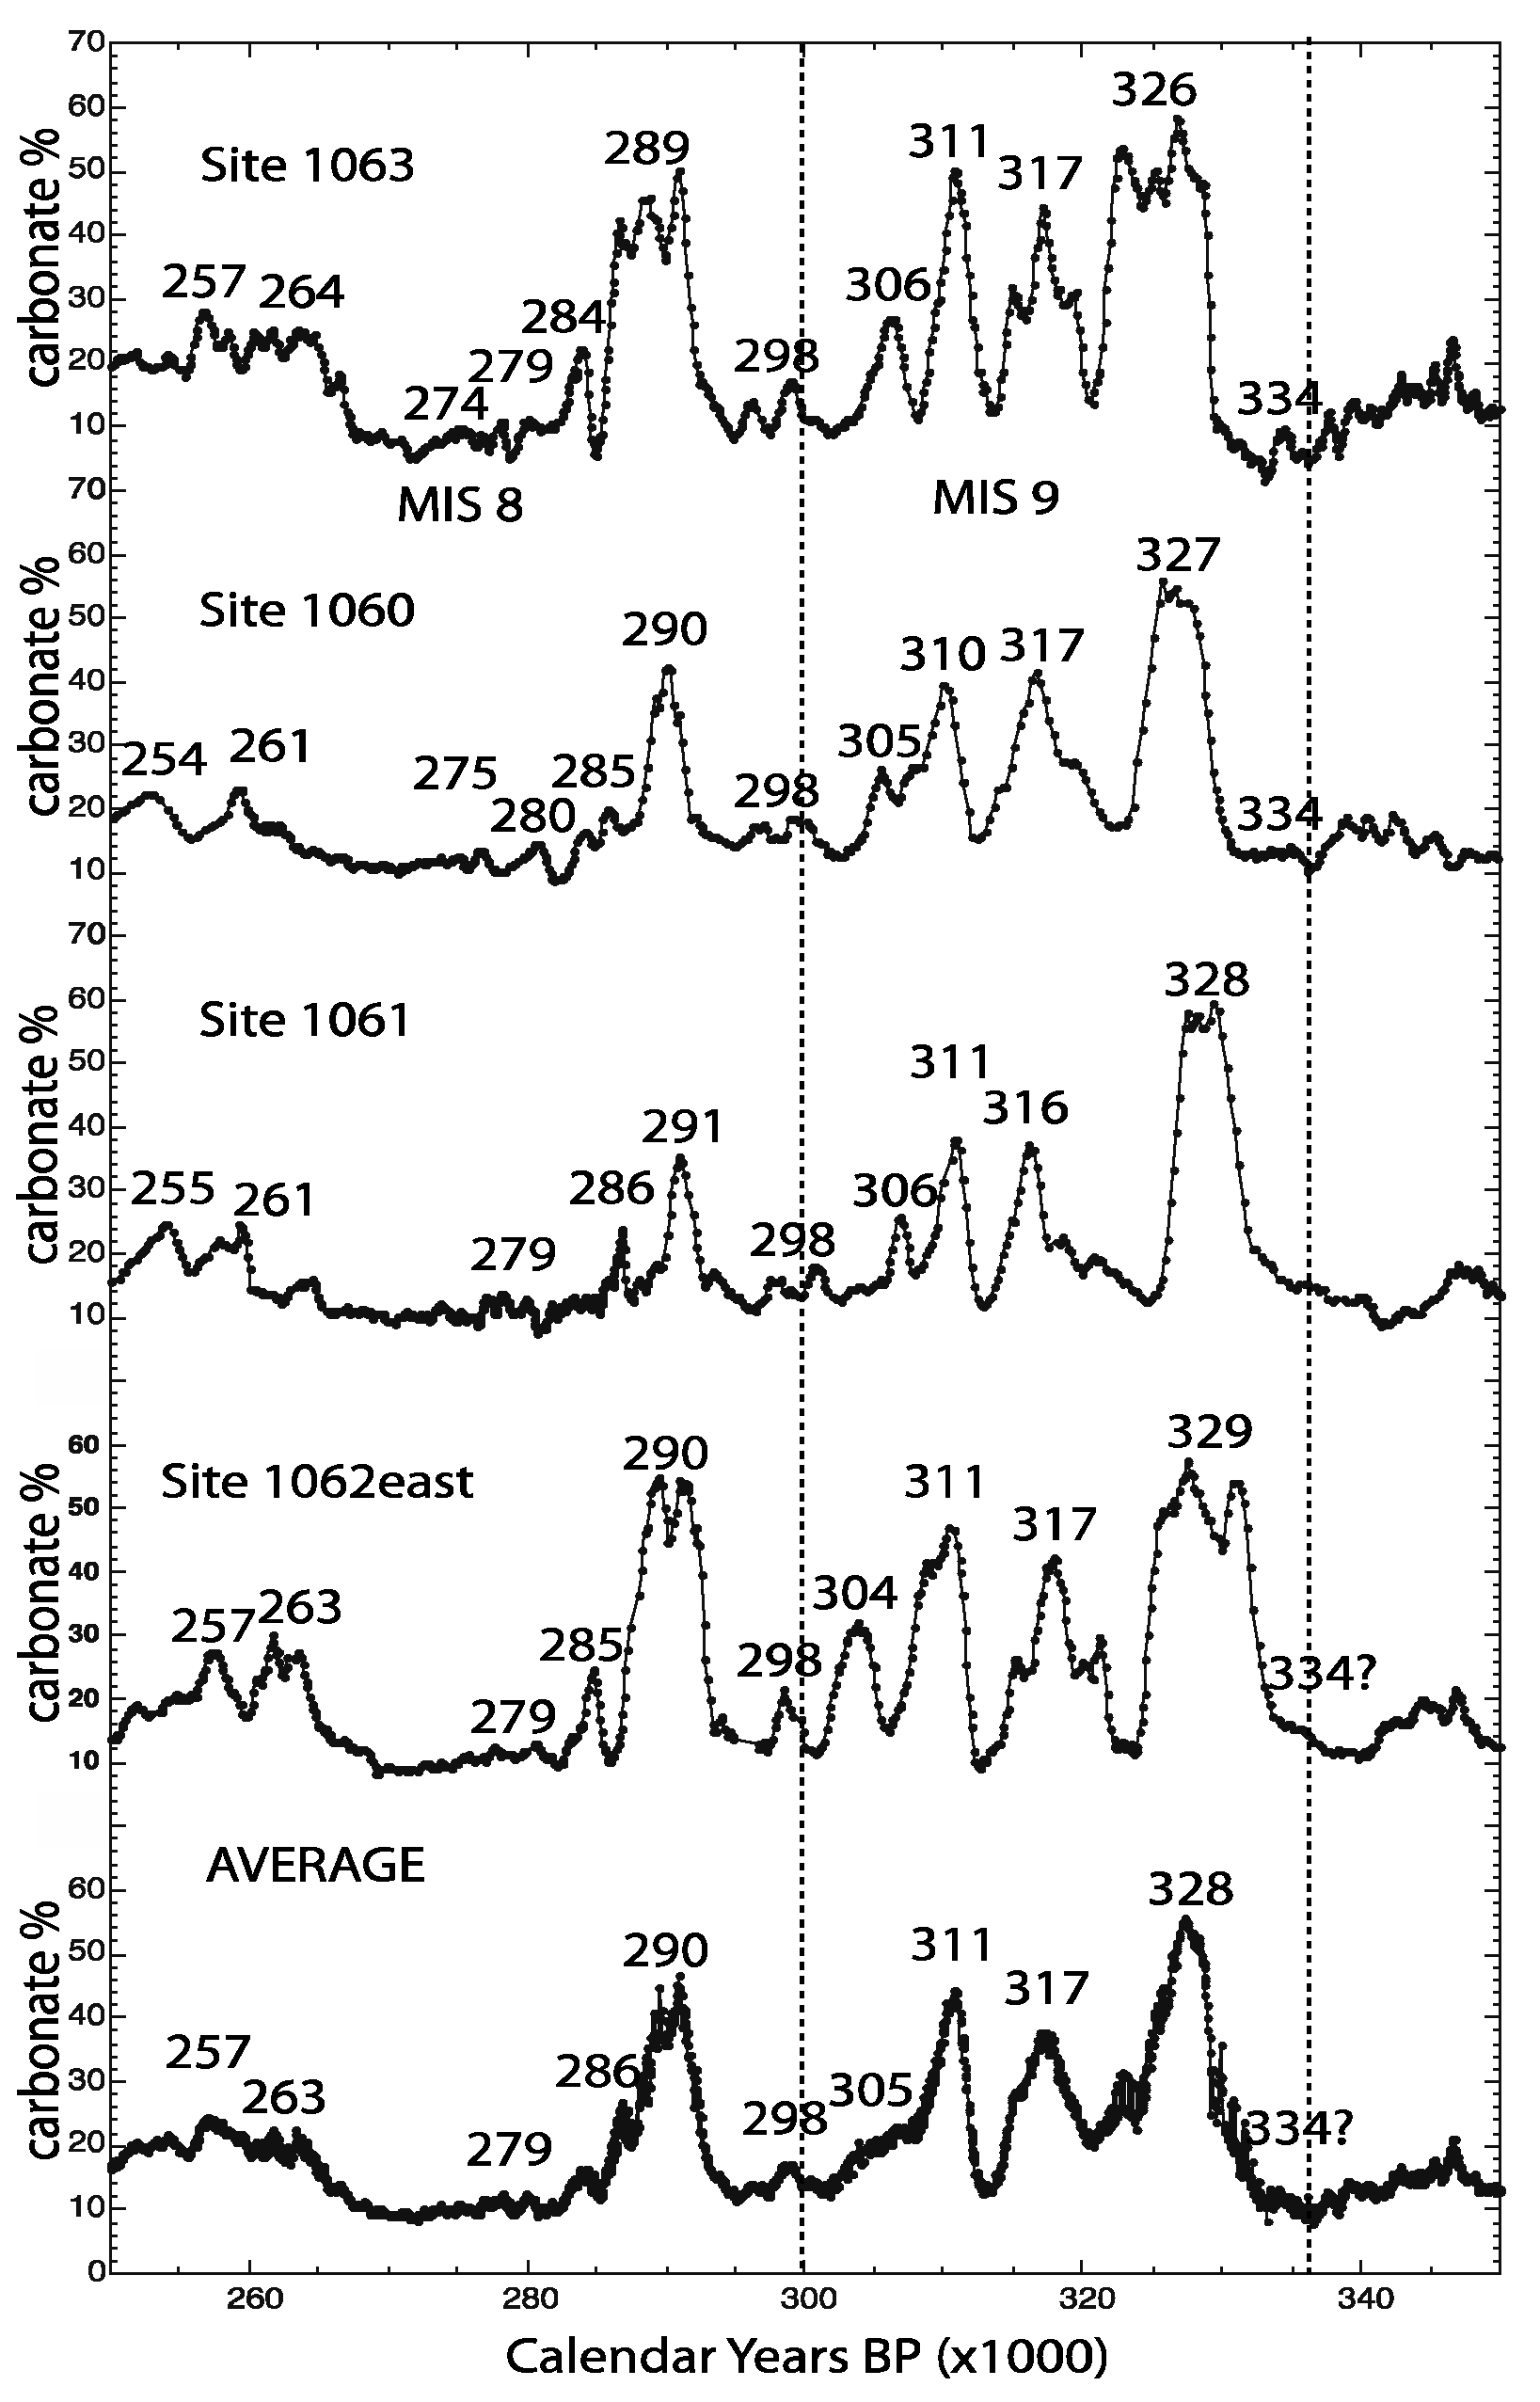
Carbonate variability in the interval 250–350 ka for ODP sites 1060–1063 is shown in
Figure 10. The average of the four sites is shown at the bottom of
Figure 10. This interval includes almost all of glacial MIS 8 and all of interglacial MIS 9. There are 11 distinctive features that are dated in
Figure 10. Ten of these carbonate highs are not significantly different in age from magnetic susceptibility peaks in the Bering Sea. But the Bering Sea has two added peaks at 266 and 271 ka in MIS 8 and the North Atlantic has one extra peak at 305 ka. There are several gaps of ~10,000 years between carbonate peaks. These are consistent in timing with similar gaps in the Bering Sea. The overall recurrence interval outside of these gaps is 5500 ± 1000 years. That is also not significantly different from the pattern in the Bering Sea.
5. Lake Elgygytgyn
Lake Elgygytgyn [
11,
12,
13,
14,
15] is situated in northeastern Siberia at 67° N (
Figure 1), within ~1000 km of IODP site U1345. ICDP site 5011-1 at Lake Elgygytgyn has recovered a 3.6 million-year record of lake sedimentation, comparable to the IODP Ex. 323 Plio/Pleistocene record discussed above. The last 3.3 million years of Lake Elgygytgyn deposition recorded at site 5011-1 has an average sedimentation rate of ~4 cm/ky. This is almost a factor of 10 lower than those of Bering Sea sites U1343, U1344, and U1345 (25–45 cm/ky) over the last ~400 ky. The revised chronology [
16] is based on a combination of correlation to global oxygen isotope records and Milankovich tuning. The final chronology probably has an average uncertainty of ~±3000 years in the interval we compare.
Lake Elgygytgyn has a similar strong bimodal pattern of high versus low magnetic susceptibility. Nowaczyk et al. [
14,
15] have argued that this bimodal magnetic susceptibility pattern is due to intermittent anoxia in Lake Elgygytgyn sediments and ice cover over Lake Elgygytgyn. They argue that warm intervals with intermittent open lake conditions have higher clastic flux to the lake and thus higher magnetic susceptibility intervals. Colder intervals with almost permanent ice cover plus higher biological productivity under the lake ice limit clastic flux to the lake and create anoxic conditions that cause magnetic mineral dissolution. Nowaczyk et al. [
14,
15] consider Milankovich-scale (insolation) glacial/interglacial oscillations to be the primary cause of the bimodal magnetic susceptibility pattern. Lund et al. [
3] noted, however, that there was also a millennial-scale alternation in magnetic susceptibility, primarily during interglacials, that is similar in style and timing to that of IODP Ex. 323 sediments.
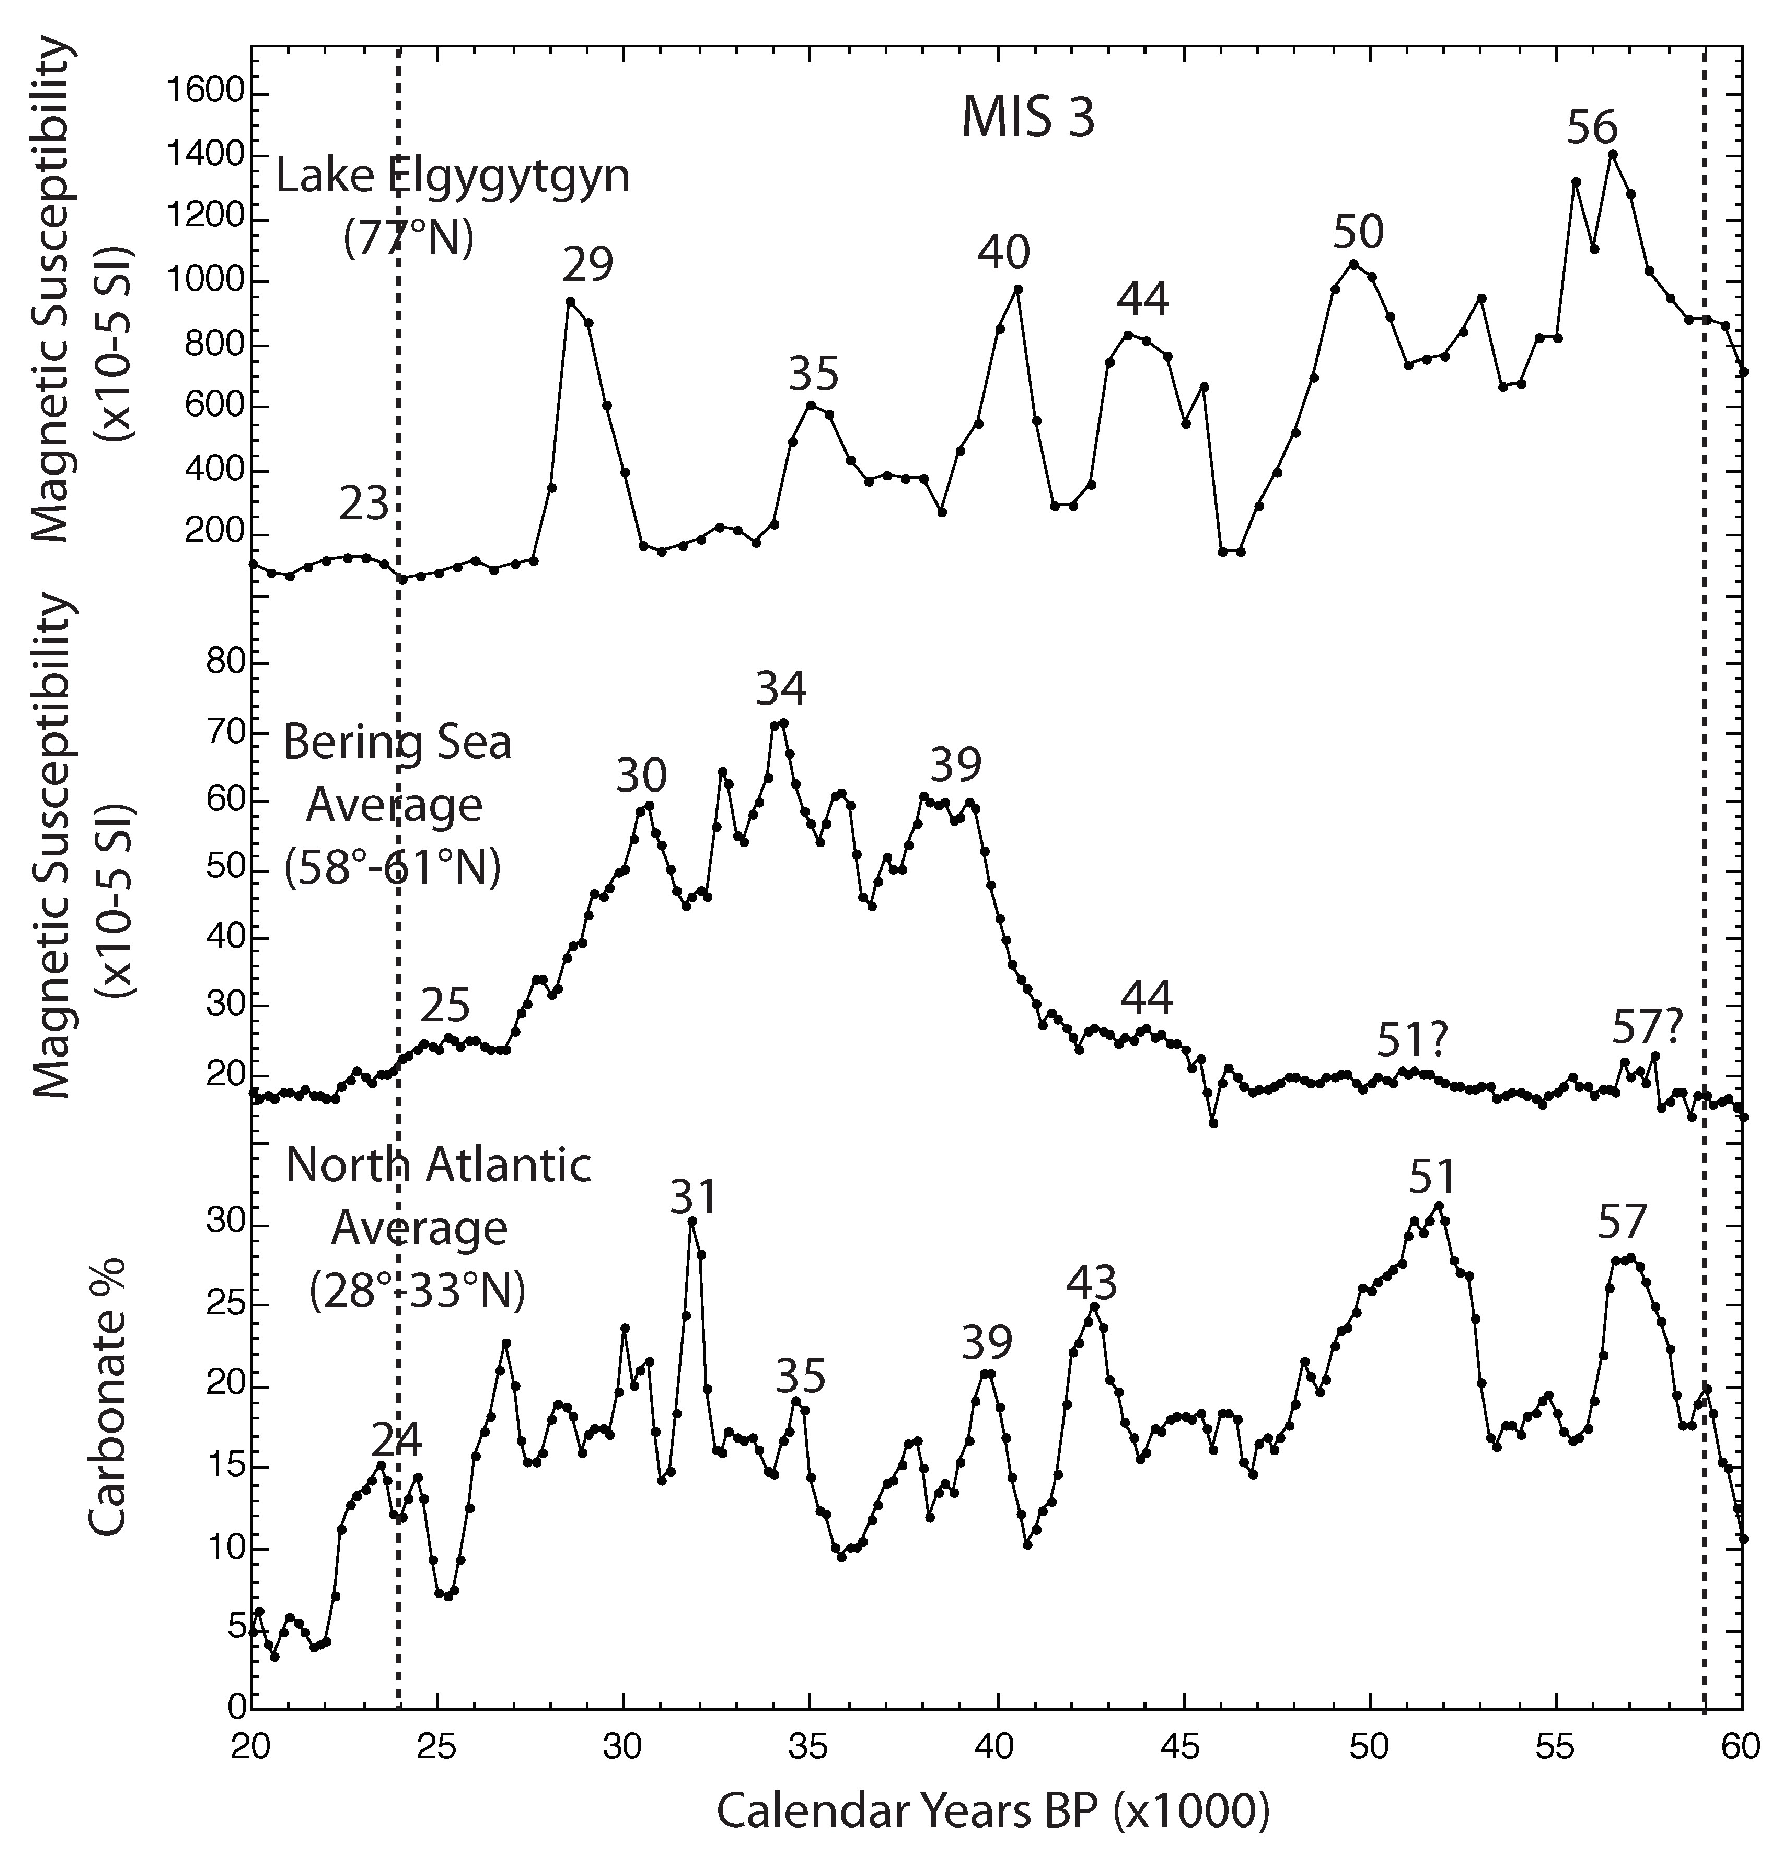
Figure 11 shows the magnetic susceptibility record of Lake Elgygytgyn during MIS 3 and compares it to the average Bering Sea magnetic susceptibility and average North Atlantic carbonate content. The Lake Elgygytgyn magnetic susceptibility high interval center ages are also shown. Lake Elgygytgyn has seven magnetic susceptibility highs in MIS 3 that are not significantly different in age from those of the other two regions. The early MIS magnetic susceptibility highs in the Bering Sea are more subdued than those of Lake Elgygytgyn and the North Atlantic. A separate study [
34] has also found evidence for the ~5000-year cyclicity in MIS 3 sediment environmental records from the Okhotsk Sea in Siberia.
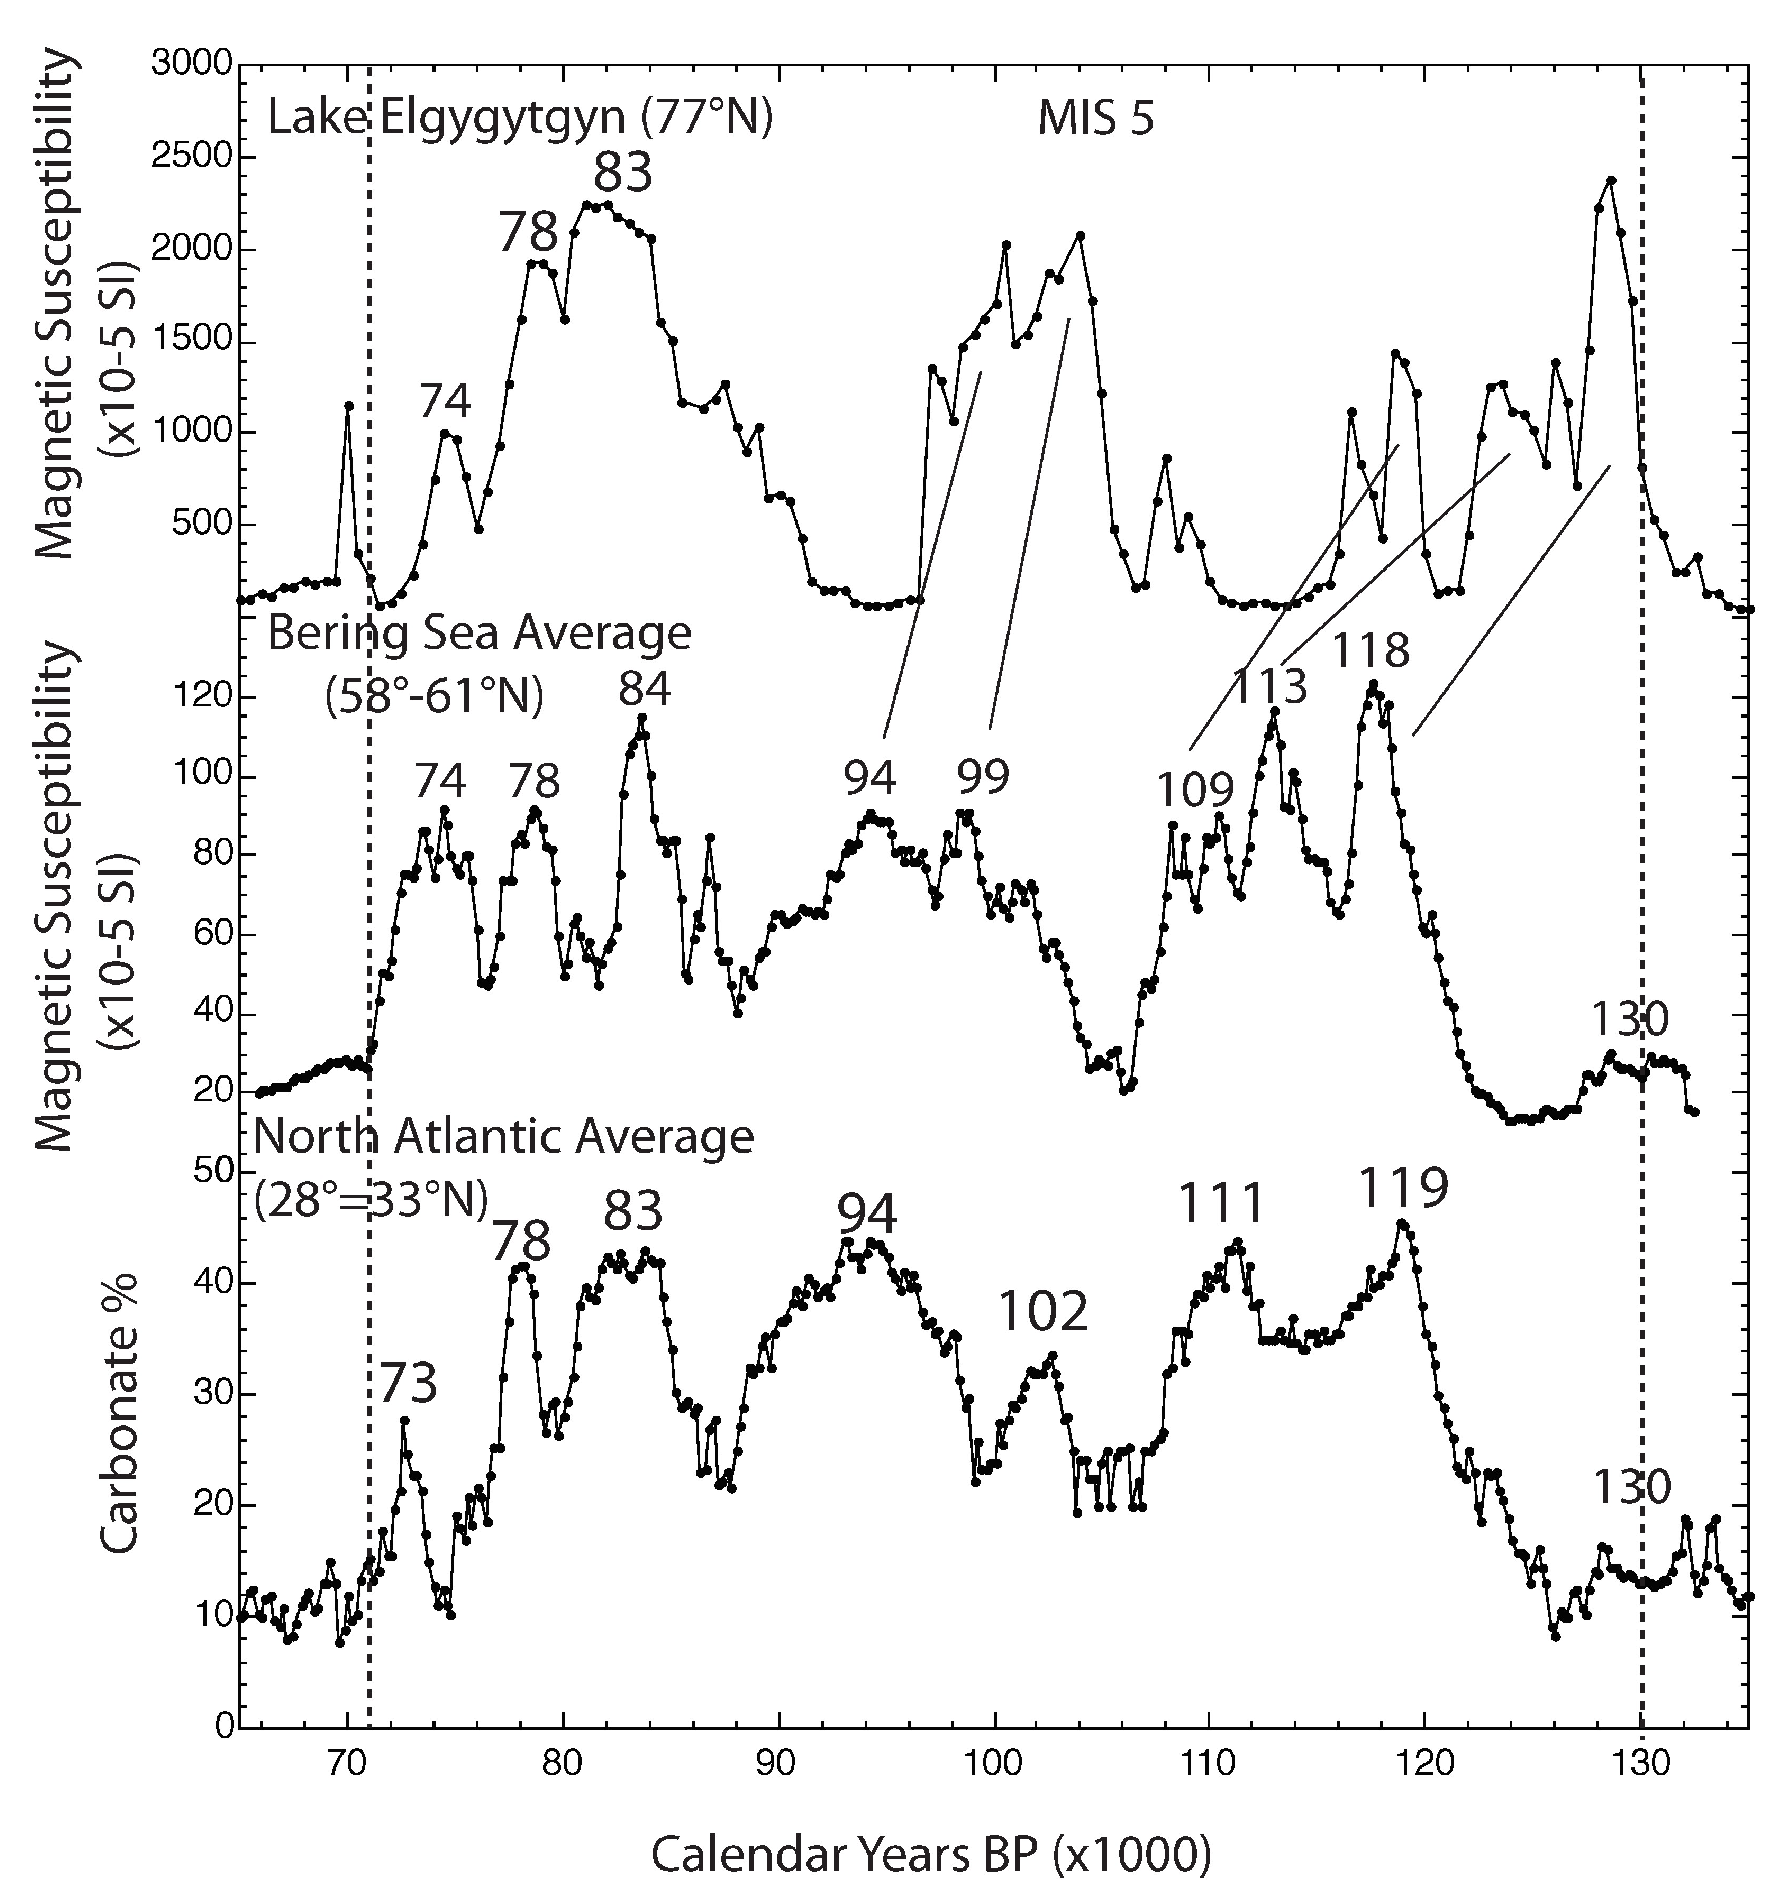
Figure 12 shows the magnetic susceptibility record of Lake Elgygytgyn during MIS 5 and compares it to the average Bering Sea magnetic susceptibility and average North Atlantic carbonate content. The Lake Elgygytgyn magnetic susceptibility high interval center ages are also shown. There are perhaps eight high-magnetic-susceptibility intervals in Lake Elgygytgyn, comparable to those of the other two regions. The ages of the youngest three highs are comparable in age to the other two regions, but the older five highs are skewed up to ~5 ky older. We think that this is an artifact of the comparative chronologies and that these five highs are comparable to those of the other two regions.
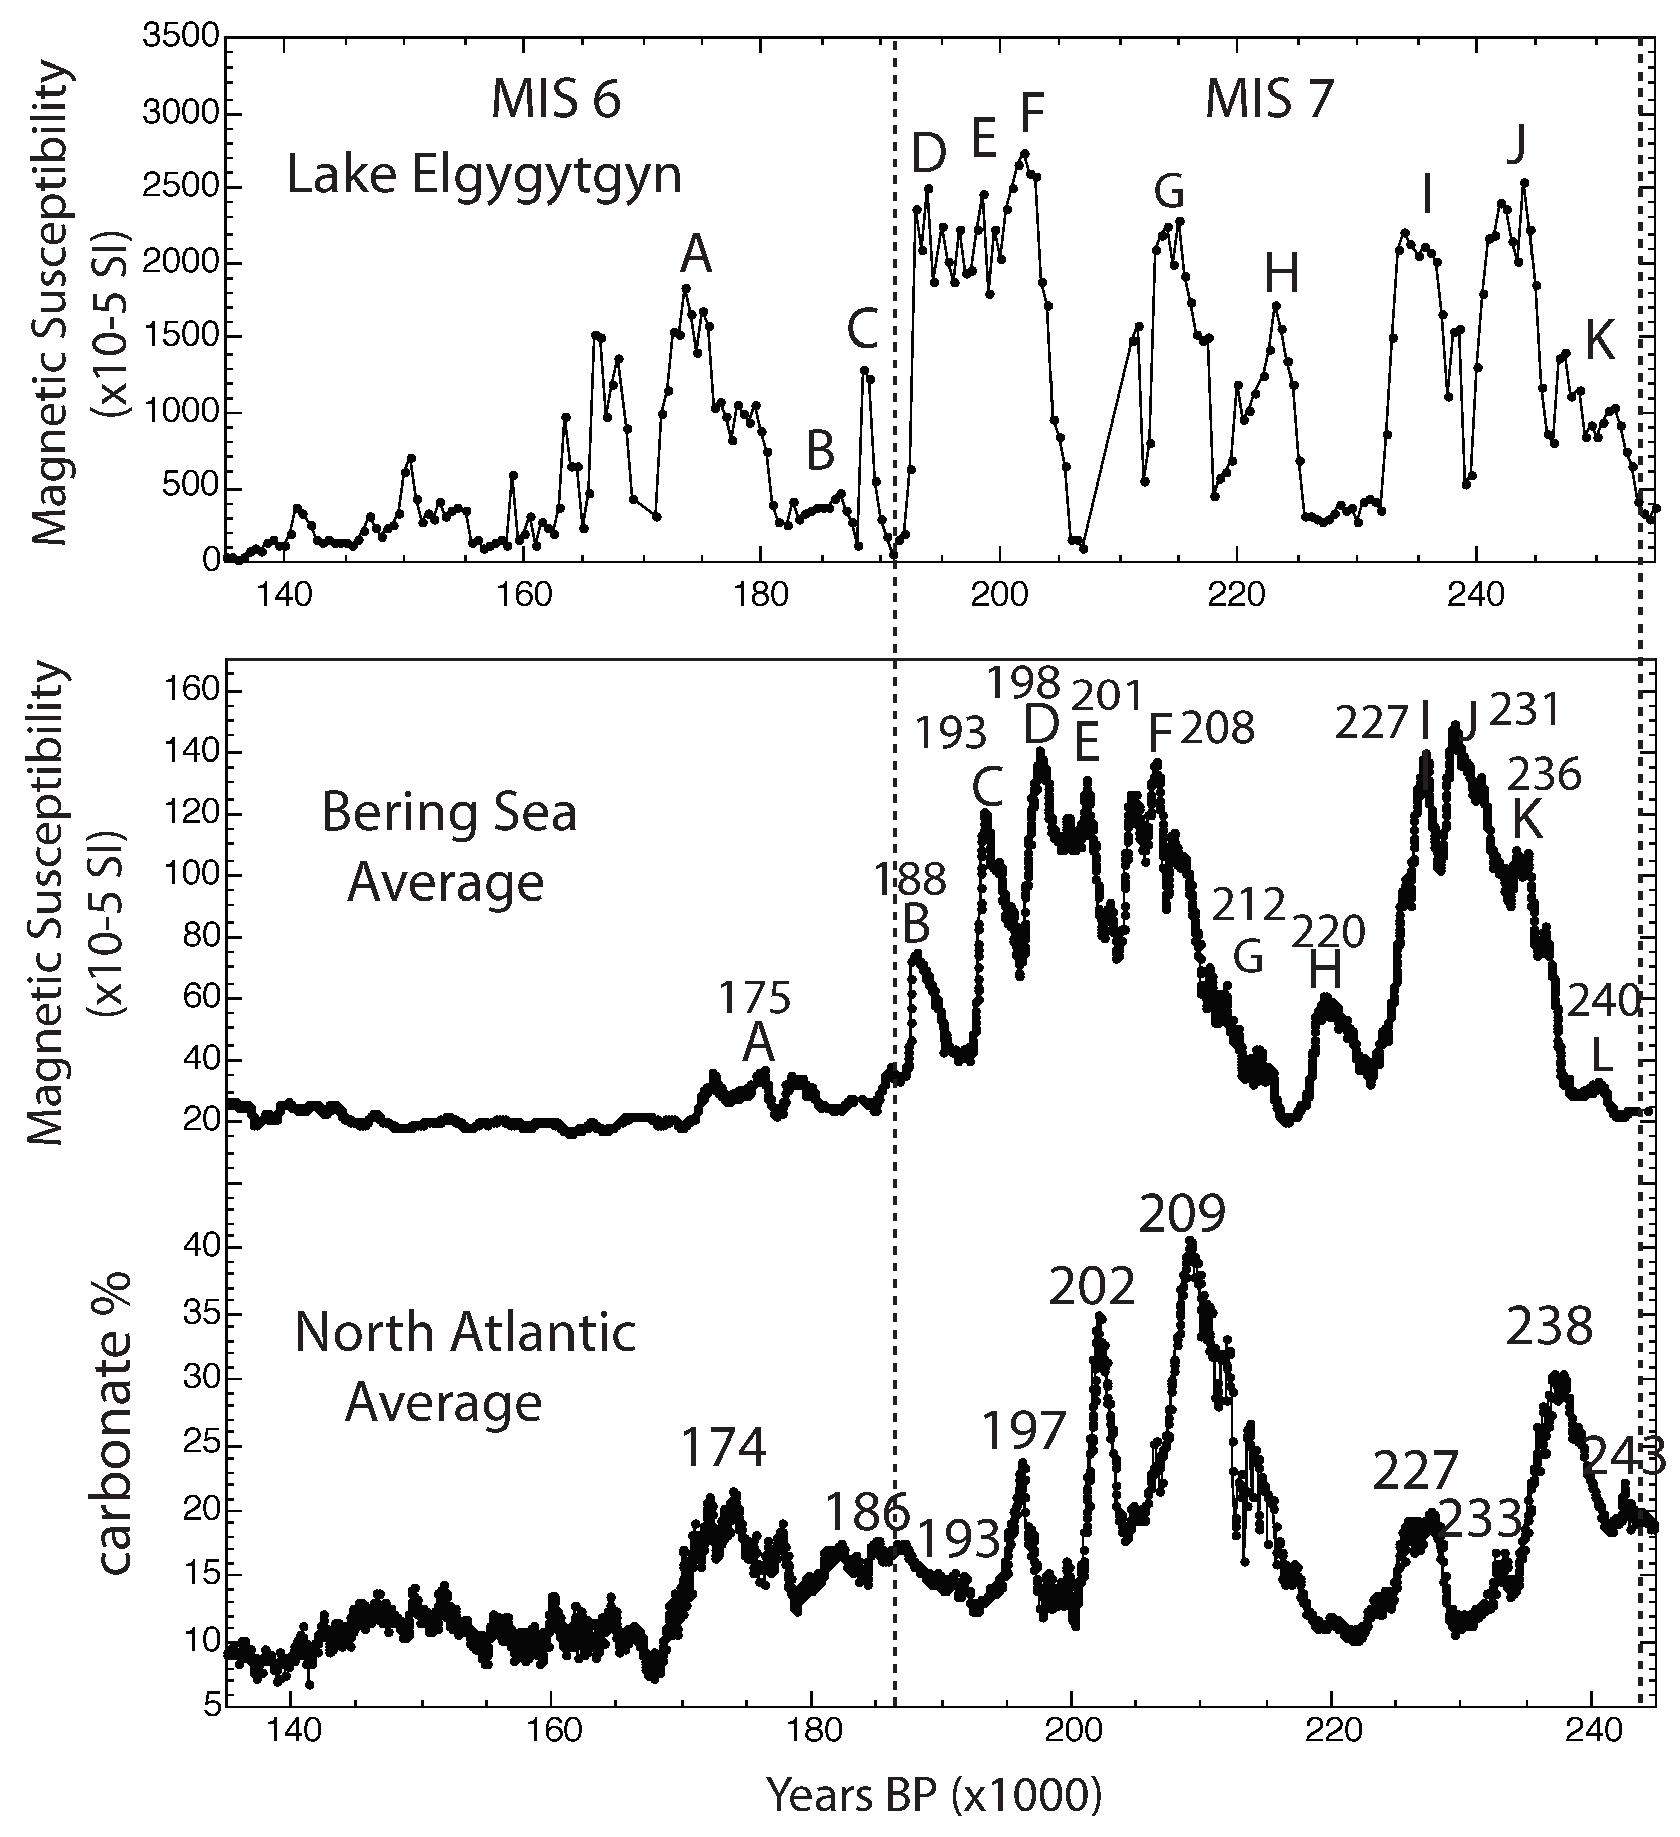
Figure 13 shows the magnetic susceptibility record at Lake Elgygytgyn during MIS 7. There is clear indication of a millennial-scale cyclicity that is consistent with the results from the Bering Sea and North Atlantic. However, a slightly different chronology is necessary to tentatively identify correlative magnetic susceptibility highs at Lake Elgygytgyn (see
Figure 13 top, features A–K). We think that these millennial-scale features are largely synchronous with the other two regions, but the chronostratigraphy is slightly offset.
Figure 14 shows the magnetic susceptibility at Lake Elgygytgyn during MIS 9. There is clear indication of a millennial-scale pattern in cyclicity that is generally consistent with the results from the Bering Sea and North Atlantic. But uncertainties in the overall chronostratigraphy of Lake Elgygytgyn preclude any certain correlation of individual highs with the other two regions.
6. Discussion
The Bering Sea deep-sea sediments (58° N to 60° N) recovered from IODP Ex. 323 record a distinctive pattern of alternating low and high magnetic susceptibility associated with glacial versus interglacial conditions. These alternations are primarily due to extensive ice presence during the glacials limiting continental margin clastic flux entering the Bering Sea. Interglacial, more ice-free conditions allowed significant clastic flux to the Bering Sea.
The interstadials and interglacials in the Bering Sea over the last 400 ka (MIS 3, MIS 5, MIS 7, and MIS 9) also record a distinctive millennial-scale alternation in higher versus lower magnetic susceptibility that we associate with warmer/wetter versus cooler/drier conditions. There is reproducible evidence for seven quasi-cycles in MIS 3, eight cycles in MIS 5, nine cycles in MIS 7, and five cycles in MIS 9. These quasi-cycles have an average recurrence interval of 5000 ± 500 years. There are also intermittent 10 ky gaps in this sequence.
North Atlantic deep-sea sediments (28° N to 33° N), associated with ODP Leg 172, also show a distinctive pattern of alternation in carbonate content, with low values during the glacials and higher values during the interglacials. Here, too, there is a distinctive millennial-scale carbonate oscillation in the interstadials and interglacials, with higher carbonate content associated with warmer/more productive intervals. There is reproducible evidence for seven quasi-cycles in MIS 3, eight cycles in MIS 5, nine cycles in MIS 7, and five cycles in MIS 9. That is the same number of cycles as noted for the Bering Sea. Almost all of the carbonate highs are equivalent in age to the Bering Sea magnetic susceptibility highs. These quasi-cycles also have an average recurrence interval of 5000 ± 500 years. There are also intermittent 10 ky gaps in this sequence that occur at the same time as those larger gaps in the Bering Sea records.
Finally, lake sediments from Lake Elgygytgyn (67° N) also contain a glacial/interglacial alternating record of low/high magnetic susceptibility associated with glacial permanent ice conditions limiting clastic flux to the lake and interglacial partially ice-free conditions that permit higher clastic flux to the lake. Lake Elgygytgyn also shows a millennial-scale pattern of higher versus lower magnetic susceptibility in interstadial MIS 3 and interglacials MIS 5, MIS 7, and MIS 9 that is very similar in style to the records from the Bering Sea and North Atlantic. However, the Lake Elgygytgyn ages of individual magnetic susceptibility highs are not always synchronous with that of the other two regions. Our preference is to consider the magnetic susceptibility in Lake Elgygytgyn to be largely synchronous with that of the other two regions, but the chronostratigraphy is slightly out of kilter.
Spectral analysis confirms the ~5000-year cyclicity that we see in all these records. We have used the Analyseries 2.0.8 program [
35] to determine the millennial-interval spectra of each region and interval using both periodogram and maximum entropy (MEM) estimates (both after removal of any linear trend). Several MEM spectra were generated with varying prediction error filters [
36,
37] from 10% to 40% of each time series length. Stable MEM spectral estimates were generated with filter lengths of 15% to 30%. The results are shown in
Figure 15. There is a persistent ~13–25 ky spectral peak in all records that we associate with the precession Milankovich cyclicity. The next persistent spectral peak is ~5000 ± 500 years (grey intervals in
Figure 15) in all the records.
The interstadial/interglacial millennial-scale environmental variations in the Bering Sea and the North Atlantic (and probably at Lake Elgygytgyn) appear to be synchronous on a Northern Hemispheric scale. These oscillations suggest 5–10 warm cycles in each interstadial/interglacial for the last ~400 ky, with an average recurrence of 5000 ± 500 years. It is not clear what is driving this pattern, but it does need to be at least Northern Hemispheric in scale. The fact that this cyclicity is pervasive over several glacial cycles suggests that its cause is related to Milankovich cyclicity. Two studies [
38,
39] have both noted that the chaotic Milankovich precession cyclicity has a higher harmonic (sub-Milankovich scale) in the 5000-year range. Two separate studies [
40,
41] have found evidence of the ~5000-year cycle in older interglacial climate records in the North Atlantic/European region (MISs 19 and 21).
7. Conclusions
This study documents that three independent regions in the Northern Hemisphere (Bering Sea, North Atlantic Ocean, and Lake Elgygytgyn, Siberia) have millennial-scale environmental cycles (warmer/cooler) during Interstadial 3 and Interglacials 5, 7, and 9 over the last 400 ka. The number and ages of cycles in the Bering Sea and North Atlantic Ocean are not significantly different. The cycles in Lake Elgygytgyn are very similar in number and age, this study indicates the chronology of Lake Elgygytgyn is not high enough in resolution to be sure of synchrony. Spectral analysis of all of the individual Interstadial/Interglacial paleoenvironmental records indicates from the three independent regions and identified a common ~5000 ± 500-year cyclicity in them. This cyclicity is spatially common to all three independent study regions in the Northern Hemisphere and temporally common to all of the Interstadial/Interglacial intervals of the last 400 ka. This commonality of cyclicity, both spatially and temporally, suggests to us that this cyclicity is due to a known ~5000-year harmonic of the chaotic precession Milankovich cyclicity.


