
Deformation and Evolution of Akata Formation Mudstone in the Niger Delta Basin: Insights from Analogue Models

Abstract
1. Introduction
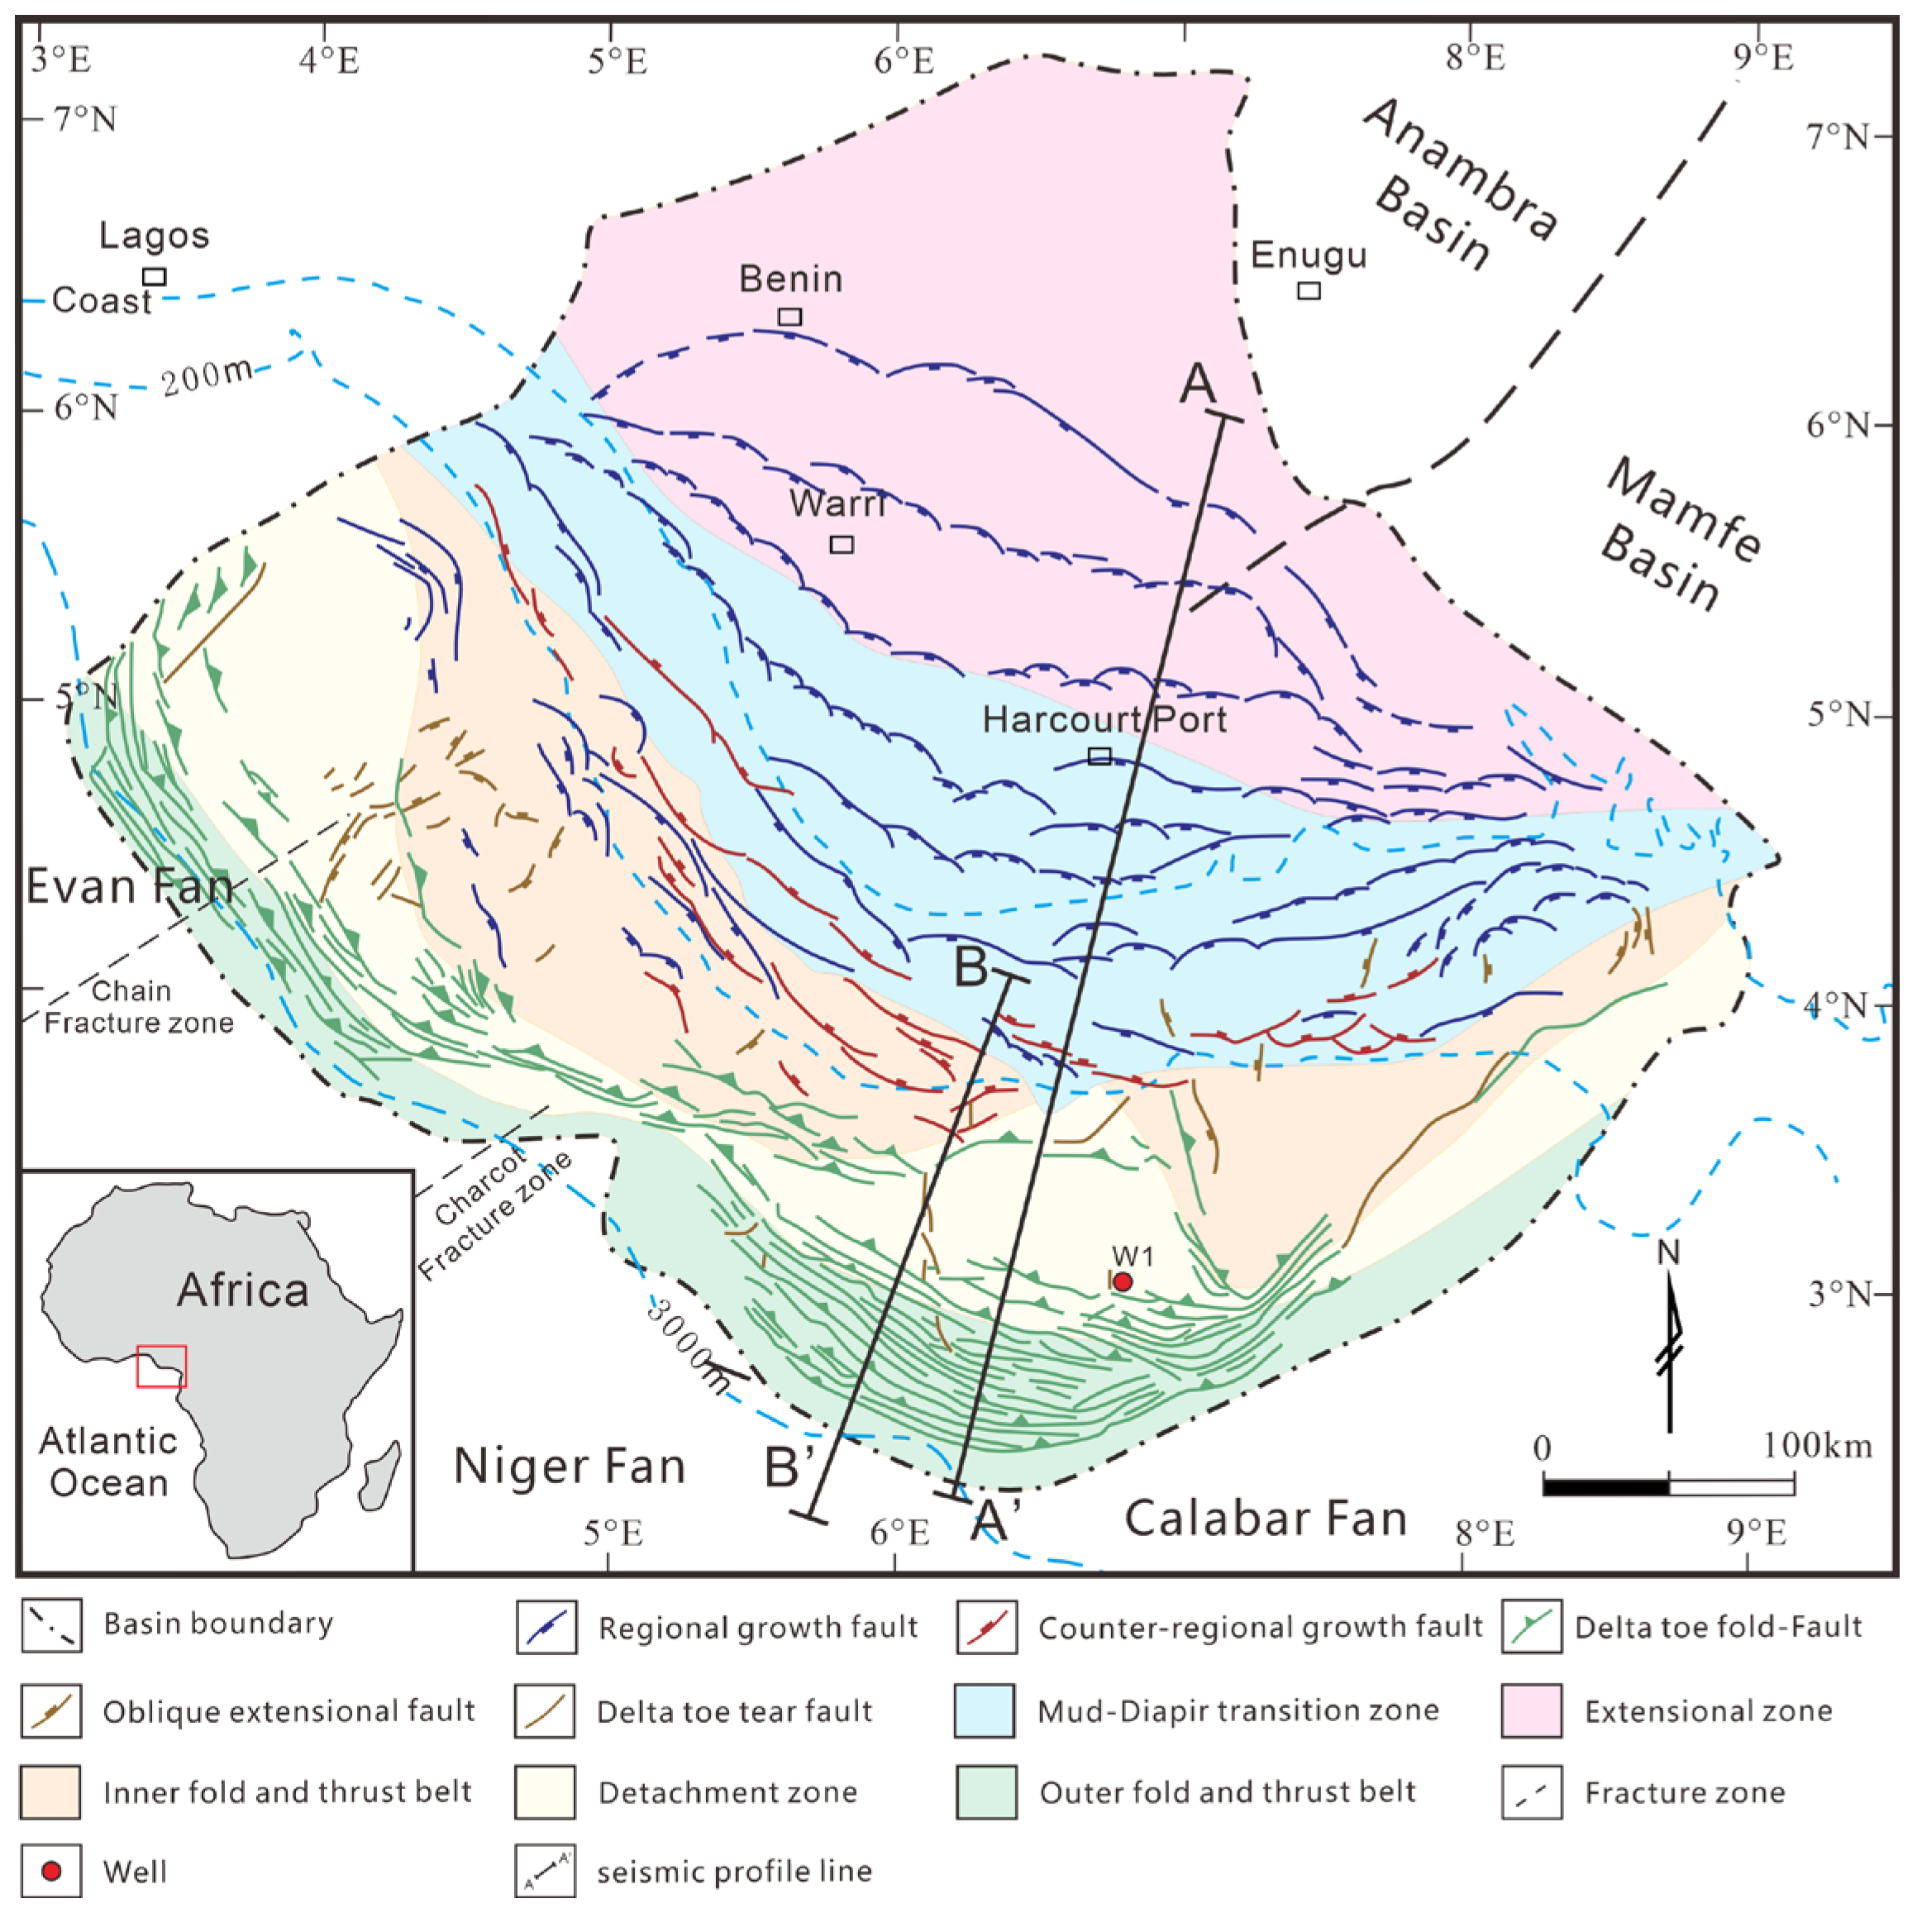
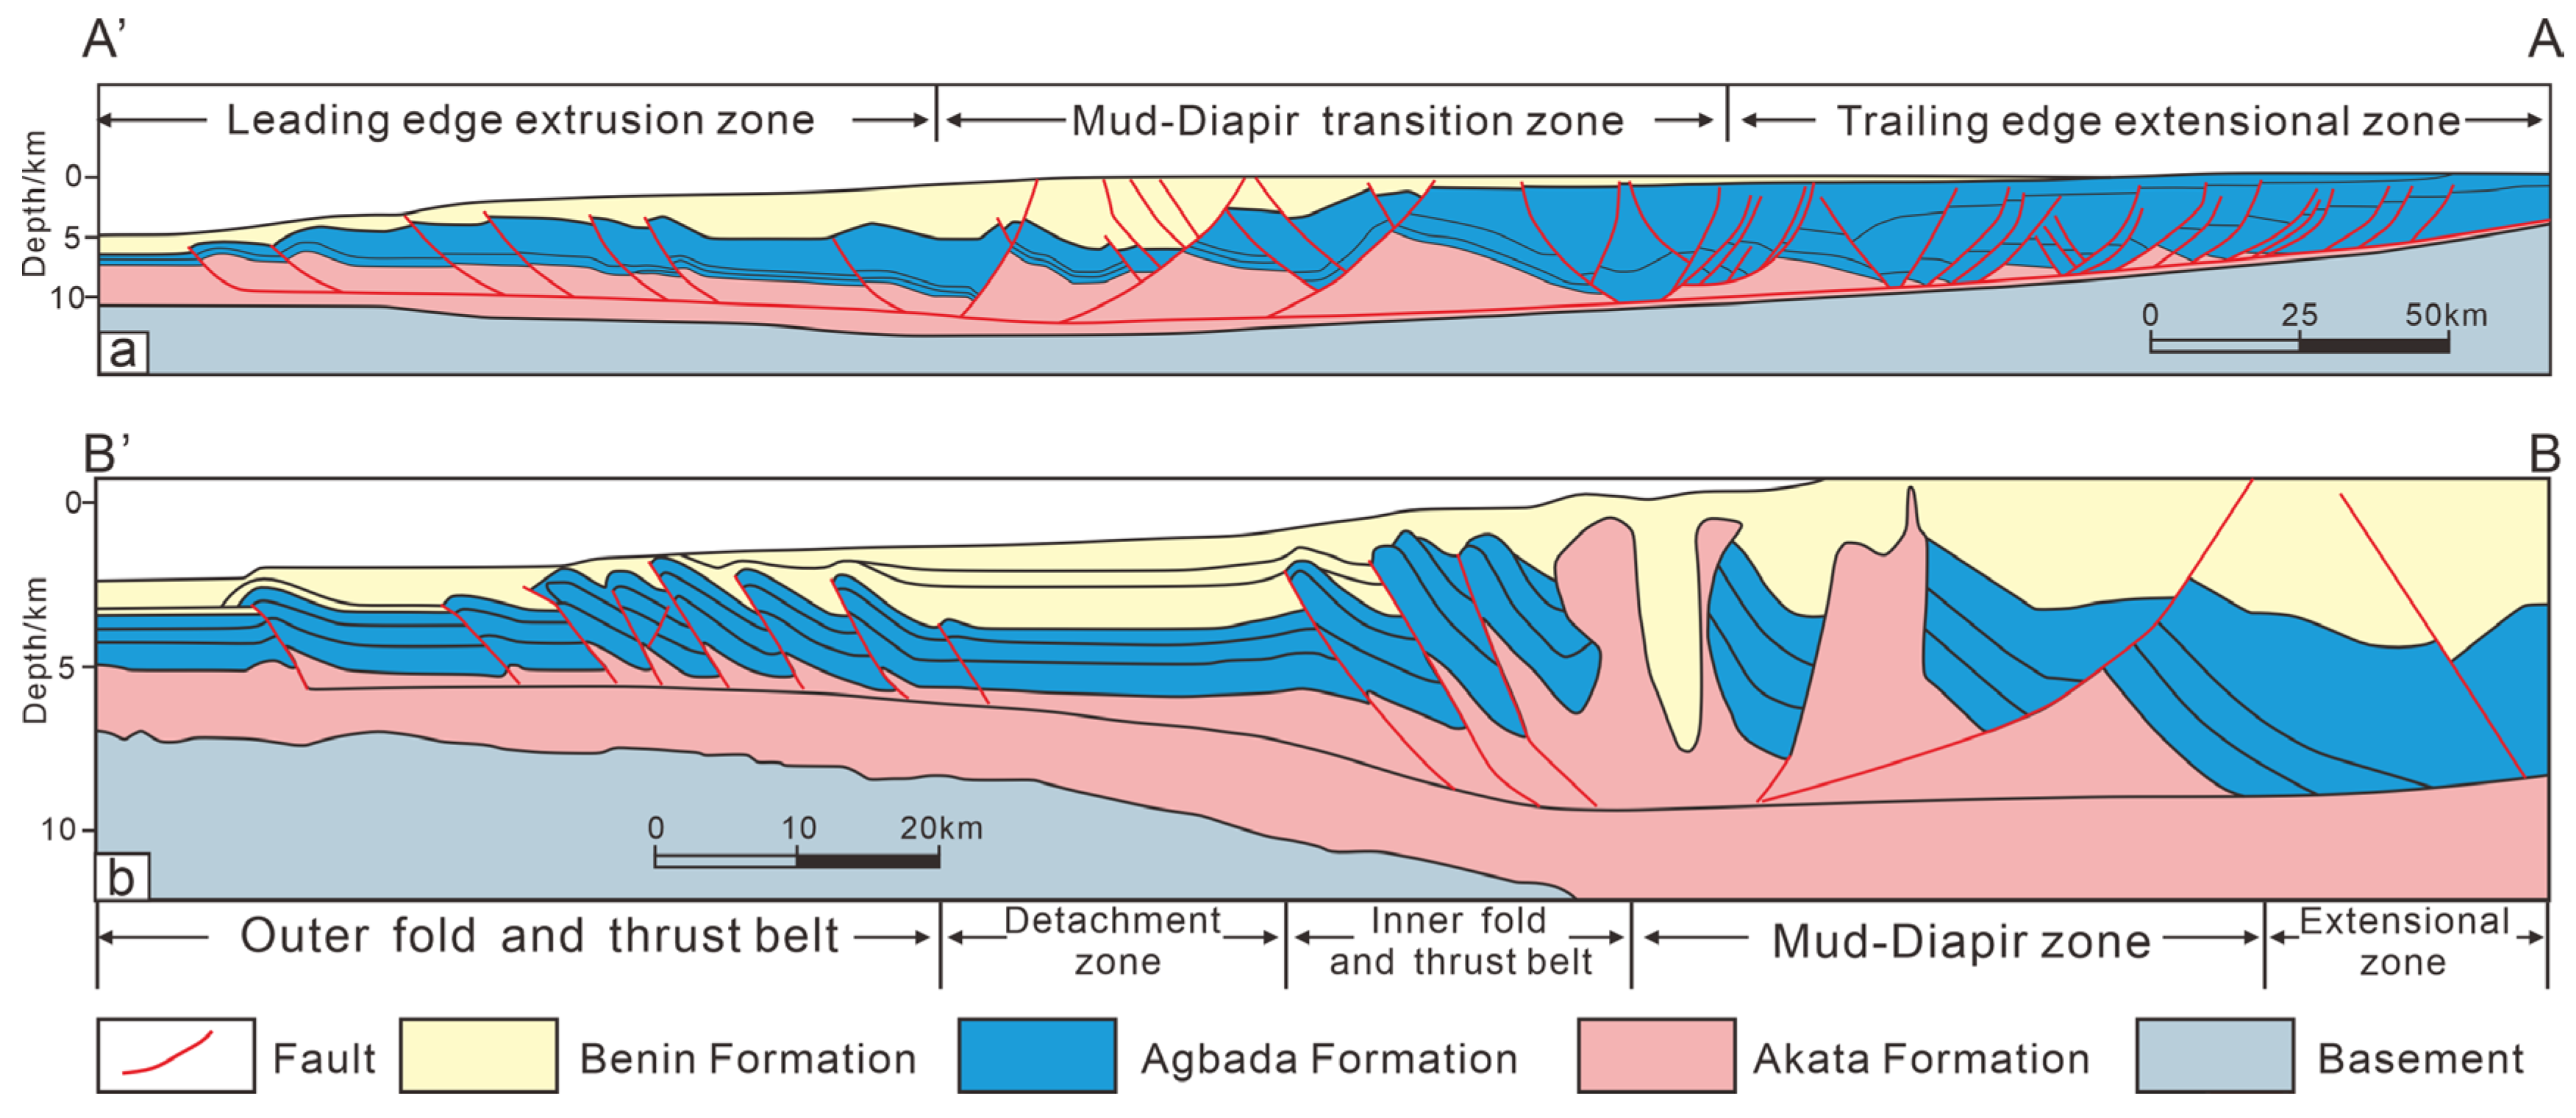
2. Geologic Setting
3. Methodology
3.1. Experimental Material
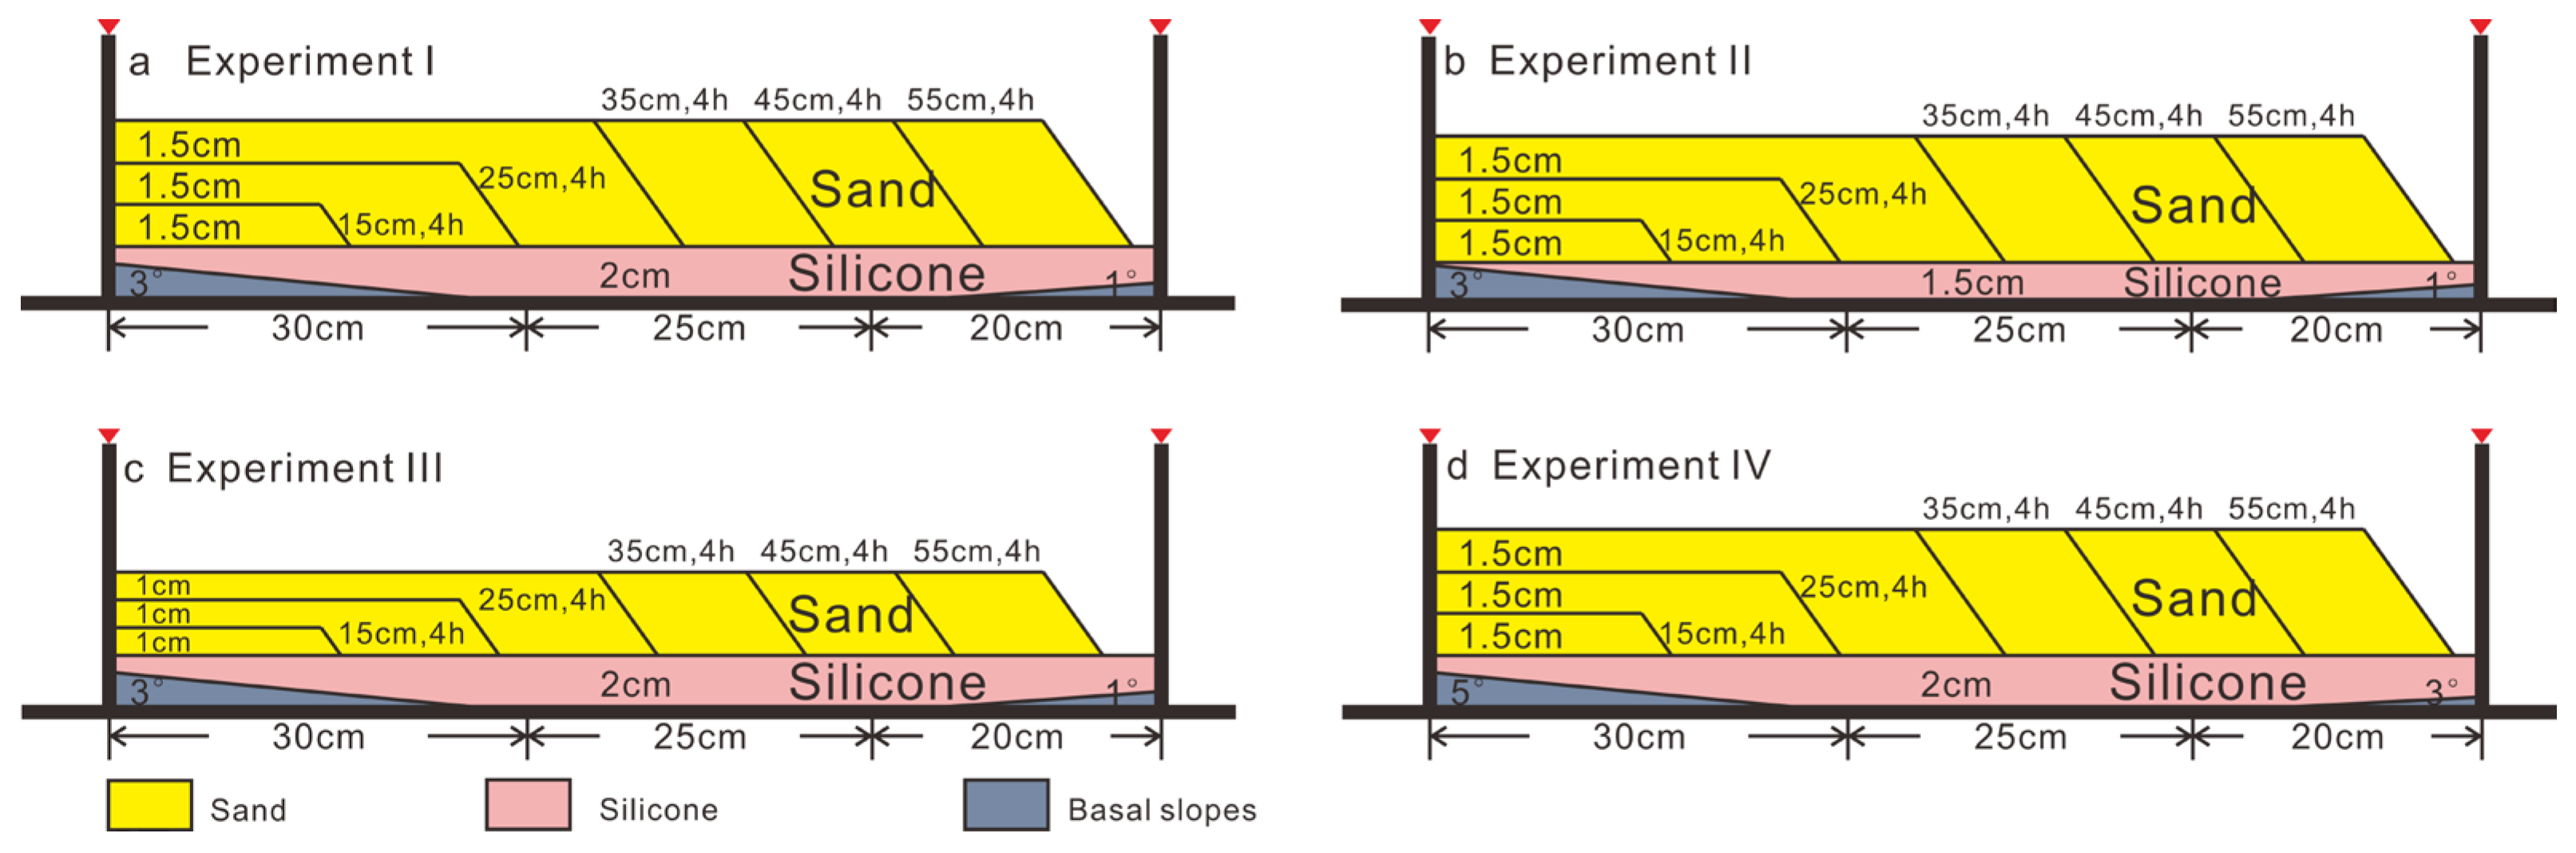
3.2. Model Design
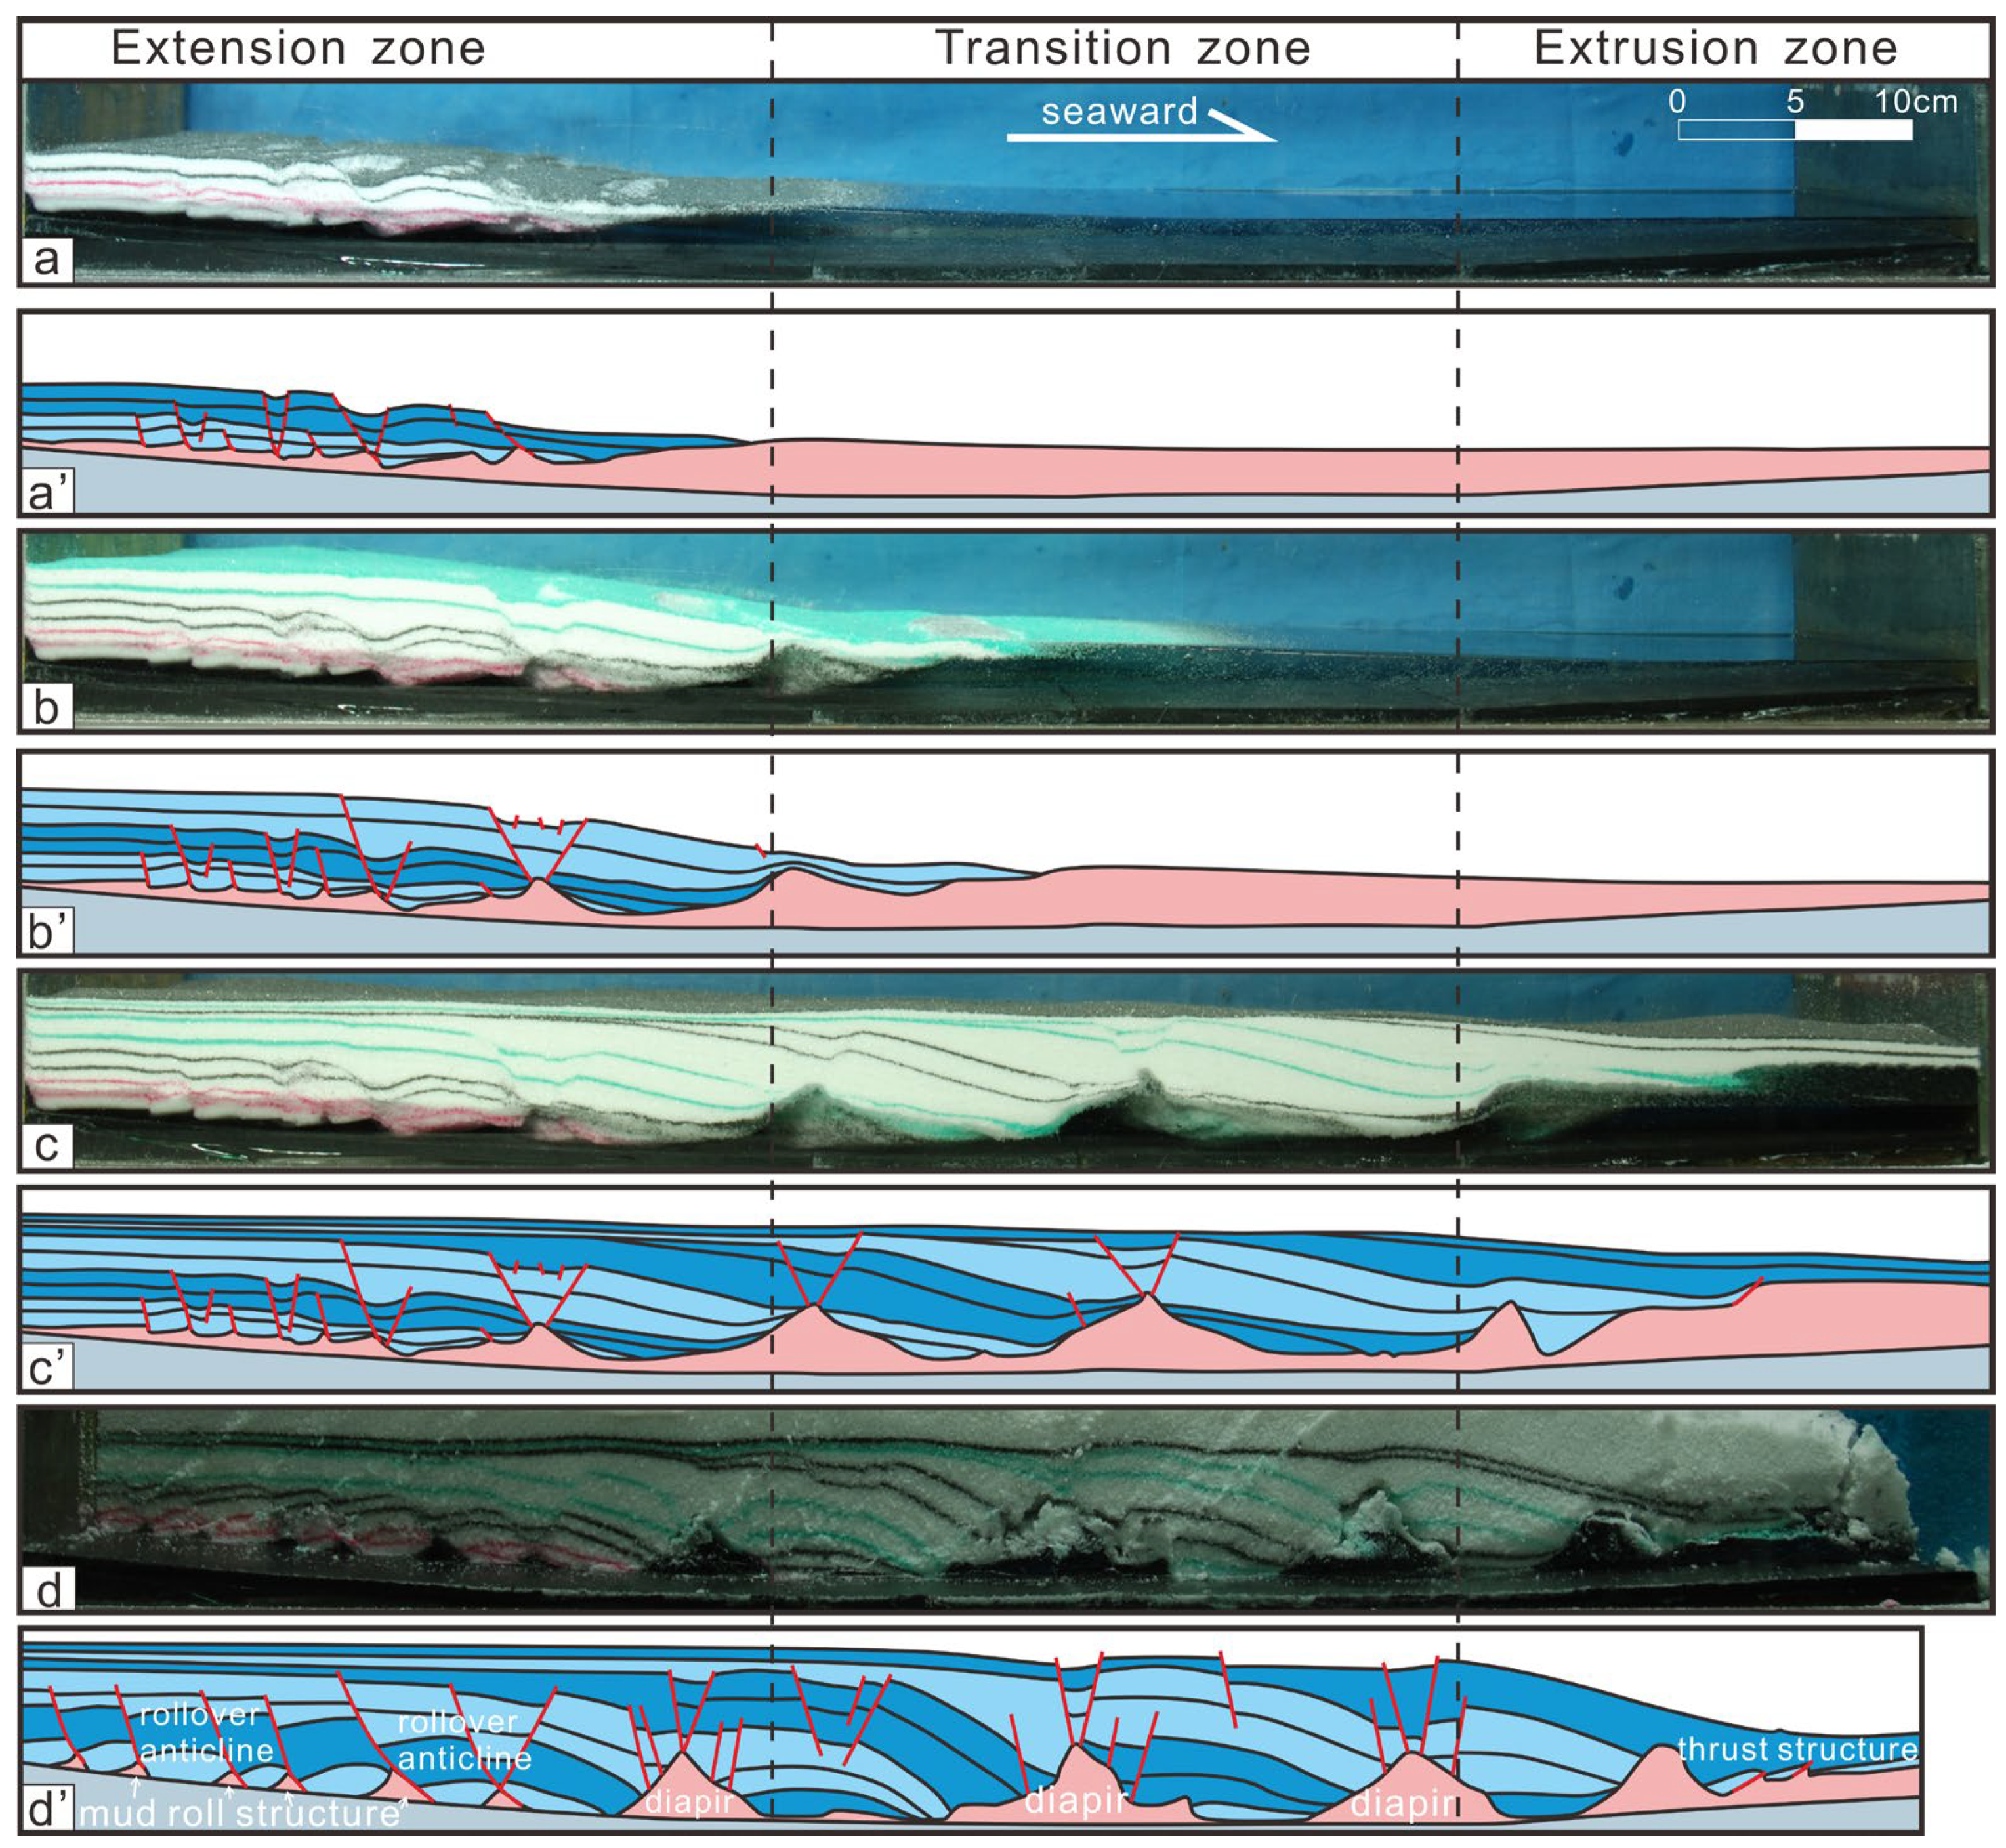
4. Results
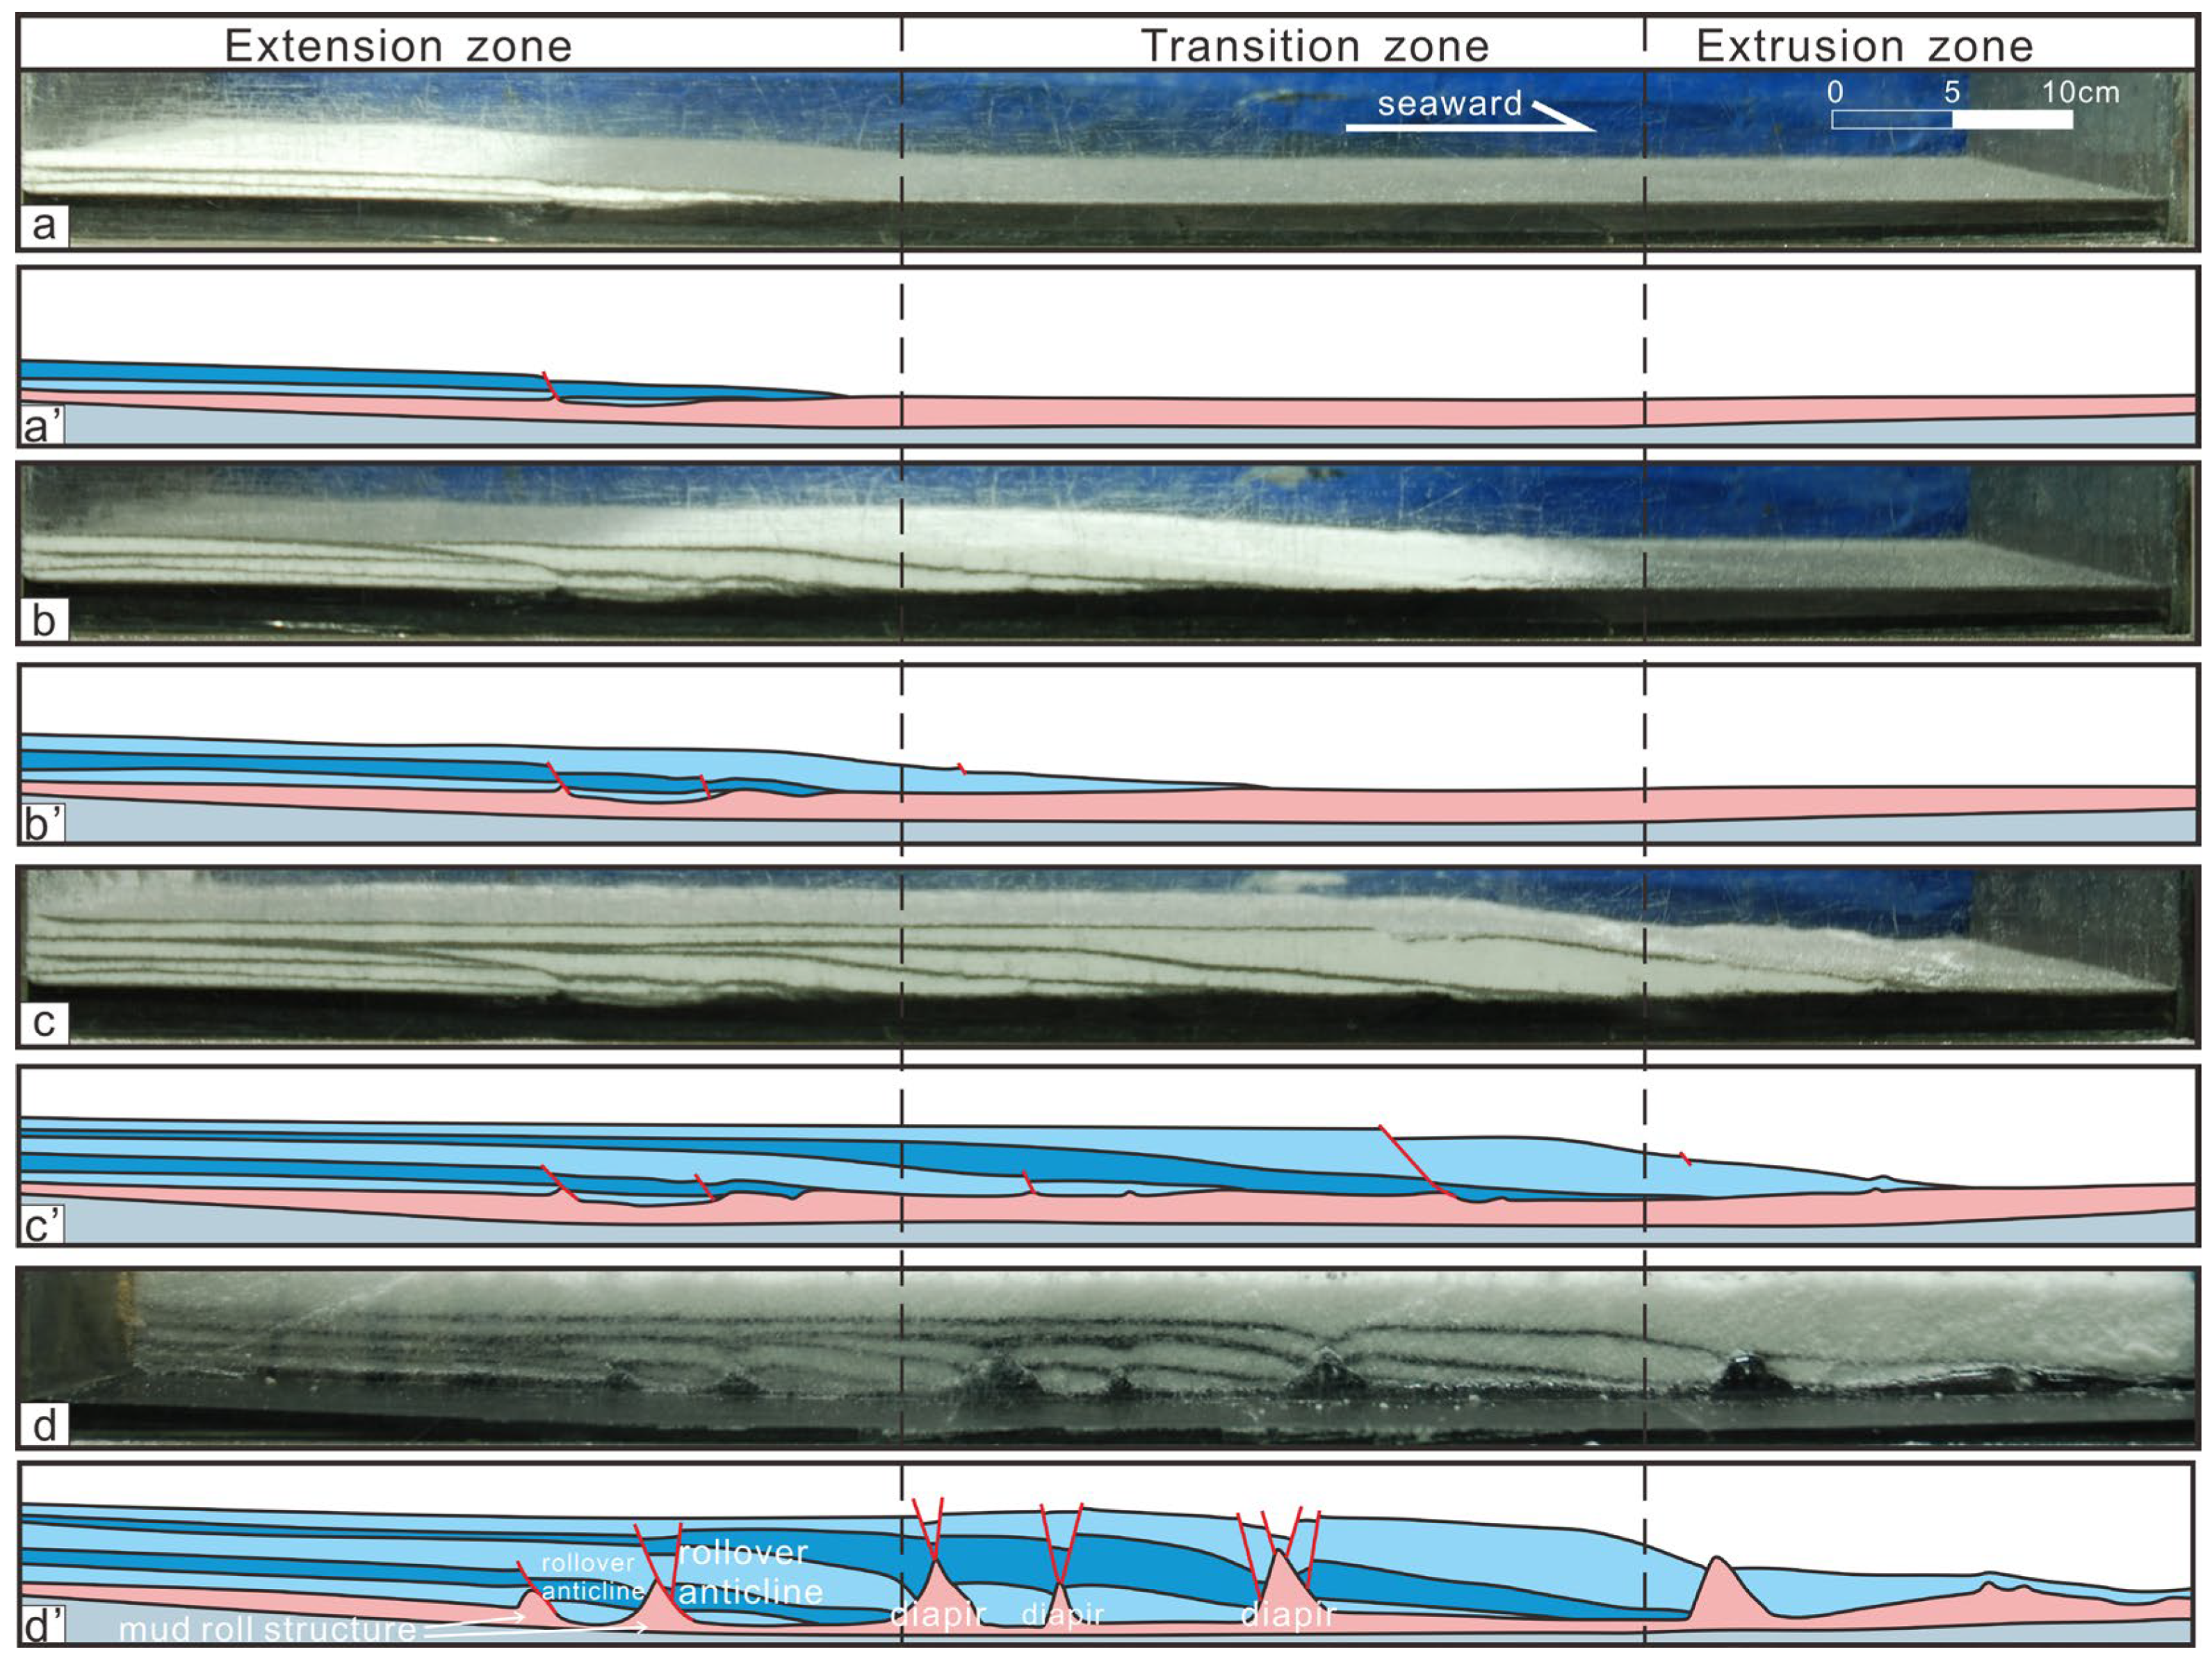
4.1. Experiment I
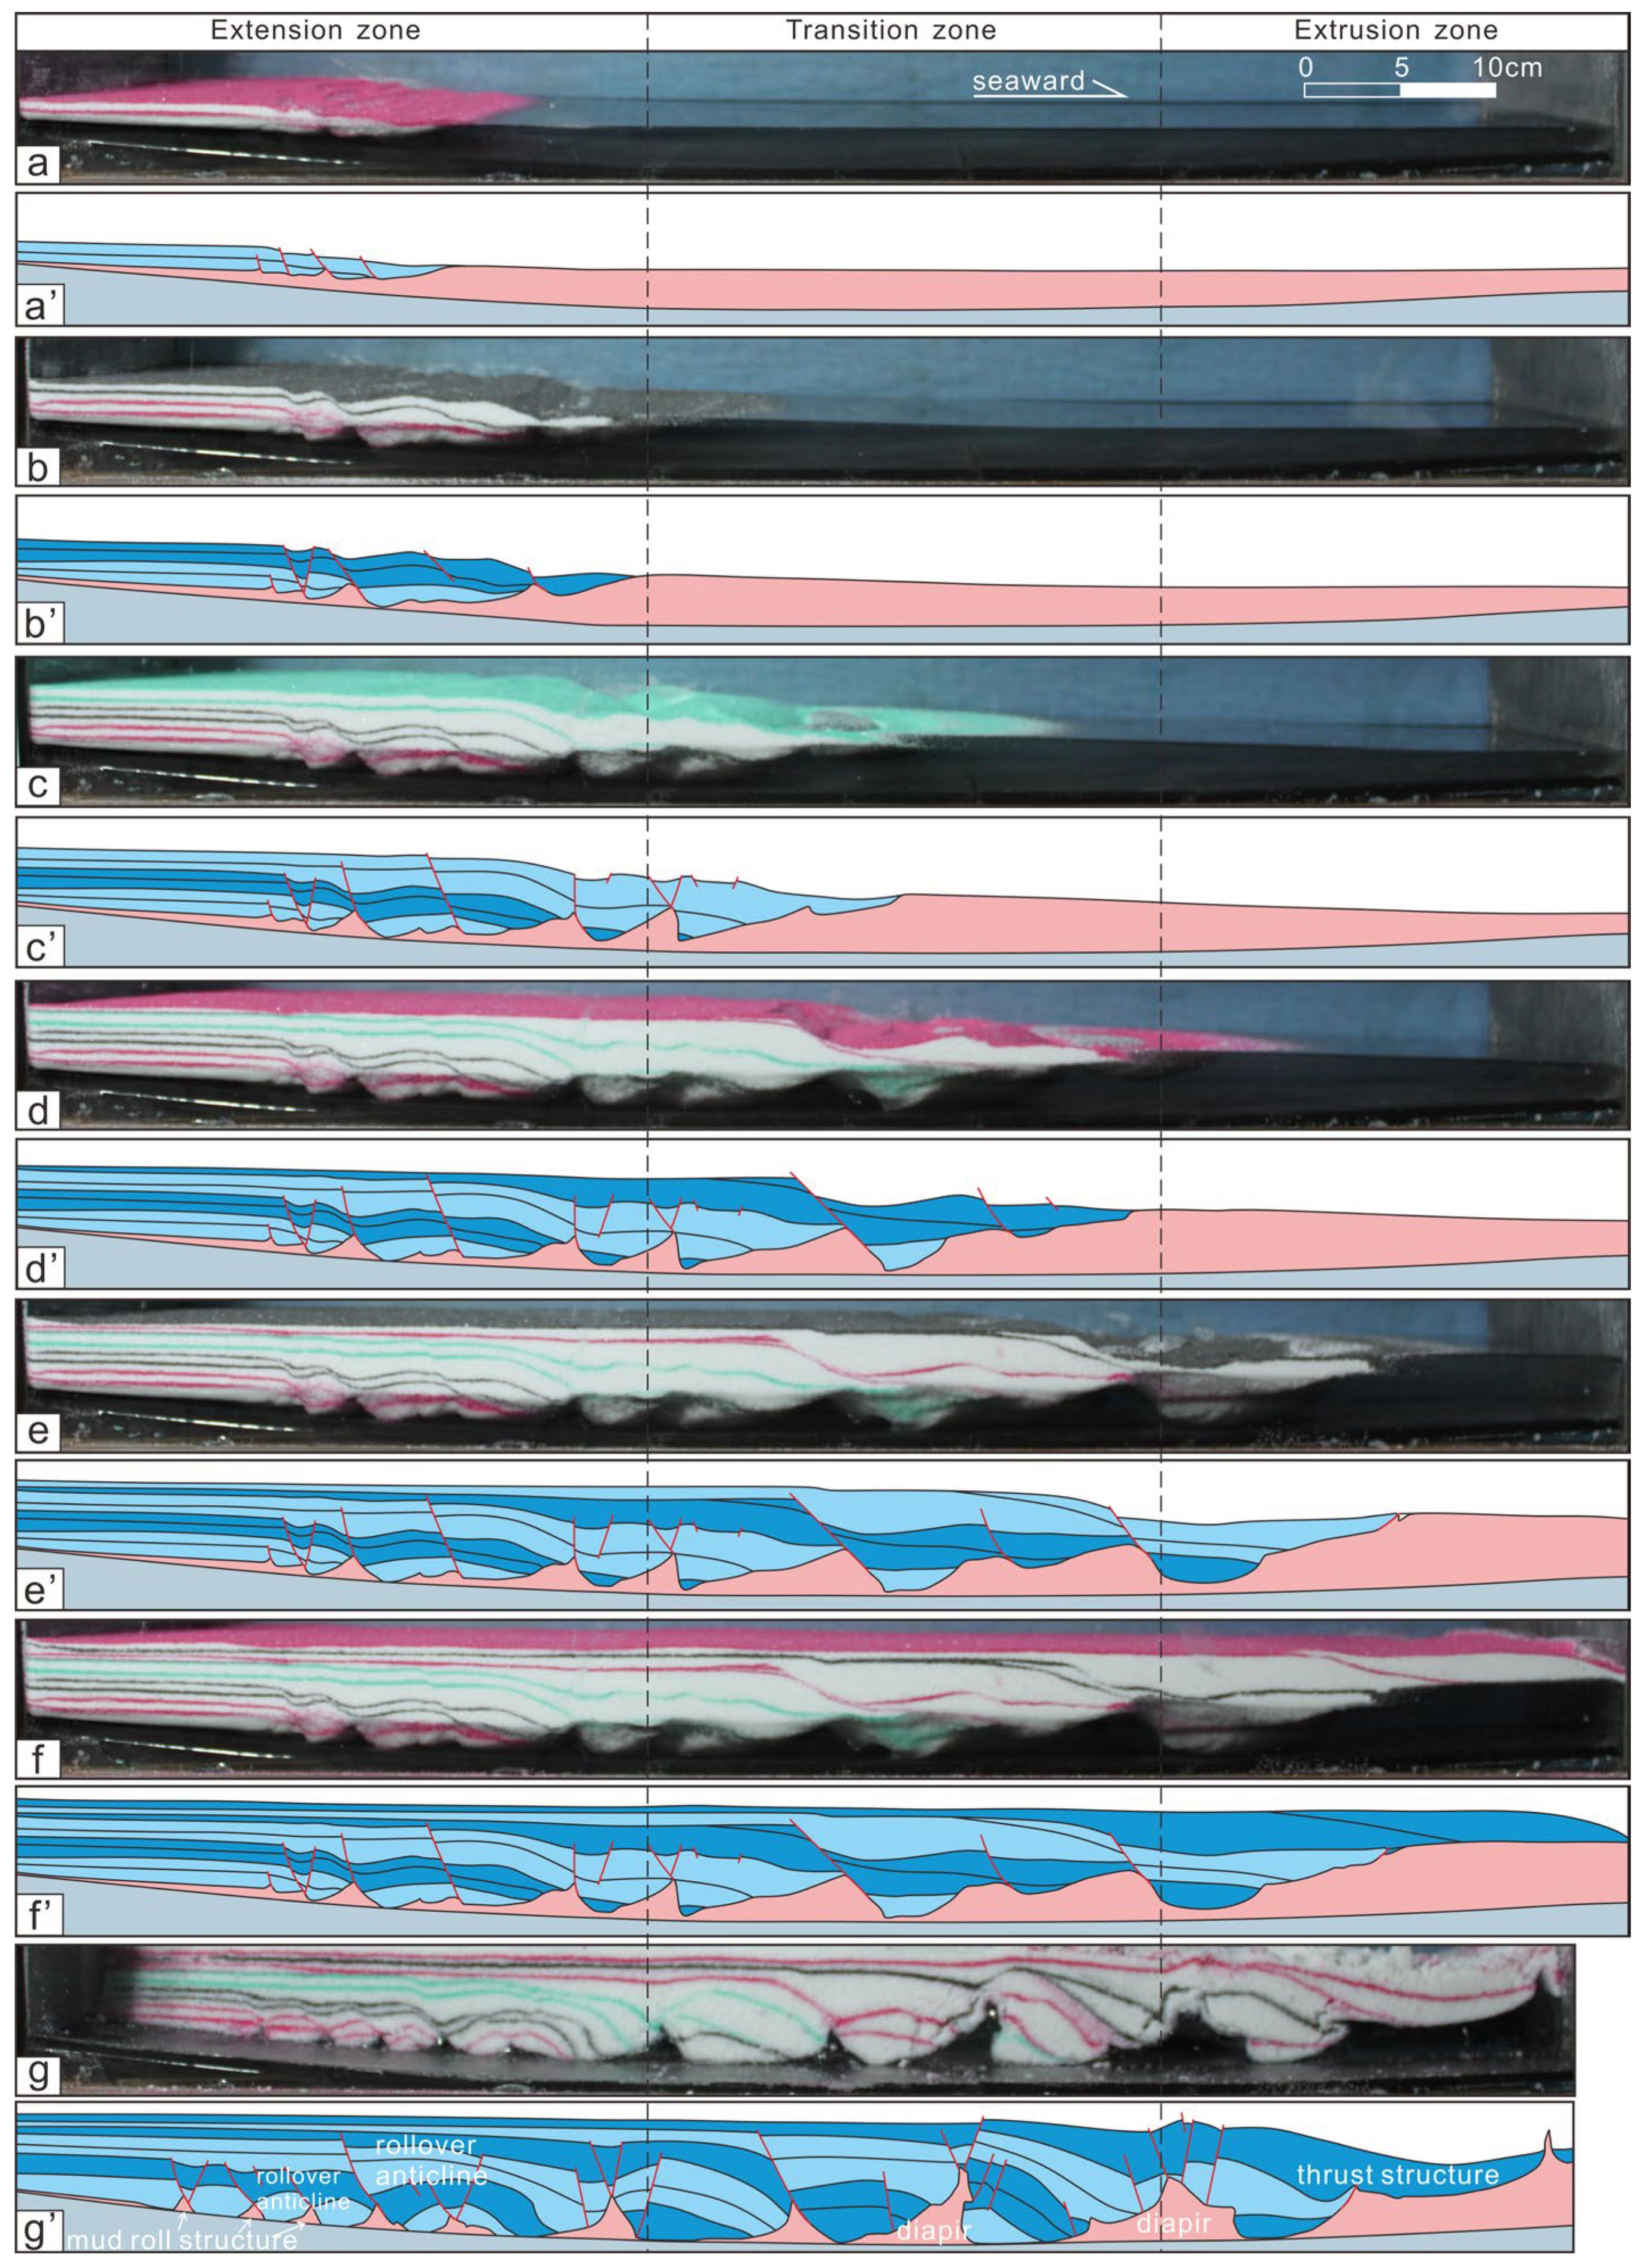
4.2. Experiment II
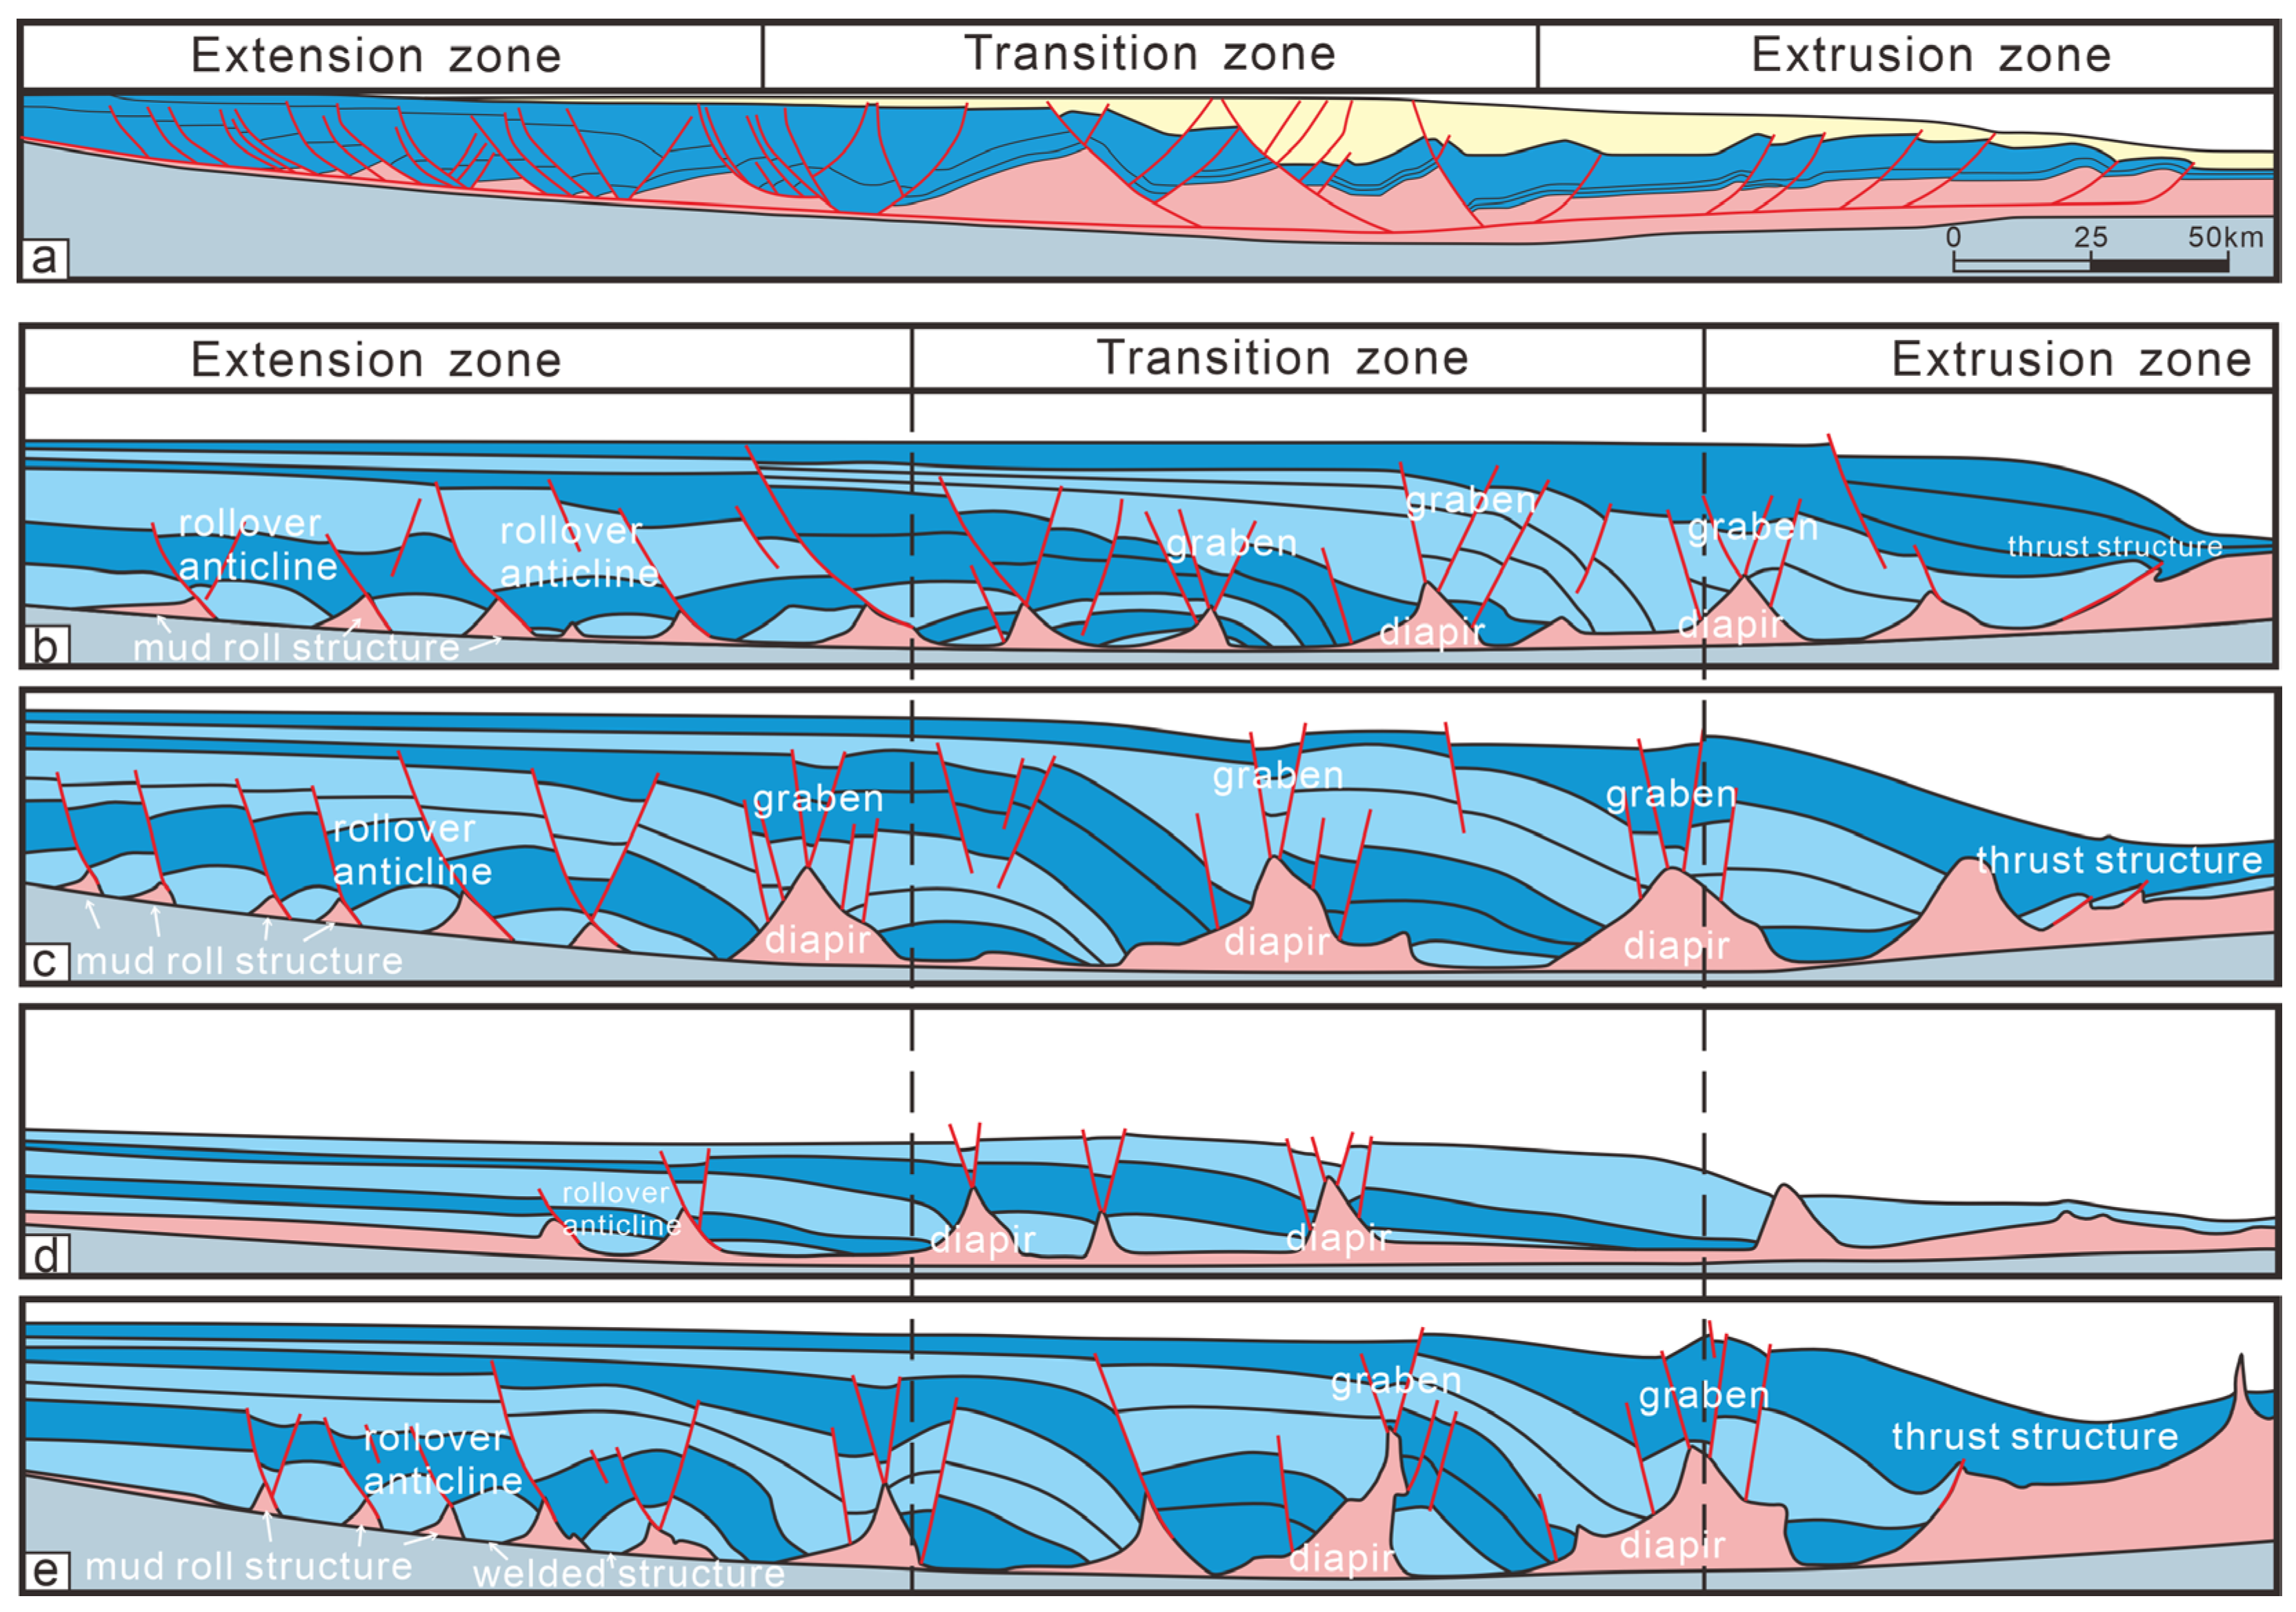
4.3. Experiment III
4.4. Experiment IV
5. Discussion
5.1. Validity and Limitations of the Model
5.2. Controlling Factors
5.2.1. Gravity Gliding and Spreading
5.2.2. Thickness of the Mudstone Layer
5.2.3. Thickness of the Overlying Strata
5.2.4. Basement Slope Inclination
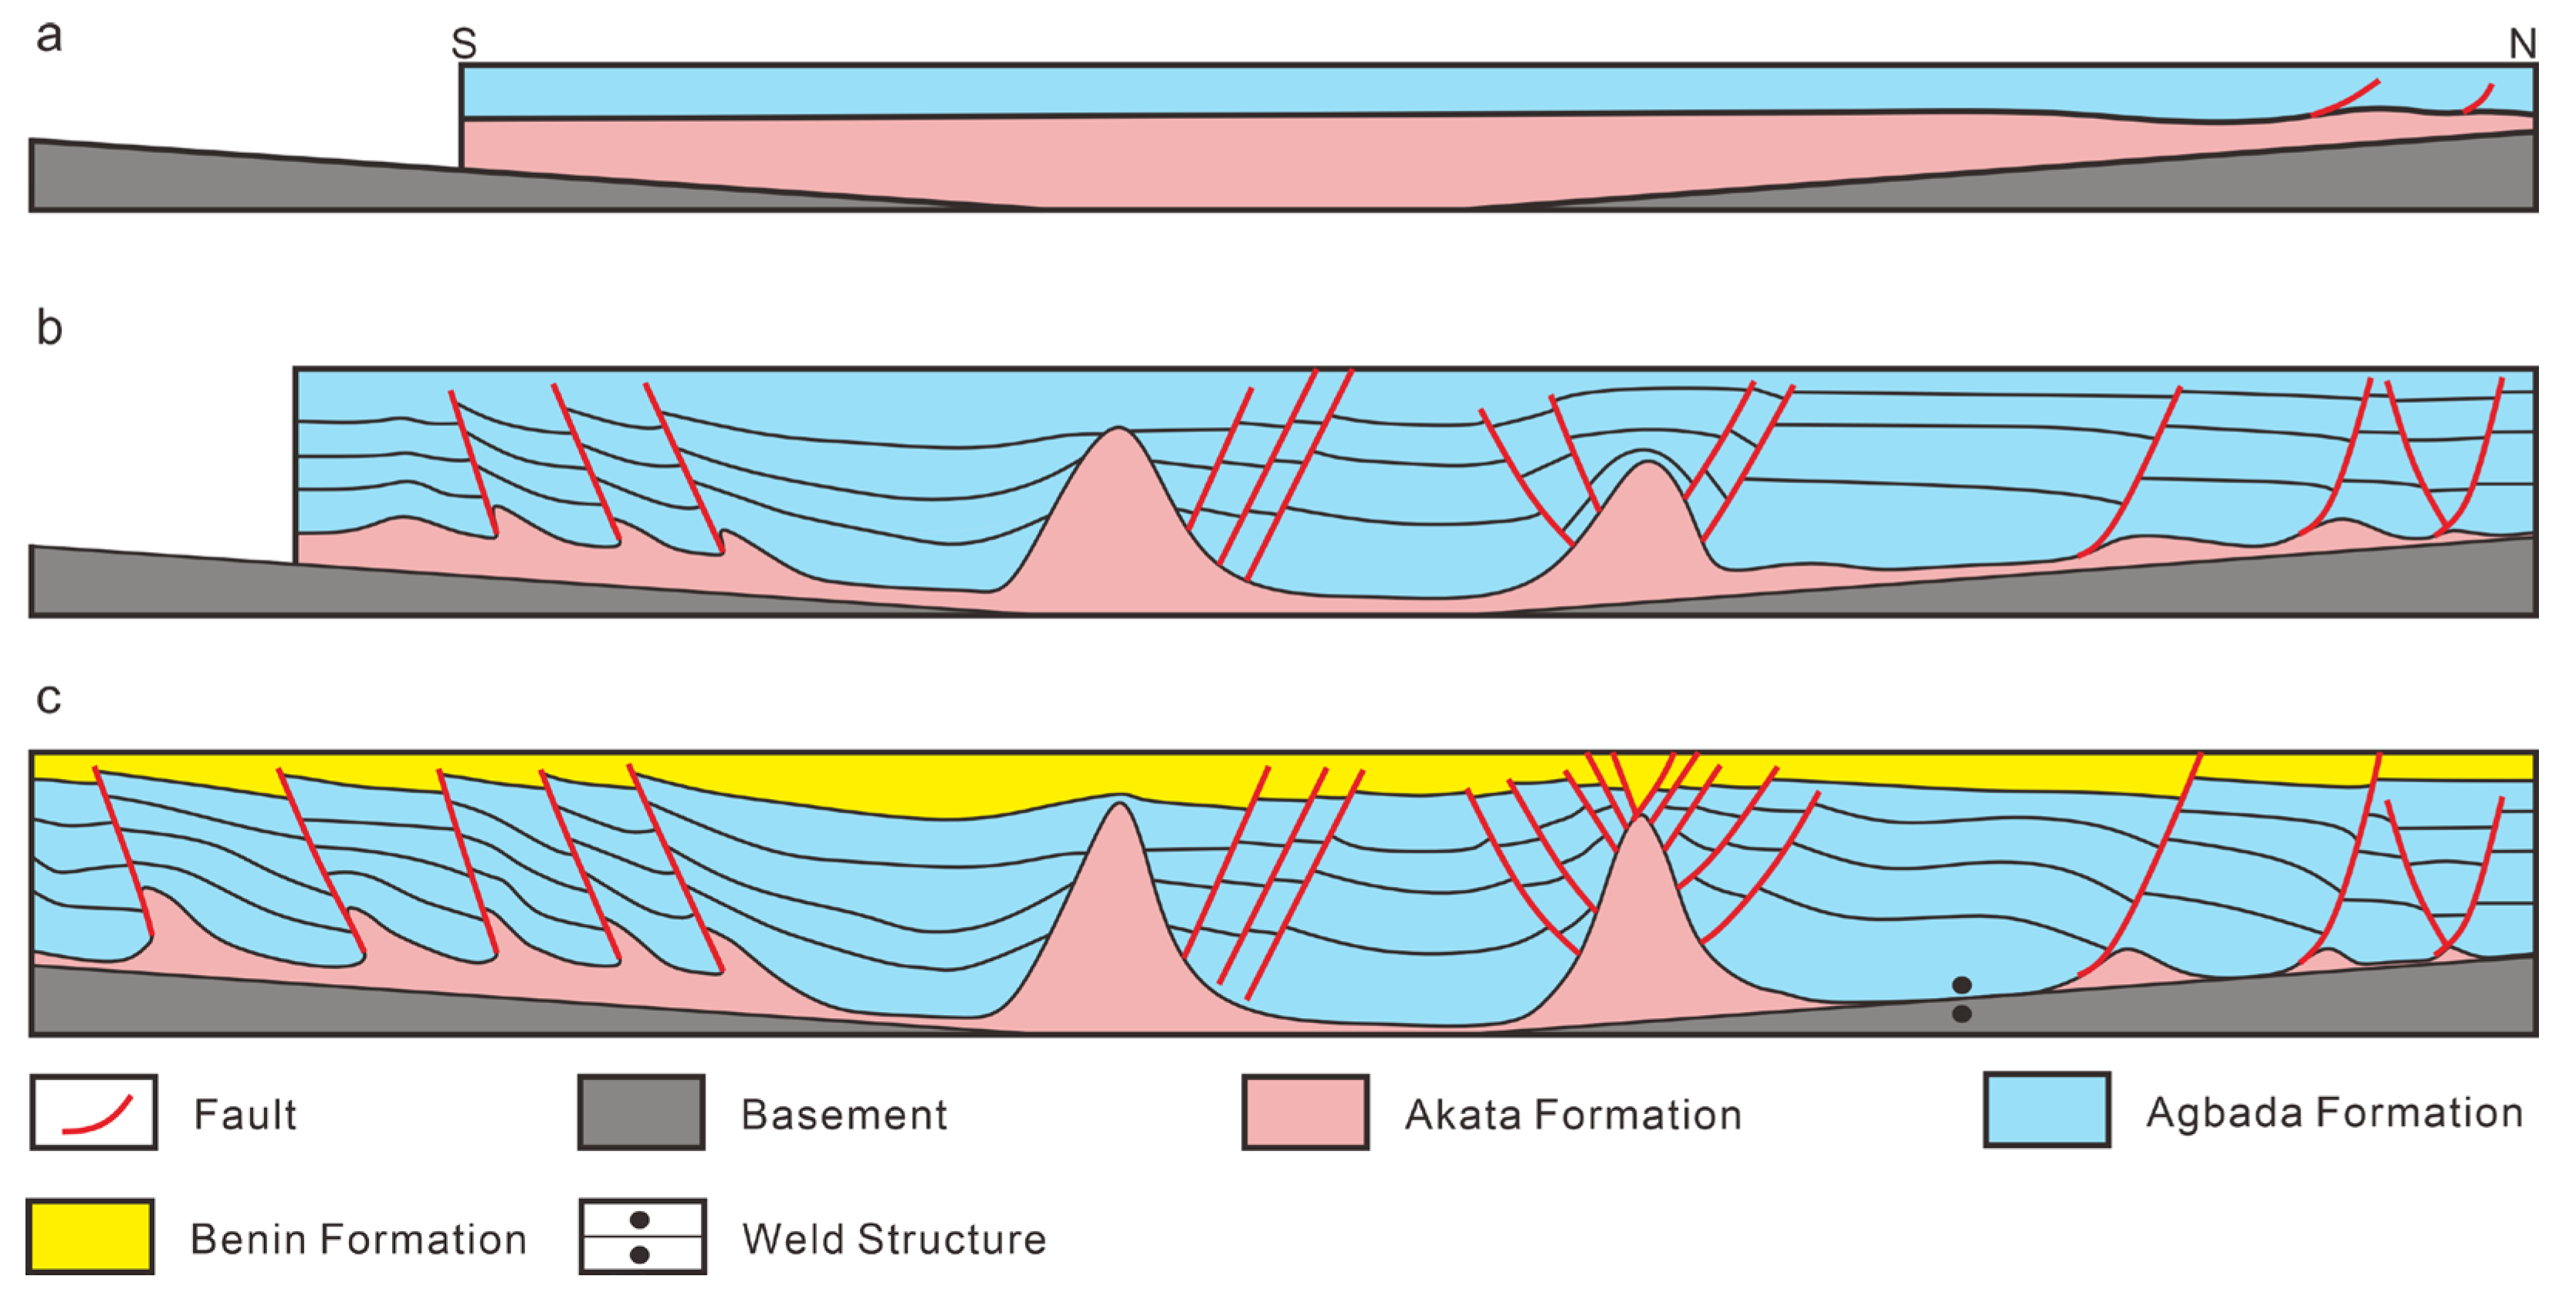
5.3. Evolutionary Model of Mudstone Structures
6. Conclusions
- The tectonic deformation of the Niger Basin results from the combined influence of gravity sliding and spreading. The main driver of mudstone deformation is gravity spreading caused by the differential load of overlying layers. The basement morphology is the decisive factor in tectonic zonation in the Niger Basin;
- The development of mudstone structures is also affected by the inclination of the basement slope and the thicknesses of the mudstone and overlying layers. A larger basement slope inclination favors the rapid flow of mudstone, which promotes the development of low-maturity mud roll structures, large-scale mudstone diapirs, and high-angle thrust nappe structures. Thinner shale layers, characterized by lower plastic mobility, facilitate the full development of mudstone structures, resulting in symmetrical mud diapirs and mud-roll structures. The effects of differential loading and gravity spreading were enhanced as the overburden thickness increased, leading to the development of large and numerous mudstone structures and stronger overburden deformation;
- The formation and evolution of mudstone structures in the Niger Basin mainly involve three stages: initial sediment weakly active stage; strongly active uplift stage; and weakly active overall burial stage. Before the Middle Oligocene, a thick layer of marine mudstone was deposited in the basin, and a few detachment faults were formed. In the Late Oligocene to Miocene, numerous mudstone structures developed and showed obvious tectonic zonation. Since the Pliocene, the tectonic activity of the basin has weakened, welding structures have developed in some areas of the extension zone, and the mud diapirs in the transition zone have been slightly uplifted.
Author Contributions
Funding
Data Availability Statement
Conflicts of Interest
References
- Cobbold, P.R.; Clarke, B.J.; Loseth, H. Structural consequences of fluid overpressure and seepage forces in the outer thrust belt of the Niger Delta. Pet. Geosci. 2009, 15, 3–15. [Google Scholar] [CrossRef]
- Ogbe, O.B. Sequence stratigraphic controls on reservoir characterization and architectural analysis: A case study of Tovo field, coastal swamp depobelt, Niger Delta Basin, Nigeria. Mar. Pet. Geol. 2020, 121, 104579. [Google Scholar] [CrossRef]
- Gao, Y.F.; Fan, T.E.; Cai, W.T.; Wang, X.B.; Le, J.; Bu, F.Q.; Chen, F.; Ma, L.T.; He, R.S. Evolution characteristics and main controlling factors of deepwater turbidite system in the Miocene of the Niger Delta Basin. J. Northeast. Pet. Univ. 2024, 48, 1–16. [Google Scholar] [CrossRef]
- Haack, R.C.; Sundararaman, P.; Diedjomahor, J.O.; Xiao, H.; Kelsch, K. Niger delta petroleum systems, Nigeria. AAPG Mem. 2000, 73, 213–231. [Google Scholar] [CrossRef]
- Corredor, F.; Shaw, J.H.; Bilotti, F. Structural styles in the deep-water fold and thrust belts of the Niger Delta. Aapg Bull. 2005, 89, 753–780. [Google Scholar] [CrossRef]
- Ani, C.C.; Mamah, L.I.; Arinze, I.J.; Emedo, C.O. Reconnaissance Hydrocarbon Prospecting of Afikpo, Oban Massif and Up-Dip Niger Delta, Nigeria. Iran. J. Sci. Technol. Trans. A Sci. 2022, 46, 1599–1612. [Google Scholar] [CrossRef]
- Wen, Z.X.; Xu, H.; Wang, Z.M.; He, Z.J.; Song, C.P.; Chen, X.; Wang, Y.H. Classification and hydrocarbon distribution of passive continental margin basins. Pet. Explor. Dev. 2016, 43, 678–688. [Google Scholar] [CrossRef]
- Bilotti, F.; Shaw, J.H. Deep-water Niger Delta fold and thrust belt modeled as a critical-taper wedge: The influence of elevated basal fluid pressure on structural styles. Aapg Bull. 2005, 89, 1475–1491. [Google Scholar] [CrossRef]
- Guterman, V.G. Model studies of gravitational gliding tectonics. Tectonophysics 1980, 65, 111–126. [Google Scholar] [CrossRef]
- Coward; Mcclay, P. Diapirism and gravity tectonics: Report of a Tectonic Studies Group conference held at Leeds University, 25–26 March 1980. J. Struct. Geol. 1981, 3, 89–95. [Google Scholar] [CrossRef]
- Milkov, A.V. Worldwide distribution of submarine mud volcanoes and associated gas hydrates. Mar. Geol. 2000, 167, 29–42. [Google Scholar] [CrossRef]
- Planke, S.; Svensen, H.; Hovland, M.; Banks, D.A.; Jamtveit, B. Mud and fluid migration in active mud volcanoes in Azerbaijan. Geo-Mar. Lett. 2003, 23, 258–268. [Google Scholar] [CrossRef]
- Alberta, M.; Beaumont, C.; Ings, S.J. Geodynamic Modeling of Sedimentation-induced Overpressure, Gravitational Spreading, and Deformation of Passive Margin Mobile Shale Basins. Aapg Mem. 2010, 93, 29–62. [Google Scholar] [CrossRef]
- Kukla, P.A.; Strozyk, F.; Mohriak, W.U. South Atlantic salt basins—Witnesses of complex passive margin evolution. Gondwana Res. 2017, 53, 41–57. [Google Scholar] [CrossRef]
- Yu, Y.X.; Tao, C.Z.; Shi, S.Y.; Yin, J.Y.; Wu, C.W.; Liu, J.J. Physical modeling of salt structures in the middle south Atlantic marginal basins and their controlling factors. Pet. Explor. Dev. 2021, 48, 136–145. [Google Scholar] [CrossRef]
- Wu, Q.L.; Peng, G.R.; Xiao, Z.B.; Lei, Y.C.; Shen, M.R.; Qiu, X.W.; Li, M. Complex Structural Characteristics and Evolution of Magmatic Diapirism Reformed Subsag:A Case of Lufeng 22 Subsag, Pearl River Mouth Basin. J. Jilin Univ. Earth Sci. Ed. 2023, 53, 1048–1065. [Google Scholar] [CrossRef]
- Jackson, M.P.A.; Talbot, C.J. External shapes, strain rates, and dynamics of salt structures. GSA Bull. 1986, 97, 305–323. [Google Scholar] [CrossRef]
- Hudec, M.R.; Jackson, M.P.A. Terra infirma: Understanding salt tectonics. Earth Sci. Rev. 2007, 82, 1–28. [Google Scholar] [CrossRef]
- Yu, Y.; Tang, L.; Yang, W.; Huang, T.; Qiu, N.; Li, W. Salt structures and hydrocarbon accumulations in the Tarim Basin, northwest China. Aapg Bull. 2014, 98, 135–159. [Google Scholar] [CrossRef]
- Zhang, Y.; Li, J.; Lei, Y.; Yang, M.; Cheng, P. 3D simulations of salt tectonics in the Kwanza Basin: Insights from analogue and Discrete-Element numerical modeling. Mar. Pet. Geol. 2020, 122, 104666. [Google Scholar] [CrossRef]
- Warsitzka, M.; Kley, J.; Kukowski, N. Salt diapirism driven by differential loading—Some insights from analogue modelling. Tectonophysics 2013, 591, 83–97. [Google Scholar] [CrossRef]
- Nikolinakou, M.A.; Hudec, M.R.; Flemings, P.B. Comparison of evolutionary and static modeling of stresses around a salt diapir. Mar. Pet. Geol. 2014, 57, 537–545. [Google Scholar] [CrossRef]
- Morley, C.K.; Back, S.; Van Rensbergen, P.; Crevello, P.; Lambiase, J.J. Characteristics of repeated, detached, Miocene-Pliocene tectonic inversion events, in a large delta province on an active margin, Brunei Darussalam, Borneo. J. Struct. Geol. 2003, 25, 1147–1169. [Google Scholar] [CrossRef]
- Morley, C.K.; King, R.; Hillis, R.; Tingay, M.; Backe, G. Deepwater fold and thrust belt classification, tectonics, structure and hydrocarbon prospectivity: A review. Earth-Sci. Rev. 2011, 104, 41–91. [Google Scholar] [CrossRef]
- Nyantakyi, E.K.; Li, T.; Hu, W.; Borkloe, J.K. Depositional model for mud-diapir controlled intra-slope basins, deepwater Niger delta, Nigeria. Acta Geod. Geophys. 2016, 51, 207–225. [Google Scholar] [CrossRef]
- Sun, Y.; Liu, Z.; Li, X.; Hu, G.; Fan, T.; Gao, Y. Formation and evolution of oblique anticline in eastern Niger Delta. Pet. Explor. Dev. 2018, 45, 55–67. [Google Scholar] [CrossRef]
- Su, Y.; Zhang, G.; Wang, T.; Li, C.; Zhao, Y.; Li, Y.; Huang, T.; Zhao, T.; Gao, Y. The gravity-slide tectonics in the Niger Delta. Chin. J. Geol. 2019, 54, 411–422. [Google Scholar] [CrossRef]
- Ogbe, O.B.; Orajaka, I.P.; Osokpor, J.; Omeru, T.; Okunuwadje, S.E. Interaction between sea-level changes and depositional tectonics: Implications for hydrocarbon prospectivity in the western coastal swamp depobelt, Niger Delta Basin, Nigeria. Aapg Bull. 2020, 104, 477–505. [Google Scholar] [CrossRef]
- Yu, Y.; Wang, T.; Chen, Z.; Su, Y.; Zhang, J.; Wu, S. Deformation and evolution of mud diapirs in Rio Del Rey Basin, Niger Delta. Oil Gas Geol. 2021, 42, 1435–1439, 1474. [Google Scholar] [CrossRef]
- Chima, K.I.; Granjeon, D.; Do Couto, D.; Leroux, E.; Gorini, C.; Rabineau, M.; Letouzey, J.; Hoggmascall, N.; Glukstad, M.-M. Tectono-stratigraphic evolution of the offshore western Niger Delta from the Cretaceous to present: Implications of delta dynamics and paleo-topography on gravity-driven deformation. Basin Res. 2022, 34, 25–49. [Google Scholar] [CrossRef]
- Kuye, D.A.; Hampson, G.J. Sedimentological and tectono-stratigraphic characterisation of a shallow-marine reservoir, ‘Dona’ field, offshore Niger Delta. Mar. Pet. Geol. 2023, 158, 106517. [Google Scholar] [CrossRef]
- Dean, S.; Morgan, J.; Brandenburg, J.P. Influence of mobile shale on thrust faults: Insights from discrete element simulations. Aapg Bull. 2015, 99, 403–432. [Google Scholar] [CrossRef]
- Wu, J.E.; McClay, K.; Frankowicz, E. Niger Delta gravity-driven deformation above the relict Chain and Charcot oceanic fracture zones, Gulf of Guinea: Insights from analogue models. Mar. Pet. Geol. 2015, 65, 43–62. [Google Scholar] [CrossRef]
- Akinlua, A.; Olise, F.S.; Akomolafe, A.O.; McCrindle, R.I. Rare earth element geochemistry of petroleum source rocks from northwestern Niger Delta. Mar. Pet. Geol. 2016, 77, 409–417. [Google Scholar] [CrossRef]
- Krueger, S.W.; Grant, N.T. The Growth History of Toe Thrusts of the Niger Delta and the Role of Pore Pressure. In Thrust Fault-Related Folding; American Association of Petroleum Geologists: Tulsa, OK, USA, 2011; pp. 1381–1385, 1440. [Google Scholar] [CrossRef]
- Fairhead, J.D.; Binks, R.M. Differential opening of the central and south Atlantic Oceans and the opening of the West African rift system. Tectonophysics 1991, 187, 191–203. [Google Scholar] [CrossRef]
- Grimaud, J.L.; Rouby, D.; Chardon, D.; Beauvais, A. Cenozoic sediment budget of West Africa and the Niger delta. Basin Res. 2018, 30, 169–186. [Google Scholar] [CrossRef]
- Chardon, D.; Grimaud, J.L.; Rouby, D.; Beauvais, A.; Christophoul, F. Stabilization of large drainage basins over geological time scales: Cenozoic West Africa, hot spot swell growth, and the Niger River. Geochem. Geophys. Geosyst. 2016, 17, 1164–1181. [Google Scholar] [CrossRef]
- Briggs, S.E.; Davies, R.J.; Cartwright, J.; Morgan, R. Thrusting in oceanic crust during continental drift offshore Niger Delta, equatorial Africa. Tectonics 2009, 28, TC1004. [Google Scholar] [CrossRef]
- Wen, Z.X.; Jiang, S.; Song, C.P.; Wang, Z.M.; He, Z.J. Basin evolution, configuration styles, and hydrocarbon accumulation of the South Atlantic conjugate margins. Energy Explor. Exploit. 2019, 37, 992–1008. [Google Scholar] [CrossRef]
- Cohen, H.A.; McClay, K. Sedimentation and shale tectonics of the northwestern Niger Delta front. Mar. Pet. Geol. 1996, 13, 313–328. [Google Scholar] [CrossRef]
- Jermannaud, P.; Rouby, D.; Robin, C.; Nalpas, T.; Guillocheau, F.; Raillard, S. Plio-Pleistocene sequence stratigraphic architecture of the eastern Niger Delta: A record of eustasy and aridification of Africa. Mar. Pet. Geol. 2010, 27, 810–821. [Google Scholar] [CrossRef]
- Riboulot, V.; Cattaneo, A.; Berne, S.; Schneider, R.R.; Voisset, M.; Imbert, P.; Grimaud, S. Geometry and chronology of late Quaternary depositional sequences in the Eastern Niger Submarine Delta. Mar. Geol. 2012, 319, 1–20. [Google Scholar] [CrossRef]
- Hou, G.; Liu, H.; Zuo, Q. A study of distribution characteristics of petroleum in Niger delta basin and their controling factors. Oil Gas Geol. 2005, 26, 374–378. [Google Scholar] [CrossRef]
- Rouby, D.; Nalpas, T.; Jermannaud, R.; Robin, C.; Guillocheau, F.; Raillard, S. Gravity driven deformation controlled by the migration of the delta front: The Plio-Pleistocene of the Eastern Niger Delta. Tectonophysics 2011, 513, 54–67. [Google Scholar] [CrossRef]
- McClay, K.; Dooley, T.; Zamora, G. Analogue models of delta systems above ductile substrates. Geol. Soc. Lond. Spec. Publ. 2003, 216, 411–428. [Google Scholar] [CrossRef]
- Fort, X.; Brun, J.P.; Chauvel, F. Salt tectonics on the Angolan margin, synsedimentary deformation processes. Aapg Bull. 2004, 88, 1523–1544. [Google Scholar] [CrossRef]
- Dooley, T.P.; Hudec, M.R.; Carruthers, D.; Jackson, M.P.A.; Luo, G. The effects of base-salt relief on salt flow and suprasalt deformation patterns—Part 1: Flow across simple steps in the base of salt. Interpretation 2017, 5, SD1–SD23. [Google Scholar] [CrossRef]
- Dooley, T.P.; Hudec, M.R. The effects of base-salt relief on salt flow and suprasalt deformation patterns—Part 2: Application to the eastern Gulf of Mexico. Interpretation 2017, 5, SD25–SD38. [Google Scholar] [CrossRef]
- Santos, C.H.d.O.; Pichel, L.M.; Da Silva, F.C.A. The effects of subsalt relief on gravity-driven salt tectonics: Results from analogue modelling. J. Struct. Geol. 2023, 174, 104919. [Google Scholar] [CrossRef]
- Weijermars, R. Flow behavior and physical-chemistry of bouncing putties and related polymers in view of rectonic laboratory applications. Tectonophysics 1986, 124, 325–358. [Google Scholar] [CrossRef]
- Morency, C.; Huismans, R.S.; Beaumont, C.; Fullsack, P. A numerical model for coupled fluid flow and matrix deformation with applications to disequilibrium compaction and delta stability. J. Geophys. Res.-Solid Earth 2007, 112, B10407. [Google Scholar] [CrossRef]
- McClay, K.R. Deformation mechanics in analogue models of extensional fault systems. Geol. Soc. Lond. Spec. Publ. 1989, 54, 445–453. [Google Scholar] [CrossRef]
- Xie, G.; Jia, D.; Zhang, Q.; Wu, X.; Shen, L.; Lu, Y.; Zou, X. Physical Modeling of the Jura-Type Folds in Eastern Sichuan. Acta Geol. Sin. 2013, 87, 773–788. [Google Scholar] [CrossRef]
- Vendeville, B.C.; Cobbold, P.R.; Davy, P.; Choukroune, P.; Brun, J.P. Physical models of extensional tectonics at various scales. Cont. Extensional Tecton. 1987, 28, 95–107. [Google Scholar] [CrossRef]
- Mourgues, R.; Lecomte, E.; Vendeville, B.; Raillard, S. An experimental investigation of gravity-driven shale tectonics in progradational delta. Tectonophysics 2009, 474, 643–656. [Google Scholar] [CrossRef]
- Gemmer, L.; Beaumont, C.; Ings, S.J. Dynamic modelling of passive margin salt tectonics: Effects of water loading, sediment properties and sedimentation patterns. Basin Res. 2005, 17, 383–402. [Google Scholar] [CrossRef]
- Brun, J.P.; Fort, X. Salt tectonics at passive margins: Geology versus models. Mar. Pet. Geol. 2011, 28, 1123–1145. [Google Scholar] [CrossRef]
- Rowan, M.G.; Peel, F.J.; Vendeville, B.C.; Gaullier, V. Salt tectonics at passive margins: Geology versus models—Discussion. Mar. Pet. Geol. 2012, 37, 184–194. [Google Scholar] [CrossRef]
- Njome, M.S.; de Wit, M.J. The Cameroon Line: Analysis of an intraplate magmatic province transecting both oceanic and continental lithospheres: Constraints, controversies and models. Earth-Sci. Rev. 2014, 139, 168–194. [Google Scholar] [CrossRef]


| Model Number | Experiment I | Experiment II | Experiment III | Experiment IV |
|---|---|---|---|---|
| Model summary | General model | Model with thinner mudstone layer | Model with thinner overburden layer | Model with larger slope inclination |
| Inclination of the slope on the landward side | 3° | 3° | 3° | 5° |
| Inclination of the slope on the ocean side | 1° | 1° | 1° | 3° |
| Mudstone thickness | 2 cm | 1.5 cm | 2 cm | 2 cm |
| Overburden thickness | 4.5 cm | 4.5 cm | 3 cm | 4.5 cm |
Disclaimer/Publisher’s Note: The statements, opinions and data contained in all publications are solely those of the individual author(s) and contributor(s) and not of MDPI and/or the editor(s). MDPI and/or the editor(s) disclaim responsibility for any injury to people or property resulting from any ideas, methods, instructions or products referred to in the content. |
© 2025 by the authors. Licensee MDPI, Basel, Switzerland. This article is an open access article distributed under the terms and conditions of the Creative Commons Attribution (CC BY) license (https://creativecommons.org/licenses/by/4.0/).
Share and Cite
Shi, S.; Ding, W.; Yu, Y.; Zhang, J. Deformation and Evolution of Akata Formation Mudstone in the Niger Delta Basin: Insights from Analogue Models. J. Mar. Sci. Eng. 2025, 13, 590. https://doi.org/10.3390/jmse13030590
Shi S, Ding W, Yu Y, Zhang J. Deformation and Evolution of Akata Formation Mudstone in the Niger Delta Basin: Insights from Analogue Models. Journal of Marine Science and Engineering. 2025; 13(3):590. https://doi.org/10.3390/jmse13030590
Chicago/Turabian StyleShi, Shuaiyu, Wenlong Ding, Yixin Yu, and Jixin Zhang. 2025. "Deformation and Evolution of Akata Formation Mudstone in the Niger Delta Basin: Insights from Analogue Models" Journal of Marine Science and Engineering 13, no. 3: 590. https://doi.org/10.3390/jmse13030590
APA StyleShi, S., Ding, W., Yu, Y., & Zhang, J. (2025). Deformation and Evolution of Akata Formation Mudstone in the Niger Delta Basin: Insights from Analogue Models. Journal of Marine Science and Engineering, 13(3), 590. https://doi.org/10.3390/jmse13030590