Article

Self-Propulsion Factors for Minimum Propulsion Power Assessment in Adverse Conditions

1
Korea Research Institute of Ships and Ocean Engineering, Daejeon 34103, Republic of Korea
2
Department of Naval Architecture & Ocean Engineering, Pusan National University, Busan 46241, Republic of Korea
*
Author to whom correspondence should be addressed.
J. Mar. Sci. Eng. 2025, 13(3), 595; https://doi.org/10.3390/jmse13030595
Submission received: 20 January 2025 / Revised: 12 March 2025 / Accepted: 13 March 2025 / Published: 17 March 2025
(This article belongs to the Section Ocean Engineering)

Abstract

:
Considering that slow steaming requires low engine power, which impedes maneuverability under severe sea conditions, the International Maritime Organization (IMO) provides guidelines for the minimum propulsion power (MPP) required to maintain ship maneuverability in adverse conditions. This study focused on the characteristics of self-propulsion factors in the context of MPP assessment to enhance MPP prediction accuracy. Overload tests were conducted at low speeds of advance, considering added resistance in adverse conditions. Moreover, propeller open-water tests were conducted corresponding to propeller flow with low Reynolds numbers to investigate their effect on self-propulsion factors. In addition, computational fluid dynamics (CFD) simulations were conducted to analyze physical phenomena such as the flow field and pressure distribution under model test conditions. The results indicated that the thrust deduction factor was lower than that given in the guidelines, whereas the wake fraction was higher at the required forward speed of 2 knots. The MPP assessment in this study revealed that the required brake power was 4–5% lower than that given in the guidelines, indicating that the guidelines need reviewing for a more reliable assessment.

1. Introduction

Owing to an increase in interest in ocean environmental issues over the recent years, the International Maritime Organization (IMO) has enforced regulations on CO2 by applying the Energy Efficiency Design Index (EEDI) and Energy Efficiency eXisting Index (EEXI) to existing and new ships. The 62nd Maritime Environment Protection Committee (MEPC) adopted the EEDI regulation, beginning with Phase 1 in 2013, and then being extended to Phases 2 and 3 [1,2,3,4]. The EEXI regulation, adopted by the 76th MEPC, has been in effect since 1 January 2023 [3,5].
Several approaches have been proposed to reduce exhaust gas emissions from ships to comply with these regulations. One such approach is slow steaming with reduced engine power, which lowers fuel consumption and exhaust emissions [6,7,8]. However, slow steaming may negatively impact maneuverability, particularly in maintaining course stability and navigating under severe sea conditions.
The MEPC has suggested certain guidelines for the minimum propulsion power (MPP) to ensure compliance with EEDI requirements while retaining a main engine with sufficient power to maintain reliable maneuverability in adverse conditions. The guidelines were ratified at the 65th MEPC, with the third revision approved at the 76th MEPC [9,10]. The guidelines suggest two assessment levels: Level 1 based on a minimum power line assessment and Level 2 based on a minimum power assessment. These assessments apply to bulk carriers, tankers, and combination carriers with sizes equal to or greater than 20,000 DWT and should not be used for ships with non-conventional propulsion systems, such as pod propulsion. The suggested MPP requirement is considered acceptable if either assessment is met. A Level 2 assessment includes a minimum power evaluation and provides detailed methods for calculating the MPP at a required forward speed of 2 knots.
Sung and Ock [11] reviewed the MPP guidelines and associated MEPC documents. They investigated the Level 1 assessment using data on bulks and tankers built since 2000 and verified the results based on variations in parameter values. The Level 2 assessment was also investigated for the KRISO Very Large Crude Oil Carrier 2 (KVLCC2): the effect of variations in the definition of adverse weather conditions, estimation methods of added resistance due to waves, and variations in self-propulsion factors (wake fraction and thrust deduction factor) on the results were evaluated. Gerhardt et al. [12] assessed MPP guidelines using KVLCC2. In particular, the effects of the added resistance, induced by waves and self-propulsion factors, on the results were subjected to a Level 2 assessment; the results were compared for varying wave periods and self-propulsion factors. Holt and Nielsen [13] subjected different DWT tankers to a Level 2 assessment. The added resistance induced by waves was investigated using three semi-empirical methods (STAwave-2, SHOPERA, and the DTU design tool). Moreover, the effect of reduction in the light-running margin of the propeller was analyzed. Feng et al. [14] studied the assessments of MPP guidelines using a new 310 K Very Large Crude Oil Carrier (VLCC), focusing on the impacts of different prediction methods for added resistance induced by waves and different propellers and engines on the results. Liu et al. [15] analyzed the effect of different prediction methods for added resistance induced by waves using data on bulks and tankers and evaluated the MPP guidelines using KVLCC2.
Assessments of the MPP guidelines were analyzed in previous studies, which mostly noted a lack of consistent results. In addition, it is difficult to achieve consistent results because of the low speed (low Reynolds number), which introduces inconsistencies in the extrapolation of the added resistance and self-propulsion factors suggested in the MPP guidelines. Bose and Molly [16] reported high measurement uncertainty in model tests under low-speed conditions and highlighted the need for improving the accuracy of power performance prediction by reducing the uncertainty associated with resistance and self-propulsion factors. Therefore, additional studies are required for more reliable and accurate MPP predictions.
This study focuses on the characteristics of self-propulsion factors corresponding to the Level 2 assessment of the MPP guidelines and their effects on the required brake power. To this end, resistance components were calculated in adverse conditions using methods in the MPP guidelines. Self-propulsion tests were conducted under overloaded conditions, considering the added resistance and forward speeds ranging between 2 knots and the design speed. Propeller open-water (POW) tests were conducted at low Reynolds numbers under self-propulsion conditions to investigate the effect of the Reynolds numbers on the self-propulsion factors. Based on the results of the aforementioned model tests, the characteristics of self-propulsion factors were analyzed, and computational fluid dynamics (CFD) simulations were conducted to investigate the physical phenomena related to the self-propulsion factors. Finally, the MPP assessments were evaluated considering the self-propulsion factors derived from the model tests, with the results compared with those obtained using the default values of the self-propulsion factors suggested in the MPP guidelines.

2. Methods

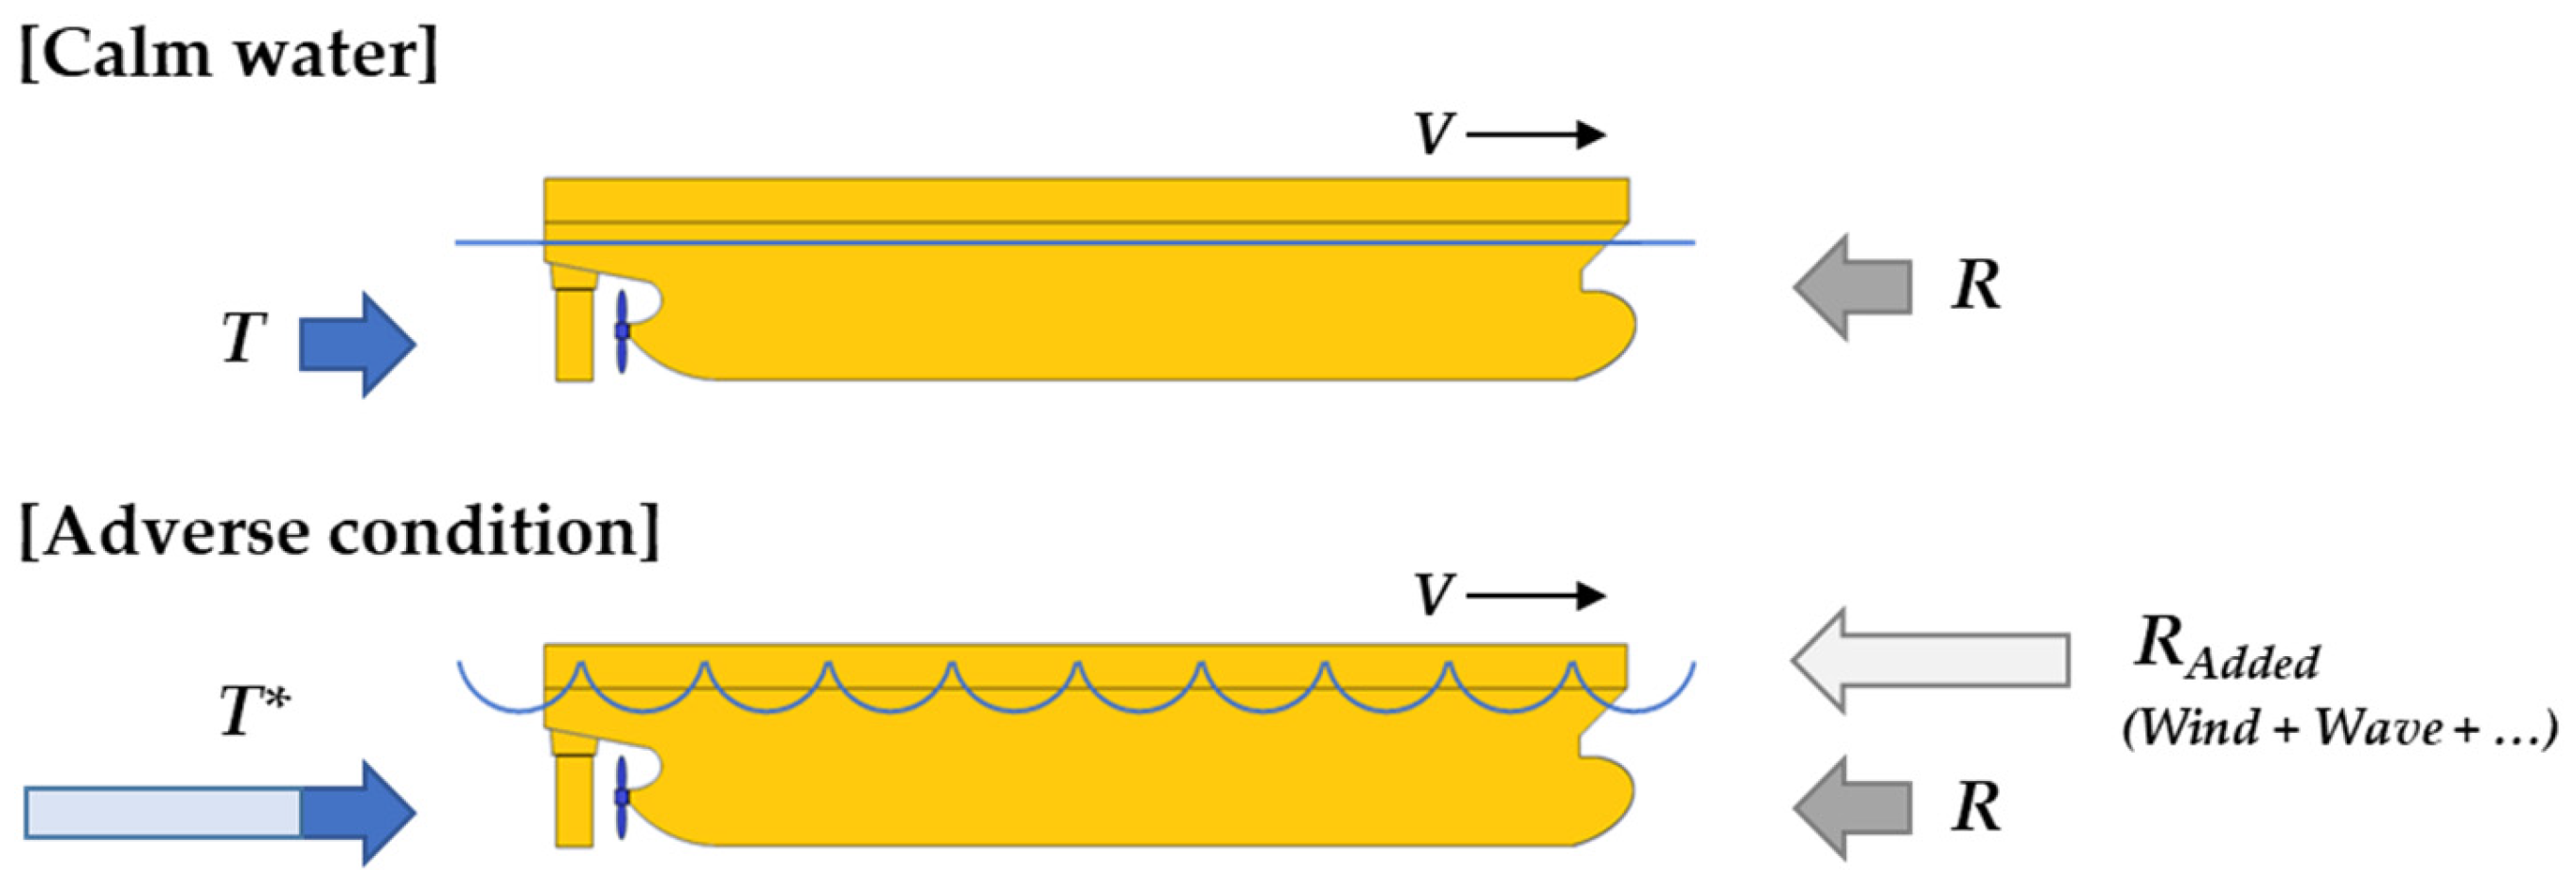
2.1. Assessment in Adverse Conditions
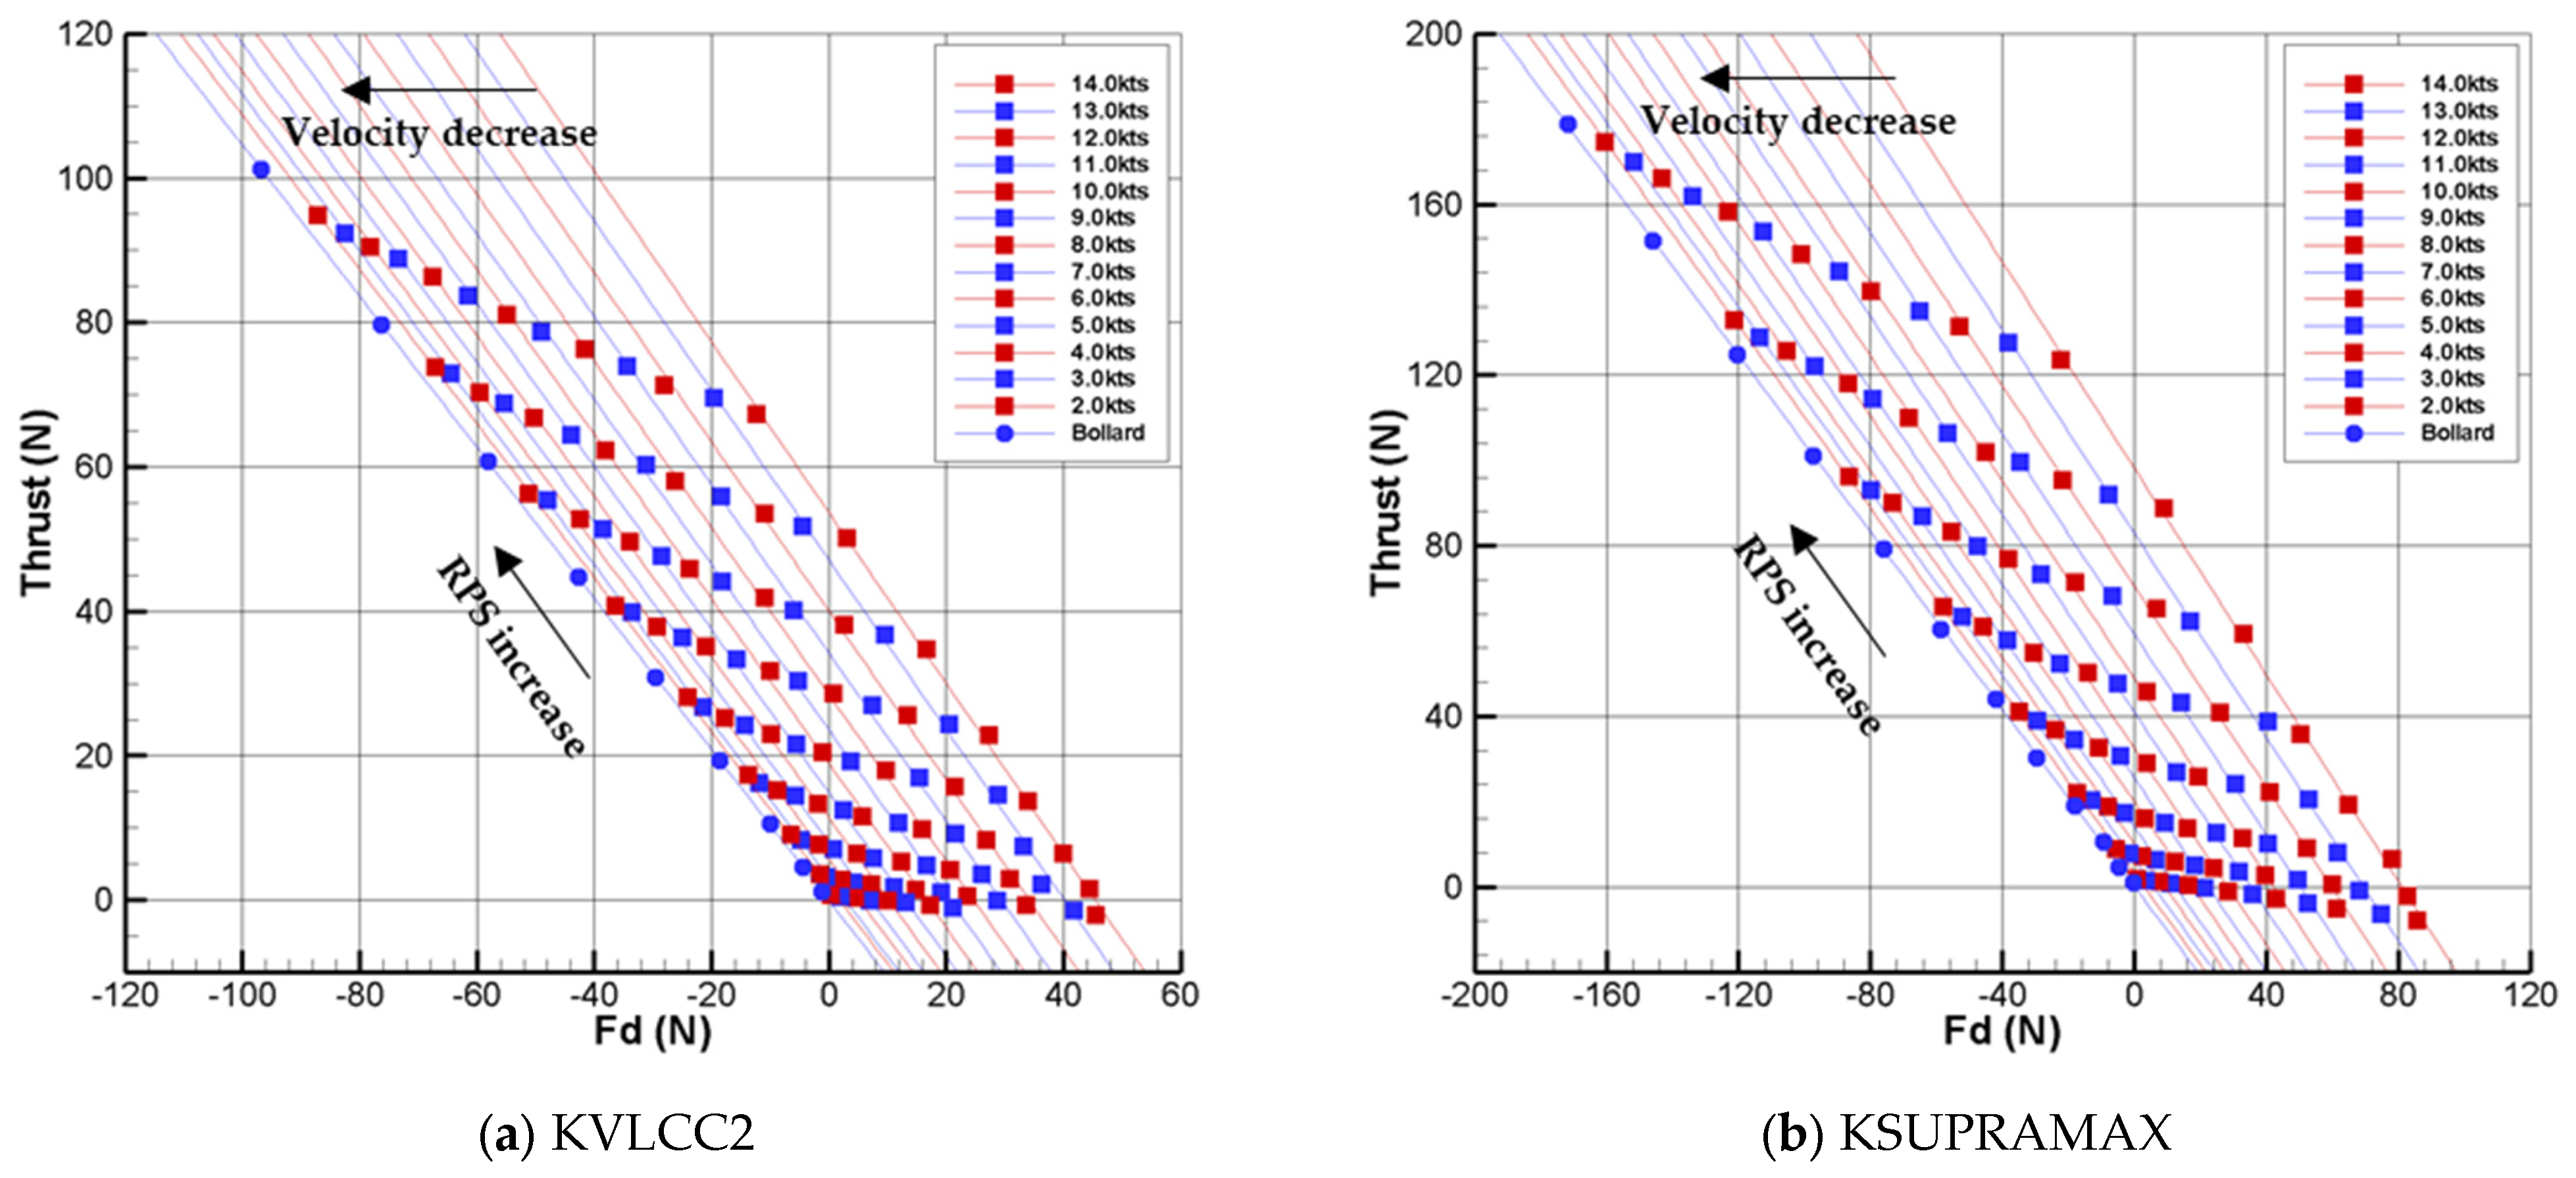
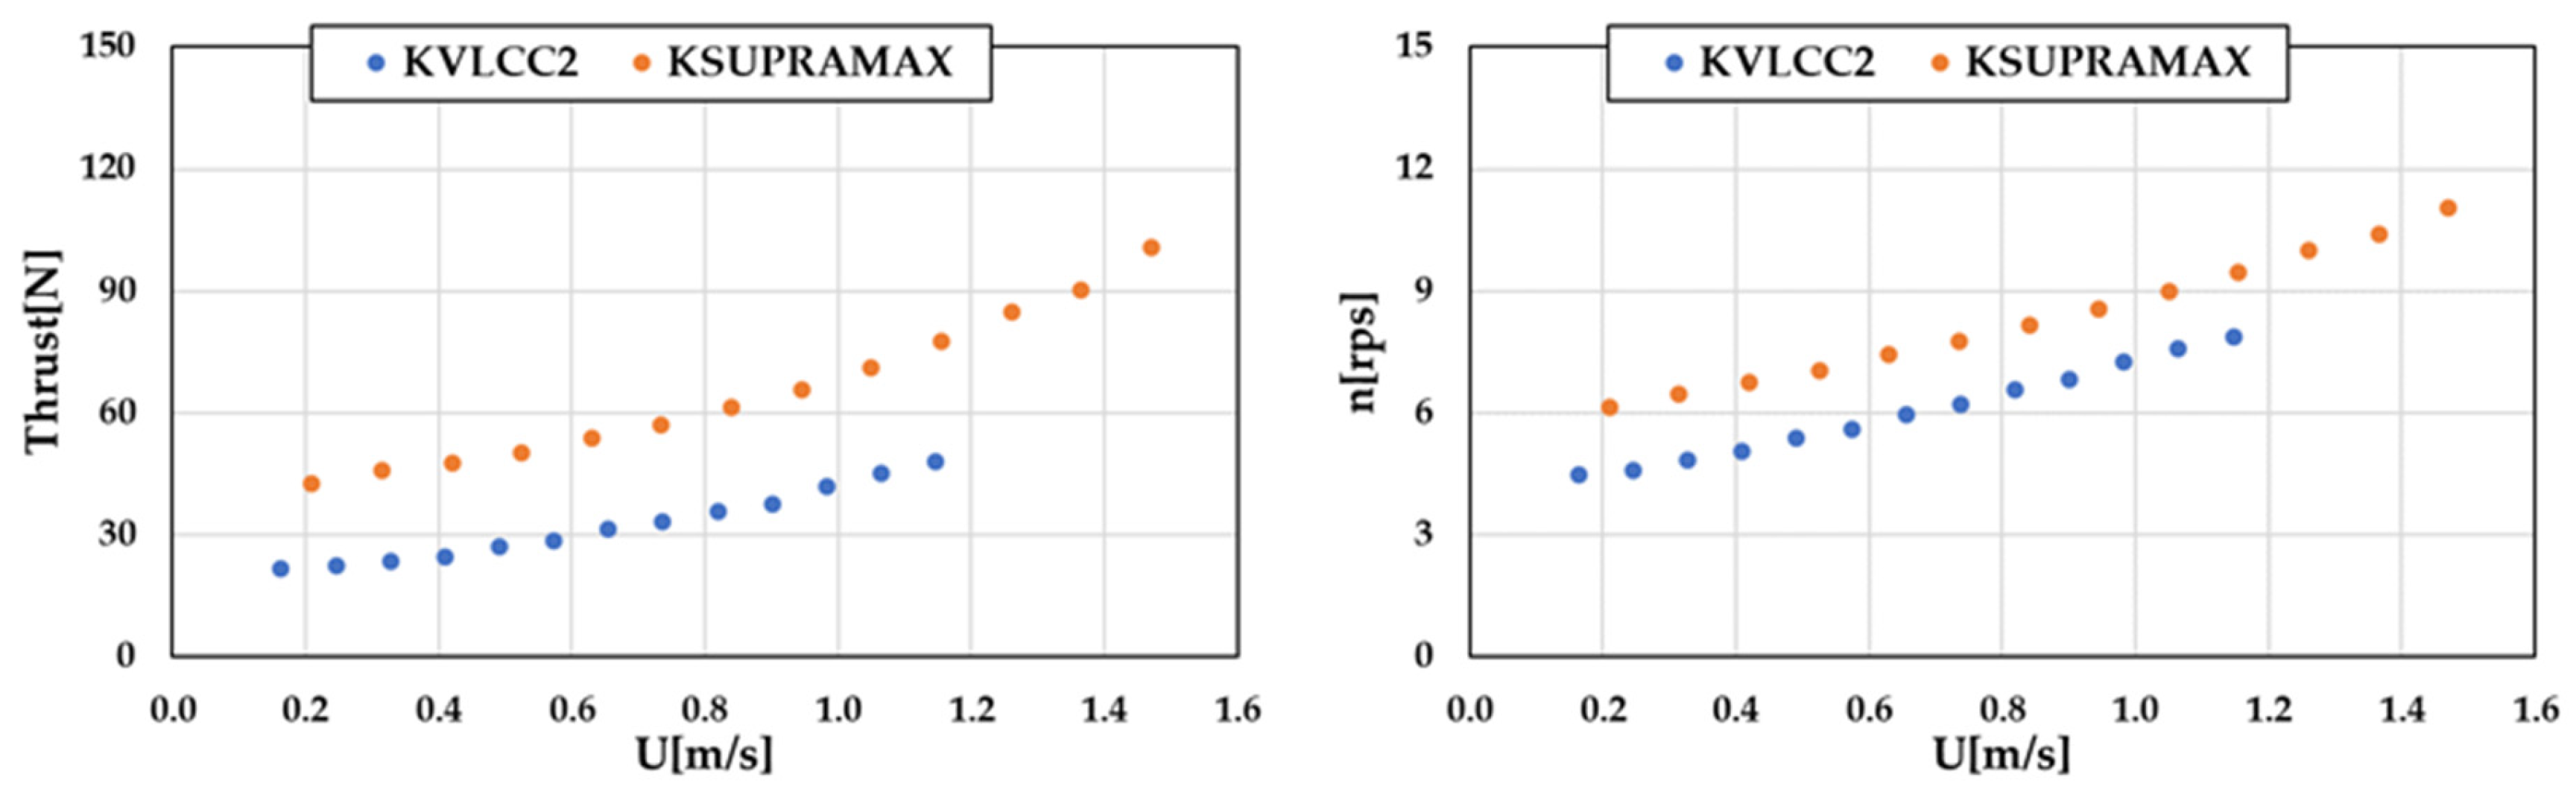
Wind and waves affect ship maneuverability significantly in adverse conditions. A higher thrust is required under such conditions to maintain any given speed compared to that in calm-water conditions, as illustrated in Figure 1. In the MPP guidelines, adverse conditions are defined in terms of ship length between perpendiculars, i.e., ship size, as listed in Table 1.
The Level 2 assessment defines the forward speed as 2 knots, with the resistance components of the ship calculated using the formulas given in Table 2. Additionally, the assessment suggests fixed values for certain self-propulsion factors, e.g., 0.1 and 0.15 for the thrust deduction factor and wake fraction, respectively.

2.2. Overload Test

An overload test was conducted to investigate the effect of added resistance induced in adverse conditions. To this end, the propeller rotation rate varied from a near-idling condition to near or above the maximum rotation rate while keeping the speed constant. The overload test procedure was configured following an International Towing Tank Conference (ITTC) procedure—the propulsion test in ice [17], which has been used for many model tests in ice conditions [18,19,20,21]. An overload test is conducted under the extended range of load conditions of the ITTC 1978 load variation test [22].
Model tests often yield less accurate performance predictions under low-speed conditions due to transient flow around the propeller and ship hull in such situations. Compared with calm-water conditions, the self-propulsion point in adverse conditions requires a higher propeller rotation rate to overcome the added resistance. Consequently, more reliable predictions can still be obtained at low speeds because the propeller generates a greater thrust in overload conditions, which induces a more turbulent flow (i.e., a higher Reynolds number) compared with normal calm-water conditions.

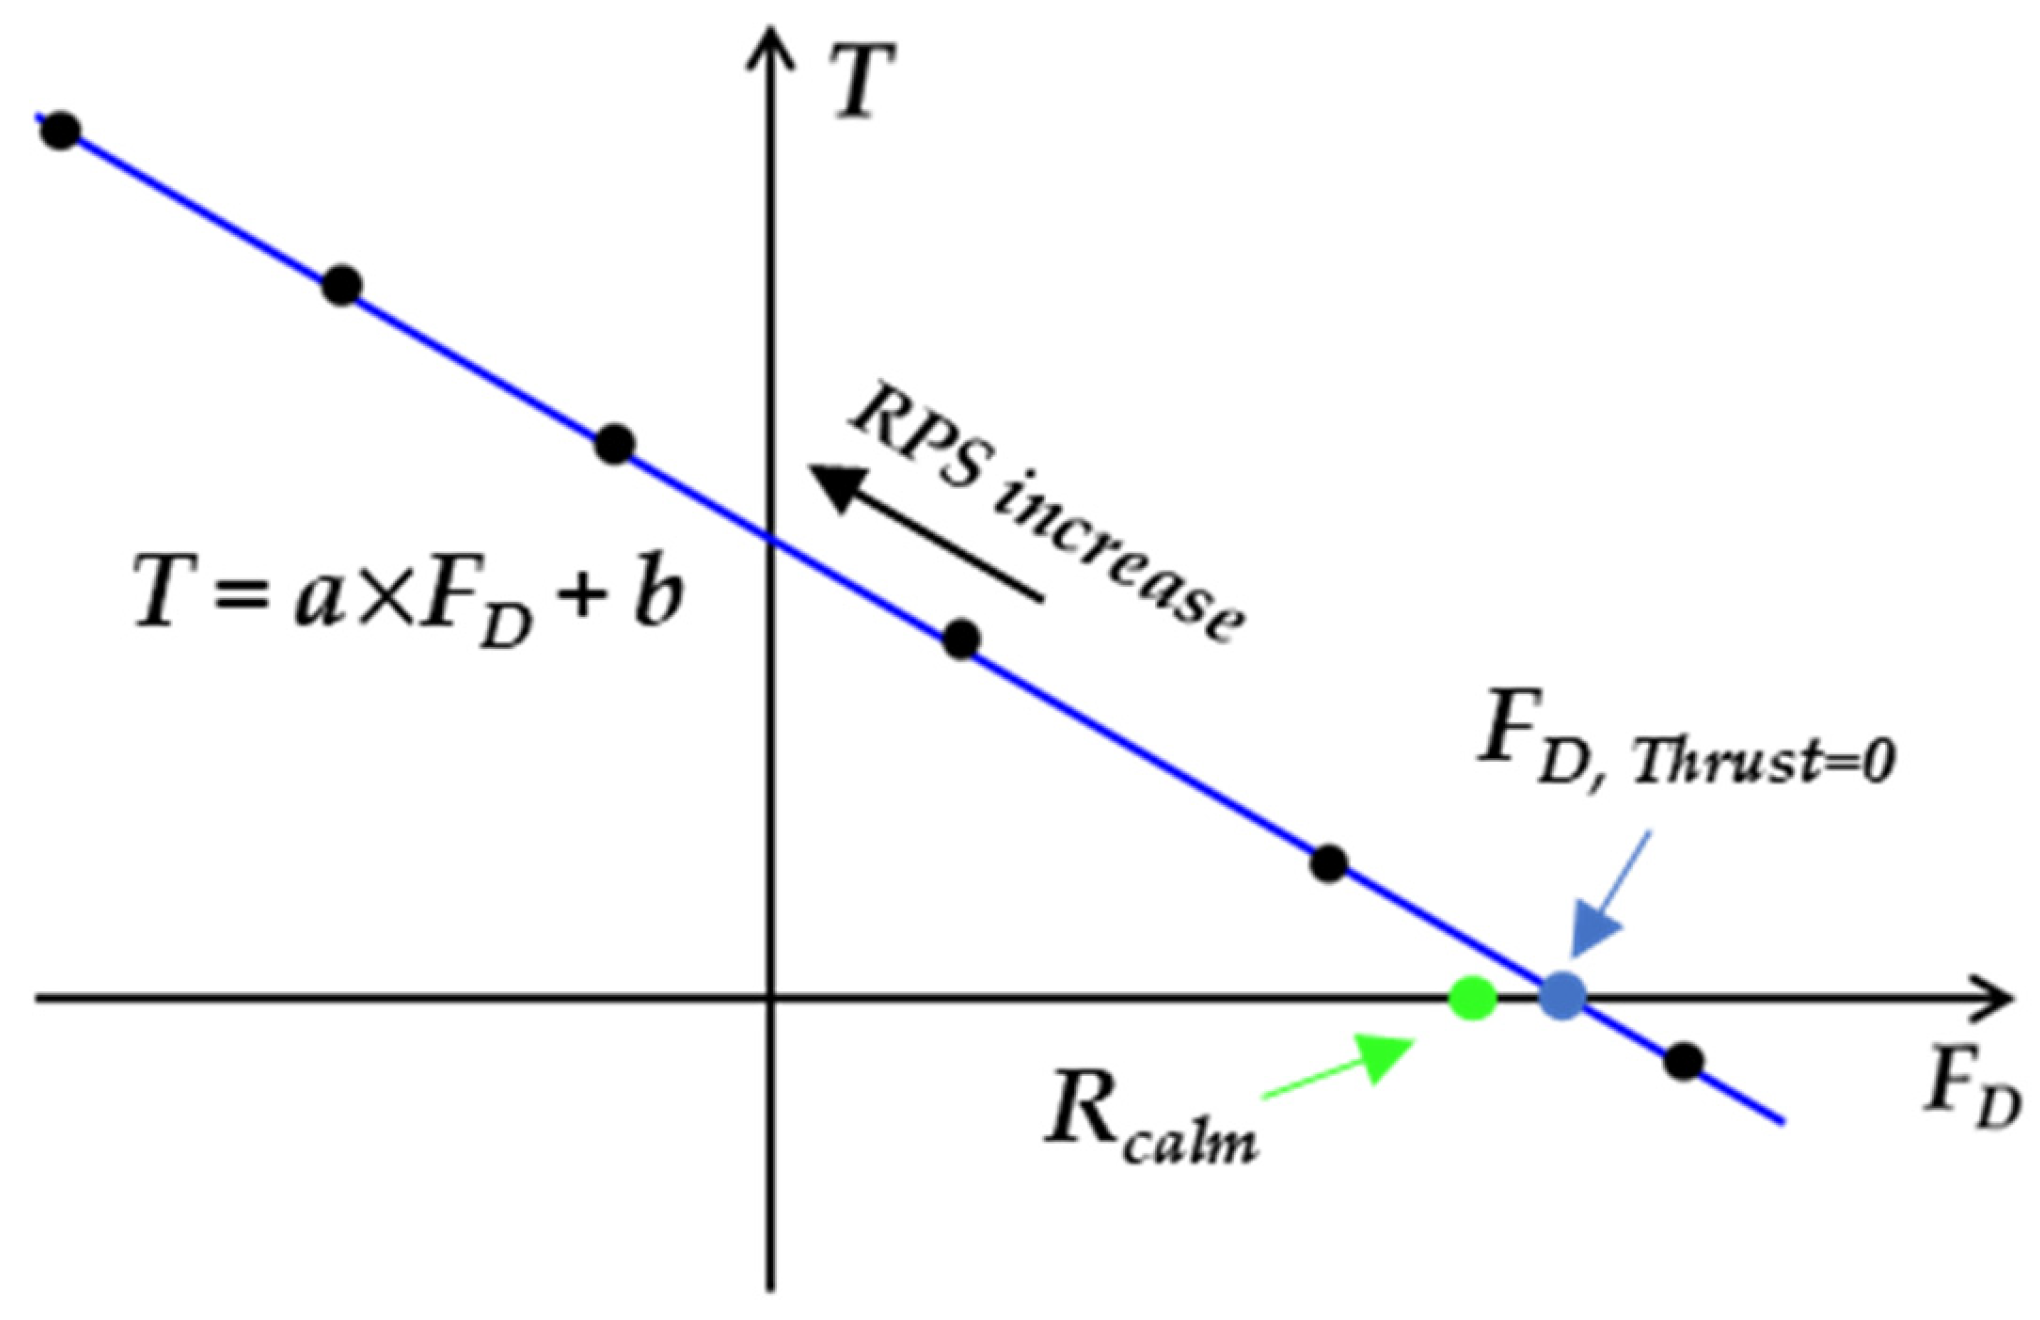
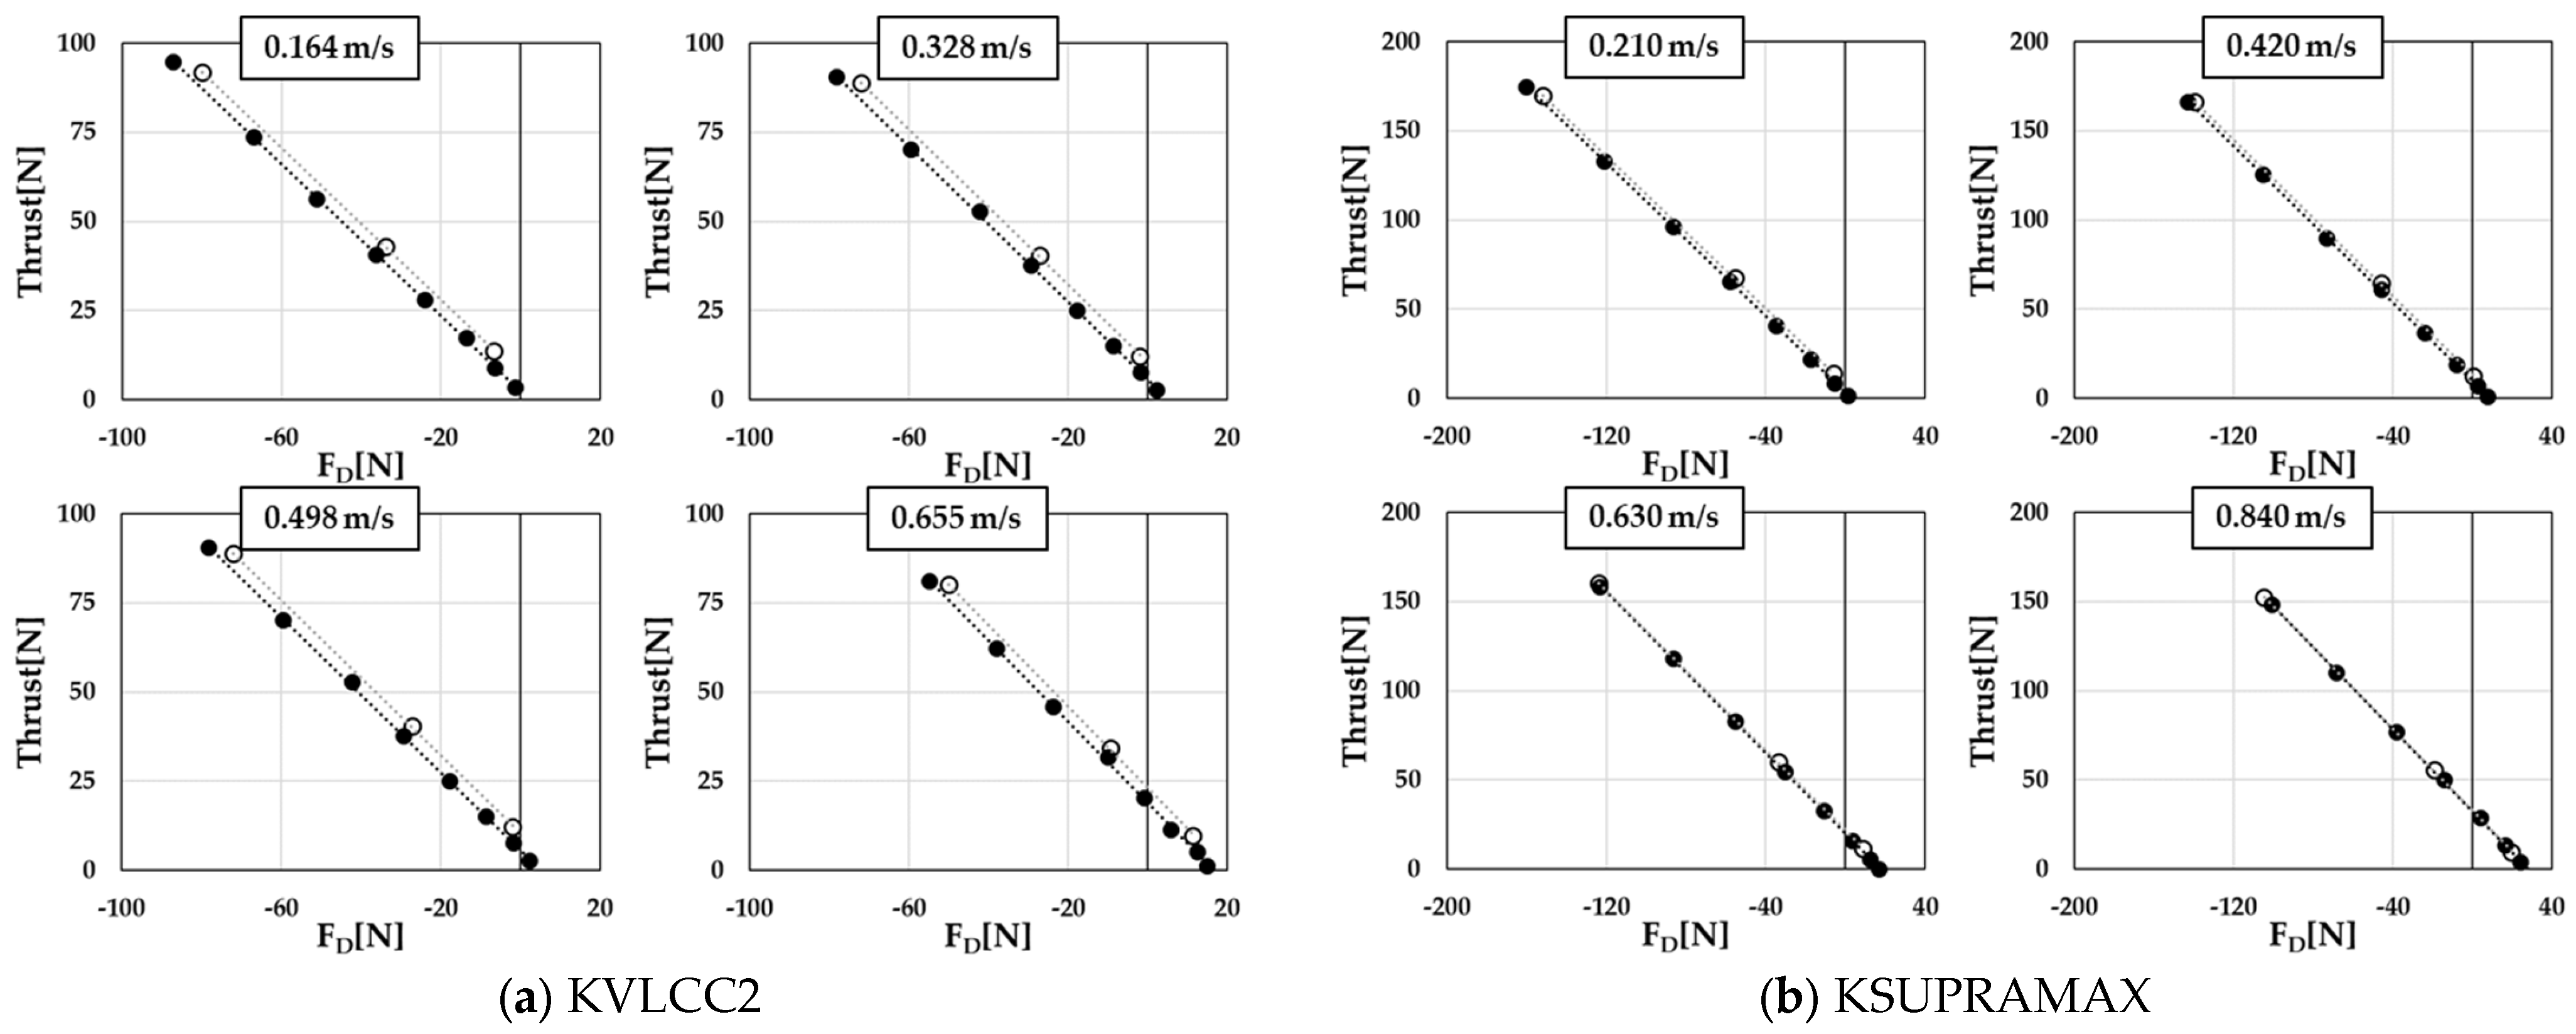
2.2.1. Resistance Derived from the Overload Test

Resistance can be obtained based on the results of the overload test by analyzing the linear relationship between the thrust (T) and towing force (FD). The towing force is regarded as the resistance when the thrust becomes zero ( F D , T h r u s t = 0 ), as illustrated in Figure 2. The resistance obtained from the overload test is usually larger than that obtained from a resistance test performed in calm-water conditions ( R c a l m ) because of the interaction between the propeller and hull (negative pressure around the stern region is induced by the propeller): that is, F D , T h r u s t = 0 / R c a l m is larger than 1 [23].

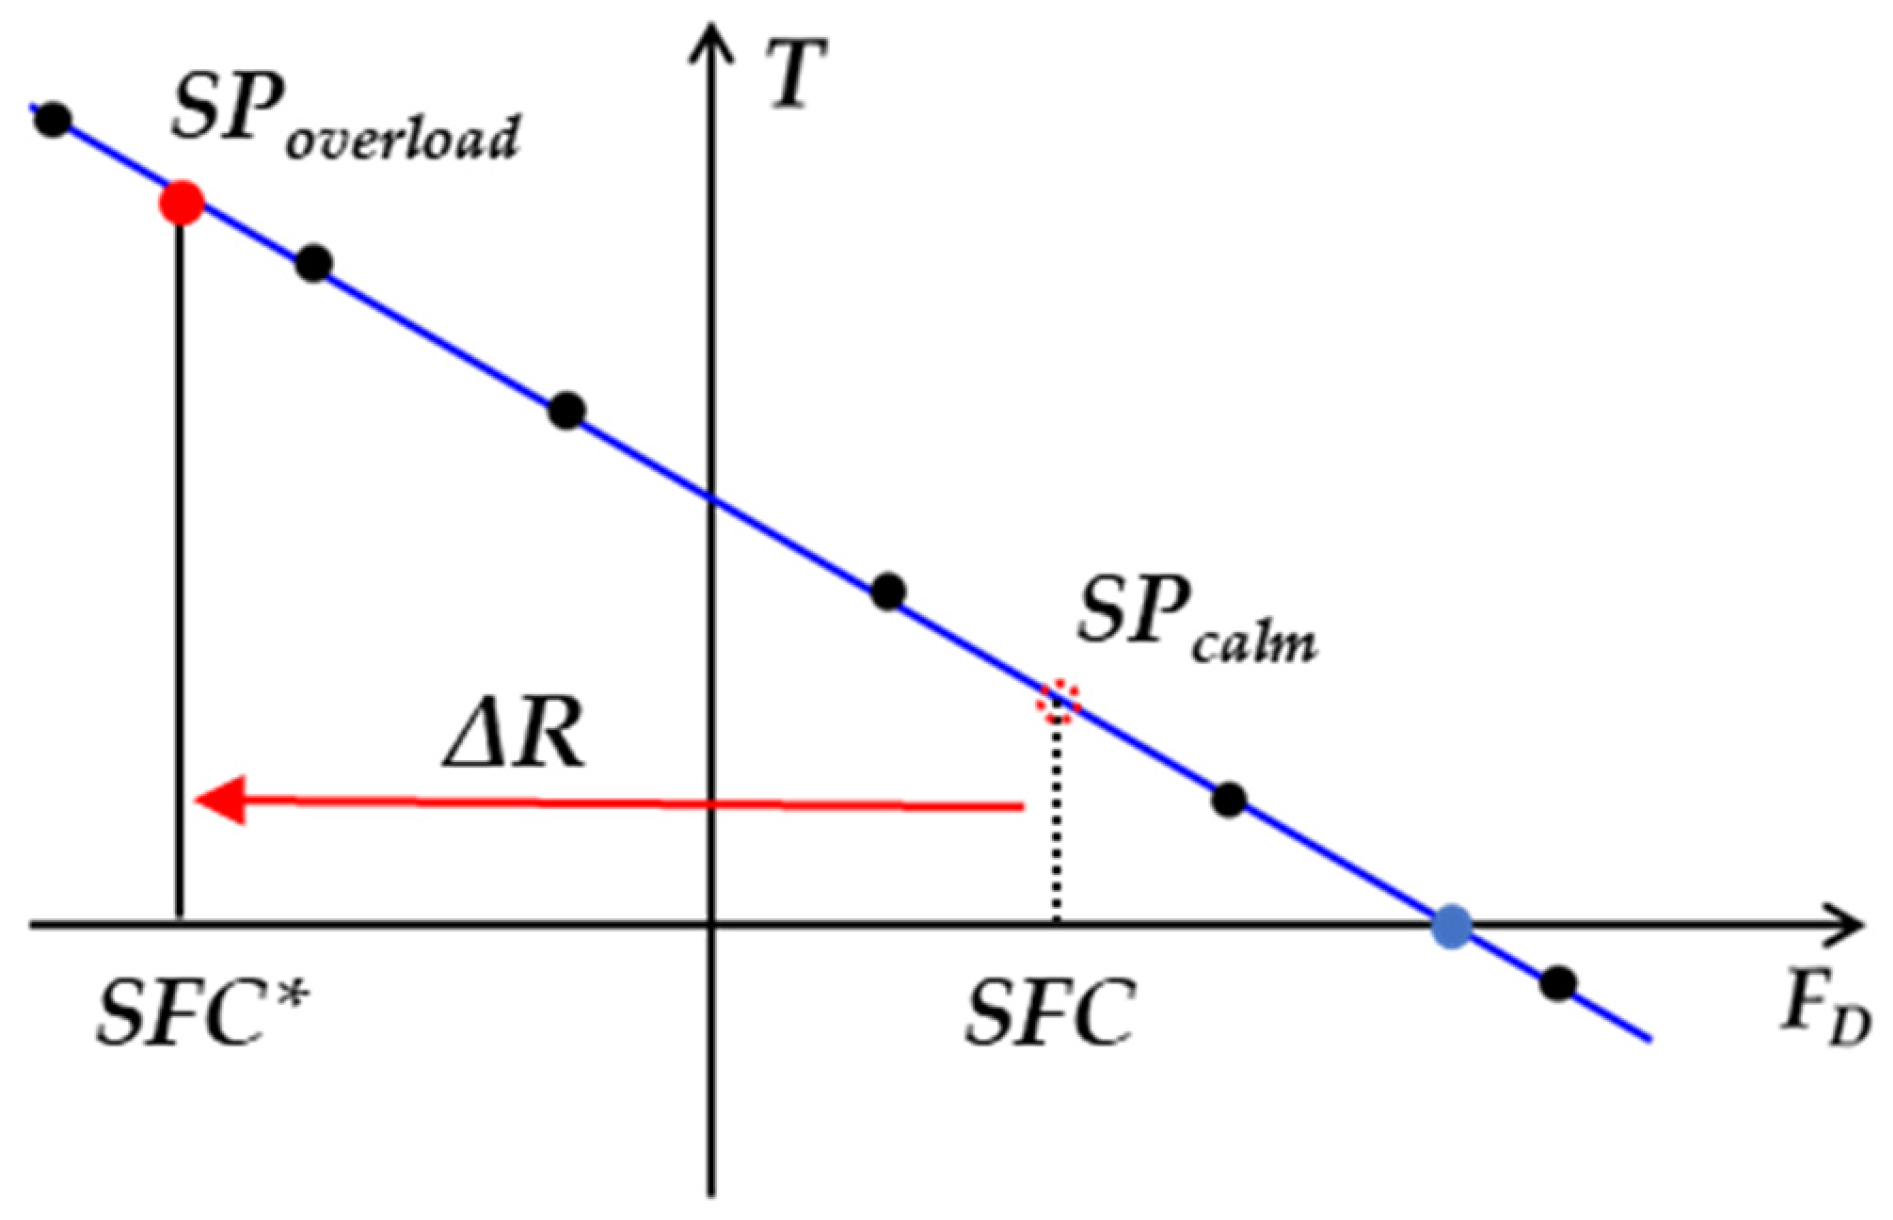
2.2.2. Self-Propulsion Point Considering the Added Resistance

The skin friction correction (SFC) was modified for the overload test by considering added resistance (Equation (1)). The self-propulsion point in adverse conditions was higher than that in calm-water conditions (Figure 3).
S F C * = S F C Δ R ,
where
  • S F C is the skin friction correction force;
  • Δ R is the added resistance at the model scale, Δ R = X a ( ρ m / ρ s ) / λ 3 .
Figure 3. Self-propulsion point considering added resistance in the overload test.
Jmse 13 00595 g003

2.3. Model Tests and CFD Simulations

2.3.1. Target Ship and Propeller
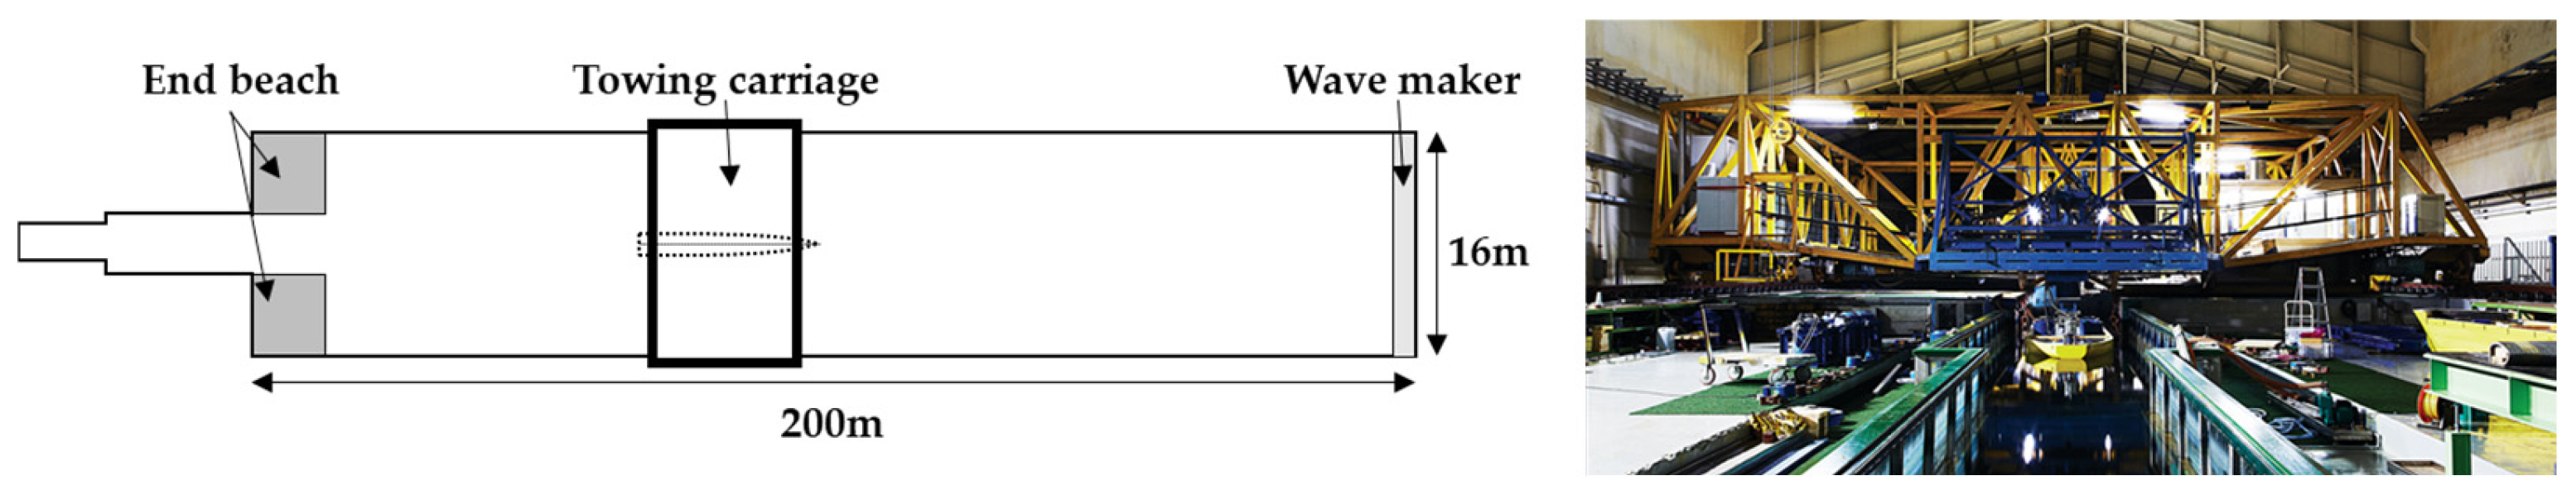
Well-known ship models—KVLCC2 (300,000 DWT class tankers) and KSUPRAMAX (66,000 DWT bulk carriers)—were selected as target ships owing to their suitability for application in MPP assessments. The scantling draft was selected because the MPP assessment was performed in maximum-load conditions. The principal dimensions are listed in Table 3.
The calculated resistance components for the target ships are summarized in Table 4 and depicted as a stacked bar chart in Figure 4. The proportion corresponding to added resistance was much larger than calm-water resistance on both target ships: 34.3-times for KVLCC2 and 35.3-times for KSUPRAMAX.

2.3.2. Model Tests

Model tests were conducted in a KRISO towing tank ( L × B × D : 200   m × 16   m × 7   m , Figure 5). The model ships and propellers used in the model tests are illustrated in Figure 6.
The conditions of the overload tests, summarized in Table 5, were determined based on the maximum engine revolutions per minute (RPM) selected based on similar DWT ships.
The results of the overload tests are presented in Figure 7. As mentioned previously, there is a linear relationship between the thrust and towing force. The absolute slope of the relationship was observed to decrease slightly with decreasing speed.
The Reynolds number for the flow around the propeller should be held constant for self-propulsion and POW tests to ensure an identical viscous effect (scale effect), as reported by Bose and Molly [16]. However, performance prediction is generally performed based on the results of the POW test, in which the propeller rotation rate is assumed to be as high as possible to ensure complete turbulent flow. Moreover, the flow around the stern region is usually more turbulent than the uniform flow observed under POW conditions if the Reynolds number is held constant. This method (i.e., considering different Reynolds numbers between POW and self-propulsion tests) can be used to predict full-scale ship performance reliably because full-scale correlation factors such as CA, CP, and CN (ITTC 1978, [22]) address the issue of accuracy. However, owing to the absence of model-ship correlation factors for MPP assessment, the self-propulsion factors should be obtained as accurately as possible.
In this study, POW tests were conducted considering low Reynolds numbers for the flow around the propeller relative to those at the self-propulsion points. The conditions used in the POW tests are presented in Table 6.
The results of the POW tests are presented in Figure 8. Referring to Heinke et al. [24], the propeller open-water efficiency ( η o ) was verified to decrease with decreasing Reynolds numbers at a constant advance ratio ( J ).

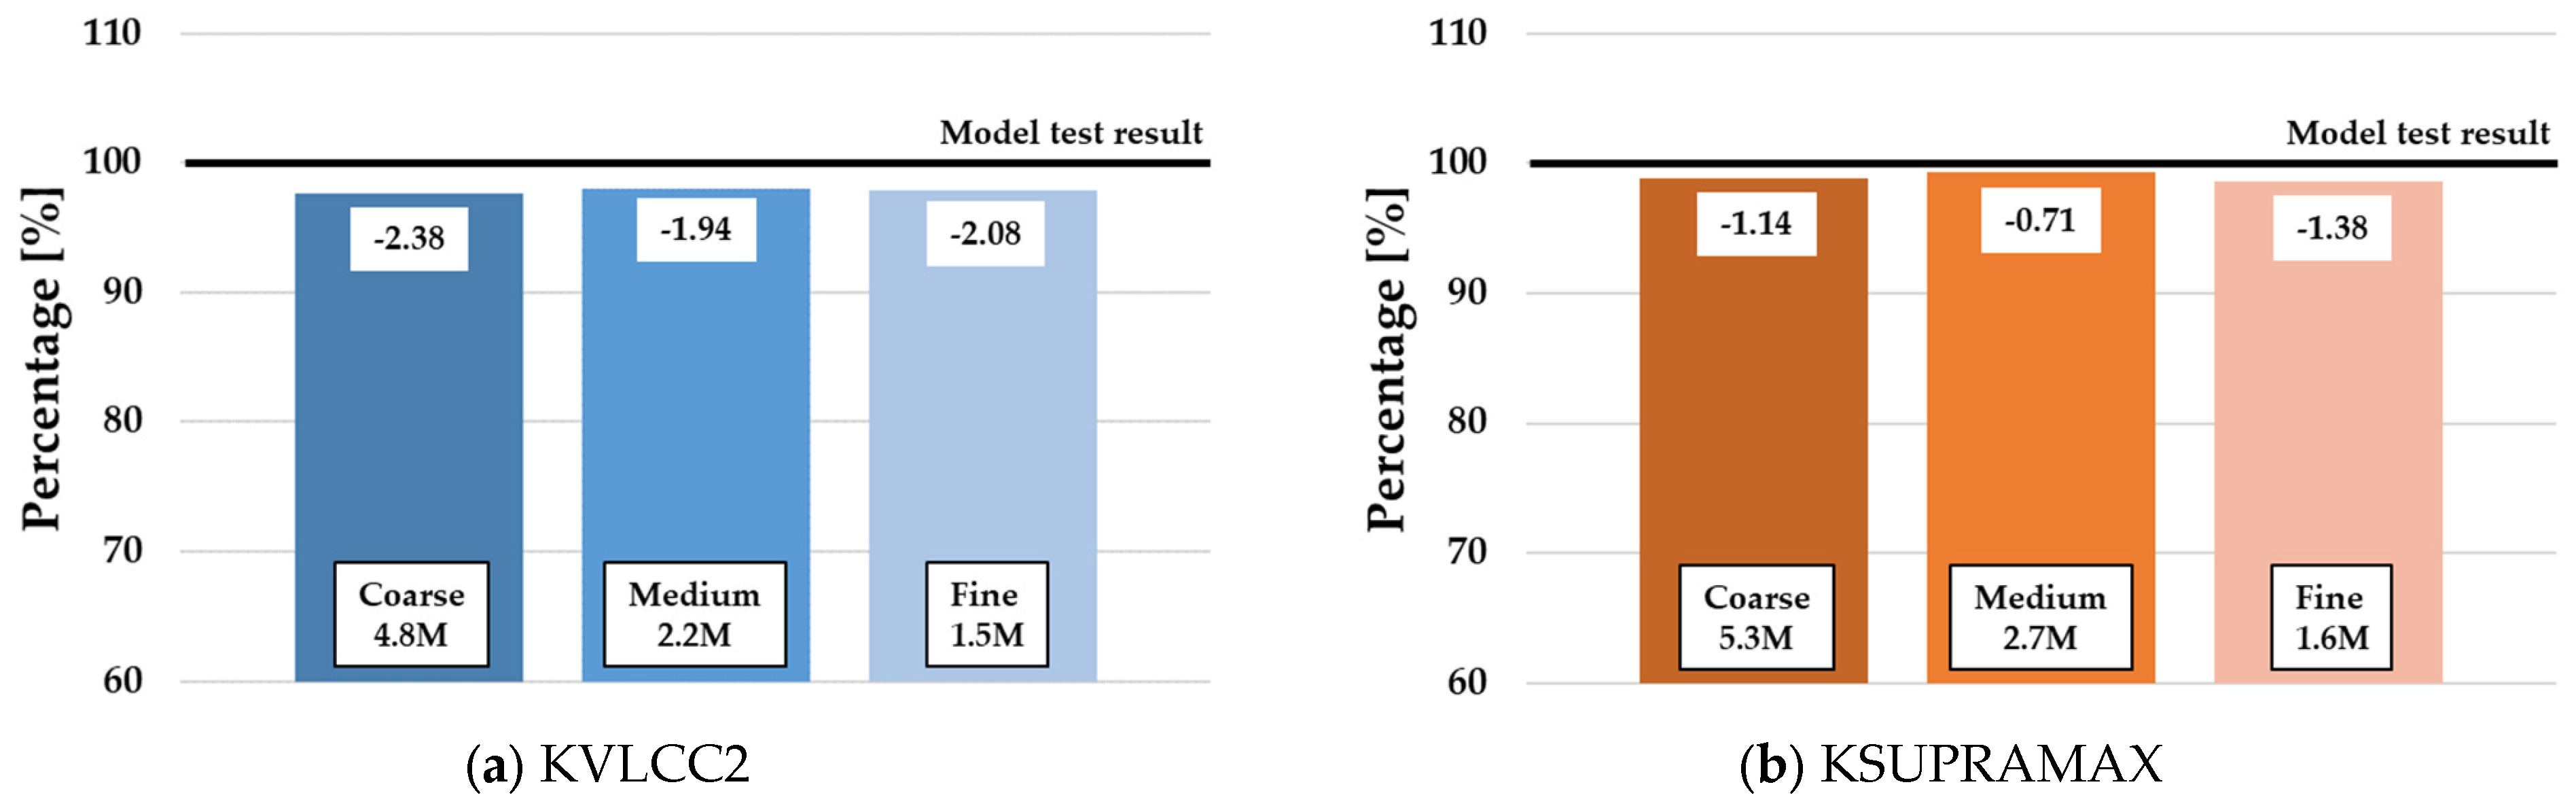
2.3.3. CFD Simulations

The CFD simulation was conducted using commercial software Star-CCM+ ver.17.04, and an incompressible Reynolds-averaged Navier–Stokes equation was used as the governing equation. The γ-Reθ (gamma-Re-theta) transition model was combined with the SST κ-ω turbulence model for the laminar–turbulence transition, considering the low Reynolds number of the model scale. The transition model was based on the work of Kim et al. [25], and a grid system incorporating a wall function with a y+ value of approximately 0.5 was constructed. The sliding mesh method was employed to simulate propeller rotation, with the time step calculated once per 10 degrees of propeller rotation. Grlj et al. [26] compared the simulation results with and without the free surface, and the simulation considering the free surface was in a little better agreement with model test. However, since the wave effect is so small at low speeds, the double-body simulations were applied in this paper. The numerical domain, boundary conditions, and grid system were assumed to be identical for both target ships, as illustrated in Figure 9. The grid system comprised a polyhedral mesh in the propeller region and a trim mesh in other areas.
The verification of grid dependency based on the grid number was conducted, and the results are illustrated in Figure 10. The total grid count was approximately 2.2 million for KVLCC2 and 2.7 million for KSUPRAMAX.
The CFD simulation was validated under the conditions summarized in Table 7, with the results illustrated in Figure 11. Good correspondence was observed between the model tests and CFD simulations, with KSUPRAMAX corresponding to a closer agreement. CFD simulations were primarily used for qualitative analysis rather than predicting absolute values.

3. Results

3.1. Characteristics of Self-Propulsion Factors

The self-propulsion factors (thrust deduction factor and wake fraction) proposed in the MPP guidelines were analyzed using a model test and CFD simulation. The ITTC 1978 extrapolation method [22] was applied to the model test results to obtain full-scale prediction results. The SFC in adverse conditions was calculated using Equation (1), with the results at the self-propulsion point considering the SFC* illustrated in Figure 12. The added resistance in adverse conditions, as defined in the MPP guidelines, varied depending on the speeds. However, the added resistance at 2 knots, i.e., the required forward speed, was applied uniformly at all speeds in this study.

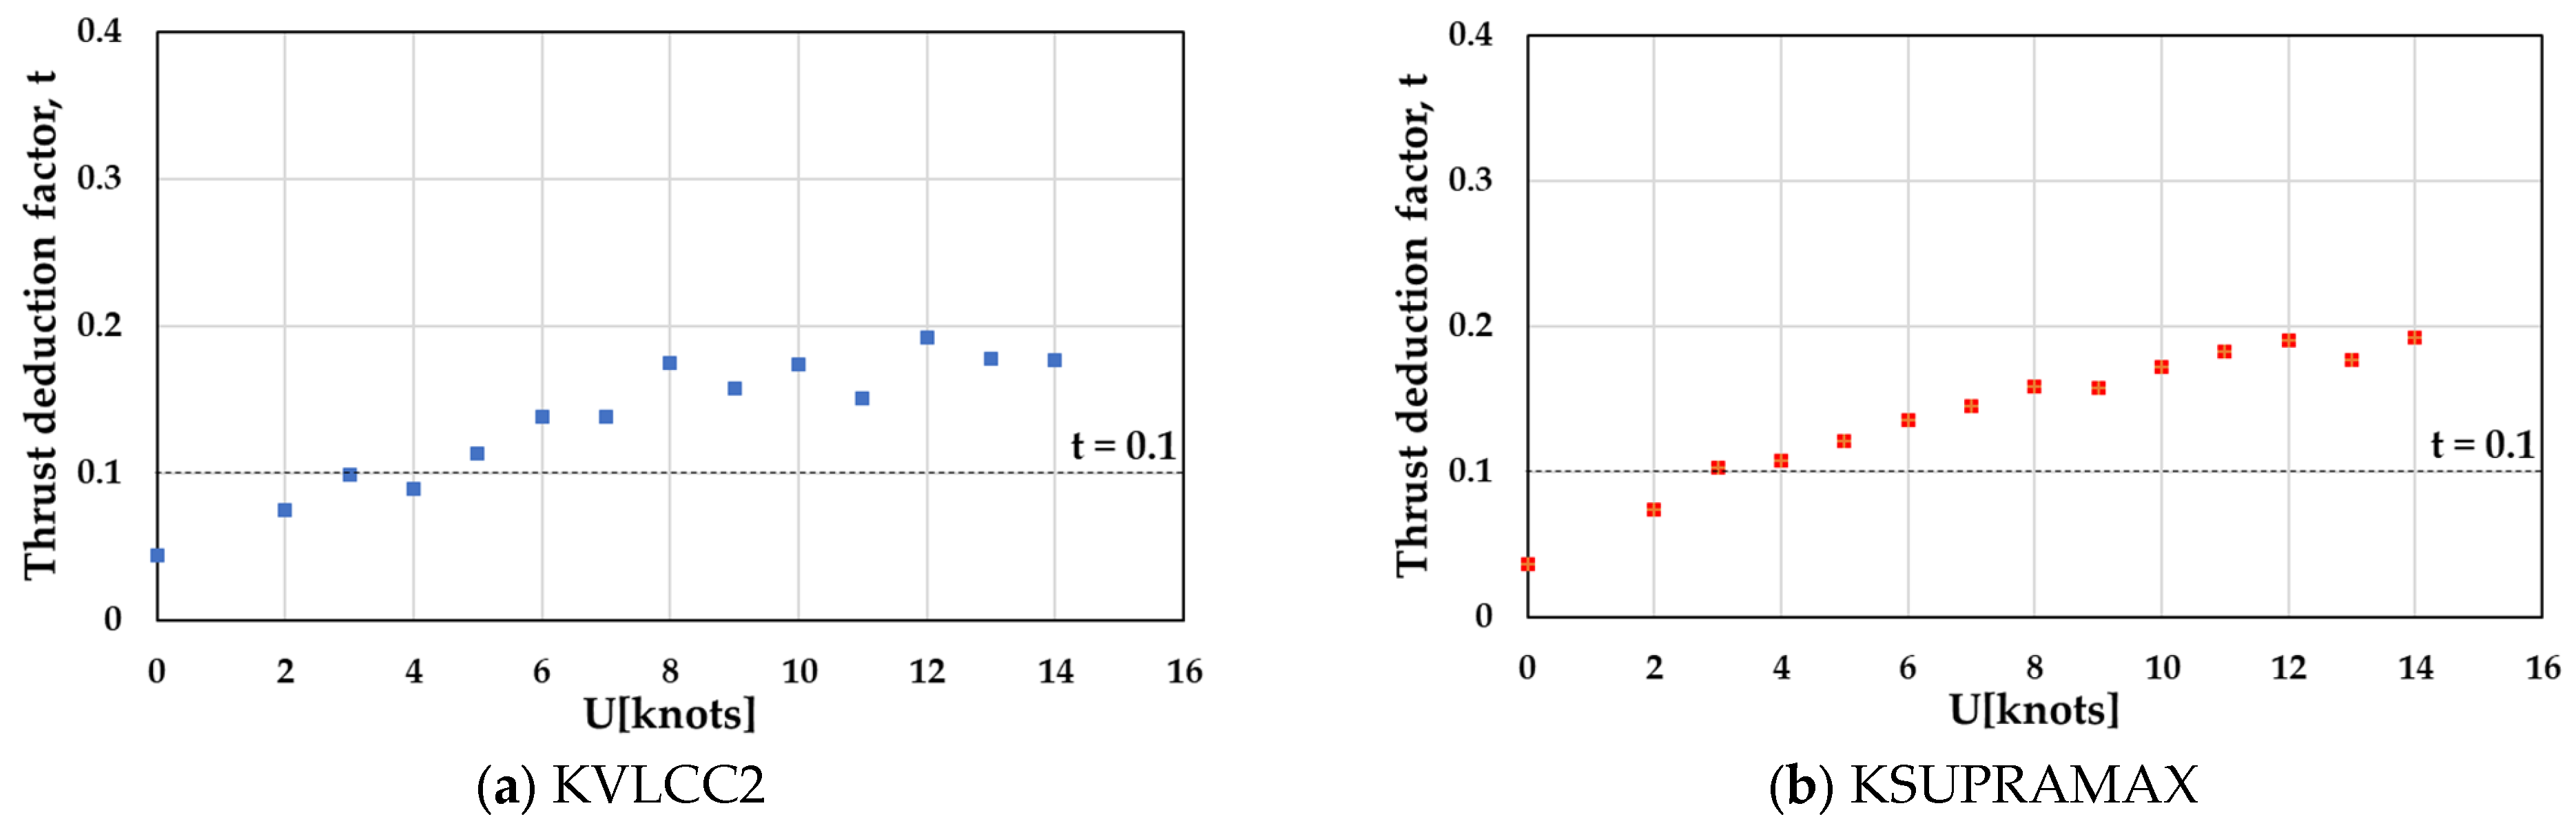
3.1.1. Thrust Deduction Factor

The thrust deduction factor was obtained in terms of the difference between the propeller thrust and hull resistance, as given by Equation (2). It could also have been obtained using the linear relationship between the thrust and towing force, as given by Equation (3). Saettone et al. [23], Molly [27], and Hadler [28] used linear relationships to obtain the thrust deduction factor.
t = T R T = 1 R T
t = 1 F D T = 1 1 ( T / F D ) = 1 1 S l o p e
Under the bollard condition (U = 0), the thrust deduction factor was obtained using Equation (3), and the self-propulsion factors corresponding to different speeds as obtained via the model test are illustrated in Figure 13. The thrust deduction factor was observed to decrease with decreasing speed, and its values at the required forward speed of 2 knots were lower than that given in the MPP guidelines (t = 0.1) for both target ships. Degiuli et al. [29] also confirmed that the thrust deduction factor decreased with decreasing speed. Although the speeds examined in their study were higher than those considered in this paper (with the lowest being 10.5 knots), the values remained lower than the MPP guideline threshold.
The thrust deduction factor, primarily affected by changes in the pressure distribution on the hull surface owing to propeller suction, increased significantly as the pressure drop increased around the stern region, as expected. The change in the distribution of the pressure coefficient at the stern was analyzed using CFD simulations, as depicted in Figure 14. With decreasing speed, the effect of propeller suction on the stern region was observed to decrease, and consequently the reduction in pressure decreased. This tendency was identical to that observed in the model test results for both the target ships.

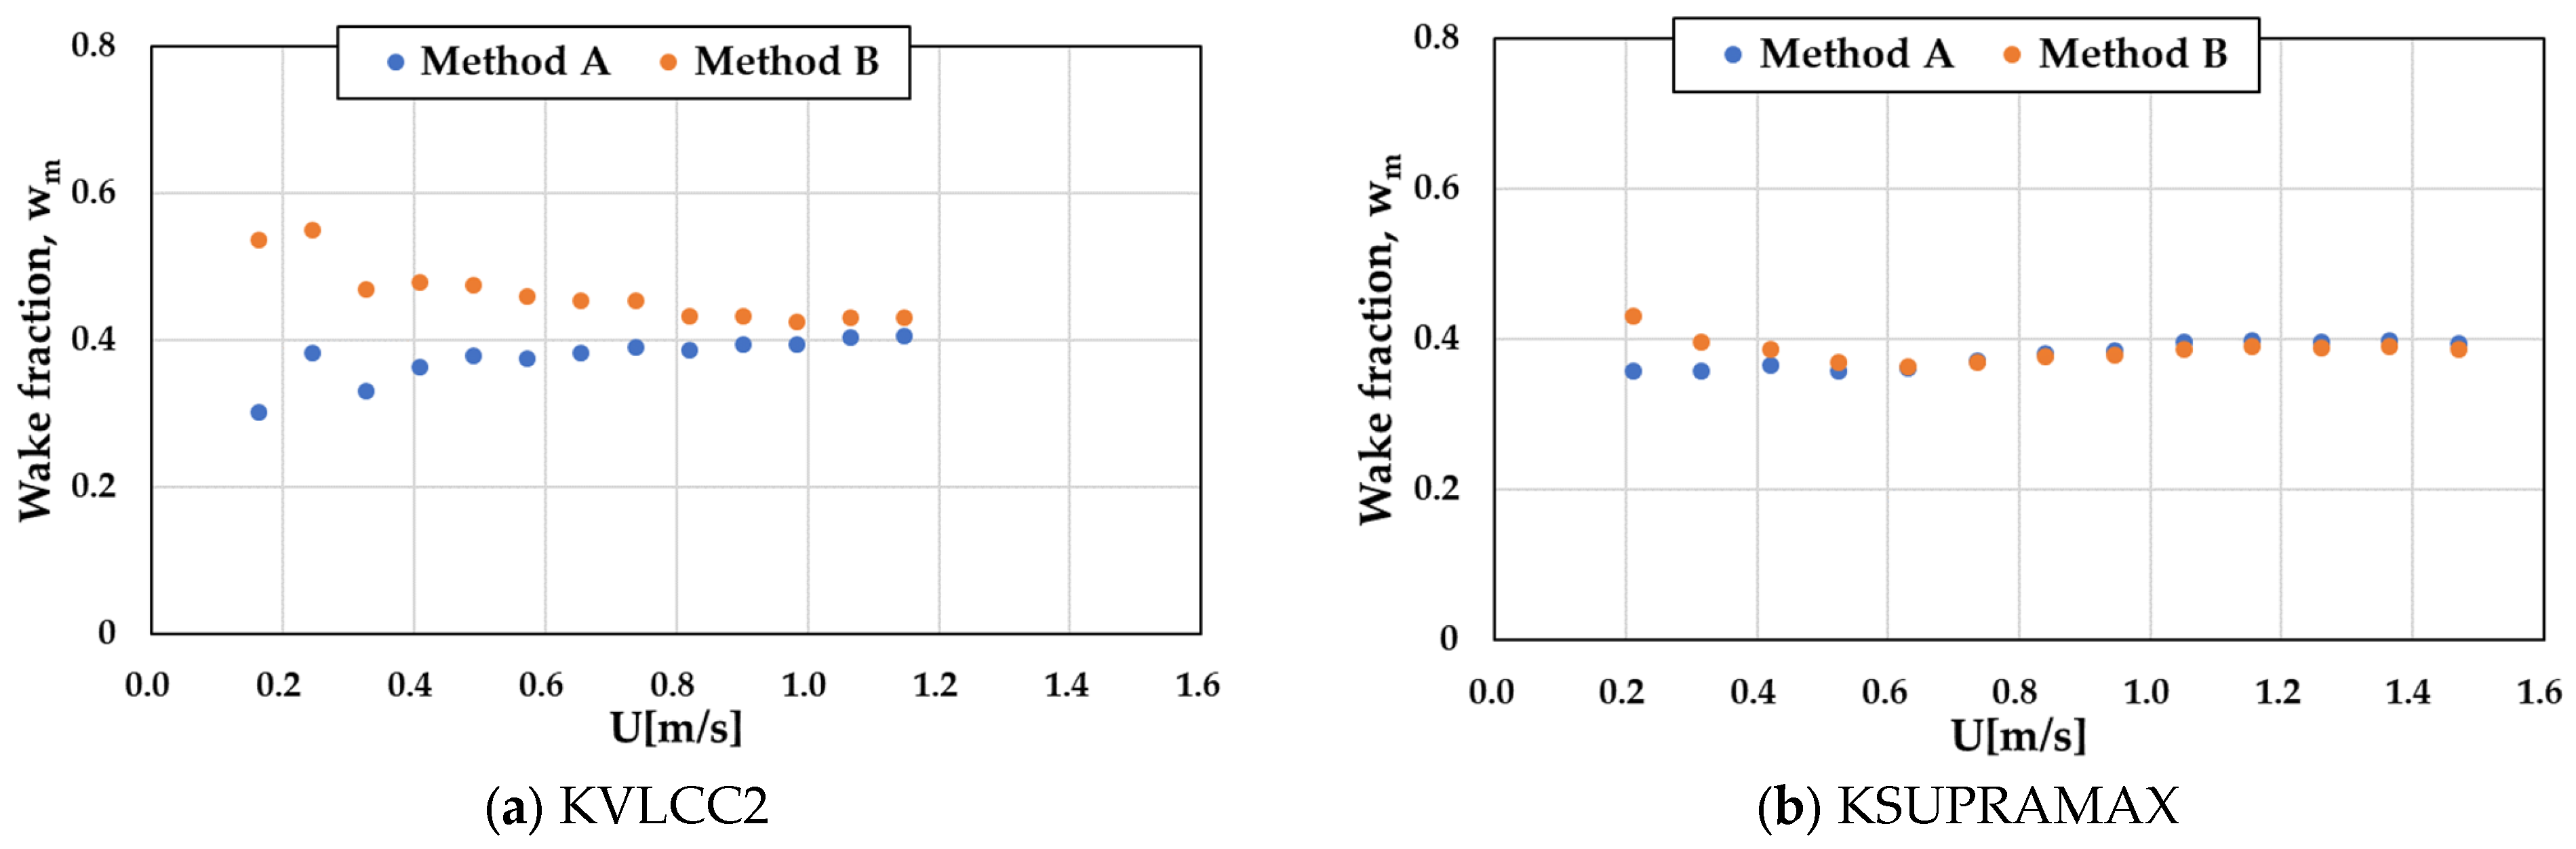
3.1.2. Wake Fraction

The wake fraction is defined in terms of the difference between the velocity of the ship and flow into the propeller. The wake can be divided into four components, as given by Equation (4).
w = w F + w P + w W + w c o r
The frictional wake, w F , is primarily induced by viscosity and depends on ship speed. As a result, as the speed was decreased, the boundary layer increased, and w F was observed to increase accordingly. The potential wake, w P , refers to the component induced by the movement of the ship in an ideal fluid and remains constant irrespective of the speed and direction of movement. The wave wake, w W , denotes the component induced by the stern wave and is negligible because of the rarity of waves at low speeds, as mentioned by Harvald [30]. Finally, w c o r is induced by the propeller–hull interaction, and propeller loading has little influence on the wake fraction under the same conditions [31]. Depending on its presence or absence, w c o r is classified as the effective wake ( w E ) or nominal wake ( w N ). In this study, the wake fraction refers to the effective wake. Therefore, because the reference speed in the MPP guidelines is a low speed of 2 knots, the boundary layer was observed to become larger, and the wake fraction increased accordingly.
The overload test was conducted using two different POW results: normal POW results with a high Reynolds number (Method A) for the propeller flow and those with a lower Reynolds number (Method B) that matched with that of the self-propulsion point. The estimated wake fraction results for the target ships are depicted in Figure 15. With decreasing speed, the wake fraction corresponding to Method B exceeded that corresponding to Method A; this trend was more apparent for KVLCC2.
Owing to the difficulty of obtaining the wake component induced by the propeller–hull interactions ( w c o r ), several studies have been conducted to estimate the effective wake [32,33,34,35,36]. In addition to Equation (4), the wake can be obtained by subtracting the propeller-induced velocity from the flow field induced by the propeller operating in the propeller plane. The flow field was analyzed using CFD simulation, as illustrated in Figure 16.
The propeller-induced velocity was calculated using momentum theory, which considers the propeller an actuator disk, as given by Equations (5) and (6). Although this method overestimated the propeller-induced velocity [37], this value was used to investigate the tendency of the velocity variation in the flow field.
T = ρ A V ( V 1 V 2 ) ,
V = 1 / 2 ( V 1 + V 2 ) ,
where
  • T is the thrust at the self-propulsion point.
  • V is the velocity at the propeller plane, propeller-induced velocity.
  • V 1 is the velocity far upstream.
  • V 2 is the velocity far downstream.
The wake results are depicted in Figure 17: the wake increased with decreasing speed, and the tendency was identical to that obtained based on the model test results corresponding to Method B.
Full-scale wake estimation was performed using the results corresponding to Method B, as depicted in Figure 18. The full-scale wake fraction decreased with decreasing speed; this trend was more apparent for KSUPRAMAX. This tendency was contrary to that observed in the model scale case. Even though the observed wake fraction decreased at low speeds, that reported in the MPP guidelines (w = 0.15) at the forward speed of 2 knots was still significantly lower than the observed values for both target ships.

3.1.3. Analysis of Self-Propulsion Factors with Respect to Propeller Load

The overload test was performed in a manner similar to the self-propulsion test, except with a higher rotation rate (i.e., higher propeller load). Therefore, the non-dimensional coefficient C T (thrust loading coefficient) was used to analyze the change in self-propulsion factors with respect to the propeller load. The C T is given by Equation (7): it was observed to increase with decreasing speed or increasing rotation rate (thrust).
C T = T / ( 0.5 ρ A 0 V 2 )
Figure 19 depicts the self-propulsion factors of the target ships obtained from the overload tests, including the self-propulsion points. The logarithmic scale was used to account for the wide range of the C T . Although the two target ships differed in size, the trends of dependence of the self-propulsion factors with respect to the loading coefficients were observed to be similar. The overload tests were conducted corresponding to identical rotation rate conditions at different speeds. Under these conditions, the thrust was observed to increase with decreasing speed, resulting in an increase in the C T . Overall, with increasing C T , the self-propulsion factors tended to decrease.
The quadratic regression was performed to analyze the correlation between self-propulsion factors and the loading coefficient. The results are depicted in Figure 20. The wake fraction was derived via full-scale wake prediction (correction using other coefficients) [19]; however, the thrust deduction factor was assumed to be the same as that for the model scale. Therefore, the distribution of the thrust deduction factor was observed to be more scattered than that of the wake fraction, which was further verified based on the R-squared value (coefficient of determination). Further, the smaller the C T , the more severe the data scatter (especially thrust deduction); therefore, it is necessary to find a filtering method to remove outliers.
The self-propulsion factors were observed to vary significantly with respect to the loading coefficient. Thus, a more accurate analysis of the correlation between self-propulsion factors and the loading coefficient could yield improvements for the MPP guidelines.

3.2. Results of the Minimum Propulsion Power

The obtained self-propulsion factors are summarized in Table 8 and compared with those suggested in the MPP guidelines. The self-propulsion factors calculated using the regression formula were similar to those obtained from the overload test because the formula was derived from the results of the overload test.
The results obtained in this study were compared with the values suggested in the MPP guidelines, and this comparison is summarized in Table 9 and Table 10, where the relative rotative efficiency ( η R ) was assumed to be 1.0. Owing to the difference between the self-propulsion factors, the hull efficiency ( η H ) derived in this study was larger than that suggested in the MPP guidelines. However, the open-water efficiency ( η O ) was smaller owing to the shift in the advance ratio ( J ) induced by the difference in the wake fraction. Consequently, the derived quasi-propulsive efficiency ( η D ) was higher than that derived in the MPP guidelines, and the required brake power derived in this study was less than that derived in the MPP guidelines by 4–5% for both target ships. These results indicate that for more reliable and accurate MPP assessments, the self-propulsion factors suggested in the MPP guidelines should be reviewed.

4. Conclusions

In this study, the Level 2 assessment of the MPP guidelines was analyzed using a model test and CFD simulation. To this end, an overload test was conducted for forward speeds ranging from 2 knots to design speed. KVLCC2 (300 K DWT) and KSUPRAMAX (66 K DWT), which are suitable for application in MPP assessments, were considered the target ships. The characteristics of self-propulsion factors and physical phenomena were analyzed using the results of the model tests and CFD simulations. The required brake power calculated using the self-propulsion factors suggested in the MPP guidelines was compared with those derived in this study. The conclusions are summarized as follows:
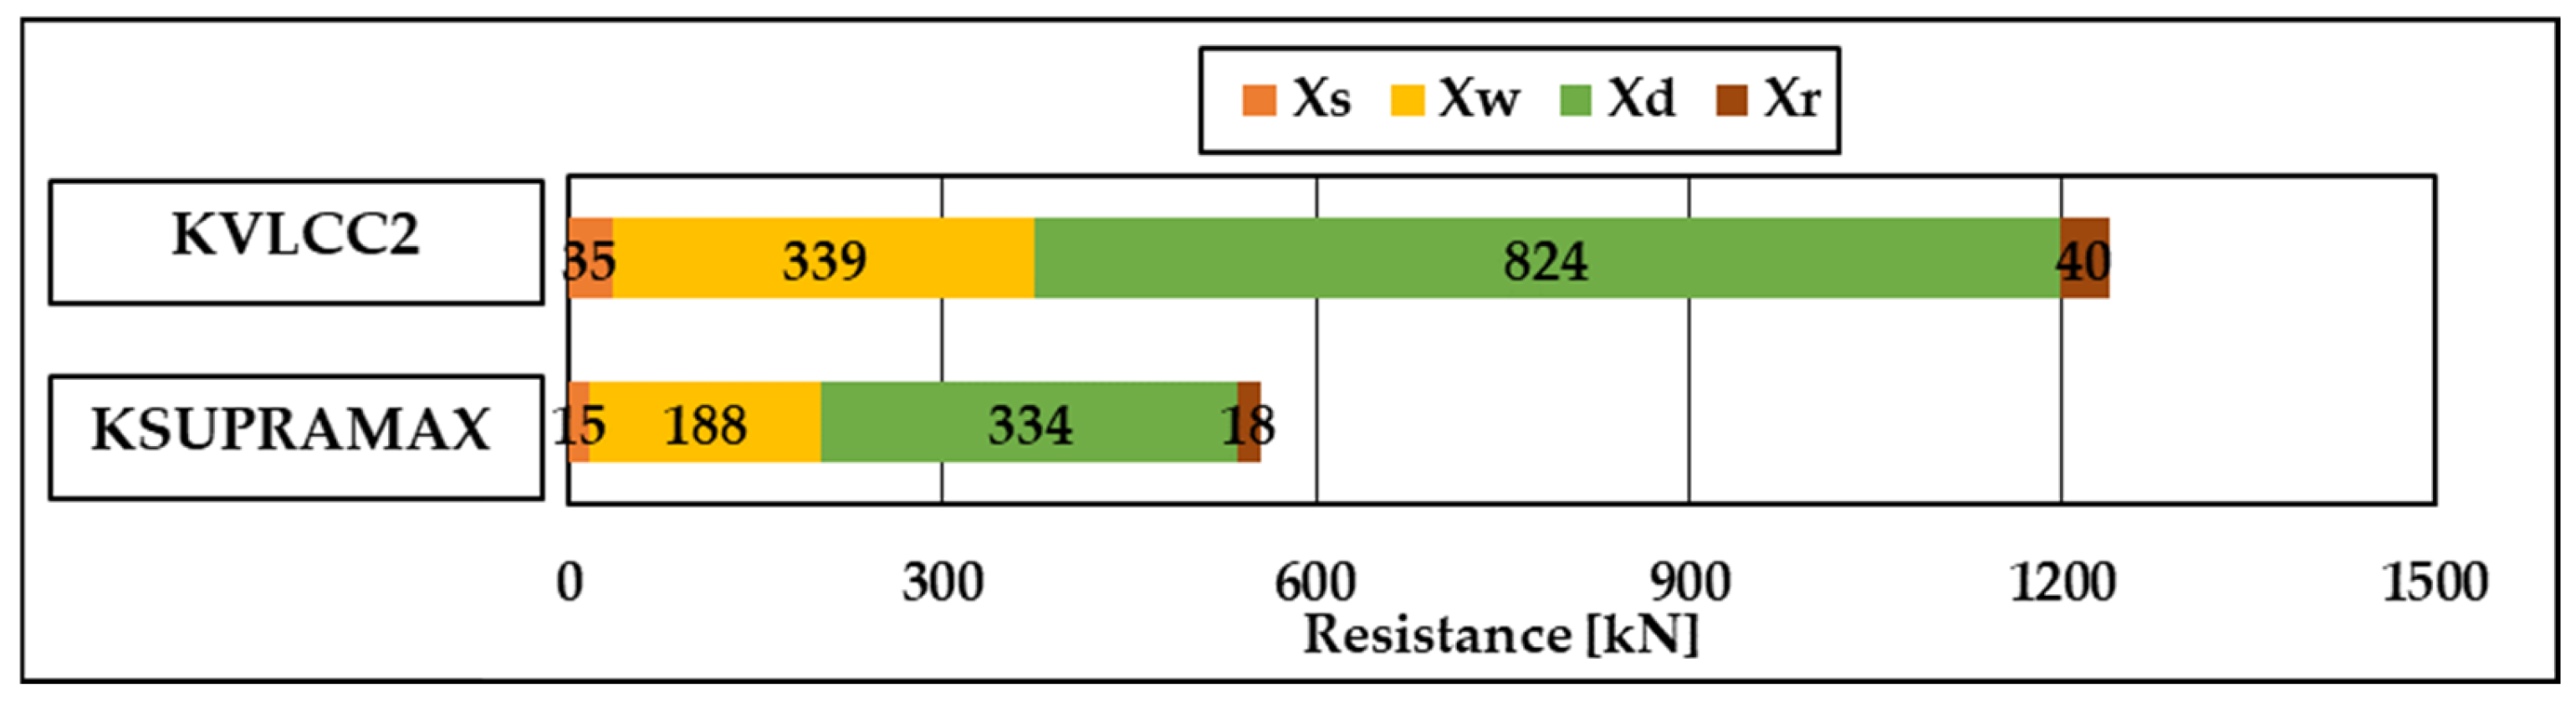
  • In adverse conditions, with decreasing speed, the proportion of the added resistance becomes larger than that under calm-water conditions. At the required forward speed of 2 knots for the MPP assessment, it increased by more than 30 times.
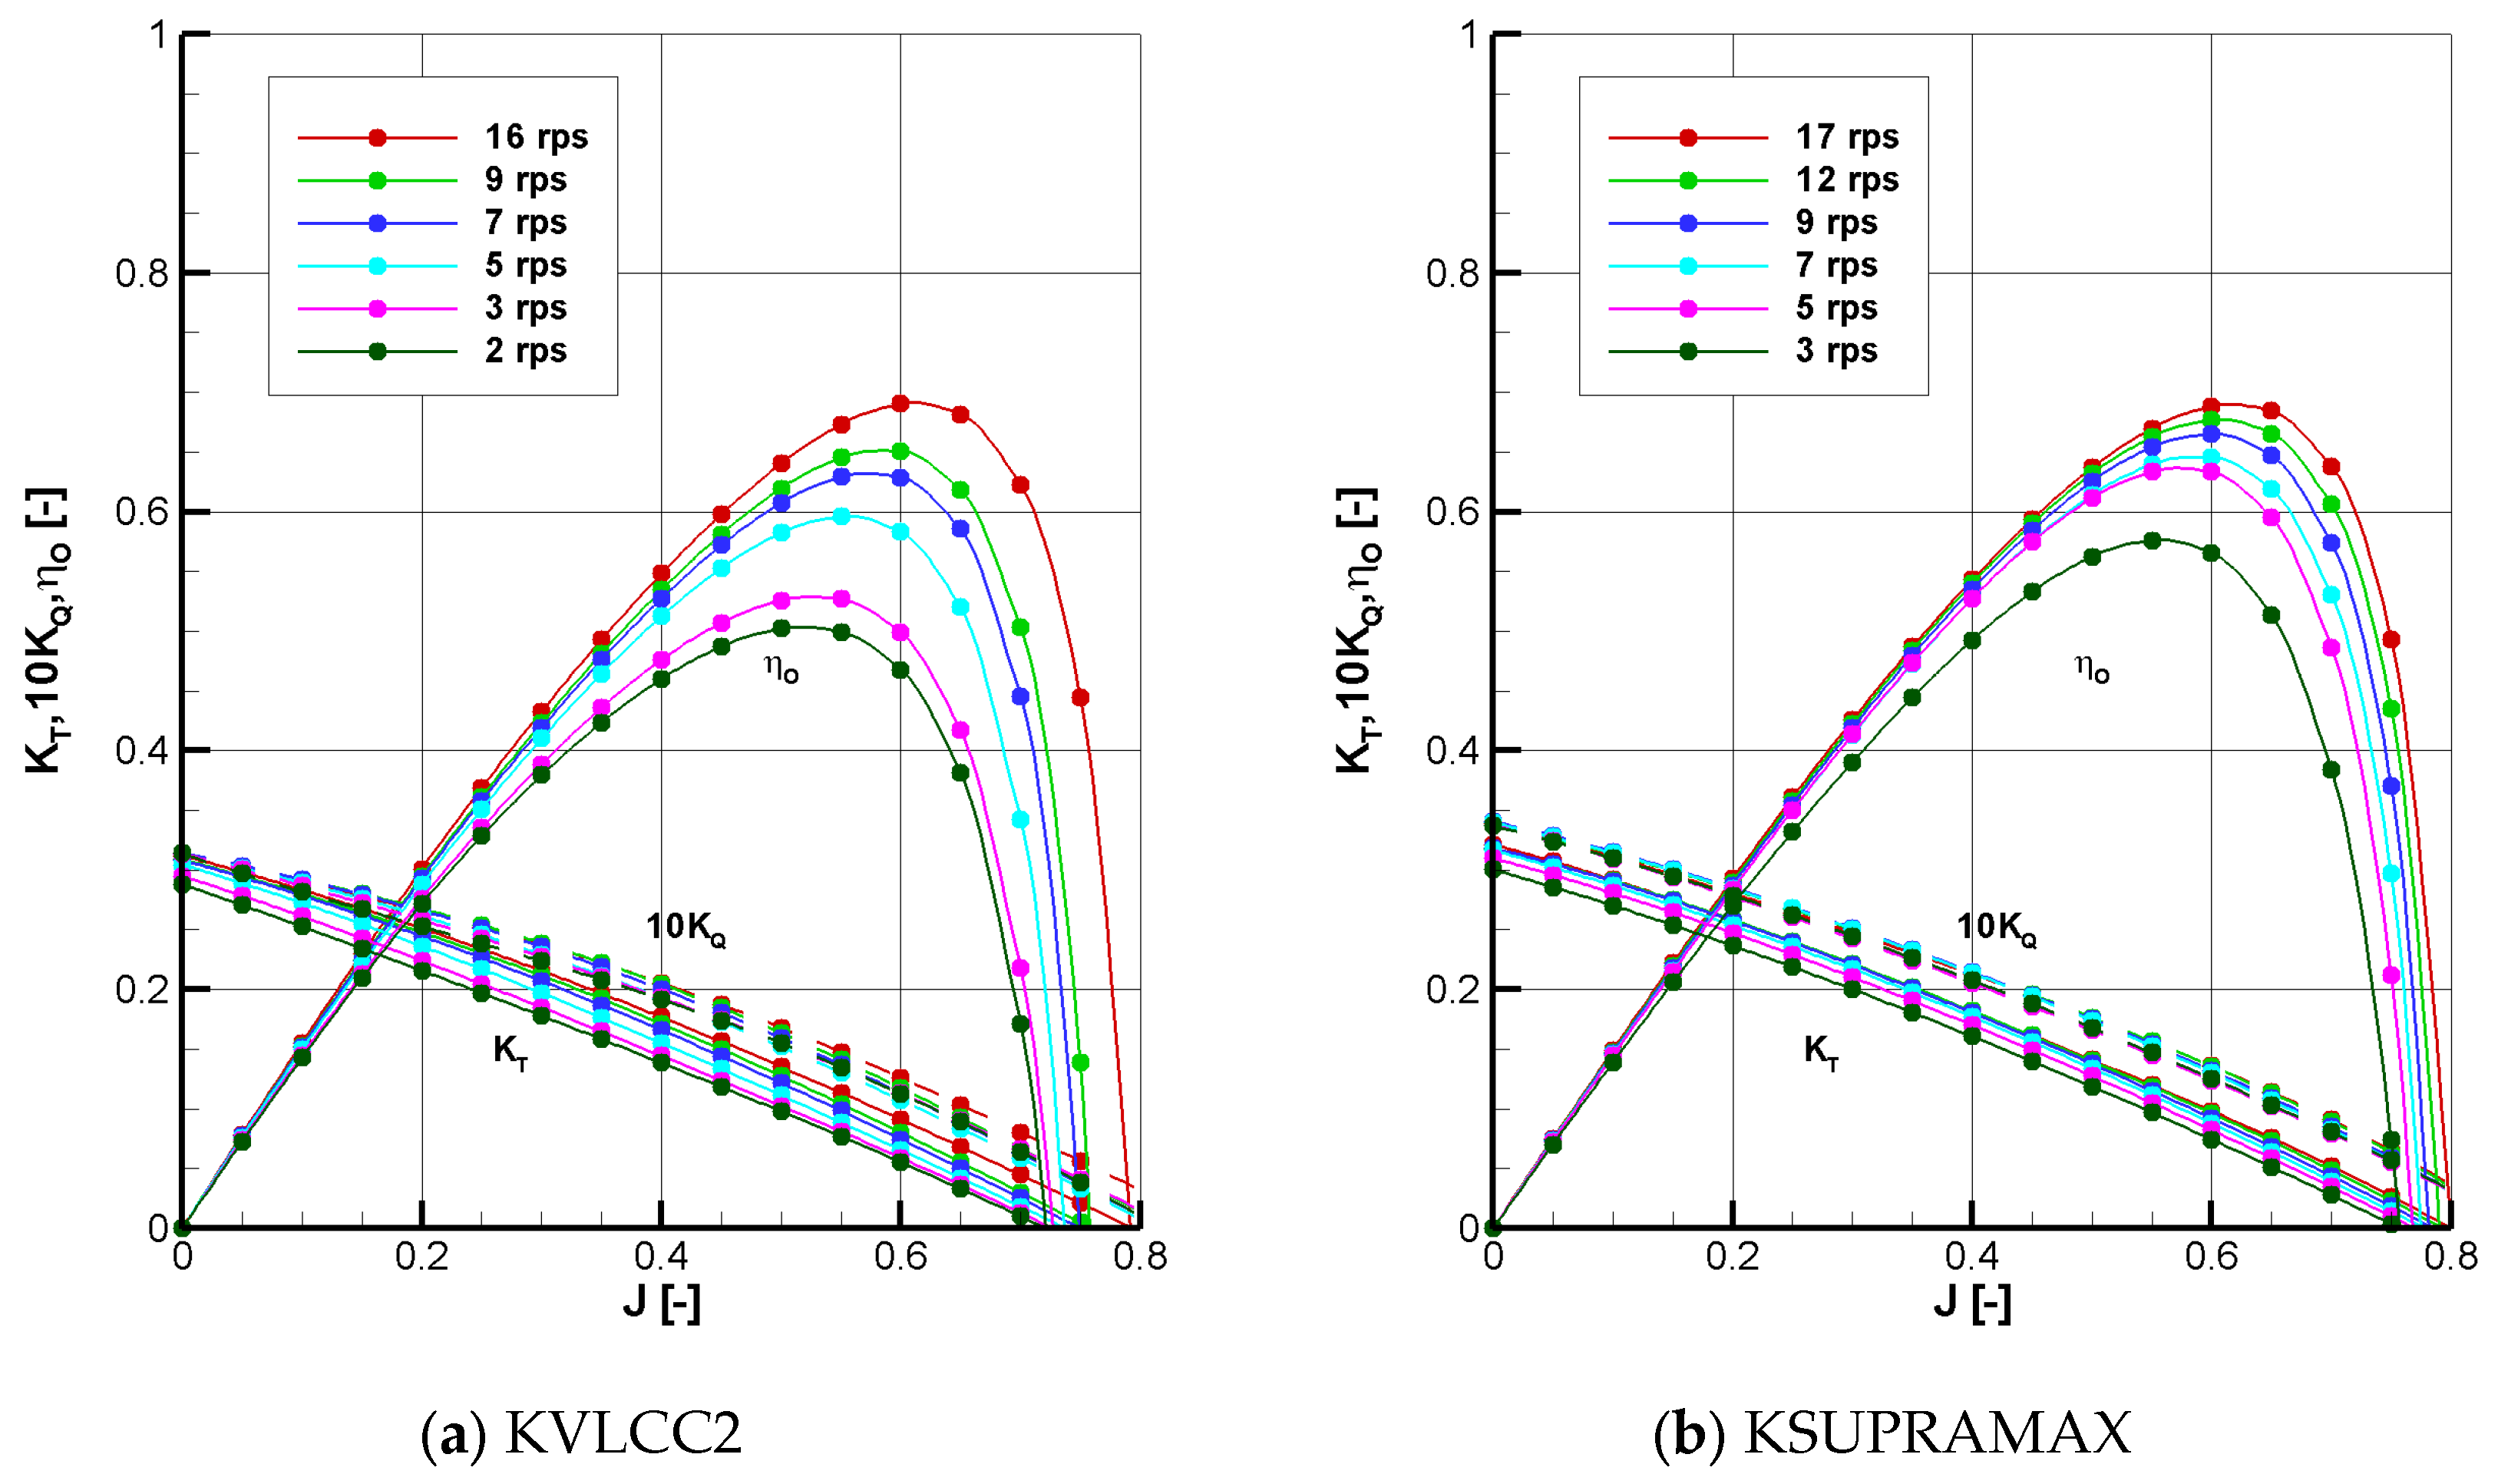
  • POW tests were conducted for low Reynolds number conditions for the propeller flow matching those of the self-propulsion point; the propeller open-water efficiency decreased with a decrease in the Reynolds number when the advance ratio was held constant.
  • The characteristics of the self-propulsion factors corresponding to Method A (POW results with a high Reynolds number) and Method B (POW results with a Reynolds number matching the self-propulsion point) were analyzed.
  • The overload test revealed that the thrust deduction factor decreased with decreasing speed. The wake fraction decreased slightly corresponding to Method A with decreasing speed, whereas it increased corresponding to Method B.
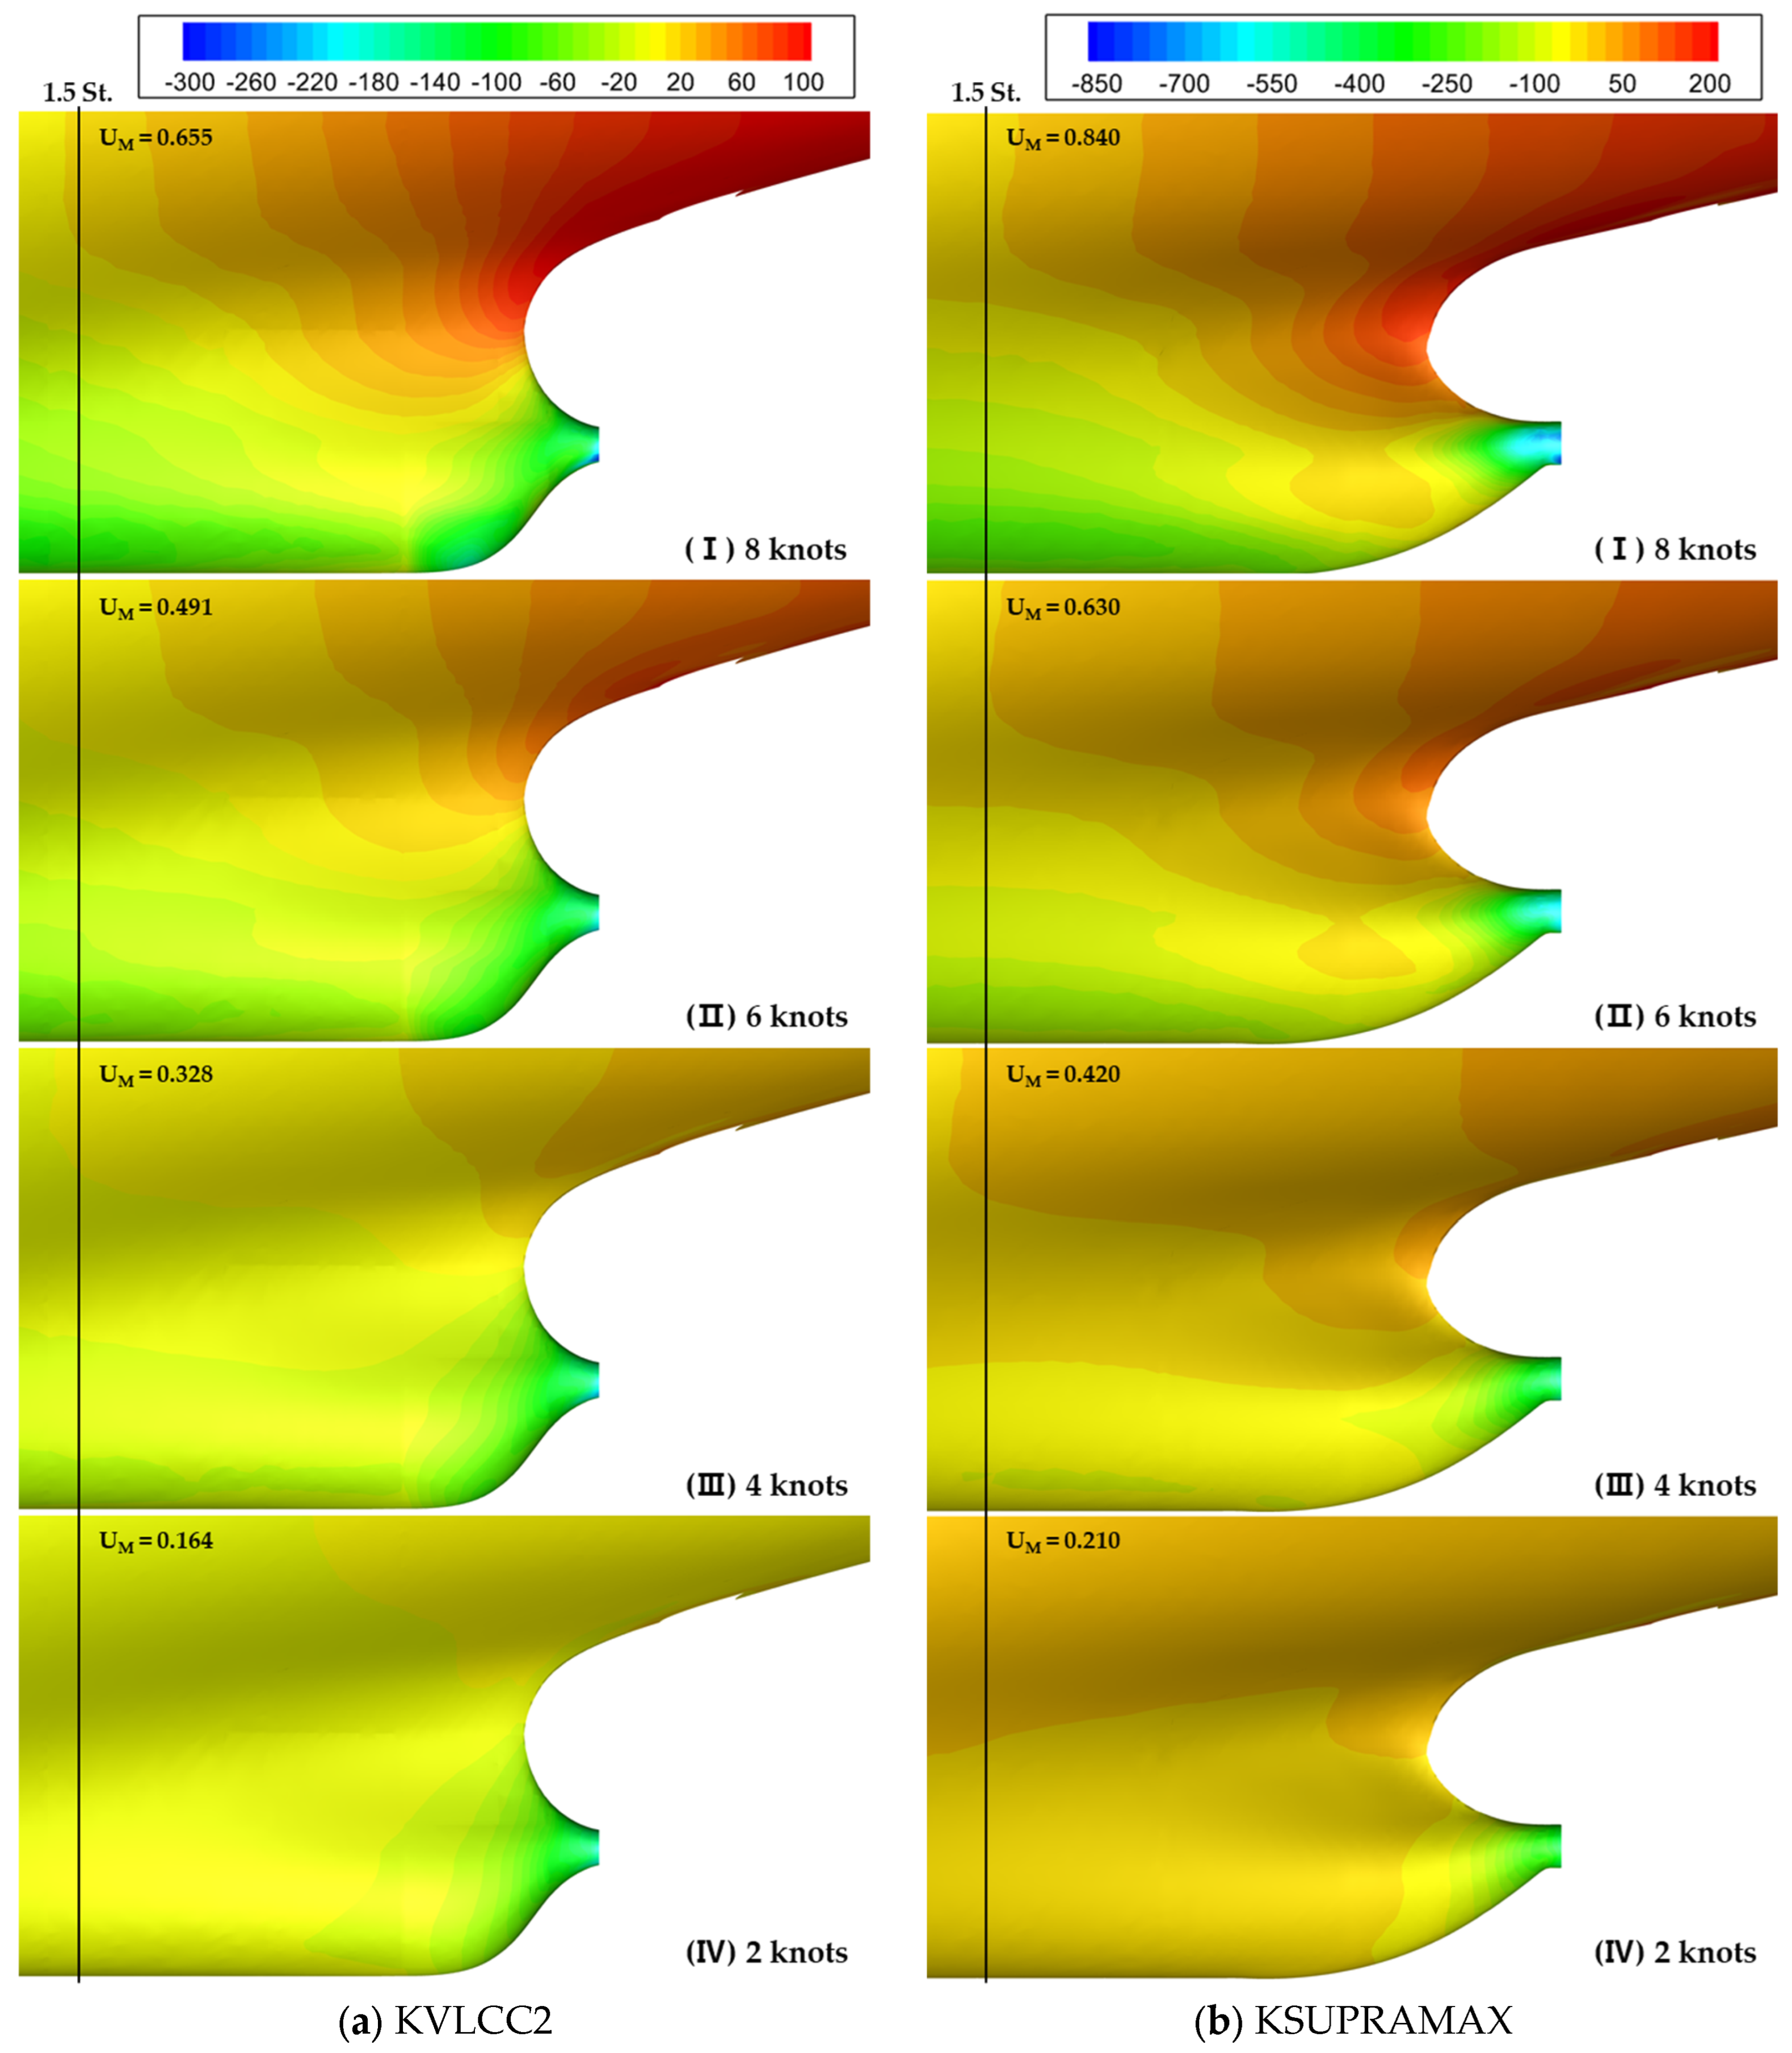
  • The physical phenomena in adverse conditions were analyzed using CFD simulations at the model scale. The thrust deduction factor decreased with decreasing speed, attributed to the reduction in propeller suction induced by the decrease in speed, as clearly demonstrated by analyzing the pressure distribution on the hull surface using CFD simulations.
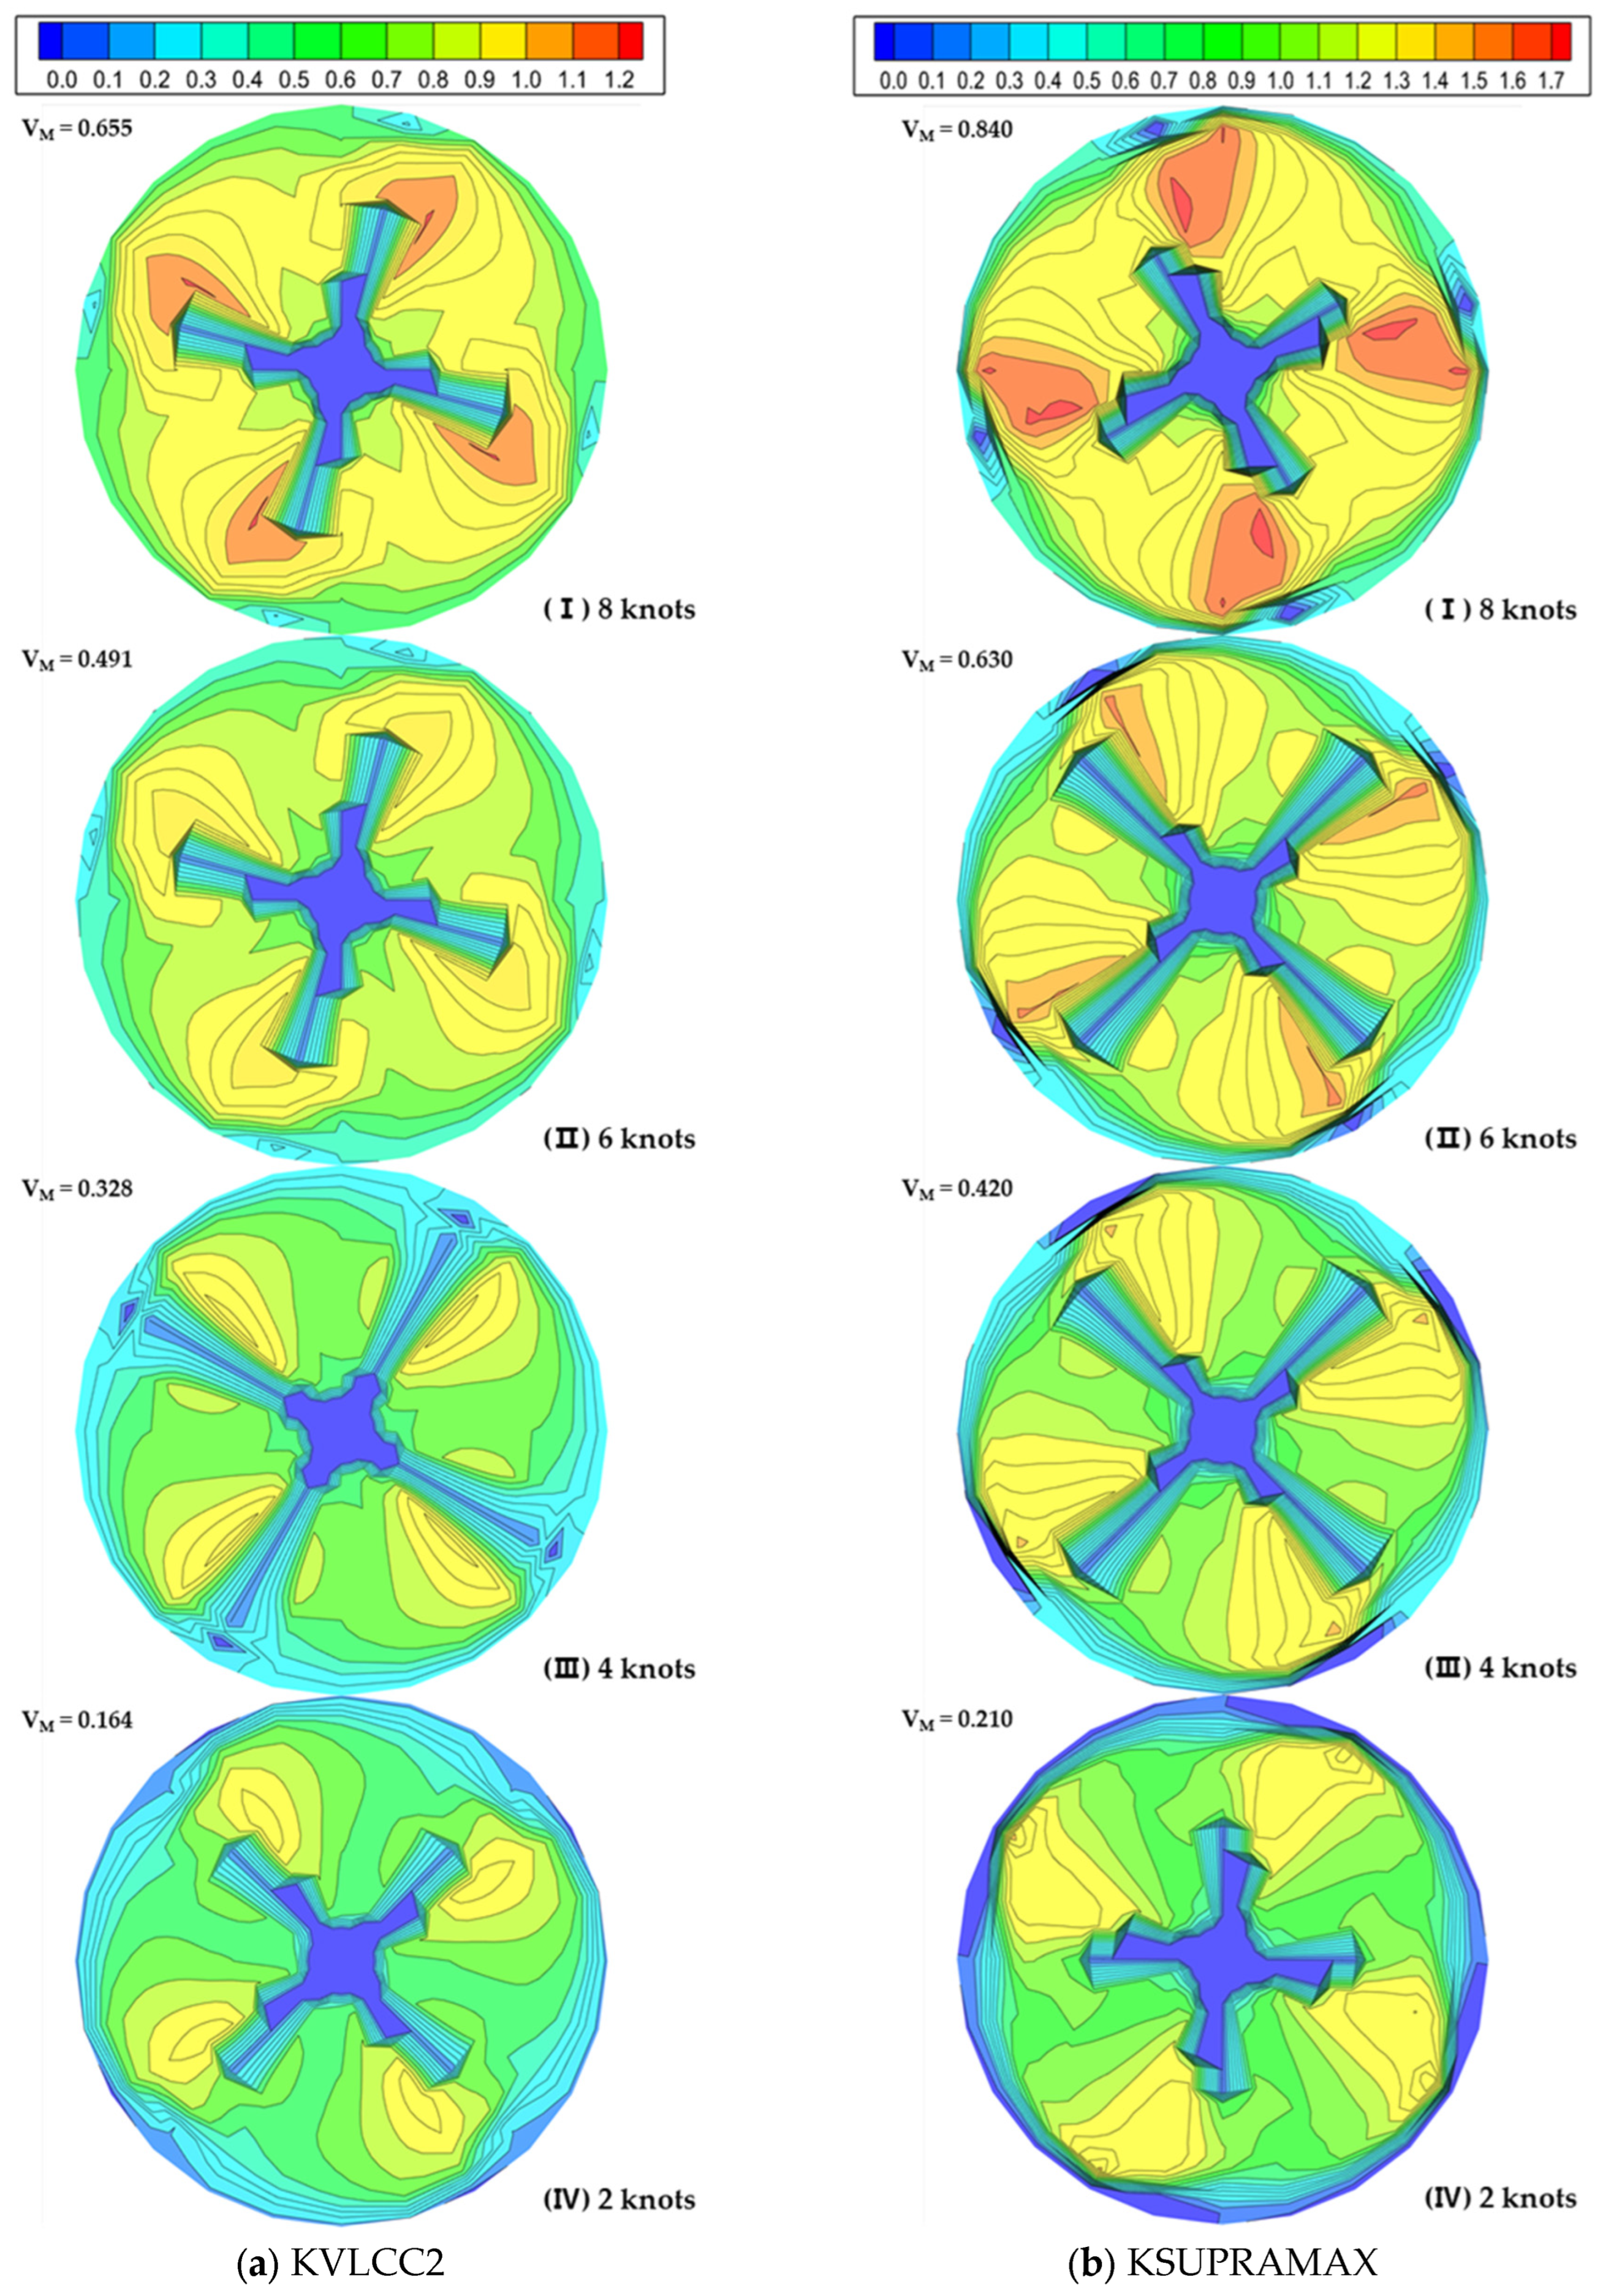
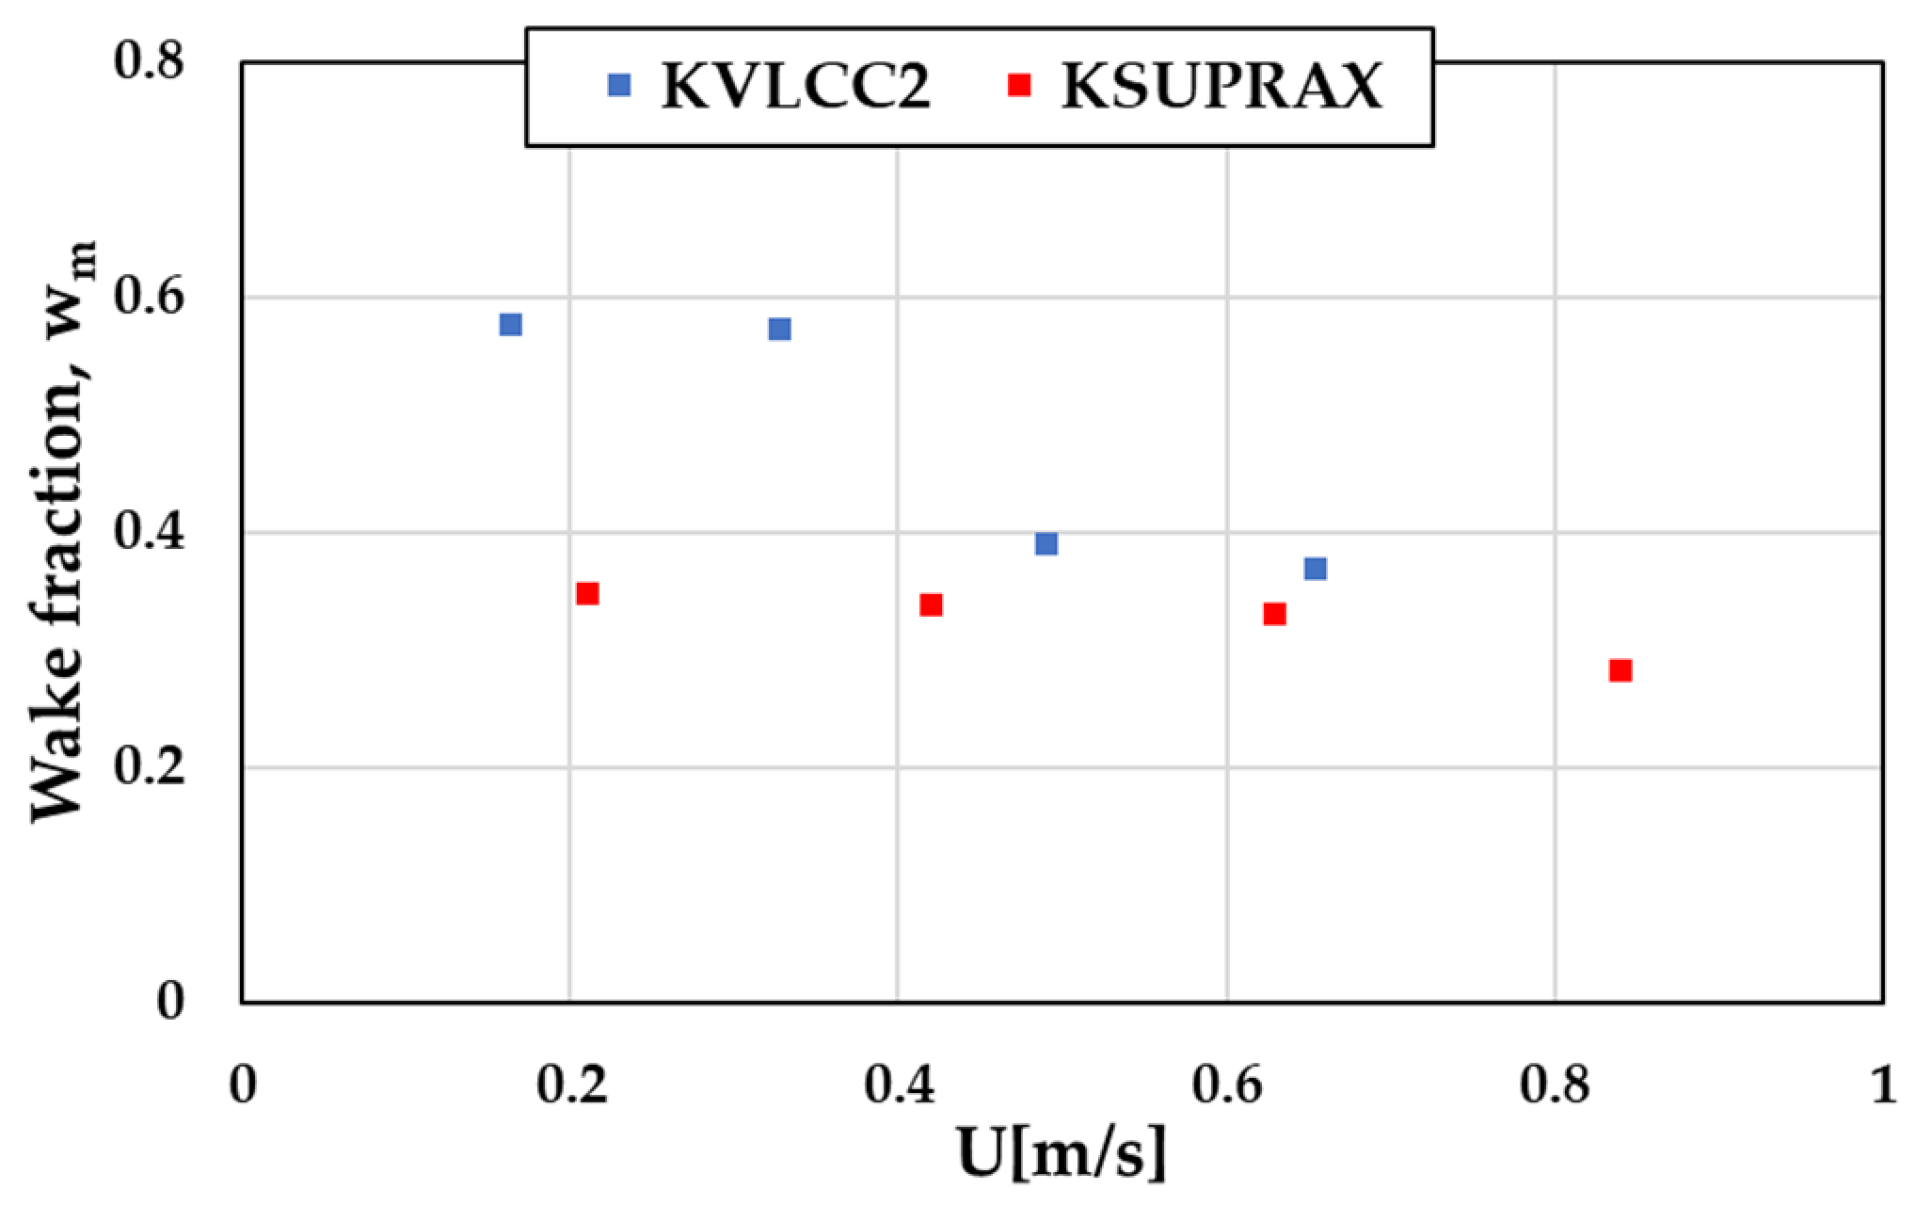
  • The flow field induced by the propeller operating on the propeller plane was obtained using CFD simulations. The propeller-induced velocity was calculated using momentum theory, and the effective wake fraction at the model scale was derived indirectly by subtracting it from the flow field. Consequently, the wake fraction increased with decreasing speed, consistent with the trend indicated by the model test results when Method B was considered.
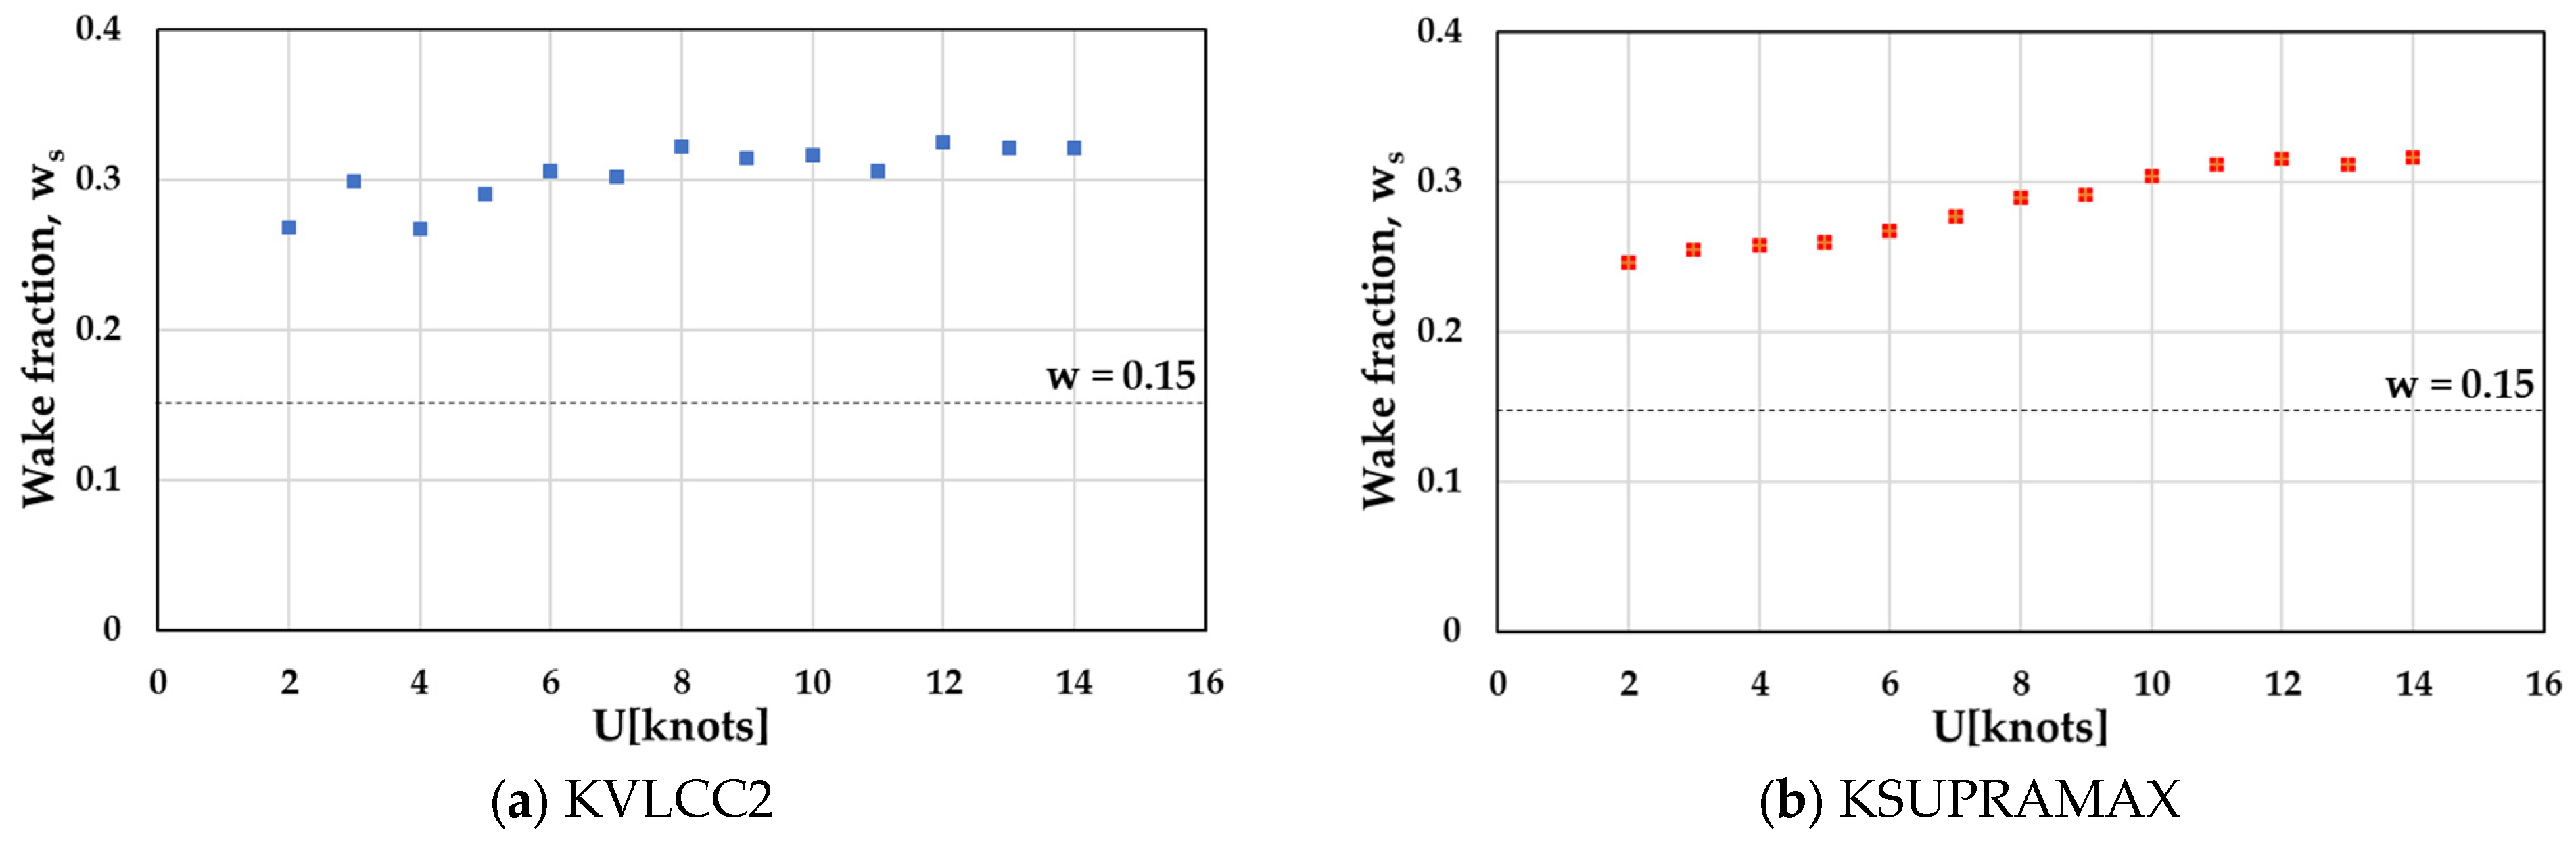
  • Full-scale estimation of self-propulsion factors was performed using the results corresponding to Method B. The thrust deduction factor was lower than that given in the MPP guidelines ( t = 0.1 ), whereas the wake fraction was higher ( w = 0.15 ).
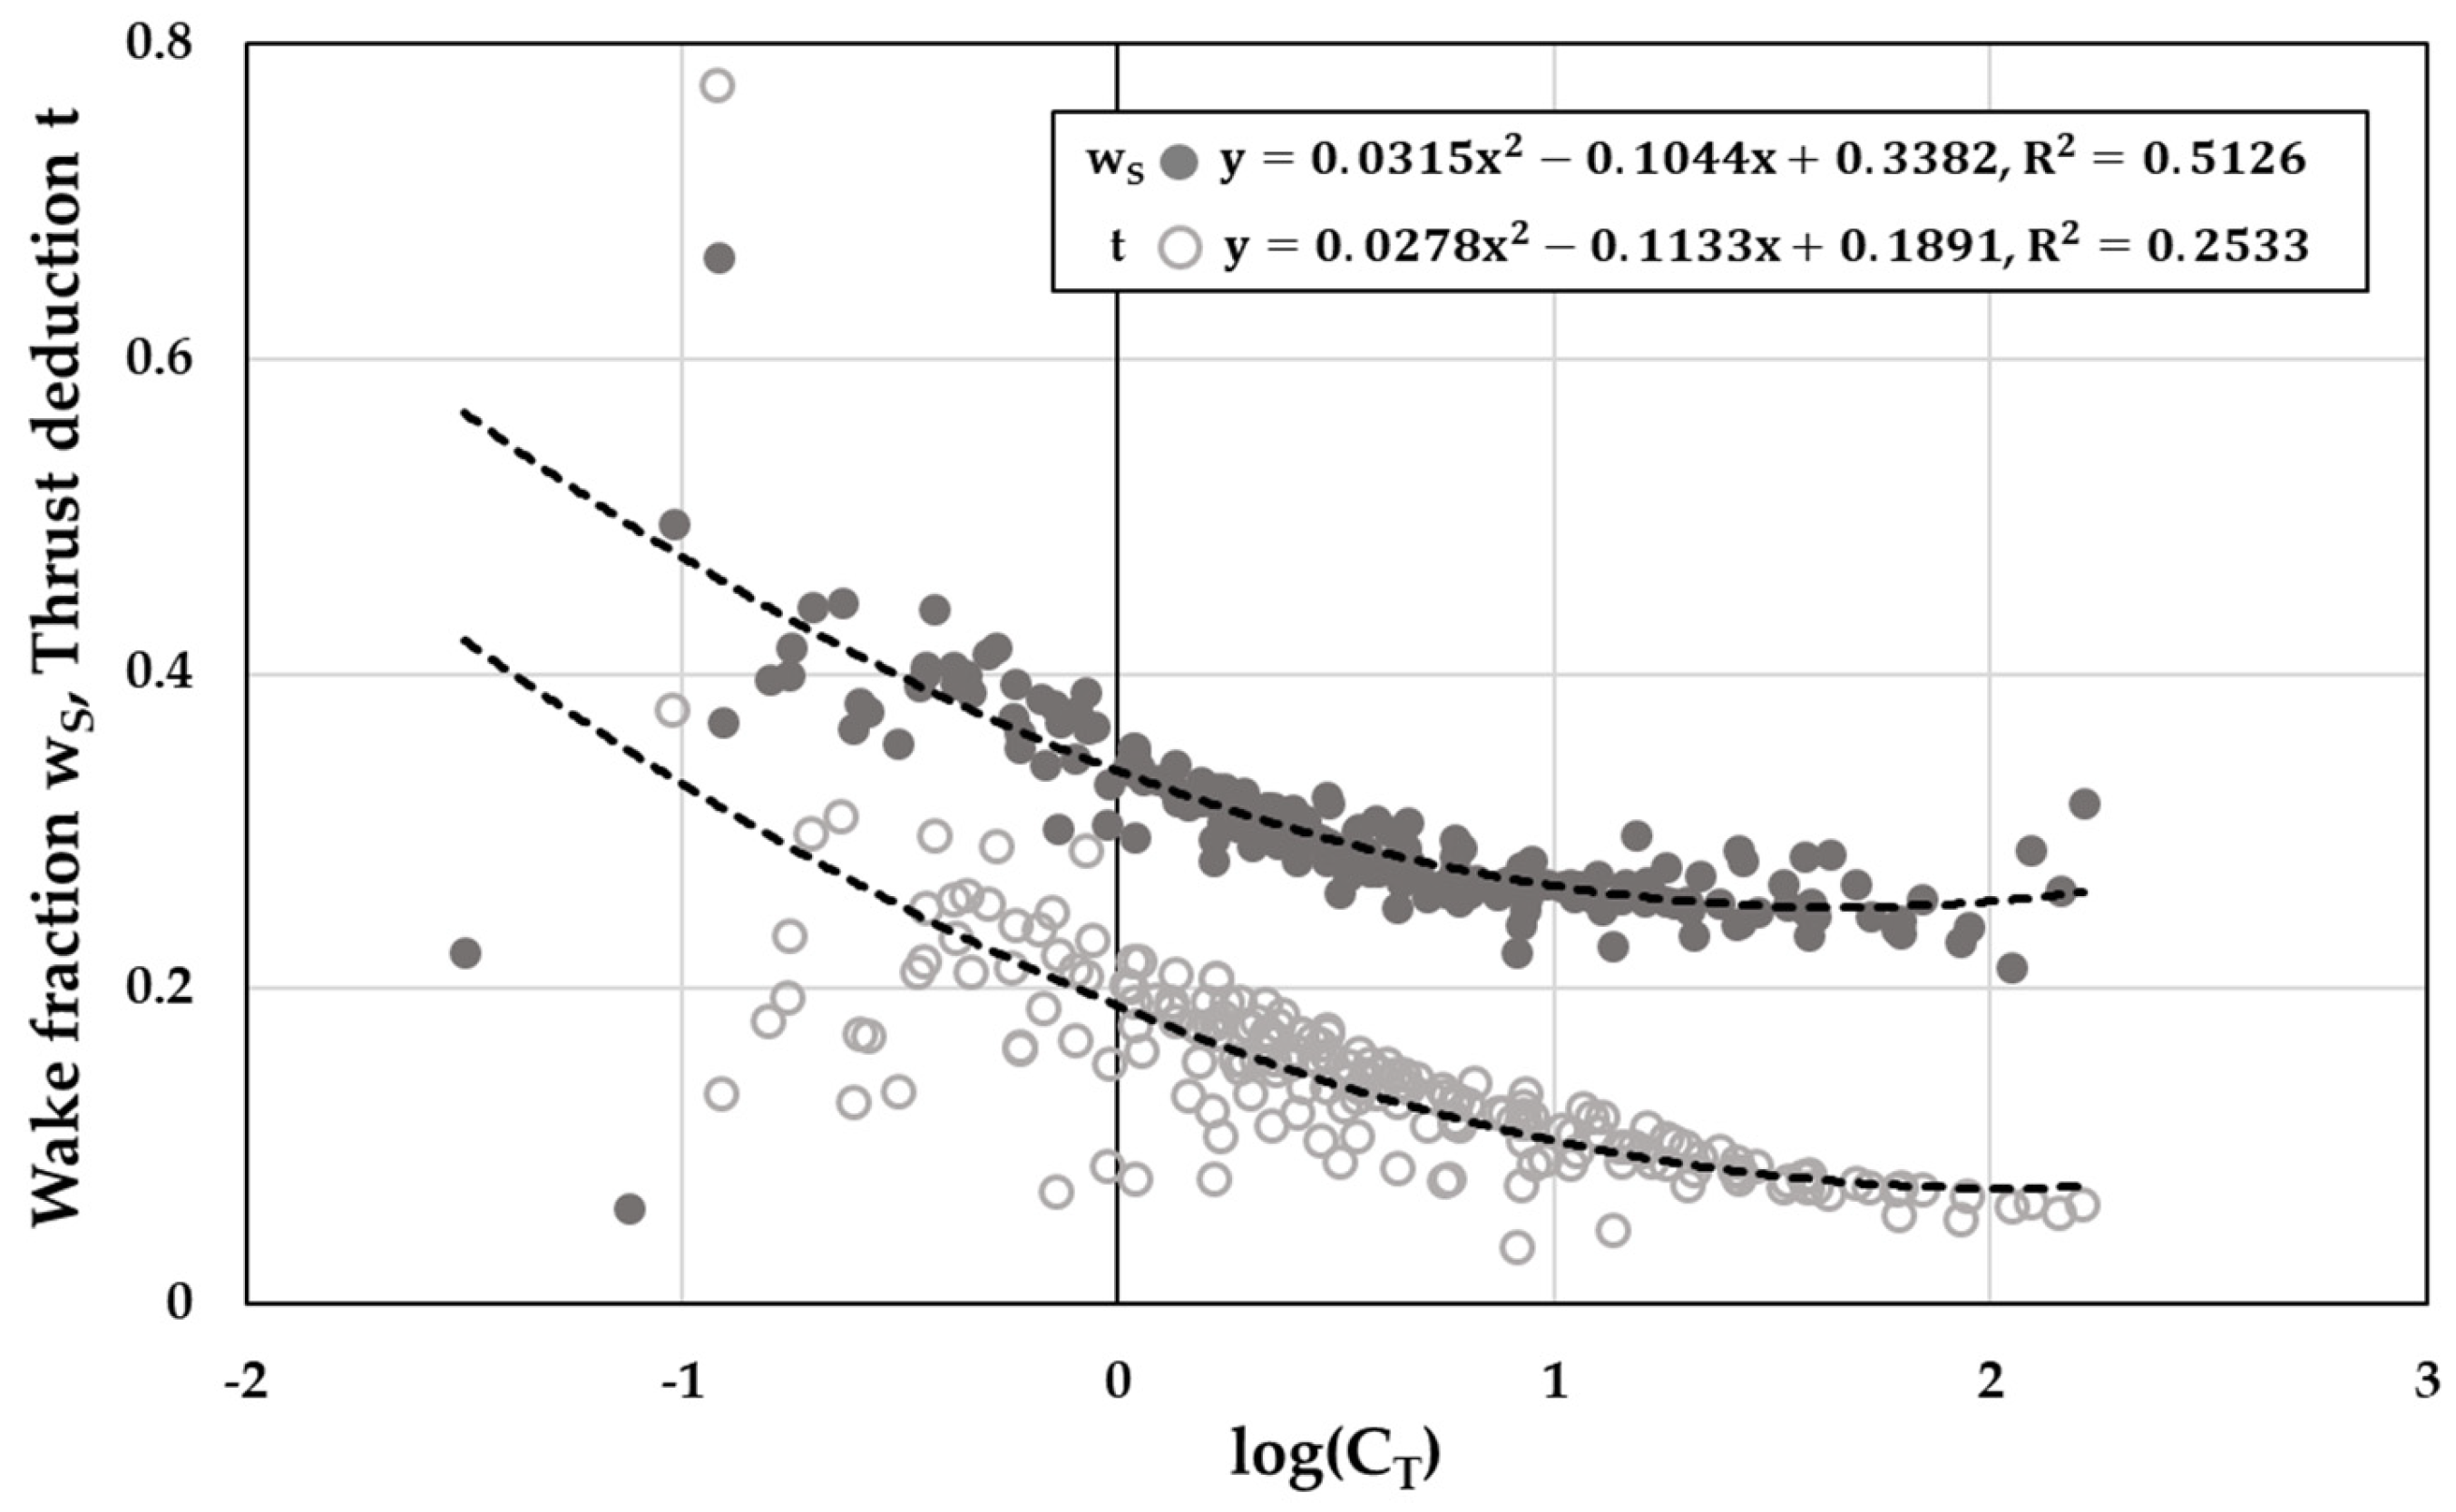
  • Regression analysis was performed on the self-propulsion factors using the thrust loading coefficient. Self-propulsion factors were demonstrated to decrease with increasing propeller load under full-scale conditions. A more accurate analysis of the correlation between self-propulsion factors and the loading coefficient could lead to an improvement in the MPP guidelines.
  • MPP assessments were conducted for the target ships, with the derived self-propulsion factors compared with those in the MPP guidelines. Although the self-propulsion factors were different from each other, some compensation owing to the shift in the advance ratio was observed in the quasi-propulsive efficiency. Consequently, the required brake power derived in this study for the target ships was approximately 4–5% less than that given in MPP guidelines.
  • For more reliable and accurate MPP assessments, the self-propulsion factors suggested in the MPP guidelines should be reviewed in more detail to address the absence of model-ship correlation factors in MPP assessment.
The MPP guidelines apply to specific ship types, sizes, and propulsion systems, with the required assessment speed set at 2 knots, which is significantly lower than a typical design speed. The limited research on this topic under low-speed conditions, in contrast to the abundance of studies on near-design speed conditions, necessitates further investigation to ensure the reliability of MPP guidelines. Future studies should conduct additional model tests on MPP assessments for various ships.

Author Contributions

Conceptualization, J.-H.L., S.H. and Y.-Y.L.; methodology, J.-H.L., S.H. and Y.-Y.L.; model testing, J.-H.L., S.H. and Y.-Y.L.; CFD simulation, J.-H.L. and W.-S.J.; analysis, J.-H.L. and S.H.; investigation, J.-H.L., S.H. and W.-S.J.; writing—original draft preparation, J.-H.L.; writing—review and editing, J.-H.L., S.H. and M.-C.K.; supervision, S.H. and M.-C.K.; project administration, S.H. All authors have read and agreed to the published version of the manuscript.

Funding

This research was supported by a grant from the Korea Research Institute of Ships and Ocean Engineering’s Endowment Project of “Development of evaluation technology for ship’s performance in extreme environment” funded by the Ministry of Oceans and Fisheries (PES5460).

Institutional Review Board Statement

Not applicable.

Informed Consent Statement

Not applicable.

Data Availability Statement

The datasets used and analysed during the current study available from the corresponding author on reasonable request.

Conflicts of Interest

The authors declare no conflicts of interest.

References

  1. IMO. Resolution MEPC.203(62). In Amendments to the Annex of the Protocol of 1997 to Amend the International Convention for the Prevention of Pollution from Ships; International Maritime Organization: London, UK, 1973; As Modified by the Protocol of 1978 Relating Thereto (Inclusion of Regulations on Energy Efficiency for Ships in MARPOL Annex VI), MEPC 62/24/Add.1; p. 2011. [Google Scholar]
  2. IMO. Resolution MEPC.324(75). In Amendments to the Annex of the Protocol of 1997 to Amend the International Convention for the Prevention of Pollution from Ships; MEPC 75/18/Add.1; International Maritime Organization: London, UK, 1973; As Modified by the Protocol of 1978 Relating Thereto—Amendments to MARPOL Annex VI (Procedures for Sampling and Verification of the Sulphur Content of Fuel Oil and the Energy Efficiency Design Index (EEDI)); p. 2020. [Google Scholar]
  3. IMO. Resolution MEPC.328(76). In Amendments to the Annex of the Protocol of 1997 to Amend the International Convention for the Prevention of Pollution from Ships; MEPC 76/15/Add.1; International Maritime Organization: London, UK, 1973; As Modified by the Protocol of 1978 Relating Thereto—2021 Revised MARPOL Annex VI; p. 2021. [Google Scholar]
  4. IMO. Resolution MEPC.364(79). In Guidelines on the Method of Calculation of the Attained Energy Efficiency Design Index (EEDI) for New Ships; MEPC 79/15/Add.1; International Maritime Organization: London, UK, 2022. [Google Scholar]
  5. IMO. Resolution MEPC.350(78). In Guidelines on the Method of Calculation of the Attained Energy Efficiency Existing Ship Index (EEXI); MEPC 78/17/Add.1; International Maritime Organization: London, UK, 2022. [Google Scholar]
  6. Farkas, A.; Degiuli, N.; Martić, I.; Grlj, C.G. Is slow steaming a viable option to meet the novel energy efficiency requirements for containerships? J. Clean. Prod. 2022, 374, 133915. [Google Scholar] [CrossRef]
  7. Farkas, A.; Degiuli, N.; Martić, I.; Mikulić, A. Benefits of slow steaming in realistic sailing conditions along different sailing routes. Ocean Eng. 2023, 275, 114143. [Google Scholar] [CrossRef]
  8. Zincir, B. Slow steaming application for short-sea shipping to comply with the CII regulation. Brodogradnja 2023, 74, 21–38. [Google Scholar] [CrossRef]
  9. IMO. Resolution MEPC.232(65). In Interim Guidelines for Determining Minimum Propulsion Power to Maintain the Manoeuvrability of Ships in Adverse Conditions; MEPC; International Maritime Organization: London, UK, 2013; Volume 65/22. [Google Scholar]
  10. IMO. Guidelines for Determining Minimum Propulsion Power to Maintain the Manoeuvrability of Ships in Adverse Conditions; MEPC.1/Circ.850/Rev.3; International Maritime Organization: London, UK, 2021. [Google Scholar]
  11. Sung, Y.J.; Ock, Y.B. Progress of the 2013 interim guidelines for determining minimum propulsion power to maintain the manoeuvrability of ships in adverse conditions. J. Soc. Nav. Archit. Korea 2019, 56, 497–506. [Google Scholar] [CrossRef]
  12. Gerhardt, F.C.; Kjellberg, M.; Korkmaz, B.; Ljungqvist, K.; Shiri, A. Determining the EEDI “Minimum Propulsion Power”. In Influence of EEDI on Ship Design & Operation; Royal Institution of Naval Architects: London, UK, 2020. [Google Scholar]
  13. Holt, P.; Nielsen, U.D. Preliminary assessment of increased main engine load as a consequence of added wave resistance in the light of minimum propulsion power. Appl. Ocean Res. 2021, 108, 102543. [Google Scholar] [CrossRef]
  14. Feng, P.; Liu, S.; Shang, B.; Papanikolaou, A. Minimum propulsion power assessment of a VLCC to maintain the maneuverability in adverse conditions. J. Mar. Sci. Eng. 2021, 9, 1287. [Google Scholar] [CrossRef]
  15. Liu, S.; Papanikolaou, A.; Shang, B. Regulating the safe navigation of energy-efficient ships: A critical review of the finalized IMO guidelines for assessing the minimum propulsion power of ships in adverse conditions. Ocean Eng. 2022, 249, 111011. [Google Scholar] [CrossRef]
  16. Bose, N.; Molloy, S. Reliability and accuracy of ship powering performance extrapolation. In Proceedings of the First International Symposium on Marine Propulsors, Trondheim, Norway, 22–24 June 2009. [Google Scholar]
  17. ITTC. Recommended procedures and guidelines. In Propulsion Tests in Ice; 7.5-02-04-02.2; International Towing Tank Conference: Zürich, Switzerland, 2017. [Google Scholar]
  18. Jones, S.J. Resistance and Propulsion Model Tests of the USCGC Healy (Model546) in Ice; Laboratory Memorandum (National Research Council of Canada, Institute for Ocean Technology): Sidney, BC, Canada, 2005. [Google Scholar]
  19. Wang, J.; Jones, S.J. Resistance and propulsion of CCGS Terry Fox in Ice from Model Tests to Full Scale Correlation. In Proceedings of the SNAME 8th International Conference and Exhibition on Performance of Ships and Structures in Ice, Banff, AB, Canada, 20–23 July 2008. [Google Scholar]
  20. Matsuzawa, T.; Shimoda, H.; Wako, D.; Uto, S.; He, Q.; Watanabe, S. Load-varying methods for ship power estimation in brash ice channel by ice tank model test. In Proceedings of the 24th International Conference on Port and Ocean Engineering Under Arctic Conditions, Busan, Republic of Korea, 11–16 June 2017. [Google Scholar]
  21. Ji, S.; Tian, Y. Research on overload method based on known ice resistance for self-propulsion test in conventional towing tank. In Proceedings of the 25th International Conference on Port and Ocean Engineering under Arctic Conditions, Delft, The Netherlands, 9–13 June 2019. [Google Scholar]
  22. ITTC. Recommended procedures and guidelines. In ITTC Perform. Prediction Method; 7.5-02-03-01.4; International Towing Tank Conference: Zürich, Switzerland, 2021. [Google Scholar]
  23. Saettone, S.; Taskar, B.; Steen, S.; Andersen, P. Experimental measurements of propulsive factors in following and head waves. Appl. Ocean Res. 2021, 111, 102639. [Google Scholar] [CrossRef]
  24. Heinke, H.-J.; Hellwig-Rieck, K.; Lübke, L. Influence of the Reynolds number on the open water characteristics of propellers with short chord lengths. In Proceedings of the Sixth International Symposium on Marine Propulsors, Rome, Italy, 26–30 May 2019. [Google Scholar]
  25. Kim, D.-H.; Jeon, G.M.; Park, J.C.; Shin, M.-S. CFD simulation on predicting POW performance adopting laminar-turbulent transient model. J. Soc. Nav. Archit. Korea 2021, 58, 1–9. [Google Scholar] [CrossRef]
  26. Grlj, C.G.; Degiuli, N.; Martić, I. Experimental and numerical assessment of the effect of speed and loading conditions on the nominal wake of a containership. Brodogradnja 2024, 75, 75405. [Google Scholar] [CrossRef]
  27. Molloy, S. Ship Powering Prediction Using Load Varying Self-Propulsion Tests, Degree of Master of Engineering; Memorial University of Newfoundland: St. John’s, NL, Canada, 2001. [Google Scholar]
  28. Hadler, J.B. The effect of propeller loading on thrust deduction. In Proceedings of the 26th American Towing Tank Conference, New York, NY, USA, 23–24 July 2001. [Google Scholar] [CrossRef]
  29. Degiuli, N.; Martić, I.; Farkas, A.; Buča, M.P.; Dejhalla, R.; Grlj, C.G. Experimental assessment of the hydrodynamic characteristics of a bulk carrier in off-design conditions. Ocean Eng. 2023, 280, 114936. [Google Scholar] [CrossRef]
  30. Harvald, S.A. Wake and Thrust Deduction at Extreme Propeller Loadings; Swedish State Shipbuilding Experimental Tank; Scandinavian University Books: Lund, Sweden, 1967. [Google Scholar]
  31. Harvald, S.A. Resistance and Propulsion of Ships (Ocean Engineering: A Wiley Series), 1st ed.; Wiley Interscience: Hoboken, NJ, USA, 1983; pp. 150–180. [Google Scholar]
  32. Scragg, C. Wake Scale Effects and Propeller Hull Interaction: State of the Art; Ship Performance Department Report; David W. Taylor Naval Ship Research and Development Center (DTNSRDC): Bethesda, MD, USA, 1980. [Google Scholar]
  33. Pecoraro, A.; Di Felice, F.; Felli, M.; Salvatore, F.; Viviani, M. Propeller-hull interaction in a single-screw vessel. In Proceedings of the Third International Symposium on Marine Propulsors, Launceston, TAS, Australia, 5–8 May 2013. [Google Scholar]
  34. Can, U.; Delen, C.; Bal, S. Effective wake estimation of KCS hull at full-scale by GEOSIM method based on CFD. Ocean Eng. 2020, 218, 108052. [Google Scholar] [CrossRef]
  35. Yao, H.; Zhang, H. Prediction of ship effective wake field using a pure RANS-based methodology. Nav. Eng. J. 2018, 130–132, 47–58. [Google Scholar]
  36. Sánchez-Caja, A.; Martio, J.; Viitanen, V.M.; Siikonen, T. Simulation of turbulent effective wakes for propellers in off-design conditions by a correction factor approach. J. Mar. Sci. Technol. 2021, 26, 1014–1025. [Google Scholar] [CrossRef] [PubMed]
  37. Gao, Q.; Jin, W.; Vassalos, D. The calculations of propeller induced velocity by RANS and momentum theory. J. Mar. Sci. Appl. 2012, 11, 164–168. [Google Scholar] [CrossRef]
Figure 1. Changes in resistance and thrust in adverse conditions.
Jmse 13 00595 g001
Figure 2. Resistance considering the correlation between the thrust and towing force.
Jmse 13 00595 g002
Figure 4. Stacked bar chart of resistance components for target ships at 2 knots (kN).
Jmse 13 00595 g004
Figure 5. Schematic diagram of a KRISO towing tank and towing tank carriage.
Jmse 13 00595 g005
Figure 6. Model ships and propellers of target ships.
Jmse 13 00595 g006
Figure 7. Overload test results of target ships.
Jmse 13 00595 g007
Figure 8. POW results of target propellers.
Jmse 13 00595 g008
Figure 9. Numerical domain, boundary conditions, and grid system.
Jmse 13 00595 g009
Figure 10. Verification results for grid dependency.
Jmse 13 00595 g010
Figure 11. Validation results compared with model test results (●: model test; ○: CFD simulation).
Jmse 13 00595 g011
Figure 12. Thrust and speed of revolution at the self-propulsion point considering the SFC*.
Jmse 13 00595 g012
Figure 13. Thrust deduction factor in adverse conditions.
Jmse 13 00595 g013
Figure 14. Distribution of the pressure coefficient at the stern.
Jmse 13 00595 g014
Figure 15. Wake fraction for Method A and Method B at the model scale.
Jmse 13 00595 g015
Figure 16. Flow field induced by the propeller on the propeller plane.
Jmse 13 00595 g016
Figure 17. Wake fraction obtained by subtracting the propeller-induced velocity from the flow field induced by the propeller operating in the propeller plane.
Jmse 13 00595 g017
Figure 18. Wake fraction at full-scale.
Jmse 13 00595 g018
Figure 19. Correlation between self-propulsion factors and l o g ( C T ) .
Jmse 13 00595 g019
Figure 20. Regression analysis of self-propulsion factors.
Jmse 13 00595 g020
Table 1. Definition of adverse conditions.
Ship Length LPP [m]Significant Wave Height HS [m]Peak Wave Period
TP [s]
Mean Wind Speed VW [m/s]
Less than 2004.57.0 to 15.019.0
200 ≤ LPP ≤ 250Parameters linearly interpolated depending on the ship’s length
More than 2506.07.0 to 15.022.6
Table 2. Formulas for resistance components.
Resistance ComponentFormulaExplanation
Total resistance X T = X S + X a X S : calm-water resistance
X a : maximum added resistance ,   X a = X w + X d + X r
Calm-water resistance X S = 1 + k × C f × 1 2 ρ S U 2 k : form factor ,   k = 0.095 + 25.6 C B L p p / B 2 B / T
C f : frictional resistance coefficient
ρ : sea water density ,   1025   k g / m 3
S : wetted surface area of the hull
U: forward speed, 2 knots
Wind resistance X w = 0.5 X w ( ε ) × ρ a × V w r 2 × A F X W ( ε ) : non-dimensional aerodynamic resistance coefficient, assumed to be 1.1
ε : apparent wind angle
ρ a : air density ,   1.2   k g / m 3
V w r : relative wind speed , V w r = U + V w c o s μ
V w : absolute wind speed
AF: frontal windage area of the hull and superstructure
Wave resistance X d = 1336 5.3 + U B × d L p p 0.75 × h s 2 L p p : length between perpendiculars
B : breadth of the ship
d : draft at the specified condition of loading
hs: significant wave height
Rudder resistance X r = 0.03 × T e r T e r : propeller thrust excluding ,   X r   from   T ,
T e r = ( X s + X d + X r ) / ( 1 t )
t: thrust deduction factor, 0.1
Table 3. Principal dimensions of target ships.
ParametersKVLCC2KSUPRAMAX
Scale ratio39.4424
Length between perpendiculars, LPP [m]320.0192.0
Breadth, B [m]58.036.0
Draft, T [m]20.813.0
Block coefficient, CB0.80980.8539
Propeller diameter, D [m]9.866.00
Number of blades44
Table 4. Resistance components of target ships at 2 knots (kN).
Target Ship X S X w X d X r X T X a / X S
KVLCC23533982440123834.3
KSUPRAMAX151883341855535.3
Table 5. Overload test conditions.
KVLCC2KSUPRAMAX
DraftDesign draft *Scantling draft
Speed0 (Bollard), 2–14 knots (Interval: 1 knot)
Propeller rotation rate2–9 rps (Interval: 1 rps)1.5–12 rps (Interval: 1.5 rps)
* KVLCC2 has the same design and scantling drafts.
Table 6. RPS and Reynolds numbers considered for the POW tests.
Target ShipRPS R e 0.7 R Target ShipRPS R e 0.7 R
KVLCC216 4.39 × 10 5 KSUPAMAX17 6.26 × 10 5
9 2.55 × 10 5 12 4.31 × 10 5
7 1.98 × 10 5 9 3.24 × 10 5
5 1.42 × 10 5 7 2.52 × 10 5
3 0.85 × 10 5 5 1.80 × 10 5
2 0.57 × 10 5 3 1.08 × 10 5
Table 7. RPS and speeds for CFD simulations.
Target ShipUS [knots]UM [m/s]RPS
KVLCC22, 4, 6, 80.164, 0.328, 0.498, 0.6553, 6, 9
KSUPAMAX0.210, 0.420, 0.630, 0.8403, 7.5, 12
Table 8. Self-propulsion factors for MPP assessment.
Target ShipGuidelineOLTRegression
Wake fraction, WSKVLCC20.1500.2680.252
KSUPRAMAX0.2460.252
Thrust deduction factor, tKVLCC20.1000.0750.081
KSUPRAMAX0.0740.079
Table 9. MPP assessment for KVLCC2.
Item [Unit]GuidelinesOLTDiff. [%]RegressionDiff. [%]
EHP[kW]12741273 1273
w[−]0.1500.268 0.252
T[−]0.1000.075 0.081
J[−]0.1230.109 0.111
η O [−]0.1930.171 0.174
η H [−]1.0591.264 1.229
η R [−]1.0001.000 1.000
η D [−]0.2050.216 0.214
RPM[rev/min]43.142.2−2.242.4−1.6
T[kN]13751337−2.81346−2.1
Q r e q [kN−m]13911347−3.21356−2.5
P B r e q [kW]62825949−5.36017−4.2
Table 10. MPP assessment for KSUPRAMX.
Item[Unit]GuidelinesOLTDiff. [%]RegressionDiff. [%]
EHP[kW]571571 571
w[−]0.1500.246 0.252
t[−]0.1000.074 0.079
J[−]0.1140.103 0.102
η O [−]0.1710.155 0.153
η H [−]1.0591.228 1.231
η R [−]1.0001.000 1.000
η D [−]0.1810.190 0.189
RPM[rev/min]76.675.0−2.175.2−1.8
T[kN]617599−2.9602−2.4
Q r e q [kN−m]398386−3.0388−2.5
P B r e q [kW]31913031−5.03054−4.3
Disclaimer/Publisher’s Note: The statements, opinions and data contained in all publications are solely those of the individual author(s) and contributor(s) and not of MDPI and/or the editor(s). MDPI and/or the editor(s) disclaim responsibility for any injury to people or property resulting from any ideas, methods, instructions or products referred to in the content.

