Article

Theoretical and Experimental Analysis of the Global Response of a Flexible Pipe Under Combined Axisymmetric and Bending Loads

by
Bernardo de P. M. da Costa
1,*,
José Renato M. de Sousa
2,
Ney Roitman
2 and
Erik Radke
3
1
Petrobras, Petróleo Brasileiro S.A., Avenida República do Chile, 65, Rio de Janeiro 20031-170, RJ, Brazil
2
Civil Engineering Department, COPPE/UFRJ—Post Graduate Institute, Federal University of Rio de Janeiro, Rio de Janeiro 21945-970, RJ, Brazil
3
LAMEF, Physical Metallurgy Laboratory, Federal University of Rio Grande do Sul, Av. Bento Gonçalves, 9500, Porto Alegre 91504-000, RS, Brazil
*
Author to whom correspondence should be addressed.
J. Mar. Sci. Eng. 2025, 13(11), 2180; https://doi.org/10.3390/jmse13112180
Submission received: 2 October 2025 / Revised: 13 November 2025 / Accepted: 14 November 2025 / Published: 18 November 2025
(This article belongs to the Special Issue Advanced Research in Flexible Riser and Pipelines)

Abstract

The bending stiffness of flexible pipes is highly dependent on curvature, driven by the interaction between their structural layers—a behavior often misrepresented by traditional numerical models. To overcome this limitation, a finite-difference-based model was developed, integrating previously proposed formulations for monotonic bending and axisymmetric responses into a return-mapping algorithm to capture hysteretic behavior under cyclic loading. The model was calibrated against pure bending and pressurized tests, accounting for interlayer adhesion and friction, which govern stiffness variation, force levels, and energy dissipation. Results showed excellent agreement with experimental data across different load combinations, confirming the model’s predictive capability. Parametric analyses revealed that higher adhesion and friction coefficients increase imposed forces until a no-slip condition is achieved, while energy dissipation follows a nonlinear dependence on interlayer friction, peaking at intermediate values and vanishing under no-slip conditions. Cyclic bending tests performed on degraded samples demonstrated that, despite wire deterioration, the global bending response remains essentially unchanged, reinforcing the stability of riser behavior over time. However, fatigue resistance must still be reassessed through updated S–N curves to account for material degradation. These findings underscore the crucial role of interlayer mechanics in determining the overall performance of flexible pipes and offer a validated framework for assessing fatigue and integrity.

1. Introduction

Unbonded flexible pipes are crucial in offshore systems, serving as conduits for oil production, water injection, gas transportation, and service lines. They offer key advantages, such as enabling early production systems, adapting to subsea layout changes, and reducing installation time compared to rigid pipelines. In a typical unbonded flexible pipe, as in Figure 1, mechanical resistance is mainly provided by three metallic layers: the carcass, the pressure armor, and the tensile armor layers. The carcass, when present, is the innermost layer, composed of profiled stainless steel strips wound at nearly 90° to withstand external pressure. The pressure armor layer resists internal pressure and typically consists of one or two Z-shaped carbon steel strips, laid at angles close to 90°. The tensile armor layers comprise high-alloy carbon steel wires with approximate rectangular cross-sections arranged in pairs (one or two pairs) and wound in opposing directions at angles between 20° and 55°. Their primary function is to resist tensile loads, torsion, and end cap effects. In contrast, internal and outer polymeric sheaths ensure tightness, while antiwear polymeric tapes reduce friction and wear between the metallic layers during the pipe operation. Furthermore, depending on design requirements, the structure may include insulation layers, a protective outer sheath, and high-strength tapes, as specified in [1].
Brazil’s flexible pipe industry benefits from strong manufacturing capabilities and a substantial fleet of installation vessels. However, flexible pipe technology faces challenges at extreme depths, in high-temperature environments, and in environments with elevated contaminant levels. These limitations may impact their effectiveness in offshore hydrocarbon exploration, particularly in Brazil’s Pre-Salt region [2]. For instance, flexible risers (e.g., Figure 1) are used in dynamic applications, connecting production units to flowlines, seabed equipment, and other floating structures [1]. These structures must resist operational and environmental loads that subject them to cyclic tensile forces and bending moments, especially at the riser support, where high axial loads and curvatures co-occur. The intensity of these loads increases with depth and operating pressures, which have both steadily risen over recent decades. In 2000, the average operating depth was approximately 650 m, with design pressures of 225 bar. By 2020, these values had increased to 1450 m and 320 bar [3].
The design of flexible risers involves iterative local and global analyses [4]. Local analyses model each pipe layer to determine the mechanical properties of the pipe (axial, torsional, and bending stiffnesses), which are then used in global finite element (FE) models to evaluate the riser’s response to environmental loads and vessel motions. In global models, while axial and torsional stiffnesses are generally assumed constant, accurately representing the nonlinear variation in bending stiffness with curvature remains a challenge. The design process concludes with refined local analyses to verify stresses, strains, and fatigue resistance under axisymmetric and bending loads. Hence, this process requires specific local models to account for the effects of axisymmetric and bending loads in the pipe structure, as well as global models that incorporate the nonlinear response of these structures.
The local mechanical response under axisymmetric loading has been extensively studied using analytical and numerical models. Early analytical formulations, which are based on equilibrium and compatibility equations with simplifying assumptions [5,6,7], evolved with the inclusion of the Clebsch–Kirchhoff theory for curved beams [8], polymeric sheath effects, and possible layer separation [9,10], which improved predictions of axial compression and torsion. Their predictive capability was validated by blind tests [11] and subsequent experimental studies [12,13]. Later works incorporated material nonlinearities [14,15], pressure and thermal effects [16,17] into the extensional–torsional response of the pipe, as well as structural defects [13,18]. Dedicated analytical models have also addressed failure mechanisms such as collapse, burst, and tensile armor buckling [19,20,21,22,23].
Numerical models, typically FE-based, require fewer assumptions but entail higher computational cost. They capture geometric imperfections, nonlinear interlayer contact (including friction and gap opening), and material nonlinearities, making them suitable for both operational and failure analyses. Simplified representations, such as equivalent layers, unit cell approaches, or macroelements [17,24,25,26,27,28,29], reduce computational effort while maintaining accuracy. These models have demonstrated good agreement with experimental data and analytical predictions [11,12,13,24,30]. For radial failure modes (collapse and burst), both equivalent and direct modeling approaches [31,32,33,34,35] are employed; direct models, although more costly, remain feasible due to the limited model length required.
While axisymmetric responses are well understood, the bending behavior of flexible pipes remains less clearly characterized. Analytical bending models typically focus on the moment–curvature relationship or stresses in tensile armor wires, whereas FE models offer greater versatility at a higher cost. A central challenge for both approaches is representing interlayer friction, which governs stiffness transitions from no-slip to full-slip states and produces a hysteretic response dependent on curvature and axial load.
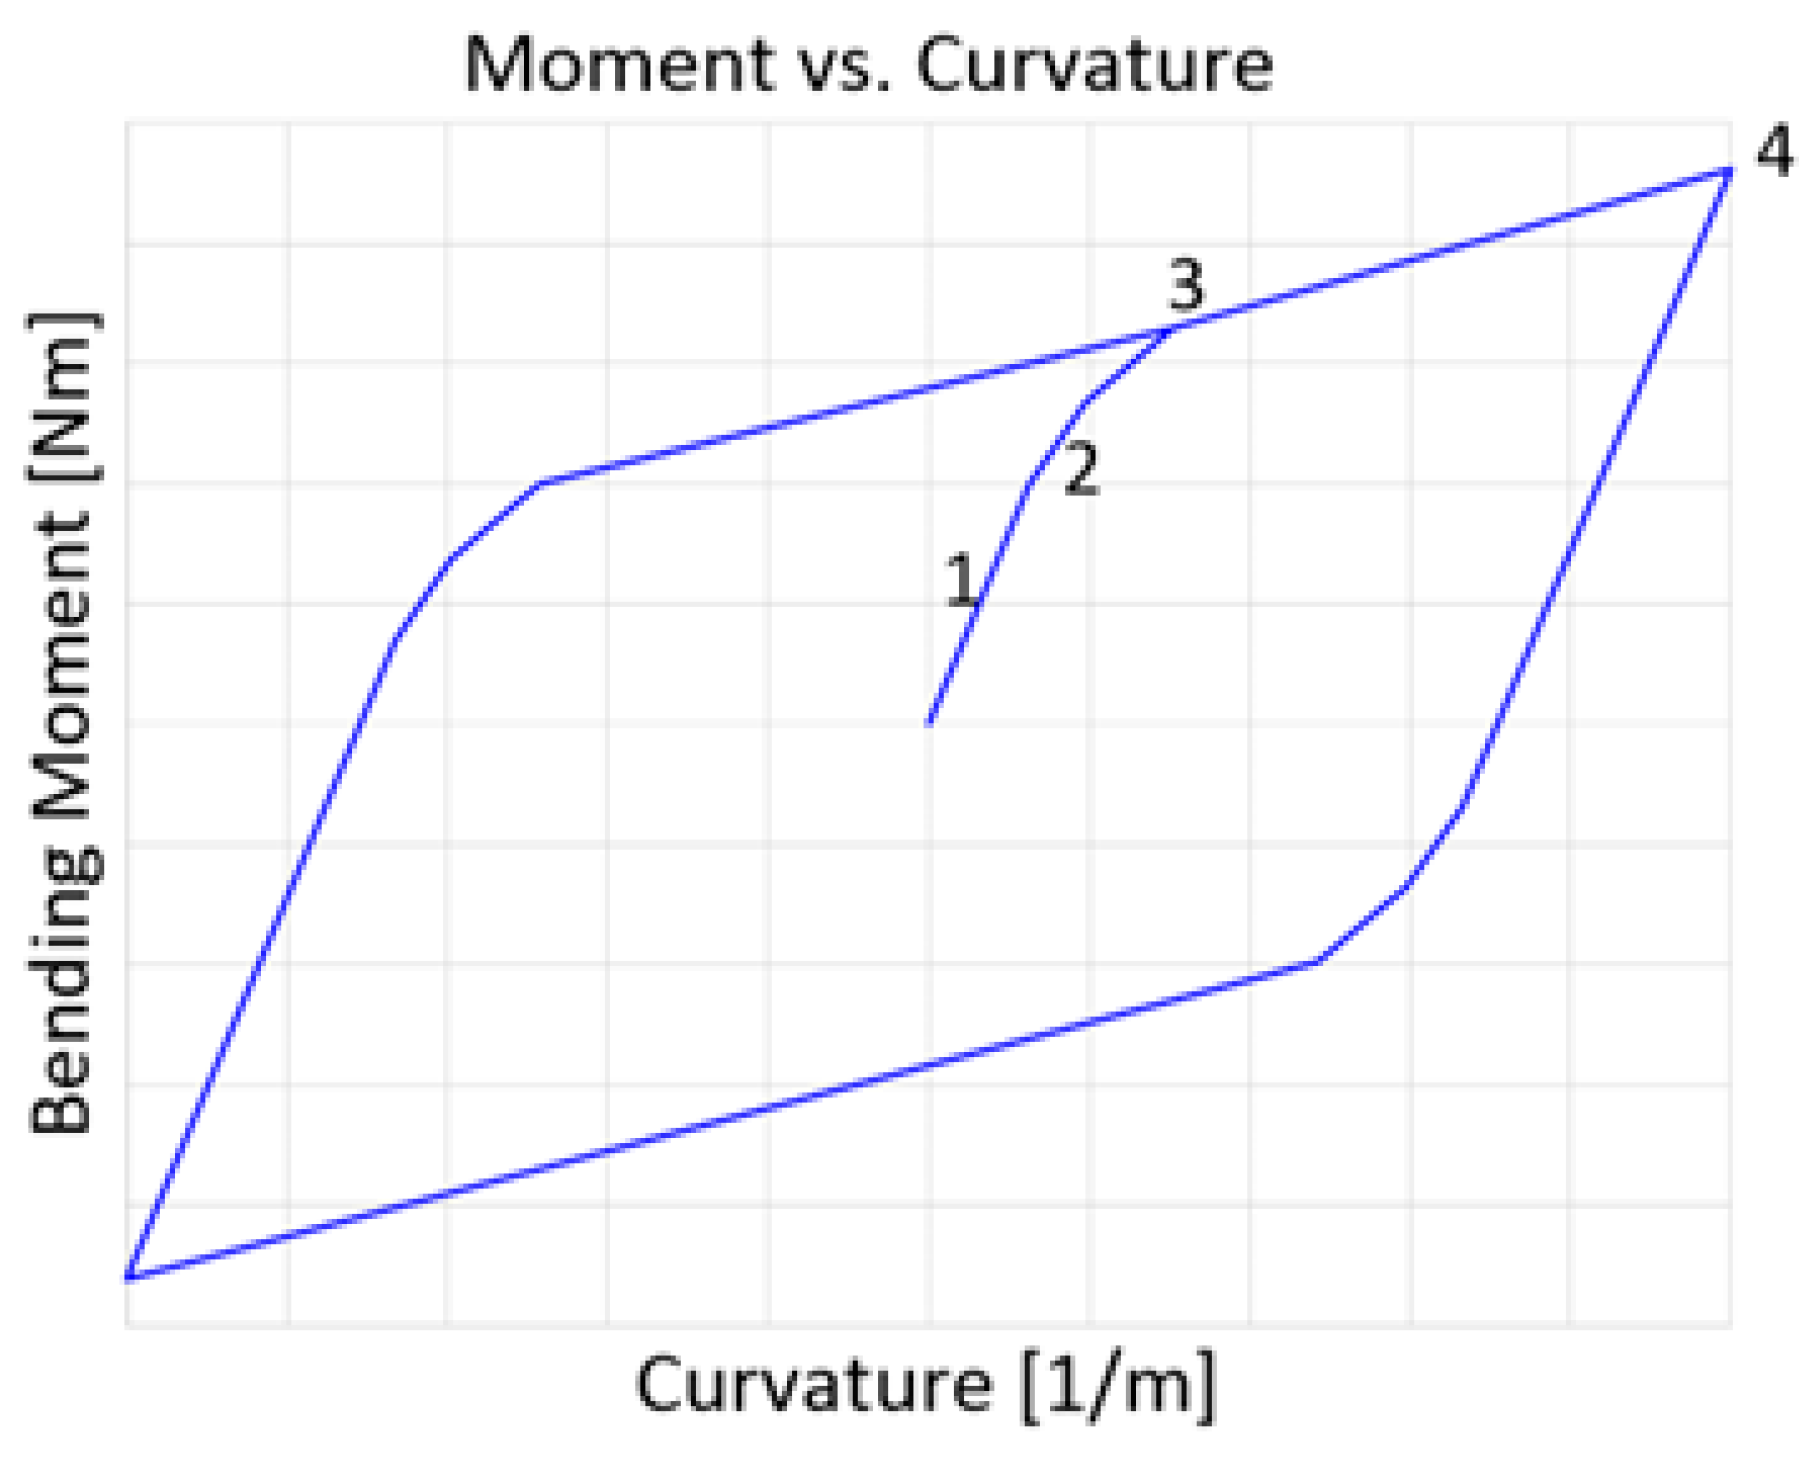
Axisymmetric loads generate interlayer contact pressures and friction forces that restrict relative motion between layers when the pipe is bent. At low curvatures, this friction prevents tensile armor wire slippage, and the pipe exhibits its maximum (no-slip) bending stiffness (1), as shown in Figure 2. As curvature increases, friction is overcome and wires begin to slide (2), reducing stiffness until it stabilizes at the minimum (full-slip) value (3). Further bending may cause wire contact, increasing stiffness, while load reversal restores adhesion and the no-slip condition (4). This friction-controlled process produces a hysteretic response, whose accurate stiffness evaluation must also consider polymeric layers and axial loads.
Recent studies have deepened the understanding of flexible pipe bending by focusing on layer interaction and initial contact pressure. Dong et al. [36], building upon the work of Kebadze and Kraincanic [37], developed an analytical model that incorporates helical element bending and torsion, and validated it against Witz’s [11] tests, which required an initial contact pressure of 1.5 MPa for convergence. Ye et al. [38] introduced a correction factor for antiwear tapes and found discrepancies in hysteresis at low pressures due to manufacturing-induced contact, which diminished with increasing internal pressure. Kim et al. [39] refined these models by including shear deformation in polymeric layers and curvature-dependent contact forces, achieving better agreement with FE simulations. Dai et al. [40] further explored friction modeling, showing that a smoothed Coulomb law best balanced accuracy and convergence, with friction coefficients requiring pressure-based calibration. Wang et al. [41] proposed a simplified 3D FE model using a double-helix beam contact, significantly reducing computational cost while preserving accuracy, calibrated through initial stresses and strains. At the wire scale, Fang et al. [42] demonstrated that analytical models perform well for round wires but deviate for rectangular ones. Finally, Tang et al. [43] conducted combined tension–bending tests on an 8-inch pipe, confirming good agreement between the experiments and analytical predictions based on tendon slip behavior.
Another key aspect concerns the local–global coupling in flexible pipe design. Global analyses of flexible pipes are typically performed using dedicated software, such as Orcaflex (version 11.5e) [44,45,46], Riflex (version V11.0) [47], or ANFLEX (Petrobras’ in-house software) [48], which model long flexible risers as beam elements with equivalent mechanical properties. Although these tools can represent the nonlinear bending moment–curvature relationship, the underlying modeling frameworks are often not fully documented, which may hinder potential modifications or, for example, the implementation of similar formulations in more general FE packages such as ANSYS (version 2025 R2) or Abaqus (version 2025 FD03).
In summary, while the axisymmetric response of flexible pipes is well established, uncertainties persist regarding bending behavior, mainly due to interlayer friction. Global models still rely on specialized black-box software, and few experimental studies address cyclic bending or armor degradation issues, critical for long-term performance [2]. Therefore, this work proposes a theoretical approach to analyze the response of a 2.5″ flexible pipe subjected to combined axisymmetric and bending loads in a four-point bending test. The approach integrates a finite difference (FD) global model with a local model that captures the nonlinear variation in bending stiffness. Experimental tests were conducted to calibrate and verify the proposed model, including a second testing phase after controlled armor degradation.
Next, the 2.5″ pipe is described, followed by a detailed description of the experimental apparatus and test procedures. Subsequently, the proposed theoretical approach is introduced and applied to simulate the experimental tests described. The obtained results are compared to provide insights into the pipe’s response to combined bending and axisymmetric loading for both non-degraded and degraded tensile armors. Finally, the study’s main conclusions are established.

2. Experimental Tests

2.1. Flexible Pipe Characteristics

The experimental tests conducted in this study employed a sample of a 2.5″ flexible pipe (internal diameter of 63.5 mm), whose characteristics are presented in Table 1. The pipe operated as a flowline at a water depth close to 1000 m with an internal design pressure of 20.7 MPa.
The layers’ thicknesses were measured directly from samples extracted from the pipe. The properties of the metallic materials and the polymeric tapes were determined based on data available in the literature. However, the material properties of both the inner and outer sheaths play a crucial role in predicting the pipe’s response to bending, especially in the full-slip regime. Therefore, experimental tests were conducted to assess the stress–strain curves for these materials, following the ASTM D638-22 [49] standard. Figure 3 illustrates the experimental setup and the samples before and after the tests, while Figure 4 shows the resulting curves for the inner and outer sheaths.
According to ASTM D638-22 [49], at least five tensile tests are required, and the Young’s modulus for each test is the slope of the straight part of the graph close to the origin. Seven tests were performed using inner sheath samples, and six tests were performed using outer sheaths. Table 2 indicates average Young moduli for the inner and outer sheaths of 372 MPa and 622 MPa, respectively. Finally, a Poisson coefficient of 0.45 was adopted for both layers [50].

2.2. Experimental Apparatus

The experimental tests employed a sample of the 2.5″ flexible pipe described in Section 3.1. The sample had a total length of 4.70 m, including two end-fittings (EF) with a length of 0.35 m each. Hence, the sample’s total free span was 4.00 m, which is higher than the minimum values of 10xID (=635 mm) or 3.0 m, as suggested by API RP 17B [51] for full-size pipes.
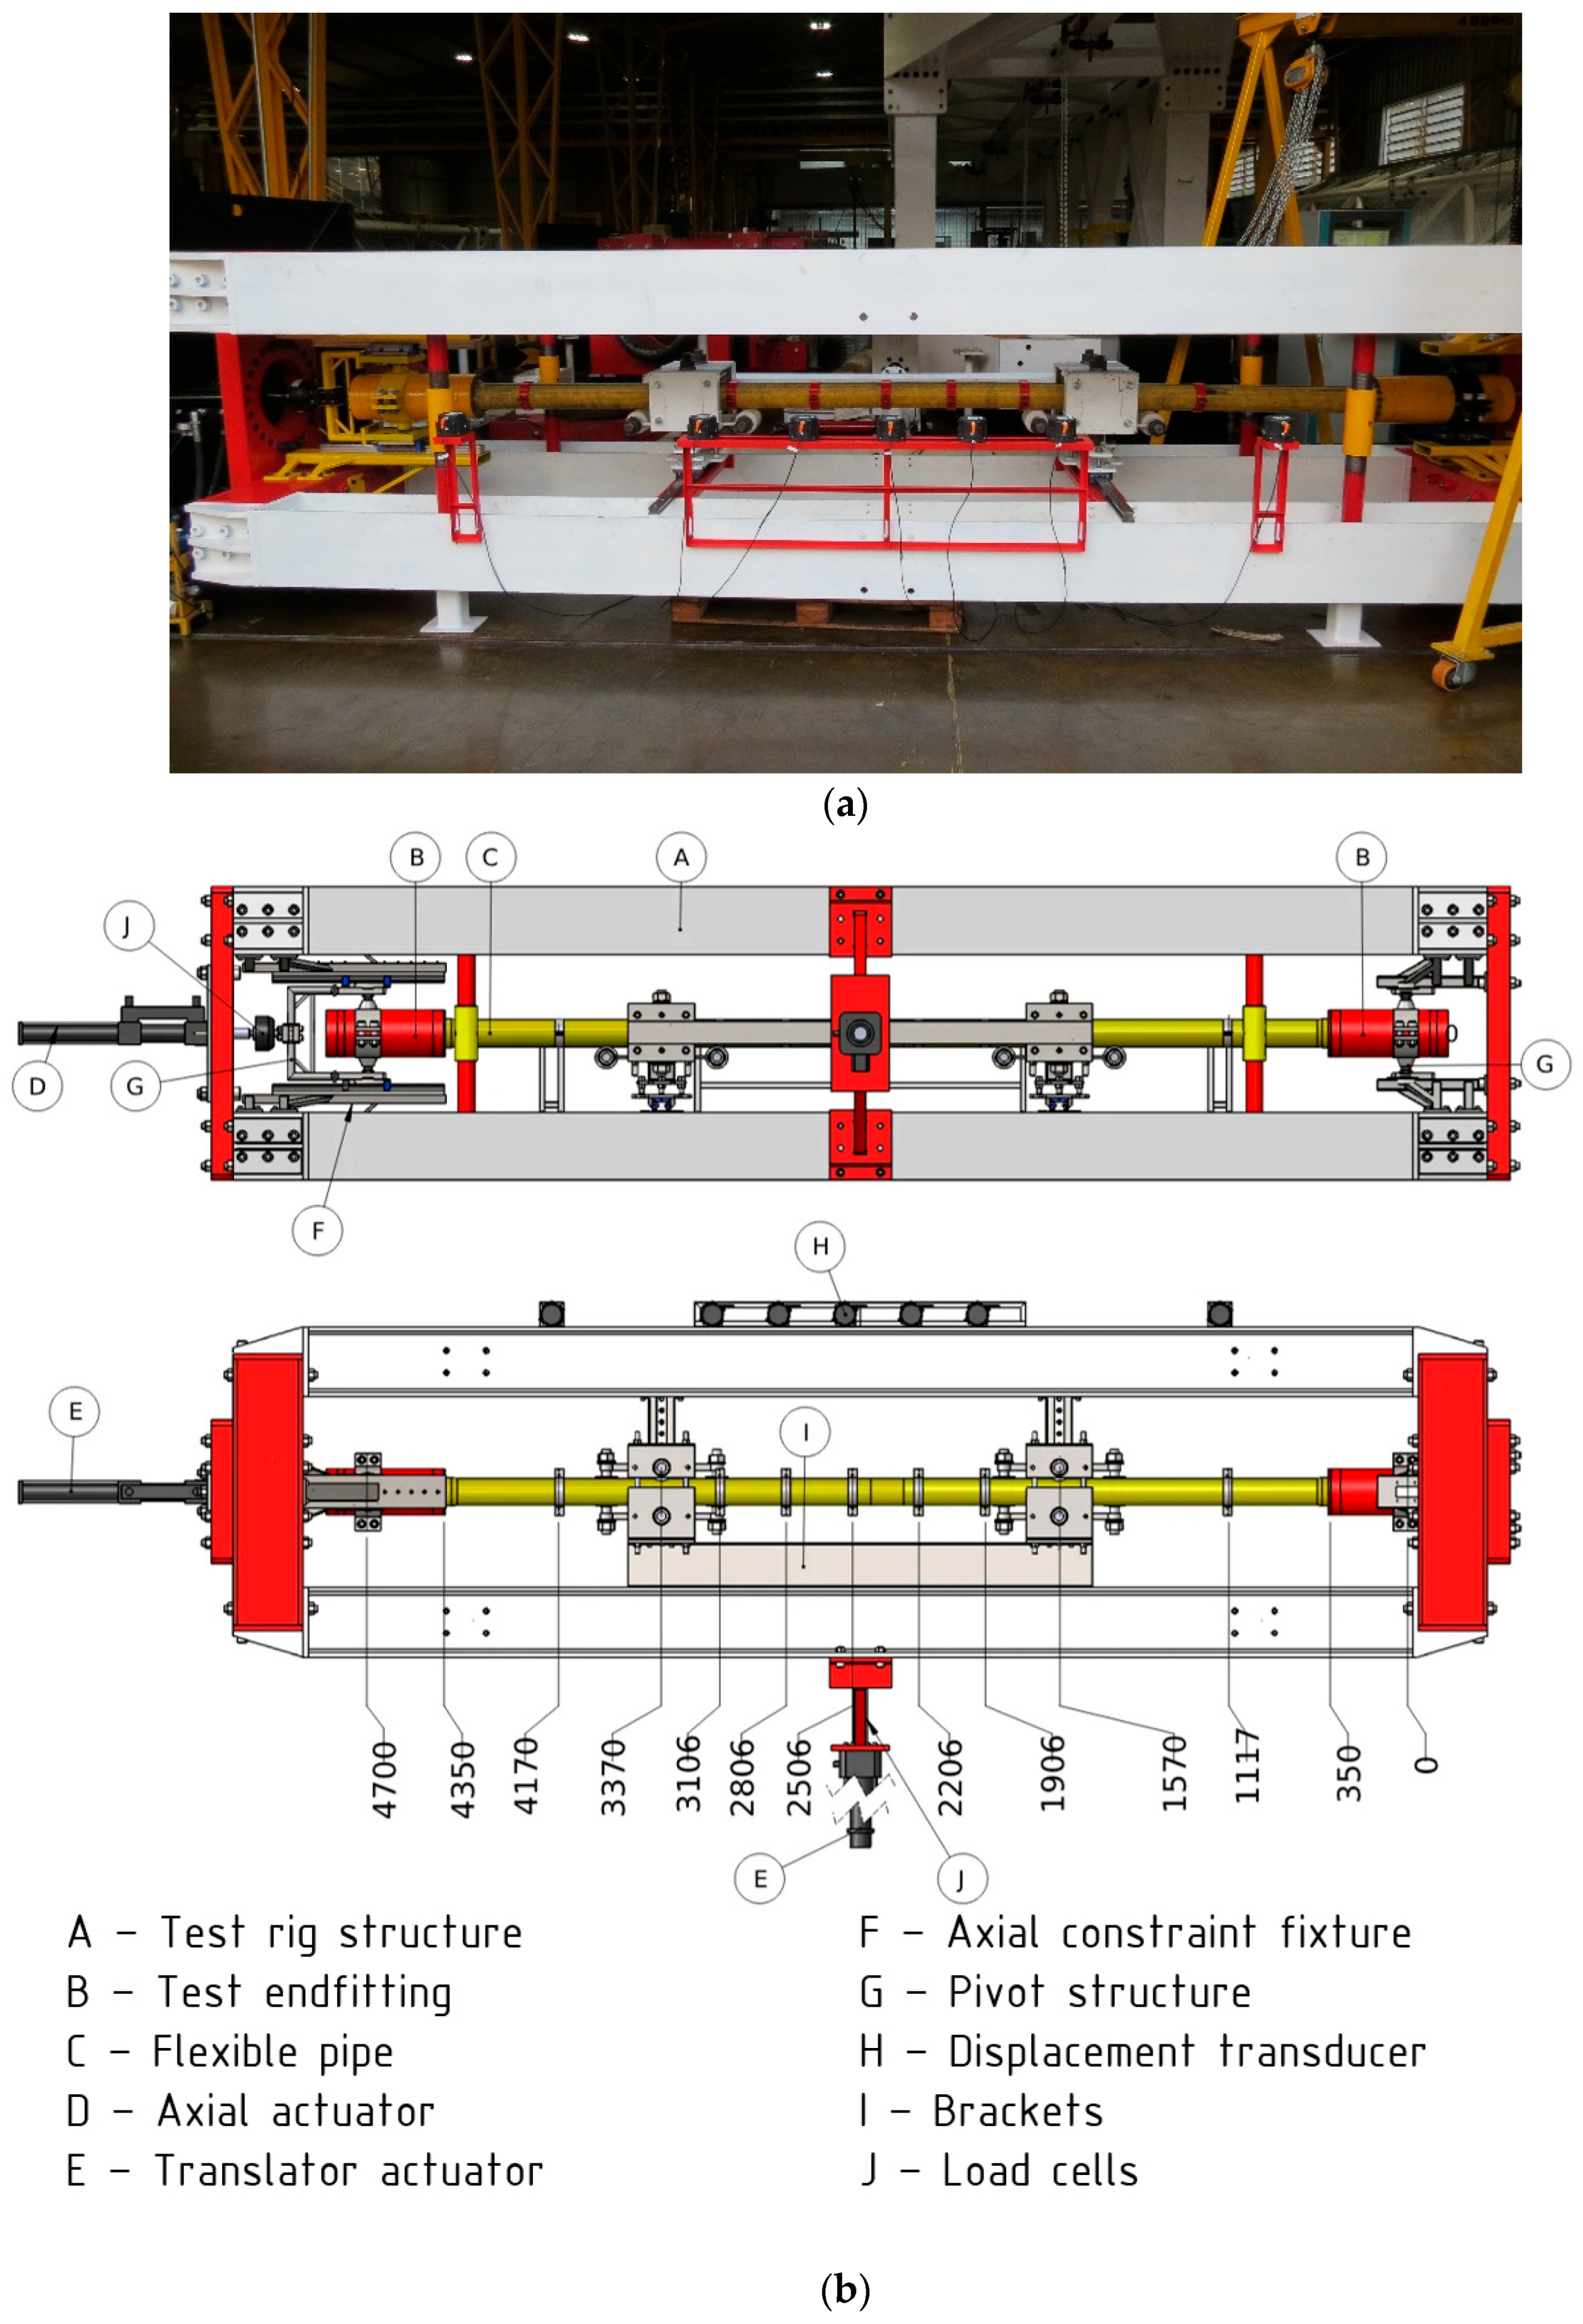
The experimental apparatus was developed to conduct a four-point bending test, as shown in Figure 5. One end of the specimen was fixed to restrict the axial translation. In contrast, the opposite end was connected to an axial actuator (20 kN capacity) equipped with a load cell, allowing free axial movement. This apparatus ensures that any specimen elongation, whether due to internal pressurization or bending, does not result in additional tensile forces, i.e., the axial load remains constant during the test cycles.
Moreover, both ends of the specimen were free to rotate, a condition achieved through a pivot mechanism integrated with the EF grooves. A bidirectional transverse actuator with a maximum capacity of 100 kN, monitored by a load cell with a measure range up to 25 kN, was mounted to a rigid fork system that distributed the load across two application points via a roller mechanism. This configuration prevented the introduction of unwanted bending moments or secondary loads into the specimen.
Displacements were measured at seven distinct points along the sample using linear transducers equipped with potentiometers, as shown in Figure 5. The sensors were fixed to the apparatus and connected to clamps positioned along the sample via steel wires. Five clamps were employed between the contact points of the transverse actuators, with one clamp located in each region adjacent to the connectors. The distance between the contact points of the transverse actuators was 1.78 m, corresponding to approximately four pitches of the external tensile armors.

2.3. Test Execution

The test procedure involved pressurizing the sample, applying an axial load, and executing bending cycles with transverse actuator displacements at a maximum amplitude of 150 mm. The apparatus was designed to record the parameters measured during the cyclic loading. Five cycles were imposed in each test. Another essential aspect of the performed tests was evaluating the impact of the tensile armors’ wires degradation on the bending response of the flexible pipe.
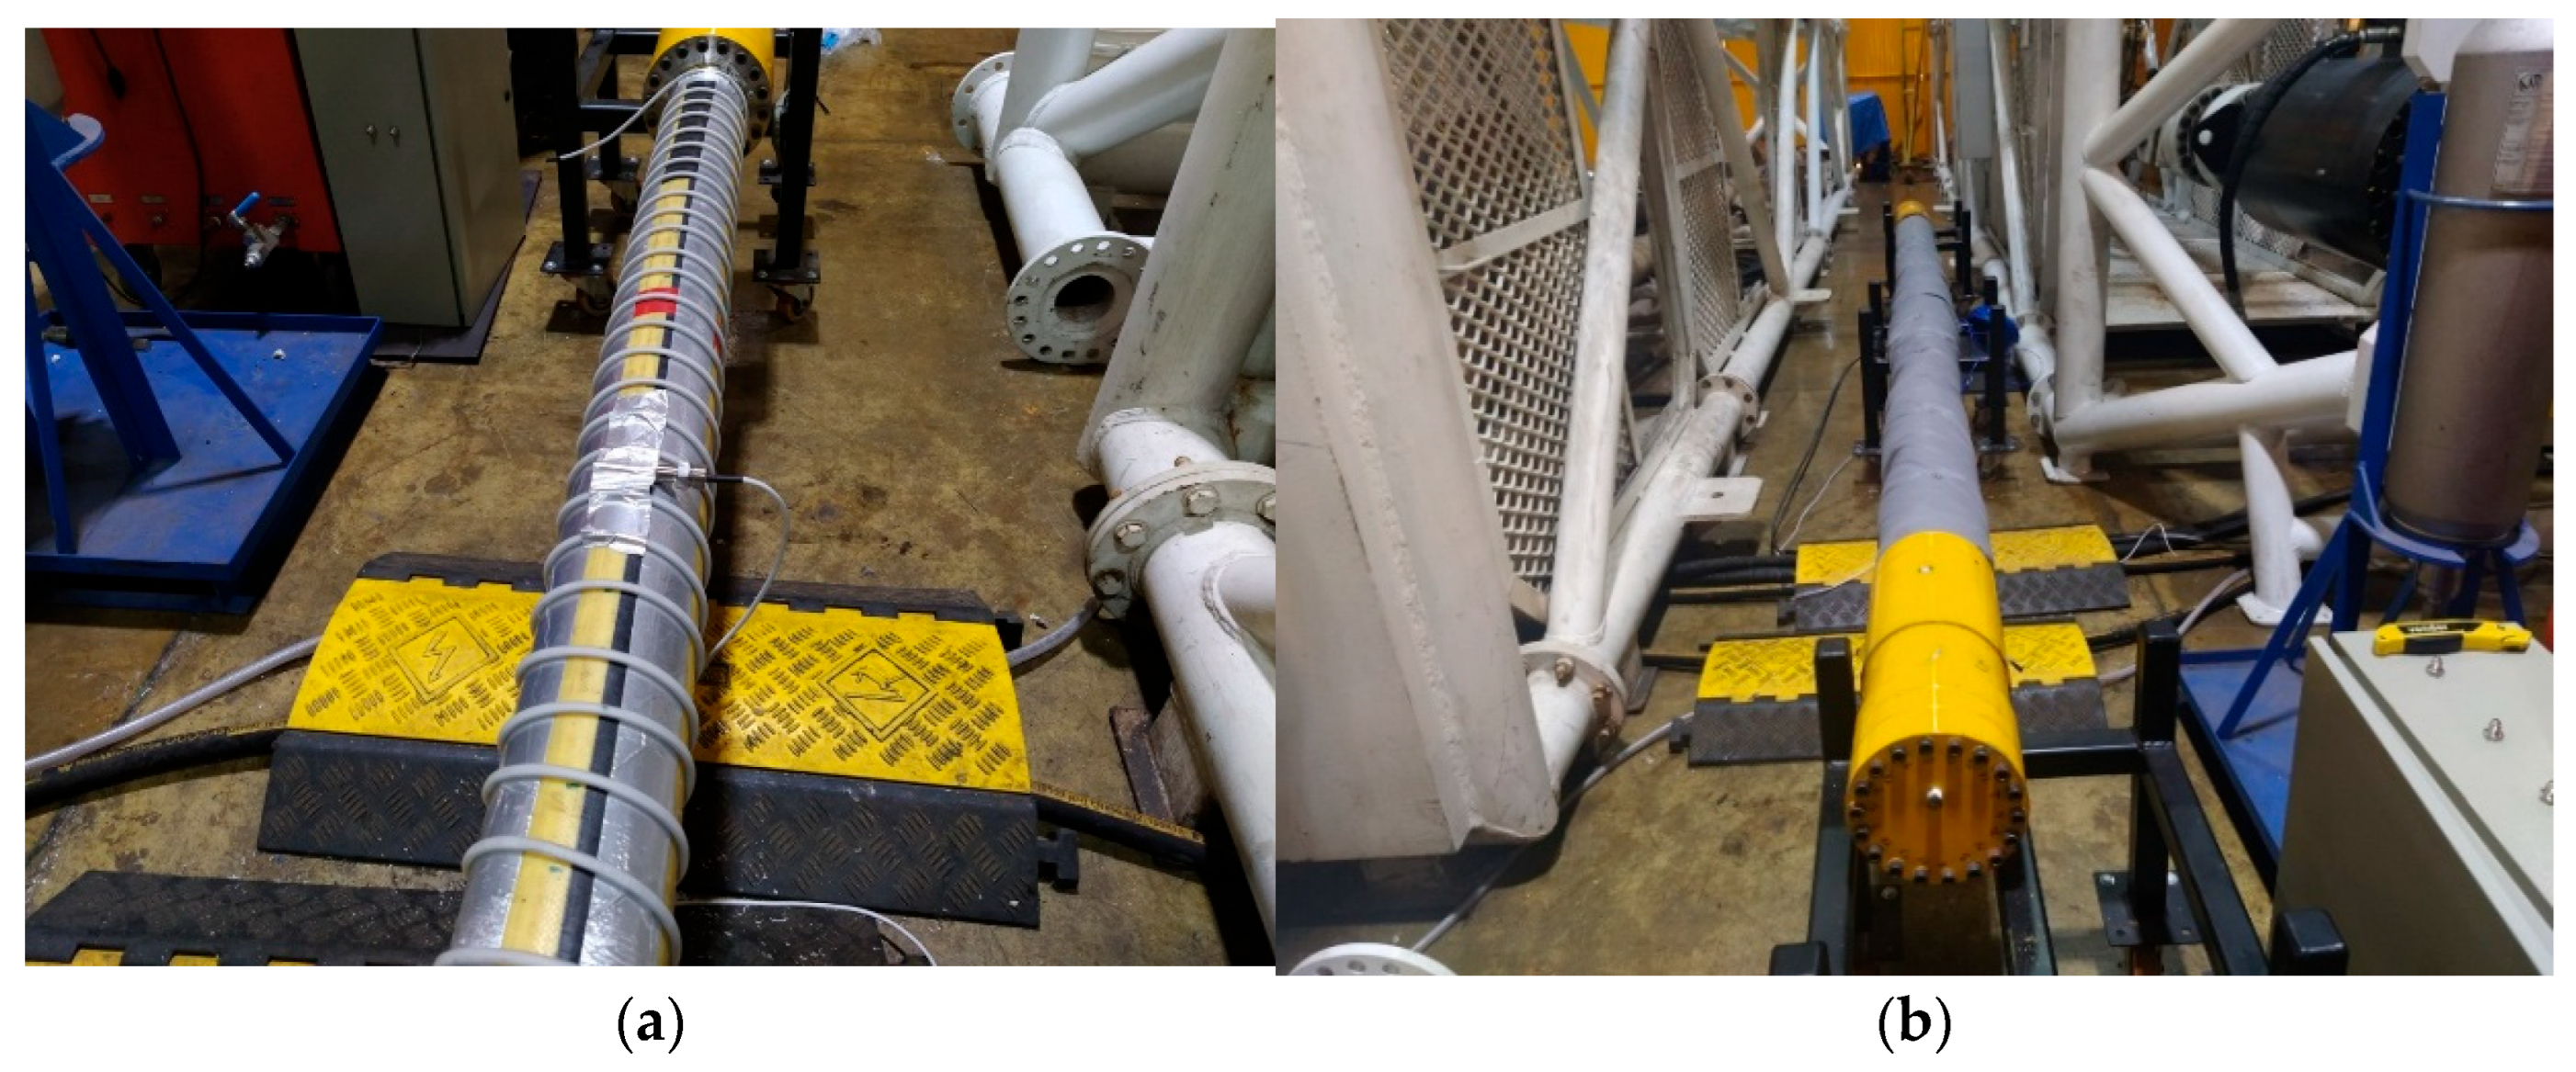
The degradation of the wires was induced by flooding the annular space of the pipe with a mixture of synthetic seawater and CO2. Initially, a heating system was implemented to maintain a constant temperature of 40 °C during the degradation process. An electronically controlled electric trace was helically wrapped around the outer sheath of the pipe with a 50 mm pitch and secured using aluminum tape to enhance thermal conductivity, as shown in Figure 6a. After that, two PT100 temperature sensors were attached to the specimen and connected to a control panel for real-time temperature regulation. Thermal blankets were wrapped around the pipe body to improve thermal insulation, as shown in Figure 6b.
After the heating system was assembled, the annular flooding system, shown in Figure 7, was installed. The test was conducted with the annular space flooded using synthetic seawater and continuous CO2 circulation at 1 bar. Before initiating the test, the annulus was pre-filled with CO2-saturated water. To ensure stable and uniform conditions throughout the experiment, CO2 was continuously introduced through one end-fitting, and its discharge was monitored at the end-fitting on the opposite side. The complete testing procedure followed these sequential steps: initial inertization, reservoir filling and fluid saturation, reservoir fluid saturation, sample filling, and CO2 bubbling. Upon completion of the test, two post-test procedures were executed, i.e., N2 bubbling and final inertization.
The initial test T0 imposed only axisymmetric loads on the pipe. Then, the bending test campaign (T1) was conducted using the sample with its original characteristics. Following this, the sample underwent an 18-month degradation period. Subsequently, the second test campaign (T2) was carried out. A summary of the test conditions is provided in Table 3.

3. Theoretical Approach

3.1. Overview

The main challenge in capturing the bending behavior of flexible pipes lies in the nonlinear relationship between bending stiffness and the imposed curvature. As discussed in Section 1, this nonlinearity primarily arises from the frictional forces generated by the axisymmetric loading, which limit the relative sliding between layers. Modeling this behavior requires a detailed representation of the pipe’s internal structure, or the development of an equivalent approach.
In the first approach, the computational cost is generally high, requiring a detailed representation of the pipe’s internal layers, and is only feasible for the analysis of flexible pipes with short lengths. However, this approach enables a direct representation of both global and local responses, allowing for the accurate capture of the relationship between the pipe’s bending moment and curvature. In contrast, the second approach relies on prior knowledge of this relationship under various loading conditions to model the pipe’s global behavior. Such information is typically obtained through local analytical or numerical models and incorporated into the formulation of two- or three-dimensional beams, whose structural stiffness is updated incrementally as the applied load varies in the global analyses. Although this method decouples global and local responses, it significantly reduces computational cost by modeling the pipe as an equivalent beam, enabling the simulation of long pipe segments, as required in the experimental tests described. Additionally, these equivalent models can be developed using either the FE method or the FD method. This work chose an FD-based model for its simplicity and efficiency in simulating the experimental tests.
Hence, next, the models employed to analyze the local response of the studied flexible pipe under axisymmetric and bending loads (local models) are described. Following this, a numerical global model is established to analyze the global response of the flexible pipe under the considered experimental loads. Altogether, these models establish the theoretical approach proposed in this work.

3.2. Local Models

3.2.1. Axisymmetric Loads

The initial step in determining the bending response of flexible pipes involves assessing their response to axisymmetric loads, including tension, torsion, and both internal and external pressures. As discussed in Section 1, various models have been developed for this purpose, leading to similar results. Hence, in this study, the model presented by Feret and Bournazel [6] is applied. In this model, a simplified solution to determine the effects of axisymmetric loads may be obtained by considering the following premises:
  • Small displacements.
  • The same elongation and twist in all layers.
  • Negligible contribution of plastic layers to the pipe’s mechanical resistance. These layers only transmit pressure.
  • No gaps occur between layers.
Considering these assumptions, a linear system of equations may be used to calculate the response for a particular flexible pipe structure. The axial, radial, and torsional balances are, respectively, described as:
i = 1 N a n i σ i A i cos α i = T + π P i n t r i n t 2 π P e x t r e x t 2 = T r e ,
i = 1 N a n i σ i A i sin α i t a n α i 2 π r i = P i n t r i n t P e x t r e x t ,
i = 1 N a n i σ i A i sin α i r i = T O .
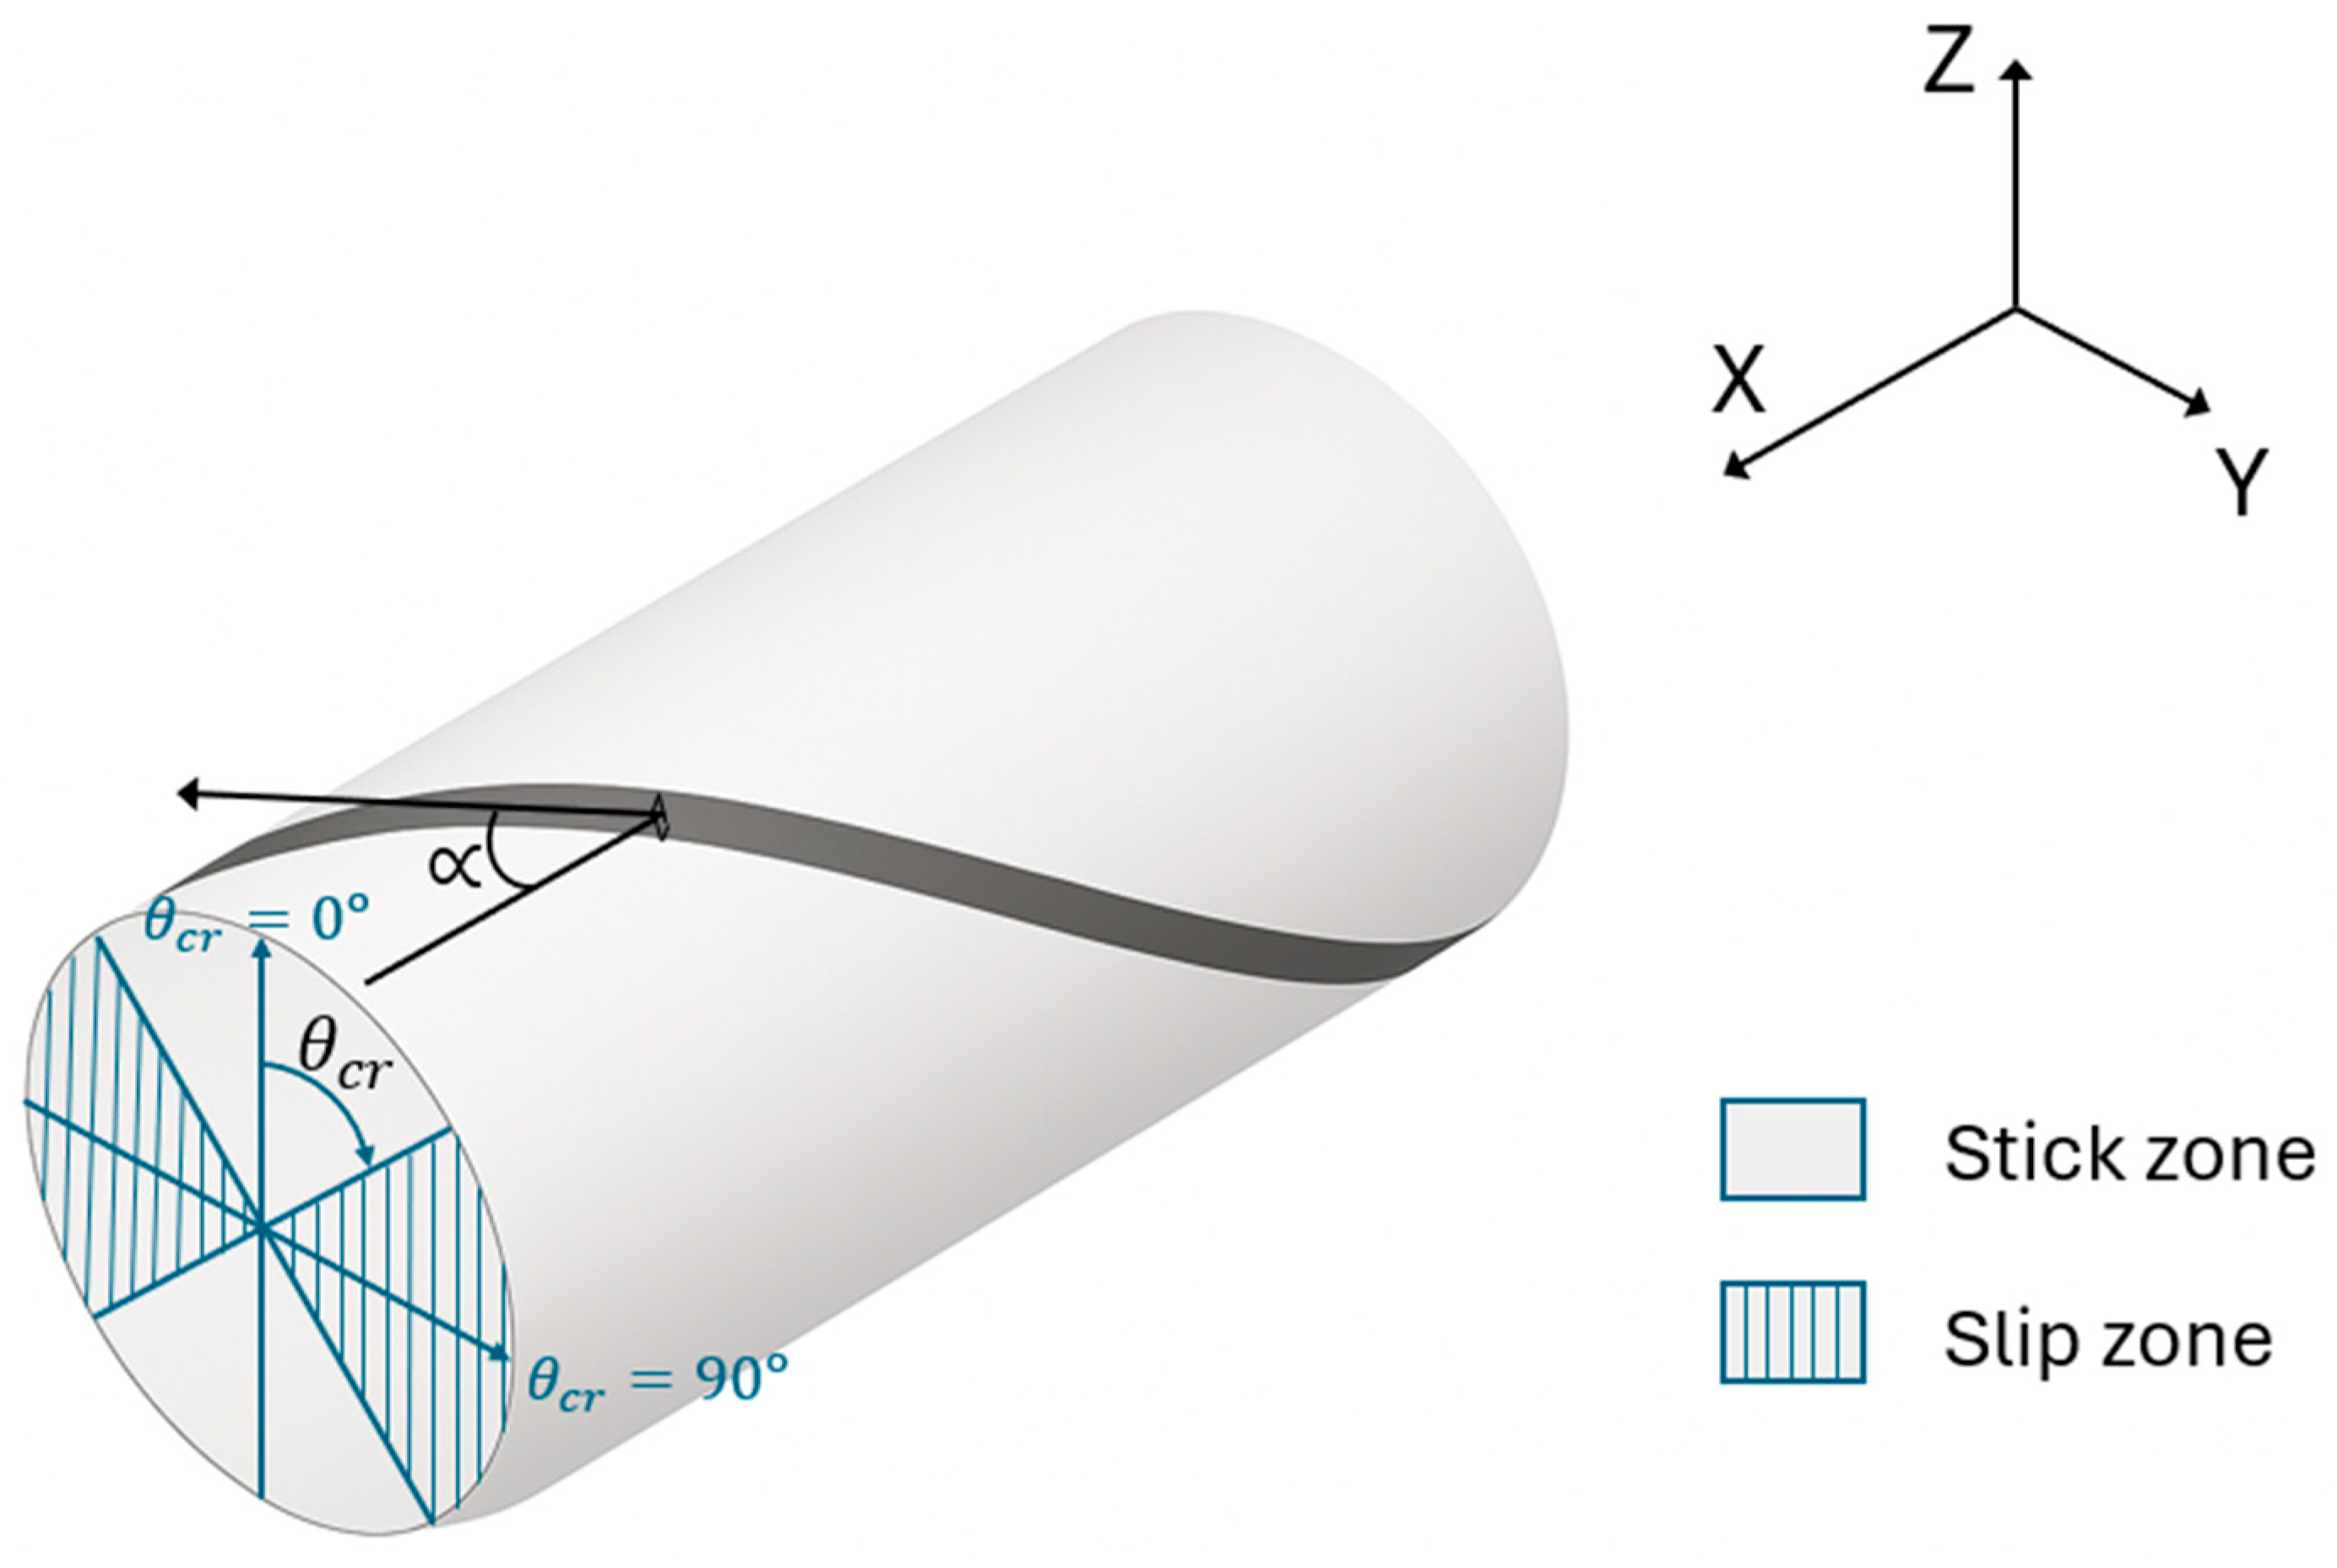
where T and T r e are the effective and real axial tensions [52], P i n t and P e x t are the acting internal and external pressures, T O is the imposed torsional moment, r i n t and r e x t are the radii where the internal and external pressure act, N a is the number of metallic layers in the pipe, n is the number of wires in the considered layer, A is the cross-section area of the wire (or tendon), α is the laying angle of the wire as depicted in Figure 8, and r is the layer mean radius.
In layer i , i = 1 N a , the normal stress σ i induced in the wires’ cross-sections may be stated as:
σ i E i = c o s 2 α i L L + s i n 2 α i r r i + r i sin α i cos α i θ L
where E is the material Young modulus of the considered metallic layer, L is the length of the pipe, L is the pipe axial elongation, r is the radial variation, and θ is the pipe twist.
The interlayer contact pressure P c , is given by:
P c i + 1 = P c i P c i
where P c 1 = P i n t , P c N a + 1 = P e x t and:
P c i = n i σ i A i sin α i t a n α i 2 π r i 2
Finally, the apparent axial stiffness E A a p of the pipe may be defined as:
E A a p = T r e · L L = T + π P i n t r i n t 2 π P e x t r e x t 2 · L L
In this study, the apparent axial stiffness is employed to verify the accuracy of the axisymmetric model before conducting the bending tests.

3.2.2. Bending Loads

Monotonic Loading
As discussed in Section 2, the response of a flexible pipe to bending is nonlinearly associated with the imposed curvature. In this study, the model proposed by Wang et al. [41] was implemented with a few modifications.
Figure 9 depicts the monotonic bending moment–curvature relation for a tensile armor layer. In the first zone, the wires are attached to their adjacent layers, and no slip is observed (no-slip or stick zone). After reaching the critical curvature κ c r The friction is insufficient to prevent interlayer relative movement, and slip starts in part of the pipe section (partial slip zone). When the imposed curvature reaches κ f , the slip is fully developed (full-slip zone).
The initial critical curvature κ c r and the related bending moment M c r for the onset of the tensile armors’ slippage are given by [41]:
κ c r = τ 0 + μ P c t F f E s i n ( α ) c o s 2 ( α )   1 + ξ
M c r = π r a 2 c o s 2 ( α ) ( τ 0 + μ · P c t ) s i n ( α )
where τ 0 is the adhesion or initial contact pressure between the layers, μ is the friction coefficient, P c t is the total contact pressure (sum of the acting pressures at the interfaces) between the layers due to the axisymmetric loads, F f is the shape factor of the tensile armor wire (typically, 0.95), r a is the mean radius of the tensile armor, and ξ is given by:
ξ = E s b 2 1 + ν s t s
where E s and ν s are the Young modulus and the Poisson ratio of the polymeric layer, t s is the thickness of the polymeric layer, and b is the width of the tensile armor wire
The adhesion τ 0 is a modification to the model proposed in this study to account for the effect of an initial interlayer contact pressure in the pipe, which is not attributable to axisymmetric loading. Its influence is substantiated by the experimental results presented in Section 4, where a pronounced hysteretic response is observed even in the absence of axisymmetric loads. This condition has also been documented in previous investigations, wherein an additional contact pressure was incorporated into the calculated P c t for model calibration purposes [36,38,41].
The curvature and the moment at which the tensile armor reaches the full-slip state are [41]:
κ f = π · κ c r m i n 2 ,
M f = 4   M c r π .
When curvature is imposed on the pipe, the polymeric layers deform in shear, which alters the critical curvature at which the tensile armor wires start to slip. To account for this effect, a correction factor ξ was introduced in Equation (8). Furthermore, this study proposes that when multiple polymeric layers are arranged in series beneath or above the tensile armors, an equivalent factor ξ e q should be considered to estimate the tangent stiffness of the combined layers:
1 ξ e q = i = 1 N p l 1 ξ i ,
where N p l is the number of polymeric layers considered.
Then, for a particular tensile armor j in layer i , the bending moment M w as a function of the curvature can be described as:
M w j ( κ )                                                                                                                                                                                                                                                                                                                                           = M c r j κ c r j · κ ,     0 κ κ c r j 4 F f r j 3 t j c o s 2 ( α j ) E i cos α j θ c r j cos θ c r j sin θ c r j κ 2 ξ i + τ 0 + μ P c t i cos θ c r j F f t j sin α ,     κ c r j < κ κ f j M f j ,     κ f j < κ
where θ c r is the critical circumferential angle that defines the boundaries in the pipe cross-section between the slip and no-slip zones according to Figure 8, where θ = 0 ° represent extrados and θ = 180 ° the intrados, and for each curvature κ , θ c r j is calculated with:
π 2 θ c r j s i n π 2 θ c r j = κ κ c r j .
So, for each tensile armor present in the structures, a relation M t ( κ ) is to be calculated, and the overall contribution of the tensile armors M t in layer i is given by:
M t i ( κ ) = j = 1 n i M w j ( κ ) ,
During the bending of the pipe, local torsion and bending effects are observed in the tensile armor wires. These effects cause an increase in the stiffness of the pipe, represented by the expression [41]:
E I b t = 1 2 i = 1 N a n j E i I n i ( 1 + s i n 2 ( α i ) 2 cos α i + E i I b i c o s 7 α i + G i J i s i n 2 ( α i ) c o s 5 ( α i ) ,
where I n , I b , and J are the normal and binormal moments of inertia and the torsional constant of the wire cross-section, and G is the shear modulus of the wire material.
Hence, the moment–curvature relation for a flexible pipe subjected to bending and axisymmetric loading is given by:
M κ = i = 1 N a M t i ( κ ) + E I p s + E I b t κ ,
where the polymeric sheaths’ contribution to the stiffness E I p s is:
E I p s = π 64 i = 1 N p s E p i D e p i 4 D i p i 4 ,
and N p s is the number of polymeric sheaths in the pipe, E p is the Young modulus of the polymeric sheath, D e p and D i p are the external and the internal diameter of the sheath. Analogously to E I b t , this contribution remains constant regardless of the imposed load.
When the direction of bending is reversed, the layers that were sliding re-adhere, and the stiffness returns to no-slip. This effect causes the hysteresis loop that characterizes the behavior of flexible pipes subject to bending. The modeling of this cyclic response is presented next.
Cyclic Loading
Aiming to model the hysteresis loop described in Section 1, two hypotheses are assumed.
  • The bending response does not depend on the load rate: the pipe’s response to bending only depends on the acting bending moment, curvature, and contact pressures resulting from the axisymmetric loading at a given time. This hypothesis is reasonable to represent the experimental tests in this study, as the loads were imposed to minimize dynamic effects, and it finds support in previous experimental and numerical studies [11,36,38,41].
  • The sliding surface translates without changing its size: this hypothesis ensures that the pipe retains memory of the loading direction, allowing the position of the critical curvature to adjust with the cyclic load. As qualitatively shown in Figure 2, the critical curvature varies with load reversal, exhibiting a response similar to the Bauschinger effect observed in metals.
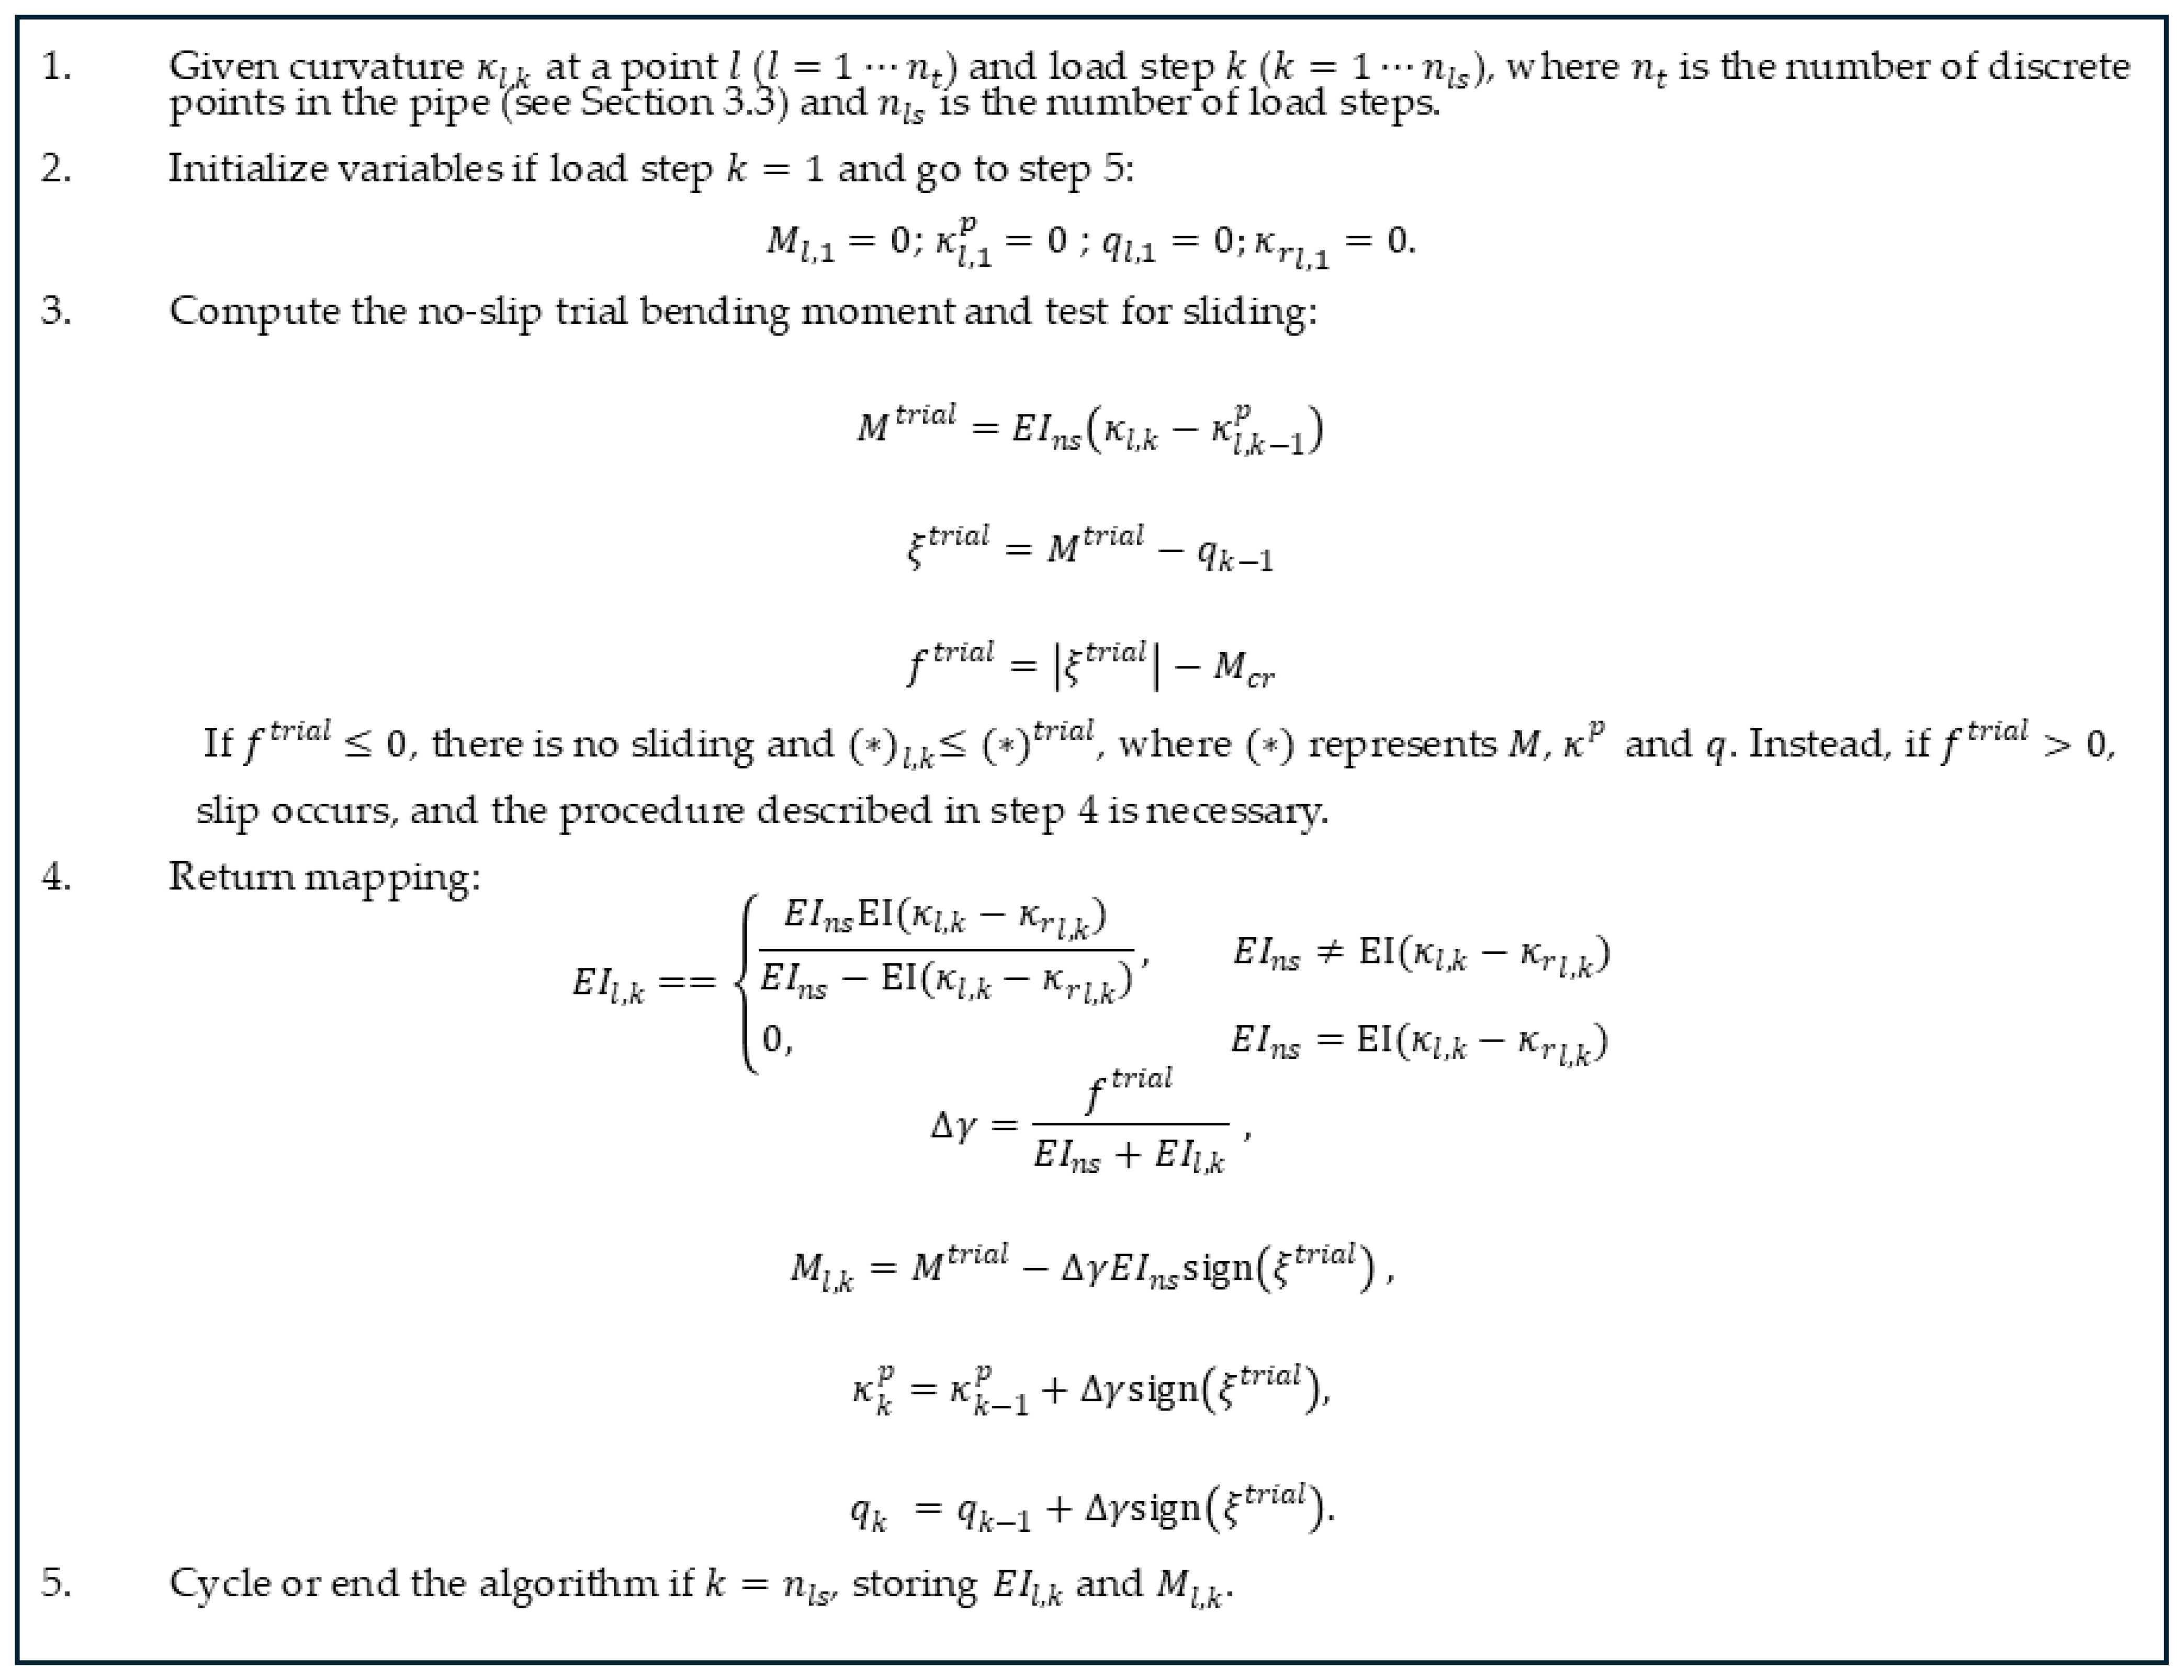
Hence, by relying on these two hypotheses, the cyclic bending response can be compared to a rate-independent plasticity problem with kinematic hardening. In this case, the cyclic bending response of a flexible pipe can be represented by adapting the return-mapping algorithm proposed by Simo and Hughes [53] as shown in Figure 10.
In the proposed algorithm, E I represents the tangent stiffness at a given curvature. However, the algorithm presented by Simo and Hughes [53] considers a bilinear relation between the quantities (stresses and strains). In contrast, the bending moment–curvature described in the previous section exhibits a nonlinear transition between the no-slip and full-slip regimes. Hence, the tangent stiffness E I employed is given by:
E I ( κ ) = d M κ d κ ,         before   first   load   reversal d M d κ d κ ,     otherwise ,
where M d is the unloading bending moment vs. curvature curve:
M d κ = E I n s · κ ,     κ 2 κ c r M κ κ r + E I n s · κ r ,     κ > 2 κ c r ,
and κ r is the curvature at each load reversal, and the no-slip bending stiffness E I n s is stated as:
E I n s =   E I 0 .

3.3. Global Model

3.3.1. Differential Equation

The flexible pipe sample is assumed to be a beam subjected to axial and transverse loads, as illustrated in Figure 11a. The coordinate system is positioned at the fixed end of the pipe, and the length L corresponds to the distance between the pivot points where the sample is fixed to the test bench. The transverse forces applied by the actuators are denoted by F A and F B , while R 1 and R 2 represent the reaction forces at the supports. The axial effective load is represented by T , distances x A and x B indicate the locations where the actuators contact the sample, and the transverse displacement imposed by the actuators at points A and B are assumed equal by hypothesis. In this model, the self-weight of the sample and its effects are neglected, and the assumption of small incremental displacements is considered valid.
The bending stiffness of a flexible pipe (either the no-slip or the full slip values) is much lower than its axial stiffness. Moreover, the relation between the free span of the pipe in the experimental apparatus (4.0 m) is more than 10 times higher than the pipe’s outer diameter (121.18 mm). Hence, the beam proposed in Figure 11a may be assumed to be slender, and shear effects can be neglected. By relying on this hypothesis, the bending moment M acting in the beam is related to the bending strain energy U as in Equation (23).
M κ = d U κ d κ .
The bending strain energy U is expressed as:
U κ = 1 2 E I κ κ 2 ,
By considering Equation (23) in Equation (24), the bending moment is given by
M κ = E I κ κ + κ 2 2 d E I ( κ ) d κ
As discussed in Section 1, the bending stiffness of a flexible pipe progressively reduces from the no-slip value to the full-slip value. Hence, if sufficiently slight curvature variations are imposed on the pipe, the change in the bending stiffness value will also be small. Moreover, relatively low curvatures were achieved in the experimental tests (maximum values were close to 0.1 m−1). Altogether, these aspects indicate a negligible contribution of the quadratic term in Equation (25), which may be rewritten as:
M κ = E I κ κ
The curvature κ at a cross-section distant x from the origin (Figure 11a) depends on the vertical displacement y imposed by the transverse forces F A and F B . By representing forces F A and F B as F = F A , F B to simplify the notation, and assuming small angle variations ( d y ( x , F ) d x 1 ), the curvature variation is expressed as:
κ x , F = d 2 y ( x , F ) d x 2 1 + d y ( x , F ) d x 2 3 / 2 d 2 y ( x , F ) d x 2
Moreover, the total bending moment is the sum of the first-order moments imposed by the transverse forces F and second-order moments related to the beam’s transverse displacement and the acting axial load. Therefore, the total bending moment M is:
M x , F = M ( 1 ) x , F T y ( x , F ) ,
where
M ( 1 ) x , F = 1 x A L · x · F A + 1 x B L · x · F B ,     0 x x A 1 x L · x A · F A + 1 x B L · x · F B ,     x A < x x B 1 x L · x A · F A + 1 x L · x B · F B ,     x B < x L ,
By rewriting Equation (26) considering Equations (27) and (28), a second-order differential equation is obtained:
d 2 y ( x , F ) d x 2 β 2 x , F y x , F + M 1 x , F E I x , F = 0 ,
where the bending stiffness E I depends on the analyzed cross-section in the beam and the imposed transverse load, and β is given by:
β x , F = T E I ( x , F )
For the described test setup, the boundary conditions consist of fixed supports at both ends, such that y 0 = y L = 0 . In addition, displacement compatibility requires equal displacements at both actuator points, y x A = y x B .
Equation (30) indicates that the lateral displacement of the beam depends on the bending stiffness at each of its cross-sections, which, in turn, is a function of the imposed curvature. Therefore, the local model proposed in Section 3.2 is employed in this work. However, the nonlinear variation of E I with the imposed loading does not allow a closed-form solution of Equation (30), and a numerical procedure is required. This procedure is described next.

3.3.2. Discretization

In this work, Equation (30), which represents the structural model presented in Figure 11a, is solved relying on the FD method. Initially, the beam is discretized as indicated in Figure 11b, in which the axial position x l of a point l is
x l + 1 = x l + l h l ,   l = 1 n t 1 ,
where x 1 = 0, n t is the total number of discretization points in the beam, and h l is the spacing between two consecutive points x l and x l + 1 , i.e.:
h l = x A n A 1 ,     0 x l + 1 x A x B x A n B 1 ,     x A < x l + 1 x B L x B n C 1 ,     x B < x l + 1 L ,
and n A , n B , and n C are the number of discretization points (nodes) in segments A, B, and C, with n t = n A + n B + n C 2 .
Moreover, the effective axial force T is constant throughout the analysis, while the transverse force is incrementally applied, i.e.:
F A k = F A k 1 + F A k ,   F B k = F B k 1 + F B k , k = 2 n l s ,
where F A 1 = F B 1 = 0 , n l s is the number of load steps, and F A k and F B k are the load increments at points A and B related to load step k .
By relying on Equations (32) and (34), the transverse displacement y at point x l caused by the transverse force F k is stated as y l , k . However, Equation (30) demands the discrete form of a second-order derivative, which represents the curvature of the beam. As the spacing between consecutive points in the discretized beam may differ, depending on the values of n A , n B , and n C , the curvature of the beam may be approximated following the equation proposed by Singh and Bhadauria [54], i.e.:
d 2 y x , F d x 2 κ l , k 2 h l y l 1 , k h l + h l 1 y l , k + h l 1 y l + 1 , k h l 1 h l h l + h l 1 .
Now, by considering the discrete notations of x , y , and F , and Equation (35), the discrete form of Equation (30) is given by:
h l y l 1 , k h l + h l 1 + β l , k 2 h l ¯ y l , k + h l 1 y l + 1 , k + M l , k ( 1 ) E I l , k · h l ¯ = 0 ,
where l = 2 n t 1 , k = 2 n l s , and:
h l ¯ = 1 2 · h l 1 h l h l + h l 1 .
Nevertheless, Equation (36) must be solved incrementally, as the bending stiffness of the pipe varies nonlinearly with the imposed loading, as discussed in Section 3.2.2. Thus, the transverse displacement y l , k is given by
y l , k = y l , k 1 + y l , k ,   l = 1 n t ,   k = 2 n l s .
Considering Equations (37) and (38) in Equation (36), the following incremental equation is obtained:
h l y l 1 , k h l + h l 1 + β l , k 2 · h l ¯ y l , k + h l 1 y l + 1 , k + M l , k ( 1 ) E I l , k h l ¯ = 0 ,
where l = 2 n t 1 , k = 2 n l s .
The transverse displacements y and the load increments F A and F B are unknown at each load step, totaling n t variables. Equation (39) gives n t 2 relations between the transverse displacements. However, the transverse displacements at the extremities of the beam are restrained:
y 1 , k = y n t , k = 0 ,         k = 2 n l s .
Finally, as the experimental tests are displacement-controlled, and the fork employed to impose the load can be assumed as rigid, the transverse displacements at points A and B are considered equal to the displacement imposed by the actuators, i.e.:
y A , k = y B , k = y t ,         k = 2 n l s .
where y t = y t / n l s and y t is the total transverse load imposed by the actuators.
The system of equations formed by Equations (39)–(41) is organized in the matrix form:
K k n t + 2   x   n t + 2   · Y k n t + 2   x 1 =   F k n t + 2   x 1 ,         k = 2 n l s ,
where the non-null terms K , Y , and F related to K , Y and F , respectively, are:
K 1,1 = K n A , n A = K n A + n B 1 , n A + n B 1 = K n t , n t = 1
K l , l 1 = h l ,   K l , l = h l + h l 1 + β l , k 2 · h l ¯ ,   K l , l + 1 = h l 1 , l = 2 n t 1 ,   l n A ,   n A + n B 1
K l , n t + 1 = 1 x A L · x l ,     2 l < n A 1 x l L · x A ,     n A + 1 l < n A + n B 1 1 x l L · x A ,     n A + n B l < n t 1 x A L · x A ,     l = n t + 1 1 x B L · x A ,     l = n t + 2
K l , n t + 2 = 1 x B L · x l ,     2 l < n A   1 x B L · x l ,     n A + 1 l < n A + n B 1 1 x n L · x B ,     n A + n B l < n t 1 x B L · x A ,     l = n t + 1 1 x B L · x B ,     l = n t + 2
Y l = y l , k ,     1 l n t F A k ,     l = n t + 1 F B k ,     l = n t + 2
F l = y t ,         l = n A   l = n A + n B 1
By determining vector Y , the transverse displacement increments y l , k at each point l related to the load increment k and the reaction loads F A k and F B k , the bending moment increment M at each point can be calculated with Equation (49) by considering Equation (28).
M l , k = M l , k ( 1 ) T y l , k .
The total bending moment is then given by:
M l , k = M l , k 1 + M l , k .
Moreover, the curvature at a point is given by Equation (35), except for the points where the loads are imposed. At these points, a backward approximation for the second derivative of the displacements is considered to avoid numerical instabilities (observed during the case study analyses discussed in Section 4), i.e.:
κ n A , k = y n A , k 2 y n A 1 , k + y n A 2 , k h n A 1 2
κ n A + n B 1 , k = y n A + n B 1 , k 2 y n A + n B 2 , k + y n A + n B 3 , k h n A + n B 2 2

3.3.3. Solution

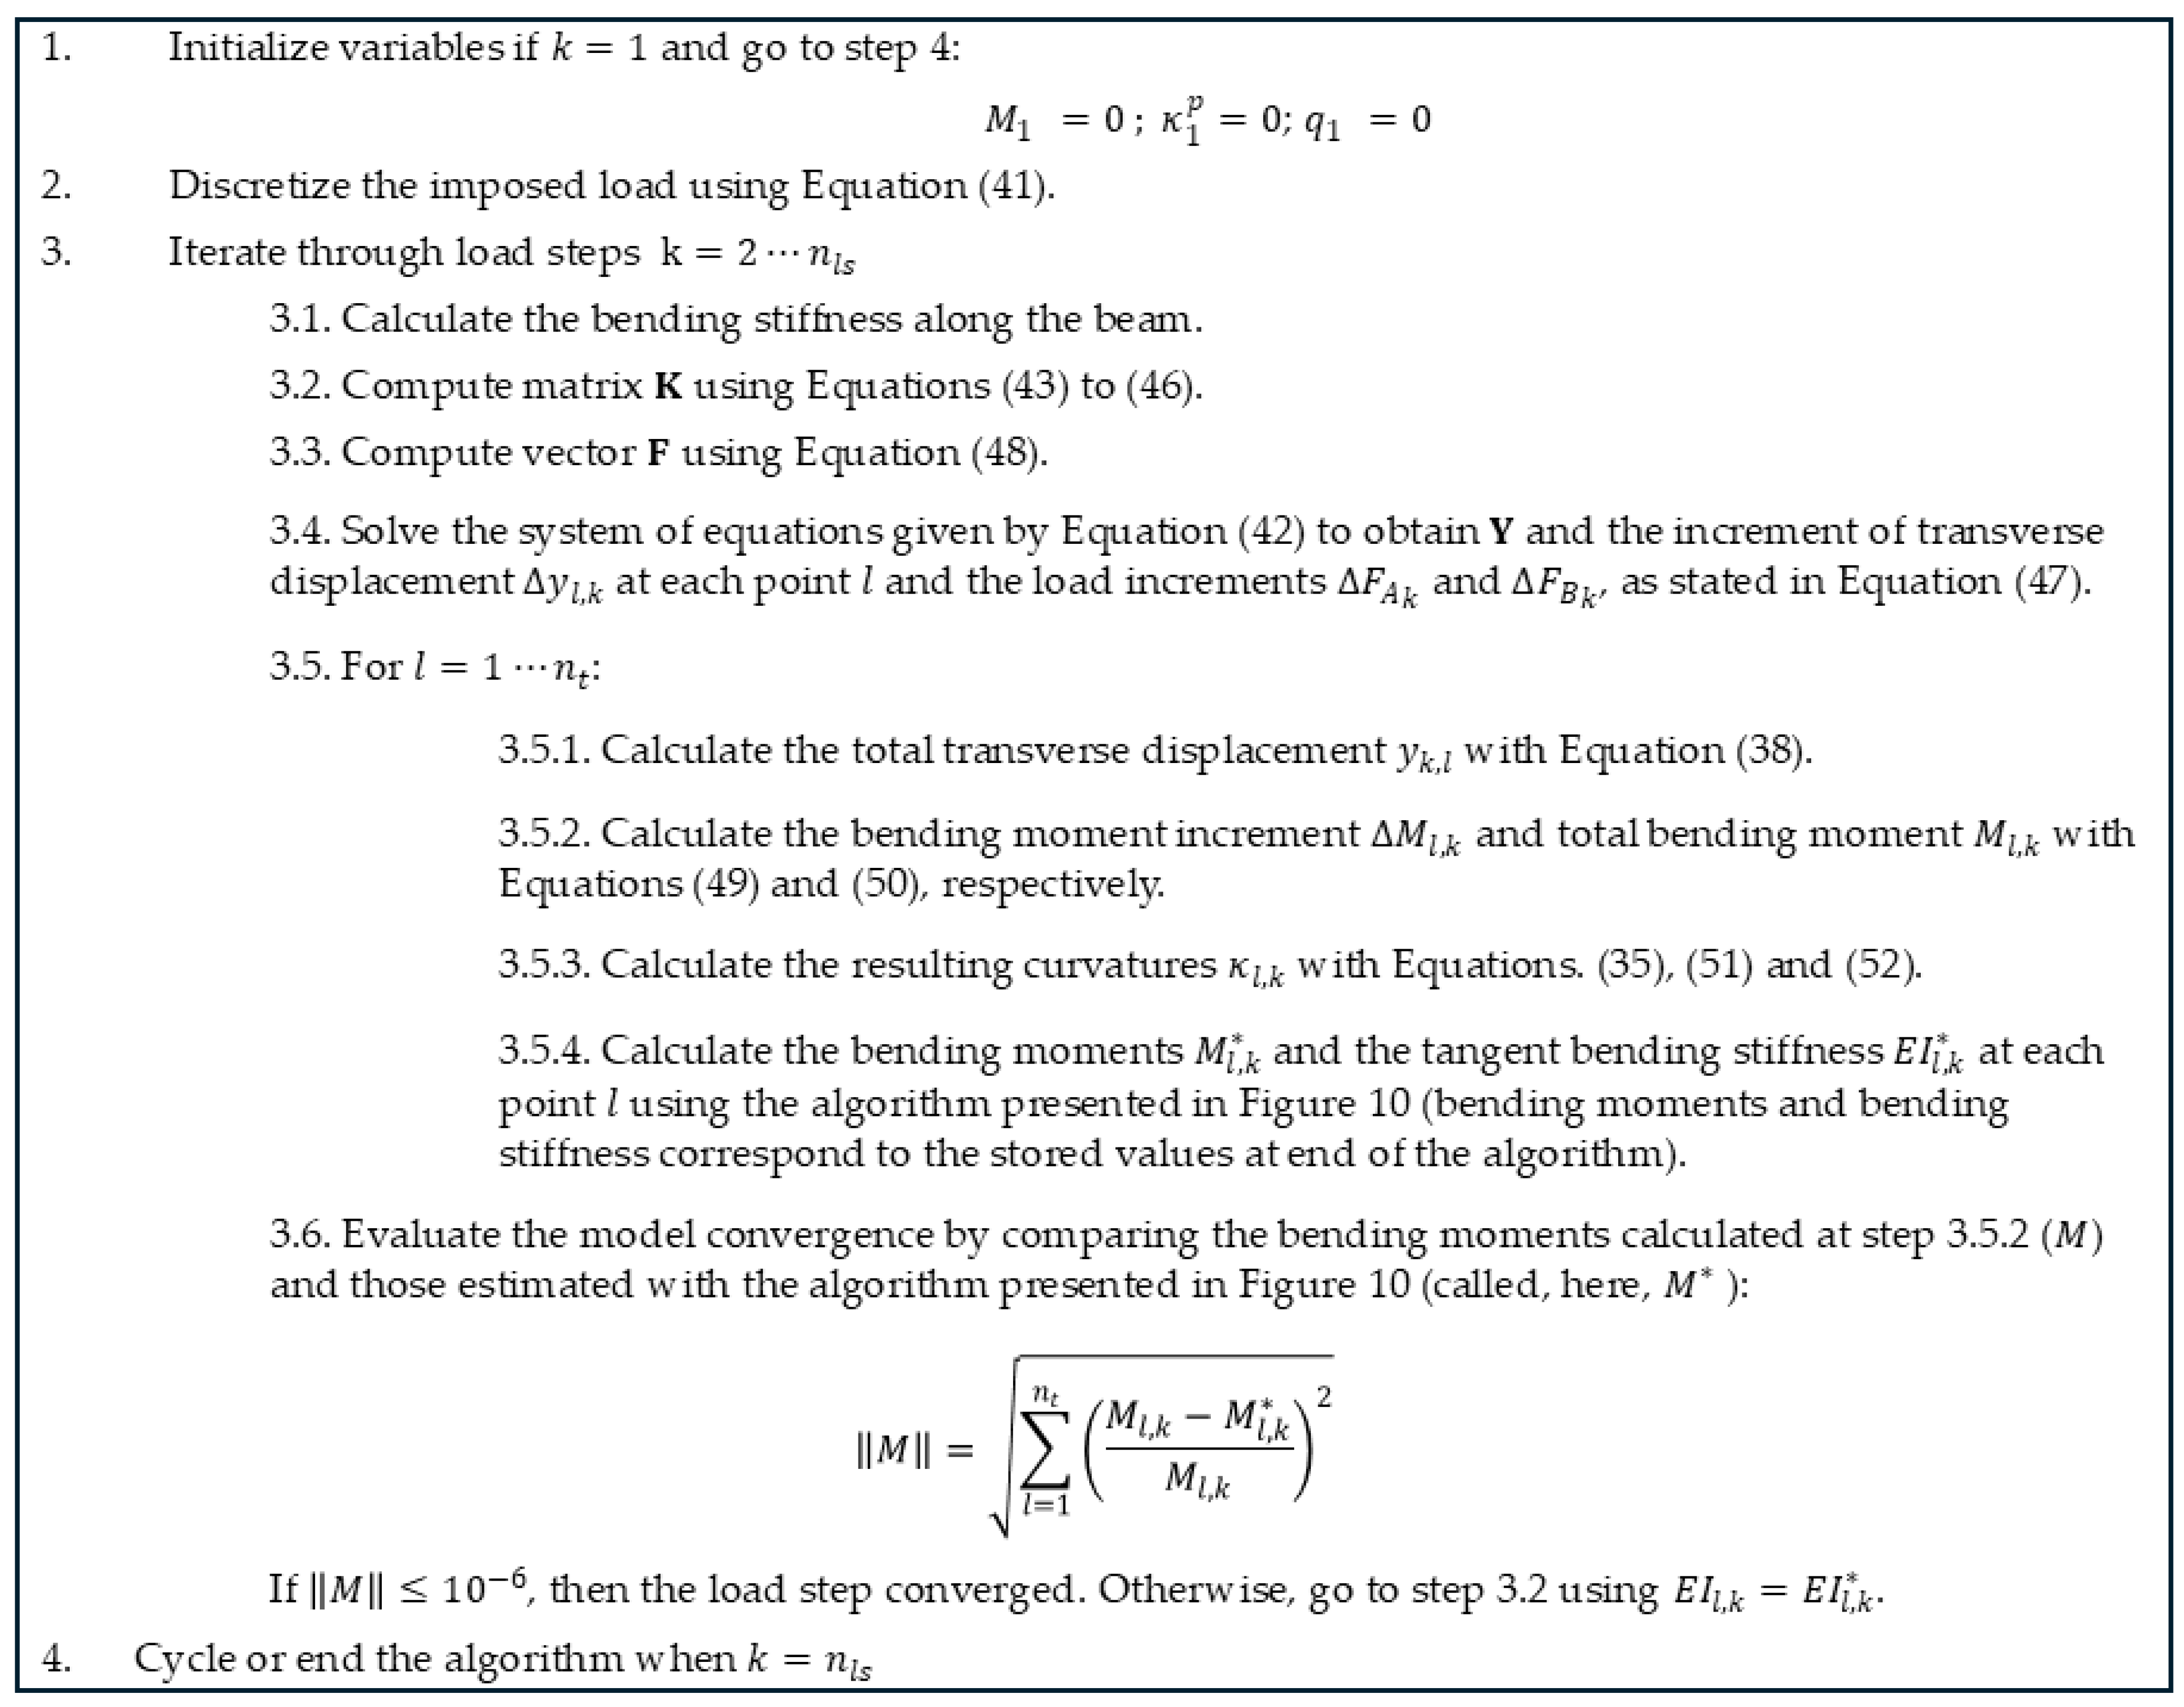
The algorithm used to calculate the sample’s response during the bending test is illustrated in Figure 12. Initially, moments, curvatures, and displacements are set to zero.
For points located within the length of the end fittings (EFs), the stiffness E I e f remains constant throughout the test and is equal to E I e f = 10 3 E I n s . In the pipe section, an initial no-slip stiffness, Equation (22), is assumed. During the iteration loop, matrix K and vector F are computed, and the linear system described in Equation (41) is solved. Incremental displacements for the nodes are determined based on their previous positions to establish the current position, as well as variations in bending moments and curvatures.
The new stiffness and estimated bending moments are subsequently calculated as a function of the curvature change using the algorithm presented in Figure 10. If the bending moments estimated using the given algorithm match those calculated, the solution has converged, and it proceeds to the next step. If a discrepancy occurs, the loop restarts, replacing the assumed stiffness with the newly calculated value. The described solution procedure was implemented in an electronic spreadsheet in Mathcad (version 15) [55].

4. Results

4.1. Axisymmetric Loading Test (T0)

Before analyzing the bending response of the pipe, the axisymmetric model must be verified, as the evaluation of the pipe bending stiffness relies on the contact pressures induced by the axisymmetric loading.
Accordingly, an experimental test was carried out to determine the apparent axial stiffness of the pipe sample (Section 3.2.1). Initially, an axial force of 2 kN, T i , was applied to straighten the specimen. Subsequently, the pipe was pressurized up to 200 bar, while the axial displacement of its free end was recorded. The axial force associated with the internal pressure acting on the closed end of the pipe (end-cap effect) was estimated by assuming that the inner sheath of the pipe is sealed at the sample’s EF. Under this condition, the real axial force, Equation (53), is expressed as:
T r e = T i + π P i n t r i n t i s 2 .
where r i n t i s . is the internal radius of the inner sheath.
Figure 13 presents the relationship between the experimentally measured axial displacement and the axial force induced by internal pressure, along with the prediction of the analytical model (Section 3.2.1). The experimental results exhibit an almost linear trend, with a linear regression yielding a coefficient of determination R 2 = 0.999. The axisymmetric model predicts a linear response that closely matches the experimental data. The slope of the regression line corresponds to an experimental apparent axial stiffness of 90,904 kN, which is only 2.2% higher than the analytical value of 88,931 kN. These results demonstrate that the model provides a reasonable prediction of the pipe’s axisymmetric response.
The axisymmetric model was subsequently employed to calculate the contact pressures associated with the axisymmetric loading conditions applied in the bending tests (Table 3). Table 4 reports the total contact pressures acting on the inner and outer tensile armor layers of the pipe ( P c I T A and P c O T A , respectively), obtained as the sum of the contact pressures at the corresponding layer interfaces.

4.2. Pure Bending Test (T1-1)

4.2.1. Mesh and Load Increment Sensitivities

This section addresses the definition of mesh parameters and load increments required to reproduce the bending tests with both accuracy and computational efficiency. An initial adhesion τ 0 of 0.9 MPa was assumed, as further justified in the following section, and the transverse displacement imposed by the actuators was equal to 150 mm (full stroke).
Mesh convergence was assessed by progressively increasing the number of nodes until additional refinement produced negligible variations in the model response. Since the simulations were performed under displacement control, the evaluation focused on the forces F A , F B , and the total force F t o t a l . The displacement increment per step was initially set to 3 mm. A comparison of the results obtained for the different mesh configurations is presented in Table 5.
Starting from the initial mesh, increasing the number of nodes produced only marginal variations in the model predictions. In particular, the total force estimated with the fourth mesh differed by less than 0.1% from that obtained with the sixth mesh. Based on these results, the fourth mesh configuration (60–80–60 nodes) was identified as the most suitable, providing an appropriate balance between computational efficiency and accuracy.
A similar procedure was employed to assess the impact of the displacement increment, utilizing the defined mesh. The results obtained are summarized in Table 6. Increments were tested within a range from 6 mm to 0.25 mm. Beyond the 1 mm increment, even when the load per step was reduced by a factor of four (to 0.25 mm), the total force varied by less than 0.5%. Consequently, the 1 mm load increment was chosen as the reference for this study.

4.2.2. Adhesion Investigation

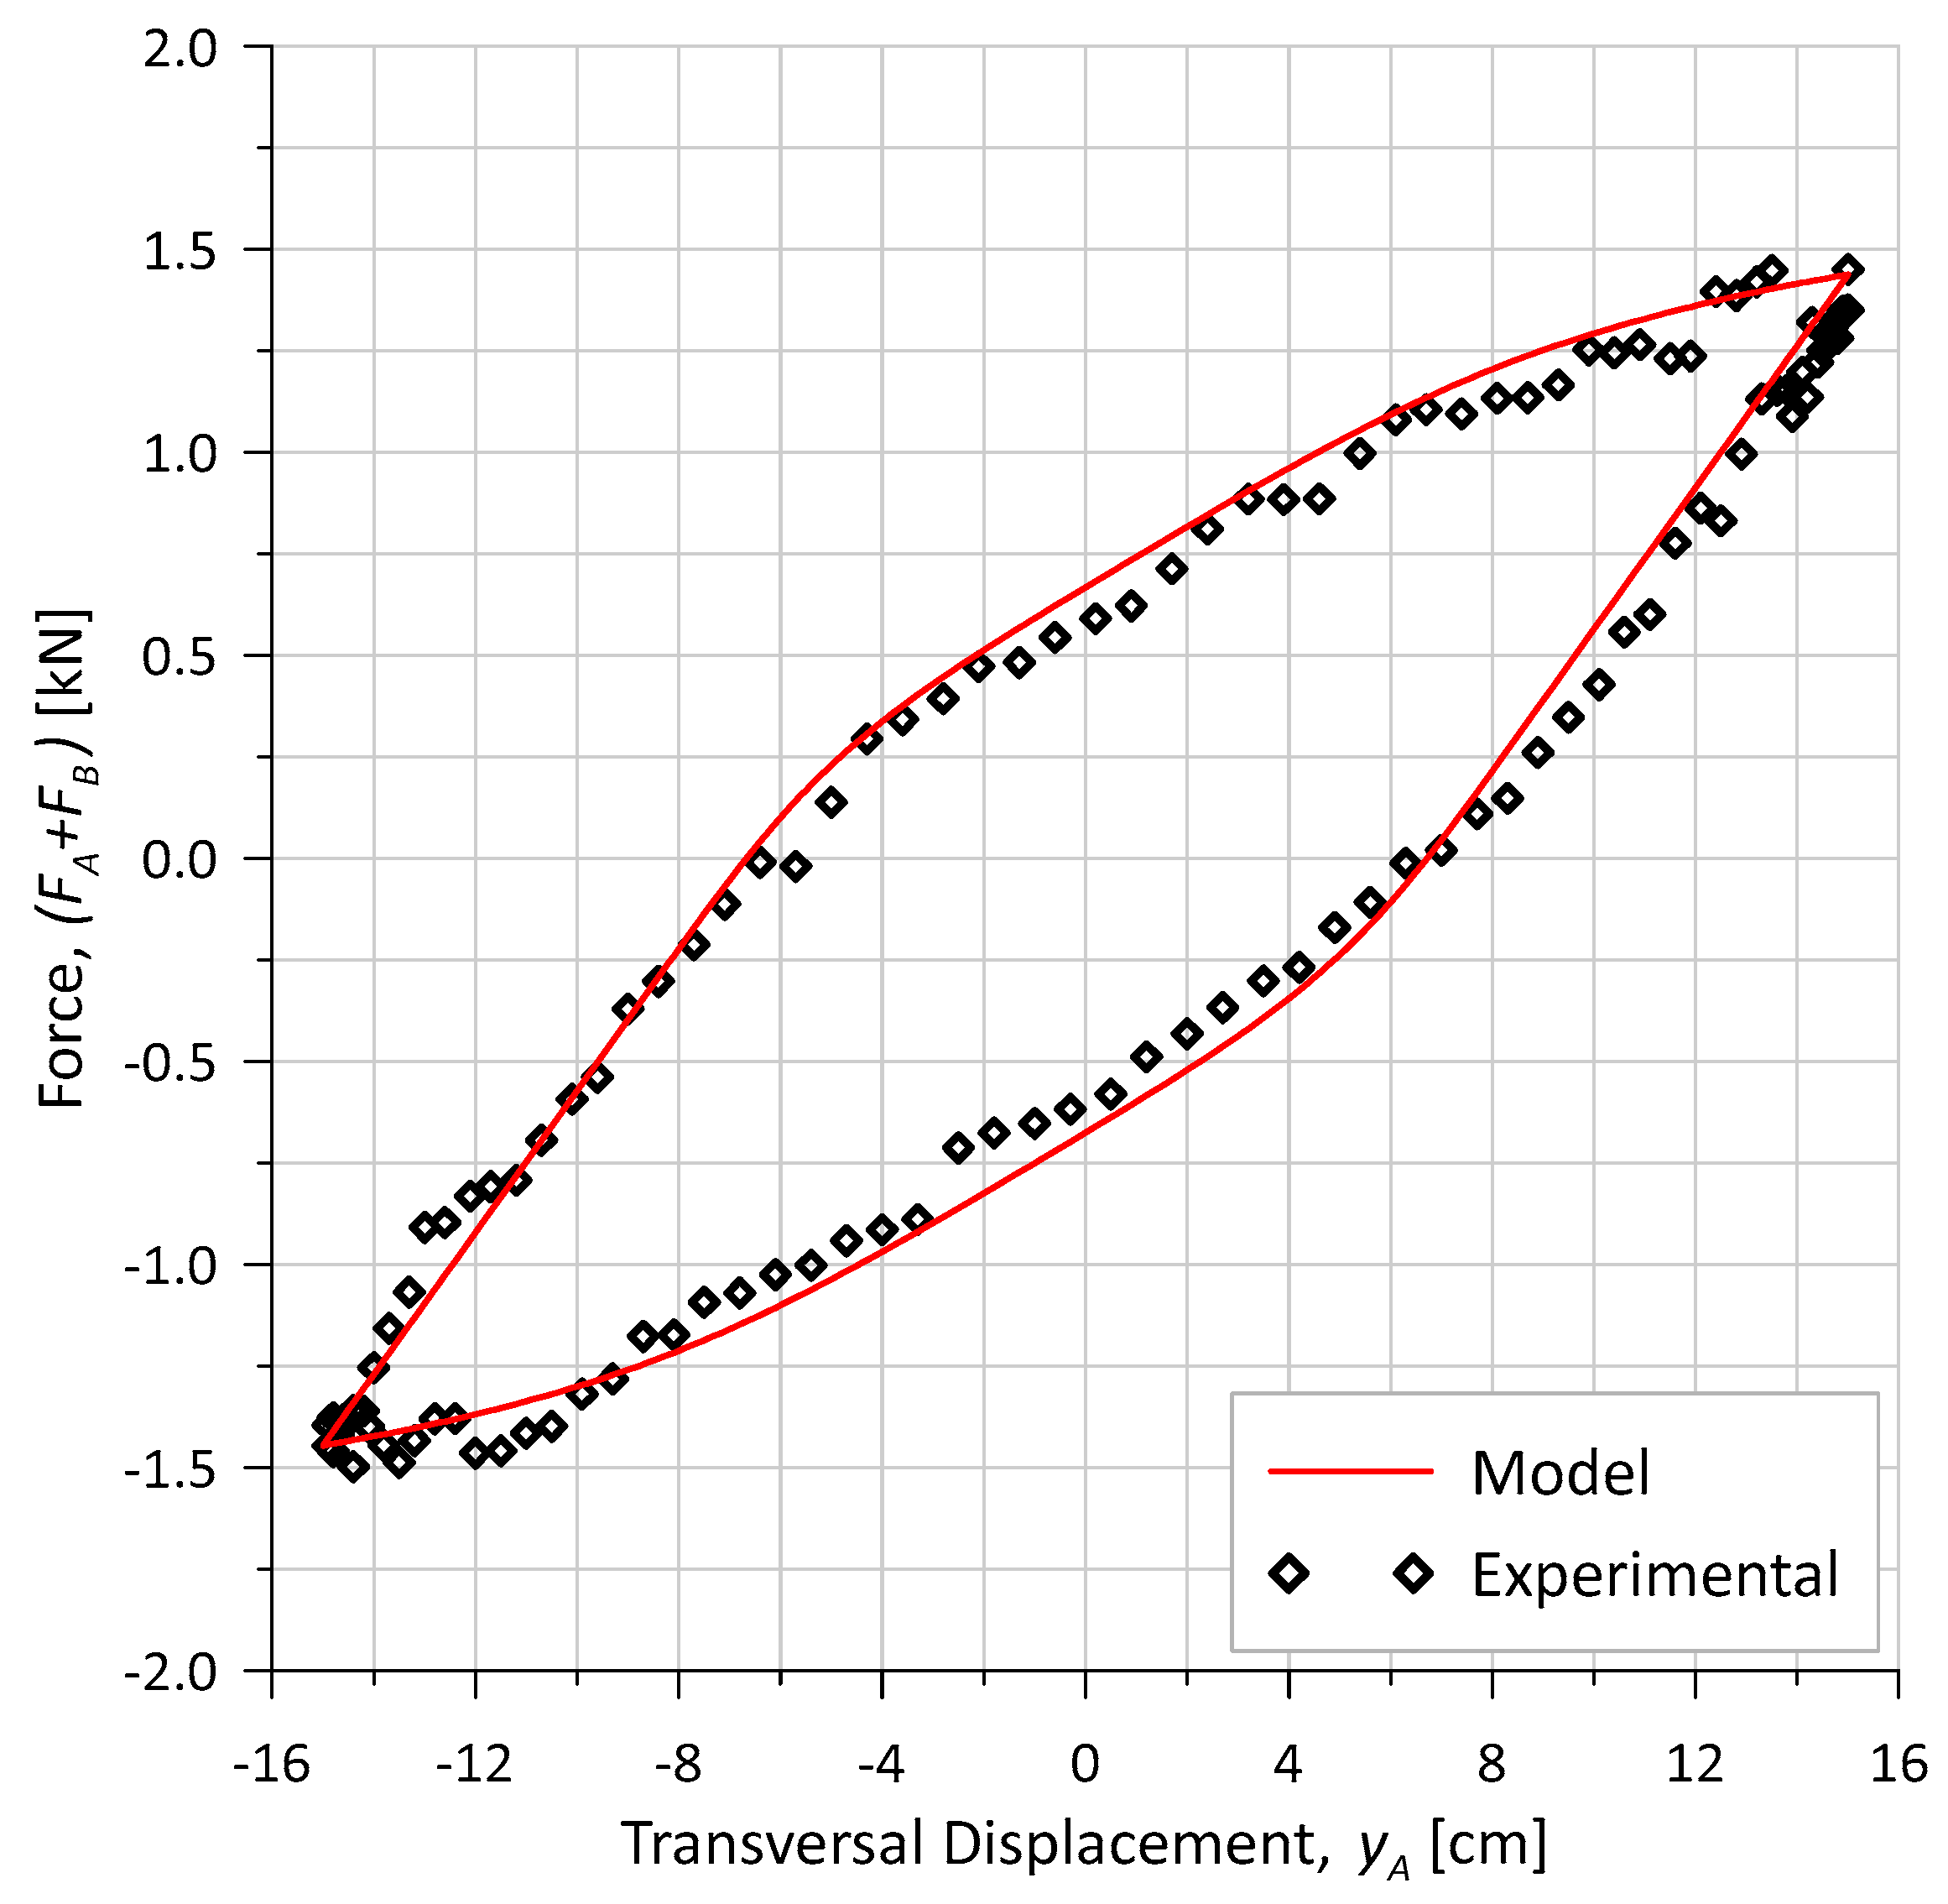
Test T1-1 (Table 3) was conducted without any internal pressure or axial load (pure bend test), but demonstrated notable hysteresis, as seen in Figure 14, where the total transversal force acting on the sample and the actuator displacement during one cycle are depicted. In the absence of an axisymmetric load to create contact pressures between the layers, this behavior can be attributed to an initial adhesion between the tensile armors and the adjacent layers. This initial adhesion restricts the relative movement between layers, resulting in energy dissipation, which is reflected in the area enclosed by the force vs. displacement curve during a cycle, as shown in Figure 14. Since this adhesion cannot be measured directly, it must be calibrated.
A parametric study was conducted to determine which value of adhesion best aligns with the experimental data, specifically focusing on the variation in total force and the area of the hysteresis loop.
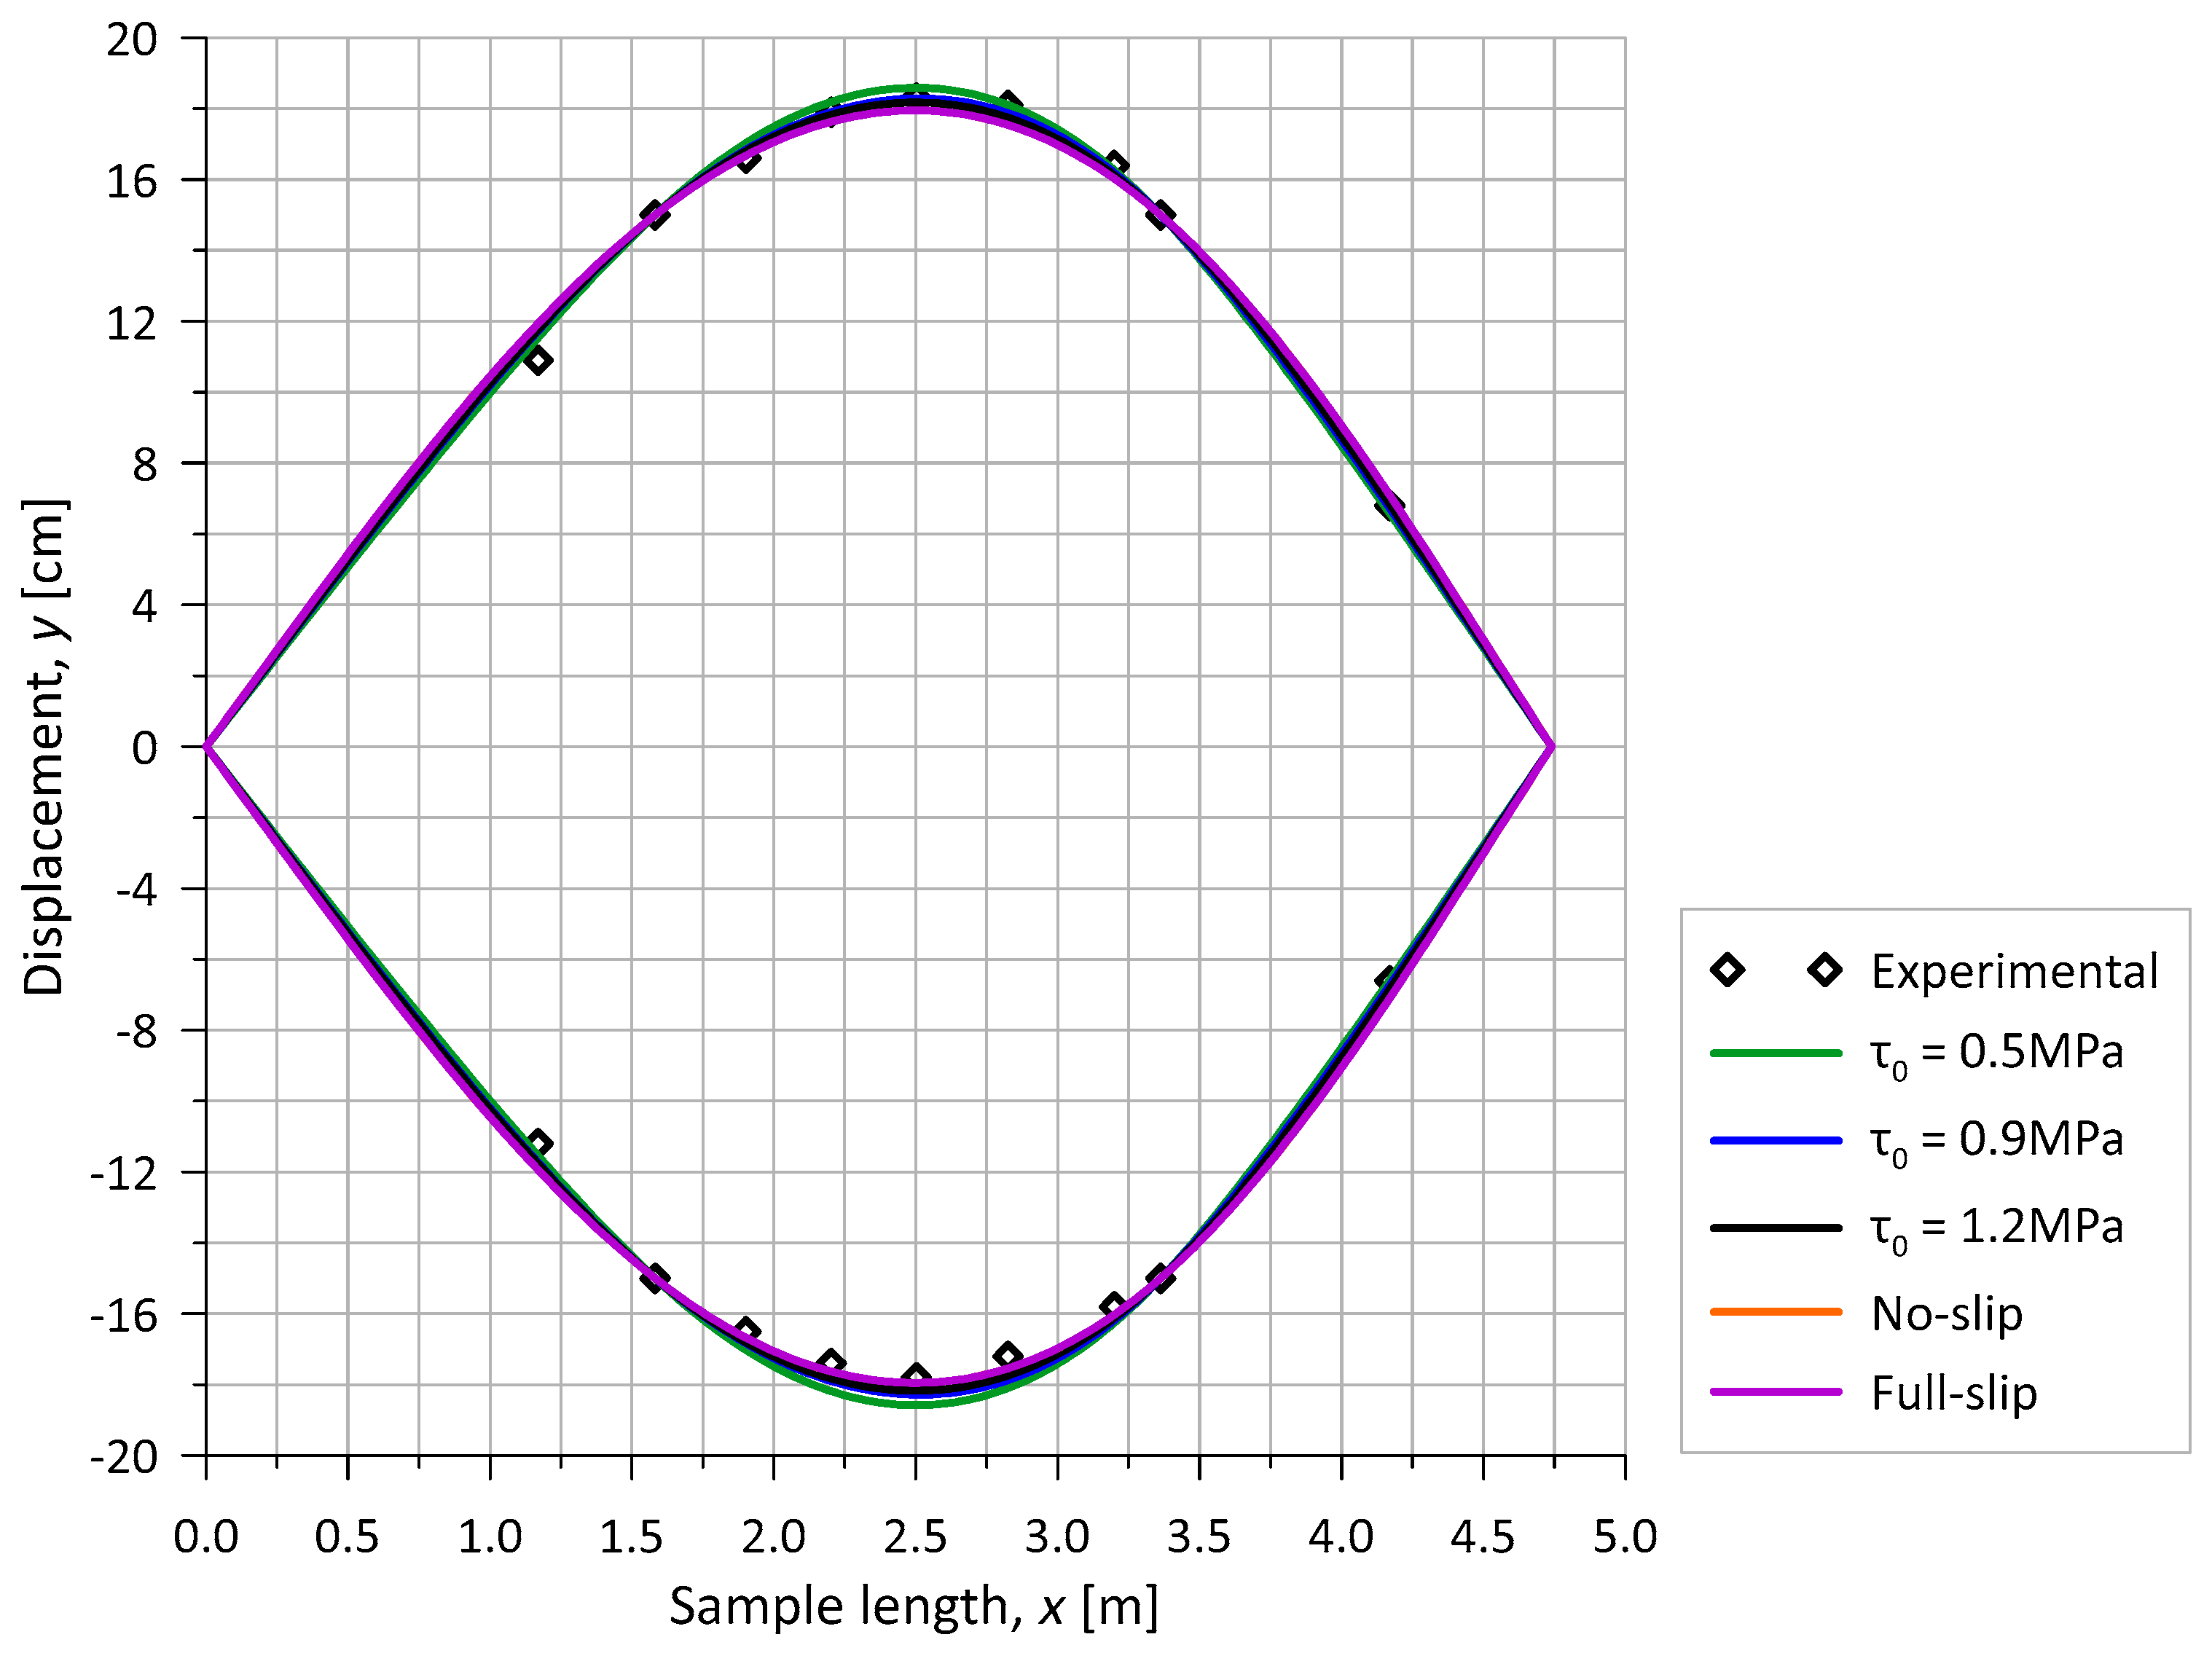
The deflection of the sample corresponding to the full stroke of the transversal actuator (150 mm) is presented in Figure 15, illustrating various adhesion conditions along with the full-slip stiffness (analogous to zero adhesion) and the no-slip stiffness (where adhesion is sufficiently high to prevent any sliding during the cycle). The experimentally measured points are also included. As anticipated, due to displacement control, the response of the pipe remains quite similar across the different conditions, although the occurrence of slippage and the associated forces vary from one case to another. The values for positive and negative peak deflections for measurement points between actuators are presented in Table 7.
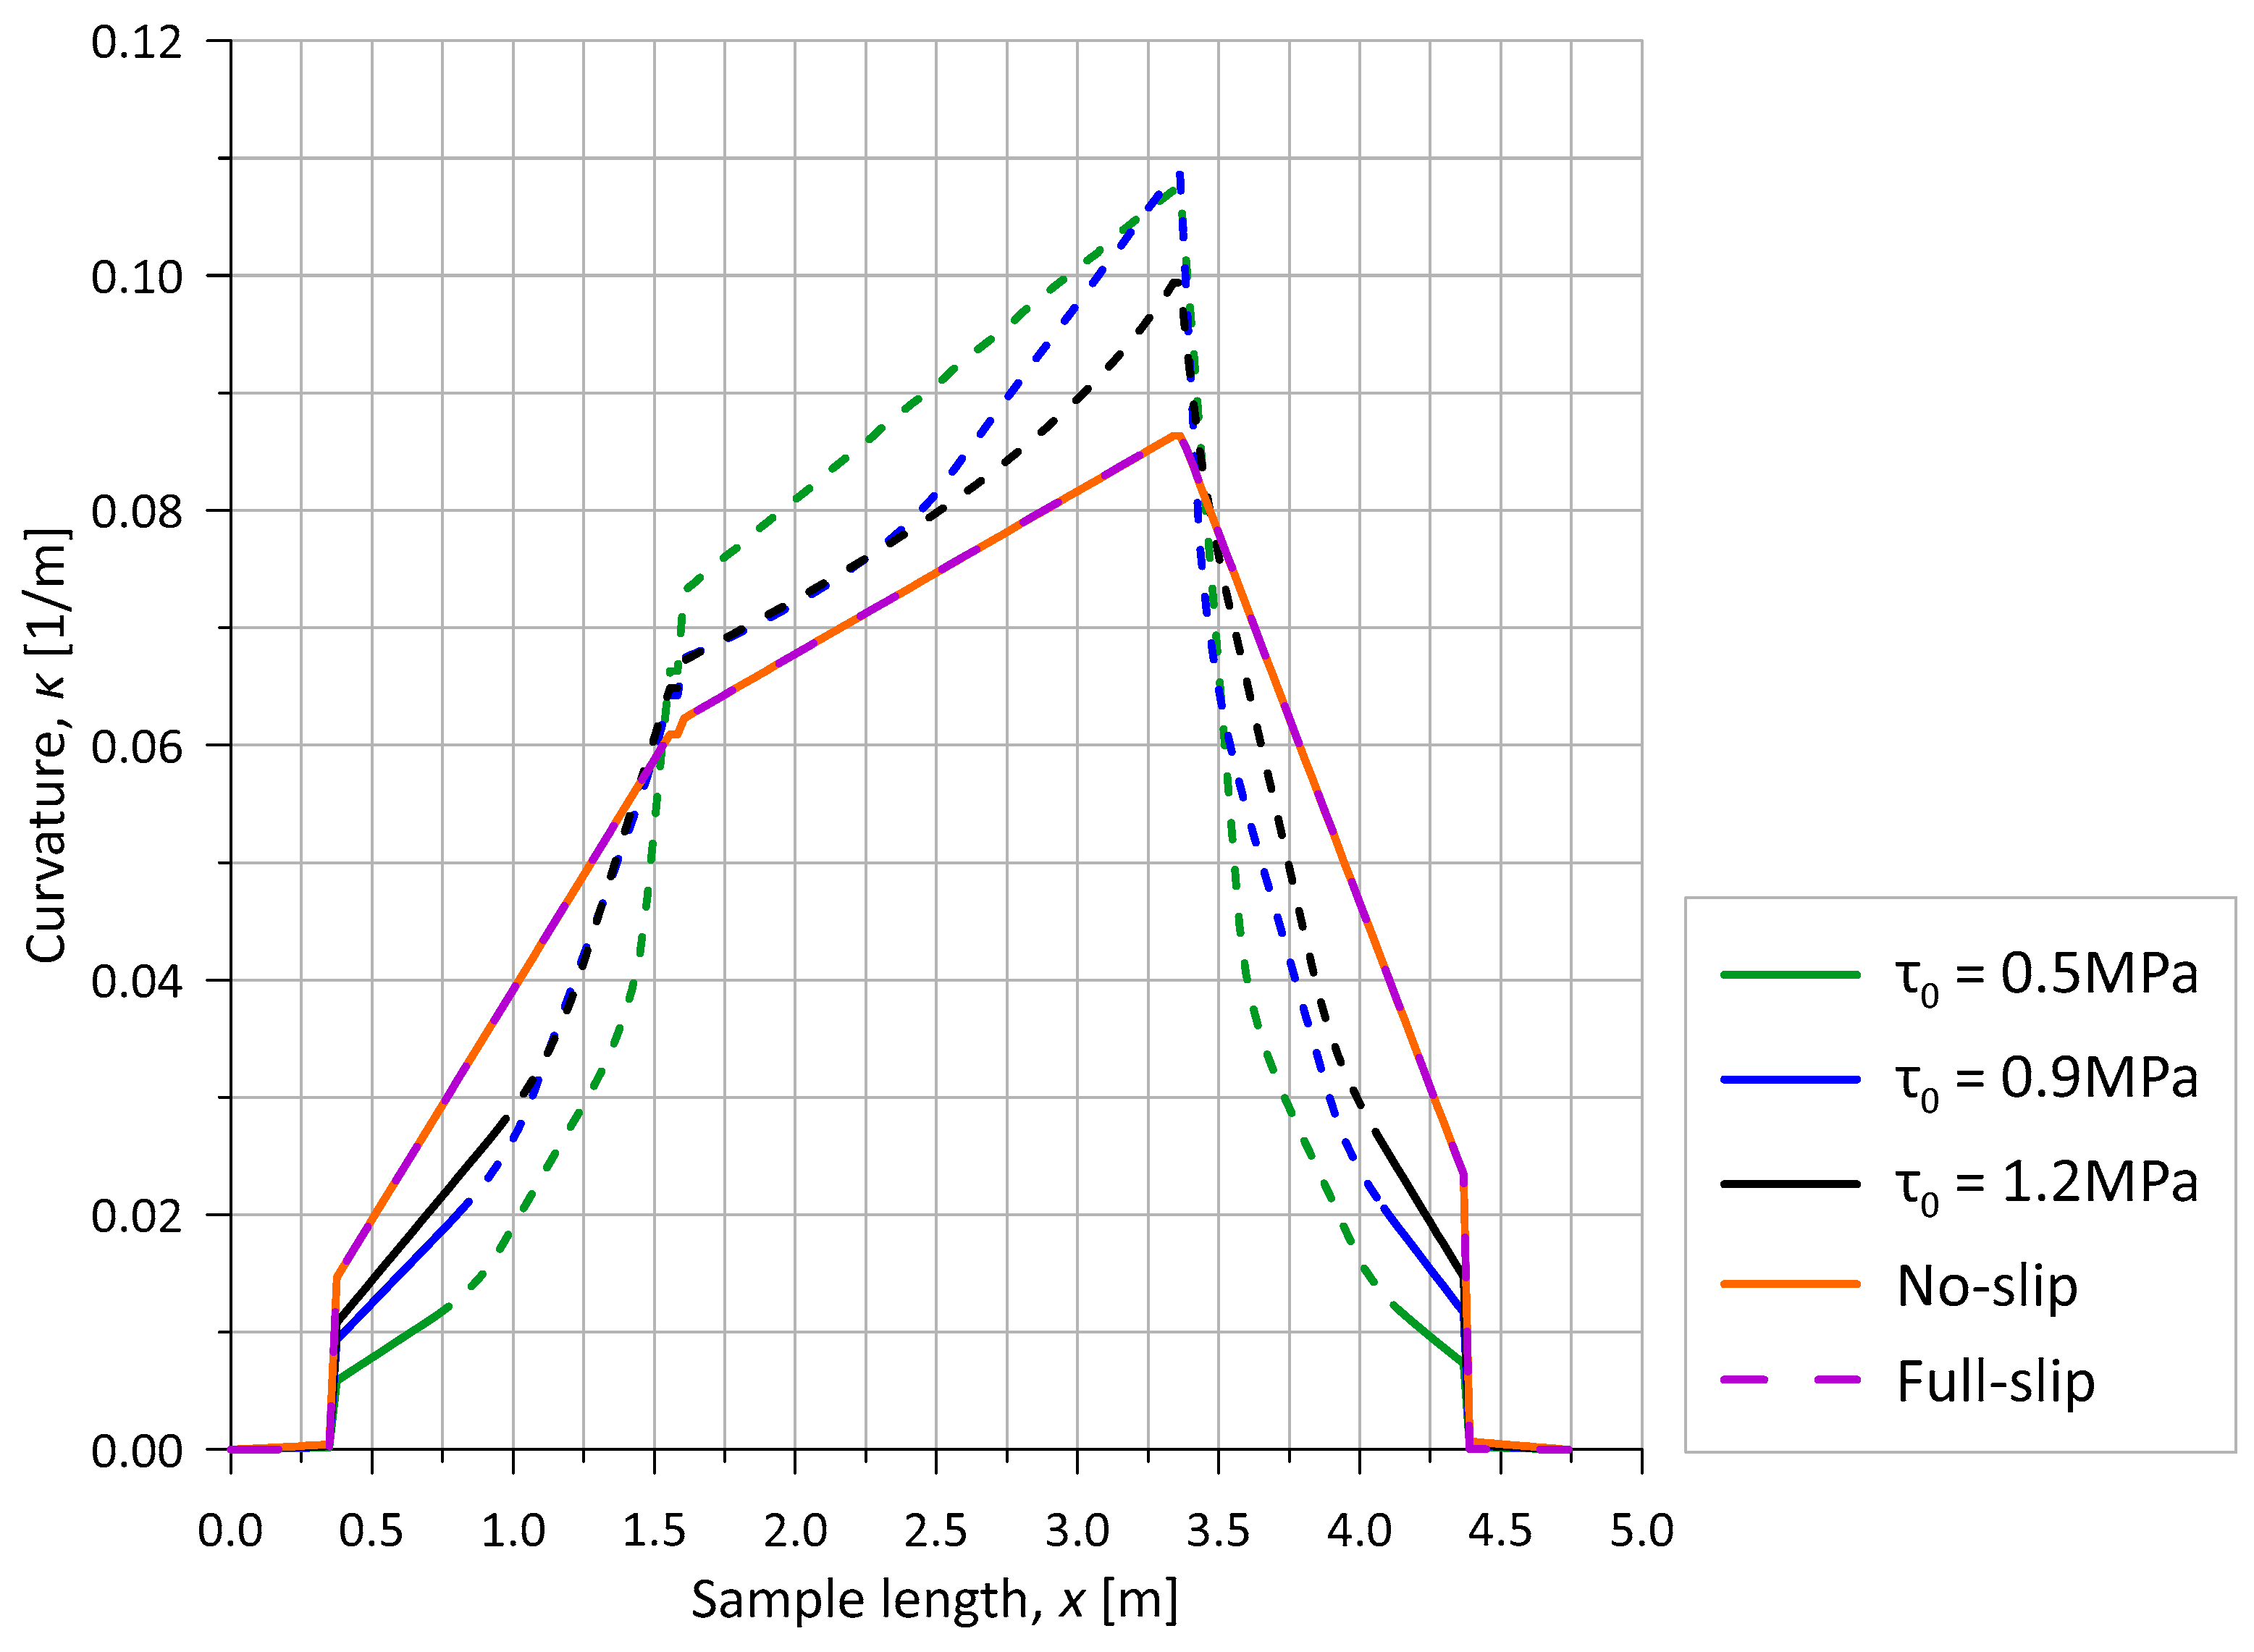
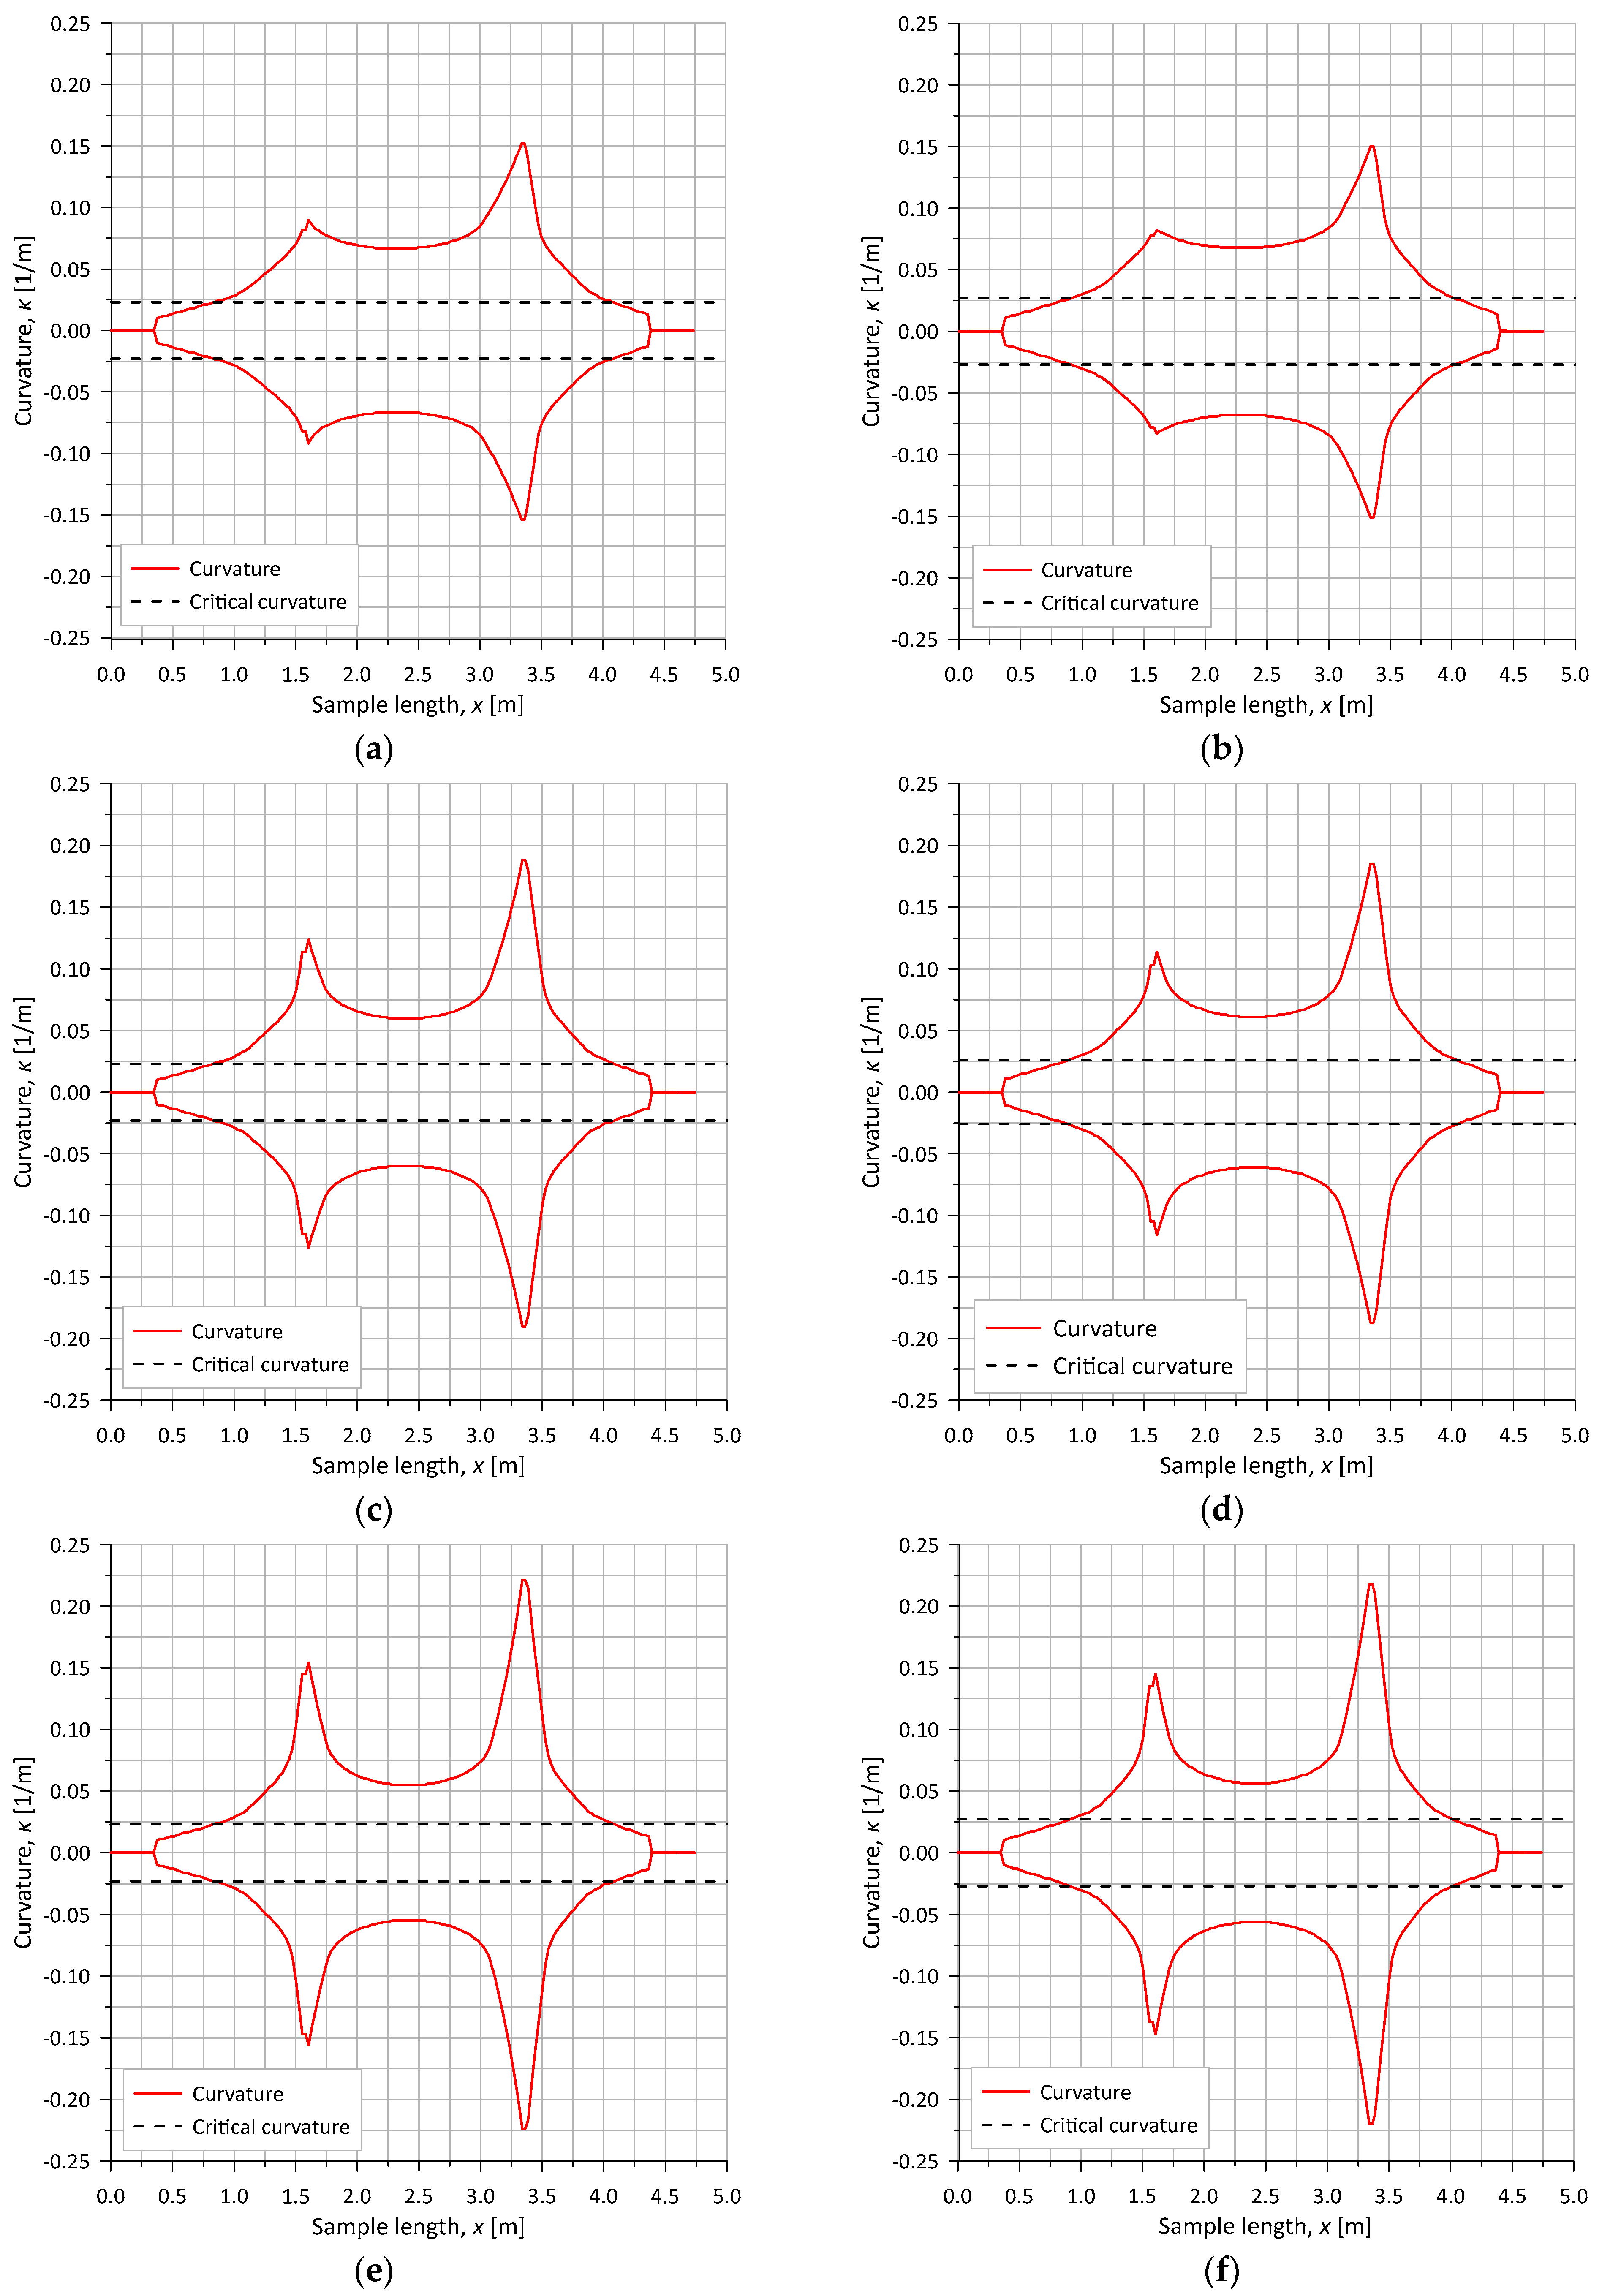
The curvatures observed under each condition are illustrated in Figure 16. It is noted that the analyses with full-slip and no-slip stiffness yielded identical results, as the tests were conducted under displacement control and, therefore, the final deformed shapes of the pipe were similar. In these cases, three distinct regions can be observed (disregarding those related to the EFs at the extremities), where the curvatures vary linearly.
On the other hand, the initial adhesion leads to a variation in the bending stiffness of the pipe as slip occurs between the layers. In Figure 16, the lengths depicted with a solid line indicate no-slip between layers, while the dashed lines represent segments of the pipe where slippage occurred. In the regions between the extremities (EFs) and the actuators, the curvatures vary nonlinearly due to the bending stiffness variation along the length of these regions. Regarding the region between the actuators, the response obtained with an adhesion of 0.5 MPa is linear, whereas the responses obtained for adhesions of 0.9 MPa and 1.2 MPa are nonlinear. Again, this response is related to the variation in bending stiffness of the pipe. In the first condition (0.5 MPa), full slip occurs between layers, while in the other conditions, stiffness still varies along the length. Finally, it is noted that the maximum curvatures are obtained for adhesions of 0.5 MPa and 0.9 MPa. In contrast, the adhesion of 1.2 MPa indicates a lower value, with the curve tending to approach that obtained with no-slip stiffness.
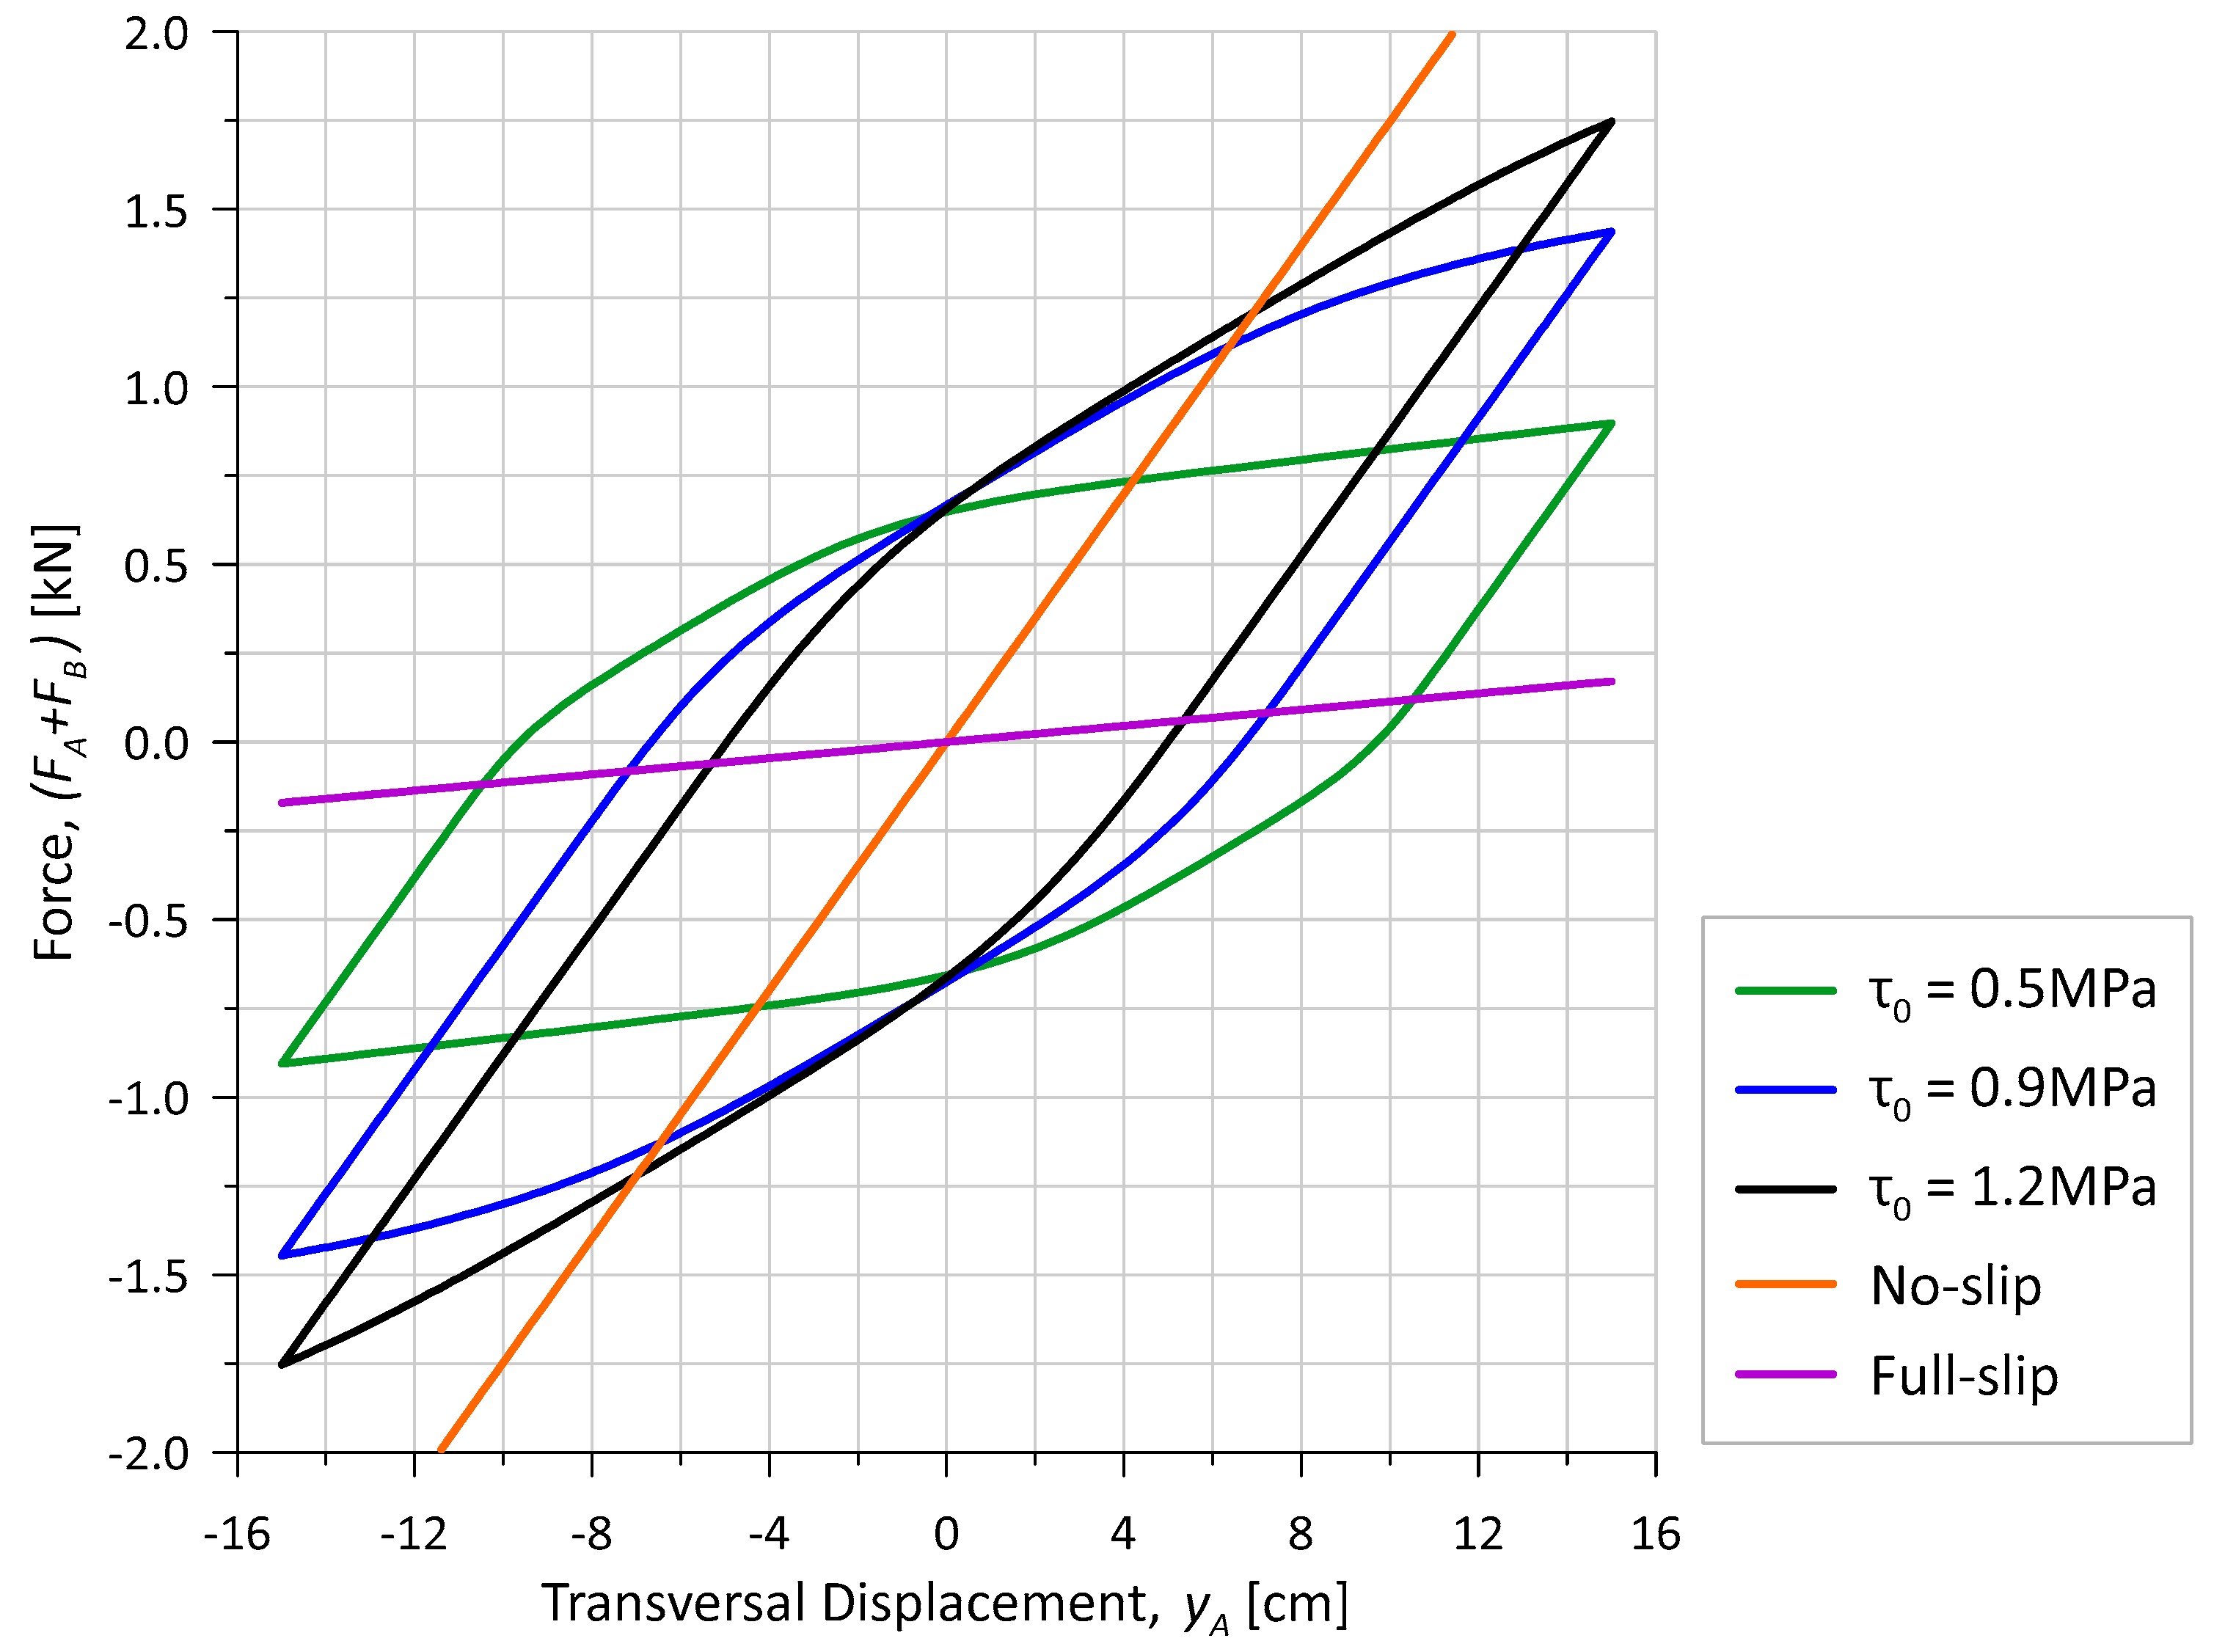
The impact of varying the adhesion between layers, and consequently the relationship between moment and curvature, can be more clearly observed in the force–displacement diagram shown in Figure 17. The graph depicts full-slip stiffness and no-slip stiffness as straight lines. In cases with adhesion, the loops represent cycles where the response initially resembles that of the no-slip condition, transitioning to a full-slip behavior. As adhesion increases, the response loop rotates counterclockwise and becomes narrower, illustrating a shift from the full-slip scenario to the no-slip scenario.
The bending responses for various adhesion values are presented in Table 8. For each case, the critical curvature κ c r at which slippage begins is listed, along with the ratio F m o d e l / F e x p (named imposed force ratio), which compares the model and experimental forces required to transition the sample from the most negative to the most positive deflections (representing half a cycle). Additionally, A m o d e l / A e x p (named energy dissipation ratio) provides a comparison of the areas of the loops, while R 2 indicates the coefficient of determination between the model and experimental measurements (Figure 14). The cycle was divided into two segments, upward and downward, and the results from both segments were used to compute R 2 .
The critical curvature increases linearly with the considered adhesion, as can be inferred in Equation (8). However, there is a nonlinear variation in the imposed forces and the enclosed areas with this parameter.
Regarding the forces required to perform the cycle, they increase as adhesion increases, as presented in Figure 18, until the adhesion reaches a level at which no slippage occurs during the cycles (approximately 3.5 MPa). After that, the forces are the same regardless of the adhesion value.
The areas represented in the loops of Figure 17 are related to energy dissipation during the load cycles due to the stick–slip effect. Therefore, no dissipation is observed in scenarios without a change in stiffness, resulting in zero area for both no-slip and full-slip conditions. As adhesion, and consequently stiffness, increases from the full-slip scenario, the areas of the loops rise from zero. However, as stiffness continues to increase and the curve approaches the no-slip stiffness condition, the area begins to decrease again, ultimately reaching zero when no slip occurs. Hence, a specific level of adhesion exists that maximizes energy dissipation. By exploring a range of adhesion values, adhesions around 0.7 MPa yield the highest energy dissipation in the test setup, as illustrated in Figure 19, which presents the variation in enclosed area with the considered adhesion. It is essential to note that two different adhesion levels can result in the same amount of dissipated energy, albeit with varying responses. This explains why the 0.5 MPa case exhibits nearly identical energy dissipation to that of the test, despite a noticeably different response. Consequently, the area cannot serve as a standalone parameter for fitting test results.
Additionally, it is essential to acknowledge that other sources of energy dissipation may impact the overall dissipation levels. For instance, in flexible pipes, viscous effects play a role; however, due to the low frequency of load imposition in the test, their impact tends to be minimal. Factors such as test bench equipment, vibrations, and noise may also contribute to energy dissipation. These secondary effects become more pronounced when the energy associated with the stick–slip effect approaches zero.
Hence, the evaluation of the optimal fit was determined by calculating the coefficient of determination (R2). The best fit was achieved at 0.9 MPa, resulting in an R 2 value of 0.993, which also exhibited similar force and area characteristics as those observed experimentally. Both the experimental and modeled loops of forces vs. actuator displacements are presented in Figure 14.

4.3. Bending Combined with Internal Pressure (T1-2)

The internal pressure and the related real axial tension T r e , Equation (53), are crucial for assessing the critical curvature of the pipe, as they induce significant interlayer contact pressures in the pipe. In contrast, the effects of pressure do not influence the global response of the pipe, i.e., only the effective axial load should be considered in the global model [55]. Furthermore, the axial load remains constant in the experimental tests, because one extremity of the pipe was free to elongate.
In this scenario, a sample was tested at an internal pressure of 200 bar and without an axial load. The only difference from the previous case is the increase in stiffness resulting from the higher contact pressures caused by pipe pressurization, as shown in Table 3.
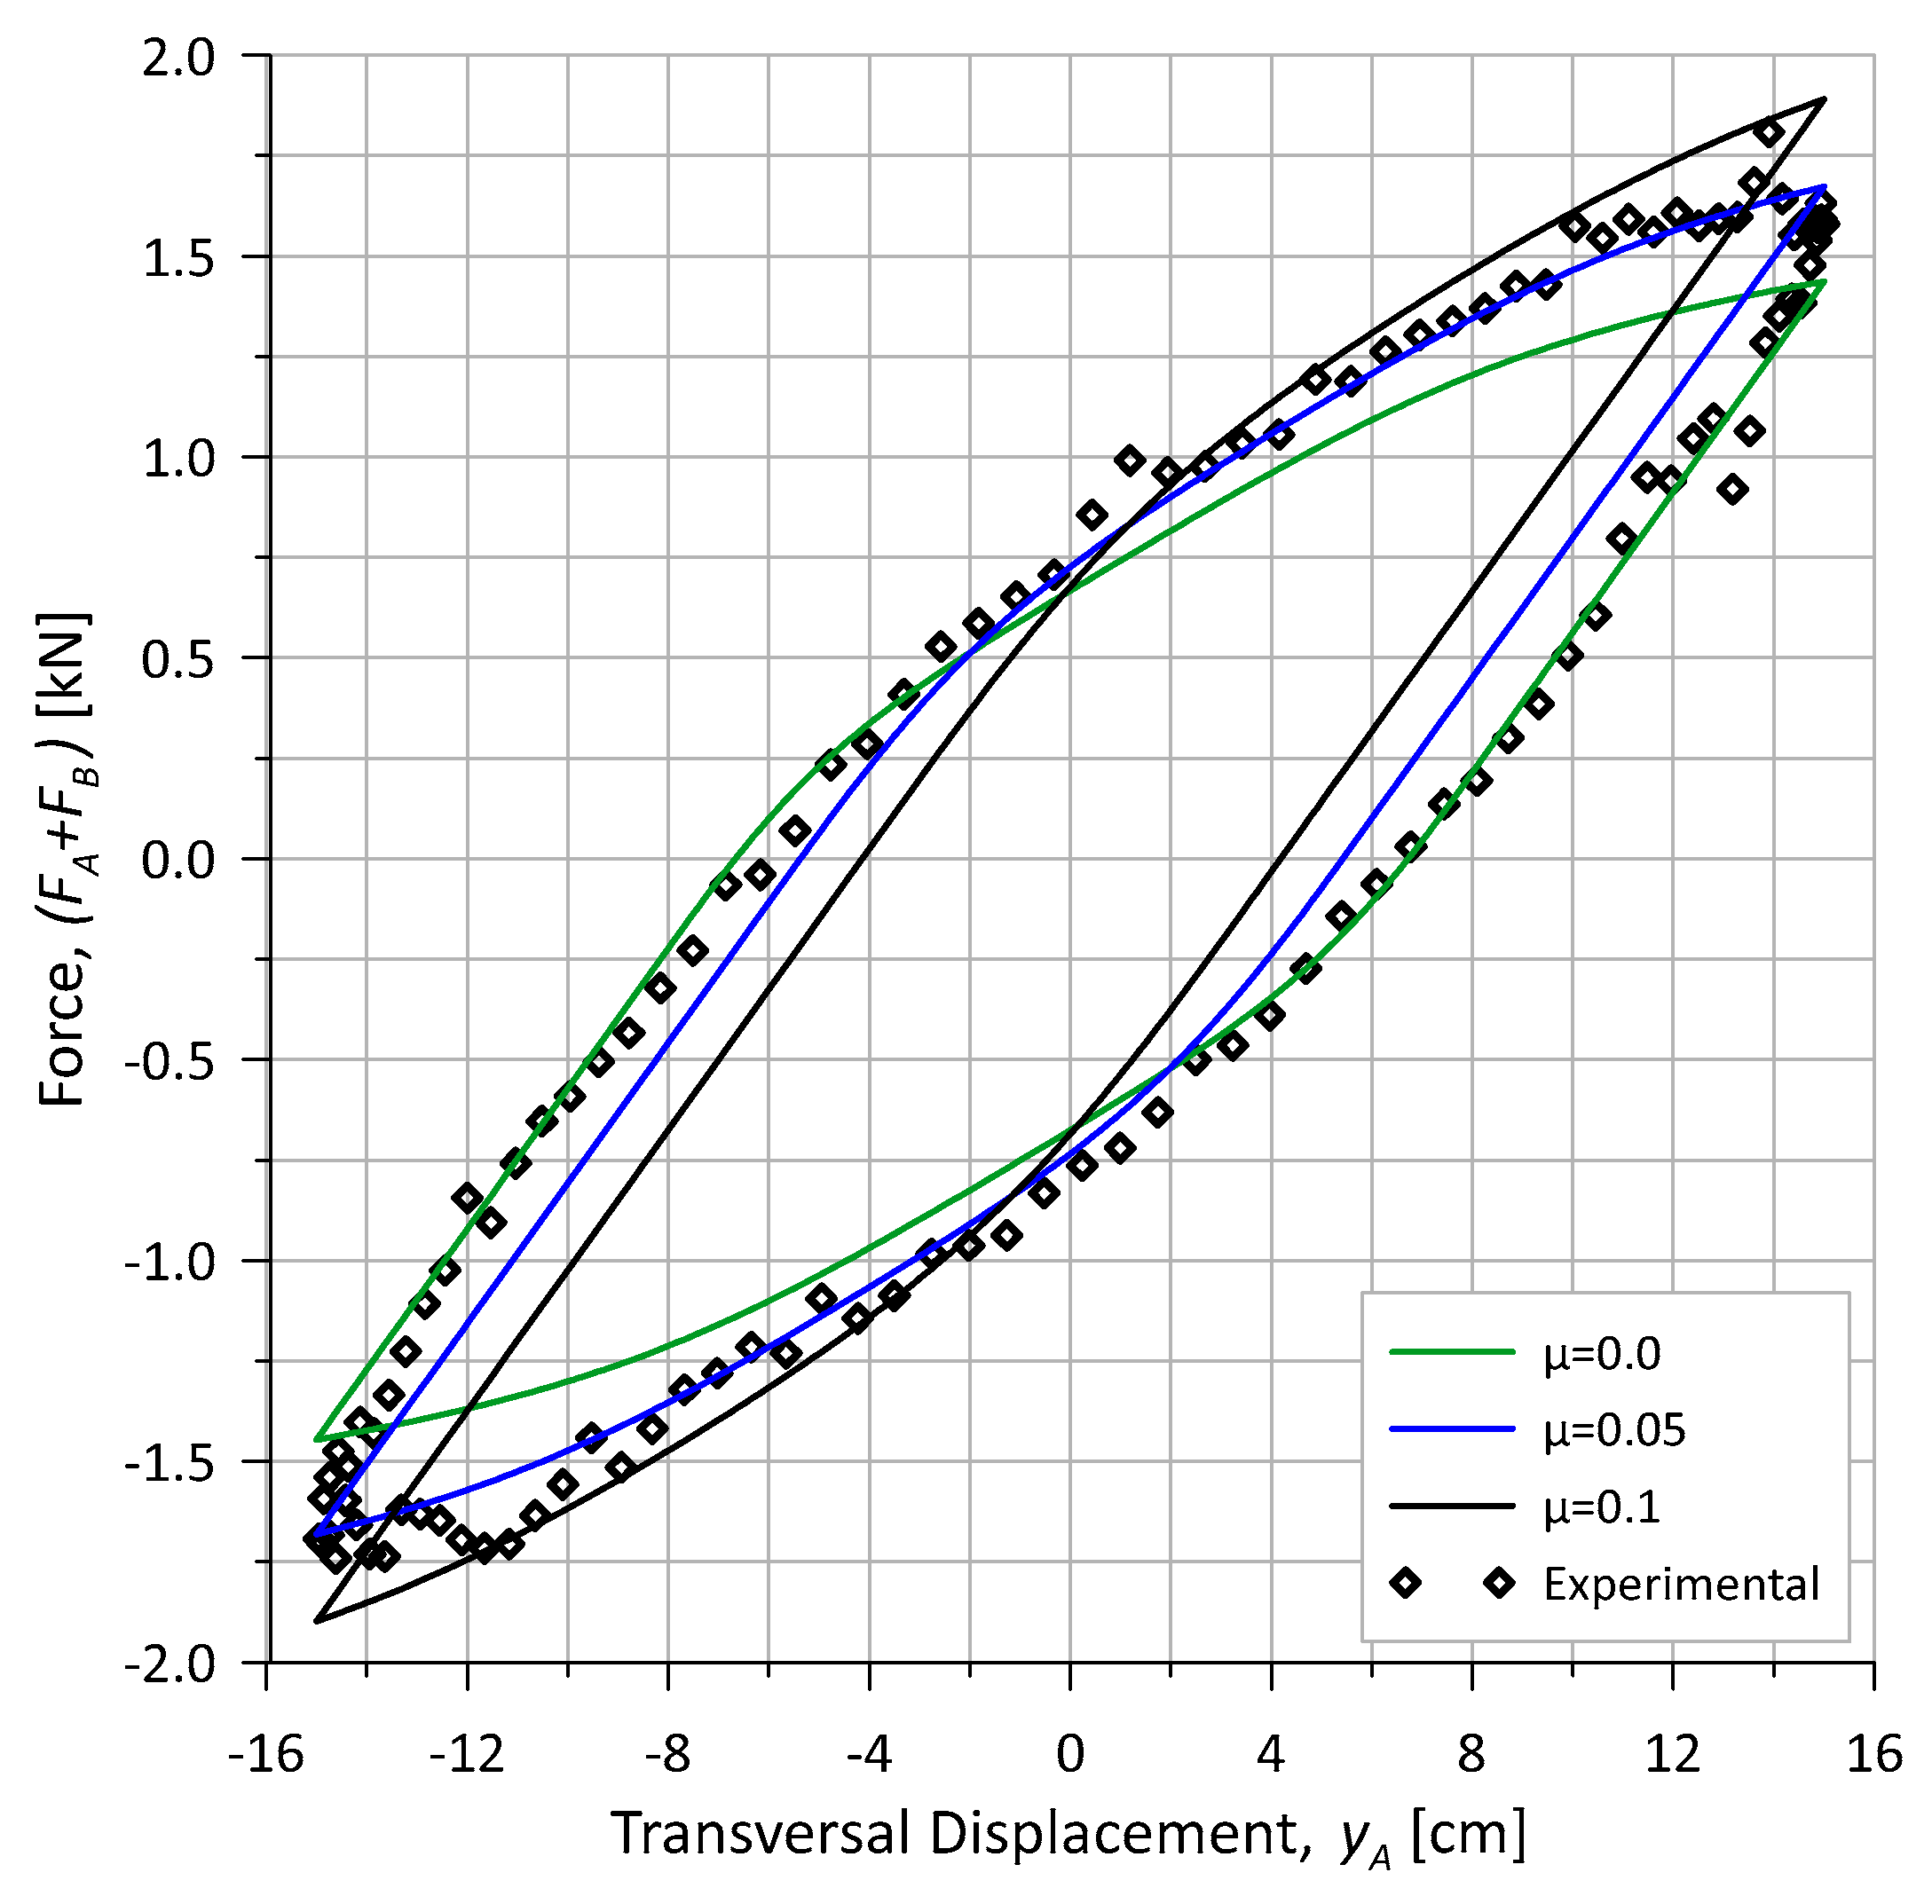
The linear dependence between critical curvature and contact pressure, as expressed in Equation (8), exhibits a slope corresponding to the interlayer friction coefficient. This test, therefore, constitutes an appropriate procedure for calibrating the friction coefficient μ . Numerical results obtained for a range of μ values are reported in Table 9. This table indicates that the increasing friction coefficients require higher transverse forces to bend the pipe, as the no-slip bending stiffness extends to higher curvatures with increasing critical curvature. On the other hand, as discussed in Section 4.2, the maximum energy dissipation occurs for an adhesion of 0.7 MPa. Consequently, an increase in the friction coefficient leads to a decrease in energy dissipation.
Moreover, by inspecting Table 8, the friction coefficient that provided the best overall agreement among the three parameters is 0.05. At this value, the energy dissipation and the imposed forces ratios are close to the experimental values, and R 2 tends to 1.0.
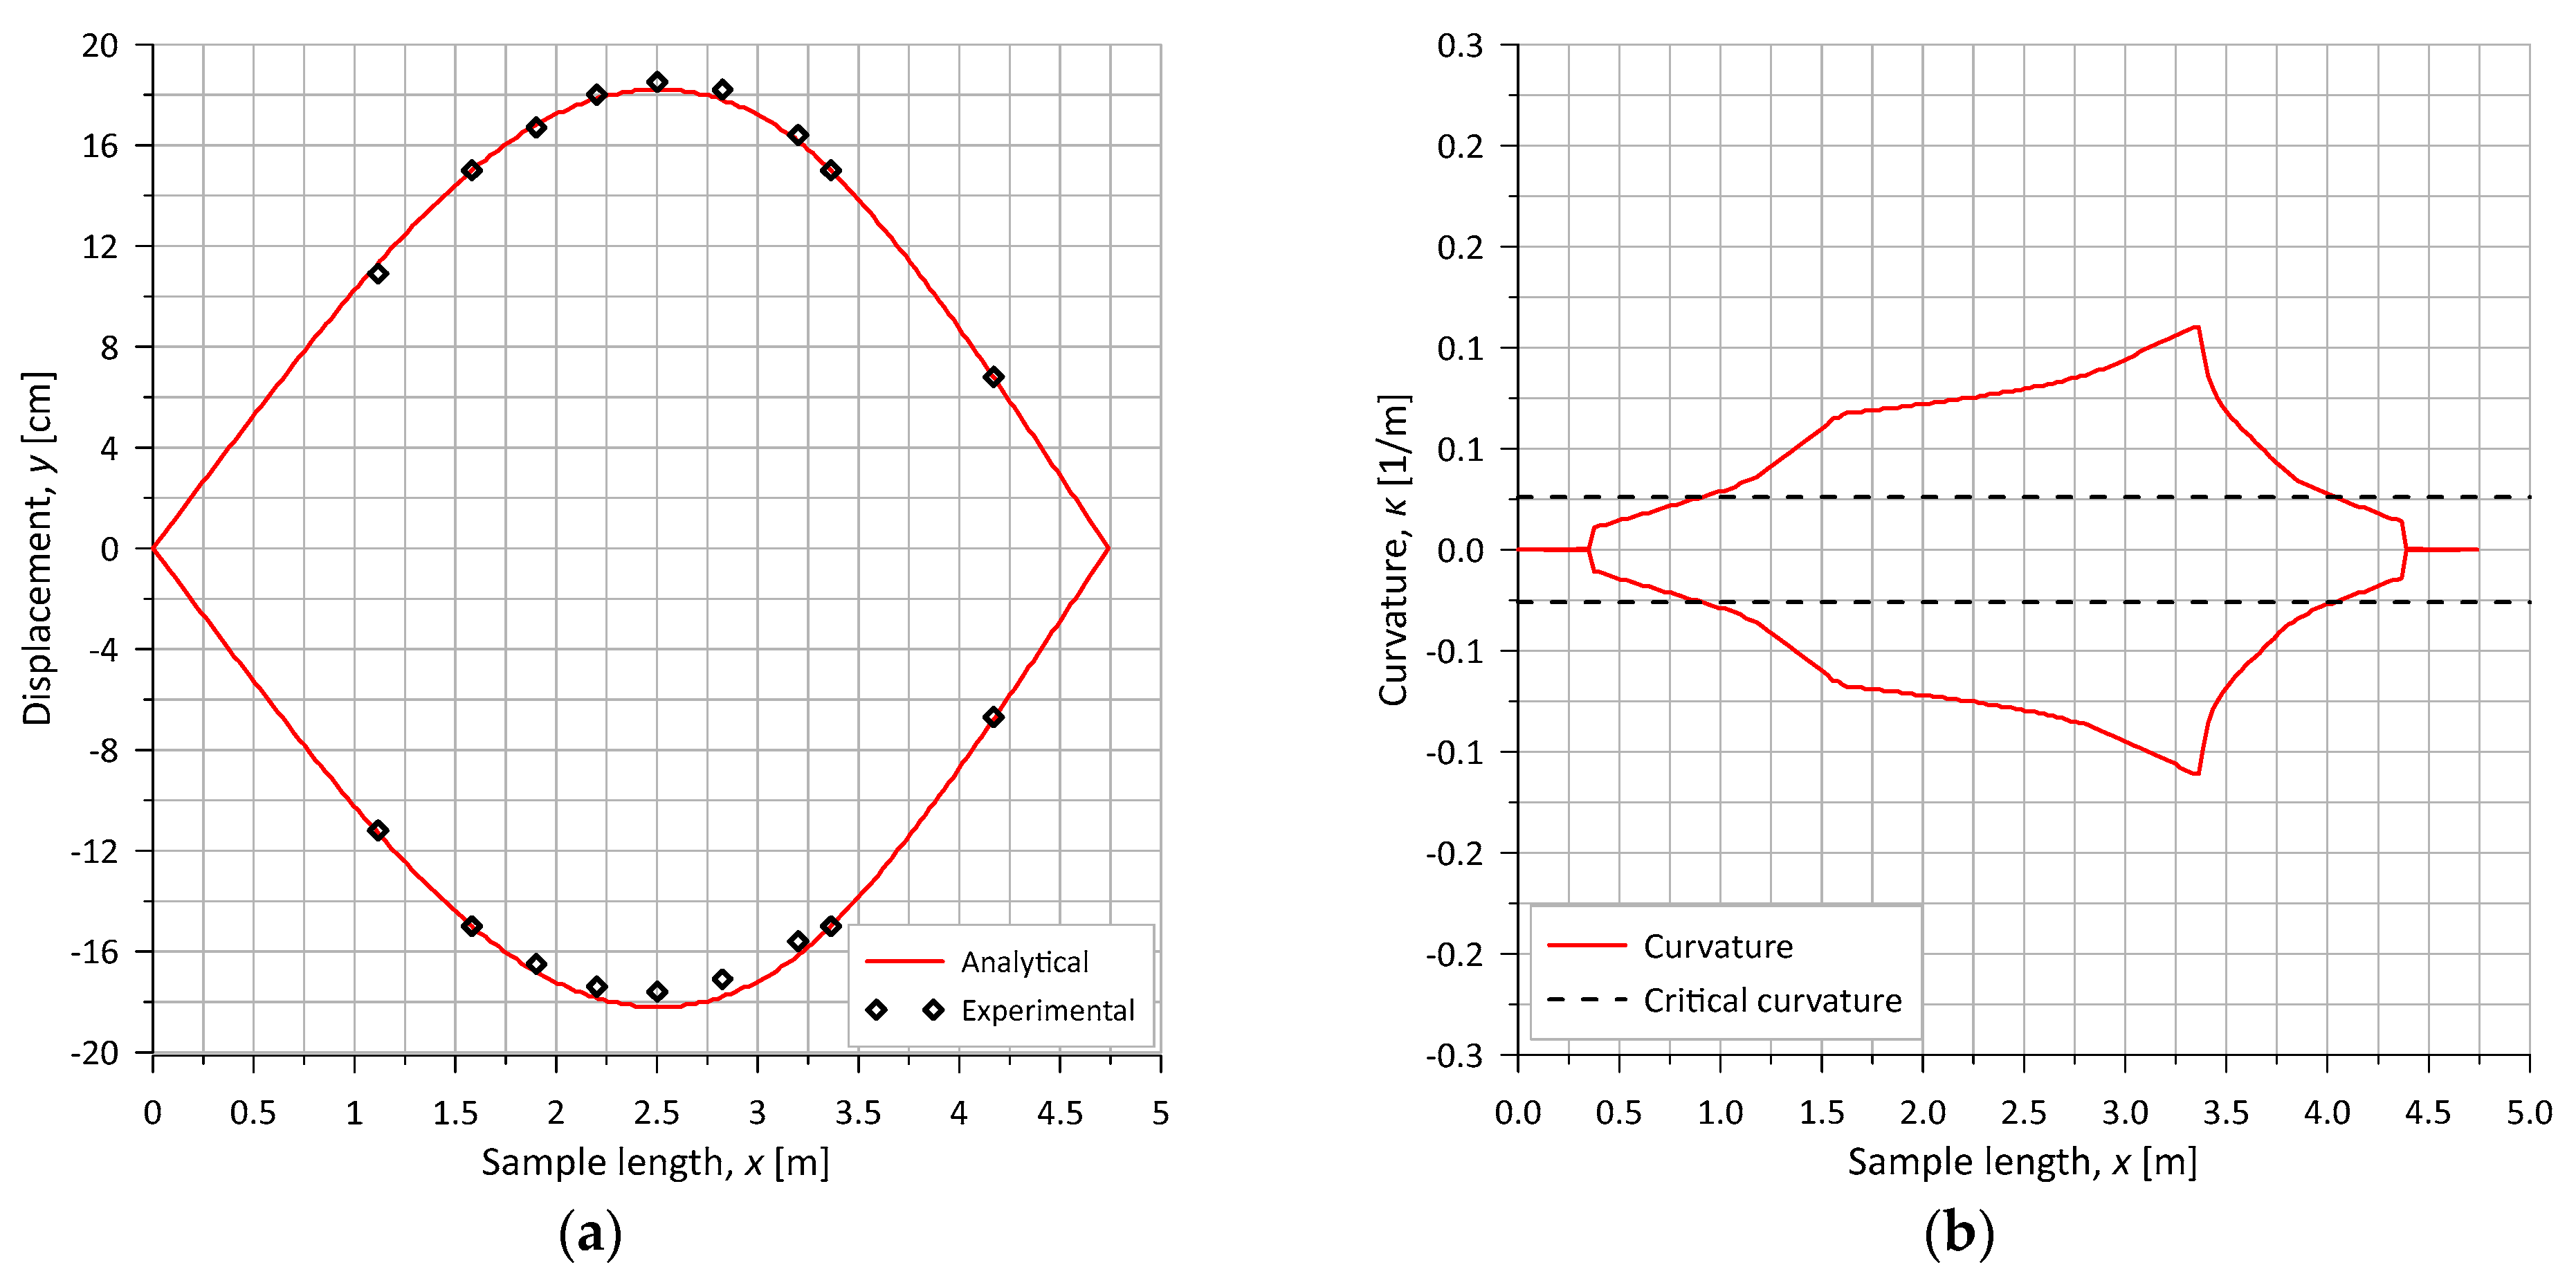
Hence, by considering an initial adhesion of 0.9 MPa and a friction coefficient of 0.05, Figure 20 compares the measured force versus transverse displacement relation with the numerically predicted curve, evidencing good agreement between them. Moreover, Figure 21a shows the transverse displacements measured along the pipe sample during the test and the numerically predicted deformed configuration, which also agreed quite well. Finally, Figure 21b illustrates the variation in curvature along the pipe, indicating the presence of no-slip and slip zones. A pronounced nonlinear variation in curvature can be depicted.
In the literature, some studies address the modeling of bending in flexible pipes, but they typically rely on a limited number of experimental tests. For example, Dong et al. [36] applied an analytical bending model proposed by Kebadze and Kraincanic [37] to evaluate the response of a bending test performed by Witz [11] on a 2.5″ flexible pipe under internal pressures of 0 and 30 MPa. A friction coefficient of 0.1 was used, but to better match the experimental results, particularly at low internal pressures, an initial contact pressure of 1.5 MPa was introduced. Both Dai et al. [40] and Wang et al. [41] developed numerical models based on the test reported by Saevik [24], involving a 4″ pipe subjected to internal pressures of 0.7, 10, and 20 MPa. In Dai et al. [40], different friction coefficients were fitted for each pressure level: 0.26, 0.23, and 0.21 for 0.7, 10, and 20 MPa, respectively. Additionally, an initial strain of 0.02 was applied to the tensile armor tendons to simulate the pre-tension between layers and better replicate the hysteresis observed in the experiments. Using the same friction values as Dai et al. [40], Wang et al. [41] investigated the effects of residual strain in the tensile armor, as well as the influence of an initial contact pressure of 2 MPa applied to the outer sheath, aiming to improve the simulation of initial interlayer friction. This study also included analytical model results incorporating the 2 MPa outer sheath pressure. In another study, Ye et al. [38] compared the results of a numerical model with experimental data for a 4″ pipe, determining an interlayer friction coefficient of 0.088 through regression analysis. Although discrepancies were noted under low contact pressure conditions, no specific mechanism was proposed to account for them in the model. Lastly, de Sousa et al. [30] employed a numerical model to study torsion in a 9.13″ flexible pipe. To improve agreement with experimental data, an adhesion value of 5 MPa was applied to all interfaces, alongside a friction coefficient of 0.1.
Consequently, there is significant variation in the values assigned to the interlayer friction coefficient. Due to the limited number of tests, as well as differences in pipe diameter, materials, and manufacturing processes, these values are not directly comparable. Nonetheless, they offer a general indication of the expected range. It is also important to highlight that the adjustment of the friction coefficient depends on how the initial contact pressure is implemented in the model, or whether it is considered at all. For example, a relatively low friction coefficient of 0.05 may be used in conjunction with a high adhesion value of 0.9 MPa. In the proposed model, as described in Equation (8), adhesion is incorporated directly into the stiffness calculation, rather than being treated as an increase in contact pressure (which, in some other models, is multiplied by the friction coefficient).

4.4. Bending Combined with Internal Pressure and Tension (T1-3 to T1-8)

This section presents the results from tests conducted on the sample under six combinations of bending, internal pressure, and tension. Figure 22 shows that the deformed shape of the sample remains relatively unchanged under different test conditions, as the tests were displacement-controlled, with the sample subjected to the same transverse displacement at the force application points. The measured transverse displacements show good correlation with the model predictions.
Regarding the curvatures, the inclusion of an axial load in the tests reveals a distinct change in the curvature profile, as shown in Figure 23. The axial force tends to straighten the sample, resulting in higher curvatures in the sections near the points of force application (actuators), where stiffness transitions occur. In contrast, the curvatures exhibit a more gradual change in scenarios without axial load, as illustrated in Figure 16 and Figure 21b.
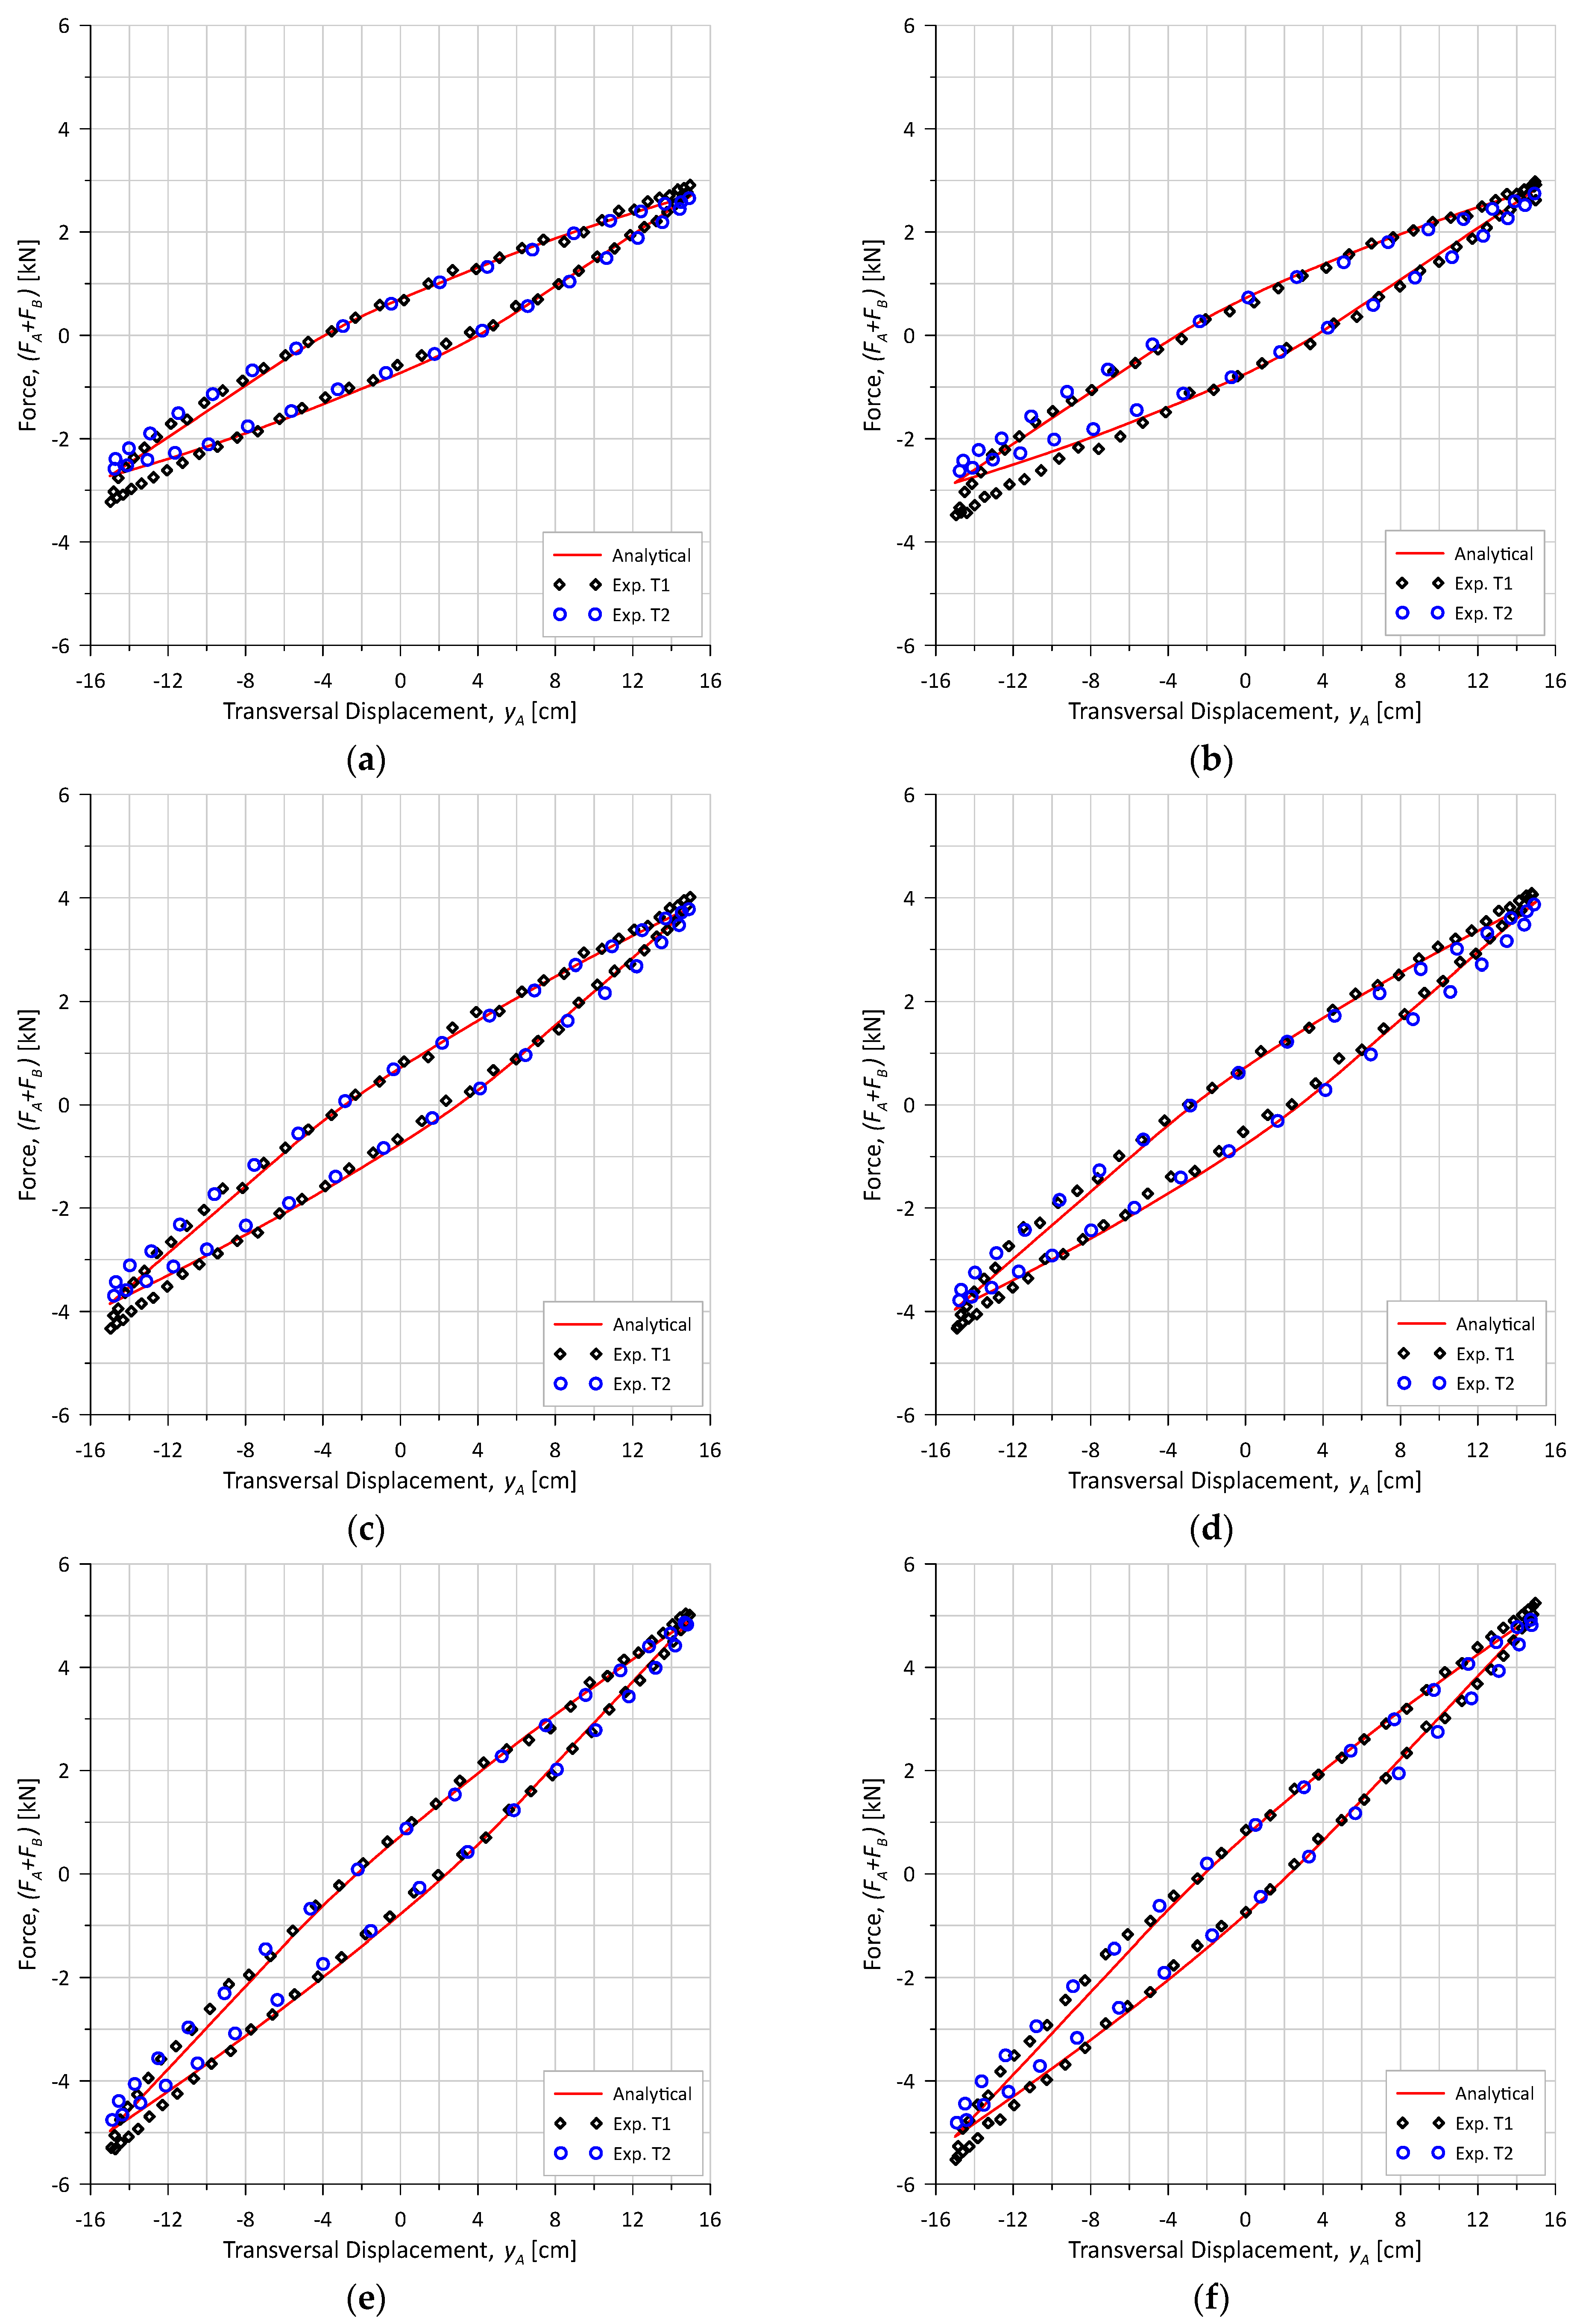
Figure 24 compares the relationship between force and transversal displacement obtained in the experimental tests with those predicted by the proposed model, while Table 10 indicates, for each of the conditions simulated, the imposed force ratio, the energy dissipation ratio, and the correlation coefficient R 2 . The results obtained show a very good agreement between the experimental tests and the model predictions.
In contrast to the cases without axial load (as shown in Figure 14 and Figure 20), the forces required to cycle the sample are notably higher due to the significant influence of the axial load, which outweighs the impact of internal pressure. Furthermore, the forces observed in cases with the same axial load remain nearly constant, even with the increase in pressure from 100 bar to 200 bar. This can be attributed to the low friction coefficient used in the model, which is associated with a high adhesion value.

4.5. Bending Tests After Degradation (T2-9 to T2-16)

After the T1 tests (1 to 8) were conducted, the sample underwent an 18-month degradation period during which the pipe was maintained with a flooded annulus containing saturated water at 1 bar CO2 and 40 °C. Tests were then repeated (T2—9 to 16), and the response was found to be very similar. The same parameters were used to calibrate the model. Figure 22 and Figure 24 present results before and after degradation.
Despite being subjected to relatively harsh conditions designed to accelerate the degradation of both the tensile armor and polymeric layers, the impact of degradation over time on stiffness appears to be negligible. This indicates that the hysteresis curve employed, e.g., for fatigue analysis (assuming an environment that is equally severe or less severe than the one tested), does not necessitate any updates and remains valid throughout the service life of the pipe. Therefore, the experimental tests suggest that only a single bending stiffness vs. curvature curve can be used, consistent with current design practices, to determine the overall response of the flexible pipe.
However, degradation of the wires results in changes to their material condition, necessitating the consideration of new fatigue curves that indicate a shorter service life for the same overall response. In Coser et al. [56], wire samples were subjected to similar conditions that led to the degradation of the test samples, followed by four-point bending fatigue tests. A comparison of the results with those from non-degraded wires clearly revealed a significant reduction in fatigue resistance. A full-scale test further validated these findings. Additionally, Krishman et al. [57] demonstrated the reduction in fatigue life by inducing controlled pitting corrosion through an electromechanical method, comparing the resulting curves of pitted wires with those from new wires. The curves for the corroded wires exhibited a reduction in fatigue life of approximately 2.6 to 2.7 times.

5. Conclusions

In this study, the global response of a flexible pipe under combined axisymmetric and bending loads was investigated through experimental tests and theoretical modeling.
The experiments were performed on a 2.5″ flexible pipe. The materials of its inner and outer sheaths were first characterized through tensile tests. The pipe was then subjected to combined axisymmetric and cyclic bending loads using a controlled displacement four-point bending setup, under both non-degraded and degraded conditions. The latter involved flooding the annulus and exposing the tensile armors to CO2-saturated water at 1 bar and 40 °C for 18 months. In all cases, transverse displacements were measured under constant axisymmetric loads, revealing significant hysteretic responses.
Theoretical analyses incorporated existing approaches to predict the monotonic response of flexible pipes under combined axisymmetric and bending loading. The bending formulation was modified to include initial interlayer adhesion, and the models were implemented in a return algorithm to reproduce hysteretic behavior. A finite-difference (FD)-based model was then developed, coupling axisymmetric and cyclic bending responses and integrating the proposed algorithm for cyclic loading. The incorporation of the local into the global model was also discussed in detail.
Theoretical and experimental results showed excellent agreement, accurately reproducing the cyclic response of the pipe. The analyses confirmed that the global response is strongly influenced by interlayer parameters such as adhesion and friction. Increasing these parameters raised the required bending forces until a no-slip condition was reached, beyond which the response stabilized. Energy dissipation varied nonlinearly with friction, peaking at partial slip and vanishing under full-slip conditions, while the adopted parameters (0.9 MPa of initial adhesion and a friction coefficient of 0.05) provided a reasonable approximation. Moreover, tests under degraded conditions showed that, despite wire corrosion, the overall mechanical response remained essentially unchanged, indicating that the global behavior of the riser is not significantly affected under the imposed degradation scenario.
The proposed methodology can be implemented in finite element (FE) models using conventional software, providing an alternative to traditional global analysis tools for flexible pipes and offering the potential for extension to three-dimensional applications. The findings also supply valuable data for model calibration and design guidance, highlighting the importance of accounting for initial adhesion and interlayer friction effects. Nonetheless, further research is needed to improve the quantification of interface parameters, incorporate possible viscous contributions to energy dissipation, and evaluate the influence of interface degradation on the fatigue life of flexible pipes.

Author Contributions

Conceptualization, B.d.P.M.d.C., N.R. and J.R.M.d.S.; methodology, B.d.P.M.d.C., J.R.M.d.S. and N.R.; validation, B.d.P.M.d.C., N.R. and J.R.M.d.S.; formal analysis, J.R.M.d.S.; investigation, E.R. and B.d.P.M.d.C.; data curation, E.R. and B.d.P.M.d.C.; writing—original draft preparation, B.d.P.M.d.C. and E.R.; writing—review and editing, N.R. and J.R.M.d.S.; supervision, N.R. and J.R.M.d.S. All authors have read and agreed to the published version of the manuscript.

Funding

This work was partially supported by the Brazilian funding agencies CNPq (Conselho Nacional de Desenvolvimento Científico e Tecnológico), grant number 308625/2022-6 and CAPES (Coordenação de Aperfeiçoamento de Pessoal de Nível Superior), finance code 001.

Data Availability Statement

Restrictions apply to the availability of the input data employed to generate the numerical models. Such data was obtained from Petrobras (the Brazilian state oil company) and cannot be disclosed due to confidentiality issues. The output data from the results of the analyses are available from the corresponding author upon reasonable request.

Acknowledgments

The authors would like to acknowledge the support of Petrobras (the Brazilian state oil company), which actively boosts research activities and encourages using innovative computational tools in real-life situations.

Conflicts of Interest

Author Bernardo de P. M. da Costa is employed by Petrobras. The remaining authors declare that the research was conducted in the absence of any commercial or financial relation that could be construed as a potential conflict of interest.

References

  1. API SP 17J; Specification for Unbonded Flexible Pipe. 5th ed. American Petroleum Institute: Washington, DC, USA, 2024.
  2. Lobo, C.V.F.; Ribeiro, M.L. SCC-CO2 Failure Mode: Literature Review and Available Technologies Used to Inspect and Access the Integrity of the Flexible Pipes. In Proceedings of the Offshore Technology Conference (OTC), Houston, TX, USA, 1–4 May 2023. [Google Scholar]
  3. MacLeod, I.; Picksley, J.; Cruickshank, K. Flexible Pipe Integrity Management Guidance & Good Practice; Rev. 05; Wood: Aberdeen, Scotland, UK, 2023. [Google Scholar]
  4. Larsen, C.M.; Saevik, S.; Qvist, J. Design analysis. In Handbook on Design and Operation of Flexible Pipes; Part B; Fergestad, D., Lotveit, S.A., Eds.; NTNU/4Subsea/SINTEF Ocean: Trondheim, Norway, 2017. [Google Scholar]
  5. Custódio, A.B.; Vaz, M.A. A Nonlinear Formulation for the Axisymmetric Response of Umbilical Cables and Flexible Pipes. Appl. Ocean Res. 2002, 24, 21–29. [Google Scholar] [CrossRef]
  6. Féret, J.J.; Bournazel, C.L. Calculation of Stresses and Slip in Structural Layers of Unbonded Flexible Pipes. J. Offshore Mech. Arct. Eng. 1987, 109, 263–269. [Google Scholar] [CrossRef]
  7. Batista, R.C.; Bogarin, J.A.; Ebecken, N.F.F. Local Mechanical Behaviour of Multilayered Flexible Risers. In Proceedings of the 7th Symposium on Offshore Engineering, Rio de Janeiro, Brazil, 21–25 August 1989; pp. 494–510. [Google Scholar]
  8. Love, A.E.H. A Treatise on the Mathematical Theory of Elasticity, 4th ed.; Cambridge University Press: London, UK, 2017; ISBN 978-1107618091. [Google Scholar]
  9. Witz, J.A.; Tan, Z. On the Axial-Torsional Structural Behaviour of Flexible Pipes, Umbilicals and Marine Cables. Mar. Struct. 1992, 5, 205–227. [Google Scholar] [CrossRef]
  10. McIver, D.B. A Method of Modelling the Detailed Component and Overall Structural Behaviour of Flexible Pipe Sections. Eng. Struct. 1995, 17, 254–266. [Google Scholar] [CrossRef]
  11. Witz, J.A. A Case Study in the Cross-Section Analysis of Flexible Risers. Mar. Struct. 1996, 9, 885–904. [Google Scholar] [CrossRef]
  12. Ramos, R., Jr.; Martins, C.A.; Pesce, C.P.; Roveri, F.E. A Case Study on the Axial-Torsional Behavior of Flexible Risers. In Proceedings of the 27th International Conference on Offshore Mechanics and Arctic Engineering (OMAE 2008), Estoril, Portugal, 15–20 June 2008. [Google Scholar]
  13. de Sousa, J.R.M.; Magluta, C.; Roitman, N.; Campello, G.C. On the Extensional-Torsional Response of a Flexible Pipe with Damaged Tensile Armor Wires. Ocean Eng. 2018, 161, 350–383. [Google Scholar] [CrossRef]
  14. Liu, J.; Tan, Z.; Sheldrake, T. An Analytical Model for the Unbonded Flexible Pipe Stress Analysis with Consideration of Nonlinear Material Properties of Metal Layers. In Proceedings of the 29th International Conference on Offshore Mechanics and Arctic Engineering (OMAE 2010), Shanghai, China, 6–11 June 2010. [Google Scholar]
  15. Liu, J.; Ma, J.; Vaz, M.A.; Duan, M. Viscoelastic Damping of Flexible Risers: Theoretical Model. Ocean Eng. 2020, 217, 107974. [Google Scholar] [CrossRef]
  16. Ramos, R., Jr.; Kawano, A. Local Structural Analysis of Flexible Pipes Subjected to Traction, Torsion and Pressure Loads. Mar. Struct. 2015, 42, 95–114. [Google Scholar] [CrossRef]
  17. Lu, H.; Vaz, M.A.; Caire, M. Alternative Analytical and Finite Element Models for Unbonded Flexible Pipes under Axisymmetric Loads. Ocean Eng. 2021, 225, 108766. [Google Scholar] [CrossRef]
  18. de Sousa, J.R.M.; dos Santos, A.C. Symbolic Regression Equations to Predict the Maximum Stress Concentration Factors in Flexible Pipes with Damaged Tensile Armors. In Proceedings of the ASME 43rd International Conference on Offshore Mechanics and Arctic Engineering (OMAE 2024), Singapore, 9–14 June 2024. [Google Scholar]
  19. Li, X.; Jiang, X.; Hopman, H. Predicting the Wet Collapse Pressure for Flexible Risers with Initial Ovalization and Gap: An Analytical Solution. Mar. Struct. 2020, 71, 102732. [Google Scholar] [CrossRef]
  20. Gay Neto, A.; Martins, C.A.; Pesce, C.P.; Meirelles, C.O.C.; Malta, E.R.; Barbosa Neto, T.F.; Godinho, C.A.F. Prediction of Burst in Flexible Pipes. J. Offshore Mech. Arct. Eng. 2013, 135, 011401. [Google Scholar] [CrossRef]
  21. Liu, Y.; Wu, Q.; He, J.; Liu, Q.; Li, M.; Wang, G. Coupled Burst and Fracture Failure Characteristics of Unbonded Flexible Riser under Internal Pressure and Axial Tension. J. Mar. Sci. Eng. 2025, 13, 1866. [Google Scholar] [CrossRef]
  22. Saevik, S.; Thorsen, M.J. Techniques for Predicting Tensile Armour Buckling and Fatigue in Deep Water Flexible Pipes. In Proceedings of the ASME 31st International Conference on Offshore Mechanics and Arctic Engineering (OMAE 2012), Rio de Janeiro, Brazil, 1–6 July 2012. [Google Scholar]
  23. Li, X.; Vaz, M.A.; Custódio, A.B. Analytical Model for Tensile Armors Lateral Deflections and Buckling in Flexible Pipes. Mar. Struct. 2019, 64, 211–228. [Google Scholar] [CrossRef]
  24. Saevik, S. Theoretical and Experimental Studies of Stresses in Flexible Pipes. Comput. Struct. 2011, 89, 2273–2291. [Google Scholar] [CrossRef]
  25. Muñoz, H.E.M.; de Sousa, J.R.M.; Magluta, C.; Roitman, N. Improvements on the Numerical Analysis of the Coupled Extensional-Torsional Response of a Flexible Pipe. J. Offshore Mech. Arct. Eng. 2016, 138, 011701. [Google Scholar] [CrossRef]
  26. Yoo, D.H.; Jang, B.S.; Yim, K.H. Nonlinear Finite Element Analysis of Failure Modes and Ultimate Strength of Flexible Pipes. Mar. Struct. 2017, 54, 50–72. [Google Scholar] [CrossRef]
  27. Malta, E.R.; Martins, C.A. Finite Element Analysis of Flexible Pipes under Axial Compression: Influence of the Sample Length. J. Offshore Mech. Arct. Eng. 2017, 139, 011701. [Google Scholar] [CrossRef]
  28. Lukassen, T.V.; Gunnarsson, E.; Krenk, S.; Glejbol, K.; Lyckegaard, A.; Berggreen, C. Tension-Bending Analysis of Flexible Pipe by a Repeated Unit Cell Finite Element. Mar. Struct. 2019, 64, 401–420. [Google Scholar] [CrossRef]
  29. Provasi, R.; Toni, F.G.; Martins, C.A. Friction Coefficient Influence in a Flexible Pipe: A Macroelement Model. Ocean Eng. 2022, 266, 112719. [Google Scholar] [CrossRef]
  30. de Sousa, J.R.M.; Magluta, C.; Roitman, N.; Londoño, T.V.; Campello, G.C. A Study on the Response of a Flexible Pipe to Combined Axisymmetric Loads. In Proceedings of the ASME 2013 32nd International Conference on Ocean, Offshore and Arctic Engineering (OMAE 2013), Nantes, France, 9–14 June 2013. [Google Scholar]
  31. de Sousa, J.R.M.; Sagrilo, L.V.S.; Rocha, D.M. Semi-Empirical Equations to Predict the Bisymmetric Dry and Wet Hydrostatic Collapse Strengths of Flexible Pipes. Appl. Ocean Res. 2022, 122, 1013129. [Google Scholar] [CrossRef]
  32. Cuamatzi-Melendez, R.; Castillo-Hernández, O.; Vázquez-Hernández, A.O.; Albiter, A.; Vaz, M.A. Finite Element Modeling of Burst Failure in Unbonded Flexible Risers. Eng. Struct. 2015, 87, 58–69. [Google Scholar] [CrossRef]
  33. Gay Neto, A.; Martins, C.A. Flexible Pipes: Influence of the Pressure Armor in the Wet Collapse Resistance. J. Offshore Mech. Arct. Eng. 2014, 136, 031401. [Google Scholar] [CrossRef]
  34. Axelsson, G.; Skjerve, H. Flexible Riser Carcass Collapse Analyses—Sensitivity on Radial Gaps and Bending. In Proceedings of the ASME 2014 33rd International Conference on Ocean, Offshore and Arctic Engineering (OMAE2014), San Francisco, CA, USA, 8–13 June 2014. [Google Scholar]
  35. Cuamatzi-Melendez, R.; Castillo-Hernández, O.; Vásquez-Hernández, A.O. Finite Element and Theoretical Analyses of Bisymmetric Collapses in Flexible Risers for Deepwaters Developments. Ocean Eng. 2017, 140, 195–208. [Google Scholar] [CrossRef]
  36. Dong, L.; Huang, Y.; Zhang, Q.; Liu, G. An Analytical Model to Predict the Bending Behavior of Unbonded Flexible Pipes. J. Ship Res. 2013, 57, 171–177. [Google Scholar] [CrossRef]
  37. Kebadze, E.; Krainkanic, I. Nonlinear Bending Behaviour of Offshore Flexible Pipes. In Proceedings of the Ninth International Offshore and Polar Engineering Conference (ISOPE), Brest, France, 30 May–4 June 1999. [Google Scholar]
  38. Ye, N.; Saevik, S.; Zhou, C. Investigation of Antiwear Tape’s Influence on Bending Behavior of One Flexible Riser. In Proceedings of the Twenty-fourth International Ocean and Polar Engineering Conference (ISOPE), Busan, South Korea, 15–20 June 2014. [Google Scholar]
  39. Kim, J.D.; Jang, B.S.; Yun, R.H. Application of Analytical Model in the Prediction of Dynamic Responses and Fatigue Damage of Flexible Risers: Part I—Improvement of Analytical Model Considering Shear Deformation and Varying Tension Effects. Mar. Struct. 2021, 79, 103044. [Google Scholar] [CrossRef]
  40. Dai, T.; Sævik, S.; Ye, N. Friction Models for Evaluating Dynamic Stresses in Non-Bonded Flexible Risers. Mar. Struct. 2017, 55, 137–161. [Google Scholar] [CrossRef]
  41. Wang, L.; Ye, N.; Yue, Q. A Novel Helix Contact Model for Predicting Hysteretic Behavior of Unbonded Flexible Pipes. Ocean Eng. 2022, 264, 112407. [Google Scholar] [CrossRef]
  42. Fang, P.; Li, X.; Jiang, X.; Hopman, H.; Bai, Y. Study of the Effects of Cross Section Shape on the Structural Behaviour of Helical Wires on a Bent Flexible Structure. In Proceedings of the 33rd International Ocean and Polar Engineering Conference (ISOPE), Ottawa, ON, Canada, 19–23 June 2023. [Google Scholar]
  43. Tang, M.; Li, S.; Zhang, H.; Bian, X.; Zhao, X. Monitoring the Slip of Helical Wires in a Flexible Riser under Combined Tension and Bending. Ocean Eng. 2022, 256, 111512. [Google Scholar] [CrossRef]
  44. Tan, Z.; Quiggin, P.; Sheldrake, T. Time Domain Simulation of the 3D Bending Hysteresis Behaviour of an Unbonded Flexible Riser. J. Offshore Mech. Arct. Eng. 2009, 131, 031301. [Google Scholar] [CrossRef]
  45. He, Y.; Lu, H.; Vaz, M.A.; Caire, M. Flexible Riser Connection Analysis with I-Tube Interface and Bending Hysteresis Effect. In Proceedings of the ASME 2019 38th International Conference on Ocean, Offshore and Arctic Engineering (OMAE2019), Glasgow, Scotland, UK, 9–14 June 2019. [Google Scholar]
  46. Dai, T.; Zhang, J.; Ren, C.; Xing, Y.; Saevik, S.; Ye, N.; Jin, X.; Wu, J. Application of a Data-Driven Approach for Maximum Fatigue Damage Prediction of an Unbonded Flexible Riser. Ocean Eng. 2024, 256, 118053. [Google Scholar] [CrossRef]
  47. Gundersen, P.; Doynov, K.; Andersen, T.; Haakonsen, R. Methodology for Determining Remnant Fatigue Life of Flexible Risers Subjected to Slugging and Irregular Waves. In Proceedings of the ASME 2012 31st International Conference on Ocean, Offshore and Arctic Engineering (OMAE 2012), Rio de Janeiro, Brazil, 1–6 June 2012. [Google Scholar]
  48. de Sousa, J.R.M.; de Sousa, F.J.M.; de Siqueira, M.Q.; Sagrilo, L.V.S.; de Lemos, C.A.D. A Theoretical Approach to Predict the Fatigue Life of Flexible Pipes. J. Appl. Math. 2012, 2012, 983819. [Google Scholar] [CrossRef]
  49. ASTM D638-22; Standard Test Method for Tensile Porperties of Plastics. American Society for Testing and Materials: West Conshohocken, PA, USA, 2022.
  50. Nitta, K.; Yam, M. Poisson’s Ratio and Mechanical Nonlinearity Under Tensile Deformation in Crystalline Polymers. In Rheology; de Vicente, J., Ed.; InTech: Vienna, Austria, 2012. [Google Scholar] [CrossRef]
  51. API RP 17B; Recommended Practice for Flexible Pipe, 6th ed. American Petroleum Institute: Washington, DC, USA, 2024.
  52. Sparks, C.P. Fundamentals of Marine Riser Mechanics: Basic Principles and Simplified Analyses, 1st ed.; PennWell Corp: Tulsa, OK, USA, 2007; ISBN 978-1-59370-070-6. [Google Scholar]
  53. Simo, J.C.; Hughes, T.J.R. Computational Ineslasticity; Springer: New York, NY, USA, 1998; ISBN 0-387-97520-0. [Google Scholar]
  54. Singh, A.K.; Bhadauria, B.S. Finite Difference Formulae for Unequal Sub-Intervals Using Lagrange’s Interpolation Formula. Int. J. Math. Anal. 2009, 3, 815–827. [Google Scholar]
  55. Mathcad, version 15.0; PTC Inc: Woburn, MA, USA, 2015.
  56. Coser, T.B.; de Negreiros, L.A.S.; Campelo, G.C.; Radke, E.D.; Rosa, C.D.; de Souza, D.F.; Rodrigues, L.F.V.; Renck, T.S.; Tagliari, M.R.; Borges, M.F. Flexible Pipe Fatigue Life Evaluation Based on a Dynamic Full-Scale Test Considering a Preconditioning Corrosion Procedure. In Proceedings of the ASME 2023 42nd International Conference on Ocean, Offshore and Artic Engineering (OMAE2023), Melbourne, Australia, 11–16 June 2023. [Google Scholar]
  57. Krishman, V.R.; Asher, S.; Kan, W.C.; Popelar, C. Effect of Piting Corrosion on Fatigue LIfe of Flexible Armor Wires. In Proceedings of the Twenty-sixth International Ocean and Polar Engineering Conference (ISOPE), Rhodes, Greece, 26 June–1 July 2016. [Google Scholar]
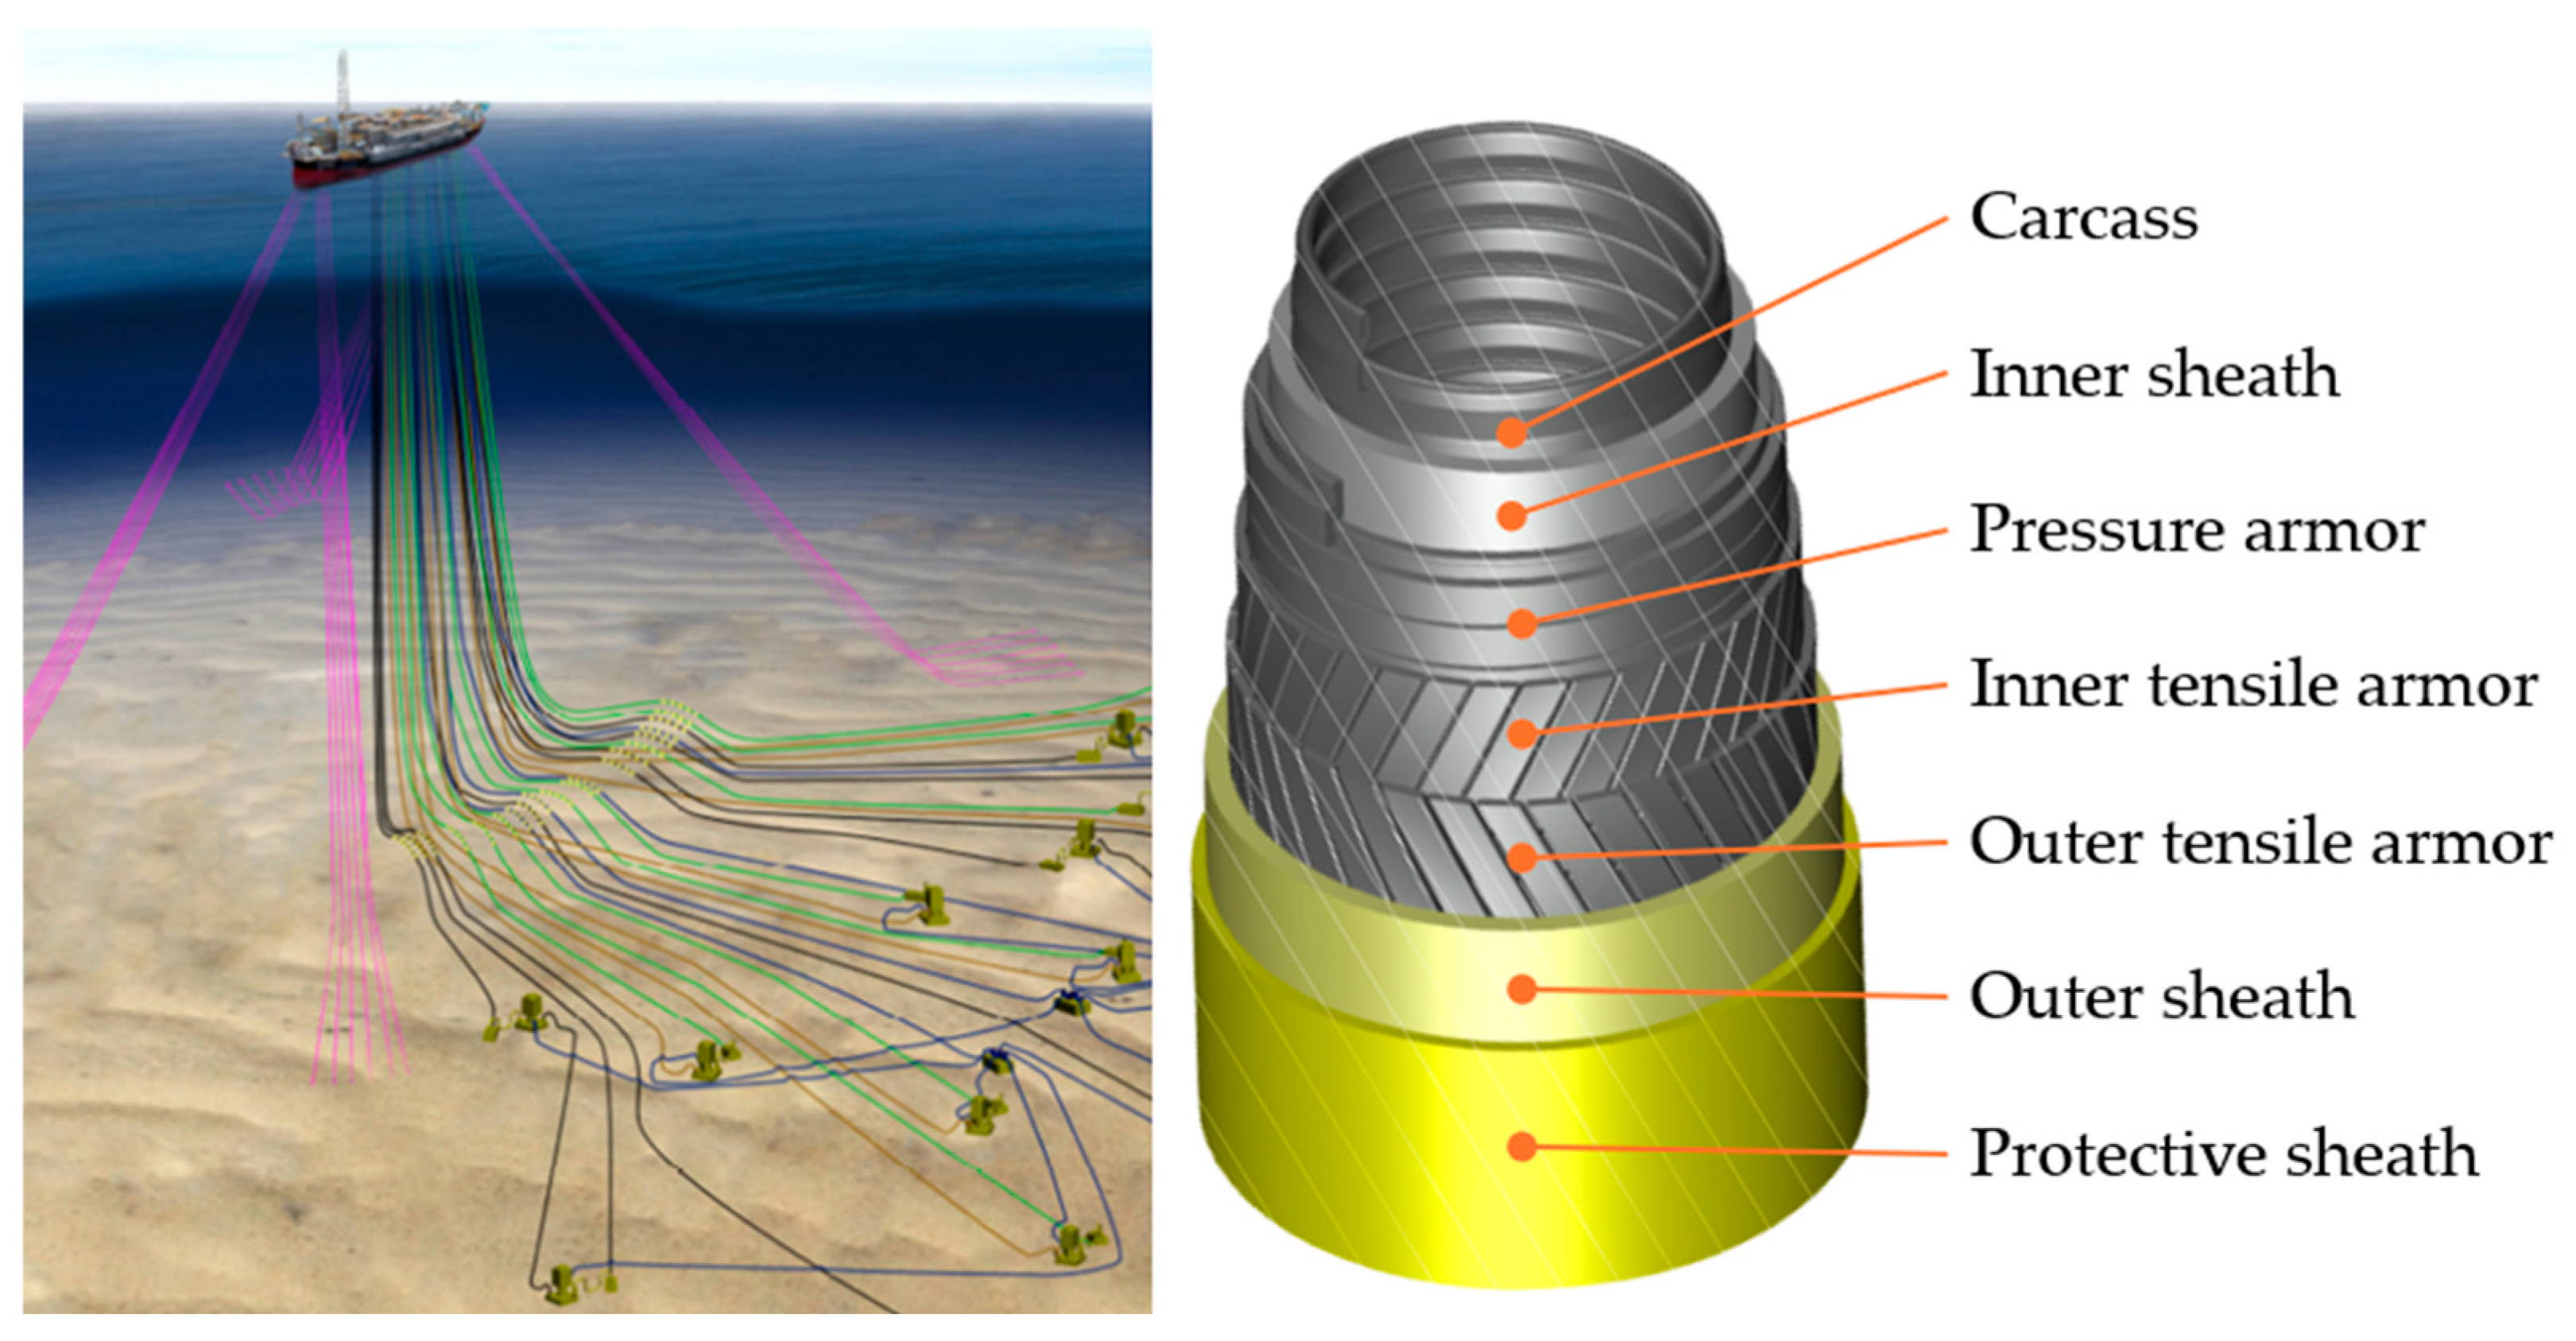
Figure 1. Subsea flexible pipe production system with a detail of the pipe’s internal layers.
Jmse 13 02180 g001
Figure 2. Moment vs. curvature in a typical flexible pipe.
Jmse 13 02180 g002
Figure 3. Experimental tests with the polymeric samples: (a) undeformed samples in the experimental tests and (b) deformed samples after the experimental tests.
Jmse 13 02180 g003
Figure 4. Experimental stress vs. strain curves: (a) inner and (b) outer sheath.
Jmse 13 02180 g004
Figure 5. Experimental apparatus: (a) 2.5″ flexible pipe mounted in the apparatus and (b) Schematic showing the main components.
Jmse 13 02180 g005
Figure 6. Heating system: (a) Electric trace positioning and (b) Thermal blankets.
Jmse 13 02180 g006
Figure 7. Piping for annulus flooding.
Jmse 13 02180 g007
Figure 8. Tensile armor angle α; and slip and stick zones in a flexible pipe cross-section.
Jmse 13 02180 g008
Figure 9. Moment vs. curvature relation in tensile armor.
Jmse 13 02180 g009
Figure 10. Adapted return-mapping algorithm for bending moment vs. curvature hysteretic response.
Jmse 13 02180 g010
Figure 11. Numerical model representation: (a) General view; (b) Discretization.
Jmse 13 02180 g011
Figure 12. Algorithm for response considering the hysteretic behavior of the flexible pipe.
Jmse 13 02180 g012
Figure 13. Variation in the pipe’s elongation with the resulting real axial tension: internal pressure test.
Jmse 13 02180 g013
Figure 14. Force vs. displacement relation: pure bending test (T1-1).
Jmse 13 02180 g014
Figure 15. Transverse displacements in the flexible pipe sample: pure bending test (T1-1), full stroke loading.
Jmse 13 02180 g015
Figure 16. Curvature and slippage occurrence (T1-1): full stroke.
Jmse 13 02180 g016
Figure 17. Force vs. displacement relation: pure bending test (T1-1) with different adhesion values.
Jmse 13 02180 g017
Figure 18. Required force due to adhesion.
Jmse 13 02180 g018
Figure 19. Energy dissipation ratio vs. adhesion.
Jmse 13 02180 g019
Figure 20. Force vs. displacement in T1-2 test.
Jmse 13 02180 g020
Figure 21. Displacements (a) and curvatures (b) in T1-2 test.
Jmse 13 02180 g021
Figure 22. Maximum displacements in tests T1-3 to T1-8 and T2-9 to T2-16 for (internal pressure/tension): (a) 100 bar/5 kN; (b) 200 bar/5 kN; (c) 100 bar/10 kN; (d) 200 bar/10 kN; (e) 100 bar/15 kN; (f) 200 bar/15 kN.
Jmse 13 02180 g022
Figure 23. Curvatures in tests T1-3 to T1-8 and T2-9 to T2-16 for (internal pressure/tension): (a) 100 bar/5 kN; (b) 200 bar/5 kN; (c) 100 bar/10 kN; (d) 200 bar/10 kN; (e) 100 bar/15 kN; (f) 200 bar/15 kN.
Jmse 13 02180 g023
Figure 24. Force vs. transverse displacement in tests T1-3 to T1-8 and T2-9 to T2-16 for (internal pressure/tension): (a) 100 bar/5 kN; (b) 200 bar/5 kN; (c) 100 bar/10 kN; (d) 200 bar/10 kN; (e) 100 bar/15 kN; (f) 200 bar/15 kN.
Jmse 13 02180 g024
Table 1. 2.5″ flexible pipe characteristics.
Layer
(Material)
Properties
Inner carcass
(Stainless 316 L)
Thickness = 3.50 mm, No. of tendons = 1, Lay angle = 87.7°,
Interlocked profile, Area = 16.00 mm2, Moment of inertia = 11.24 mm4,
Young modulus = 193 GPa, Poisson coefficient = 0.3
Internal plastic
(Polyamide 12)
Thickness = 5.00 mm,
Young modulus = 372 MPa, Poisson coefficient = 0.45
Pressure armor
(Carbon steel)
Thickness = 6.35 mm, No. of tendons = 1, Lay angle = 87.9°,
Z-profile, Area = 49.95 mm2, Moment of inertia = 186.29 mm4,
Young modulus = 205 GPa, Poisson coefficient = 0.30
Antiwear layer
(Polypropylene)
Thickness = 0.3 mm,
Young modulus = 350 MPa, Poisson coefficient = 0.30
Inner tensile armor
(Carbon steel)
Thickness = 2.01 mm, No. of wires = 43, Lay angle = 38°,
Rectangular profile, Width = 5.00 mm,
Young modulus = 205 GPa, Poisson coefficient = 0.30
Antiwear layer
(Polypropylene)
Thickness = 0.6 mm,
Young modulus = 350 MPa, Poisson coefficient = 0.30
Anti-buckling tape
(Glass filament)
Thickness = 0.81 mm,
Young modulus = 350 MPa, Poisson coefficient = 0.30
Antiwear layer
(Polypropylene)
Thickness = 0.30 mm
Young modulus = 350 MPa, Poisson coefficient = 0.30
Outer tensile armor
(Carbon steel)
Thickness = 2.01 mm, No. of wires = 47, Lay angle = 36°,
Rectangular profile, Width = 5.0 mm
Young modulus = 205 GPa, Poisson coefficient = 0.30
Antiwear layer
(Polypropylene)
Thickness = 0.30 mm,
Young modulus = 350 MPa, Poisson coefficient = 0.30
Anti-buckling tape
(Glass filament)
Thickness = 0.81 mm,
Young modulus = 350 MPa, Poisson coefficient = 0
Antiwear tape
(Polypropylene)
Thickness = 0.3 mm,
Young modulus = 350 MPa, Poisson coefficient = 0
Outer sheath
(HDPE)
Thickness = 6.55 mm
Young modulus = 622 MPa, Poisson coefficient = 0.45
Table 2. Experimental Young moduli of the polymeric sheaths.
TestYoung Modulus (MPa)
Inner Sheath (PA)Outer Sheath (PE)
1358601
2373650
3408619
4372577
5405644
6323640
7361-
Average372622
Std. deviation29.128.5
Table 3. Test matrix.
CampaignTest Internal   Pressure ,   P i n t [Bar] Axial   Load ,   T [kN]Annulus Degradation
T002002No degradation
T1100No degradation
22000
31005
410010
510015
62005
720010
820015
T290018 months—Flooded annulus with saturated water 1 bar CO2 at 40 °C
102000
111005
1210010
1310015
142005
1520010
1620015
Table 4. Contact pressures per test condition.
Internal   Pressure ,   P i n t
[bar]
Axial   Load ,   F
[kN]
Contact Pressures 1Corresponding Tests
Inner   Armor ,   P c I T A [MPa] Outer   Armor ,   P c O T A [MPa]
00001, 9
10053.341.223, 11
100103.631.314, 12
100153.911.405, 13
20005.932.052, 10
20056.212.146, 14
200106.502.237, 15
200156.792.328, 16
1 Sum of the contact pressures on the internal and external surfaces of the wires.
Table 5. Mesh sensitivity results.
Mesh n A n B n C n t F A [N] F B [N] F t o t a l [N]
110151033582.1851.51433.6
215201548582.9845.81428.7
330403098584.6838.21422.8
4608060198585.4834.71420.1
59012090298585.6833.61419.2
6120160120398585.7833.01418.7
Table 6. Load increment sensitivity results.
y t [mm] F A [N] F B [N] F t o t a l [N]
6.00584.98091393.9
3.00585.4834.71420.1
1.50585.7847.21432.9
1.00585.8851.41437.2
0.50586.0855.51441.5
0.25586.0857.51443.5
Table 7. Displacement comparison—Load increment sensitivity results.
Positive Stroke [mm]
Sensor#2#3#4#5#6
Experimental164181183179166
Full slip167177179175160
No slip167177179175160
τ0 = 0.5 MPa170182186181162
τ0 = 0.9 MPa168179183179162
τ0 = 1.2 MPa168179182178161
Negative Stroke [mm]
Sensor#2#3#4#5#6
Experimental158172178174165
Full slip160175179176167
No slip160175179176167
τ0 = 0.5 MPa162181186182170
τ0 = 0.9 MPa161179183179168
τ0 = 1.2 MPa161178182177167
Table 8. Adhesion sensitivity results.
τ 0 [MPa] κ c r [1/m] F m o d e l F e x p A m o d e l A e x p R 2
0.50.01070.5921.030.848
0.70.01500.7721.1310.963
0.80.01710.861.1170.988
0.90.01930.9461.0740.993
1.00.02141.0231.020.983
1.10.02361.0910.9670.961
1.20.02571.1480.9270.933
Table 9. Friction coefficient sensitivity analysis.
μ κ c r [1/m] F m o d e l F e x p A m o d e l A e x p R 2
00.0190.810.9190.982
0.030.0230.8900.9160.993
0.040.0240.9170.9100.992
0.050.0260.9420.9010.993
0.060.0270.9680.8890.984
0.070.0280.9920.8750.977
0.100.0321.0600.8200.945
Table 10. Adjusted model parameters vs. experimental results.
Test F m o d e l F e x p A m o d e l A e x p R 2
T1-10.9461.0740.993
T1-20.9420.9010.989
T1-30.8850.9970.990
T1-40.9181.0080.996
T1-50.9500.9540.997
T1-60.8740.9750.990
T1-70.9300.9920.995
T1-80.9380.9330.996
T2-91.0100.9650.984
T2-101.0821.0150.983
T2-111.0311.0250.994
T2-121.0200.9900.994
T2-131.0210.9820.995
T2-141.0571.0810.988
T2-151.0230.9480.993
T2-161.0310.8980.992
Disclaimer/Publisher’s Note: The statements, opinions and data contained in all publications are solely those of the individual author(s) and contributor(s) and not of MDPI and/or the editor(s). MDPI and/or the editor(s) disclaim responsibility for any injury to people or property resulting from any ideas, methods, instructions or products referred to in the content.