Abstract
Unbonded flexible risers are key components in offshore oil and gas production, enabling safe hydrocarbon transport under extreme deepwater conditions. The pressure armour (PA) layer is the primary metallic layer, which is designed to resist internal pressure; however, its complex helical geometry poses significant modelling challenges. This study presents a comprehensive numerical and analytical investigation of the burst behaviour of the PA layer under internal pressure. Three FE modelling strategies are developed and compared with theoretical predictions: a simplified axisymmetric 2D model, a fully detailed 3D helical model, and an efficient periodic boundary condition (PBC) model. The proposed PBC-based approach offers a practical balance between accuracy and efficiency, providing an effective tool for parametric analysis and design optimisation of flexible risers.
1. Introduction
Pipelines serve as vital infrastructure in offshore oil and gas developments, enabling the reliable transportation of hydrocarbons from subsea wells to processing facilities [1,2]. With the global expansion of deep and ultra-deepwater exploration, the demand for pipelines that can withstand harsh environments and heavy loads has greatly increased [3,4]. Among these, unbonded flexible risers have emerged as a critical technology due to their superior mechanical performance, geometric adaptability, and ease of installation in harsh offshore environments [5]. Unlike rigid pipelines, flexible risers are able to accommodate vessel motions, seabed irregularities, and thermal or pressure variations without significant structural damage, making them particularly suitable for deep-water field development [6]. Their internal architecture, schematically illustrated in Figure 1, is composed of metallic and polymeric layers. The metallic constituents primarily include the carcass, pressure armour, and tensile armour, while the polymeric components consist of the inner and outer sheaths together with anti-wear and high-strength anti-birdcage tapes.
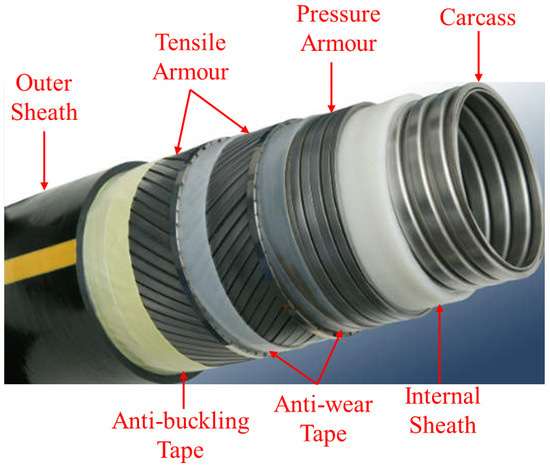
Figure 1.
Typical unbounded flexible pipe.
The hydrocarbon stream flows inside the carcass, which is enclosed by an inner polymer sheath that acts as a seal and prevents fluid from entering the space where the pressure and tensile armours are located [7,8]. Since the polymer sheath provides only sealing and does not contribute significantly to load-bearing, the entire internal pressure is transferred to the metallic pressure armour [9]. This makes the pressure armour the primary structural layer resisting burst failure, which is one of the most critical failure modes in flexible risers [10]. Failure of this layer can lead to catastrophic consequences such as hydrocarbon leakage, interruption of production, severe environmental damage, and high replacement and repair costs. For this reason, accurate prediction of burst resistance is of paramount importance in order to ensure safe and efficient offshore operations [11].
Early research efforts have attempted to predict the collapse and burst behaviour of risers through analytical formulations. Bournazel and Feret [12] introduced a simplified equilibrium approach to approximate internal pressure loading and to provide design guidelines. Oliviera et al. [13] extended this work by incorporating axial–circumferential interaction and structural deformation, thereby improving accuracy. Colquhoun et al. [14] adapted classical thin-walled cylinder theory with correction factors to capture the unique geometry of Z-shaped pressure armour profiles. Fernando et al. [15] later compared simplified 2D axisymmetric models with more detailed 3D representations that incorporated manufacturing-induced deformations, showing the limitations of purely analytical formulations. Zhu and Leis [16] proposed the average shear stress yield (ASSY) theory, positioned between the Tresca and von Mises criteria, noting that pipeline failures usually occur between these bounds. While von Mises is often adopted in commercial finite element codes as a conservative assumption, its direct application to the highly complex geometry of pressure armour layers remains questionable.
Building on these foundations, several authors proposed nonlinear models that consider both geometric and material nonlinearity. Neto et al. [17,18] introduced linear and nonlinear modelling approaches for the pressure armour, accounting for hardening behaviour, radial displacements, and thickness variations under internal pressure. More recently, Cuamatzi-Melendez et al. [19] investigated burst capacity by modelling only the inner sheath together with the pressure armour, validating their results against analytical solutions. O’Halloran et al. [20] explored the influence of internal pressure on fatigue performance, showing that it significantly reduces the predicted number of cycles to crack initiation in the pressure armour. Liu et al. [21] developed a finite element model of a 2.5-inch unbonded riser, combining stress distribution and deformation analyses with yield/ultimate stress theory to predict burst failure. Wei et al. [22] further investigated the unlocking mechanism of the pressure armour layer under internal pressure using 3D nonlinear FEM, showing that increasing internal pressure can promote interlock loss, leading to unlocking and eventual birdcage failure.
Although these contributions have advanced the understanding of flexible riser mechanics, significant challenges remain. Experimental testing of risers under burst conditions is extremely costly and time-consuming, and requires specialised facilities. Consequently, most available research relies on numerical simulations. However, fully detailed 3D FE simulations that explicitly capture interwire contact, friction, and geometric imperfections are computationally expensive and impractical for routine design or large parametric studies. As a result, researchers often use simplified equivalent models to reduce computational costs, but such approaches frequently compromise accuracy by neglecting key physical effects. Santos and Pesce [23] proposed a space-filling mesh scheme to represent voids between wires, validated against analytical and experimental data. While this method reduced simulation time, it did not adequately address the end-cap effect under internal pressure, leaving a gap in predictive reliability.
These limitations show the need for efficient and accurate modelling methods that can predict the burst pressure of the pressure armour layer without the high computational cost of fully detailed 3D models. In the present work, three FE modelling approaches are explored, and the results are compared with the theoretical equations. First, a 2D axisymmetric model is developed to capture the global stress distribution of the pipe under internal pressure in a highly efficient manner. Second, a fully detailed 3D model is constructed to reproduce the complete helical geometry of the pressure armour and provide a benchmark for accuracy. Finally, a simplified finite element framework based on periodic boundary conditions (PBCs) is proposed to represent an infinitely long pipe under internal pressure. The PBC approach is shown to combine the accuracy of the full model with the efficiency of the axisymmetric model, making it the most suitable choice for parametric studies and design optimisation.
By combining computational efficiency with physical accuracy, this study aims to provide a practical methodology for assessing burst failure in flexible risers, contributing to safer and more cost-effective offshore pipeline design.
2. Analytical Model
For a thick cylindrical layer with inner radius a, outer radius b, internal pressure and external pressure , the axial (longitudinal) stress, due to Timoshenko and Goodier [24], is
which is constant through the thickness. In this work, we adopt the open–ends boundary condition ().
The Lamé radial and circumferential (hoop) stresses at radius [25] are
For the common special case when there is no external pressure ()
and, at the inner surface
Given elastic data pairs , a through-origin least-squares estimate of the slope is
where, for the open–ends (plane–stress) case to be physically admissible with , one must have .
To relate the outer radius b to measurable section properties, Martins et al. [26] introduced an equivalent plate thickness based on bending–stiffness equivalence.
where ℓ is the effective strip width used in the plate equivalence, is the minimum principal second moment of area about the centroidal axes, and is a geometric factor defined here as
where x and s denote the characteristic axial repeat length of the interlocked profile and its axial pitch, respectively. On the other hand, the thickness links directly to the cylinder radii via
Substituting (10) into (6) yields a closed-form –p relation entirely in terms of The quantity is obtained from the eigenvalues of the symmetric inertia matrix.
where are the eigenvalues of . Finally, if a measured elastic slope is available (from (7)), one may invert (6) to infer the geometry: first solve
then recover
All formulas are dimensionally consistent.
3. Numerical Model
3.1. The Basics
The material data for the polyethylene (PE) layer were obtained from uniaxial tensile tests reported by Zhang et al. [4]. The corresponding true stress–strain curve, shown in Figure 2a, was directly implemented into the finite element model to capture both the elastic and plastic responses of the polymer material. For the pressure armour (PA) layer, the material was selected as stainless steel 316L [27]. The Young’s modulus was determined based on tensile tests performed by Krishna et al. [28], while, according to the findings of Yan et al. [29], the cold-worked and annealed 316L stainless steel exhibits a yield strength of approximately 900 MPa. No strain-hardening term was introduced (); therefore, the PA material was idealised as an elastic–perfectly plastic material, as shown in Figure 2b, to simplify the numerical implementation while accurately representing the yielding behaviour of metallic layers under high internal pressure [30]. This assumption also ensures consistency between the numerical and analytical predictions while preserving the load-carrying capacity of the PA layer. The complete set of elastic properties for both PE and PA layers is summarised in Table 1.
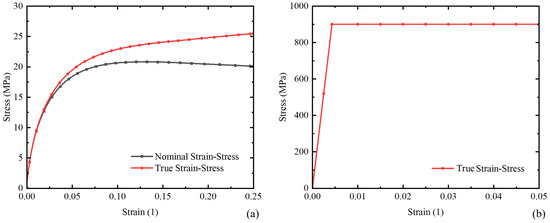
Figure 2.
Stress-strain curves (a) HDPE and (b) pressure armour steel.

Table 1.
Properties of the test specimen.
The pressure armour profile adopted in this study was selected in accordance with API 17B [31], which provides industry guidelines for flexible riser design. The detailed cross-sectional geometry of the Z-shaped armour is shown in Figure 3a. All critical dimensions and curvature radii are specified, highlighting the interlocking mechanism that ensures structural integrity under high internal pressure. The interlocking geometry of the PA layer and its corresponding pitch length are illustrated in Figure 3b. The thickness of the PE layer is considered to be 8 mm for the FE models. All finite element models are executed using ABAQUS/Standard 2024 [32], employing the Static General step with NLGEOM enabled.
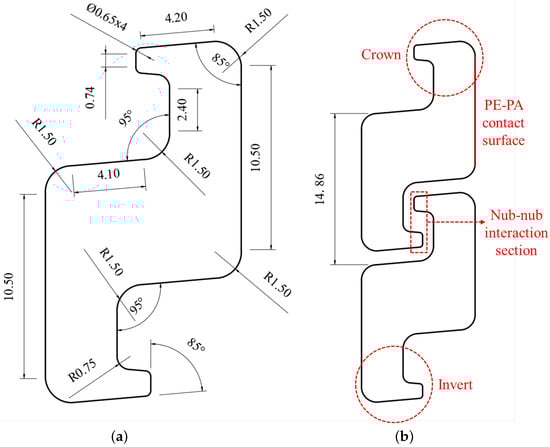
Figure 3.
Pressure armour geometry: (a) cross-section with dimensions (mm) and curvature radii (mm), with angles between contour lines indicated in degrees (°), showing the Z-shaped interlocking profile; (b) longitudinal section with pitch length (mm).
3.2. Axisymmetric Model
The pressure armour layer presents significant modelling challenges due to its pronounced geometric nonlinearity, which arises from the radial displacements of the Z-shaped profiles, the contact interactions between successive profiles, and the helical winding pitch. However, since the winding angle is close to 90°, this feature can be reasonably neglected, allowing the assumption of axisymmetry about the pipe’s longitudinal axis. Under this simplification, the loading conditions are considered uniform along the circumference of the pipe, enabling the use of a two-dimensional axisymmetric representation. In this model, the polymer sheath and the pressure armour were included, both modelled in a planar domain. To capture uniform stress distribution along the Z-profiles, the model incorporated three complete Z-profiles together with two half-profiles, following the approach of Cuamatzi-Melendez et al. [19], as illustrated in Figure 4.
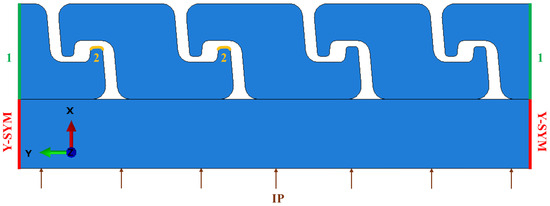
Figure 4.
Axisymmetric model of the PE and PA layers.
Internal pressure (IP) was applied along the inner surface of the polymer sheath. To reproduce the stress field within the Z-profile closures, boundary conditions were carefully defined. Y-symmetry was imposed on the PE layer boundaries to maintain circumferential continuity. A tie-constraint strategy was then employed to ensure consistent deformation across the PA cross-section. Two separate Tie constraints, as illustrated in Figure 4 (Pair 1 in green and Pair 2 in yellow), were introduced. The first ties the two vertical end surfaces of the PA profile, ensuring that the entire section deforms as a continuous strip without introducing artificial gaps or mismatched motion at the boundaries. The second ties the two interlocking nub surfaces, enforcing compatible displacement and rotation between the mating regions of the Z-shaped closure. In both cases, ABAQUS’s Tie option fully constrains all translational and rotational degrees of freedom of the secondary surface to follow the main surface, thereby preventing unintended relative sliding or separation in the 2D axisymmetric formulation. Both the PE and PA were meshed using CAX4R 4-node bilinear axisymmetric elements with reduced integration and hourglass control. Figure 5 shows the PA cross-section in its actual global coordinate orientation used in the FE model, together with its mesh details.
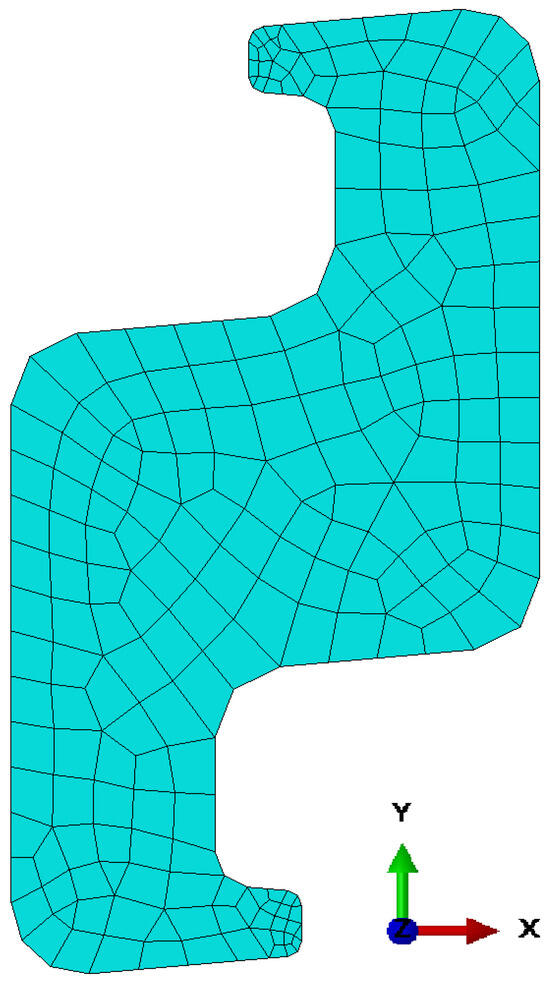
Figure 5.
Finite element mesh of the PA cross-section.
3.3. Full 3D Model
A 3D FE model of the interlocked pressure armour (PA) layer, including its pitch and lay angle, was established using the commercial software ABAQUS version 2024. To simulate load transfer, a polymer layer was added to the inside of the PA layer. The inner diameter of the pipe is 154 mm (6 inch). To minimise the influence of end effects on the results, several models with varying lengths were tested, and the model with a length approximately twice the outer diameter of the pipe was ultimately selected for analysis. Solid elements were used, and the material properties were applied based on the results of the previous section. The analysis was carried out as a geometrically nonlinear problem using the static general step. The layers were meshed with C3D8R elements (8-node linear brick, reduced integration, hourglass control), a standard element formulation in ABAQUS known for balancing accuracy and computational efficiency in both linear and nonlinear problems [33]. The general resulting mesh configuration of the pipe is depicted in Figure 6.
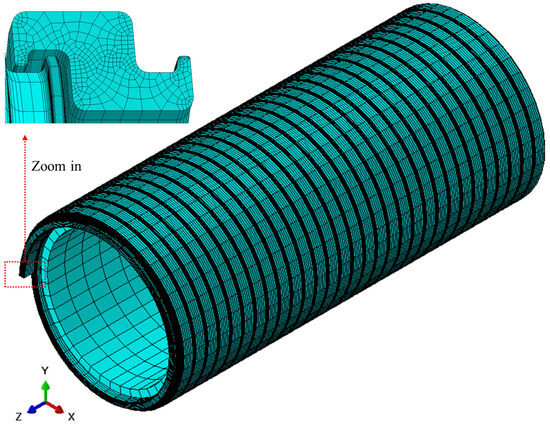
Figure 6.
Finite element mesh of the pipe.
Boundary conditions were applied to both ends of the pipe model, where all translational degrees of freedom were restricted, and internal pressure was applied to the inner surface of the PE layer, as illustrated in Figure 7. To prevent interpenetration between surfaces, general contact was defined across the entire model, with an additional explicit contact pair defined between the outer surface of the PE and the inner surface of the PA. The contact was modelled with hard pressure-overclosure behaviour in the normal direction and a penalty formulation in the tangential direction, allowing separation after contact. Based on experimental findings, the friction coefficient between the PA and PE was set to 0.15 [34], and between the armours is considered to be 0.1 [35].
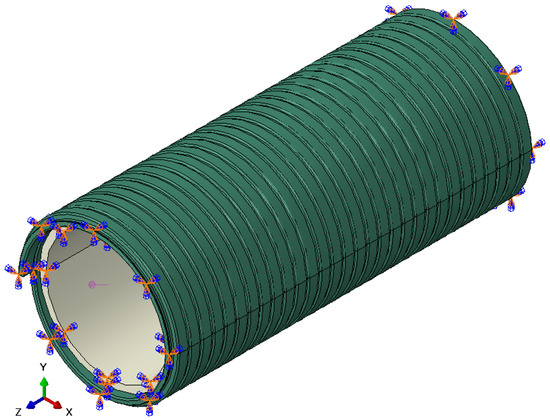
Figure 7.
Applied loads and boundary conditions.
3.4. PBC Model
Because full-length internal pressure simulations of flexible pipes are computationally prohibitive due to their complex multilayered structure, researchers have proposed efficient numerical strategies that exploit the periodic geometry of helical components, using periodic boundary conditions to represent infinitely long structures while minimising boundary effects. The concept of periodic boundary conditions (PBC) originates from multiscale analysis, where homogenization theory, often employing asymptotic expansions, has been applied to bridge the microscale and macroscale behaviours in slender beam-like structures, such as cables, flexible pipes, and helical ropes [36]. In the PBC model, the length is reduced as:
where , is the pitch length, is the number of helixes, and i denotes the sequence of the current layer.
A periodic boundary condition between two surfaces can be implemented in Abaqus by imposing an appropriate constraint between each corresponding pair of their nodes [37]. A single strip of the interlocked pressure armour is divided into two parts and modelled with contact interactions, as illustrated in Figure 8, which is sufficient to represent the behaviour of the entire pressure armour layer. In addition, the internal polymer layer is modelled inside the PA layer to transmit the applied internal pressure, while an outer sheath is introduced around the PA layer to replicate the functional role of the external sheath in a real flexible pipe and to restrain excessive radial expansion. Periodic boundary conditions were applied to both ends of the PA and PE layers to represent the repeating helical architecture of the flexible pipe. Specifically, the nodal displacements on one end of the model were coupled with those on the opposite end along the longitudinal direction, ensuring that deformation and stress fields were continuous and repeatable across the boundaries. This approach allows the model to simulate an infinitely long structure using only one representative segment, thereby eliminating artificial boundary effects and significantly reducing computational cost [38]. Moreover, to prevent rigid body motion and ensure numerical stability, both ends of the outer sheath were fully constrained in all degrees of freedom (DOFs).
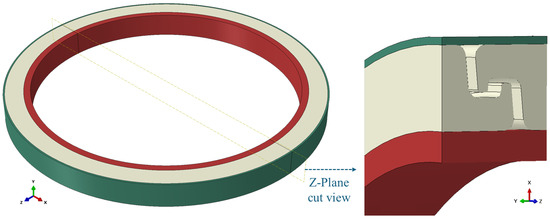
Figure 8.
The FE geometry of the PBC model.
To ensure reproducibility, the explicit multi-point constraint (MPC) equations are used in the PBC model. Each node on the boundary is paired with its corresponding node on the boundary such that
where is the rotation matrix corresponding to one helical pitch and is the circumferential advance of a single strip. This explicit node-pair formulation ensures that the stress, strain, and displacement fields are periodic, allowing for the unambiguous reproduction of the model.
The Static General step in ABAQUS was chosen, as it efficiently handles nonlinearities such as contact, plasticity, and large deformation, making it suitable for flexible pipe simulations. In this study, the step time used an initial increment size of 0.1, a minimum allowable increment of , and the default force residual tolerance of , providing stable convergence throughout the nonlinear loading process. The internal pressure was applied uniformly to the inner surface of the PE layer. Moreover, three surface-to-surface contact interactions were established to capture the interfacial behaviour between layers:
- (1)
- Between the PE and PA layers, a rough tangential formulation was applied with hard normal contact and separation allowed after contact. This choice ensures that the PE acts purely as a load transmitter without allowing unrealistic sliding at the interface, while still permitting detachment under high internal pressure [39].
- (2)
- Between the PA strips, a penalty tangential formulation was used with a friction coefficient of 0.1, while normal behaviour was defined as hard contact with separation allowed after contact. The penalty formulation with a calibrated friction coefficient reflects experimental observations of limited slip between PA strips and prevents artificial locking, consistent with the experimental results [34].
- (3)
- Between the PA and the outer sheath, a rough tangential formulation was employed with hard normal contact, but separation after contact was not permitted. This constraint was necessary to mimic the physical role of the outer sheath in resisting radial expansion and providing continuous confinement to the PA layer during pressurisation.
The PBC formulation represents an equivalent lay angle of 90°, consistent with published descriptions of pressure armour winding geometry [40]. Moreover, under pure internal pressure, shear transfer across interfaces is minimal and frictional effects on burst behaviour become secondary [41].
All layers were meshed using C3D8R elements, an 8-node linear brick element with reduced integration and hourglass control, which is widely recommended in ABAQUS for contact-dominated problems. This choice ensures reliable accuracy for nonlinear analyses while maintaining computational efficiency. The mesh details are shown in Figure 9.
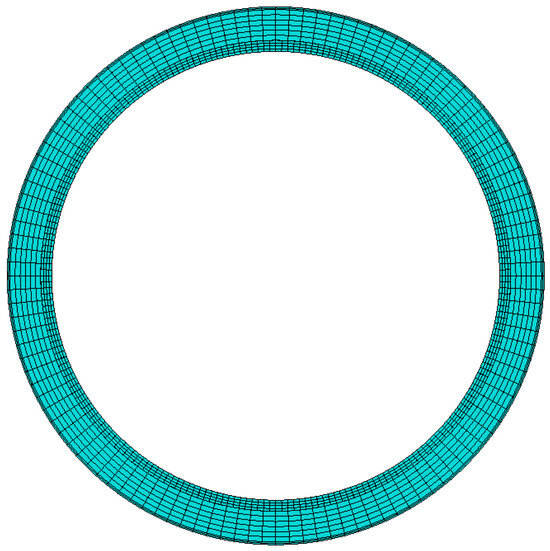
Figure 9.
The mesh schematic of the PBC model.
A mesh sensitivity analysis was performed using six different mesh densities to identify a suitable element size for the model. The predicted critical pressure stabilised once the mesh was refined below approximately 12–15 mm, and further refinement produced changes of less than 1%. Meshes coarser than this range (corresponding to fewer than about 28,800 elements in the PE layer, 21,600 in the PA layer, and 960 in the outer sheath) underpredicted the critical pressure by several percent due to insufficient resolution of the localised plastic deformation in the PA strips. In contrast, meshes with element sizes between 8 mm and 20 mm exhibited nearly identical pressure–response behaviour, indicating that the solution had reached mesh independence within this range. Based on this observation, an element size of 10 mm was selected as the optimal compromise between computational efficiency and numerical accuracy.
3.5. Results
Figure 10 presents the von Mises stress distribution obtained from the axisymmetric FE model under internal pressure. The stress field exhibits a fully periodic pattern along the circumferential direction, consistent with the repeated Z-shaped geometry of the pressure armour. Local stress concentrations develop at the crown regions of the Z-lock, where geometric curvature induces bending effects and governs the load transfer mechanism. Throughout loading, the polymer liner sustains comparatively low stress levels, confirming that the PA layer carries the dominant portion of the hoop stresses while the PE layer primarily functions as a stabilising internal sheath that transmits internal pressure to the metallic reinforcement. A small displacement in the X-direction is visible on the right boundary of the model; this results from the reduced stiffness of the half-modelled PA segment but is negligible and does not influence the global stress response or the predicted collapse pressure.
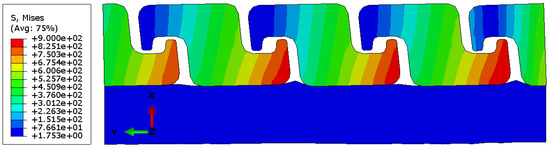
Figure 10.
Von Mises stress distribution in the axisymmetric FE model under internal pressure (unit: MPa).
Figure 11 presents the von Mises stress distribution from the full 3D FE model of the pipe section under internal pressure. High stress zones (in red) appear primarily at the contact interfaces and curved regions of the metallic interlocks, indicating these areas experience the greatest plastic deformation. In contrast, the PE liner experiences substantially lower stress levels, remaining far below its yield strength and acting mainly as a pressure-transmitting medium. Along the PA tips, the interlocked geometry efficiently carries hoop stresses but also generates critical stress hotspots that may trigger plastic deformation and potential instability.
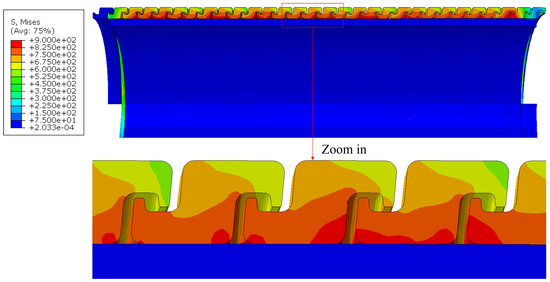
Figure 11.
Von Mises stress distribution in the full 3D FE model under internal pressure (unit: MPa).
Figure 12 shows the evolution of the von Mises stress distribution in the PBC finite element model of the Z-shaped closing profile when subjected to increasing internal pressure levels of approximately 25 MPa, 50 MPa, and 75 MPa. At the lowest internal pressure (a), the von Mises stresses are concentrated mainly at the inner corner of the interlocking region, while the rest of the cross-section remains in a relatively low-stress state. As the pressure increases (b), the overall stress pattern remains similar; however, the polymer begins to penetrate further into the PA cross-section. At the failure stage (c), this polymer penetration becomes more pronounced, which significantly increases the local contact pressure and drives deformation in the weaker section of the PA. Consequently, the von Mises stress reaches its maximum values (red zone) within the inner fillet and the load-bearing section of the interlock, indicating the regions most prone to yielding or damage initiation under pressurisation. The overall stress pattern remains symmetric and continuous, confirming that the boundary conditions realistically capture the mechanical response of the periodic structure.
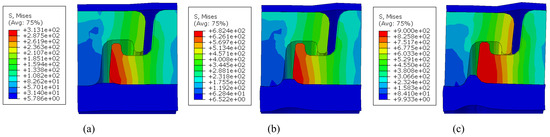
Figure 12.
Von Mises stress distribution in the PBC FE model under internal pressures of (a) 25 MPa, (b) 50 MPa, and (c) 75 MPa.
It is important to note that the stress distribution obtained from the PBC model (Figure 12) differs from that of both the full 3D helix (Figure 11) and the 2D axisymmetric model (Figure 10), because the three formulations represent fundamentally different physical assumptions. The full 3D model captures the behaviour of a finite-length helical reinforcement, including end effects, helix-induced bending, and non-uniform contact along the pitch; as a result, it produces a Lamé-type stress field with maximum von Mises stresses concentrated along the inner surface of the PA strip. In contrast, the PBC model represents an infinitely long, periodically repeating unit cell in which periodic constraints suppress global hoop deformation and eliminate end effects. This forces the stress field to become fully periodic and governed almost entirely by the local geometry of the Z-shaped interlock. Consequently, the PBC model localises its peak stresses at the locking tip—exactly where curvature, contact, and geometric constraint dominate the load transfer—rather than along the inner surface as in the full 3D helix. This localisation behaviour is also more consistent with the 2D axisymmetric representation, where hoop deformation is constrained and the stress field is driven primarily by profile curvature rather than helix bending.
Figure 13 compares the hoop stress response of the analytical model with the three FE approaches: the axisymmetric 2D model, the full 3D model, and the PBC model. All models exhibit a linear increase in von Mises stress with internal pressure until reaching the plastic region of the PA material. The axisymmetric 2D model predicts a significantly lower collapse pressure than the other approaches because its formulation cannot reproduce the inherently three-dimensional behaviour of the pressure armour. Moreover, the 2D model neglects lay-angle-induced bending–torsion coupling, the discrete Z-lock contact mechanism, and the shear transfer between adjacent strips—mechanisms that collectively provide substantial stiffness under internal pressure. In contrast, the full 3D model captures these effects explicitly, including geometric stiffening from the helix angle and localised compaction at the interlocking region, which results in a slightly higher predicted capacity than the analytical solution. The PBC model agrees closely with the analytical response and remains slightly below the full 3D prediction, as the periodic formulation suppresses end effects and pitch-induced deformation.
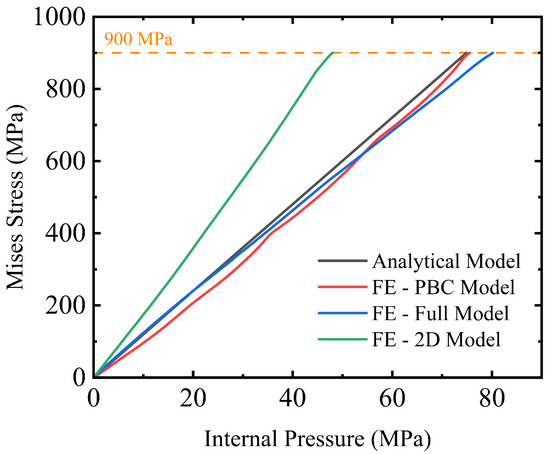
Figure 13.
The comparison between FE models and theory.
The computational cost differs significantly among the FE methods, and all simulations were carried out on a workstation equipped with an Intel Core i9-14900KF processor (24 cores, 32 threads) and 64 GB RAM. The results, together with the corresponding critical internal pressure (IP) values predicted by each method, are summarised in Table 2. These results demonstrate that the PBC model yields a conservative yet sufficiently accurate prediction of collapse resistance while offering a dramatic reduction in computational cost. In contrast, the full 3D helical model provides the most realistic stress field but requires significantly longer runtimes, making it less practical for extensive design studies. The axisymmetric model is computationally much more efficient but underestimates the collapse pressure because it cannot capture helix-induced stiffness and three-dimensional contact behaviour. Taken together, the very close agreement in critical pressures between the PBC model and the analytical solution confirms the robustness, accuracy, and conservative reliability of the PBC finite element strategy.
Table 2.
Critical internal pressure (IP) amounts of different models.
4. Discussion
To further examine the pipe response under increasing internal pressure, the radial displacement of the PA in the PBC model is shown in Figure 14. The distribution pattern shows that the crown of the PA cross-section exhibits the greatest displacement due to its reduced thickness along the radial axis, making it more flexible. In contrast, the invert region shows the smallest displacement because pressure is transferred indirectly through the PA body before reaching the invert. Much of the load is therefore absorbed along the PA thickness, reducing its radial deformation. Correspondingly, A line of nodes in the PE-PA contact surface was selected, where the largest radial expansion occurs. The displacement of these nodes was tracked and averaged to represent the overall radial deformation of the PA, with results plotted as a function of internal pressure in Figure 15.
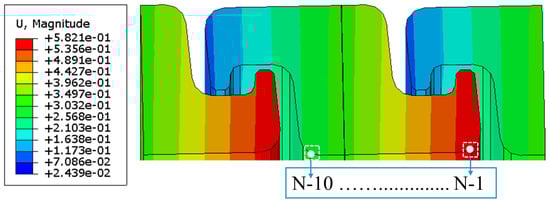
Figure 14.
The radial displacement distribution among the PA (unit: mm).
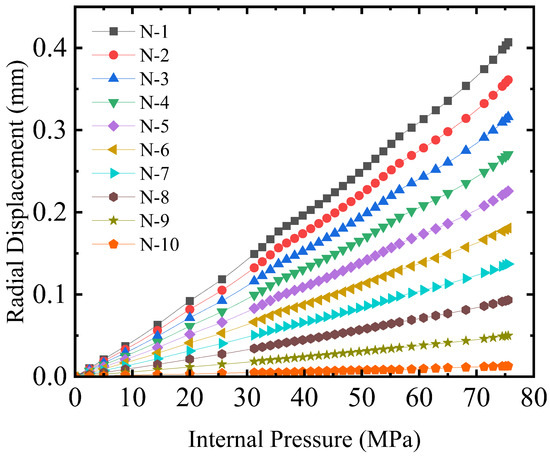
Figure 15.
The internal pressure-radial displacement relationship.
The finite element analyses reveal that the model fails because the pressure armour reaches its material stress limit before any contact occurs in the nub–nub interaction section (Figure 10, Figure 11 and Figure 12). This outcome indicates that there is sufficient clearance between neighbouring nubs for the selected material, meaning that failure is not governed by nub–nub interaction or crown–invert compression, which are often the dominant mechanisms in the PA configurations. Instead, the results suggest that the chosen cross-sectional design is particularly well suited for this material, as it prevents premature interaction-driven failure and allows the load-bearing capacity of the PA to be fully activated.
The contact pressure distribution along the PE–PA interface is shown in Figure 16. The evaluated nodes correspond to those used in Figure 14. The crown region exhibits the lowest contact pressure, confirming it as the most compliant and weakest section of the PA under internal pressure. The figure, obtained at the failure point, shows that the contact pressures at the interlocking tips exceed the pipe’s burst pressure, indicating that sealing integrity is maintained and failure does not occur due to leakage. The evolution of contact pressure with internal pressure is presented in Figure 17. In all cases, the contact pressure at the PE–PA interface increases nonlinearly and remains higher than the applied internal fluid pressure throughout the loading range. This behaviour confirms that the interface stays in compression, preventing fluid penetration or the formation of leakage paths. Consequently, the overall structural failure is governed by yielding or plastic collapse of the metallic PA, rather than by loss of sealing or liner separation.
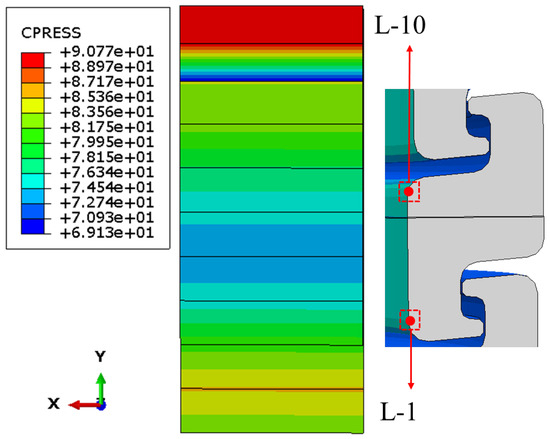
Figure 16.
The contact pressure in the PE-PA contact surface (unit: MPa).
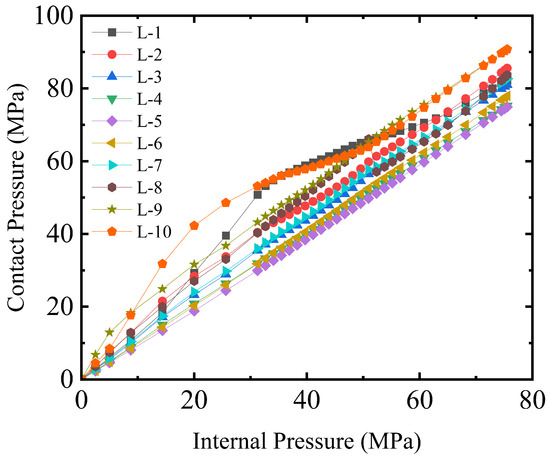
Figure 17.
The internal pressure-contact pressure relationship.
5. Conclusions
This study presented a comprehensive investigation into the burst behaviour of the pressure armour (PA) layer under internal pressure. Three finite element (FE) approaches were developed and assessed: a simplified two-dimensional (2D) axisymmetric model, a fully detailed three-dimensional (3D) helical model, and an efficient periodic boundary condition (PBC) model. These were benchmarked against analytical solutions to evaluate their accuracy and computational performance.
- The axisymmetric 2D model, although extremely fast, significantly underestimated the collapse pressure because it cannot represent the inherently three-dimensional mechanics of the helical strip. The absence of lay-angle-induced bending–torsion coupling, discrete Z-lock contact, and shear transfer between neighbouring strips leads to an underprediction of global stiffness.
- The full 3D helical model captured all geometric and contact-related effects explicitly, including localised locking deformation and helix-induced stiffening. As a result, it predicted a slightly higher collapse pressure than the analytical reference and provided the most realistic stress field. However, its computational cost was prohibitively high for use in design optimisation or parametric studies.
- The PBC model closely reproduced the analytical hoop stress response while maintaining a slightly conservative prediction relative to the full 3D model. By eliminating end effects and enforcing periodicity, it retained the essential mechanics of the interlocking Z-shaped strip while achieving a reduction in runtime of more than an order of magnitude.
Across all FE approaches, the governing failure mechanism was consistent: collapse occurred when the material strength of the PA layer was exceeded. No premature nub–nub interaction or crown–invert compression was observed, confirming that the selected PA cross-section provides sufficient clearance to avoid interaction-driven failure. The polymer liner remained far below its strength limit in all simulations and primarily acted as a pressure-transmitting medium rather than as a structural load-bearing component.
Future work may focus on validating the numerical findings through dedicated burst tests on full-scale PA specimens, enabling direct experimental confirmation of the predicted collapse pressures.
Author Contributions
M.S.: software, data curation, writing—original draft preparation; Y.Z.: methodology, validation, writing—review and editing; P.F.: visualization; Y.B.: supervision. All authors have read and agreed to the published version of the manuscript.
Funding
This research received no external funding.
Data Availability Statement
The original contributions presented in this study are included in the article. Further inquiries can be directed to the corresponding author.
Conflicts of Interest
Author Yong Bai was employed by the company OPR Offshore Engineering Equipment Co., Ltd. The remaining authors declare that the research was conducted in the absence of any commercial or financial relationships that could be construed as a potential conflict of interest.
References
- Saneian, M.; Han, P.; Jin, S.; Bai, Y. Fracture response of steel pipelines under combined tension and torsion. Thin-Walled Struct. 2020, 154, 106870. [Google Scholar] [CrossRef]
- Saneian, M.; Han, P.; Jin, S.; Bai, Y. Fracture response of steel pipelines under combined tension and bending. Thin-Walled Struct. 2020, 155, 106987. [Google Scholar] [CrossRef]
- Zhang, Y.; Liu, W.; Kuang, W.; Saneian, M.; Bai, Y. Mechanical behaviour analysis of steel strips reinforced thermoplastic pipe under torsion. Ocean. Eng. 2024, 303, 117655. [Google Scholar] [CrossRef]
- Zhang, Y.; Liu, W.; Saneian, M.; Bai, Y. A comprehensive study on the failure modes of steel strips reinforced thermoplastic pipe under torsion. Int. J. Press. Vessel. Pip. 2025, 216, 105490. [Google Scholar] [CrossRef]
- Bai, Y.; Zhang, Y.; Saneian, M.; Fang, P.; Quintero, J.; Ye, Q. Structural integrity of pipe-joint entirety under multi-axial loading: Comparative assessment of butt-joints and mid-joints. Ocean. Eng. 2025, 342, 122911. [Google Scholar] [CrossRef]
- de Sousa, J.R.M.; Sagrilo, L.V.S.; Rocha, D.M. Semi-empirical equations to predict the bisymmetric dry and wet hydrostatic collapse strengths of flexible pipes. Appl. Ocean. Res. 2022, 122, 103129. [Google Scholar] [CrossRef]
- Saneian, M.; Bai, Y. Assessment of the Carcass Role in Designing Deepwater Riser Connectors. In Proceedings of the International Conference on Offshore Mechanics and Arctic Engineering, Glasgow, UK, 9–14 June 2019; Volume 58806, p. V05AT04A033. [Google Scholar] [CrossRef]
- Saneian, M.; Bai, Y. Evaluation of the Inner Liner in Unbounded Flexible Pipelines in the Sealing System of End-Fitting. In Proceedings of the International Conference on Offshore Mechanics and Arctic Engineering, Singapore, 9–14 June 2024; Volume 87806, p. V003T04A004. [Google Scholar] [CrossRef]
- Zhang, Y.; Saneian, M.; Bai, Y.; Fang, P.; Cheng, P.; Zhao, L. Test-based equivalent-material method for collapse qualification of helically wound and layered cylindrical structures-with application to flexible-riser carcass. Nat. Commun. Eng. 2025. [Google Scholar] [CrossRef]
- Bai, Y. Deepwater Flexible Risers and Pipelines; John Wiley & Sons: Hoboken, NJ, USA, 2020. [Google Scholar]
- Det Norske Veritas. Project Recommended Practice: Composite Risers; Technical Report; Report No. 2002-0067; Det Norske Veritas: Høvik, Norway, 2002. [Google Scholar]
- Féret, J.J.; Bournazel, C.L. Calculation of Stresses and Slip in Structural Layers of Unbonded Flexible Pipes. J. Offshore Mech. Arct. Eng. 1987, 109, 263–269. [Google Scholar] [CrossRef]
- De Oliveira, J.; Goto, Y.; Okamoto, T. Theoretical and methodological approaches to flexible pipe design and application. In Proceedings of the Annual Offshore Technology Conference, Houston, TX, USA, 6–9 May 1985; pp. 517–526. [Google Scholar] [CrossRef]
- Colquhoun, R.; Hill, R.; Nielsen, R. Design and materials considerations for high pressure flexible flowlines. In Proceedings of the SUT Advances in Subsea Pipeline Engineering and Technology, Aberdeen, UK, 30–31 May 1990; pp. 145–178. [Google Scholar]
- Fernando, U.S.; Tan, Z.; Sheldrake, T.; Clements, R. The stress analysis and residual stress evaluation of pressure armour layers in flexible pipes using 3D finite element models. In Proceedings of the International Conference on Offshore Mechanics and Arctic Engineering, Vancouver, BC, Canada, 20–25 June 2004; Volume 37459, pp. 57–65. [Google Scholar] [CrossRef]
- Zhu, X.K.; Leis, B.N. Theoretical and Numerical Predictions of Burst Pressure of Pipelines. J. Press. Vessel. Technol. 2007, 129, 644–652. [Google Scholar] [CrossRef]
- Gay Neto, A.; Martins, C.v.d.A.; Pesce, C.P.; Meirelles, C.O.C.; Malta, E.R.; Barbosa Neto, T.F.F.; Godinho, C.A.F. Burst prediction of flexible pipes. In Proceedings of the International Conference on Offshore Mechanics and Arctic Engineering, Shanghai, China, 6–11 June 2010; Volume 49132, pp. 511–520. [Google Scholar] [CrossRef]
- Neto, A.G.; Martins, C.D.A.; Pesce, C.P.; Meirelles, O.C.; Malta, E.R. Prediction of burst in flexible pipes. J. Offshore Mech. Arct. Eng. 2013, 135, 011401. [Google Scholar] [CrossRef]
- Cuamatzi-Melendez, R.; Castillo-Hernández, O.; Vázquez-Hernández, A.; Albiter, A.; Vaz, M. Finite element modeling of burst failure in unbonded flexible risers. Eng. Struct. 2015, 87, 58–69. [Google Scholar] [CrossRef]
- O’halloran, S.; Connaire, A.; Harte, A.M.; Leen, S.B. Modelling of fretting in the pressure armour layer of flexible marine risers. Tribol. Int. 2016, 100, 306–316. [Google Scholar] [CrossRef]
- Liu, X.; Qu, Z.; Liu, Y.; He, J.; Si, G.; Wang, S.; Liu, Q. Numerical Simulation of Burst Failure in 2.5-Inch Unbonded Flexible Riser Pressure Armor Layers. Metals 2024, 14, 762. [Google Scholar] [CrossRef]
- Wei, R.; Li, X.; Vaz, M.A.; Custódio, A.B. Finite Element Modelling of Pressure Armour Unlocking Failure in Unbonded Flexible Risers. J. Mar. Sci. Eng. 2025, 13, 411. [Google Scholar] [CrossRef]
- Santos, C.C.; Pesce, C.P. An alternative strategy for offshore flexible pipes finite element analysis. Mar. Struct. 2019, 65, 376–416. [Google Scholar] [CrossRef]
- Timoshenko, S.P.; Goodier, J.N. Theory of Elasticity, 2nd ed.; McGraw–Hill: New York, NY, USA, 1951. [Google Scholar]
- Lamé, G. Leçons sur la Théorie Mathématique de L’élasticité des Corps Solides; Bachelier: Paris, France, 1852. [Google Scholar]
- Martins, C.v.A.; Pesce, C.P.; Aranha, J.A. Structural behavior of flexible pipe carcass during launching. In Proceedings of the International Conference on Offshore Mechanics and Arctic Engineering, Cancun, Mexico, 8–13 June 2003; Volume 36827, pp. 537–546. [Google Scholar] [CrossRef]
- American Petroleum Institute. API Specification 17J: Specification for Unbonded Flexible Pipe; American Petroleum Institute: Washington, DC, USA, 2014. [Google Scholar]
- Krishna, S.; Manna, I.; Glushych, V.; Weisheit, A.; Dutta Majumdar, J. Microstructural Evolution and Wear Resistance of Surface Alloyed AISI 316L Stainless Steel with Equi-atomic CoCrFeMnTi by Continuous Wave Diode Laser. Opt. Laser Technol. 2024, 179, 111345. [Google Scholar] [CrossRef]
- Yan, F.; Liu, G.; Tao, N.; Lu, K. Strength and ductility of 316L austenitic stainless steel strengthened by nano-scale twin bundles. Acta Mater. 2012, 60, 1059–1071. [Google Scholar] [CrossRef]
- Cornacchia, F.; Liu, T.; Bai, Y.; Fantuzzi, N. Tensile strength of the unbonded flexible pipes. Compos. Struct. 2019, 218, 142–151. [Google Scholar] [CrossRef]
- API. RP17B: Recommended Practice for Flexible Pipe; American Petroleum Institute: Washington, DC, USA, 2008. [Google Scholar]
- Dassault Systèmes. ABAQUS/Standard User’s Manual; SIMULIA: Johnston, RI, USA, 2024. [Google Scholar]
- Belytschko, T.; Bindeman, L.P. Assumed strain stabilization of the eight node hexahedral element. Comput. Methods Appl. Mech. Eng. 1993, 105, 225–260. [Google Scholar] [CrossRef]
- Saevik, S.; Berge, S. Fatigue testing and theoretical studies of two 4 in flexible pipes. Eng. Struct. 1995, 17, 276–292. [Google Scholar] [CrossRef]
- Dong, L.; Huang, Y.; Zhang, Q.; Liu, G. An analytical model to predict the bending behavior of unbonded flexible pipes. J. Ship Res. 2013, 57, 171–177. [Google Scholar] [CrossRef]
- Smith, D.M.; Cunningham, L.S.; Chen, L. Efficient finite element modelling of helical strand cables utilising periodicity. Int. J. Mech. Sci. 2024, 263, 108792. [Google Scholar] [CrossRef]
- Fang, P. Development of an Effective Modelling Method for the Local Mechanical Analysis of Submarine Power Cables. Ph.D. Thesis, Delft University of Technology, Delft, The Netherlands, 2024. [Google Scholar]
- Li, S.; Sitnikova, E. An excursion into representative volume elements and unit cells. Compr. Compos. Mater. II 2017, 1, 451–489. [Google Scholar] [CrossRef]
- Zhang, M.; Chen, X.; Fu, S.; Guo, Y.; Ma, L. Theoretical and numerical analysis of bending behavior of unbonded flexible risers. Mar. Struct. 2015, 44, 311–325. [Google Scholar] [CrossRef]
- Bai, Y.; Bai, Q. Subsea Pipelines and Risers, 2nd ed.; Elsevier Science: Oxford, UK, 2005. [Google Scholar]
- Provasi, R.; Toni, F.G.; de Arruda Martins, C. Friction coefficient influence in a flexible pipe: A macroelement model. Ocean. Eng. 2022, 266, 112719. [Google Scholar] [CrossRef]
Disclaimer/Publisher’s Note: The statements, opinions and data contained in all publications are solely those of the individual author(s) and contributor(s) and not of MDPI and/or the editor(s). MDPI and/or the editor(s) disclaim responsibility for any injury to people or property resulting from any ideas, methods, instructions or products referred to in the content. |
© 2025 by the authors. Licensee MDPI, Basel, Switzerland. This article is an open access article distributed under the terms and conditions of the Creative Commons Attribution (CC BY) license (https://creativecommons.org/licenses/by/4.0/).