Article

Seasonal Dynamics and Trophic Impact of Mesozooplankton in the Shannon River Estuary System, Ireland

by
Ian R. Jenkinson
1,2,3,* and
Tom H. Ryan
1,†
1
Department of Oceanography, National University of Ireland, H91 TK33 Galway, Ireland
2
Institute of Oceanology, Chinese Academy of Sciences, Qingdao 266071, China
3
Agence de Conseil et de Recherche Océanographiques, 19320 La Roche Canillac, France
*
Author to whom correspondence should be addressed.
Deceased.
J. Mar. Sci. Eng. 2025, 13(10), 1966; https://doi.org/10.3390/jmse13101966
Submission received: 23 August 2025 / Revised: 5 October 2025 / Accepted: 8 October 2025 / Published: 14 October 2025
(This article belongs to the Special Issue Mesozooplankton Ecology in Marine Environments)

Abstract

Mesozooplankton (netplankton > 250 µm) were sampled during nine cruises over one year at three stations in the Shannon estuary system, Ireland. A net with three mesh sizes was used to capture a wider range of plankton sizes than a standard single-mesh net. An innovation was the incorporation factorial analysis of celestial (seasonal) variables, spring equinox (Spr) and summer solstice (Sum), together with physicochemical and biological variables, without presuming cause or effect. Over the year, water temperature and salinity were closely positively related to each other and to the occurrence of most of the taxa. The approximate trophic impact of by major taxa was estimated from abundance and published clearance rates. Overall, the mean herbivorous/detritivorous grazing by mesozooplankton was 54 L m−3 d−1. Among the mesozooplankters and mysids, Mesopodopsis slabberi (predominantly April–November) contributed 96.3% and the appendicularian Oikopleura dioica (May–October) contributed 2.0% (nano- and picoplankton), while copepods only provided 0.98%. The ctenophore Pleurobrachia pileus (present April–October) grazed 2.0% (carnivorous grazing mysids and copepods contributed additional unquantified carnivorous grazing). These data, collected 45 years ago, provide a valuable baseline for assessing subsequent ecological changes.

Graphical Abstract

1. Introduction

Temperate estuaries are being degraded rapidly worldwide [1]. However, the Shannon estuary complex remains relatively unpolluted [2,3,4,5] and is of international importance, serving not only as a refuge for wildfowl and waders but also for supporting significant, though threatened, migratory eel [6] and salmon [7] fisheries.
The west coast of Ireland represents the most westerly point of northwest Europe (excluding Iceland). Its estuaries are thus unique in mixing with oceanic Atlantic water and its associated planktonic communities. Despite this, mesozooplankton in the estuaries of Ireland’s west coast have been little studied. The only year-round study appears to be that by Byrne [8] in the Dunkellin estuary at the head of Galway Bay (salinities 4.5 to 34.5), which used a 160 µm mesh net. Other studies of west Irish coastal mesozooplankton, including those in salinities < 30, have focused on specific groups: decapod adults and their planktonic larvae [9], copepods [10], larval and post-larval fishes [11], chaetognaths [12,13], and planktonic cnidaria [14]. The account by Hensey [15] of netplankton, sampled in the Shannon estuary at salinities of 25 to 35 in September 1977, May 1978, and August 1978, is discussed further in the Study Area section.
Long-term ecological studies, such as the present one, are essential for assessing changes in zooplankton [16] and fish [17] abundances, particularly for understanding the effects of both cyclic and progressive climate variations.
A related study on the intertidal and benthic fauna around Aughinish has also been published [18,19], with some fauna common to the mesozooplankton we sampled.
Before the present study began, construction had started on Aughinish Island in the Shannon estuary (Figure 1) for the largest plant in Europe for purifying bauxite into alumina (aluminum oxide). Production commenced in 1983, with a throughput of 800,000 tonnes per year [20]. Concerns about the potential impacts of the plant and its associated increase in shipping prompted funding for ecological baseline surveys of the mesozooplankton and intertidal biota, carried out from 1978 to 1980 [18,19,21,22]. This paper is based on the mesozoolankton samples (approximately 0.2 to 2 mm and larger) collected during a series of cruises in 1979–1980 around Aughinish Island, on the southern (County Limerick) side of the Shannon estuary, including two tributary estuaries, the Deel and the Robertstown (Figure 1). It complements the accounts by [21,22] of the autotrophic and heterotrophic nano- and microplankton (10 µm to 200 µm) sampled during the same cruises.
The aims of this publication are threefold: (1) to provide an annual record of the mesozooplankton around Aughinish Island in 1979/80 as a baseline for assessing changes over nearly half a century, a period marked by increased industrial impact, climate change, and potential species introductions; (2) to use zooplankton abundance data to estimate the differential grazing pressure (trophic impact) of the major taxa; and (3) to present a factorial analysis relating the mesozooplankton community to celestial, physicochemical, and other biological variables (abundance of detritus and pico- and nanoplankton). This factorial analysis seeks to avoid the presumptive classification of variables as either controlling or controlled.
We have applied factorial analysis as a descriptive tool, not an inferential one (Section 3.2.2) [23,24]. In this approach, we have incorporated celestial variables—the spring equinox and summer solstice—to describe the seasonal cycle, a feature we believe to be highly innovative.

2. Study Area

The River Shannon is considered the longest river in Ireland and Britain, with a length of approximately 258 km from its source to Limerick City (Figure 1), where it meets salt water. It also has by far the greatest annual discharge rate, which at Limerick City is 208 m3·s−1. From there, the estuary stretches a further 101 km to a line from Kerry Head to Loop Head, where it meets the Atlantic Ocean. The river flows through many lakes and drains a catchment area of 11,794 km2, consisting mostly of agricultural land and peat bog. The Shannon estuary itself, covering 235 km2 including intertidal areas, receives flow from the rivers Fergus, Owengarney, Deel, Maigue, and Robertstown, with their own estuaries. The Fergus estuary is particularly extensive, shallow, and characterized by many islands and intertidal flats (Figure 1).
The Shannon estuary complex remains relatively unpolluted [2,3,4,5] and is internationally important, not only as a refuge for wildfowl and wading birds but also for its salmon runs [7]. However, by the 1980s, the estuary was receiving domestic effluent from adjacent towns, notably Limerick, Foynes, Shannon Town, and Askeaton [3]. Along its banks and tributaries are Shannon Airport, which served nearly 2 million passengers in 2023 [25], and several potentially polluting industries at Newmarket-on-Fergus (pharmaceuticals), Askeaton (milk products; plastics), and Tarbert (oil-fired power station). This includes the bauxite plant mentioned previously, which has been producing 1.9 × 10⁶ tonnes·y−1 of alumina from bauxite [26]. Additionally, a power station at Money Point burns approximately 2 × 10⁶ tonnes of coal per year. Since the early 1990s, shipping traffic has increased to transport coal and bauxite to the Money Point and Aughinish Island plants, respectively, increasing the likelihood of species introductions [27].
Measurements of oceanographic parameters—including temperature, salinity stratification, turbidity, and nutrient and chlorophyll *a* concentrations—were carried out on five cruises from 1977 to 1979 [28,29]. The stations were located in the mid-channel up to Aughinish Island. Hensey [15] analyzed zooplankton samples taken with Clarke-Bumpus nets from these cruises. McMahon et al. [30] reported on stratification, nutrients, chlorophyll *a*, suspended matter concentration, and current speeds from Tarbert up to Limerick Town, again mainly in the mid-channel. They also modelled the light regime in the water column and its impact on phytoplankton growth. The chlorophyll *a* levels they measured showed a strongly negative relationship with salinity, reflecting a combined turbidity and chlorophyll maximum in salinities of ≤1 to ~6. This maximum occurred from 1 to 16 km downstream of Limerick Town.
This study is based on mesozooplankton sampled around Aughinish Island on nine cruises in 1979 and 1980. Information on nano- and microplankton obtained during the same cruises has been published elsewhere [21,22].

3. Materials and Methods

3.1. Sampling, Identification, and Estimation of Abundance

Sampling for physicochemical parameters and nanoplankton was conducted at one- to two-month intervals at Stations 1–5 over nine cruises from May 1979 to May 1980. The specific cruise dates were 12 May 1979, 10 July 1979, 3 August 1979, 3 October 1979, 20 November 1979, 21 December 1979, 13 February 1980, 1 April 1980, and 3 May 1980. All cruises occurred during spring tides, with the exception of the August cruise, which was delayed by bad weather and took place during neap tides.
Sampling at all stations was performed on the rising tide. Stations 1, 3, and 4 were sampled at 0h28–1h02, 1h58–3h51, and 3h13–4h57 after Low Water at Tarbert, respectively [22]. Water depth at the time of sampling was recorded during the vertical profiling of temperature and salinity using a T/S probe (M5 T/S bridge, Electronic Switchgear, Ltd., Chertsey, England). The measured depths were Station 1, 2–2.5 m; Station 3, 7–10 m; and Station 4, 2–5 m. It should be noted that these depth measurements may be slight underestimates, as the primary purpose of lowering the probe was to obtain T/S profiles.
At each station, we recorded water clarity (Secchi disc) and obtained vertical temperature/salinity (T/S) profiles. Surface water samples were also collected for microplankton enumeration [21,22]. At Stations 1, 3, and 4, a net tow was conducted by steaming against the incoming tidal current. Since T/S measurements preceded the net tow, the tow itself may have sampled water of a slightly higher salinity than recorded.
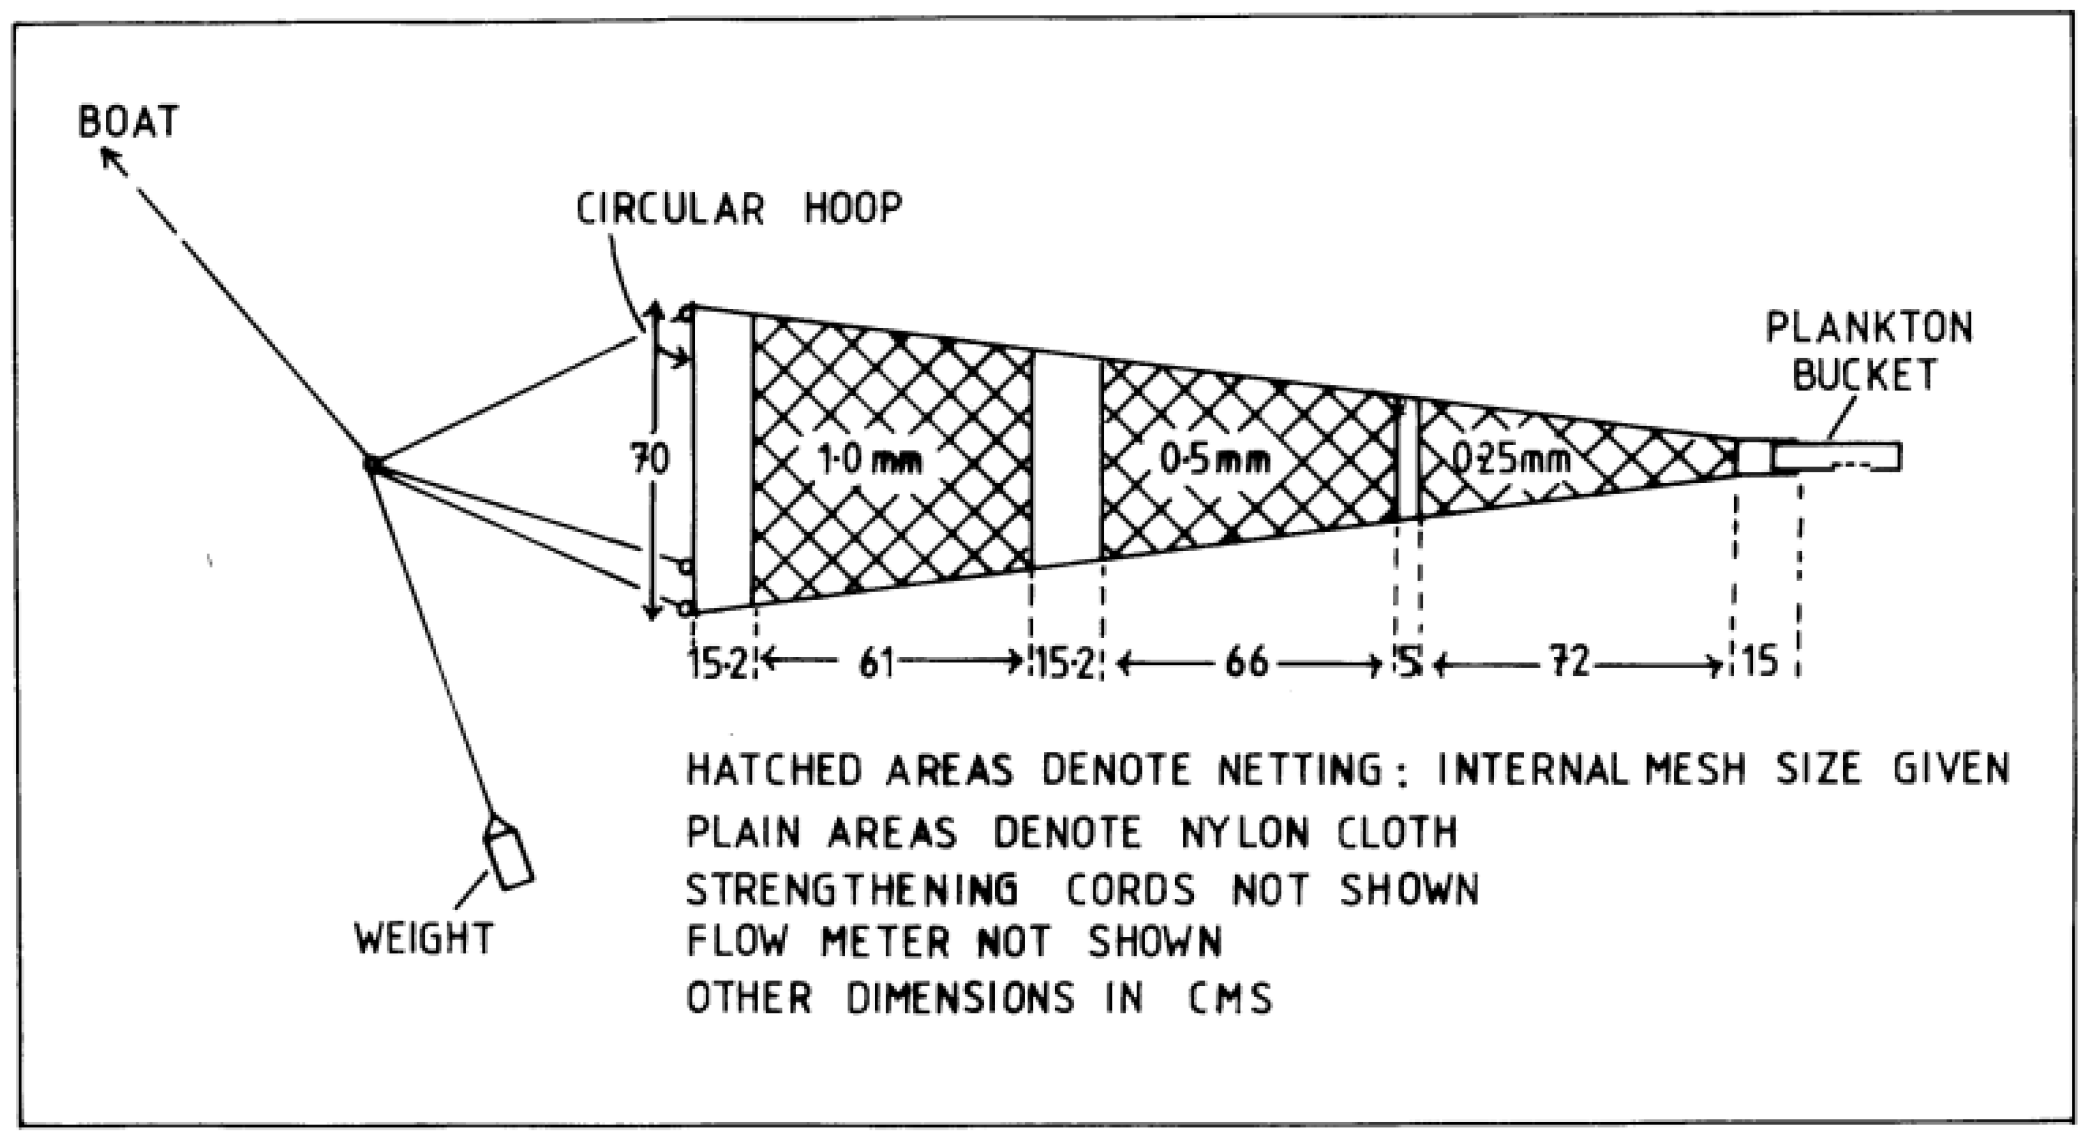
Mesozooplankton was sampled using an oblique tow for 10 min at an approximate speed of 1 m s−1. While the standard method employs a WP2 net with a single 200 µm mesh [31], the present study utilized a net with three mesh sizes (250 µm, 500 µm, and 1000 µm; Figure 2) to capture a wider size range of zooplankton.
As the vessel was not equipped with a winch, the net was first towed at the surface, and rope was progressively played out to lower the net to an estimated position near the bottom. To estimate the volume of water filtered, a flowmeter was fixed to the net ring at one-third of the ring’s diameter. The system was calibrated by towing the ring without a net attached for a measured time and speed. The flowmeter readings from actual plankton tows were then used to calculate the total volume of water filtered.
Because net filtering efficiency is inversely related to mesh size, the volume filtered by the smallest mesh (250 µm) was multiplied by a filtering coefficient of 0.88 [32]. It is acknowledged that this coefficient would have varied as an unknown function of clogging by plankton and detritus. The concentration of organisms in each size class was calculated from the corrected volume of water filtered by the corresponding mesh. All plankton samples were fixed and preserved in 4% formaldehyde (w/w) in seawater.
The high abundance of comparatively large mysids in the samples prompted the calculation of estimated clearance rates for the main taxa. Consequently, this methodological approach provides a better quantitative understanding of secondary production processes in the historic planktonic food web than would have been possible with a standard WP2 net.
For quantitative analysis, the volume sampled per standard haul (before flowmeter correction) was defined as follows:
  • 210 m3 for organisms > 1.0 mm (e.g., Pleurobrachia pileus, fishes, mysids), sampled by all three meshes.
  • 100 m3 for organisms > 0.5 mm (e.g., adult Calanus), sampled by the 500 µm and 250 µm meshes.
  • 37 m3 for mesozooplankton > 0.25 mm (e.g., adult copepods, large copepodites, Oikopleura dioica without its house), sampled by the 250 µm mesh only.
  • 100 m3 was arbitrarily assigned as the sampled volume for detritus.
The volume of net-sampled detritus was measured by allowing the detritus and plankton to settle together in a measuring cylinder, with the proportion of each component estimated visually.

3.2. Statistical Analyses

3.2.1. Diversity

Community structure was assessed using diversity indices. Species diversity was calculated from raw counts using the Shannon–Wiener index:
H′ = −∑ pᵢ log2(pᵢ)
where pᵢ is the proportion of individuals belonging to species i in a sample [33,34,35,36]. While most organisms were identified to the species level, in some cases the taxon i refers to a higher taxonomic group (see Supplementary Materials for taxon data).
Some studies use the natural logarithm (loge) instead of log2 to calculate H′, and others do not specify the base used. The “vegan” package documentation notes that the choice of logarithm base makes little practical difference [36,37]. To confirm this, we calculated H′ for our data using both methods Values derived from logₑ were consistently higher, but the difference was always less than 0.4%. Therefore, comparisons between studies reporting H′ are valid with an error of less than 1%.
We also calculated the following indices:
  • The Margalef index of richness:
Dmg = (S − 1)/log2(N)
where N is the total number of individuals and S is the number of species.
  • Pielou’s Evenness index:
J′ = H′/log22(S)

3.2.2. Principal Component Analysis (PCA)

Community structure was further investigated using multivariate methods. We present only the results from Principal Component Analysis (PCA), as they yielded the most intuitively useful results.
An innovative aspect of our PCA is the incorporation of two celestial variables: Spring vs. Autumn Equinox (Spr) and Summer vs. Winter Solstice (Sum). These are included to help describe the association of the annual cycle with other variables in the two-dimensional PCA scatter plots (see Section 4).
Our PCA was designed in the spirit of Joliffe and Cadima [24], who emphasized that the aim of PCA is descriptive, not inferential. We also selected physico-chemical–biological variables, and abundance of the major taxa for the analysis, which was performed using the factoextra package [23] in R.

3.3. Choice of Environmental Variables

In factorial analysis of environmental time-series data, distinguishing between causative and effect variables is challenging. Biological and some physico-chemico-biological variables and taxon abundances can influence each other over the timescale of the series, potentially with time lags or feedback loops. We have therefore treated all variables similarly, avoiding this distinction.
Another innovation of this study is the characterization of the annual cycle as a circle (pair of sinusoidal functions) represented by components corresponding to the spring–autumn equinoxes and summer–winter solstices. We consider this approach adapted to subtropical, temperate, and boreal zones without a marked monsoon, including Ireland. The circle is defined by the components Spr and Sum (Equations (4) and (5)). To our knowledge, this classical treatment is innovative as an input to ecological time-series studies. Longobardi et al. [38], however, used photoperiod—which is strongly related to Sum—as a variable to investigate phytoplankton abundance and community structure in a Mediterranean study and found it had a remarkably stable influence over a 25-year time series.
Celestial cycles, notably the solar annual cycle, produce regular variations in temperature, salinity (Figure 3), and light flux, particularly in polar and temperate regions. Biological clocks are often cued to such variables [39]. The lunar ~12.64 h M2 cycle is the strongest driver of tides in the study area and aliases with the weaker 12.00 h solar S2 cycle to produce the oscillation between spring and neap tides approximately every 14.75 days. The solar and lunar cycles have driven many organisms to develop biological clocks keyed to these annual, lunar-monthly, and daily cycles [39]. Other cycles and environmental fluctuations add further variations or “noise”. The present investigation is suited to detect only annual, not lunar or daily, variations. We therefore incorporated the components for the summer solstice (Sum) and spring equinox (Spr) into the PCA (Figure 4a). We attempted to minimize interference from lunar-monthly variations by sampling, as closely as possible, during spring tides (with the exception of August, which was sampled during neap tides, as mentioned above).
The relationships between environmental/seasonal variables and the most abundant species were explored using Principal Component Analysis (PCA). We used raw data for physicochemical variables and log(n + 1) transformed data for plankton counts, employing the “factoextra” package [23] (Table 1). The spring–autumn equinox component (Spr) and the summer–winter solstice component (Sum) are calculated as
Spr = +sin[(Jd + 11) × 360/365]
Sum = −cos[(Jd + 11) × 360/365]
where Jd is the Julian day. Note that the autumn equinox and winter solstice components are thus -Spr and -Sum, respectively; their annual variations are shown in Figure 4a. They can be imagined as exactly opposite Spr and Sum in in the PCA biplots (Section 4.2).

3.4. Calculations of Grazing Rate (Trophic Impact)

The term clearance rate refers to the volume cleared per individual per unit time. In contrast, grazing rate (or trophic impact) refers to the volume grazed per unit time by the population of a given taxon, calculated as Grazing rate = Clearance rate × Abundance.

3.4.1. General Considerations

Trophic impact (as grazing rates) was estimated for the four principal meso mesozooplankton types sampled: (1) the ctenophore Pleurobrachia pileus; (2) copepods (>90% Eurytemora affinis and Acartia spp.); (3) the mysid Mesopodopsis slabberi; and (4) the appendicularian Oikopleura dioica. Other mesozooplankton taxa were considered too minor to exert significant trophic pressure.
These grazing rates were calculated from abundance data and published measurements of clearance per individual (see Section 3.4). These published measurements were generally not investigated in relation to different temperatures or other in situ conditions, such as food, detritus, and predator composition, and were made under laboratory conditions. Our estimates of trophic impact should therefore not be considered too precise; a maximum error of approximately ± a factor of 5 is tentatively suggested.

3.4.2. Predatory Clearance Rate by Pleurobrachia pileus

Båmstedt [40] measured a clearance rate for P. pileus of 6.1 L ind−1 d−1 on the large copepod Calanus finmarchicus. Pleurobrachia is known to consume even larger plankton, such as fish larvae [41], and in the study area, they likely prey considerably on mobile prey such as mysids. It is unclear to what extent the appendicularian Oikopleura dioica is protected from ctenophore predation by its mucous house and associated escape reaction [42]. For our calculations, we assumed P. pileus carnivorously clears 6 L ind−1 d−1 of zooplankton and exerts no herbivory or detritivory. We discuss Yip’s suggestion of detritivory by P. pileus [43] in the Section 5.

3.4.3. Clearance Rates by Eurytemora affinis

This copepod feeds principally on phytoplankton when available, although it can survive on a diet mainly of detritus, making it a widespread and sometimes extremely abundant component of estuarine plankton [44,45,46,47]. In the Shannon, we observed that its gut contained yellowish material, consistent with detritivory.
From feeding experiments using natural phytoplankton, Poulet [48] found the ingestion rate for adult females to be:
IE = 0.218 + 0.135[POM] (µg ind−1 h−1)
where [POM] is the concentration of particulate organic matter (g m−3 wet weight).
The clearance rate for E. affinis is therefore:
CE = IE/[POM] = 0.218/[POM] + 0.135 (mL ind−1 h−1)
Assuming a hypothetical phytoplankton population of 30 µm diameter spheres conforming to the cell volume-carbon relationship of Mullin et al. [49], 1 g m−3 wet weight equals 52 mg m−3 of organic carbon. Available data [28,29,30] indicate a mean annual particulate organic carbon (POC) level in the Shannon estuary (Stations 3 and 4) of ~600 mg C m−3, with microplankton contributing ~100 mg C m−3, except in May, when values peaked at ~150–200 mg C m−3) [21,22]. Station 1 was excluded from this calculation due to its vastly different microplankton regime. As E. affinis tends to concentrate near the bottom where detritus is more abundant [50], we assumed a mean accessible POC of 1000 mg C m−3 (≈11.6 g m−3 wet weight). This concentration yields a clearance rate (CE) of 3.6 mL ind−1 d−1 and a carbon capture rate (IE) of 2.9 µg C ind−1 d−1.
We assumed adult males and copepodites have clearance rates equal to, and half that of, adult females, respectively. Poulet’s [48] experiments were conducted at 0–10 °C, compared to 6–17 °C in our study. As temperature effects on clearance rate are unquantified, no correction was applied.

3.4.4. Clearance Rates by Acartia spp.

Adults of all Acartia species in this study are similar in size. All can utilize detritus but appear to require some healthy phytoplankton. Unlike E. affinis, Acartia species can “track” and actively grasp larger particles, including small zooplankters [50,51,52,53,54].
Clearance rates were calculated similarly to E. affinis, using data from Poulet [48] for adult female Acartia clausi:
CRA = IA/[POM] = 1.43/[POM] + 1.09 (mL ind−1 h−1)
where IA is the ingestion rate (µg ind−1 h−1 wet weight).
For Acartia, the relevant [POM] cannot be assumed identical to that for E. affinis, due to its Acartia’s need for healthy phytoplankton. We assumed that half the detrital POC and all nano- and microplankton POC were available. Excluding Station 1, microplankton POC near Aughinish is relatively constant at ~100 mg m−3 [21,22]. Thus, the POC available to Acartia is estimated at ~460 mg m−3, equivalent to 8.8 g m−3 wet weight of 30 µm spherical cells [49]. Substituting 8.8 for [POM] in Equation (8) gives a clearance rate of 3.0 mL ind−1 d−1 and a carbon capture rate of 1.4 µg C ind−1 d−1.
For comparison, Roman [53] found clearance rates for A. tonsa on of 1.5–3.7 mL ind−1 d−1 when fed detrital particles 10 to 24 µm in size composed of aged Fucus−1, while Kiørboe et al. [54] reported a maximum of 11 mL ind−1 d−1 on cultured Rhodomonas (~150 µg C L−1); the latter condition seems less representative of the Shannon estuary.
We assumed clearance rates of 3.0 and 1.5 mL ind−1 d−1 for adults and copepodites, respectively. The population grazing pressure (mL m−3 d−1) is:
GRA = (AA × 3.0) + (CA × 1.5)
where AA is adult concentration (m−3) and CA is copepodite concentration.

3.4.5. Clearance Rates by Mysids

The mysid population was overwhelmingly dominated by Mesopodopsis slabberi. Mysids are generally omnivorous, feeding raptorially on zooplankton when available, but otherwise filter-feeding on phytoplankton or other organic matter [47,55,56].
Clearance rates appear to have been quantified primarily for filter-feeding in the absence of animal prey. Webb et al. [55] reported clearance rates for M. slabberi feeding on diatoms between 0.21 and 0.79 L ind−1 d−1. David et al. [47], working in the more comparable environment of the Gironde estuary, measured clearance rates in 24 h incubations of 0.78 and 0.39 L ind−1 d−1 for adults and juveniles, respectively. We have used these latter values, which are at the upper end of the range found by Webb et al. [55].

3.4.6. Clearance Rates by Oikopleura dioica

King [57] found that O. dioica reared at 14 °C cleared 200 mL ind−1 d−1 and required a minimum food concentration of 40–60 mg C m−3. Alldredge [58] measured in situ clearance equivalent to 300 mL ind−1 d−1, while Acuña & Kiefer [59] reported rates of 113–250 mL ind−1 d−1, decreasing with increasing food concentration. Taking a rough average, we assumed a clearance rate of 100 mL ind−1 d−1 for the temperatures prevalent in the Shannon estuary during summer when this species primarily occurred.

4. Results

4.1. Temperature and Salinity

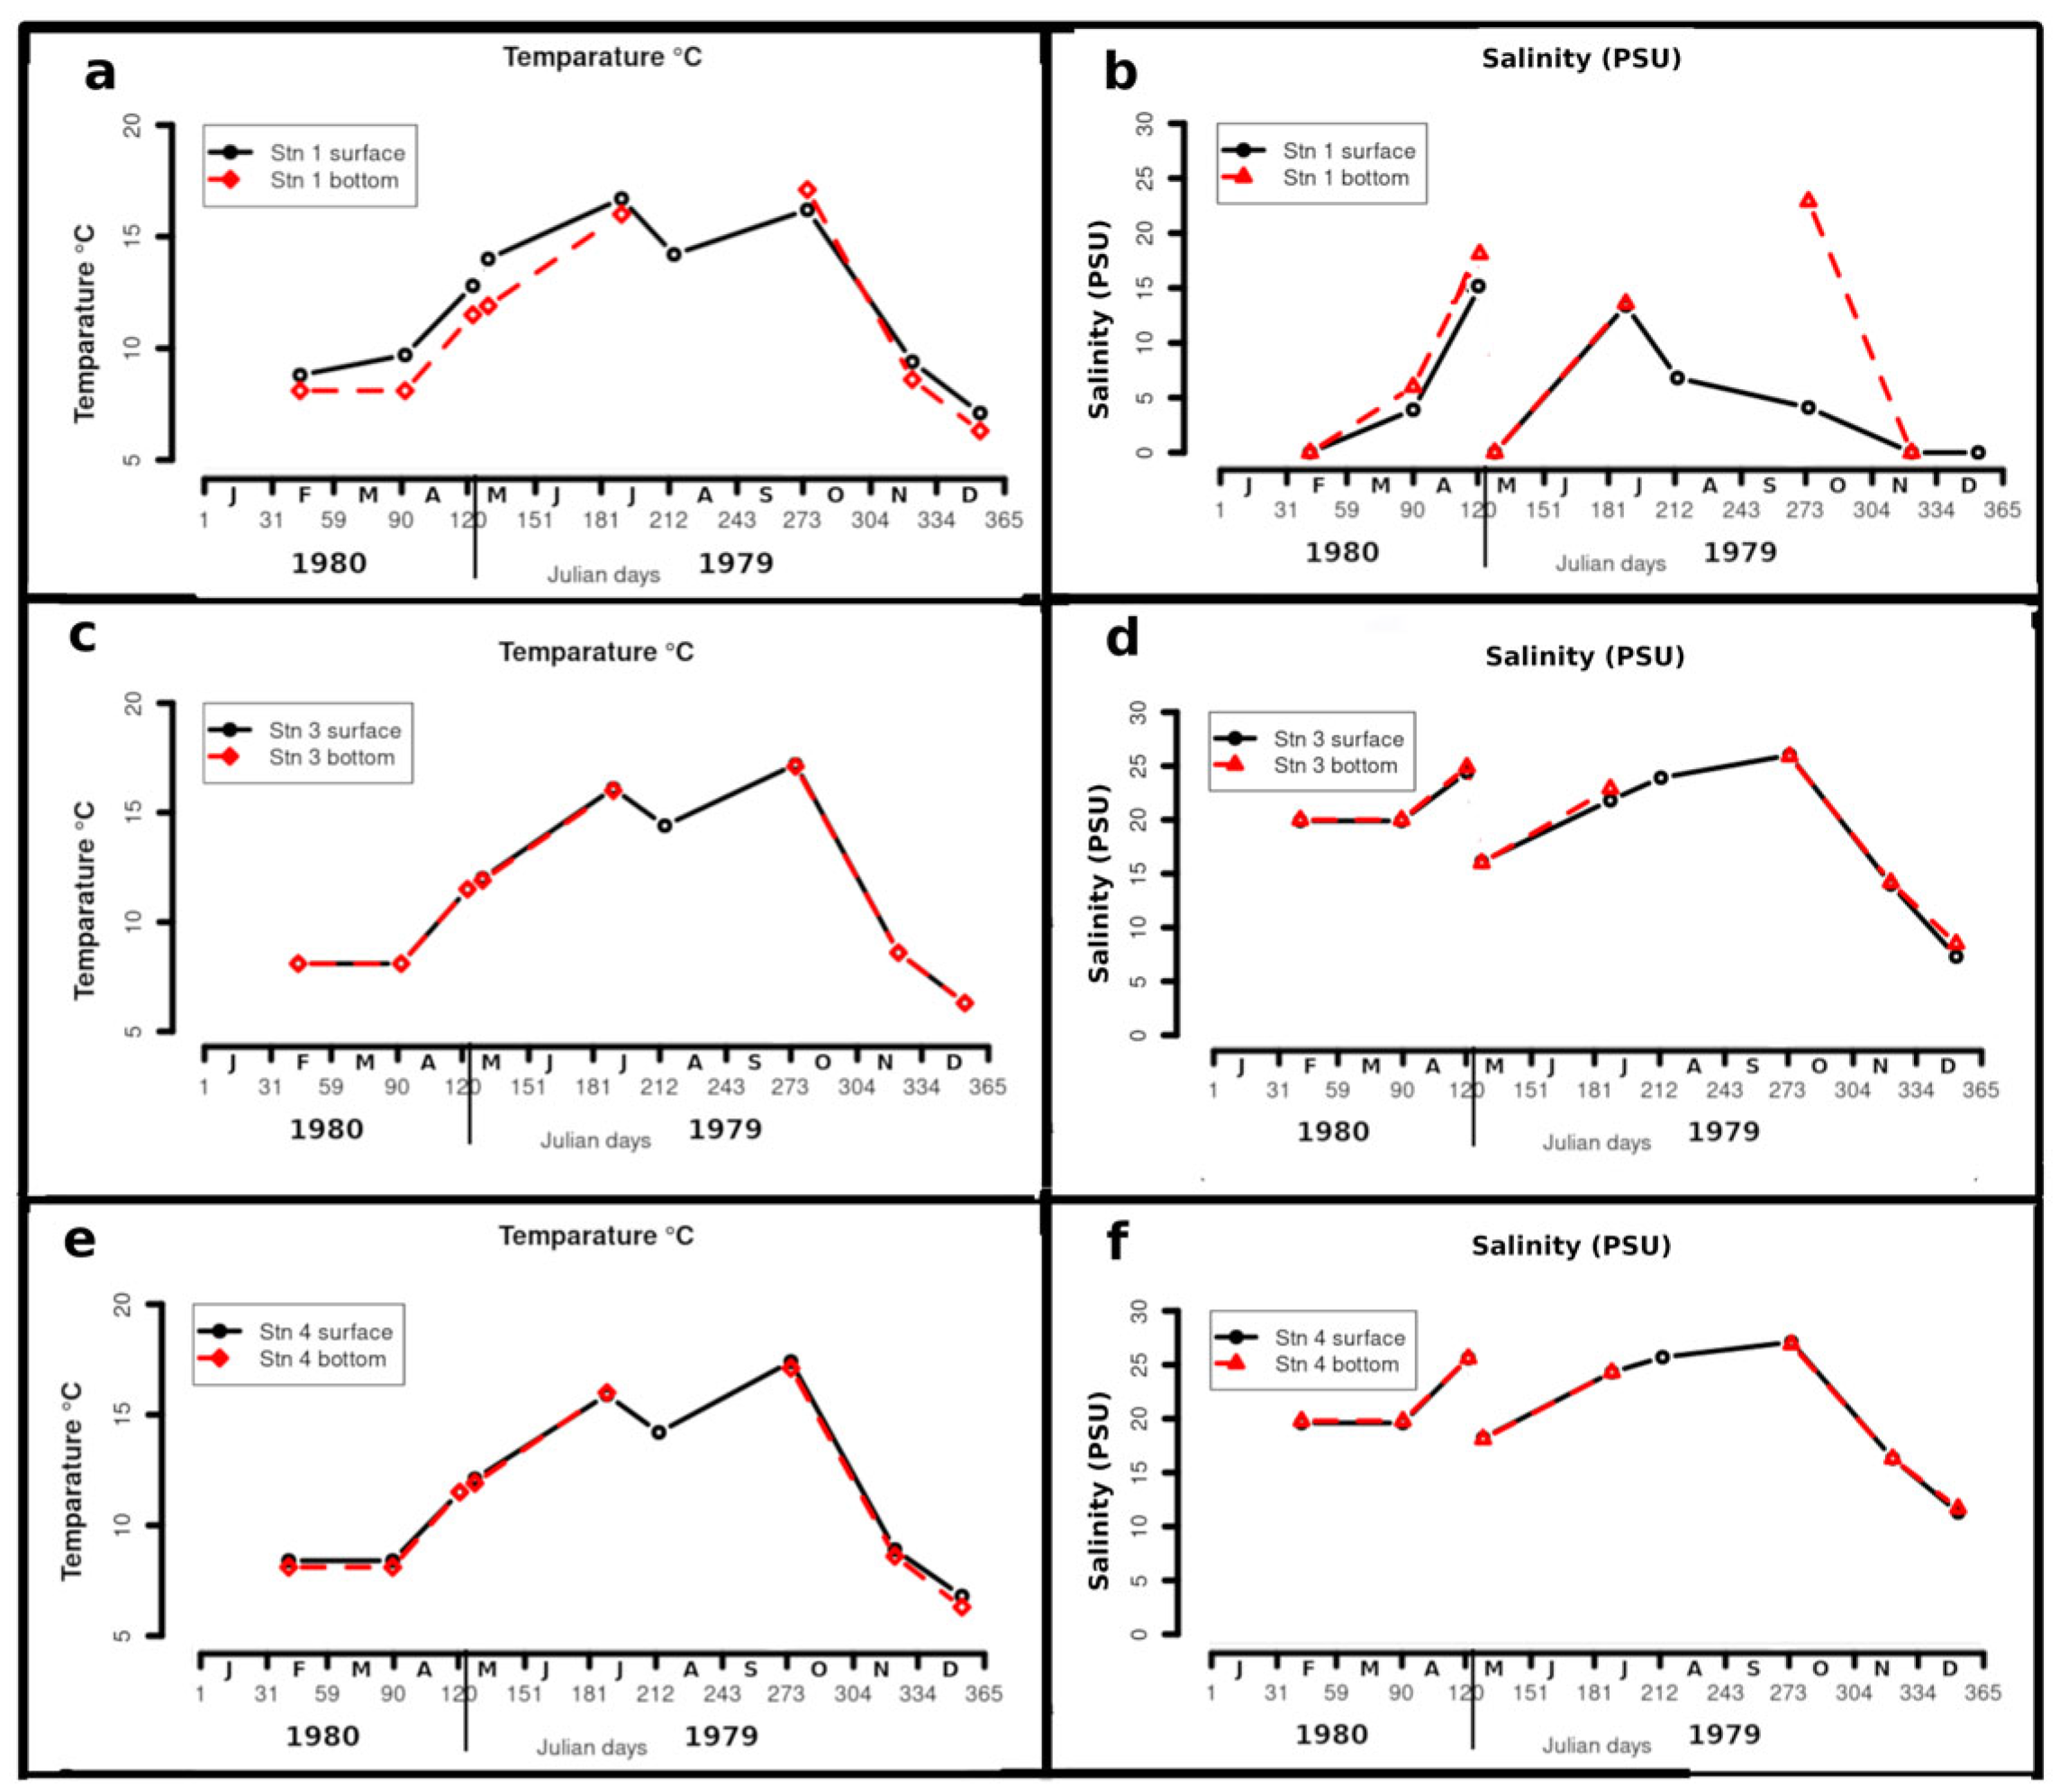
Figure 3 shows surface and near-bottom temperature and salinity values. Some near-bottom data are missing due to technical malfunction of the T-S meter.
Temperatures were highest in October (16–17 °C) and lowest in December (6–7 °C) across all stations. Exceptionally cold weather in January 1980 caused ice formation around Station 1 Station 1 exhibited thermal stratification on all cruises where bottom water was sampled, with a maximum surface-to-bottom difference of 1.0 °C in May and inverse thermostratification of 1.3 °C in October, the latter associated with strong salinity stratification. In contrast, Stations 3 and 4 showed little thermal stratification.
Station 1 was consistently less saline than the others, with zero salinity recorded in November, December, February, and May 1980. When not entirely freshwater, it was strongly halostratified, most notably in October (bottom: 22.9 PSU; surface: 4.1 PSU). At Stations 3 and 4, the lowest salinities were 7.2 PSU (December) and 9.7 PSU (January), respectively. The highest salinities at all stations occurred in May 1980 and October.
In summary, Station 1 was often strongly stratified when not filled with freshwater, whereas Stations 3 and 4 were always well-mixed or only very weakly stratified.

4.2. Celestial Variables

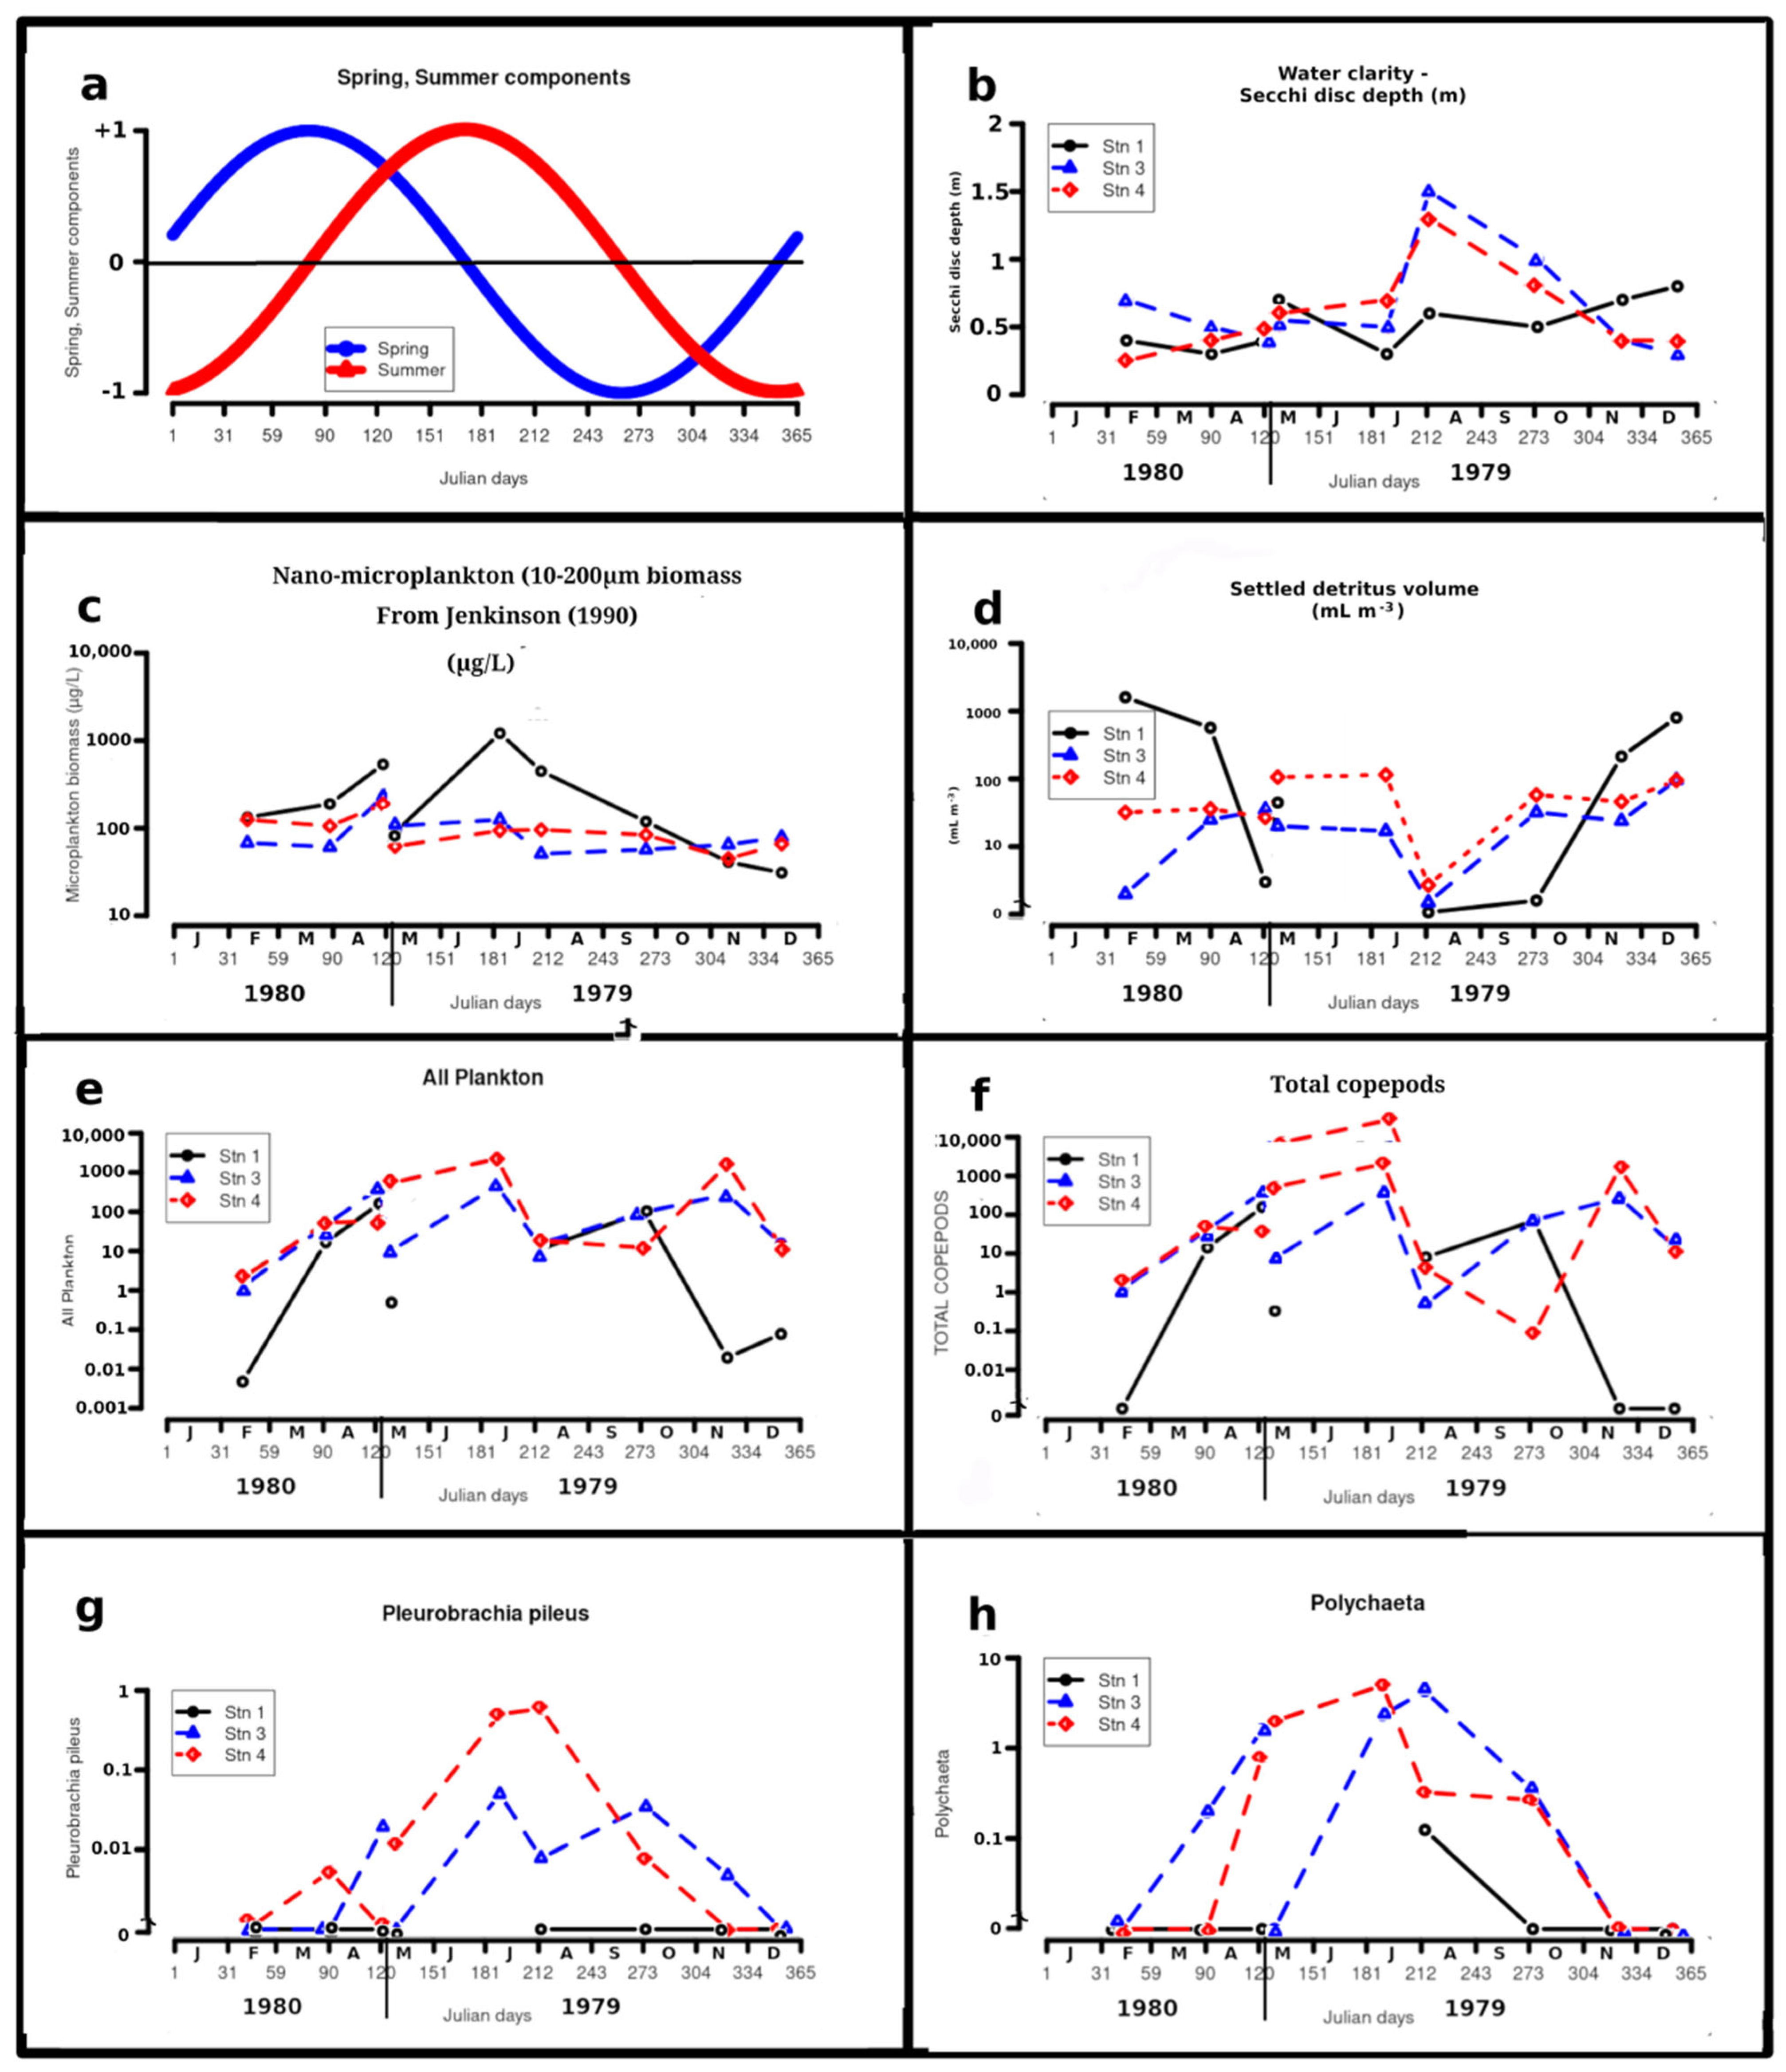
Figure 4a illustrates the sinusoidal annual variation in the celestial variables Spr and Sum. Spr peaks at the spring equinox and reaches a minimum at the autumn equinox. Sum, while, peaks at the summer solstice and reaches a minimum at the winter solstice.

4.3. Secchi Disc Water Clarity and Colour

Figure 4b shows that water clarity at Stations 3 and 4 was highest in summer, with a notable peak in August. In contrast, clarity at Station 1 varied less throughout the year.
Water colour was predominantly yellow-brown. However, it was light green at Stations 3 and 4 in August, corresponding to the peak clarity, and was a yellow-brown-green in May 1980, coinciding with a spring maximum in nano- and microplankton (Figure 4c). At Station 1, the water was yellow-brown in October, December, and April; orange-brown in May 1979 and November; red-brown in July (during a red tide of the dinoflagellate Glenodinium foliaceum [21,22]); and light yellow in May 1980. These colours likely reflect inputs from detritus and pigmented nano- and microplankton.

4.4. Detritus Volume Fraction

Figure 4d shows that the volume fraction of detritus (ΦD) at Station 1 varied 23,000-fold, from 7 × 10⁻⁸ in August to 1.6 × 10⁻³ in February, and was inversely related to annual salinity and temperature. During periods of high ΦD at Station 1, the sampler collected leaves, small sticks, wood fragments, and paper. The detritus volume varied much less at Stations 3 and 4, by factors of 190 and 67, respectively. Detritus was least abundant during the August cruise at all three stations, the only sampling event conducted during neap tides.

4.5. Total Mesozooplankton

Figure 4e shows that total mesozooplankton abundance at Station 1 it varied 550-fold, from a minimum of 0.004 ind. m−3 in February to a maximum of 2.2 ind. m−3 in May 1980. At this station, mesozooplankton abundance was inversely related to ΦD and positively correlated with salinity.
At Station 3, mesozooplankton abundance varied 379-fold, with a minimum of 1.2 ind. m−3 in February and maxima of 455 ind. m−3 in July and 411 ind. m−3 in May 1980. At Station 4, the variation exceeded 1000-fold, from a minimum of 2.1 ind. m−3 in February to maxima of 2250 ind. m−3 in July and 1613 ind. m−3 in November.

4.6. Dominant and Noteworthy Mesozooplankton

4.6.1. Coelenterates

Ephyra larvae of Aurelia aurita were common at Stations 3 and 4 in April and May, with a single individual found in August. No medusa-stage individuals were recorded. Occasional specimens of Phialella quadrata, Proboscidactyla stellata, Sarsia gemmifera, and Sarsia tubulosa were also encountered.

4.6.2. Ctenophores

Pleurobrachia pileus (O.F. Müller) (Figure 4g)
P. pileus occurred from May to October at stations with bottom salinities between 16.1 and 27.1 PSU and was not found at Station 1. At Stations 3 and 4, its mean and maximum abundances were 0.4 and 4 ind. m−3, respectively—approximately one-third of the values reported by Yip [43] for Galway Bay over a full year.

4.6.3. Polychaetes (Figure 4h)

Although not all specimens were identified, the genera Autolytus, Lanice, and Procena were encountered; Tomopteris was not. Abundance maxima at Stations 3 and 4 occurred from May to October. Only one polychaete was found at Station 1, in August.

4.6.4. Major Copepods

(Note: Sex ratios are expressed as M:F. Cited ratios originally expressed as F:M have been converted.)
Acartia bifilosa (Giesbrecht) (Figure 4i)
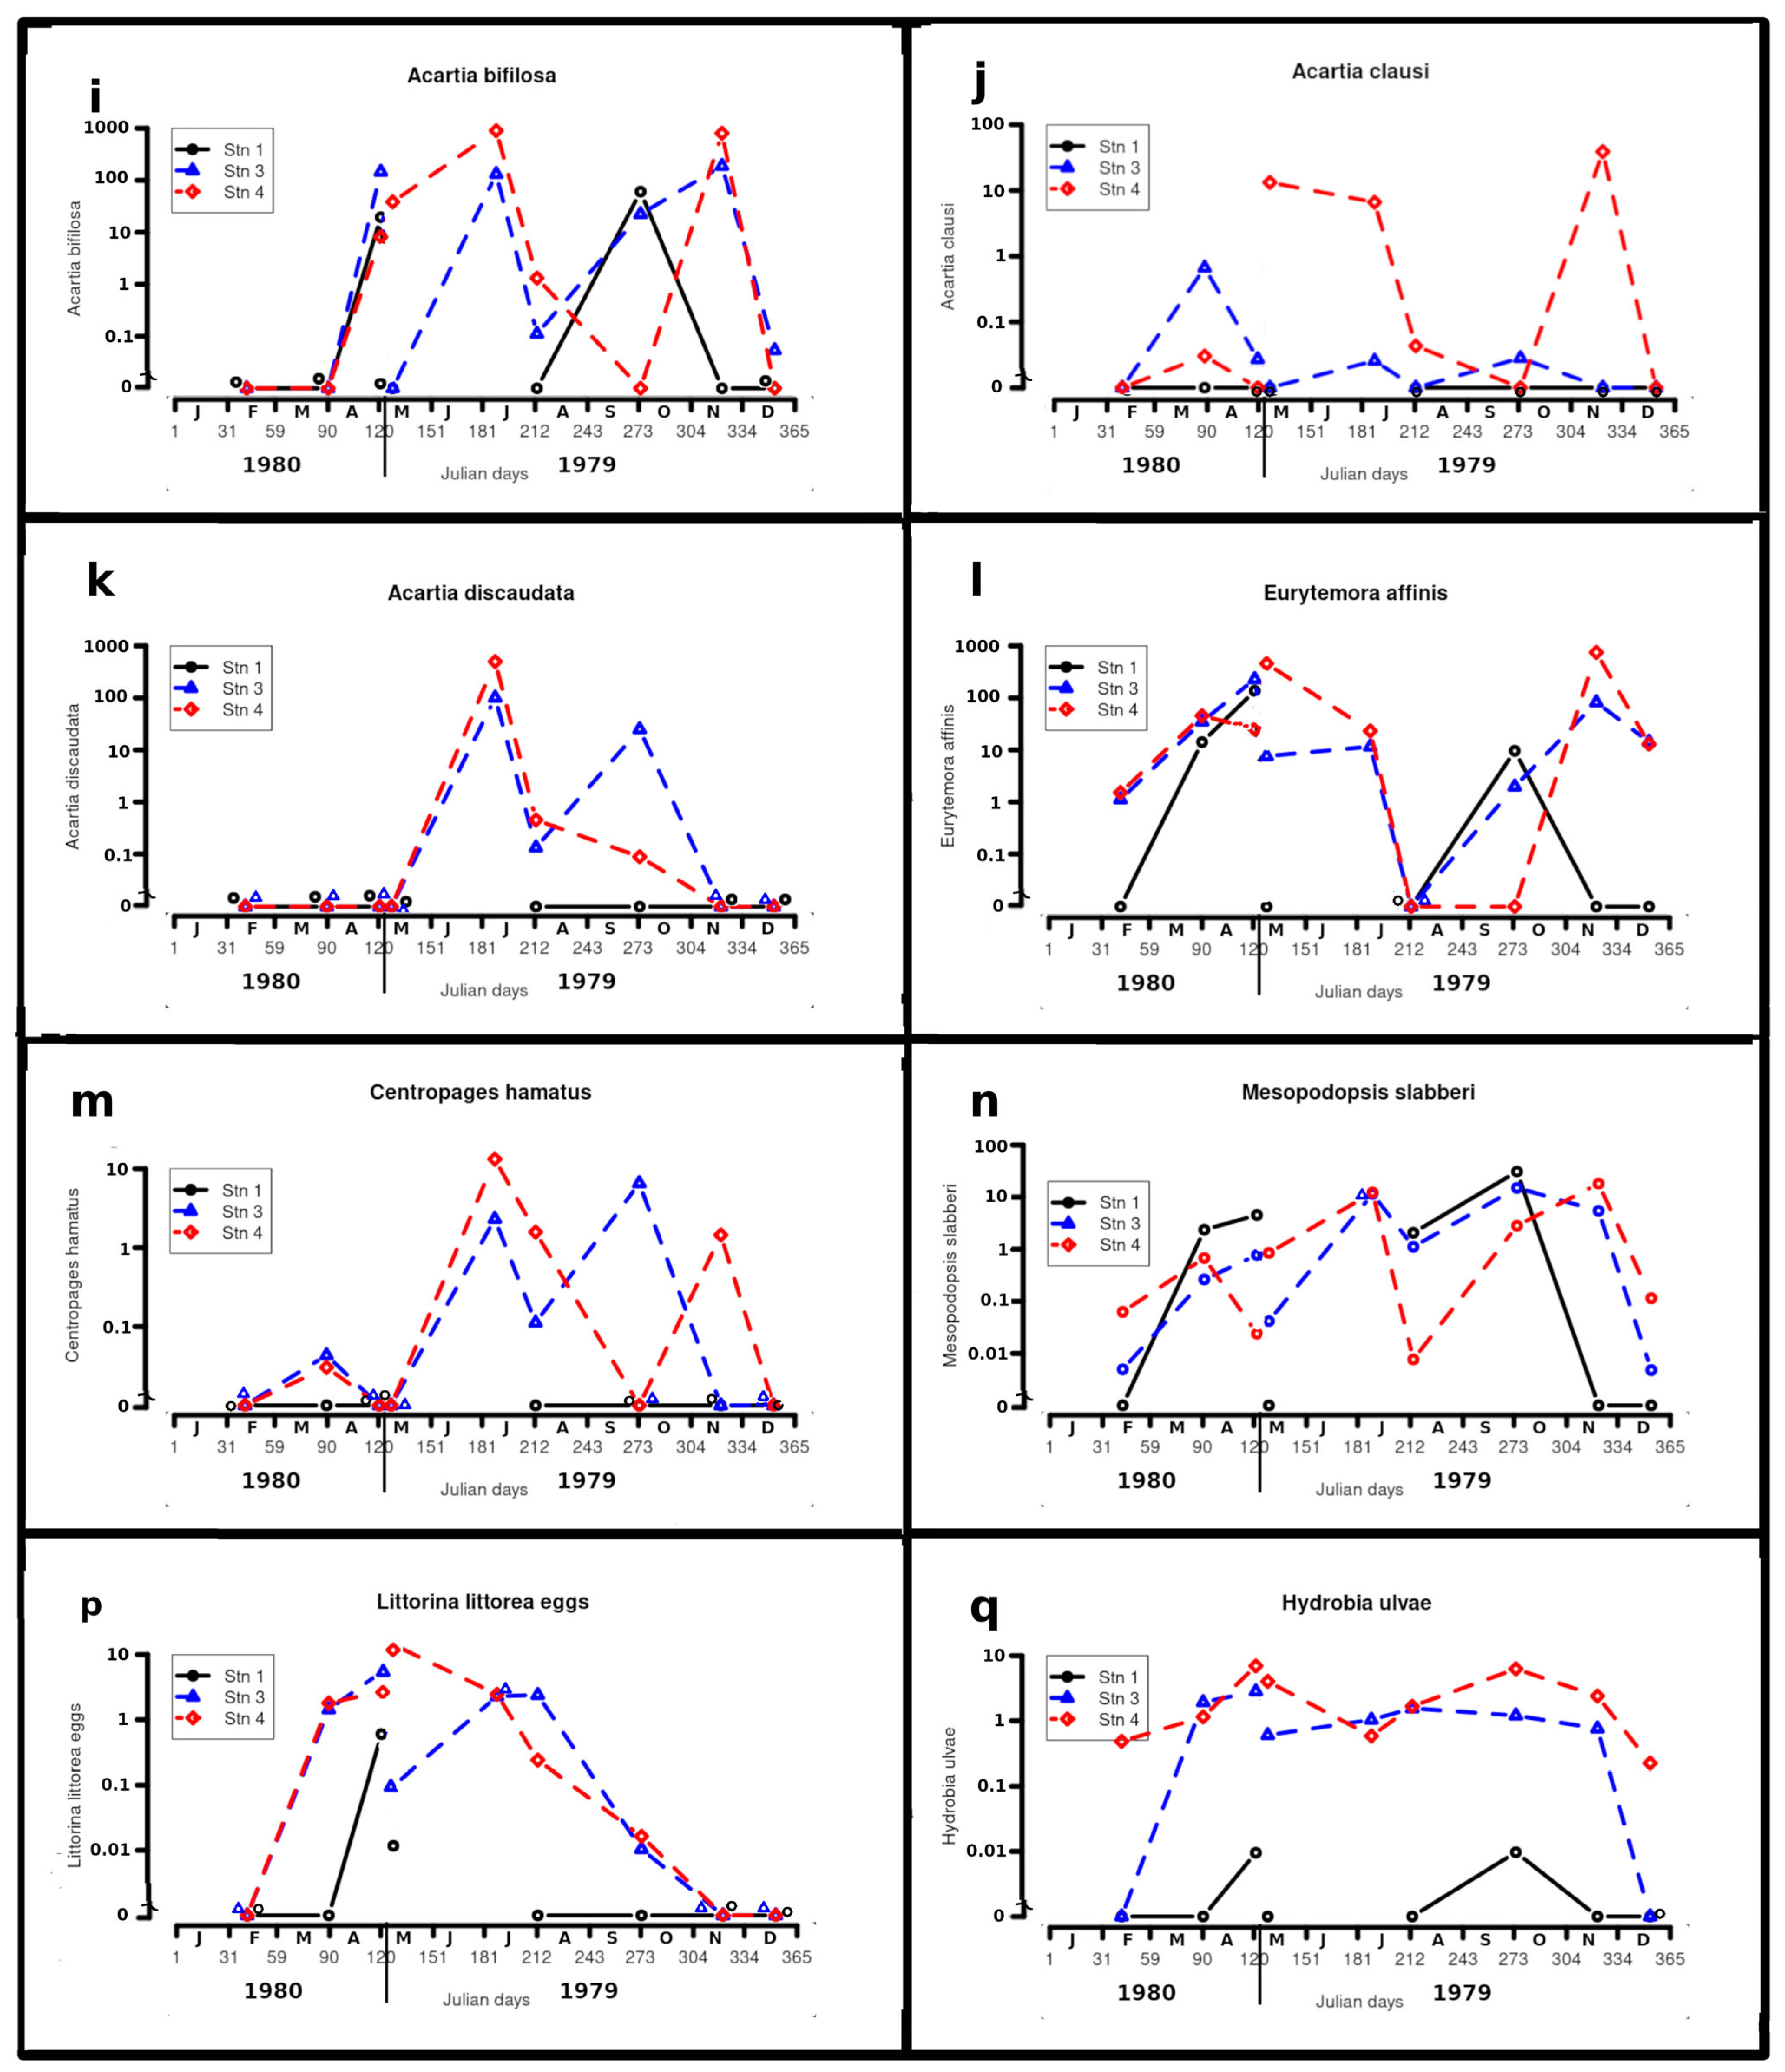
Together with Eurytemora affinis, this was one of the most abundant copepods, although it was virtually absent from December to April. Occasional juveniles were found in November, December, and May 1980. It was often abundant at Stations 3 and 4, reaching a maximum of 900 ind. m−3 at Station 4 in July, at bottom salinities ranging from 8.5 to 27.0 PSU. The overall sex ratio was 1:2.9 (M:F).
Acartia clausi Giesbrecht (Figure 4j)
This species occurred from May to November. It was sporadically abundant at Station 4 (maximum 42 ind. m−3 in November) and was found at bottom salinities from 16.4 to 27.1 PSU. The overall sex ratio was 1:9 (M:F). It was not found at Station 1.
Acartia discaudata (Giesbrecht) (Figure 4k)
This species was found, at times abundantly, at Stations 3 and 4, but only in July, August, and October (bottom salinities 22.5 to 27.1 PSU). It reached a maximum of 540 ind. m−3 at Station 4 in July. The sex ratio was 1:2 (M:F). It was not encountered at Station 1.
Eurytemora affinis (Poppe) (Figure 4l)
This species was encountered on all cruises except August and, together with Acartia bifilosa, was one of the most abundant copepods. Its maximum abundance (810 ind. m−3) occurred at Station 4 in November, across a salinity range of 5 to 27 PSU. Females with eggs were found from April to December, and females with spermatophores were also observed in November. The overall sex ratio was 1:0.65 (M:F). For comparison, other studies report: Dutch Wadden Sea, 1:5 [60]; Gironde estuary, 1:8 to 1:0.45, with a positive relationship between the proportion of males and total abundance [50]. In the Seine estuary, Devreker et al. [61] conducted a detailed study and found mean sex ratios of 1:0.65 in bottom water and 1:0.5 in surface waters.
Eurytemora velox (Willieborg)
This species occurred at Station 1 in May 1980 (5 ind. m−3) when surface salinity was 15.1 PSU. Otherwise, occasional specimens were sampled at Stations 3 and 4, including females with spermatophores in November. Its presence may indicate freshwater or brackish salt-marsh run-off.
Temora longicornis (O.F. Müller)
This species occurred at Stations 3 and 4 (2 ind. m−3) in November (minimum bottom salinity 14.1 PSU). Hensey [15] found it quite abundant in the Shannon estuary, especially in May, but also in August and September. The reason for this distributional difference with our survey remains unexplained.
Pseudocalanus elongatus Beck
This species occurred sporadically at Stations 3 and 4, especially in November and April, with single specimens in May 1979, December, and February. The minimum bottom salinity at which it was found was 11.7 PSU, and its maximum concentration was 2 ind. m−3 at Station 3 in November (bottom salinity 14.1 PSU). According to Hensey [15], this is a cold-water species in the Irish context, consistent with its absence from July to October in our study. Hensey recorded it in very high numbers in the Shannon estuary in May 1978.
Centropages hamatus (Lilljeborg) (Figure 4m)
This species was found at Stations 3 and 4 in April and from July to November. The maximum concentration was 14 ind. m−3 at Station 4 in July. The minimum bottom salinity at stations where it occurred was 16.4 PSU. The overall sex ratio was 1:8.7 (M:F). Hensey [15] found this species to be ubiquitous and abundant from Loop Head to Foynes over a salinity range of 25 to 35 PSU.

4.6.5. Other Copepods

Isolated specimens of Calanus helgolandicus, Paracalanus parvus, Diaptomus gracilis, Oithona helgolandica, Oithona nana, and Caligus curtus were collected. C. curtus is a “sea louse” parasitic primarily on gadoid fishes [62]. Harpacticoids were also found sporadically on all cruises except in November and December.

4.6.6. Cirripedes

Cirripede larvae were encountered at Stations 3 and 4 in May, July, and August. In the lower estuary, Hensey [15] found Balanus balanoides larvae abundant in May and Chthamalus stellatus larvae abundant in August and September.

4.6.7. Mysids

Gastrosaccus spinifer (Goës)
Three specimens were found at Station 4 in November.
Mesopodopsis slabberi (Van Beneden) (Figure 4n)
This species was present on every cruise and at every station, except Station 1 from November to February when salinities were zero. The largest concentrations were 34 ind. m−3 at Station 1 in October, 20 ind. m−3 at Station 4 in November, and 16 ind. m−3 at Station 3 in October. In low salinities, adults were often absent or scarce. Although egg presence was not noted in all samples, adult females with eggs were found in May 1979, July, August, October, and May 1980, while non-breeding adult females were noted in May 1979 and August. This is a euryhaline, estuarine species [63]. Hensey [15] found large numbers of M. slabberi from Tarbert to Foynes, with the highest abundances at depths of 10 and 15 m.
Neomysis integer (Leach)
This species was found sporadically in low to moderate numbers at all stations on all cruises except October. Most individuals were juveniles (suggesting possible net avoidance by adults), but a breeding female was encountered at Station 1 in July.

4.6.8. Isopods

Idotea chelipes occurred on most cruises at Station 4 and occasionally at Station 3. It characteristically lives among brackish-water intertidal algae.
Gnathiid isopods, most apparently Paragnathia formica, were collected sporadically on most cruises. The juveniles, known as pranizae, are frequently ectoparasitic on fish and are often captured in plankton nets [64].

4.6.9. Amphipods

Sporadic examples were taken, including Corophium volutator (Station 4, February) and Metopa alderi (Station 4, July).

4.6.10. Decapods

Carcinus maenas (L.)
Larvae occurred in small numbers in August, April, and May 1980 (maximum 0.2 ind. m−3 at Stations 3 and 4 in August). Adults were widely distributed on the shore around Aughinish [19].
Crangon crangon (L.)
These shrimps were found sporadically in small numbers (maximum ~0.05 ind. m−3 at Station 3 in July). Adults and juveniles occurred in April, May, July (some with eggs), October, November, and December (when four adults were collected from zero salinity), April, and May 1980. Zoeae were found in May, July, and August. Hensey [15] found larvae at all her stations in the Shannon, from Loop Head to Foynes, generally in moderate numbers. Adults were abundant on the shore around Aughinish, especially from May to November [18,19].
Other Decapods
An adult and a zoea of Micropipus pusillus were encountered, as well as single zoeae of Upogebia deltaura and Anapagurus laevis.

4.6.11. Molluscs

Hydrobia ulvae (Pennant)—adults (Figure 4q)
This species was often abundant. It occurred at Station 4 on all cruises and at Station 3 on all cruises except February and December. At Station 1, it was found only in May and October in very small numbers. Maximum abundances were 12 ind. m−3 at Station 4 in April. O’Sullivan [18] found these snails very abundant on the shores around Aughinish. Their normal habitat is estuarine or marine mud, generally around mid-tide level. They crawl down the beach as the tide ebbs and are floated back up on the flood tide under the water film [65] or on mucus rafts [66]. Sampling during the flood tide may explain the large numbers captured by the plankton net. The low numbers recorded in low-salinity conditions may be due to the tendency of H. ulvae to remain in their shells when salinities are low [67].
Littorina littorea (L.)—egg capsules (Figure 4p)
Egg capsules containing two to three eggs were present from April to October and were least common at Station 1. Maximum abundances were 6 ind. m−3 at Station 4 in May 1979. Adults occur intertidally all around Aughinish [18], and Hensey [15] found their eggs in the Shannon estuary in September and May. Thus, breeding of L. littorea in the Shannon estuary lasts from at least April until late September. Byrne [8] found L. littorea eggs in the Dunkellin estuary, Galway Bay, from January to July, which contrasts with our findings.
Other Molluscs
Gastropod and lamellibranch larvae occurred sporadically.

4.6.12. Tunicates

Oikopleura dioica Fol (Figure 4r)
This species was present from May to October. It was most abundant at Station 4 in July (~200 ind. m−3) and least abundant at Station 1. The minimum bottom salinity at which it was encountered was 18.2 PSU. Hensey [15] found the species virtually throughout the sampled area in May, August, and September. Low salinity appears to limit its distribution around Aughinish.

4.6.13. Fishes

The following fish species were encountered:
  • Anguilla anguilla: Elvers (65–75 mm) were found at all stations from December to May, with a maximum of ~25 ind. (~0.7 ind. m−3) at Station 1 in April.
  • Gasterosteus aculeatus: One individual from Station 1 in November.
  • Gobiidae: Larval gobies occurred at maxima of ~2 ind. m−3 from May to November at all stations.
  • Platichthys flesus: Flounder larvae and early juveniles (9–10 mm) occurred, most abundantly at Station 1 (~1 ind. m−3) in April and May.
  • Sprattus sprattus: Three sprats (yolk-sac stage to 10 mm) were found at Station 4 in February and May.
  • Syngnathus rostellatus: Pipefish (16–100 mm) were encountered, mostly singly, at Stations 1 and 3 from July to October.

4.7. Mesozooplankton Diversity

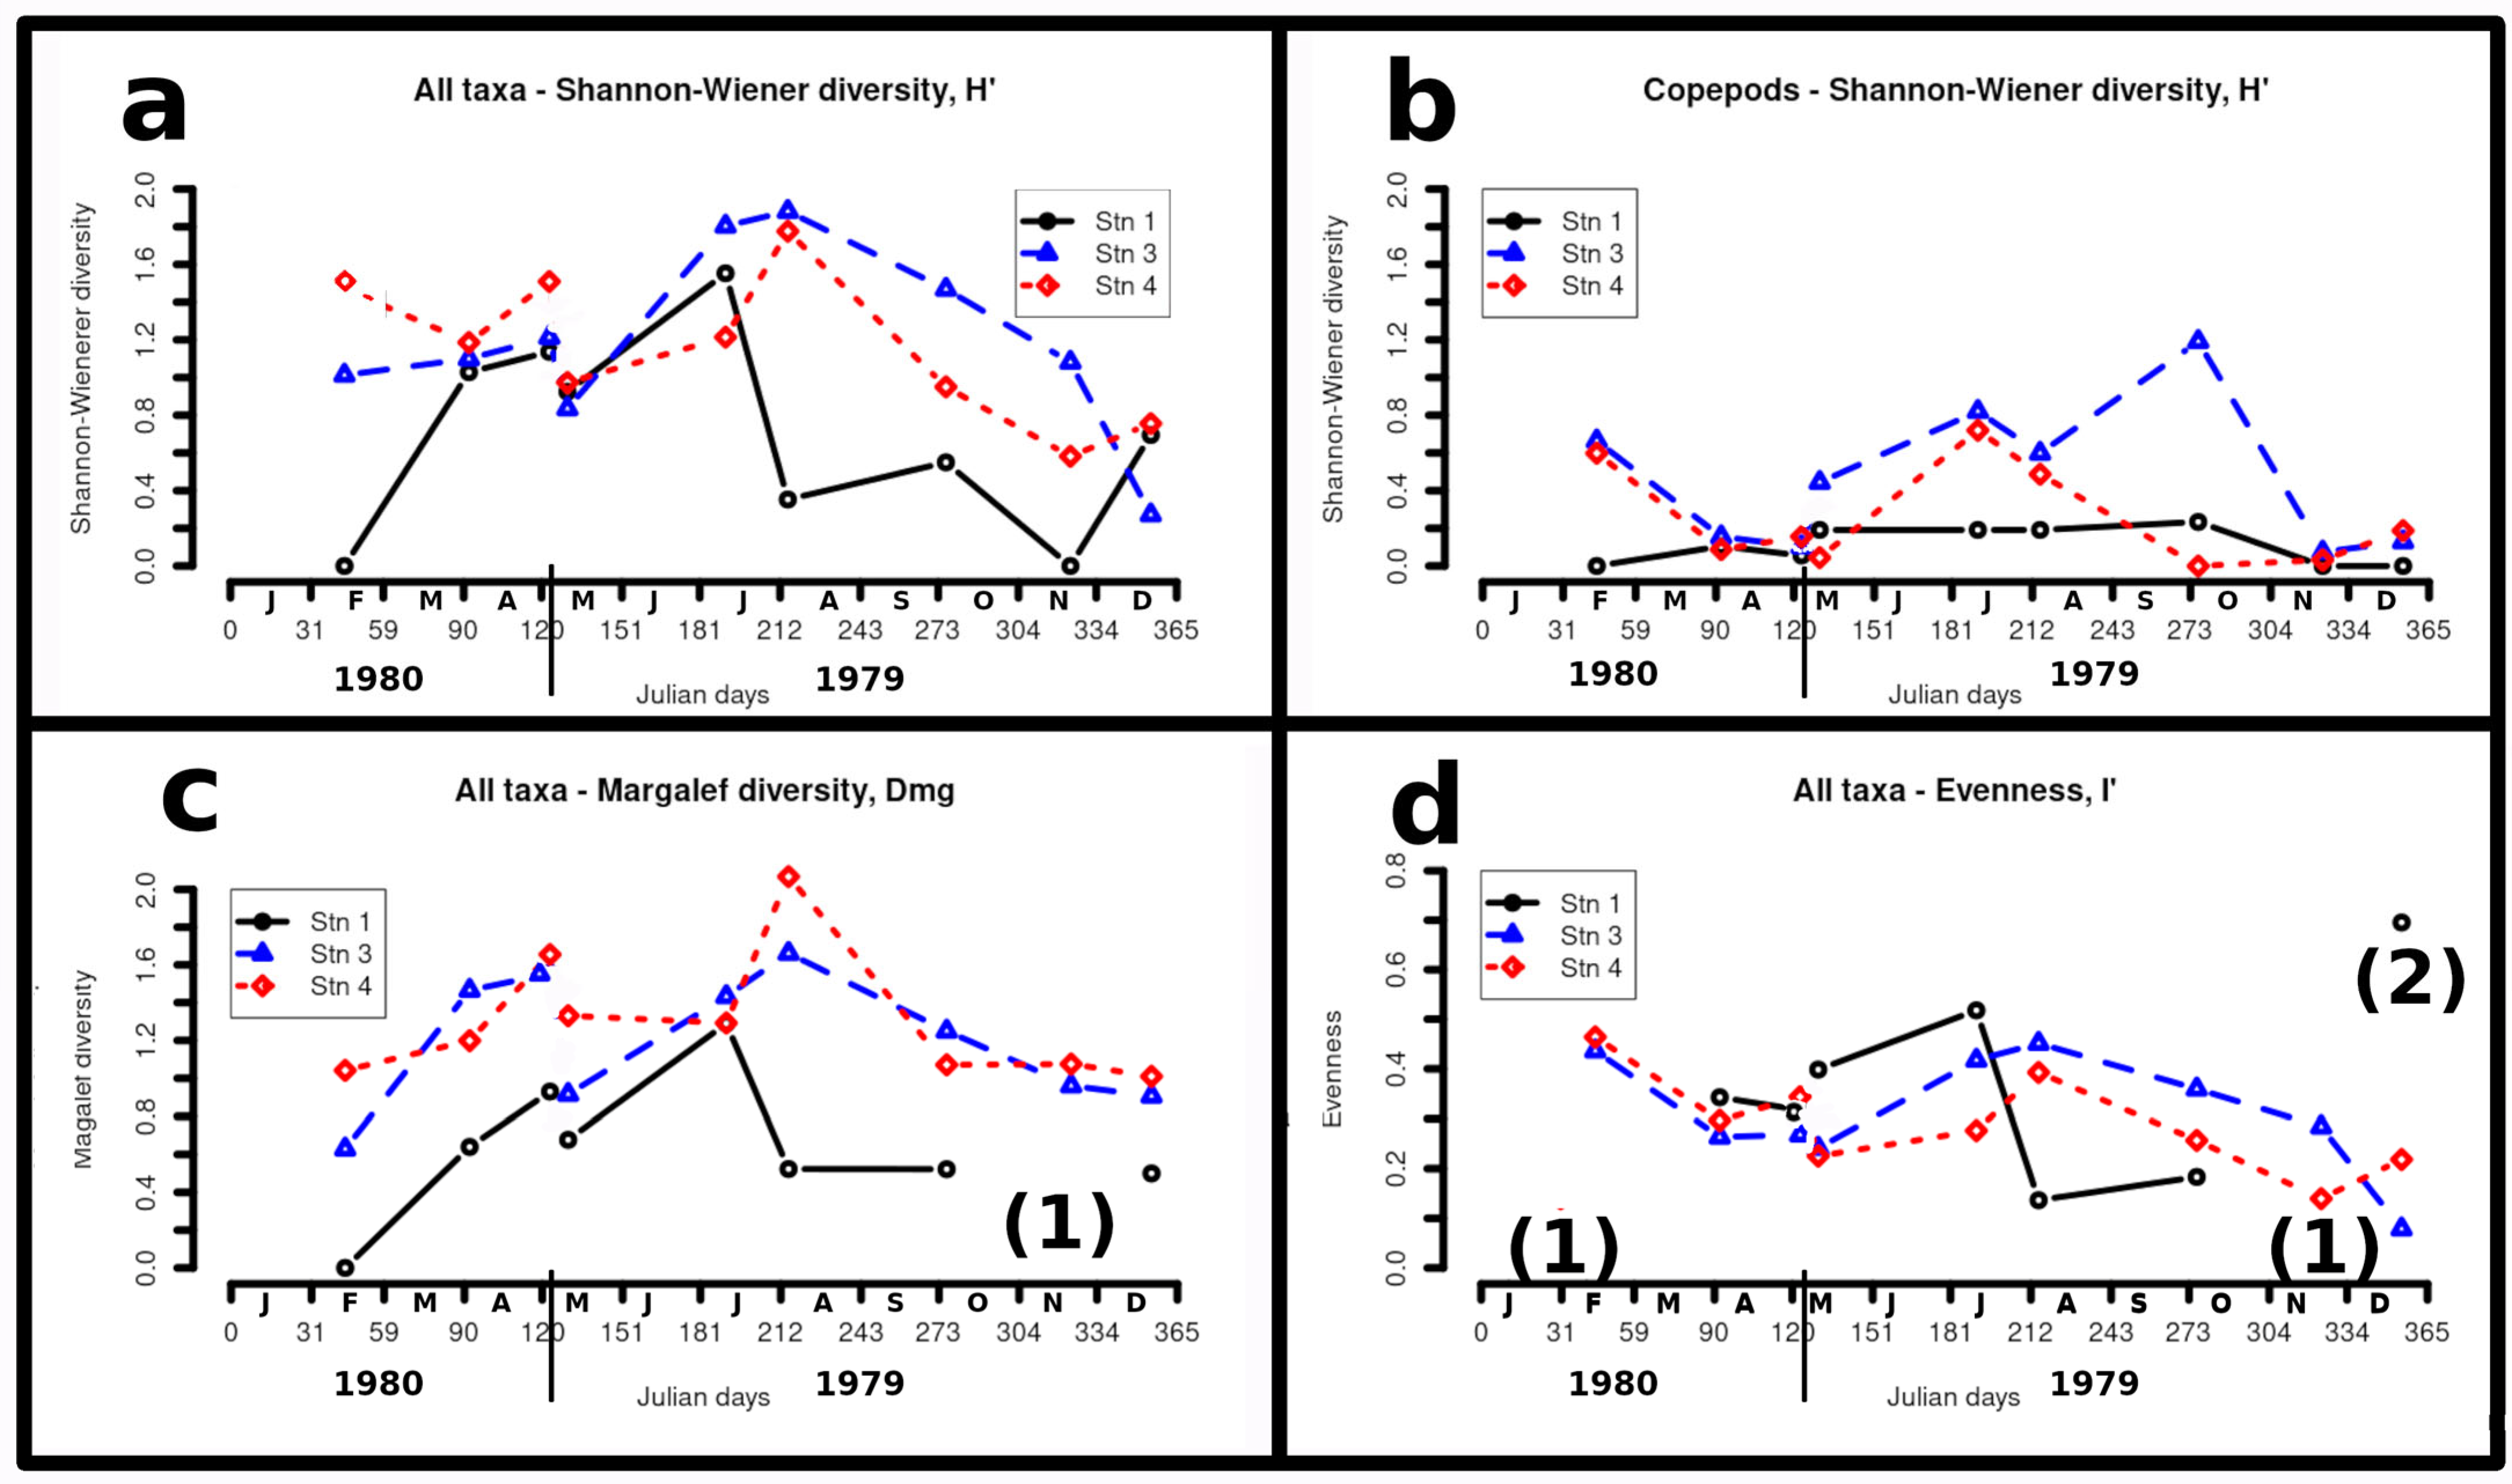
Figure 5a shows Shannon–Wiener diversity, H′, values for all taxa. At stations 3 and 4, values were already moderately high (1.0 to 1.6) in February, peaked in August (~1.8) then declined steeply to minimum values in November (0.6 to 1.1) and particularly December (0.3 to 0.7). Figure 5b shows H′ values just for copepods; at stations 3 and 4, moderate values in February (~1.0) declined to May in both years (0.05 to 0.5), peaked in July for both stations (~0.8), increasing further in October for station 3 (~1.2), then declining to low values in November and December (0.05 to 0.25). Figure 5c shows Margalef diversity (richness), Dmg for all taxa; at stations 3 and 4; fairly low values (0.6 to 1.05) in February increased to peaks in May 1980 (~1.6) and August (1.6 to 2.0), then declined only gradually to December (~1.0). Figure 5d shows evenness, I’, At stations 3 and 4, maximum values in February (~0.45) dipped to a minimum (0.2 to 0.35) in May of both years, increased to a second maximum 0.4 to 0.45) in August, then declined gradually to minima in November and December (0.1 to 0.3).
For all the four variables, values at station 1 varied widely, and may have been distorted by the low numbers of taxa or individuals, or both, in some samples.

4.8. Principal Component Analysis (PCA) Interpretation

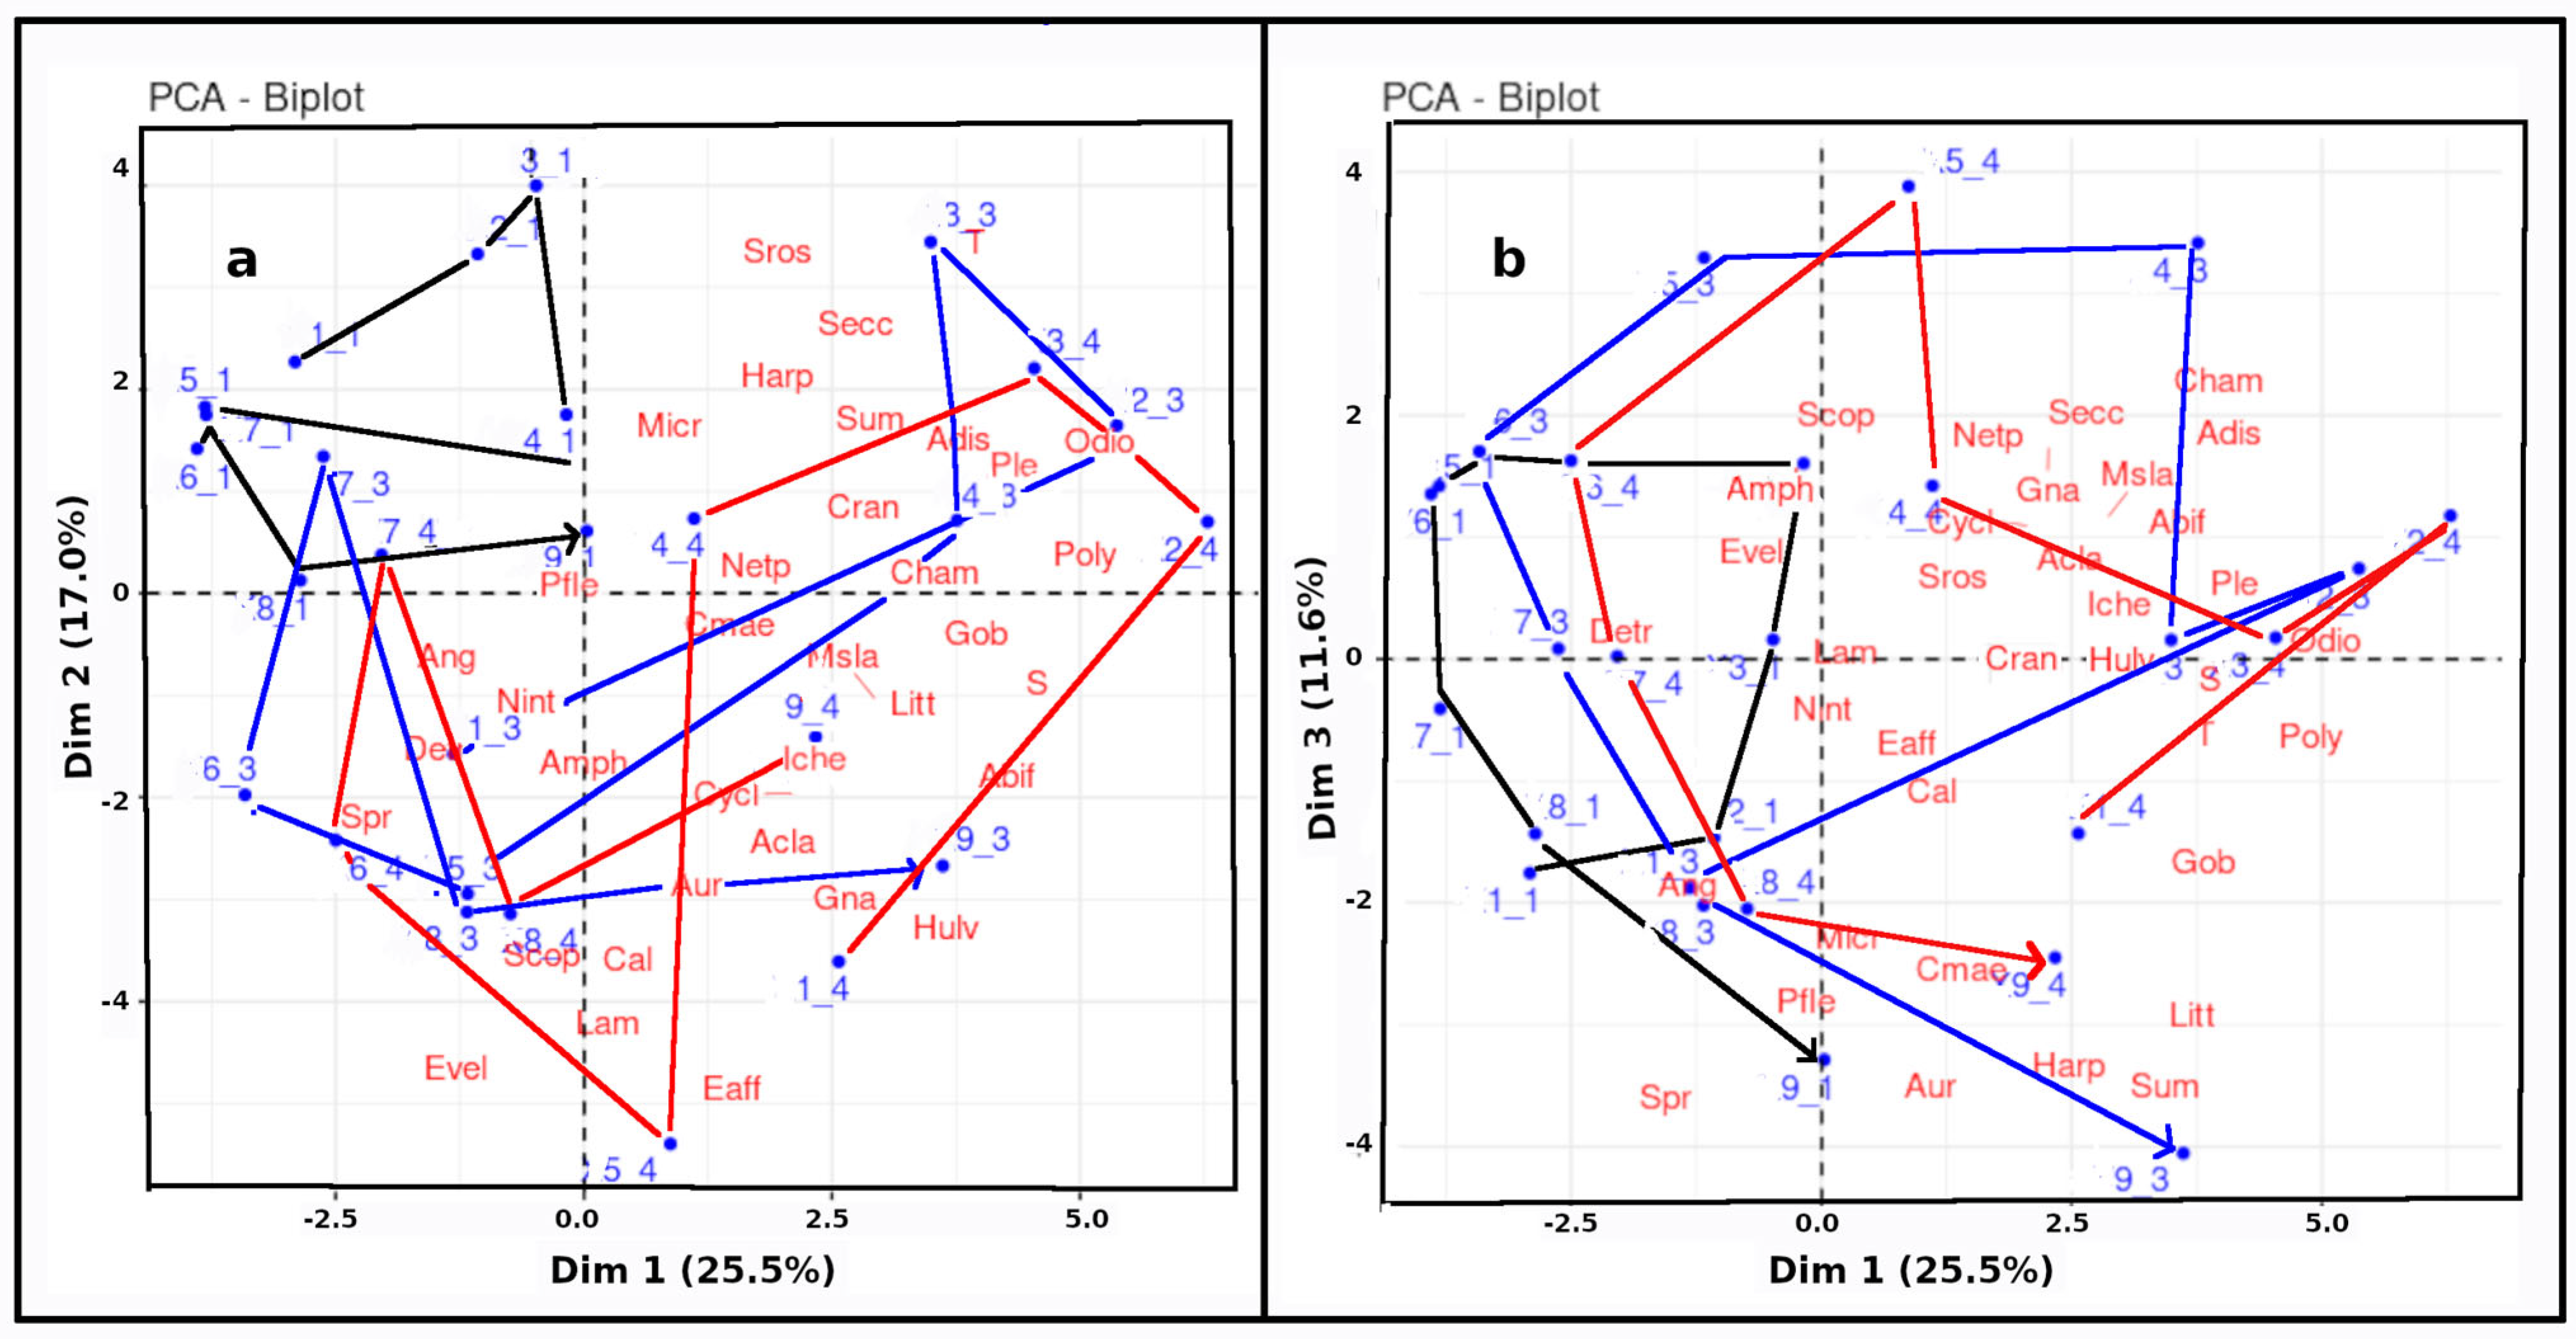
Figure 6 shows the Principal Component Analysis (PCA) of celestial, physico-chemical, and biological variables plotted in the hyperspace of the three dominant dimensions (D1, D2, D3), which together represent 54.1% of the total variance.
Figure 6a shows the D1-D2 plane, with D1 and D2 contributing 26% and 17% of the variance, respectively. The fact that the three dominant dimensions represent a moderate percentage of the total variance suggests complex, multi-factorial relationships among the variables.
Salinity loaded strongly positively on D1, as did Temperature. Thus, this dimension can thus be primarily described by the variability of these two parameters along the annual cycle. All samples from Station 1 (Deel River), as well as samples from the seventh cruise (7_3, 7_4) in February, are located in the upper-left quadrant or on its border. Correspondingly, the salinity (S) vector points towards the opposite (bottom-right) quadrant. The upper-left quadrant is almost devoid of taxa, reflecting the low salinity and low abundance of most mesozooplankton species at Station 1 on all cruises, and at Stations 3 and 4 in February.
Figure 6b shows the D1-D3 plane. Although D3 contributes only 11.7% of the total variance, it adds considerable intuitive understanding. In this plane, the spring equinox (Spr) and summer solstice (Sum) score highly in the bottom-left and bottom-right quadrants, respectively, approximately 90° apart. Consequently, the top-right and top-left quadrants typify the autumn equinox and winter solstice, respectively. The trajectories of all stations show an anticlockwise rotation through these seasonal quadrants over the annual cycle.
In Figure 6a (D1-D2 plane), the scores for Station 1 are confined to the upper-left quadrant. In Figure 6b (D1-D3 plane), the celestial variables Spr and Sum occupy the lower-left and lower-right quadrants, respectively.
Over the annual cycle, the scores for Stations 3 and 4 describe a roughly anticlockwise rotation through the four quadrants, corresponding to the summer solstice (lower-right), autumn equinox (upper-right), winter solstice (upper-left), and spring equinox (lower-left). Station 1 also rotates anticlockwise but appears constrained or “pushed” towards the left (winter-spring) side of the D1-D3 plane in Figure 6b.
In the D1-D2 plane, Station 1 remains confined to the upper-left quadrant, where essentially no taxa are found, suggesting that this station was generally unfavourable for mesozooplankton.
Most biological variables scored positively on D1 (associated with the summer solstice/autumn equinox and high Temperature and Salinity). Notable exceptions were the nektonic elvers of Anguilla anguilla (Ang) and Eurytemora velox (Evel), as well as the detritus volume (Detr). On the D2-D3, plane, Detr loaded in opposition to Secchi disc transparency (Secc).
In summary, in the D1-D2 plane, the Deel estuary (Station 1) evolved separately over the year from the Shannon (Station 3) and Robertstown (Station 4) estuaries. In the D1-D3 plane, Spr and Sum are distributed at right angles, with the stations revolving in a roughly circular pattern, tracking the progression of the seasons.

4.9. Grazing Rates (Trophic Impact)

4.9.1. Predatory Grazing Rates by Pleurobrachia pileus

Table 2 shows that the year-round mean grazing rate by P. pileus was 0.00, 0.08, and 0.75 L m−3 d−1 at Stations 1, 3, and 4, respectively, giving an overall mean of 0.28 L m−3 d−1. The maximum grazing rate was 3.5 L m−3 d−1 at Station 4 in August. As this organism is an obligate carnivore, its grazing rates are considered separately from the herbivorous/detritivorous impacts determined for the other major taxa in this study.

4.9.2. Eurytemora affinis

As shown in Table 3, the year-round mean grazing rate by the E. affinis population was 0.05, 0.11, and 0.46 L m−3 d−1 at Stations 1, 3, and 4, respectively. The maximum grazing rate observed was 2.9 L m−3 d−1 at Station 4 in November.

4.9.3. Grazing Rates by Acartia spp.

Table 4 shows that the mean grazing rate by all Acartia species was 0.03, 0.24, and 0.67 L m−3 d−1 at Stations 1, 3, and 4, respectively, with an overall mean of 0.31 L m−3 d−1. The maximum rate was 5.5 L m−3 d−1 at Station 4 in July.
This calculated grazing rate represents the consumption of microphytoplankton and detritus captured via filter-feeding. Acartia spp. also raptorially grasp larger prey, such as nauplii, when available. However, there is currently insufficient published information to quantify the trophic impact of this carnivorous feeding mode.

4.9.4. Grazing Rates by All Copepods

Table 5 shows the summed grazin rates by all copepods. The year-round mean estimated grazing rates of all copepods (except copepodites and nauplii) were low, nearly two orders of magnitude less than that of the mysids”.

4.9.5. Grazing Rates by Mysids

As shown in Table 6, the year-round mean grazing rate by Mesopodopsis slabberi (adults and juveniles combined) was 77, 5, 36.7 and 4.6 L m−3 d−1 at Stations 1, 3, and 4, respectively. The maximum rate observed was 491 L m−3 d−1 at Station 1 in October. Maxima at all stations occurred in October or November, with secondary maxima at Stations 3 and 4 in July.
The relative contribution of juveniles to the total grazing by M. slabberi was only 16% at Station 1, but substantially higher at Stations 3 (92%) and 4 (73%).
The overall grazing rate, and hence trophic impact, of mysids exceeded that of O. dioica by approximately one order of magnitude and that of all copepods combined by about two orders of magnitude. Although copepods exerted their smallest grazing impact in the Deel estuary (Station 1), this was where M. slabberi exerted its greatest impact.

4.9.6. Grazing Rates by Oikopleura dioica

As shown in Table 7, the mean grazing rate by O. dioica was 0.014, 0.56, and 2.7 L m−3 d−1 at Stations 1, 3, and 4, respectively, resulting in an overall year-round mean of 1.1 L m−3 d−1. The maximum rate was 22 L m−3 d−1 at Station 4 in July. Maxima occurred in July or August at all stations, consistent with the species’ presence being confined to the period from May to August.

4.9.7. Total Filter-Feeding Grazing Rates (Trophic Impact) by the Mesozooplankton

The biomass of other herbivores (e.g., polychaetes, crustacean and mollusc larvae) was negligible compared to the contributions of mysids, Oikopleura and copepods. We therefore estimate that the total filter-feeding grazing rate of the mesozooplankton community is effectively the sum of the grazing by these three groups.
Estimates of this combined herbivorous grazing pressure are presented in Table 8. Dominated by M. slabberi, the total grazing pressure exhibited two pronounced peaks (May-July and October-November) and two distinct minima (August and December-February). The mean annual grazing rates were 78, 40 and 46 L m−3 d−1 at Stations 1, 3, and 4, respectively, with an overall mean of 54 L m−3 d−1. The maximum rate observed was 491 L m−3 d−1 at Station 1 in October.

5. Discussion

5.1. Inclusion of Celestial Variables: An Innovation

A key innovation of this study was the inclusion of the celestial variables—and Sum—the trigonometric components representing the spring equinox and summer solstice, respectively—in thePrincipal Component Analysis (PCA). The autumn equinox and winter solstice are represented by the negative values of these variables, -Spr and -Sum.

5.2. Trophic Structuring by the Mesozooplankton

Estuaries generally support higher zooplankton biomasses than adjacent continental shelves and are often dominated by specific groups such as copepods, cladocerans, or mysids [68]. Zooplankton sampling with nets involves well-known quantitative uncertainties, including net clogging (particularly when detritus is abundant), the partial loss of small organisms through mesh apertures, and net avoidance by more mobile taxa [69] While our results are subject to these limitations, the approach likely provides a broader picture of trophic impact and mesozooplankton diversity than a single mesh size would have achieved.
The ctenophore Pleurobrachia pileus is a carnivore that feeds by trailing two tentacles to entrap and immobilize prey. Pleurobrachia spp. typically consume prey such as fish larvae and mesozooplankton, with copepods often predominating [70]. In our study, the trophic impact of P. pileus was confined to May to November (Table 2). Mean annual grazing rates were 0.00, 0.08, and 0.75 L m−3 d−1 at Stations 1, 3, and 4, respectively, and the species was not observed at Station 1. Yip [43] suggested that P. pileus was ingesting detritus in the Shannon estuary, based on the yellowish material observed in their guts. An alternative explanation is that they were preying upon E. affinis, which itself had ingested suspended detritus (see below).
The copepod component was dominated by four species: Eurytemora affinis (Figure 4l), Acartia bifilosa (Figure 4i), Acartia discaudata (Figure 4k), and Acartia clausi (Figure 4j). A. discaudata and A. clausi were never found at Station 1. All three Acartia species exhibited a distinct abundance minimum from November to February. In contrast, E. affinis remained abundant throughout the winter but was never recorded at zero salinity, unlike populations in the Elbe estuary [71] and the American Great Lakes [72]. The year-round mean estimated grazing rate for all copepods combined (excluding copepodites and nauplii) was 0.08, 0.35, and 1.1 L m−3 d−1 at Stations 1, 3, and 4, respectively (Table 5)—nearly two orders of magnitude lower than that of the mysids.
The mysid Mesopodopsis slabberi exerted year-round mean estimated grazing rates of 77, 37, and 41 L m−3 d−1 at Stations 1, 3, and 4, respectively (Table 6). The larger mysid, Neomysis integer, was much less abundant, and its trophic impact has not been estimated. It is possible that N. integer evaded capture more effectively than M. slabberi.
The larvacean Oikopleura dioica secretes a mucous house with filters that allow it to feed on nano- and picoplankton, as well as colloidal organic matter [73]. While its grazing rate was quantitatively comparable to that of the copepods in this study, it primarily impacts smaller particles than those cleared by mysids and copepods. This species was observed only from May to October and was far more abundant at Station 4 than at Station 3, and nearly absent at Station 1. This distribution suggests it may be advected into the study area from summer plankton populations in the lower estuary and adjacent coastal ocean. Its main competitors for food were likely heterotrophic and mixotrophic micro- and nano-flagellates [21,22,74].

5.3. The Mesozooplankton Community

5.3.1. General Considerations

This section discusses the major animal components sampled. Some of the larger organisms, particularly adult mysids and juvenile fish, may be classed as nekton or nektoplankton. For simplicity, they are all referred to here as “mesozooplankton”.

5.3.2. The Importance of Our Three-Mesh Net

Our three-mesh net sampled a wider size range of plankton than would have been possible with a single-mesh net, such as a WP2 [31,75]. While some loss of precision in estimating the abundance of smaller netplankton must have occurred, the largest mesh (1.0 mm) was crucial for capturing nektoplanktonic organisms like mysids and some juvenile fish. Even so, highly active swimmers like mysids may have been undersampled.

5.3.3. The Mesozooplankton Taxa

The Major Copepods: Eurytemora and Acartia
Eurytemora affinis has invaded freshwaters from the sea multiple times over the last 200 years, implying different populations have also invaded estuaries over the same timescale. Lee [45] suggested that E. affinis constitutes a complex of cryptic species—morphologically conservative but genetically pre-adapted for rapid evolution in salinity preference. This may explain why laboratory-determined salinity tolerance ranges differ markedly for E. affinis from different estuaries. Motorized shipping over the last century and a half has further complicated the spread of copepods and their resistant diapause eggs via ballast water [76]. The salinity of peak abundance for E. affinis varies widely: near zero in populations recently introduced to the American Great Lakes [45] and the Elbe estuary [71]; between 0.5 and 10 in the Weser estuary [77]; zero to 1 in the Gironde estuary [47,78]; about 16 in the Shannon estuary (present study); and below 30 [44,79] or between 20 and 25 [80] in the Severn estuary.
Acartia bifilosa occurs together with E. affinis in many European estuaries. Its salinity of peak abundance also varies: 15–22 in the Gironde [50], 13–25 in the Shannon (present study), and 27–33 in the Severn [79].
Reporting on laboratory investigations of E. affinis from the Dutch Wadden Sea, Vaupel-Klein and Weber [60] concluded that “biotic factors (such as food competition, predation, and parasitism) … may be instrumental in controlling occupation of the marine habitat by E. affinis”. The fact that widely occurring estuarine mesozooplankton species like E. affinis, A. bifilosa, M. slabberi, and juvenile Sagitta are found in different, though somewhat restricted, salinity ranges across various estuaries suggests that while salinity may control distribution in the short term, other factors may be influential over longer timescales, potentially by forcing the evolution of salinity tolerance.
The type of available food is one obvious candidate. Levels of suspended sediment and detritus are generally highest in the uppermost parts of estuaries, often associated with high concentrations of heterotrophic bacteria and nanoflagellates, more or less aggregated with detritus into larger particles. Other factors could be the absolute concentration of detritus or its ratio to living phytoplankton. For instance, Chervin [81], studying an estuary where the detritivorous E. affinis was absent, found that copepod development rates were inversely related to detritus concentration, even with roughly constant chlorophyll levels throughout the estuary. He concluded that high detritus levels could prevent effective feeding on phytoplankton by clogging filtering mechanisms, a factor that would affect some species more than others.
Although E. affinis can utilize phytoplankton [82,83], ciliates [84], and detritus [49,85,86], it can survive exclusively on estuarine detritus [50]. In contrast, Acartia spp. require some healthy phytoplankton as well [50,51,52,53]. Even when phytoplankton is present in turbid parts of an estuary, excessively high concentrations of sediment or detritus are likely to reduce the foraging efficiency of A. bifilosa, thereby favouring E. affinis. Conversely, A. bifilosa may outcompete Eurytemora for phytoplankton where sediment and detritus are less abundant [53]. Adults of A. bifilosa have coarser feeding appendages than E. affinis and can also feed carnivorously [50]. In addition to competing with E. affinis for food, A. bifilosa may exert top-down control by preying on its nauplii, particularly when the species are co-dominant and suitable phytoplankton for A. bifilosa is scarce.
Acartia tonsa, which spread from North America to colonize West European estuaries and coastal waters during the twentieth century, is now considered dominant in many areas from the Gulf of Finland to the Mondego estuary in Portugal, including British coastal waters [87,88]. As it is known to be spread by ships’ ballast water [87], we confirm its absence in our 1979–1980 samples. Its subsequent appearance in the region would, therefore, not be surprising.
Position Maintenance by Estuarine Meso Plankton: The Case of Eurytemora affinis
The ability of estuarine planktonic animals to prevent their populations being washed out to sea is a major factor in determining their autochthonous occurrence in different estuaries. The tendency of E. affinis both to associate with detritus [50], and the in vitro observation that it tends to sink in relatively still water [77] may lead to its relatively greater occurrence near the bottom [15,49,80], and this in turn may help it to remain in estuaries like the Morlaix [89,90], and those with high flushing rates.
Mesopodopsis slabberi
Mesopodopsis slabberi occurs in salinities from 1.3 to 43. The genomes of M. slabberi from seven estuaries in continental western Europe, as well as of M. wooldridgei from South Africa, show strong genetic differences among populations in different estuaries. This suggests that genetic movement between estuaries has been low. This, may be associated with strong position maintenance by this vigourously swimming organism, coupled with brooding of the larvae in a brood pouch [91]. Like Eurytemora affinis [72], M. slabberi may be a complex of look-alike cryptospecies.
Oikopleura dioica
Oikopleura appeared at stations 3 and 4 between May and July, after the spring microplankton maximum, and its grazing pressure (maximum 43 L m−3 d−1, Table 8) may have contributed to controlling the nano- and pcoplankton abundance, but at station 1, where blooms of euglenoids and dinoflagellates occurred) [21,22].
Pleurobrachia pileus
In summer, the mesozooplankton suffered additional predation by the ambush predator Pleurobrachia of up to 3.5 L m−3 d−1 (Table 2), although this seems too weak to contribute significantly to the August copepod minimum (Figure 4f). Mysids, since they are very mobile, may be particularly vulnerable to this ambush predation. Although Pleurobrachia frequently takes larval fish [41], there appears to be no published data on predation on mysids by ctenophores.
Absence of Cladocerans
The absence of cladocerans is perplexing, as the species, Evadne normanni and Podon intermedius are found abundantly offshore of the mouth of the estuary [92], and Evadne is characteristic of low salinities in both the Baltic [93].
Hydrobia ulvae
Small gastropods Hydrobia ulvae are very abundant on the mud flats around Aughinish [18]. They drift in the water by crawling on to the surface film of the water, as the rising tide covers their mud flats [67]. The proximity of the stations in this survey to intertidal areas and the fact that sampling took place on the rising tide and mainly at Springs are thus all factors which may collectively explain the high abundance of H. ulvae in the plankton-net oblique tows. Meireles and Queiroga [94] found that floating by H. ulvae showed a strong fortnightly rhythm, with maxima at Spring Tides, and minima at Neaps. However, this rhythm is not confirmed in the Shannon estuary, as no minimum in our catches of H. ulvae occurred in August, when sampling was done at Neap Tides. The relative scarcity of H. ulvae at station 1 and their absence at station 3 from December to February suggests that they may be limited by salinity <~10 PSU. At station 4 (measured salinities 6.1 to 27.4 in the present study), H. ulvae floated all year round.

5.4. Diversity

The annual variation in Shannon–Wiener diversity (H′) and Margalef diversity (Dmg, or “richness”) for all taxa (Figure 5a and Figure 5c, respectively) showed pronouncedseasonal variations at each station. Station 1 was consistently less diverse than Stations 3 and 4.
At Stations 3 and 4, H′ showed only moderate seasonal variation, with maxima in August and minima in November and December. Dmg at these stations also peaked in August, with minima in February, November, and December. At Station 1, both H′ and Dmg peaked in July and reached marked minima in February. In temperate, non-monsoonal estuaries like the Gironde [50] and Morlaix Bay [90], taxon diversity (H′) is generally highest in summer and lowest in winter. This pattern can be attributed to two factors: a greater intrusion of allochthonous, halophile species in summer, and increased biological activity driven by higher light levels and temperatures. The annual patterns of copepod diversity at Stations 3 and 4 in our study resemble those in the Gironde estuary, but the variation was greater in the Shannon (Figure 5a).
The fact that the annual cycles of H′—calculated from different but overlapping mesozooplankton assemblages (Figure 5a,b)—followed similar patterns at Stations 3 and 4 indicates that mesozooplankton taxon diversity reflects a fundamental ecological state within the Shannon estuary. At these stations, H′ for all organisms (Figure 5a) and for copepods alone (Figure 5b) showed only a weak positive relationship with total mesozooplankton abundance (Figure 4e), copepod abundance (Figure 4f), and non-copepod mesozooplankton abundance (Figure 4s). The seasonal pattern of copepod diversity (Figure 5b) was completely different from that of copepod abundance (Figure 4f), remaining high despite a 1000-fold crash and subsequent 100-fold recovery in abundance at Station 3. This indicates that, in the Shannon estuary system, diversity is not functionally related to abundance. The lowest copepod diversity values at Stations 3 and 4 generally corresponded to periods of overwhelming dominance by E. affinis.
Margalef diversity (Dmg) showed distributions similar to H′, although the distinction between Station 1 n the one hand and Stations 3 and 4 on the other was more pronounced. The distributions of Evenness (I’, Figure 5d) are difficult to interpret; the high value at Station 1 in December is likely an artefact, as only two taxa were sampled.
In this study, the lower diversity values (H′, Dmg) for the total mesozooplankton reflect numerical dominance by either Mesopodopsis slabberi or Eurytemora affinis. Higher diversity reflects, in part, a greater ingress of allochthonous species (e.g., Pseudocalanus elongatus, Acartia clausi, A. discaudata, and to some extent Pleurobrachia pileus and Oikopleura dioica) from the ocean or lower estuary. It also reflects the development of a relatively diverse autochthonous meroplankton fauna that overwinters in the benthos, such as Hydrobia ulvae, decapod larvae, coelenterates, and Acartia bifilosa. Acartia spp. can be considered part of the meroplankton due to their ability to overwinter as benthic eggs [76].
Although total mesozooplankton abundance, particularly of marine species, was higher at Station 4 than at Station 3 (Figure 4e), mesozooplankton diversity at the two stations was similar (Figure 5a–c). This strongly suggests that mesozooplankton diversity was not merely a function of allochthonous intrusion (which was higher at Station 4), but also reflected autochthonous ecological differences within the estuary. Reduced diversity at these stations in winter likely reflects greater environmental harshness during this season.
The generally lower mesozooplankton diversity at Station 1 indicates that the estuarine environment of the Deel is harsher than adjacent parts of the Shannon estuary. This may be related to lower and more variable salinities, as well as washouts during high river discharge. The virtual absence of freshwater indicator species in the Deel estuary, however, suggests that the Deel River itself was poor in zooplankton, for either natural or anthropogenic reasons. The distinctly different annual pattern of diversity variation at Station 1 compared to Stations 3 and 4 (Figure 5a–c), along with its distinct mesozooplankton and phytoplankton composition [21,22], further confirms that the Deel estuary is environmentally distinct from the adjacent Shannon estuary.

5.5. The Factorial Analysis

The graphical presentation of the factorial analysis (PCA) in Figure 6a (D1-D2 plane) shows that Station 1 was confined to the upper-left quadrant, while Stations 3 and 4 moved primarily through the other three quadrants. This clearly demonstrates that Station 1 was ecologically distinct from Stations 3 and 4. No variables were strongly associated with the same quadrant as Station 1, except marginally for Platichthys flesus. In contrast, 15 variables occupied the opposite, lower-right quadrant, including salinity, Idotea chelipes, Acartia bifilosa, Hydrobia ulvae, Mesopodopsis slabberi, Aurelia aurita, and Eurytemora affinis. Salinity was a key variable in distinguishing Station 1 (compare Figure 3a,d,f). As plankton abundances were log-transformed for the analysis, the result that M. slabberi was more associated with Stations 3 and 4, despite its highest arithmetic mean abundance being at Station 1 (Deel), reflects its more consistent presence at Stations 3 and 4 (Figure 4n).
Figure 6b (D1-D3 plane) shows the four quadrants of the biplot associated with the four seasons. The spring equinox (Spr) and summer solstice (Sum) are clearly associated with the lower-left and lower-right quadrants, respectively, meaning the autumn equinox and winter solstice are associated with the upper-right and upper-left quadrants. Temperature and salinity loaded close together at the interface of the summer and autumn quadrants, as did the majority of taxa. The exceptions were amphipods, Eurytemora velox, and detritus, which occupied the winter quadrant, along with Neomysis integer, Anguilla anguilla (elvers migrating into freshwater), and Platichthys flesus (dab).
Annual variability was clearly shown by PCA, related to celestial variables, temperature and salinity. All three stations showed rotational movement over the year, and the physical, chemical and biological variables showed positions corresponding to their seasonal characteristics over the year.
The incorporation of celestial variables may enhance the usefulness of PCA, and factorial analysis in general, for interpreting seasonal ecological dynamics in estuaries and other ecosystems.

5.6. Grazing Impact of Mesozooplankton on the Estuary Ecosystem

Mesopodopsis slabberi (both juveniles and adults) prefers micro- and mesozooplankton prey over phytoplankton [47,55,56]. David [56] found that in the Gironde estuary, juveniles consume 4% vegetable particulate organic matter, 77% microzooplankton, and 19% mesozooplankton, while for adults the respective proportions are 0%, 70%, and 30%. These proportions likely depend on the relative abundance of these different trophic pools.
If the dietary proportions available for Mesopodopsis in the Shannon estuary are similar to those in the Gironde, it would suggest that Mesopodopsis not only dwarfs the trophic impact of copepods but also heavily preys upon them, thereby dominating and confining them to a secondary role within the trophic web. Because copepods have a more rapid turnover (shorter life span) than mysids, they may act to rapidly repackage nano- and microplankton (flagellates, ciliates, and diatoms) into higher-quality food particles that are then exploited by the mysids. Juvenile mysids also likely exploit some flagellates, ciliates, and diatoms directly. The complex and changing trophic role of detritus warrants further detailed study Mesopodpsis dominated the trophic impact in the Shannon estuary system. This is in contrast to most European estuaries, except the Gironde, where trophic impact has been found to be dominated by copepods.

6. Conclusions

The mesozooplankton community in the Shannon estuary system near Aughinish Island, including the Robertstown and Deel tributary estuaries, was investigated over a full annual cycle (1979–1980) across nine cruises.
This study provides a foundational archive on mesozooplankton for future spatial and temporal comparisons. The year-round distribution in the Robertstown estuary (Station 4) was similar to that in the main Shannon estuary (Station 3), whereas the mesozooplankton community in the Deel estuary (Station 1) was distinctly different, corresponding to its unique annual variations in salinity and microplankton.
Our Principal Component Analysis (PCA) incorporated two key innovations. First, we treated all variables similarly without predefining them as causative or resultant. Second, we incorporated celestial variables representing the spring–autumn equinoxes (Spr) and summer–winter solstices (Sum). In the resulting hyperspace, the D1-D2 plane clearly segregated Station 1 (Deel estuary) from Stations 3 and 4 (Shannon and Robertstown estuaries) over the annual cycle. The D1-D3 plane revealed Spr and Sum at approximately right angles to each other, with all three stations showing rotational movement through the seasons, and other variables occupying positions corresponding to their seasonal characteristics. In the D1-D3 plane, all three stations showed rotational movement over the year, and the physical, chemical and biological variable showed positions corresponding to their seasonal characteristics over the year.
The copepod fauna was dominated by Eurytemora affinis, and Acartia bifilosa and A. discaudata, as well as the somewhat less abundant A. clausi. This is a copepod, a community typical of many temperate estuaries. However, there is a is notable absence of cladocerans and the copepod Acartia tonsa.
The trophic impact (grazing rate) by the major mesozooplankton groups was dominated by Mesopodopsis slabberi, followed by Oikopleura dioica (summer only) and only secondarily by the copepods, Eurytemoa affinis, Acartia bifilosa and Acartia discaudata. Pleurobrachia pileus also exerted purely carnivorous pressure, and may have been associated with the collapse in mysid and copepod abundance in August.
Finally, the incorporation of celestial variables enhanced the interpretative power of our PCA, offering a promising method for elucidating seasonal ecological dynamics.

Supplementary Materials

The following supporting information can be downloaded at: https://www.mdpi.com/article/10.3390/jmse13101966/s1, Supplementary Materials: Spreadsheet containing the data.

Author Contributions

I.R.J. obtained the funding, carried out the sampling and wrote the manuscript. I.R.J. and T.H.R. designed the project and wrote the initial drafts. T.H.R. identified and enumerated the microzooplankton. Author T.H.R. passed away prior to the publication of this manuscript. The other author has read and agreed to the published version of this manuscript.

Funding

This research was funded by the Aughinish Alumina Ltd. through University College Dublin to I.R.J. and T.H.R. University College Galway provided materials, laboratory and library facilities.

Data Availability Statement

The data are available as Supplementary Materials.

Acknowledgments

Their support, liaison and permission to publish are gratefully acknowledged. John Bracken, Brenda Healy, Geoffrey O’Sullivan and Brian McK. Bary facilitated this study, and we also thank Geoffrey O’Sullivan and Mary Hensey for sharing their data. John Coyne and Tom Furey provided important technical help and Cyril Ryan of Askeaton was a superb boatman even in apparently impossible conditions. More recently, Sami Souissi encouraged publication of this work. Co-author Tom H. Ryan died tragically in a car accident, and this paper is fondly and respectfully dedicated to his memory. We are grateful to two reviewers for their detailed and professional reviews.

Conflicts of Interest

The authors declare no conflicts of interest.

References

  1. Lotze, H.K.; Lenihan, H.; Bourque, B.; Bradbury, R.; Cooke, R.; Kay, M.; Kidwell, S.; Kirby, M.; Peterson, C.; Jackson, J. Depletion, Degradation, and Recovery Potential of Estuaries and Coastal Seas. Science 2006, 312, 1806–1809. [Google Scholar] [CrossRef]
  2. Jeffrey, D.; Wilson, J.G.; Harris, C.; Tomlinson, D. The application of two simple indices to Irish estuary pollution studies. In Estuarine Management and Quality Assessment; Wilson, J., Halcrow, W., Eds.; Plenum Press: London, UK, 1985; pp. 147–161. [Google Scholar]
  3. Wilson, J.; Brennan, B. Spatial and temporal variation in sediments and their nutrient concentrations in the unpolluted Shannon estuary, Ireland. Arch. Für Hydrobiol. 1993, 75, 451–486. [Google Scholar]
  4. Wilson, J.; Brennan, B.; Brennan, M. Horizontal and vertical gradients in sediment nutrients on mudflats in the Shannon estuary, Ireland. Neth. J. Aquat. Ecology. 1993, 27, 173–180. [Google Scholar] [CrossRef]
  5. Wilson, J.; Brennan, M. Nutrient interchange between the sediment and the overlying water on the intertidal mudflats of the Shannon estuary. Arch. Für Hydrobiologie. 1993, 75, 423–450. [Google Scholar]
  6. McCarthy, T.K.; Frankiewicz, P.; Cullen, P.; Blaszkowski, M.; O’Connor, W.; Doherty, D. Long-term effects of hydropower installations and associated river regulation on River Shannon eel populations: Mitigation and management. Hydrobiologia 2008, 609, 109–124. [Google Scholar] [CrossRef]
  7. Anon. and Conservation Through Education. All Gates Closed. The Life and Death of the Atlantic Salmon. 2025. Available online: https://www.youtube.com/watch?v=PcgFo0odp2w (accessed on 2 January 2025).
  8. Byrne, P. Seasonal Composition of Meroplankton in the Dunkellin Estuary, Galway Bay. In Biology and Environment: Proceedings of the Royal Irish Academy; Royal Irish Academy: Dublin, Ireland, 1995; Volume 95B, pp. 35–48. Available online: http://www.jstor.org/stable/20504491 (accessed on 1 August 2025).
  9. Ó Céidigh, P. The marine Decapoda of Counties Galway and Clare. In Proceedings of the Royal Irish Academy. Section B: Biological, Geological, and Chemical Science; Royal Irish Academy: Dublin, Ireland, 1961; Volume 62, pp. 151–174. [Google Scholar]
  10. Fives, J.M. Investigations of the plankton of the west coast of Ireland. II. Planktonic Copepoda raken off County Galway and adjacent areas in plankton surveys during the years 1958 to 1963. In Proceedings of the Royal Irish Academy. Section B: Biological, Geological, and Chemical Science; Royal Irish Academy: Dublin, Ireland, 1968; Volume 67, pp. 233–259. [Google Scholar]
  11. Fives, J.M. Investigations of the Plankton of the West Coast of Ireland: IV. Larval and Post-Larval Stages of Fishes Taken from the Plankton of the West Coast in Surveys during the Years 1958–1966. In Proceedings of the Royal Irish Academy. Section B: Biological, Geological, and Chemical Science; Royal Irish Academy: Dublin, Ireland, 1970; Volume 70, pp. 15–93. Available online: http://www.jstor.org/stable/20494950 (accessed on 1 August 2025).
  12. Fives, J.M. Investigations of the Plankton of the West Coast of Ireland: V. Chaetognatha Recorded from the Inshore Plankton off Co. Galway. In Proceedings of the Royal Irish Academy. Section B: Biological, Geological, and Chemical Science; Royal Irish Academy: Dublin, Ireland, 1971; Volume 71, pp. 119–138. Available online: http://www.jstor.org/stable/20518893 (accessed on 1 August 2025).
  13. O’Brien, F.I. The relationship between temperatur, salinity and Chaetognatha of the Galway Bay area of the west coast of Ireland. In Proceedings of the Royal Irish Academy. Section B: Biological, Geological, and Chemical Science; Royal Irish Academy: Dublin, Ireland, 1977; Volume 77, pp. 245–252. [Google Scholar]
  14. Boyd, R.J.; Ó Céidigh, P.; Wilkinson, A. Investigations of the Plankton of the West Coast of Ireland: VI. Pelagic Cnidaria of the Galway Bay Area 1956–1972, with a Revision of Previous Records for These Species in Irish Inshore Waters. In Proceedings of the Royal Irish Academy. Section B: Biological, Geological, and Chemical Science; Royal Irish Academy: Dublin, Ireland, 1973; Volume 73, pp. 383–403. Available online: http://www.jstor.org/stable/20518927 (accessed on 1 August 2025).
  15. Hensey, M. Zooplankton and oceanographic conditions in the Shannon Estuary, Ireland. Master’s Thesis, Department of Oceanography, National University of Ireland, Galway, Ireland, 1980. [Google Scholar]
  16. Mackas, D.L.; Beaugrand, G. Comparisons of zooplankton time series. J. Mar. Syst. 2010, 79, 286–304. [Google Scholar] [CrossRef]
  17. Currie, R.; Wyatt, T.; O’Brien, D. Determoinistic signals in fish catches, wine harvests and sea-level, and further experiments. Int. J. Climatol. 1993, 13, 665–687. [Google Scholar] [CrossRef]
  18. O’Sullivan, G. The intertidal fauna of Aughinish Island, Shannon, Co. Limerick. Ir. Nat. J. 1983, 21, 62–69. [Google Scholar]
  19. O’Sullivan, G. Seasonal changes in the intertidal fish and crustacean populations of Aughinish Island and the Shannon Estuary. In Irish Fishery Investigations, Series B; Stationery Office: Dublin, Ireland, 1984; Volume 28, pp. 1–15. [Google Scholar]
  20. Beaulieu, S. The Road to a New Bauxite–Mine and Refinery Optimisation. In TRAVAUX 48, Proceedings of the 37 th International ICSOBA Conference and XXV Conference «Aluminium of Siberia», Krasnoyarsk, Russia, 16–20 September 2019; ICSOBA: Saint-Colomban, QC, Canada, 2019; pp. 137–139. Available online: https://icsoba.org/proceedings/37th-conference-and-exibition-icsoba-2019/?doc=17 (accessed on 1 August 2025).
  21. Jenkinson, I.R. The microplankton biomass and diversity of the upper Shannon estuary (Ireland) and two tributary estuaries. Br. Phycol. J. 1985, 20, 187. [Google Scholar]
  22. Jenkinson, I.R. Estuarine plankton of Co Limerick. I. A recurrent bloom summer bloom of the dinoflagellate Glenodinium foliaceum Stein confined to the Deel estuary, with data on microplankton biomass. Ir. Nat. J. 1990, 23, 173–180. [Google Scholar]
  23. Kassambara, A.; Mundt, F. Factoextra: Extract and Visualize the Results of Multivariate Data Analyses. 2020. Available online: https://CRAN.R-project.org/package=factoextra (accessed on 1 August 2025).
  24. Jolliffe, I.T.; Cadima, J. Principal component analysis: A review and recent developments. Philos. Trans. R. Soc. A: Math. Phys. Eng. Sci. 2016, 374, 20150202. [Google Scholar] [CrossRef] [PubMed]
  25. The Shannon Airport Group. Traffic Figures. 2024. Available online: https://www.snnairportgroup.ie/2025/shannon-airport-passenger-numbers-climb-7-to-over-104m-in-first-half-of-2025/ (accessed on 8 August 2025).
  26. Rusal Aughinish Alumina. 2025. Available online: https://rusal.ru/en/about/geography/aughinish-alumina/ (accessed on 2 October 2025).
  27. Wonham, M.; Carlton, J. Trends in marine biological invasions at local and regional scales: The Northeast Pacific Ocean as a model system. Biol. Invasions 2005, 7, 369–392. [Google Scholar] [CrossRef]
  28. Department of Oceanography. Data Report No. 4, 1977-1978; Department of Oceanography, University College: Galway, Ireland, 1979. [Google Scholar]
  29. Department of Oceanography. Data Report No. 5, 1979-1980; Department of Oceanography, University College: Galway, Ireland, 1981. [Google Scholar]
  30. McMahon, T.; Raine, R.; Fast, T.; Kies, L.; Patching, J. Plankton biomass, light attenuation and md mixing in the Shannon estuary, Ireland. J. Mar. Biol. Assoc. UK 1992, 72, 709–720. [Google Scholar] [CrossRef]
  31. Grandremy, N.; Bourriau, P.; Daché, E.; Danielou, M.-M.; Doray, M.; Dupuy, C.; Forest, B.; Jalabert, L.; Huret, M.; Le Mestre, S.; et al. Metazoan zooplankton in the Bay of Biscay: A 16-year record of individual sizes and abundances obtained using the ZooScan and ZooCAM imaging systems. Earth Syst. Sci. Data 2024, 16, 1265–1282. [Google Scholar] [CrossRef]
  32. Smith, P.E.; Counts, R.C.; Clutter, R.I. Changes in Filtering Efficiency of Plankton Nets Due to Clogging Under Tow. ICES J. Mar. Sci. 1968, 32, 232–248. [Google Scholar] [CrossRef]
  33. Shannon, C.; Weaver, W. The Mathematical Theory of Communication; University of Illinois Press: Urbana, IL, USA, 1963. [Google Scholar]
  34. Abdullah Al, M.; Gao, Y.; Xu, G.; Wang, Z.; Xu, H.; Warren, A. Variations in the community structure of biofilm-dwelling protozoa at different depths in coastal waters of the Yellow Sea, northern China. J. Mar. Biol. Assoc. UK 2019, 99, 43–50. [Google Scholar] [CrossRef]
  35. Rajkumar, M.; Ashok Prabu, V.; Rahman, M.M.; Jenkinson, I.R. Community structure of microzooplanktonin a tropical estuary (Uppanar) and amangrove (Pichavaram) from the south-east coast of India. J. Mar. Biol. Assoc. India 2022, 64, 13–28. [Google Scholar] [CrossRef]
  36. R Core Team. R: A Language and Environment for Statistical Computing. 2025. Available online: https://cran.r-project.org/doc/manuals/r-release/fullrefman.pdf (accessed on 1 August 2025).
  37. Oksanen, J.; Simpson, G.L.; Blanchet, F.G.; Kindt, R.; Legendre, P.; Minchin, P.R.; O’Hara, R.; Solymos, P.; Stevens, M.H.H.; Szoecs, E.; et al. Vegan: Community Ecology. Package. 2022. Available online: https://www.researchgate.net/publication/313502495_Vegan_Community_Ecology_Package (accessed on 1 August 2025).
  38. Longobardi, L.; Dubroca, L.; Margiotta, F.; Sarno, D.; Zingone, A. Photoperiod-driven rhythms reveal multi-decadal stability of phytoplankton communities in a highly fluctuating coastal environment. Sci. Rep. 2022, 12, 3908. [Google Scholar] [CrossRef]
  39. Häfkar, N.S.; Meyer, B.; Last, K.S.; Pond, D.W.; Hüppe, L.; Teschke, M. Circadian Clock Involvement in Zooplankton Diel Vertical Migration. Curr. Biol. 2017, 27, 2194–2201. [Google Scholar] [CrossRef]
  40. Båmstedt, U. Trophodynamics of Pleurobrachia pileus (Ctenophora, Cydippida) and ctenophore summer occurrence off the Norwegian north-west coast. Sarsia 1998, 83, 169–181. [Google Scholar] [CrossRef]
  41. Hardy, A. The Open Sea: The World of Plankton ; Collins: London, UK, 1956. [Google Scholar]
  42. Purcell, J.; Sturdevant, M.; Galt, C. A review of appendicularians as prey of invertebrate and fish predators. In Response of Marine Ecosystems to Global Change: Ecological Ipact of Appendicularians; Gorsky, G., Youngbluth, M., Deibel, D., Eds.; Editions Scientifiques: Paris, France, 2005; pp. 259–435. [Google Scholar]
  43. Yip, S.Y. A preliminary study on the planktonic ctenophora of the west coast of Ireland with special reference to Pleurobrachia pileus from Galway Bay. In Proceedings of the Royal Irish Academy. Section B: Biological, Geological, and Chemical Science; Royal Irish Academy: Dublin, Ireland, 1981; Volume 81, pp. 89–109. [Google Scholar]
  44. Williams, R. Zooplankton of the Bristol Channel and Severn Estuary. Mar. Pollut. Bull. 1984, 15, 66–70. [Google Scholar] [CrossRef]
  45. Lee, C.E. Global phylogeography of a cryptic copepod species complex and reproductive isolation between genetically proximate “populations”. Evolution 2000, 54, 2014–2027. [Google Scholar] [CrossRef] [PubMed]
  46. Tackx, M.; Pauw, N.D.; Mieghem, R.V.; Azémar, F.; Hannouti, A.; Damme, S.; Fiers, F.; Daro, N.; Meire, P. Zooplankton in the Schelde estuary, Belgium and The Netherlands. Spatial and temporal patterns. J. Plankton Res. 2004, 26, 133–141. [Google Scholar] [CrossRef]
  47. David, V.; Sautour, B.; Galois, R.; Chardy, P. The paradox high zooplankton biomass-low vegetal particulate organic matter in high turbidity zones: What way for energy transfer? J. Exp. Mar. Biol. Ecol. 2006, 333, 202–218. [Google Scholar] [CrossRef]
  48. Poulet, S.A. Comparison between five co-existing species of marine copepods feeding on naturally occurring particulate matter. Limnol. Oceanogr. 1978, 23, 126–143. [Google Scholar] [CrossRef]
  49. Mullin, M.; Sloan, P.; Eppley, R. Relationship between carbon content, cell volume, and area in phytoplankton. Limnol. Oceanogr. 1966, 11, 307–311. [Google Scholar] [CrossRef]
  50. Castel, J. Aspects de l’étude écologique du plancton de l’estuaire de la Gironde. Oceanis 1981, 6, 353–577. [Google Scholar]
  51. Heinle, D.; Flemer, D. Carbon requirements of a population of the estuarine copepod, Eurytemora affinis. Mar. Biol. 1975, 31, 235–247. [Google Scholar] [CrossRef]
  52. Richman, S.; Heinle, D.; Huff, R. Grazing by adult estuarine copepods of the Chesapeake Bay. Mar. Biol. 1977, 42, 69–84. [Google Scholar] [CrossRef]
  53. Roman, N.R. Feeding of the copepod Acartia tonsa on the diatom Nitzschia closterium and brown alga (Fucus vesiculosus) detritus. Mar. Biol. 1977, 42, 149–155. [Google Scholar] [CrossRef]
  54. Kiørboe, T.; Møhlenberg, F.; Hamburger, K. Bioenergetics of the planktonic copepod Acartia tonsa: Relation between feeding, egg production, and composition of specific dynamic action. Mar. Ecol. Prog. Ser. 1985, 26, 85–97. [Google Scholar] [CrossRef]
  55. Webb, P.; Perissinotto, R.; Wooldridge, T. Feeding of Mesopodopsis slabberi (Crustacea, Mysidaceae) on naturally occurring phytoplankton. Mar. Ecol. Prog. Ser. 1987, 38, 115–123. [Google Scholar] [CrossRef]
  56. David, V. Dynamique spatio-temporelle du zooplancton dans l’estuaire de la Gironde et implications au sein du réseau trophique planctonique. Ph.D. Thesis, Université de Bordeaux I, Bordeaux, France, 2006. [Google Scholar]
  57. King, K.R. The population biology of the larvacean Oikopleura dioica in enclosed water columns. In Marine Mesocosms; Grice, O.D., Reeve, M.R., Eds.; Springer: New York, NY, USA, 1982; pp. 341–352. [Google Scholar]
  58. Alldredge, A. The impact of appendicularian grazing on natural food concentrations in situ. Limnol. Oceanogr. 1981, 26, 247–257. [Google Scholar] [CrossRef]
  59. Acuňa, J.; Kiefer, M. Functional response of the appendicularian Oikopleura dioica. Limnol. Oceanogr. 2000, 45, 608–618. [Google Scholar] [CrossRef]
  60. von Vaupel-Klein, J.; Weber, R. Distribution of Eurytemora affinis (Copepoda: Calanoida) in relation to salinity: Field and laboratory observations. Neth. J. Sea Res. 1975, 9, 297–310. [Google Scholar] [CrossRef]
  61. Devreker, D.; Souissi, S.; Molinero, J.C.; Nkubito, F. Trade-offs of the copepod Eurytemora affinis in mega-tidal estuaries. Insights from high frequency sampling in the Seine Estuary. J. Plankton Res. 2008, 30, 1329–1342. [Google Scholar] [CrossRef]
  62. Hemmingsen, W.; MacKenzie, K.; Sagerup, K.; Remen, M.; Bloch-Hansen, K.; Dagbjartarson Imsland, A.K. Caligus elongatus and other sea lice of the genus Caligus as parasites of farmed salmonids: A review. Aquaculture 2020, 522, 735160. [Google Scholar] [CrossRef]
  63. Tattersall, W.; Tattersall, O. The British Mysidacea; The Ray Society: London, UK, 1951. [Google Scholar]
  64. Naylor, E. British Marine Isopods; Linnean Society and Academic Press: London, UK, 1972. [Google Scholar]
  65. Graham, A. British Prosobranch and Other Operculate Gastropod Molluscs; Academic Press: London, UK, 1971. [Google Scholar]
  66. Gibson, R.; Hextall, B.; Rogers, A. Photographic Guide to the Sea and Shore Life of Britain and North-west Europe; Oxford University Press: New York, NY, USA, 2001. [Google Scholar]
  67. Little, C.; Nix, W. The burrowing and floating behaviour of the gastropod Hydrobia ulvae Estuarine Coastal and Marine. Science 1976, 4, 537–544. [Google Scholar] [CrossRef]
  68. Wiebe, P.H.; Harris, R.; Gislason, A.; Margonski, P.; Skjoldal, H.R.; Benfield, M.; Hay, S.; O’Brien, T.; Valdés, L. The ICES Working Group on Zooplankton Ecology: Accomplishments of the first 25 years. Prog. Oceanogr. 2015, 141, 179–201. [Google Scholar] [CrossRef]
  69. Clutter, R.; Anraku, M. Avoidance of samplers. In Zooplankton Sampling; UNESCO: Paris, France, 1968; pp. 57–76. [Google Scholar]
  70. øller, L.F.; Canon, J.M.; Tiselius, P. Bioenergetics and growth in the ctenophore Pleurobrachia pileus. Hydrobiologia 2010, 645, 167–178. [Google Scholar] [CrossRef]
  71. Peitsch, A.; Köpcke, B.; Bernát, N. Long-term investigation of the distribution of Eurytemora affinis (Calanoida; Copepoda) in the Elbe Estuary. Limnologica 2000, 30, 175–182. [Google Scholar] [CrossRef]
  72. Favier, J.-B.; Winkler, G. Coexistence, distribution patterns and habitat utilization of the sibling species complex Eurytemora affinis in the St Lawrence estuarine transition zone. J. Plankton Res. 2014, 26, 1247–1261. [Google Scholar] [CrossRef]
  73. Troedson, C.; Frischer, M.E.; Nejstgaard, J.C.; Thompson, E.M. Molecular quantification of differential ingestion and particle trapping rates by the appendicularian Oikopleura dioica as a function of prey size and shape. Limnol. Oceanogr. 2007, 52, 416–427. [Google Scholar] [CrossRef]
  74. Raven, J.A.; Beardall, J. Evolution of Phytoplankton in Relation to Their Physiological Traits. J. Mar. Sci. Eng. 2022, 10, 194. [Google Scholar] [CrossRef]
  75. Skjoldal, H.R.; Aarflot, J.M.; Knutsen, T.; Wiebe, P.H. Comparison of WP-2 and MOCNESS plankton samplers for measuring zooplankton biomass in the Barents Sea ecosystem. J. Plankton Res. 2024, 46, 654–672. [Google Scholar] [CrossRef] [PubMed]
  76. Kasahara, S.; Uyé, S.; Onbé, T. Calanoid copepod eggs in sea-bottom muds. II. Seasonal cycles of abundance in the populations of several species of copepods and their eggs in the Inland Sea of Japan. Mar. Biol. 1975, 31, 373–384. [Google Scholar] [CrossRef]
  77. Soltanpour-Gargari, A.; Wellershaus, S. Very low salinity stretches in estuaries—The main habitat of Eurytemora affinis, a plankton copepod. Meeresforschung 1997, 31, 199–208. [Google Scholar]
  78. Castel, J.; Courties, C.; Poli, J. Dynamique du copépode Eurytemora hirundoides dans l’estuaire de la Gironde: Effet de la température. In Oceanologica Acta, Special Issue; Gauthier-Villars: Paris, France, 1983; pp. 57–61. [Google Scholar]
  79. Collins, N.; Williams, R. Zooplankton of the Bristol Channel and Severn Estuary. The distribution of four copepods in relation to salinity. Mar. Biol. 1981, 64, 273–283. [Google Scholar] [CrossRef]
  80. Rees, C. The plankton in the upper reaches of the Bristol Channel. J. Mar. Biol. Assoc. UK 1939, 23, 397–5425. [Google Scholar] [CrossRef]
  81. Chervin, M. Assimilation of particulate organic carbon by estuarine and coastal copepods. Mar. Biol. 1978, 49, 265–275. [Google Scholar] [CrossRef]
  82. Heinle, D.R. Population dynamics of exploited cultures of calanoid copepods. Helgoländer Wissenshaftliche Meeresunters 1970, 20, 360–372. [Google Scholar] [CrossRef]
  83. Katona, S.K. Growth characteristics of the copepods Eurytemora affinis and Eurytemora herdmanni in laboratory culture. Helgoländer Wissenschalftliche Meeresunters 1970, 20, 373–384. [Google Scholar] [CrossRef]
  84. Berk, S.; Brownlee, D.; Heinle, D.; Kling, H.; Colwell, R. Ciliates as a food source for marine plankton copepods. Microb. Ecol. 1977, 4, 27–40. [Google Scholar] [CrossRef] [PubMed]
  85. Heinle, D.; Harris, R.; Ustach, J.; Flemer, D. Detritus as food for estuarine copepods. Mar. Biol. 1977, 40, 341–353. [Google Scholar] [CrossRef]
  86. Poli, J.; Castel, J. Cycle biologique en laboratoire d’un copépode planctonique de l’estuaire de la Gironde: Eurytemora hirundoides (Nordquist, 1888). Vie Milieu Life Environ. 1983, 33, 79–86. [Google Scholar]
  87. Bradford-Greve, J.M. Copepoda: Calanoida: Acartiidae: Acartia, Paracartia, Pteriacartia. In ICES Identification Leaflets for Plankton No. 181; Lindley, J., Ed.; International Council for the Exploration of the Sea: Copenhagen, Denmark, 1999; pp. 1–19. [Google Scholar]
  88. Marques, S.C.; Azeiteiro, U.M.; Marques, J.C.; Neto, J.M.; Pardal, M.A. Zooplankton and ichthyoplankton communities in a temperate estuary: Spatial and temporal patterns. J. Plankton Res. 2006, 28, 297–312. [Google Scholar] [CrossRef]
  89. Le Fèvre-Lehoëroff, G. Distribution et variations saisonnières du plancton en ‘rivière de Morlaix Comptes-rendus hebdomadaires des Séances de l’Académie des Sciences de Paris. Ann. De L’institut Océanographique Monaco Nouv. Série 1972, 275, 1681–1684. [Google Scholar]
  90. Le Fèvre-Lehoërff, G. Variabilité de l’indice de diversité spécifique de copépodes dans l’estuaire à marée (Baie de Morlaix): Sa signification écologique. Ann. De L’institut Océanographique Monaco Nouv. Série 1974, 50, 59–66. [Google Scholar]
  91. Remerie, T.; Bourgois, T.; Peelaers, D.; Vierstraete, A.; Vanfleteren, J.; Vanreusel, A. Phylogeographic patterns of the mysid Mesopodopsis slabberi (Crustacea, Mysida) in Western Europe: Evidence for high molecular diversity and cryptic speciation. Mar. Biol. 2006, 149, 465–481. [Google Scholar] [CrossRef]
  92. Gieskes, W. Ecology of the cladocera of the North Atlantic and the North Sea, 1960–1967. Neth. J. Sea Res. 1971, 5, 342–376. [Google Scholar] [CrossRef]
  93. Helenius, L.K.; Leskinen, E.; Lehtonen, H.; Nurminen, L. Spatial patterns of littoral zooplankton assemblages along a salinity gradient in a brackish sea: A functional diversity perspective. Estuar. Coast. Shelf Sci. 2017, 198, 400–412. [Google Scholar] [CrossRef]
  94. Meireles, S.; Queiroga, H. Use of artificial collectors shows semilunar rhythm of planktonic dispersal in juvenile Hydrobia ulvae (Gastropoda: Prosobranchia). J. Mar. Biol. Assoc. UK 2004, 84, 761–766. [Google Scholar] [CrossRef]
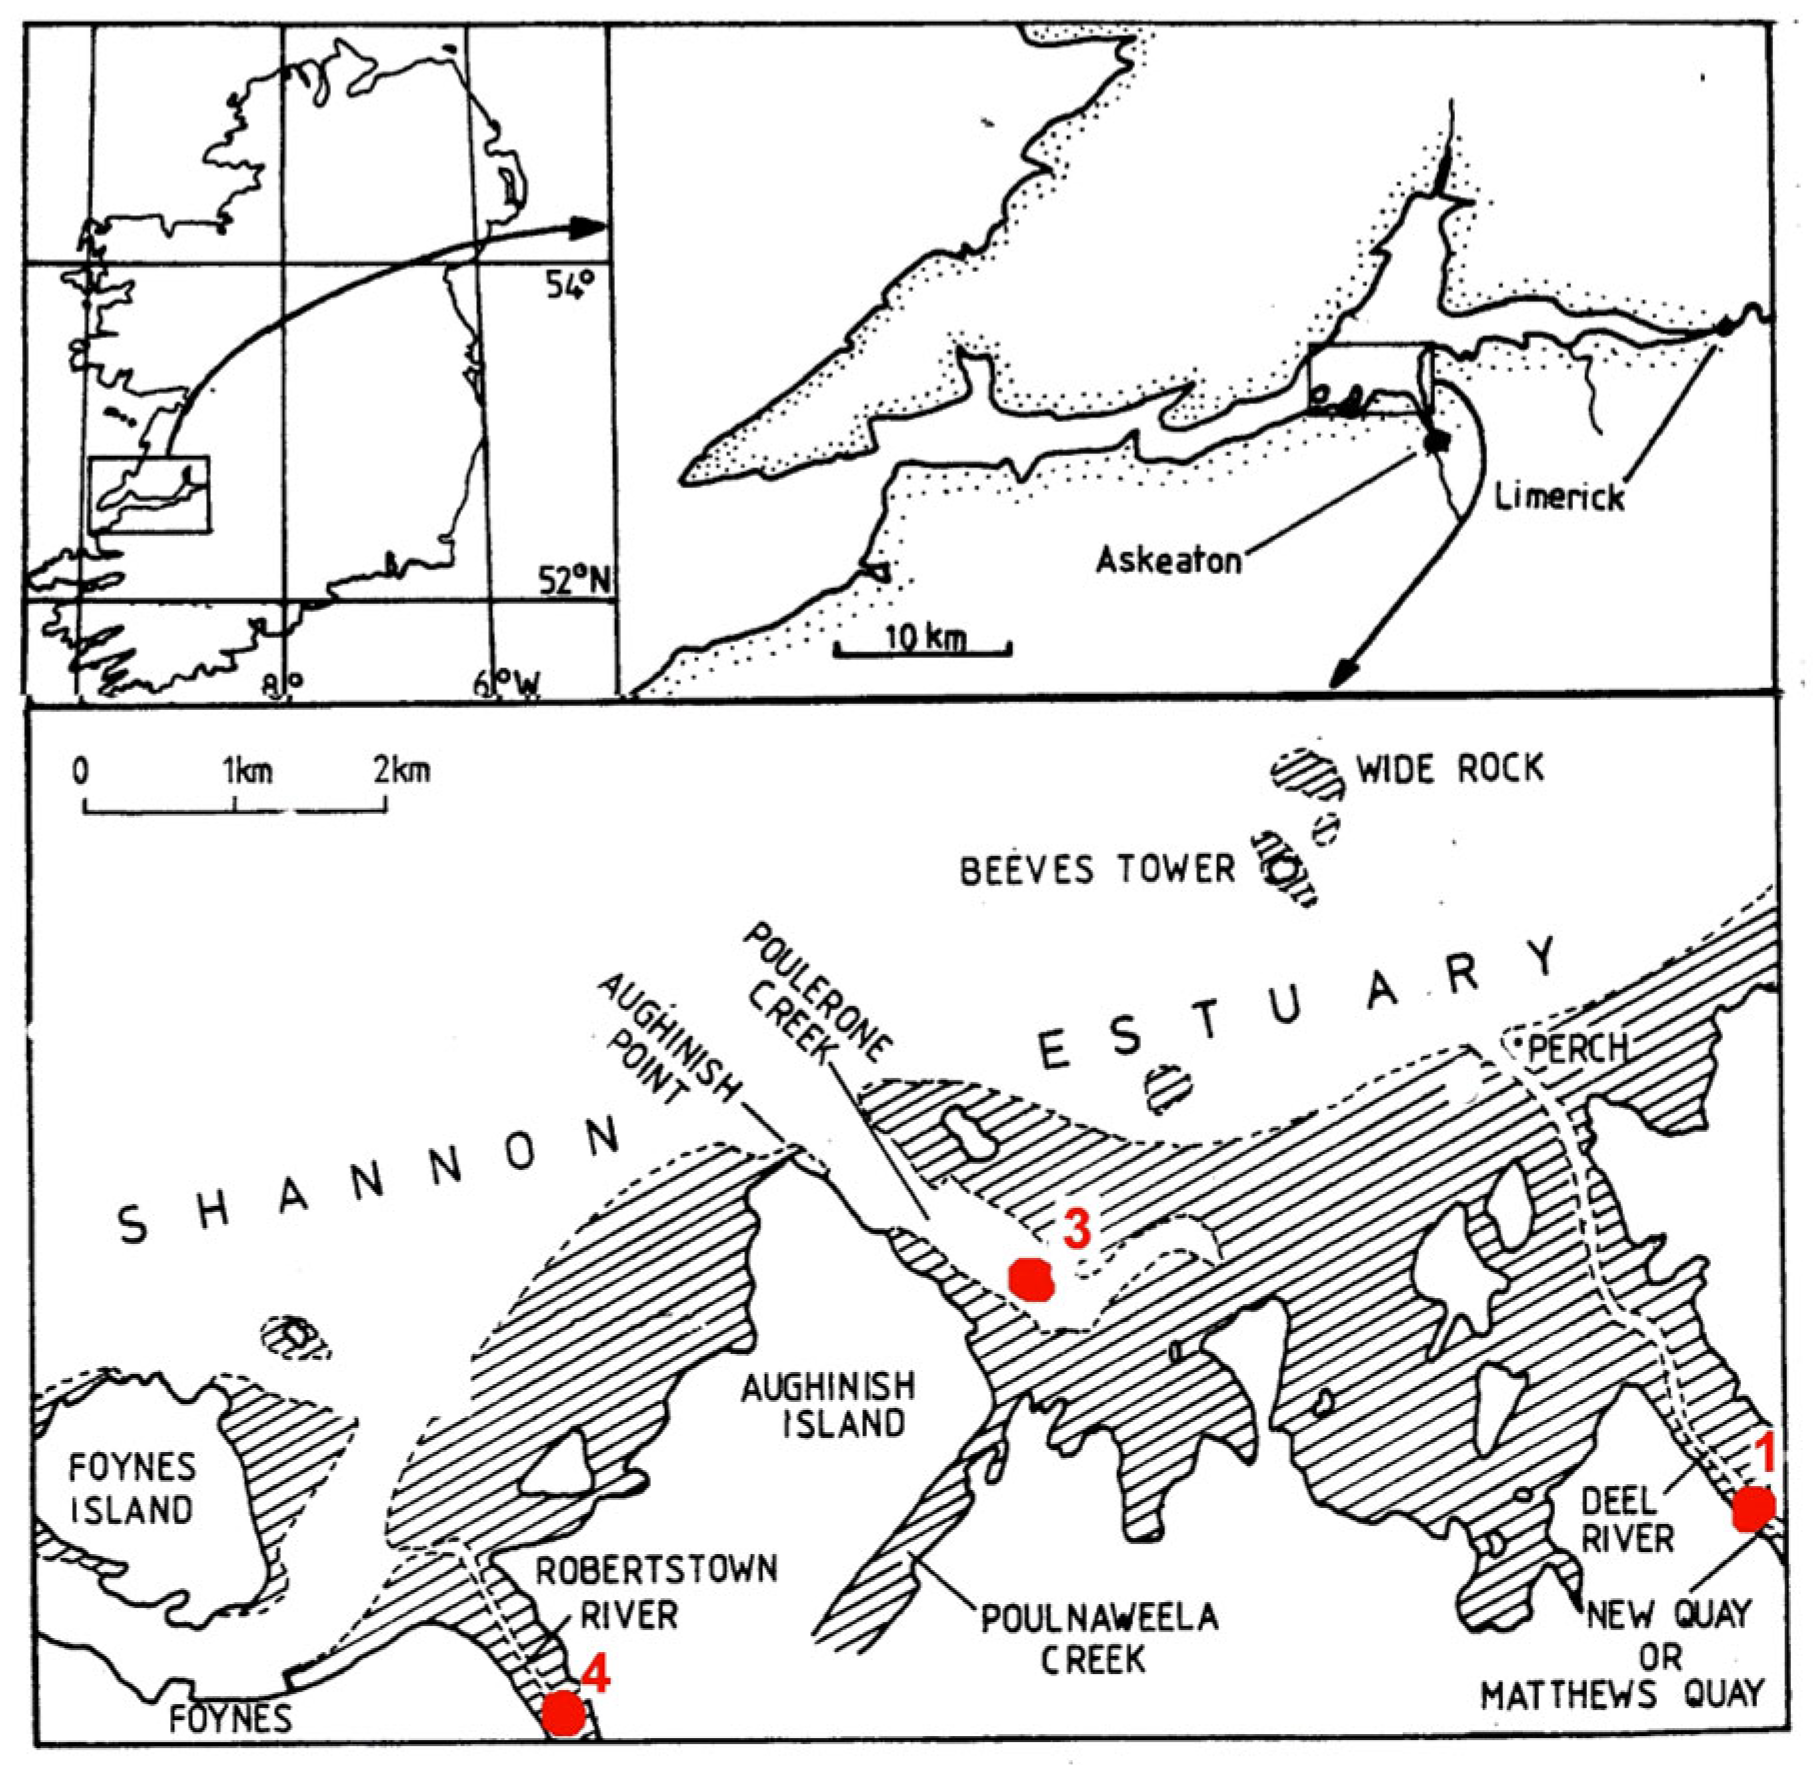
Figure 1. Upper left—Ireland. Upper right—Shannon estuary. Lower panel—study area. Shading represents intertidal areas. Stations 1, 3 and 4 were sampled by towing against the incoming tide.
Jmse 13 01966 g001
Figure 2. Diagrammatic representation of the ring net. Not to scale.
Jmse 13 01966 g002
Figure 3. Surface and near-bottom temperature (T) and salinity (S) values: at Station 1 (a,b); at Station 3 (c,d); at Station 4 (e,f), respectively. Some near-bottom values are missing because of technical malfunction of the T-S meter.
Jmse 13 01966 g003
Figure 4. (an) and (ps) Annual variations in celestial, physicochemical variables and abundance for the more abundant taxa. Abundance values are omitted for station 1 in July as the sample contained bottom material and was considered non-quantitative.
Jmse 13 01966 g004aJmse 13 01966 g004bJmse 13 01966 g004c
Figure 5. Mesozooplankton diversity. (a) Shannon–Wiener diversity (H′) for all taxa; (b) H′ for copepod taxa only; (c) Margalef diversity (also called richness) (Dmg) for all taxa; (d) evenness (I’) for all taxa. Notes: (1) values could not be calculated at station 1 as only one taxon was sampled; (2) very high I’ value at station 1 may be misleading as only two taxa were sampled.
Jmse 13 01966 g005
Figure 6. Results of the Principal Component Analysis (PCA) performed by station, with corresponding scores of environmental variables shown on the same plots. (a) The D1-D2 plane; (b) the D1-D3 plane. Abbreviations for environmental variables, including taxa, are given in. Stations are indicated as “cruise_station” (e.g., “7_1” denotes Cruise 7 at Station 1). The cruises are as follows: 1—May 1979; 2—July; 3—August; 4—October; 5—November; 6—December; 7—February 1980; 8—April; 9—May 1980. Arrows connecting the PCA scores of stations as they change with successive cruises are coloured as follows: Station 1—black; Station 3—blue; Station 4—red.
Jmse 13 01966 g006
Table 1. Abbreviations of variable shown in Figure 4 and their transformation, if any.
AbbreviationVariableTransformAbbreviationVariableTransform
AclaAcartia clausiLog(n + 1)AbifAcartia bifilosaLog(n + 1)
AmphAmphipodsLog(n + 1)AdisAcartia discaudataLog(n + 1)
AurAurelia auritaLog(n + 1)AngAnguilla anguilla—elversLog(n + 1)
ChamCentropages hamatusLog(n + 1)CalCalanus helgolandicus and C. sp.Log(n + 1)
CranCrangon crangonLog(n + 1)CmaeCarcinus maenas larvaeLog(n + 1)
DetrDetritus volumeLog(volume)CyclFreshwater cyclopoid copepodsLog(n + 1)
EvelEurytemora veloxLog(n + 1)EaffEurytemora affinisLog(n + 1)
GobGobiid larvaeLog(n + 1)GnaGnathiid isopodsLog(n + 1)
HulvHydrobia ulvae adultsLog(n + 1)HarpHarpacticoid copepodsLog(n + 1)
LamLamellibranch larvaeLog(n + 1)IcheIdotea chelipesLog(n + 1)
MicrBiovolume of nano-microplankton 10–200 µm (from Jenkinson, 1990) [15])Log(volume)LittLittorina littorea egg capsules (2–3 eggs)Log(n + 1)
NetpTotal netplankton concentrationLog(n + 1)MslaMesopodopsis slabberiLog(n + 1)
OdioOikopleura dioicaLog(n + 1)NintNeomysis integerLog(n + 1)
PlePleurobrachia pileusLog(n + 1)PflePlatychthys flesusLog(n + 1)
SSalinity (mean of surface and bottom)No transformPolysPolychaete larvaeLog(n + 1)
SeccSecchi disc depth (m)—Water clarityNo transformScopSmall copepods, Paracalanus parvus and Pseudocalanus elongatusLog(n + 1)
rosSygnathus rostratusLog(n + 1)SprSpring equinox component (Autumn component is the negative of this)None
TWater temperature (mean of surface and bottom)No transformSumSummer solstice component (Winter component is the negative of this)None
Table 2. Carnivorous grazing rate (trophic impact) by Pleurobrachia pileus (L m−3 d−1).
CruiseStation
134
May0.000.000.07
July0.000.303.02
August0.000.053.54
October0.000.210.05
November0.000.030.00
December0.000.000.00
February0.000.000.00
April0.000.000.03
May0.000.110.00
MEAN0.000.0780.75
Table 3. Grazing rate by Eurytemora affinis (L m−3 d−1).
CruiseStation
134
May00.030.84
JulyP0.030.07
August000
October0.010.010
November00.292.9
December00.110.03
February000
April0.050.090.18
May0.310.410.07
MEAN0.050.110.45
Note: P—E. affinis present but not quantified. Mean excludes Station 1 in July.
Table 4. Grazing rate by Acartia spp. (L m−3 d−1).
CruiseStation
134
May000.08
July015.5
August0.0100.01
October0.20.170
November00.620.38
December000
February000
April000
May0.060.380.02
MEAN0.030.240.67
Table 5. Grazing rate by all copepods (except small copepodites and nauplii) (L m−3 d−1).
CruiseStation
134
May00.030.92
JulyP1.035.57
August0.0100.01
October0.210.180
November00.913.28
December00.110.03
February000
April0.050.090.18
May0.370.790.09
MEAN0.080.351.12
Note: P—E. copepods present but not quantified. Mean excludes Station 1 in July.
Table 6. Grazing rate by Mesopodopsis slabberi (L m−3 d−1).
CruiseStation
134
May total0.000.9515.13
Adults0.000.9514.42
Juveniles0.000.000.71
July totalP111.84148.25
AdultsP7.6366.34
JuvenilesP104.2281.90
August total19.8210.480.07
Adults0.980.150.00
Juveniles18.8410.340.07
October total491.29140.8726.36
Adults404.570.740.00
Juveniles86.72140.1226.36
November0.0050.93169.38
Adults0.000.000.00
Juveniles0.0050.93169.38
December0.000.041.07
Adults0.000.000.00
Juveniles0.000.041.07
February0.000.050.59
Adults0.000.000.00
Juveniles0.000.050.59
April26.262.566.34
Adults8.360.210.00
Juveniles17.902.356.34
May82.5012.840.31
Adults80.4111.230.18
Juveniles2.091.600.13
MEAN77.4836.7340.83
Adults61.792.328.99
Juveniles15.6934.4131.84
P—present but not quantified.
Table 7. Grazing rate by Oikopleura dioica (L m−3 d−1).
CruiseStation
134
May000.12
JulyP4.322
August0.110.551.1
October000
November000
December000
February000
April000
May00.210.80
MEAN0.010.562.70
P—present but not enumerated.
Table 8. Grazing rate (herbivorous grazing pressure) by copepods, mysids, and appendicularians (L m−3 d−1).
CruiseStation
134
May00.9516
JulyP134175
August20111.2
October49114126
November052173
December00.151.1
February00.0521.1
April262.76.5
May831414
MEAN77.539.546.0
P—present but not quantified.
Disclaimer/Publisher’s Note: The statements, opinions and data contained in all publications are solely those of the individual author(s) and contributor(s) and not of MDPI and/or the editor(s). MDPI and/or the editor(s) disclaim responsibility for any injury to people or property resulting from any ideas, methods, instructions or products referred to in the content.