Article

The Influence of Summer Cyclonic Circulation in the Southern Gulf of California on Planktonic Copepod Communities

by
Franco Antonio Rocha-Díaz
1,*,
María Adela Monreal-Gómez
2,
Erik Coria-Monter
2,
David Alberto Salas-de-León
2,
Elizabeth Durán-Campos
3 and
Sergio Cházaro-Olvera
4
1
Posgrado en Ciencias del Mar y Limnología, Universidad Nacional Autónoma de México, Av. Universidad 3000, Copilco, Coyoacán 04510, Mexico
2
Instituto de Ciencias del Mar y Limnología, Universidad Nacional Autónoma de México, Av. Universidad 3000, Copilco, Coyoacán 04510, Mexico
3
Escuela Nacional de Ciencias de la Tierra, Universidad Nacional Autónoma de México, Av. Universidad 3000, Copilco, Coyoacán 04510, Mexico
4
Facultad de Estudios Superiores Iztacala, Universidad Nacional Autónoma de México, Av. de Los Barrios 1, Los Reyes Iztacala, Tlalnepantla 54090, Mexico
*
Author to whom correspondence should be addressed.
J. Mar. Sci. Eng. 2025, 13(8), 1394; https://doi.org/10.3390/jmse13081394
Submission received: 16 June 2025 / Revised: 17 July 2025 / Accepted: 19 July 2025 / Published: 23 July 2025
(This article belongs to the Special Issue Mesozooplankton Ecology in Marine Environments)

Abstract

This study evaluated how the summer circulation pattern in the Southern Gulf of California influences copepod communities. The evaluation was based on hydrographic data and zooplankton samples collected during a multidisciplinary research cruise conducted in June and July of 2019. The results revealed the presence of a cyclonic circulation with a diameter of approximately 100 km, located near the entrance of the Gulf, affecting the upper 200 m layer. A total of 30 copepod species were identified, including 20 from the order Calanoida and 10 from Cyclopoida. The most abundant Calanoida species were Canthocalanus pauper, Clausocalanus furcatus, and Subeucalanus subcrassus, with respective densities of 2316.80, 1593.60, and 1584.64 ind m−3. The most abundant Cyclopoida species were Oithona setigera, Dioithona rigida, and Oncaea venusta, which had densities of 963.44, 290.56, and 235.52 ind m−3, respectively. The horizontal distribution of these species showed variations influenced by the cyclonic circulation. Specifically, low abundance values were observed at the center of cyclonic circulation, while higher values were found at its periphery. This pattern was consistent among the dominant species, indicating that they do not benefit from the cold subsurface waters induced by circulation. In fact, the distribution of some species was higher in a band of warm water located in the eastern portion of the study area. Overall, our findings shed light on how the summer cyclonic circulation in the Southern Gulf of California affects the copepod community, an aspect that has not been previously explored. This research enhances our understanding of the processes influencing this group of organisms in a highly dynamic environment.

1. Introduction

The Gulf of California (GC) experiences notable seasonal variability in its surface circulation patterns and thermohaline structure. Three main physical drivers influence these dynamics: (1) the monsoon wind system, (2) the exchange with the Pacific Ocean (PO), and (3) heat transfer through the surface [1]. As a result, the surface current patterns in the southern GC are highly dynamic, showing significant differences between summer and winter. The exchange with the PO is essential for circulation in this region; during the summer, there is an inflow close to the mainland coast and an outflow near the peninsula’s coast, which leads to the formation of a cyclonic circulation [1].
The hydrodynamics of the southern GC is particularly notable due to its direct connection with the PO, which facilitates a continuous exchange of different water masses. This exchange creates a complex thermohaline structure in the surface layers that influences regional circulation patterns [2].
The differences in temperature, salinity, and density among the water masses converging at the entrance of the Gulf—such as Tropical Surface Water (TSW), California Current Water (CCW), and Gulf of California Water (GCW)—lead to the formation of thermohaline fronts. These fronts often generate mesoscale structures like meanders and eddies, which are common in the southern GC [2,3]. This dynamic environment encourages biological productivity in the Gulf.
The biological productivity in the GC is widely recognized, ranking among the ecosystems with the highest levels of biological production in the world [4]. The region serves as a habitat for many species, including some that are critically endangered [5]. The elevated levels of biological production in the Gulf are directly linked to the species that form the base of the food chain, such as zooplankton [6].
Zooplankton encompasses a large and diverse group of organisms that play a fundamental role in pelagic food webs [7]. Among them, copepods are particularly significant, as they are one of the most abundant groups [8]. Copepods, the most numerous microcrustaceans in the world, are essential in marine ecosystems due to their varied feeding habits; they can be herbivores, omnivores, detritivores, or carnivores [9]. Their small size makes them an important food source for a variety of organisms, including invertebrates, fish, birds, and even marine mammals [10]. This dynamic relationship facilitates the transfer of energy and carbon within marine food webs [11,12].
Research on copepod populations in the GC began in the 1970s. Early studies highlighted the numerical significance of these organisms and examined their biogeography [13]. Subsequent research confirmed the ecological importance of copepods [14]. Since then, significant efforts have been made to understand the dynamics of copepod populations within the Gulf, particularly regarding how large-scale processes influence their community structure. For example, during the 1982/1983 El Niño event, the copepod community structure was composed of over 65% calanoid copepods with tropical affinities, notably featuring Pleuromamma gracilis Claus, 1863 [15]. Additionally, studies reported a considerable decrease in the biomass and density of zooplankton organisms, particularly copepods, euphausiids, and tunicates, during this event [16].
Over the past few decades, studies have focused on how changes in the hydrographic properties of the water column affect the copepod community structure of the GC. Variations in species composition have been observed between the cold and warm seasons. During winter (January), the water column is well-mixed, with temperatures ranging from 16 to 18 °C. This season is dominated by species such as Pleuromamma gracilis, Calanus pacificus (Brodsky, 1948), Rhincalanus nasutus (Giesbrecht, 1888), and Scolecithrix danae (Lubbock, 1856). Conversely, in the summer (July), a prominent thermocline develops, leading to a shift in dominance toward species like Centropages furcatus (Dana, 1849–1852), Clausocalanus furcatus (Brady, 1883), and Canthocalanus pauper (Giesbrecht, 1888) [17].
Two significant warm episodes in the southern GC—the heatwave of 2014 and the 2015 El Niño event—resulted in notable changes in species composition. During the 2014 heatwave, Acartia tonsa (Dana, 1849–1852) was the dominant species. In contrast, during the 2015 El Niño, Clausocalanus furcatus, Copilia mirabilis (Dana, 1849–1852), and Cosmocalanus darwinii (Lubbock, 1860) became key indicators [18]. The authors noted that tropical species comprised 87% of the assemblage in 2014, increasing to 95% in 2015. Recently, significant seasonal variability in copepod abundance has been documented in the GC, correlating with changes in temperature and the availability of food, particularly phytoplankton. Copepod abundance was significantly higher during the cold season compared to the warm season. However, no substantial changes in species richness were reported [19].
Mesoscale structures play a significant role in shaping the composition, distribution, and abundance of copepods in the southern GC. For instance, a mature summer cyclonic eddy, approximately 150 km in diameter, affects both the vertical and horizontal distribution of calanoid copepods. Horizontally, the dominant species, Subeucalanus subtenuis (Giesbrecht, 1888), becomes less abundant towards the center of the eddy. Vertically, the thermocline primarily hosts Nannocalanus minor (Claus, 1863) and Temora discaudata (Giesbrecht, 1889) [20]. Additionally, during summer, a mesoscale frontal zone connecting the GC with the PO causes the thermocline to deepen. This deepened thermocline creates a habitat dominated by the calanoid copepods Scolecithrix bradyi Giesbrecht, 1888, and Heterorhabdus papilliger (Claus, 1863). However, the concentrations of these species remain low (<450 ind 1000 m−3) [21].
To date, numerous studies have provided a comprehensive characterization of the copepod populations in the GC, focusing on biogeography, seasonal variations, and latitudinal changes. However, the effect of summer cyclonic circulation in the southern GC on copepod composition and distribution is still not well understood. This study aimed to assess copepod communities in the southern GC during the summer of 2019 to better understand how circulation patterns influence these organisms. We hypothesize that temperature gradients induced by the cyclonic circulation of the southern Gulf will generate changes in species composition, as well as impact the horizontal distribution of some species. We achieved this by using high-resolution hydrographic data and zooplankton samples collected during a multidisciplinary research cruise aboard the R/V El Puma, operated by the National Autonomous University of Mexico, which took place in June and July of 2019.

2. Materials and Methods

2.1. Study Area

The GC is a large, elongated inland sea located within Mexican territory, bordered by the Baja California Peninsula to the west and mainland Mexico to the east (Figure 1a). The Gulf features a highly variable topography, with depths that exceed 3500 m in the southern region, and shallower areas dropping to just 200 m in the north. It is renowned for its rich marine life and serves as an essential habitat for several iconic species, providing both refuge and feeding grounds [22]. For these reasons, the GC is included in the list of the 64 Large Marine Ecosystems worldwide and is currently designated as a UNESCO World Heritage site [23].
Hydrodynamically, several processes, such as upwellings, fronts, meanders, and eddies, significantly influence biological productivity within the Gulf. Key factors affecting this productivity include strong tidal mixing in the northern GC [3], the propagation of internal waves [24], a summer cyclonic circulation [3,25], the presence of mesoscale eddies [26], coastal upwellings [27], and the effects of El Niño Southern Oscillation (ENSO) [4,28].

2.2. Sampling

High-resolution hydrographic data on temperature and conductivity were collected at 36 hydrographic stations in the southern GC (Figure 1b). The data were obtained using a Conductivity–Temperature–Depth (CTD) sonde (Sea-Bird SBE-9 Plus), which was equipped with dissolved oxygen (SBE 42) and fluorescence sensors (ECO-Wet Labs) and connected to a General Oceanics rosette. This dataset was gathered during the multidisciplinary scientific expedition “FIBGOC-I”, which took place on board the R/V El Puma from 24 June to 6 July 2019. Each CTD cast was performed near the seafloor, approximately 5 m above it, with a descent rate of 1 m s−1 and a data storage configuration of 24 Hz. The sensitivity of the CTD sensors was 0.005 °C for temperature and 0.0005 S m−1 for conductivity.
After each CTD-rosette cast, oblique zooplankton hauls were conducted both during the day and night using bongo nets with mesh sizes of 333 μm and a mouth diameter of 60 cm (Figure 1b). Zooplankton samples were collected from a depth of 200 m to the surface, or from near the bottom at shallower stations. The volume of water filtered during each haul was recorded using General Oceanics 2030R flowmeters, which were calibrated by the manufacturer prior to the cruise. The collected organisms were then immediately fixed in a 4% formalin solution (with sodium borate added) for 24 h and subsequently preserved in a 70% ethanol solution.

2.3. Data Processing

The CTD data collected at each hydrographic station underwent several levels of processing. First, the data were converted into usable scientific units using the manufacturer’s software (SBE Data Processing v. 7.26.7), with an average depth interval of 1 dbar. Following this, standard algorithms were applied to derive the potential temperature (°C) and salinity levels (psu). The thermocline depth was determined by identifying the depth at which the maximum vertical temperature gradient occurred. Additionally, geostrophic velocities were calculated using standard methods [29]. To analyze the vertical distribution of both hydrographic properties and the geostrophic velocities, data were presented in a vertical section along transect A-A’ representing the boundary between PO and the GC (Figure 1b).
Sea surface temperature (SST, °C) and chlorophyll-a concentration (mg m−3) data were obtained from the Moderate Resolution Imaging Spectroradiometer (MODIS-AQUA) for the date corresponding to the research cruise. These data, with a resolution of 1 km per pixel, were processed using SeaDAS software (version 7.4) in accordance with standard algorithms and protocols [30], along with recommendations from Coria-Monter et al. [22]. Finally, maps of both variables were created using routines for MATLAB R2021b.

2.4. Laboratory Analyses

The zooplankton samples were analyzed immediately after collection. First, the original samples were divided using a Folsom splitter, reducing them to 1/32 of their original volume. This method has proven effective for samples from the Southern Gulf of California, as it accurately represents all zooplankton groups in the region, including copepods [31,32]. Next, adult copepods were isolated by picking them out with a glass Petri dish as a base, while using a Carl Zeiss Stemi 508 stereo microscope equipped with an Axiocam 208 color camera. The organisms were identified down to the species level using general identification keys [33,34,35] as well as specific keys for the GC region [36]. The nomenclature for all species was verified using international repositories (e.g., WORMS). Our study focused solely on adult organisms because, at this stage, all the essential structures for their taxonomic identification (such as antennae, antennules, maxillae, mandibles, genital segments, caudal rami) are fully developed and distinct, which ensures accurate identification at the species level and helps avoid bias [33]. Finally, the abundance of each species was standardized to density units (ind m−3) based on flowmeters readings, following standard procedures [37].

2.5. Statistical Analyses

Different statistical methods were employed to analyze the relationships between environmental variables and the density of different copepod species in the dataset. Initially, correlation tests were conducted to evaluate the statistical significance of the data, focusing on the relationship between copepod density and environmental factors such as temperature, geostrophic current speed at a depth of 50 m, and the total depth at each station. Following this, an agglomerative hierarchical clustering analysis was performed using a Bray–Curtis similarity matrix. To minimize the influence of dominant species in the dataset, the density data for each copepod species were transformed using the double square root method, as suggested by Field et al. [38].
To explore how physical and chemical parameters impact copepod assemblages, a Canonical Correspondence Analysis (CCA) was conducted. The environmental variable matrix included hydrographic variables, chlorophyll-a, and dissolved oxygen levels, previously transformed using a double square root. Additionally, a matrix containing the double square root-transformed density data for each copepod species was used. CCA is a multivariate statistical technique that enables the simultaneous analysis of an organism’s responses to environmental variables, modeling unimodal relationships between dependent and explanatory variables. This method produces a low-dimensional ordination diagram and is widely used in ecological research [39].
Finally, complementary statistical methods were applied to the generated dataset, including a similarity percentage analysis (SIMPER) and an analysis of similarity (ANOSIM).

3. Results

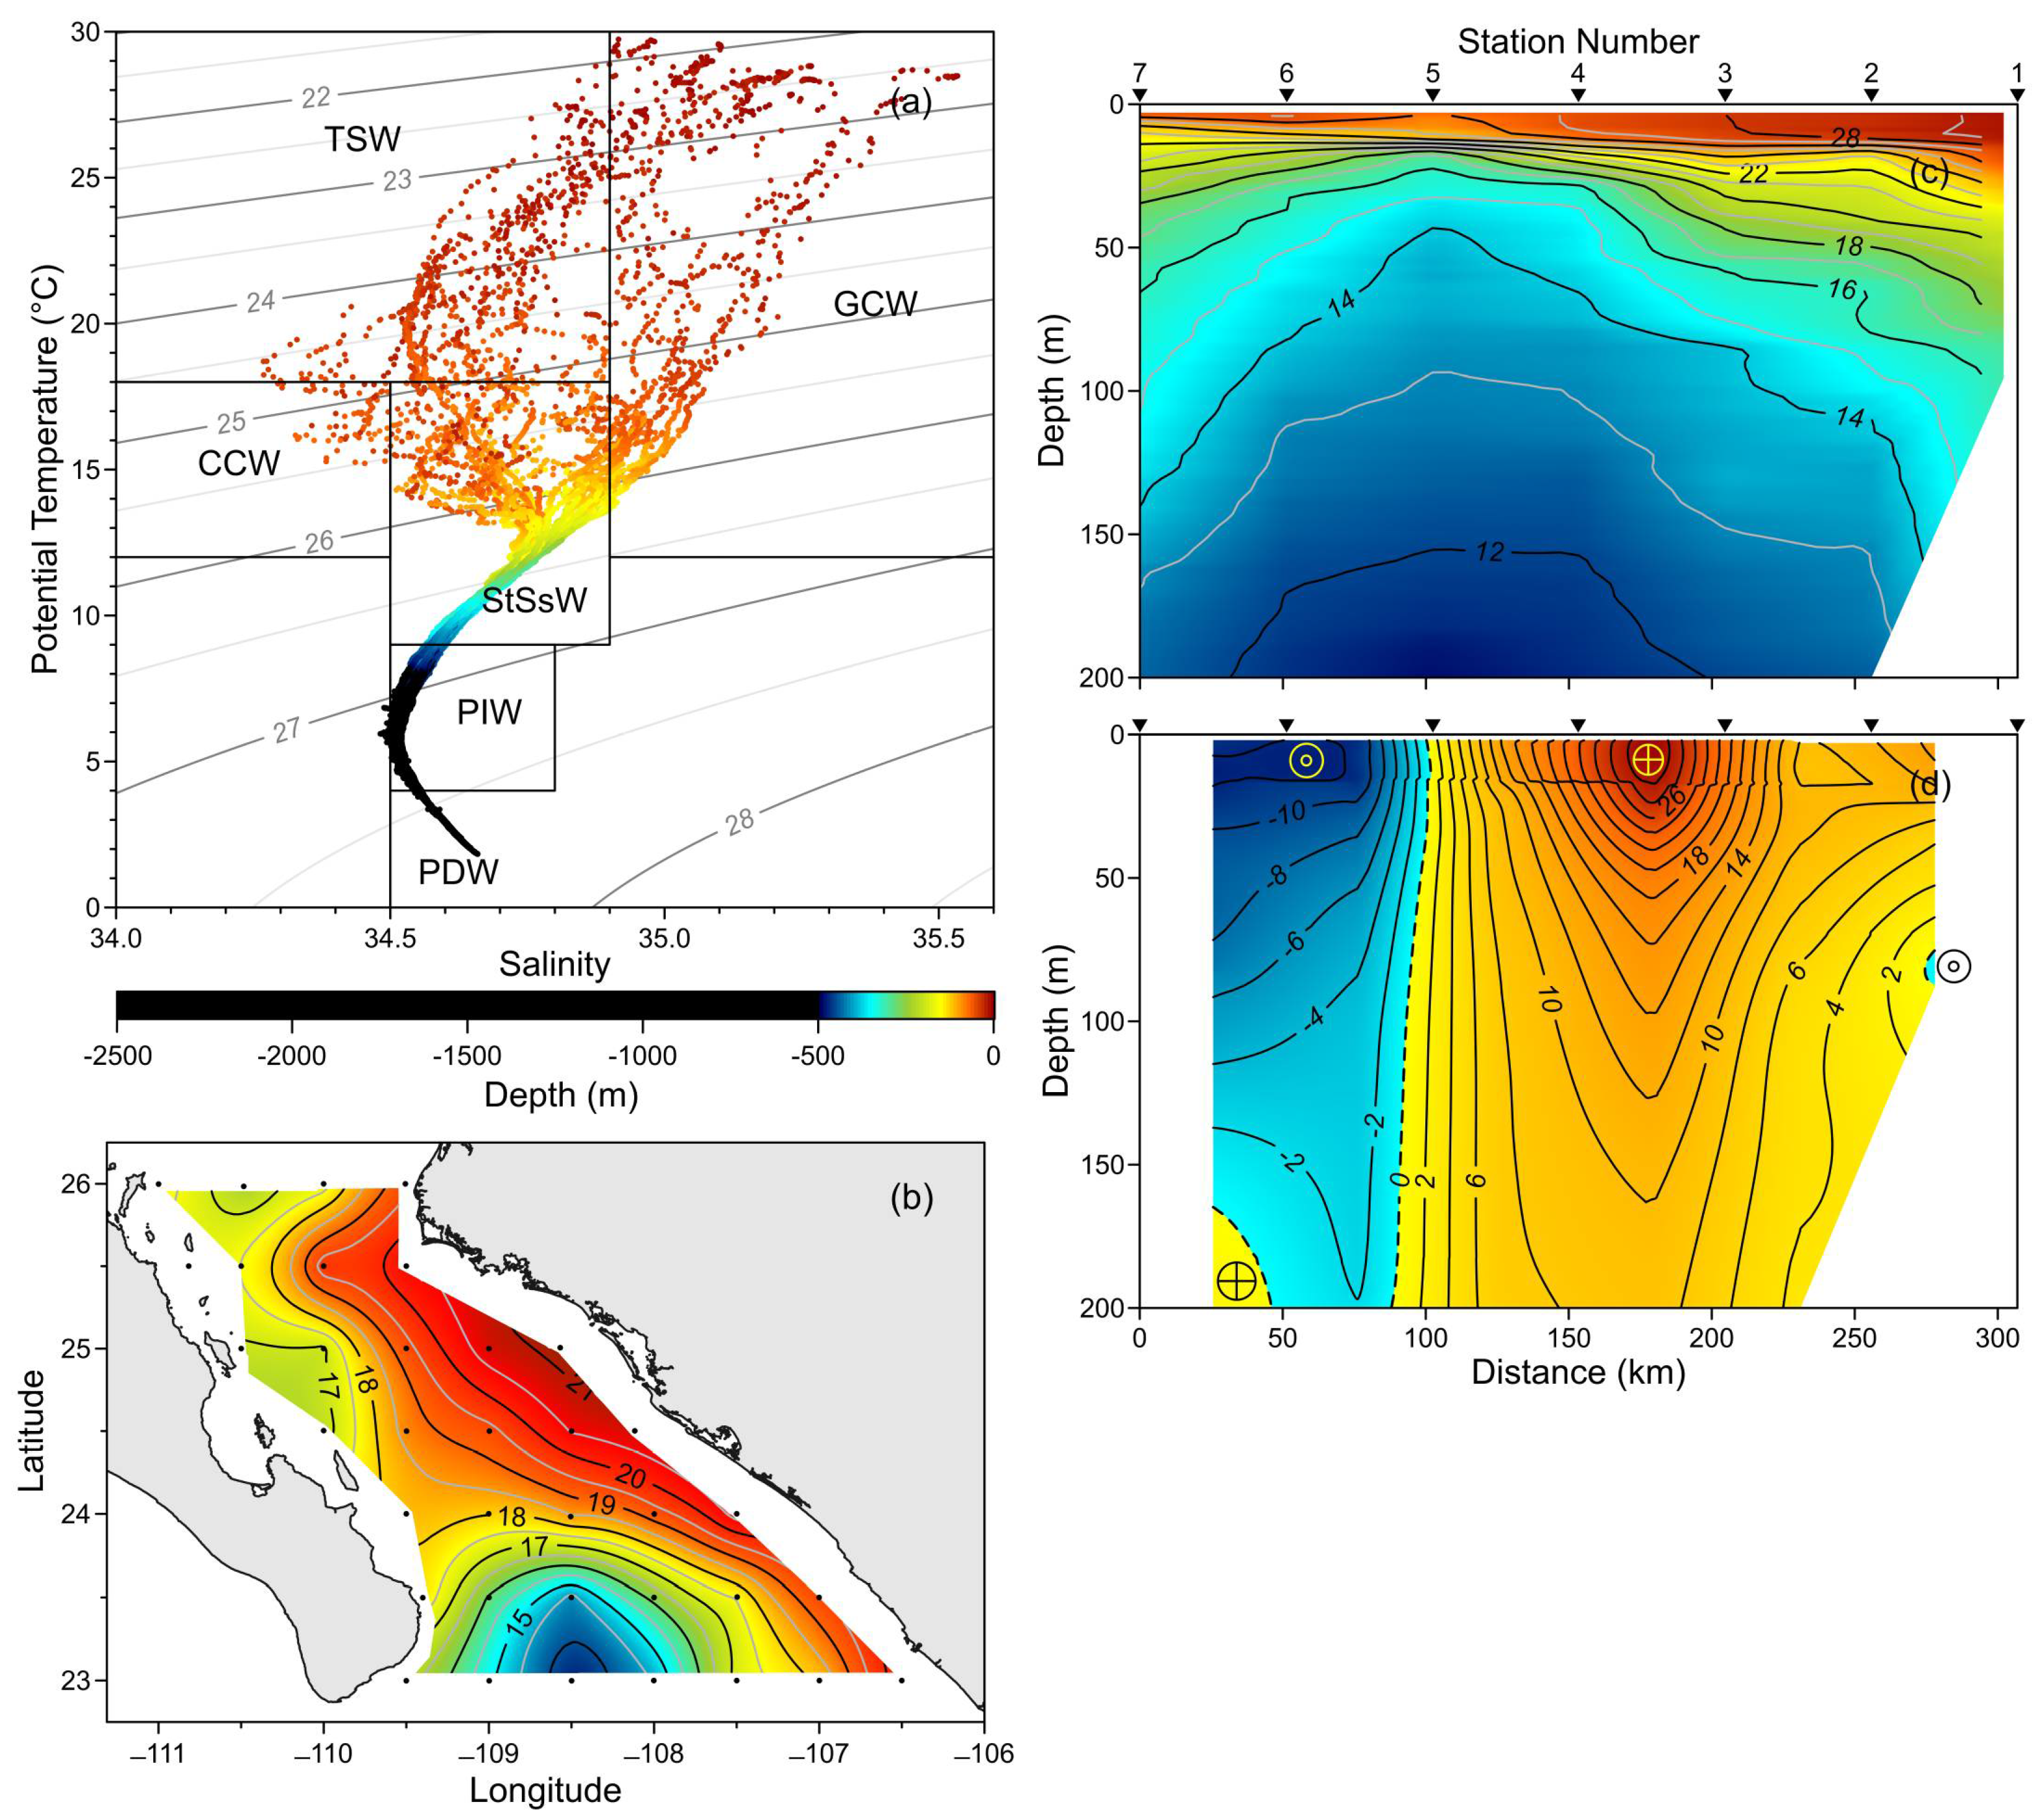
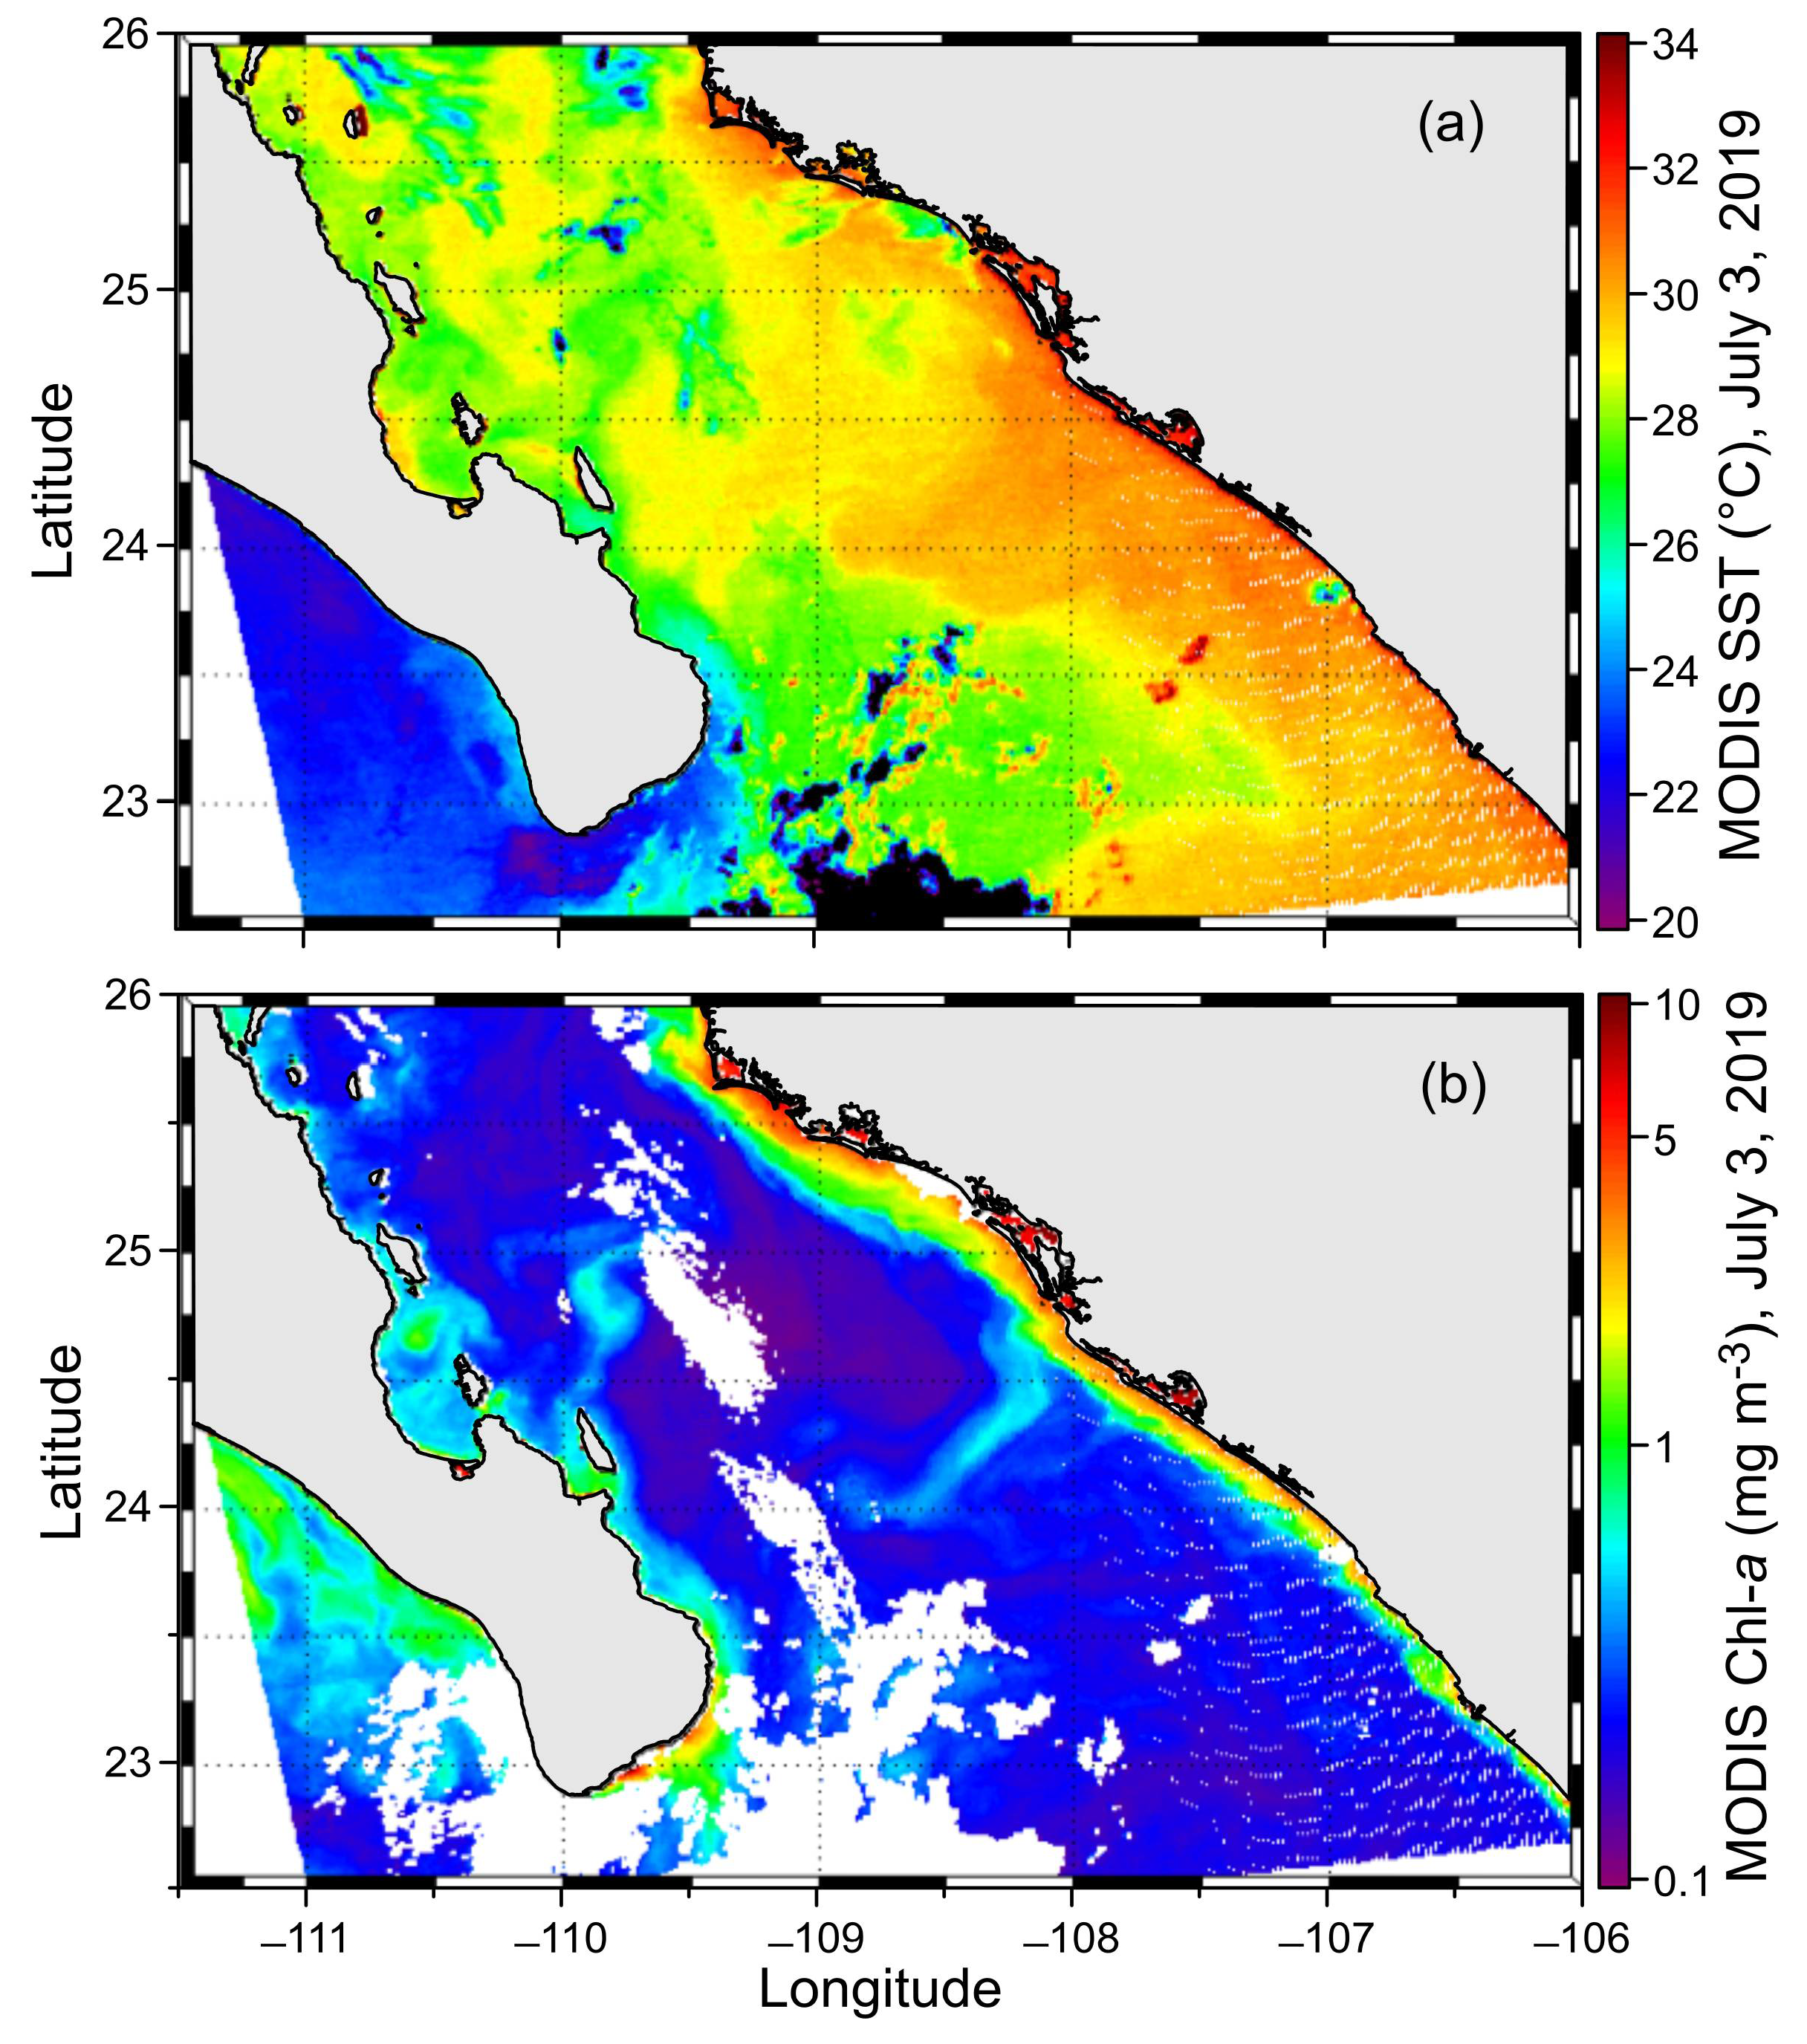
3.1. Hydrography and Circulation Pattern

The potential temperature (°C) and salinity (psu) diagram indicated the presence of six water masses: (1) TSW, (2) GCW, (3) CCW, (4) Subtropical Subsurface Water (SSW), (5) Pacific Intermediate Water (PIW), and (6) Pacific Deep Water (PDW) (Figure 2a).
The thermocline was observed at a depth of 50 m. At this depth, the horizontal distribution of temperature displayed a cold core with a temperature of 13 °C at its center. This cold core, located in the southwest, extends approximately 100 km in diameter, where the GC connects with the PO (Figure 2b). Additionally, the horizontal distribution of temperature revealed a region of warmer water (>19 °C) along the mainland coast. In the northernmost section, this warm water nearly surrounds both coasts of the Gulf (Figure 2b).
Regarding the vertical distribution of temperature along the A-A’ transect (Figure 1b), an uplift of the isotherms was observed (Figure 2c). At station 5, a more pronounced uplift was noted; specifically, the 14 °C isotherm rose from a depth of 140 m to 50 m (Figure 2c). This uplift can be attributed to the cyclonic circulation pattern occurring in the region during the summer. Figure 2d further confirms this cyclonic circulation. In the upper 200 m layer, the vertical section of the geostrophic velocity (cm s−1) along the A-A’ transect indicates the highest inflow between stations 3 and 4, while outflow is observed to the left of station 5, where the center of cyclonic circulation is located.
Satellite images were obtained on 3 July 2019. Despite some gaps in the data, interesting features were still visible. The sea surface temperature, as shown in Figure 3a, exhibited a pattern similar to that shown in Figure 2b. A band of warm water (>28 °C) was noted along the mainland coast. In contrast, lower sea surface temperatures were observed in the central part of the study area and along the coast of the Baja California Peninsula. The chlorophyll-a image (Figure 3b) indicated the highest values (>5 mg m−3) in the coastal regions, along with the presence of filaments at approximately 24.75 °N.

3.2. Copepod Community Structure

Our study revealed a taxonomic list that includes 30 species of planktonic copepods. Among these, 20 species belong to the order Calanoida, while 10 species are classified under Cyclopoida (Table 1).
Within the order Calanoida, the most abundant species were Canthocalanus pauper (Giesbrecht, 1888), with a density of 2316.80 ind m−3; Clausocalanus furcatus Brady, 1883, with a density of 1593.60 ind m−3; and Subeucalanus subcrassus (Giesbrecht, 1888), with 1584.64 ind m−3. In contrast, Labidocera acuta (Dana, 1849–1852) was the least abundant species, recorded at only 2.24 ind m−3.
Within the order Cyclopoida, the most abundant species was Oithona setigera Dana, 1853–1855, with a density of 963.44 ind m−3. This was followed by Dioithona rigida (Giesbrecht, 1896) with 290.56 ind m−3, and Corycaeus obtusus Dana, 1849–1852, which recorded 139.52 ind m−3. The species Onychocorycaeus catus (Dahl, 1894) was recorded with only 0.32 ind m−3.

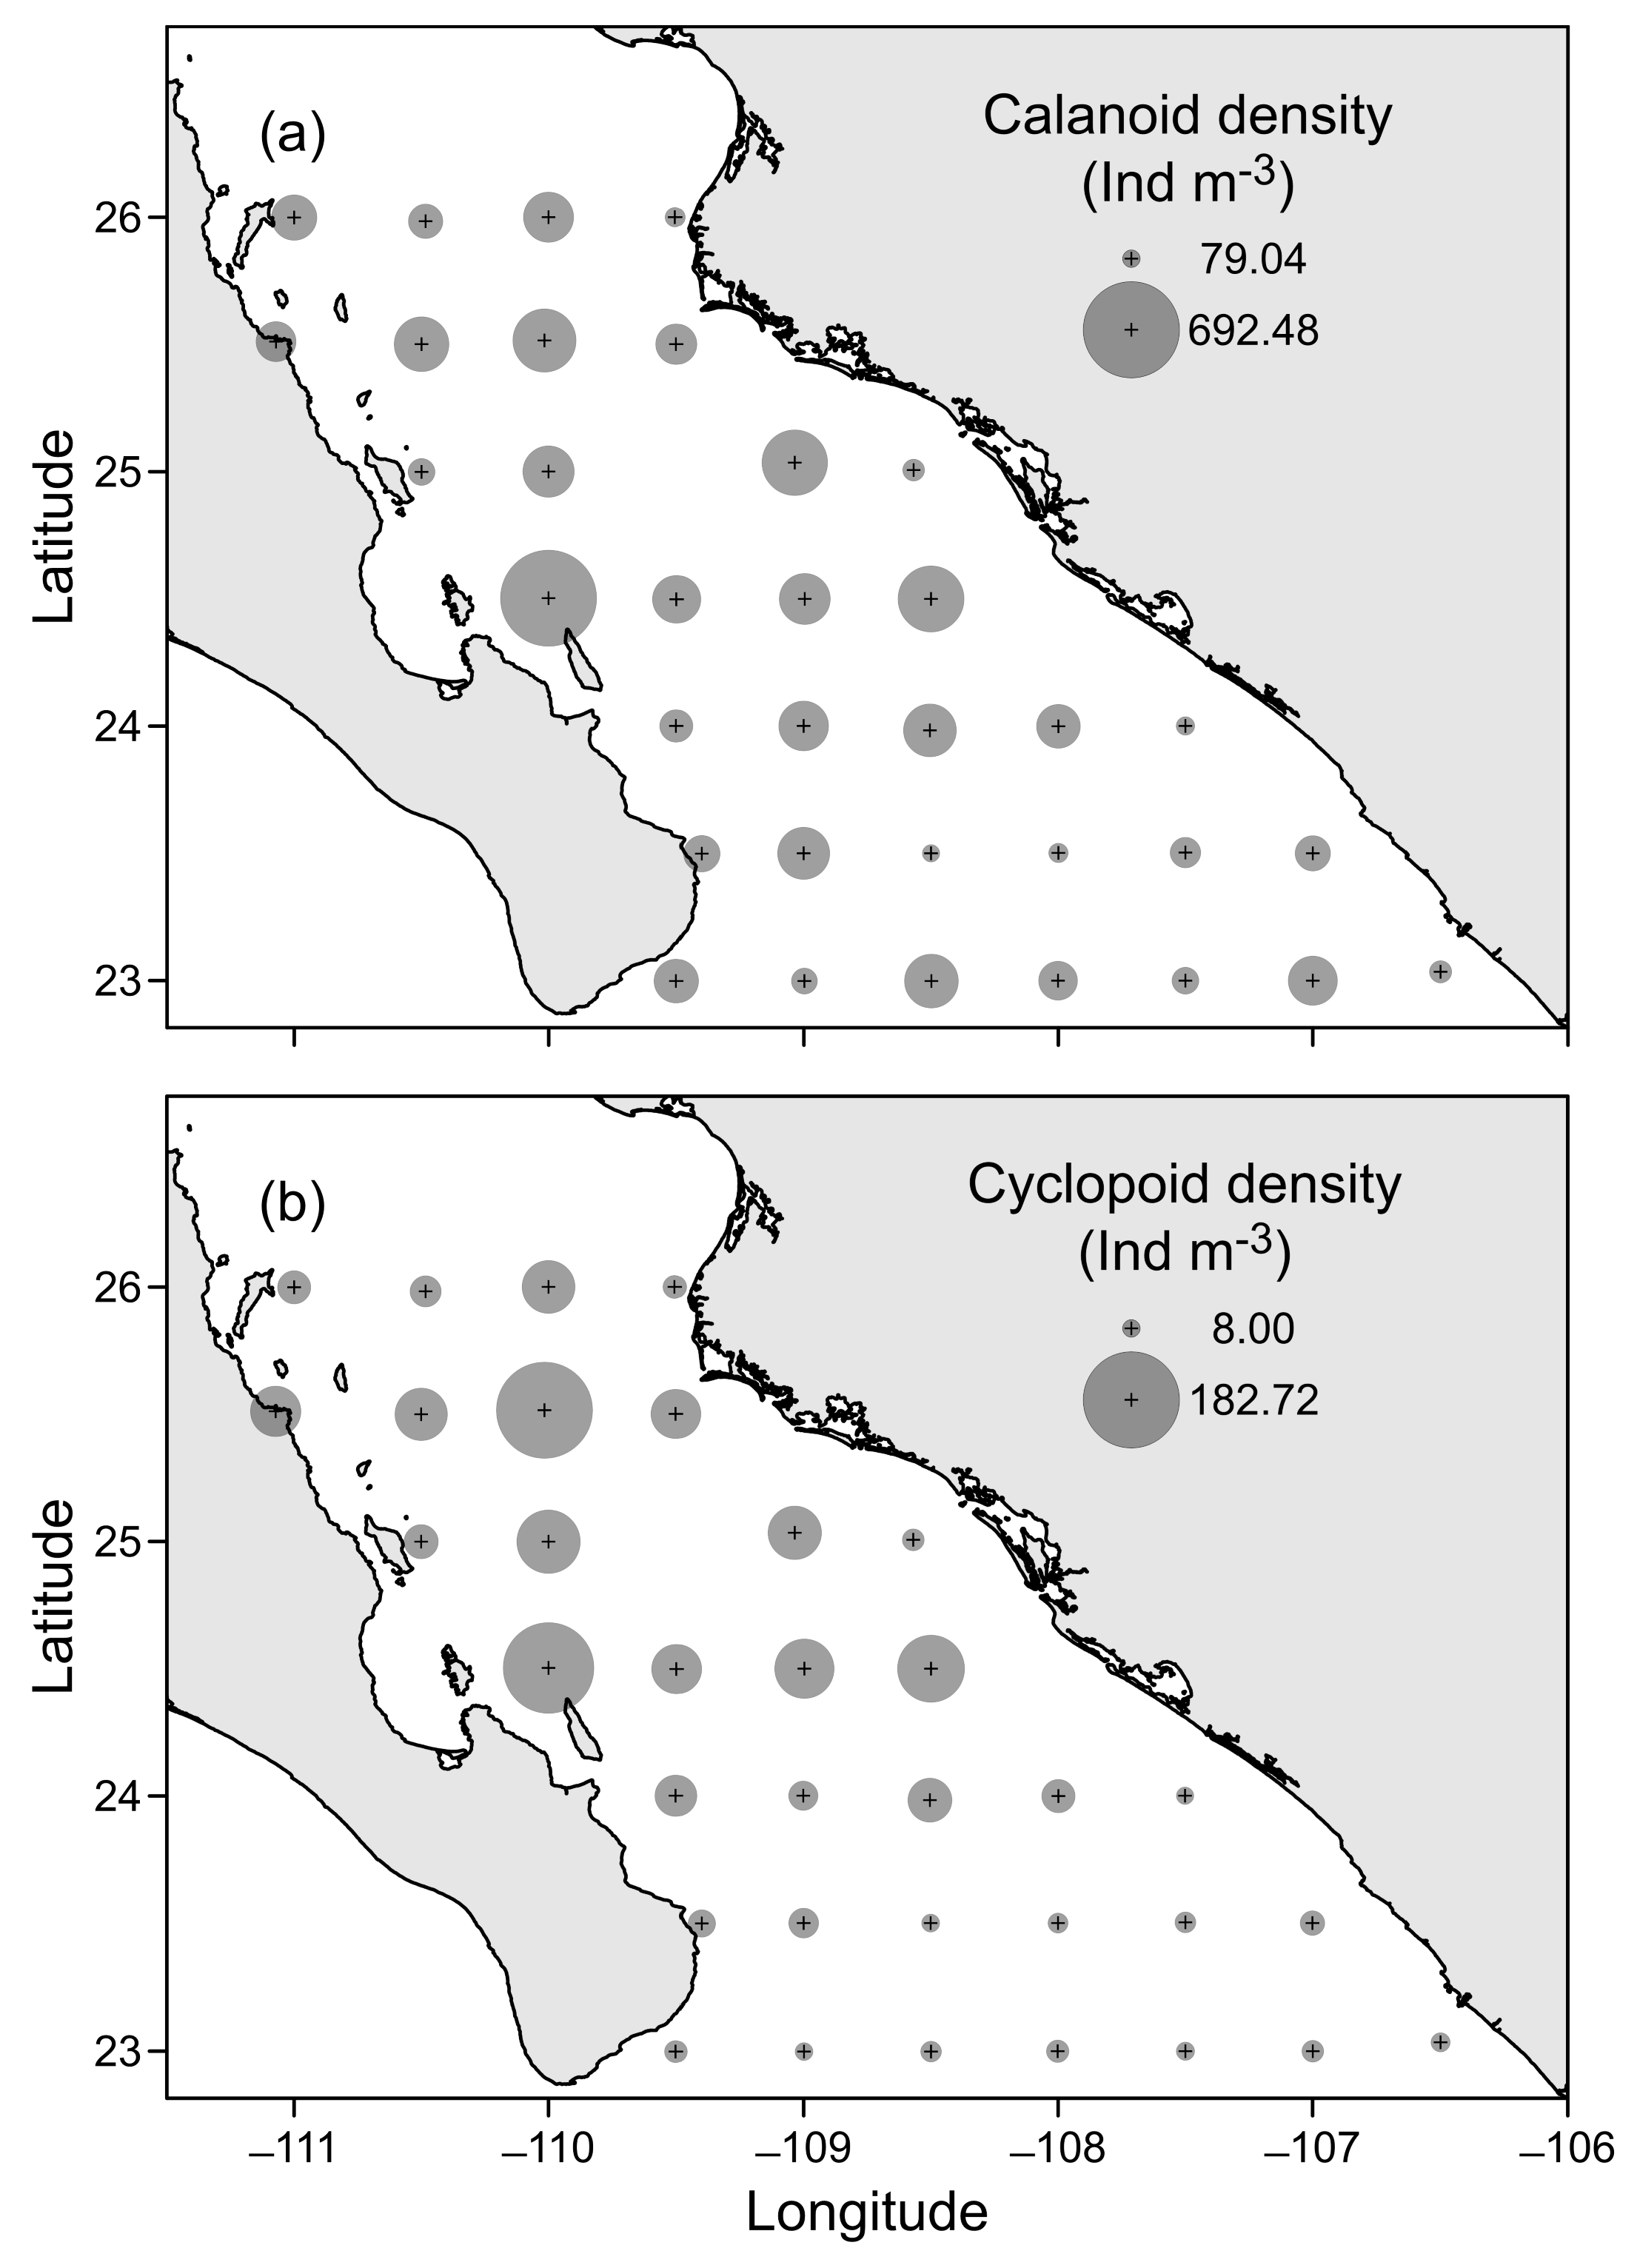
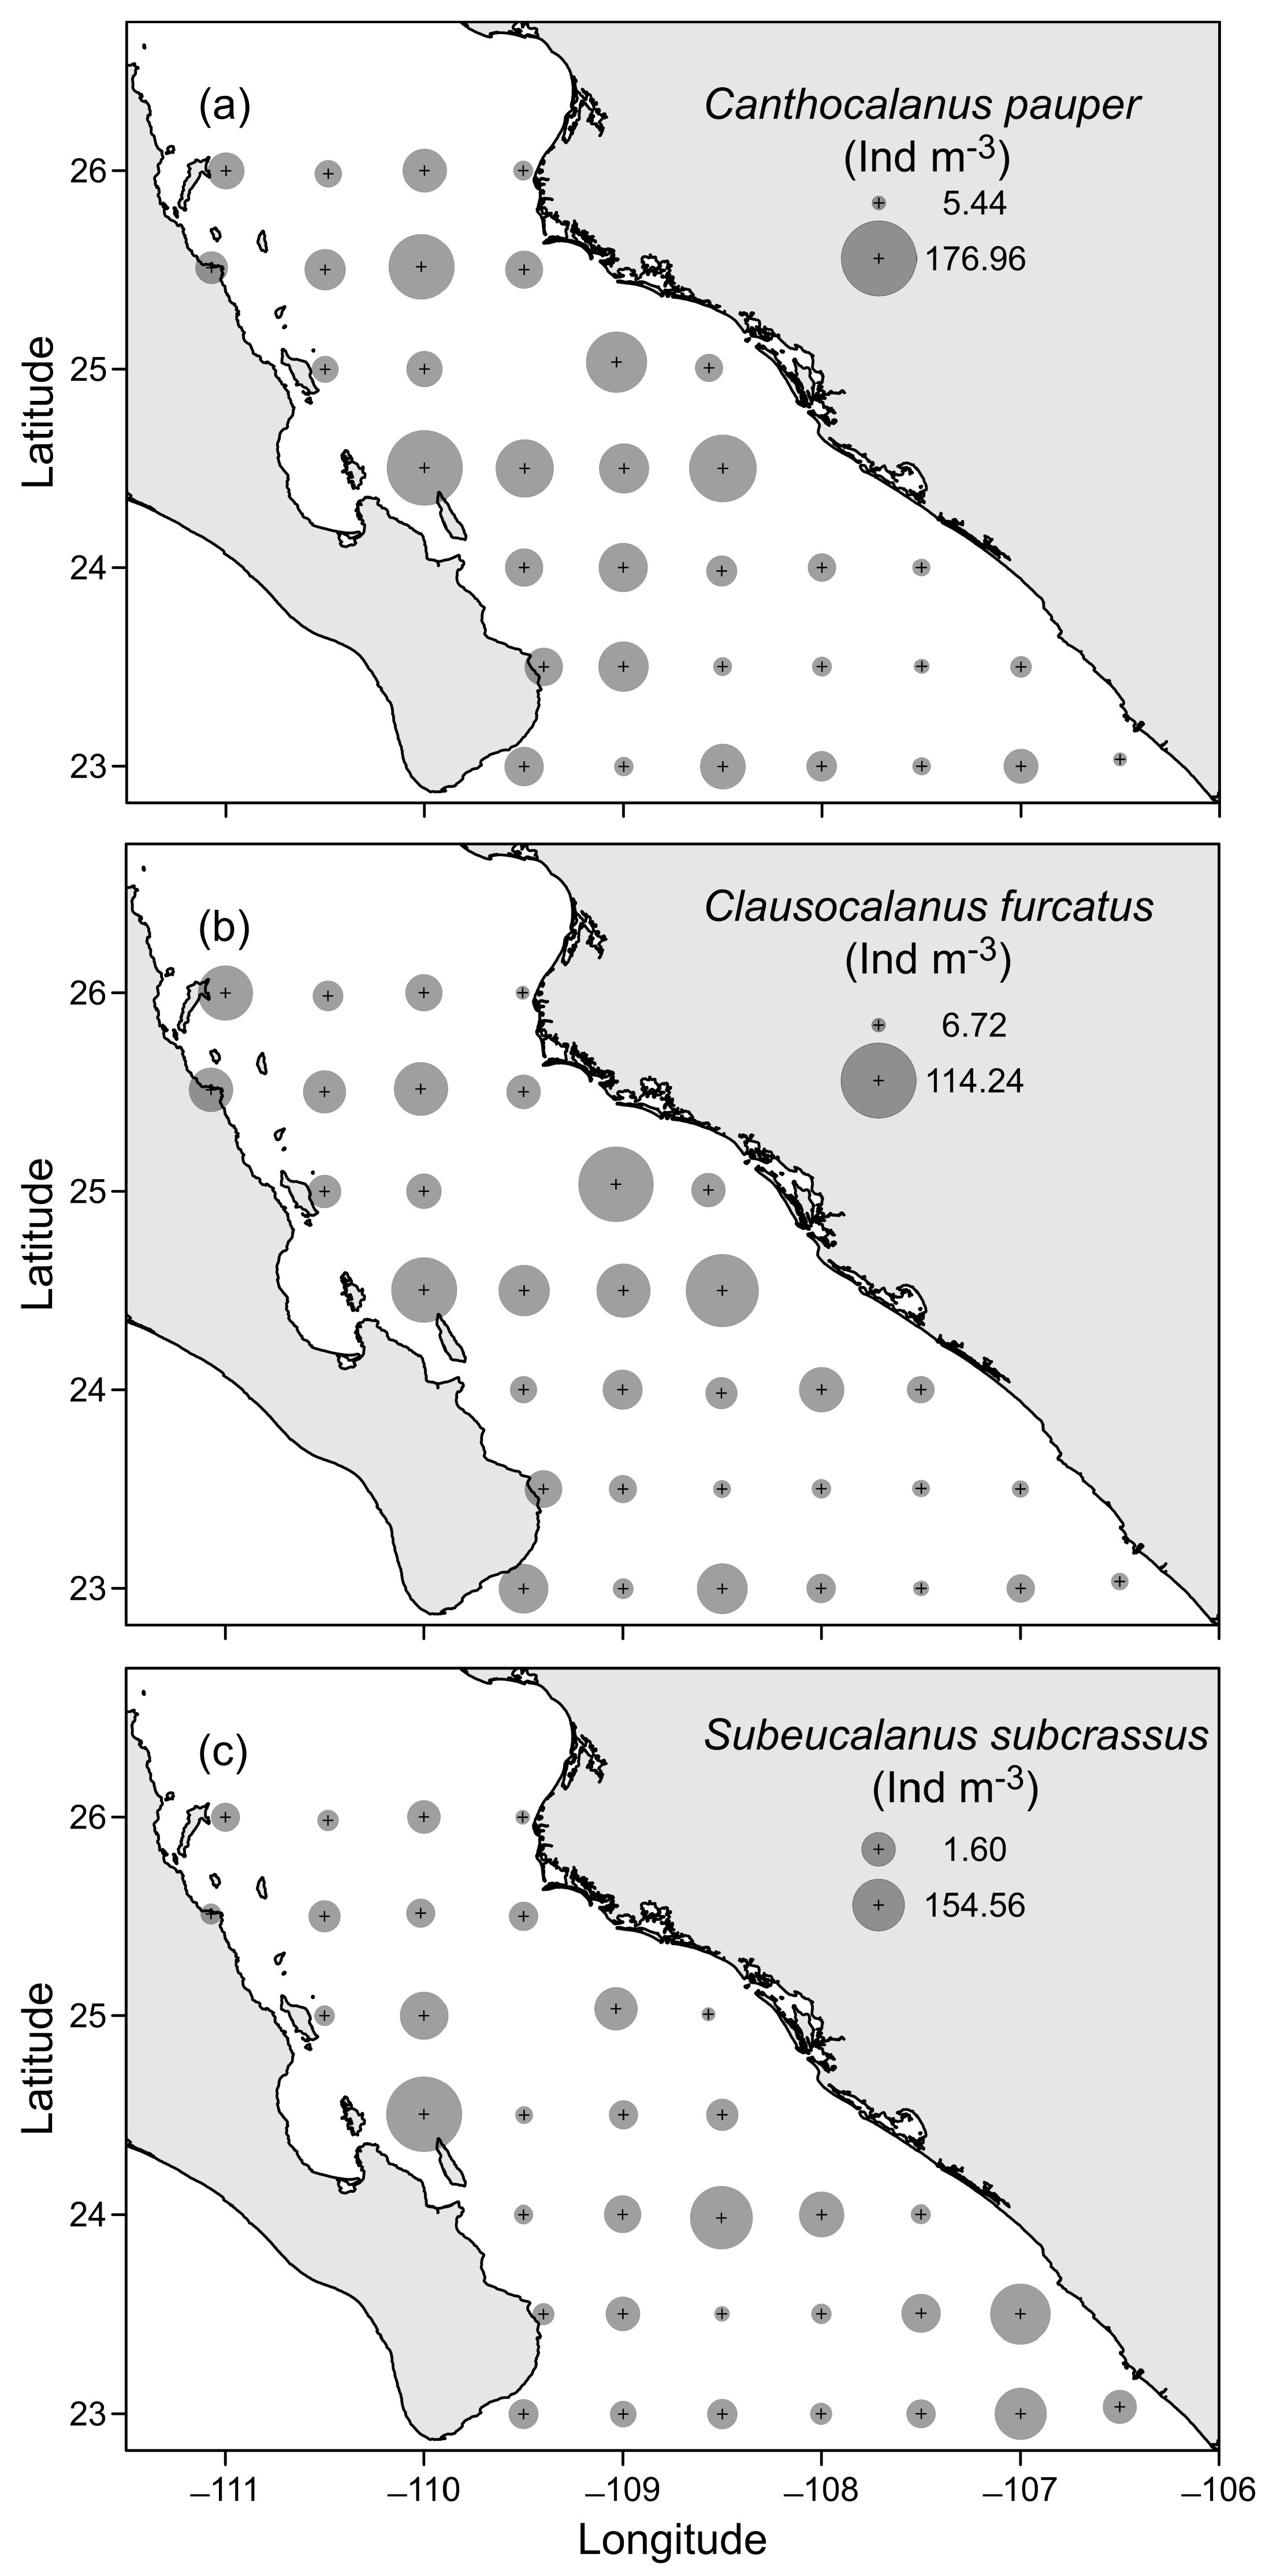
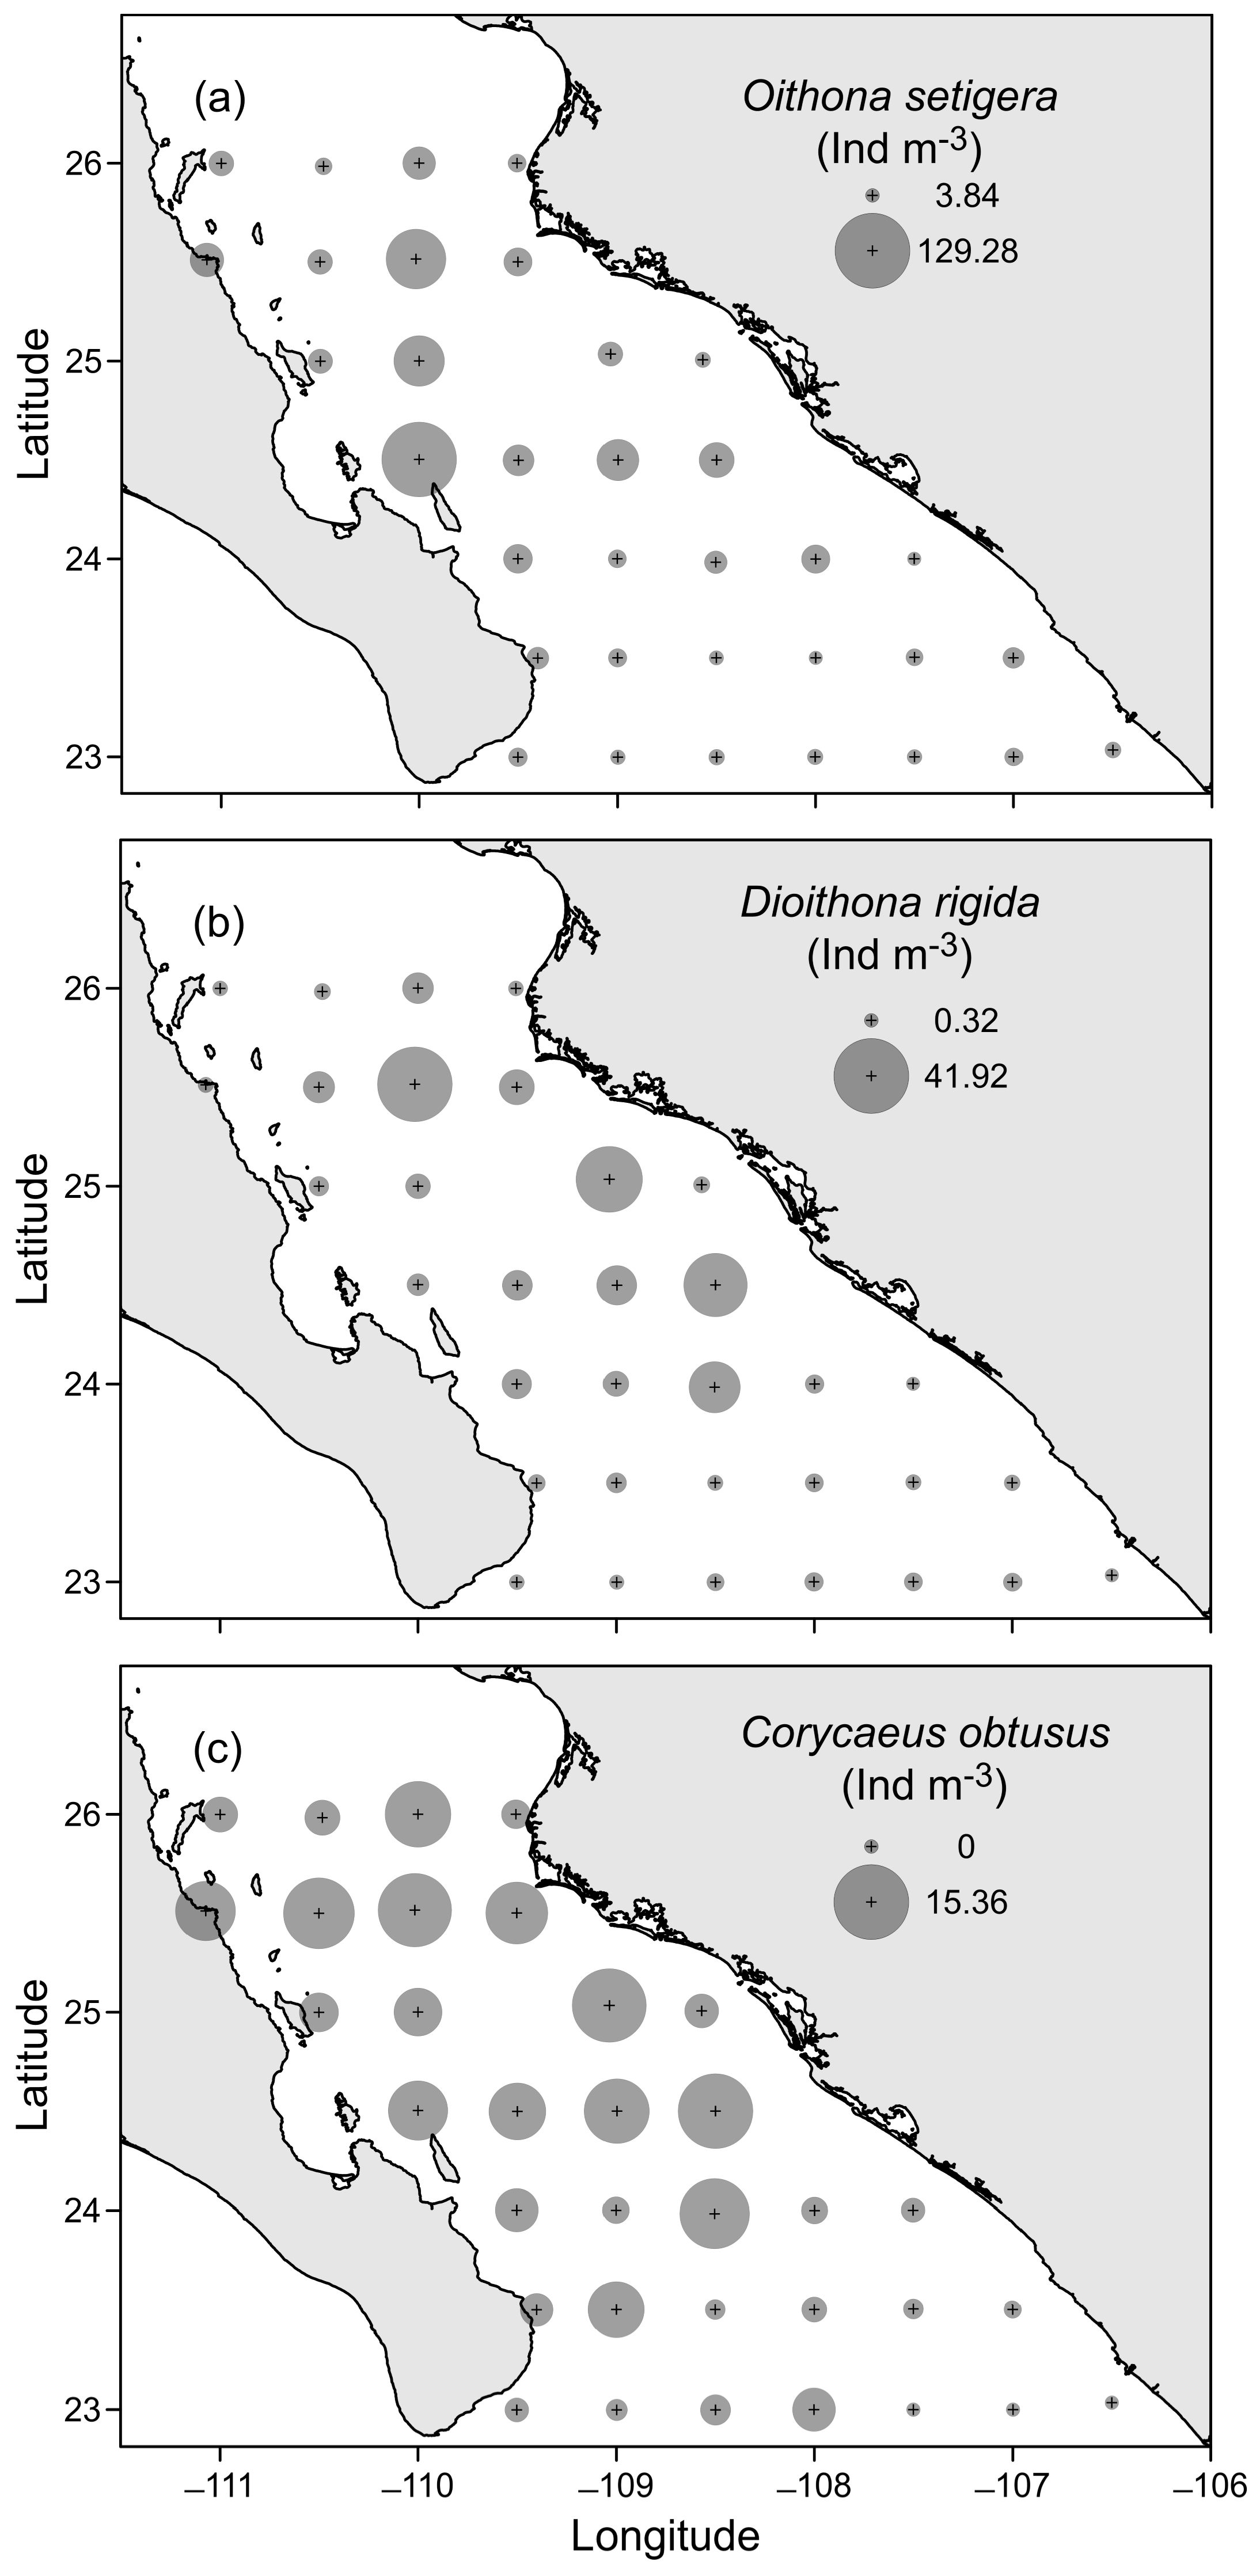
3.3. Horizontal Distribution of Copepods

The horizontal distribution of the copepod density showed significant variations. For calanoid copepods, areas of higher density were identified, particularly near the coast of the Baja California Peninsula, close to the Bay of La Paz (Figure 4a). Secondary peaks in density were observed in the eastern portion of the study area, while lower values were recorded at stations connecting the Gulf with the PO (Figure 4a). In the southern stations linking the PO with the Gulf, low densities of cyclopoid copepods were noted. Conversely, the highest densities of cyclopoid copepods were found in the central and northern parts of the study area, especially at a station near the Bay of La Paz, which exhibited notably high-density levels (Figure 4b).
After identifying the dominant species, we analyzed their horizontal distribution throughout the study area. Among the calanoid copepods, C. pauper showed higher abundances (>90.00 ind m−3) in two main regions (Figure 5a). One of these regions is located near the Baja California peninsula, where the temperature is lower compared to the mainland coast (Figure 2b and Figure 3a). A significant abundance of this species was also noted in the central portion of the study area. The horizontal distribution of C. furcatus revealed high densities (>80.00 ind m−3) on both coasts, as well as at a station located in the central part of the Gulf (Figure 5b). The distribution pattern of S. subcrassus was similar to that of C. pauper, with high densities (>80.00 ind m−3) recorded near the Baja California peninsula and in the central region of the Gulf (Figure 5c).
In terms of cyclopoid copepods, O. setigera displayed a horizontal distribution pattern with the highest densities in the central part of the Gulf and along the coast of the Baja California Peninsula. In contrast, lower density values were recorded in the southern region at the entrance of the GC (Figure 6a). Similarly, D. rigida also exhibited low densities in the southern region, with numbers increasing significantly northward, ultimately reaching maximum values (Figure 6b). A similar trend was observed for C. obtusus, which had low density in the southern area and higher values in the northern region (Figure 6c).

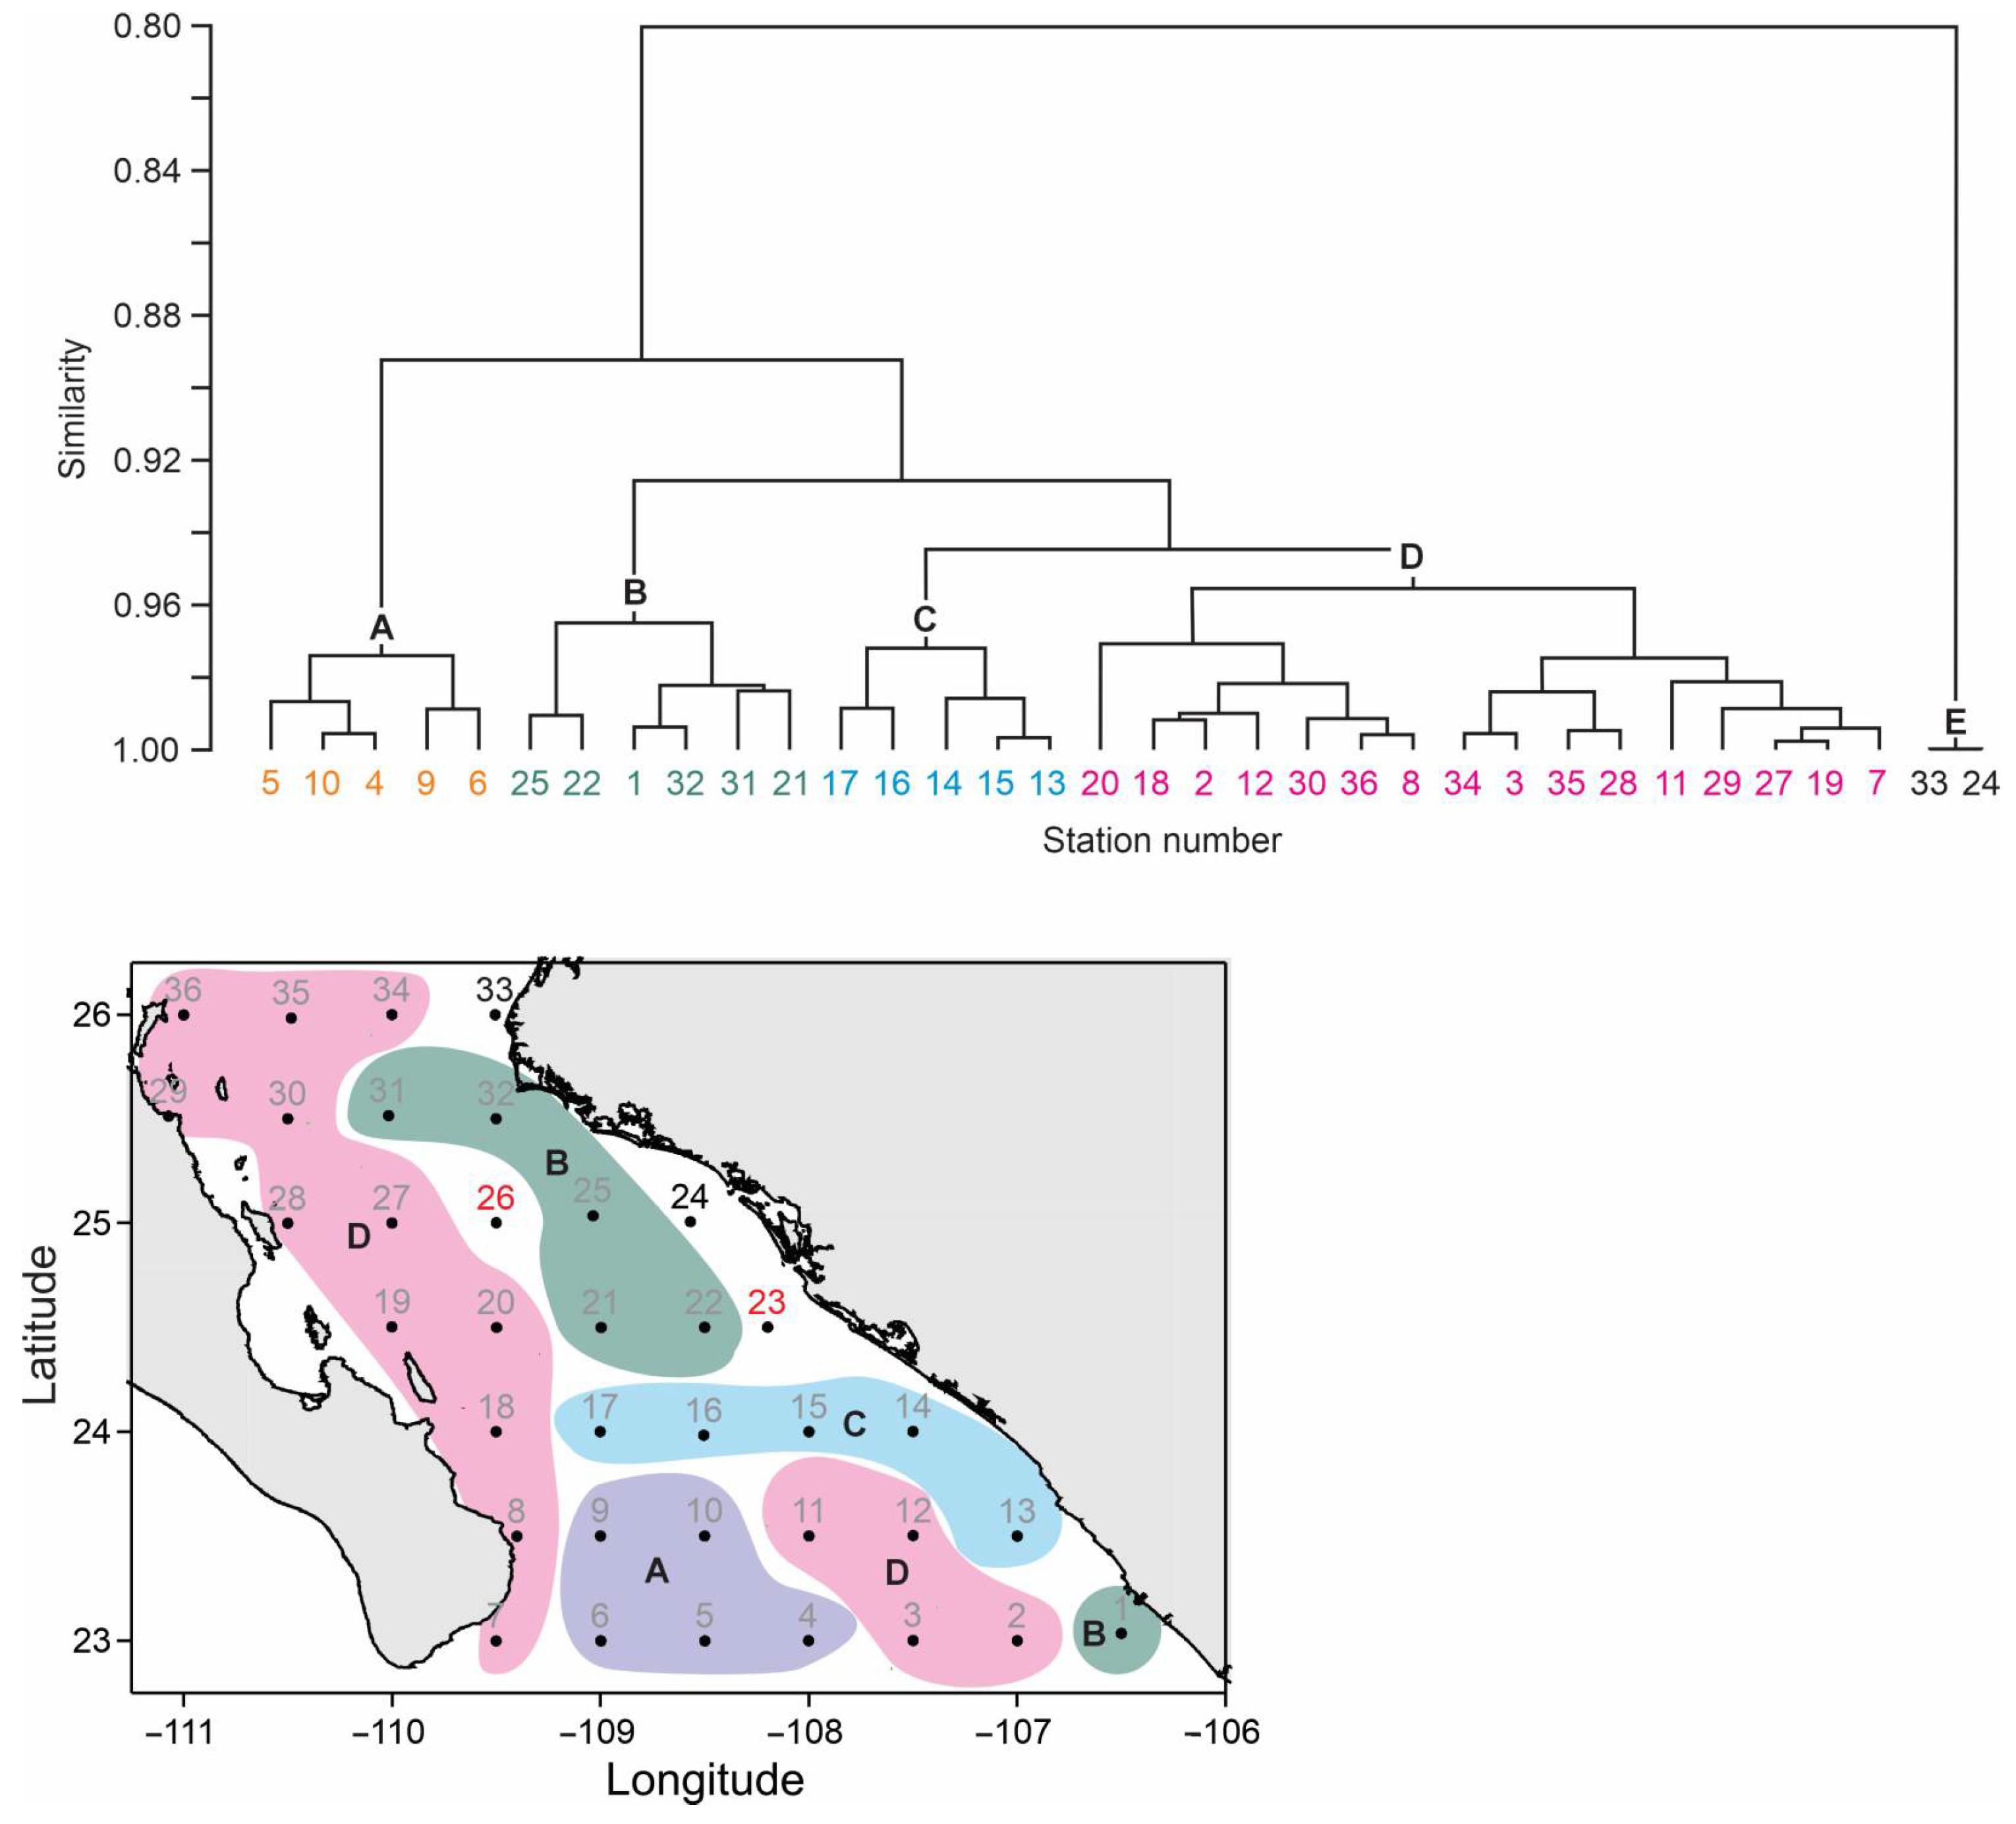
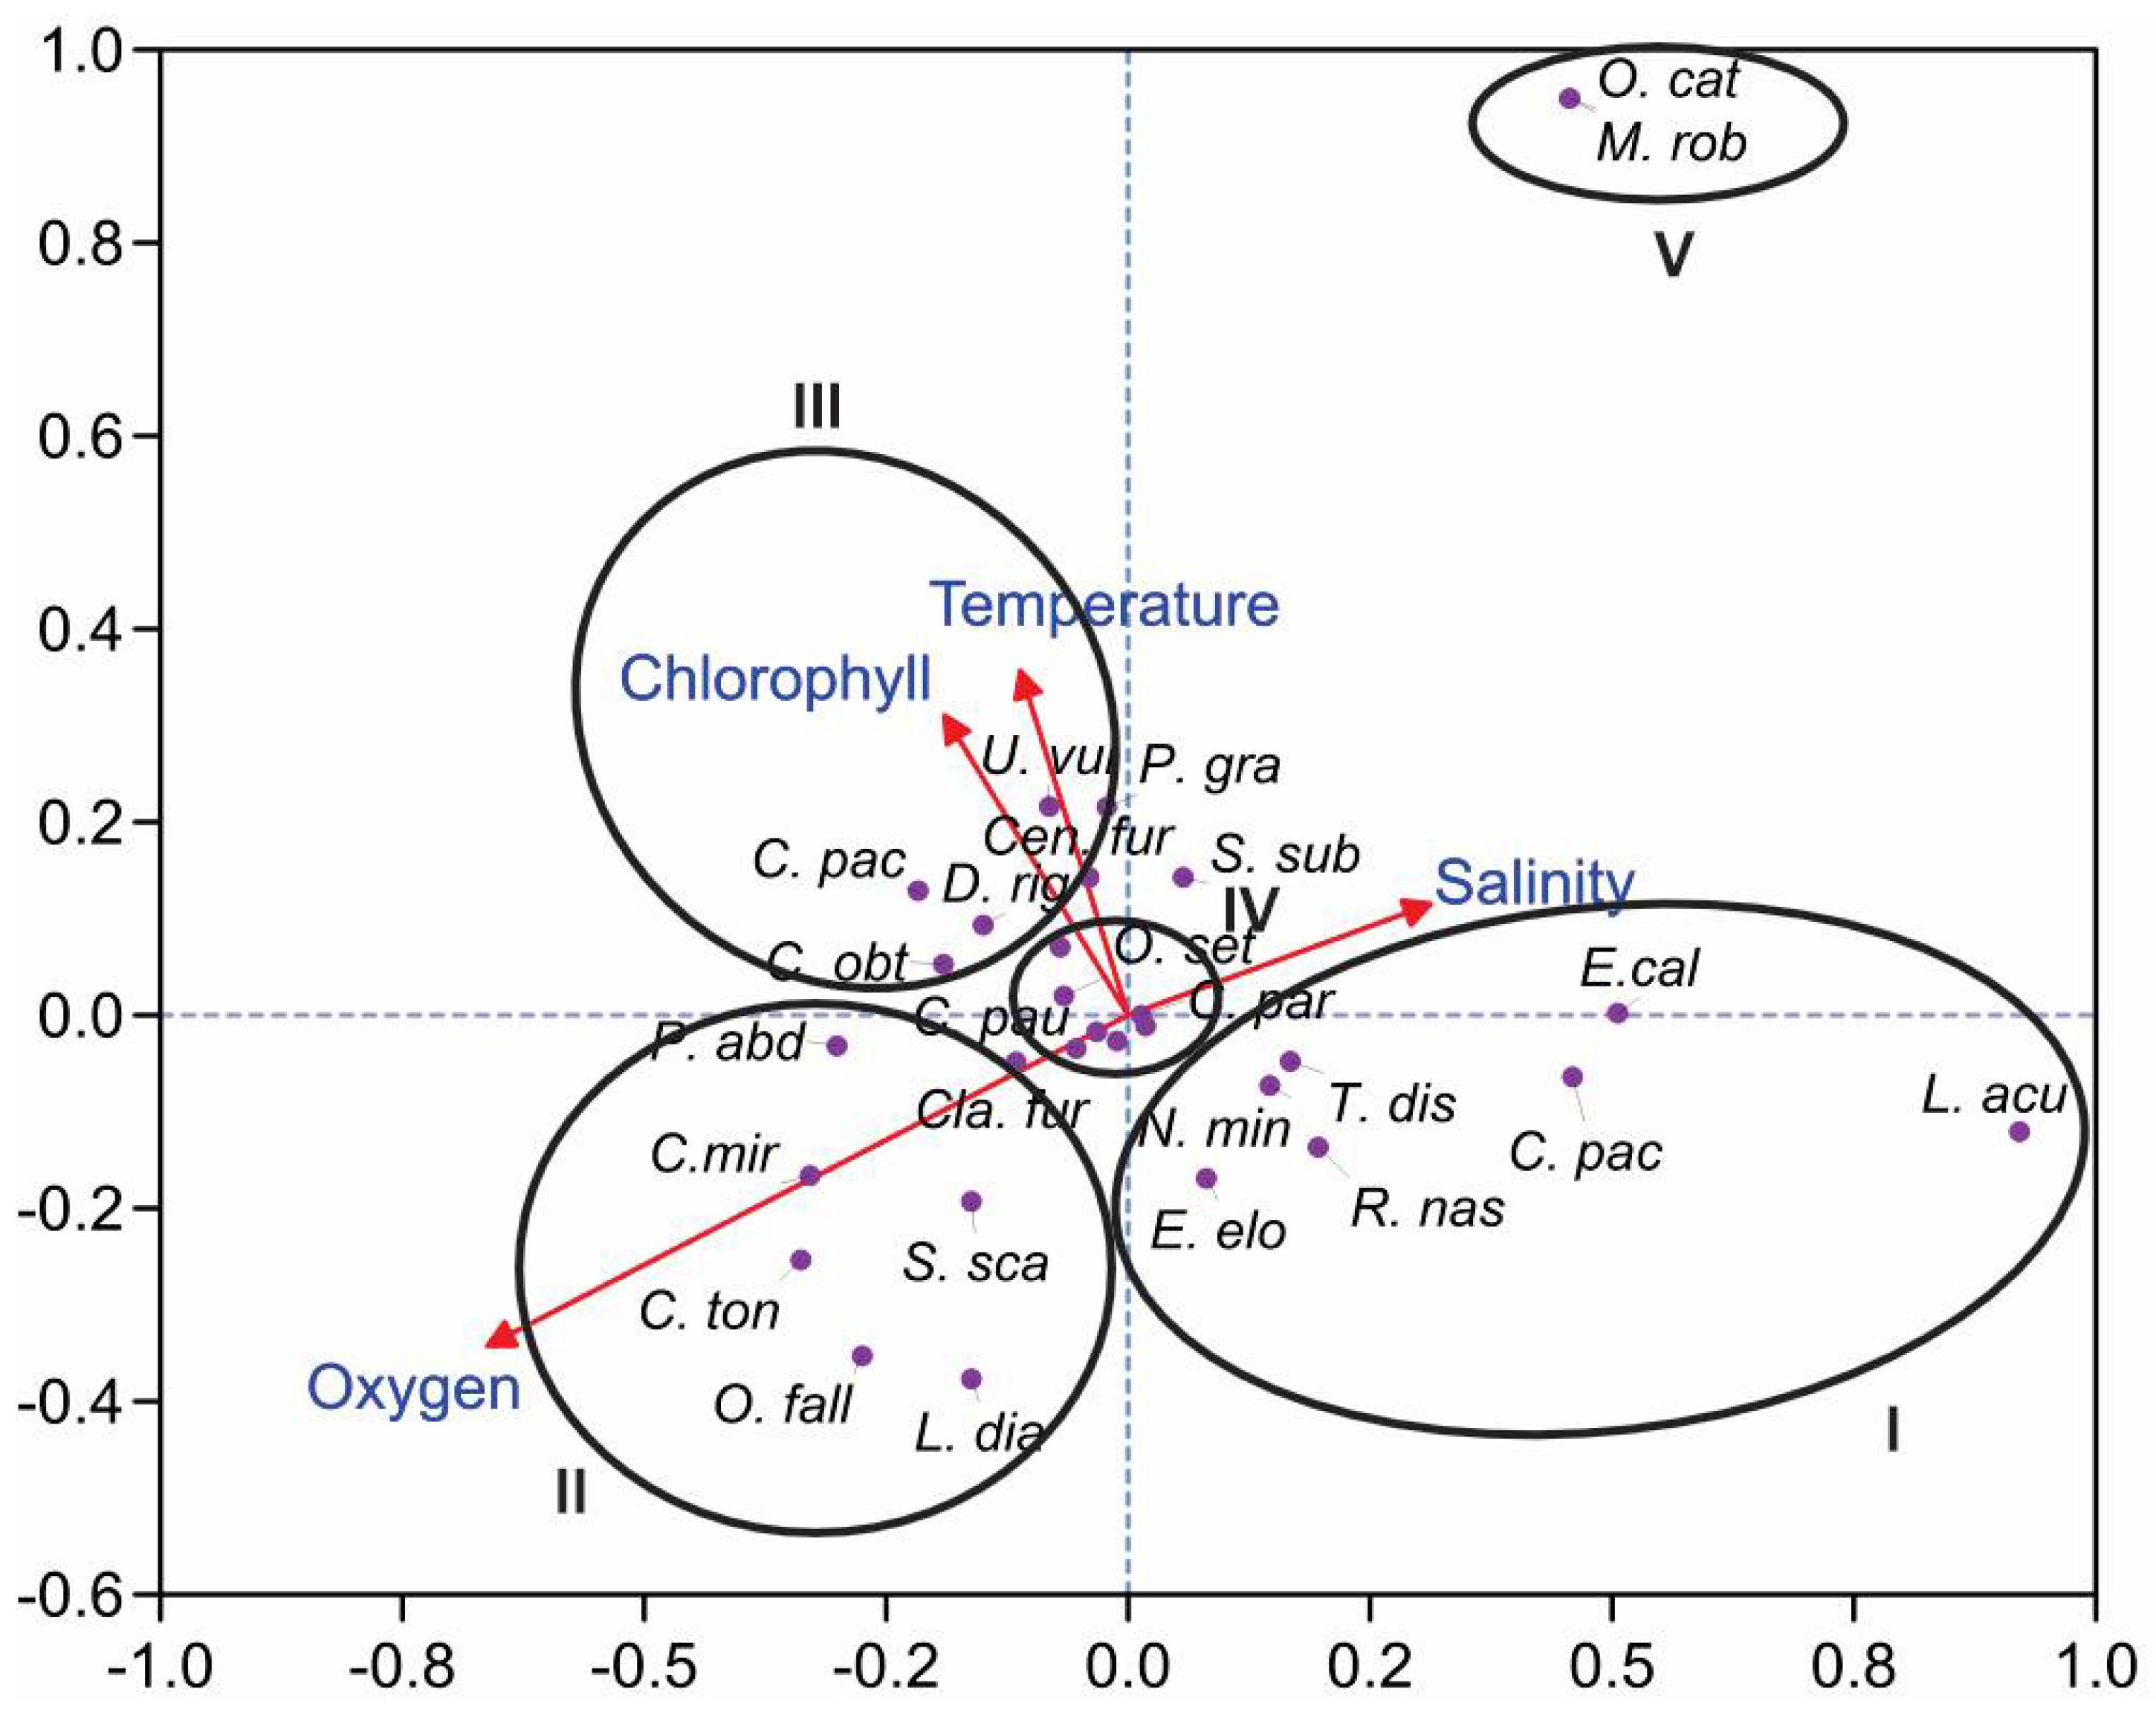
3.4. Statistical Analyses

The statistical analyses conducted in this study allowed us to identify noteworthy distribution patterns linked to environmental variables. Initially, the cluster analysis using a Bray–Curtis matrix revealed the formation of three major groups with 90% similarity (Figure 7). Group A includes the stations influenced by the cyclonic circulation identified in our research. Group E consists of subgroups B, C, and D, representing stations located in the peninsular and continental areas. Finally, Group F includes stations 33 and 24, which are situated in a shallower zone in the eastern coastal region.
The Canonical Correspondence Analysis (CCA) ordination diagram, generated from the environmental data matrix along with the species richness and density matrix, allowed us to assess the impact of each variable on species composition (Figure 8). The most significant variables identified were temperature, chlorophyll-a, and dissolved oxygen, which explained the density of many species observed in this study.
The analysis revealed five groups: Group I included species such as N. minor and R. nasutus, which exhibited an inverse relationship with temperature and chlorophyll-a; Group II consisted of species like A. tonsa and O. fallax, directly associated with higher dissolved oxygen concentrations; Group III was represented by species such as C. pauper and C. obtusus, which showed the highest density of calanoids and cyclopoids and a positive correlation with both chlorophyll-a and dissolved oxygen; Group IV did not show any relationship with environmental factors. Group V, including species like M. robustus and O. catus, had the lowest abundance, but a direct relationship with salinity was noted.
The ANOSIM test confirmed the separation of the formed groups (p = 0.043). Ultimately, the SIMPER analysis revealed that the species with the highest percentages were C. pauper and S. subcrassus, which accounted for over 55% (Table 2).

4. Discussion

The sampling strategy used in this study allowed us to clarify the influence of the summer cyclonic circulation in the southern GC on copepod communities. The study of circulation patterns in this area became increasingly important at the end of the 20th century. Early research has identified the dynamics of the PO as one of the primary drivers of circulation within the Gulf due to its direct connection [40,41,42,43]. The exchange, combined with the prevailing wind patterns, northwesterly winds in winter and southeasterly winds in summer, shapes the Gulf’s circulation dynamics. During the summer, water exchange between the PO and the GC occurs as inflow along the mainland coast and as outflow along the peninsular coast, resulting in a cyclonic circulation pattern near the entrance [3], as shown in Figure 1a. Research on this cyclonic circulation has significantly advanced, indicating that its effects extend to the upper 200 m of the water column [2,3].
In our study, we identified a cold core, which is consistent with the cyclonic circulation, which extends horizontally for up to 100 km and vertically beyond 200 m, aligning with previous findings. However, the effects of this cyclonic circulation on marine life remain largely unknown, particularly regarding how the southern cyclonic circulation of the GC influences copepod communities. Copepods are abundant, diverse, and ecologically significant [8], playing a vital role in several aspects of the Gulf’s ecosystem. One area that has not been explored is how surface and subsurface circulation patterns affect the composition and distribution of these copepod populations.
We observed significant differences in the horizontal distribution of copepod densities in the study area. Low-density values were noted in the southern GC, particularly at the center of the cold core induced by the cyclonic circulation. In contrast, higher density values were recorded in the periphery of this cold core. This pattern was consistent when examining the distribution of dominant species. For example, calanoid copepods such as C. pauper and C. furcatus exhibited their lowest densities at the center of the cold core (Figure 5a,b). A similar trend was observed among the three dominant species of cyclopoid copepods (Figure 6). Interestingly, C. furcatus (Figure 5b) showed high densities in the eastern portion of the study area, which coincided with elevated water temperatures, suggesting that this species thrives in warmer water. Clausocalanid copepods are dominant components of the mesozooplankton in many regions of the world’s oceans. The case of C. furcatus has been documented with high densities during periods of elevated temperatures in the water column across various environments, including the Mediterranean Sea [44] and the Red Sea [45], as well as under different trophic conditions [46]. The results obtained in our research align with the findings reported in these studies.
Several studies conducted worldwide support our findings regarding the influence of circulation patterns on copepods communities. For example, in the Mediterranean Sea, the presence of cyclonic eddies is associated with increased species richness [47]. Similarly, in the Gulf of Mexico, it is well-documented that the circulation pattern, along with the presence of cyclonic eddies, significantly affects the horizontal distribution of species [48]. In the Bay of La Paz, located in the Southern Gulf of California, a cyclonic eddy confined to the basin leads to the formation of a “copepod belt” that follows the eddy’s circumference [31].
In our study, statistical analyses identified temperature as a key environmental factor influencing species composition. It has been found that temperature determines the growth rates of copepods in more than 90% of cases [49], regulates their body size [50], and affects their global distribution [51]. Similar to our findings, there is scientific evidence that temperature changes impact species composition. For instance, in the northwestern Mediterranean, populations of species from the genera Centropages and Temora exhibit significant changes in response to variations in temperature [52]. In the Northeast Pacific, increases in sea surface temperature affect the density of species in the genera Neocalanus, Calanus, and Oithona [51]. Moreover, in the Northern California Current, rising sea surface temperatures during the summer months result in an increase in copepod biomass in the region [53].
Regarding Canthocalanus pauper, which was the most abundant calanoid species in our study, recent research indicates that this species responds specifically to environmental fluctuations, particularly temperature, influencing its population dynamics [54]. Similarly, Oithona setigera, the most abundant cyclopoid species in our study, exhibits high sensitivity to temperature changes, with documented tendencies to aggregate in cooler temperatures [55]. This pattern aligns with our observations in the western region along the Baja California Peninsula.
Copepods are the most numerous class of crustaceans on Earth, yet many aspects of how the physical environment influences their composition, distribution, and abundance in several regions remain unclear. In the Southern Gulf of California, the circulation patterns have been well-documented for several decades, but their impact on the copepod community is still not fully understood. The results presented here help to address these gaps by documenting significant changes in species composition. It appears that dominant organisms benefit from alterations in surface and subsurface temperatures caused by these circulation patterns. This research enhances our understanding of the ecological dynamics in the region and the distribution patterns of species at lower trophic levels of food chains. This knowledge eventually helps us comprehend the behavior of species at higher levels of the pelagic food chain, including those of significant ecological and commercial importance.

Author Contributions

Conceptualization, F.A.R.-D., M.A.M.-G., E.C.-M., D.A.S.-d.-L., and E.D.-C.; methodology, F.A.R.-D., M.A.M.-G., and E.C.-M.; software, F.A.R.-D., M.A.M.-G., E.C.-M., D.A.S.-d.-L., E.D.-C., and S.C.-O.; validation, F.A.R.-D., M.A.M.-G., E.C.-M., D.A.S.-d.-L., E.D.-C., and S.C.-O.; formal analysis, F.A.R.-D., M.A.M.-G., E.C.-M., D.A.S.-d.-L., E.D.-C., and S.C.-O.; investigation, F.A.R.-D., M.A.M.-G., E.C.-M., D.A.S.-d.-L., E.D.-C., and S.C.-O.; resources, M.A.M.-G., E.C.-M., D.A.S.-d.-L., and E.D.-C.; data curation, F.A.R.-D., M.A.M.-G., E.C.-M., D.A.S.-d.-L., E.D.-C., and S.C.-O.; writing—original draft preparation, F.A.R.-D., M.A.M.-G., E.C.-M., D.A.S.-d.-L., E.D.-C., and S.C.-O.; writing—review and editing, F.A.R.-D., M.A.M.-G., E.C.-M., D.A.S.-d.-L., E.D.-C., and S.C.-O.; supervision, F.A.R.-D., M.A.M.-G., E.C.-M., D.A.S.-d.-L., E.D.-C., and S.C.-O.; funding acquisition, M.A.M.-G., E.C.-M., D.A.S.-d.-L., and E.D.-C. All authors have read and agreed to the published version of the manuscript.

Funding

This study was supported by the Instituto de Ciencias del Mar y Limnología (UNAM) (grants 144, 145, 627) and partially supported by DGAPA-PAPIIT-UNAM projects #IA200120, IG100421 and IA200123. The ship time of the research cruise “FIBGOC-I” was funded by UNAM. Franco Antonio Rocha-Díaz received funding from Secretaría de Ciencia, Humanidades, Tecnología e Innovación (Secihti), México, through a Ph.D. scholarship (CVU #968483) and from Posgrado en Ciencias del Mar y Limnología, Universidad Nacional Autónoma de México.

Data Availability Statement

The datasets generated during this study are available from the corresponding author upon request.

Acknowledgments

The authors thank the participants in the research cruise, including the captain and crew of the R/V El Puma. Jorge Castro improved the figures. The authors are grateful for the feedback from Dennis McGillicuddy Jr. and the three anonymous reviewers, whose constructive comments enhanced an earlier version of this manuscript.

Conflicts of Interest

The authors declare no conflicts of interest.

References

  1. Lavín, M.F.; Beier, E.; Badan, A. Estructura hidrográfica y circulación del Golfo de California: Escalas estacional e interanual. In Contribuciones a la Oceanografía Física en México; Monografía No. 3; Lavín, M.F., Ed.; Unión Geofísica Mexicana: Ensenada, Mexico, 1997; p. 171. [Google Scholar]
  2. Lavín, M.F.; Castro, R.; Beier, E.; Godínez, V.M.; Amador, A.; Guest, P. SST, thermohaline structure, and circulation in the southern Gulf of California in June 2004 during the North American Monsoon Experiment. J. Geophys. Res. 2009, 114, C02025. [Google Scholar] [CrossRef]
  3. Lavín, M.F.; Marinone, S.G. An overview of the physical oceanography of the Gulf of California. In Nonlinear Processes in Geophysical Fluid Dynamics; Velasco-Fuentes, O.U., Ed.; Kluwer Academic Publishers: Dordrecht, The Netherlands, 2003; pp. 173–204. [Google Scholar]
  4. Durán-Campos, E.; Salas-de-Léon, D.A.; Coria-Monter, E.; Monreal-Gómez, M.A.; Aldeco-Ramírez, J.; Quiroz-Martínez, B. ENSO effects in the southern gulf of California estimated from satellite data. Cont. Shelf. Res. 2023, 266, 105084. [Google Scholar] [CrossRef]
  5. Álvarez-Borrego, S. Phytoplankton biomass and production in the Gulf of California: A review. Bot. Mar. 2012, 55, 119–128. [Google Scholar] [CrossRef]
  6. Coria-Monter, E.; Monreal-Gómez, M.A.; Salas-de-León, D.A.; Durán-Campos, E. Zooplankton abundance during summer in the Bay of La Paz (southwestern Gulf of California, Mexico). Lat. Am. J. Aquat. Res. 2020, 48, 794–805. [Google Scholar] [CrossRef]
  7. Brierley, A.S. Plankton. Curr. Biol. 2017, 27, R478–R483. [Google Scholar] [CrossRef] [PubMed]
  8. Bron, J.E.; Frisch, D.; Goetze, E.; Johnson, S.C.; Lee, C.E.; Wyngaard, G.A. Observing copepods through a genomic lens. Front. Zool. 2011, 8, 22. [Google Scholar] [CrossRef] [PubMed]
  9. Benedetti, F.; Vogt, M.; Righetti, D.; Guilhaumon, F.; Ayata, S.D. Do functional groups of planktonic copepods differ in their ecological niches? J. Biogeogr. 2018, 45, 604–616. [Google Scholar] [CrossRef]
  10. Jackson, J.M.; Lenz, P.H. Predator-prey interactions in the plankton: Larval fish feeding on evasive copepods. Sci. Rep. 2016, 6, 33585. [Google Scholar] [CrossRef] [PubMed]
  11. Yamaguchi, A.; Matsuno, K.; Homma, T. Spatial changes in the vertical distribution of calanoid copepods down to great depths in the North Pacific. Zool. Stud. 2015, 54, 13. [Google Scholar] [CrossRef] [PubMed]
  12. Khodami, S.; Mercado-Salas, N.F.; Tang, D.; Martinez-Arbizu, P. Molecular evidence for the retention of the Thaumatopsyllidae in the order Cyclopoida (Copepoda) and establishment of four suborders and two families within the Cyclopoida. Mol. Phylogenet. Evol. 2019, 138, 43–52. [Google Scholar] [CrossRef] [PubMed]
  13. Fleminger, A. Geographical distribution and morphological divergence in American coastal-zone planktonic copepods of the genus Labidocera. In Chemistry, Biology and the Estuarine System; Cronin, L.E., Ed.; Academic Press: New York, NY, USA, 1975; pp. 392–419. [Google Scholar]
  14. Alldredge, A.L.; King, J.M. Effects of moonlight on the vertical migration patterns of demersal zooplankton. J. Exp. Mar. Biol. Ecol. 1980, 44, 133–156. [Google Scholar] [CrossRef]
  15. Jiménez-Pérez, L.C.; Lara-Lara, J.R. Zooplankton biomass and copepod community structure in the Gulf of California during the 1982-1983 El Niño event. CalCOFI Rep. 1988, 12, 122–128. [Google Scholar]
  16. Lavaniegos-Espejo, B.E.; Lara-Lara, J.R. Zooplankton of the Gulf of California after the 1982-1983 EI Niño Event: Biomass Distribution and Abundance. Pac. Sci. 1990, 44, 297–310. [Google Scholar]
  17. Palomares-García, R.J.; Gómez-Gutiérrez, J.; Robinson, C.J. Winter and summer vertical distribution of epipelagic copepods in the Gulf of California. J. Plankton Res. 2013, 35, 1009–1026. [Google Scholar] [CrossRef]
  18. Beltrán-Castro, J.R.; Hernández-Trujillo, S.; Gómez-Gutiérrez, J.; Trasviña-Castro, A.; González-Rodríguez, E.; Aburto-Oropeza, O. Copepod species assemblage and carbon biomass during two anomalous warm periods of distinct origin during 2014–2015 in the southern Gulf of California. Cont. Shelf Res. 2020, 207, 104215. [Google Scholar] [CrossRef]
  19. Velázquez-Ornelas, K.E.; Hendrickx, M.E. Latitudinal and seasonal variation in the copepods (Multicrustacea: Copepoda) of the Gulf of California based on the CORTES cruises (1985). Nauplius 2023, 31, e2023027. [Google Scholar] [CrossRef]
  20. Cruz-Hernández, J.; Sánchez-Velasco, L.; Godínez, V.M.; Beier, E.; Palomares-García, J.R.; Barton, E.D.; Santamaría-del-Ángel, E. Vertical distribution of calanoid copepods in a mature cyclonic eddy in the Gulf of California. Crustaceana 2018, 91, 63–84. [Google Scholar] [CrossRef]
  21. Cruz-Hernández, J.; Sánchez-Velasco, L.; Beier, E.; Godínez, V.M.; Barton, E.D. Distribution of calanoid copepods across the mesoscale frontal zone of tropical-subtropical convergence off México. Deep Sea Res. 2019, 169–170, 104678. [Google Scholar] [CrossRef]
  22. Coria-Monter, E.; Monreal-Gómez, M.A.; Salas-de-León, D.A.; Durán-Campos, E. Impact of the “Godzilla El Niño” event of 2015- 2016 on sea surface temperature and chlorophyll-a in the southern Gulf of California, Mexico, as evidenced by satellite and in situ data. Pac. Sci. 2018, 72, 411–422. [Google Scholar] [CrossRef]
  23. Sherman, H.; Hempel, G. Perspectives on Regional Seas and the Large Marine Ecosystem Approach. In The UNEP Large Marine Ecosystem Report; Sherman, K., Hempel, G., Eds.; United Nations Environment Programme: Nairobi, Kenya, 2009; pp. 3–22. [Google Scholar]
  24. Filonov, A.E.; Lavín, M. Internal tides in the Northern Gulf of California. J. Geophys. Res. 2003, 108, 3151. [Google Scholar] [CrossRef]
  25. Beier, E. A numerical investigation of the annual variability in the Gulf of California. J. Phys. Oceanogr. 1997, 27, 615–632. [Google Scholar] [CrossRef]
  26. Quiroz-Martínez, B.; Salas-de-León, D.A.; Gil-Zurita, A.; Monreal-Gómez, M.A.; Coria-Monter, E.; Durán-Campos, E. Latitudinal and archipelago effect on the composition, distribution, and abundance of zooplanktonic organisms in the Gulf of California. Oceanologia 2023, 65, 371–385. [Google Scholar] [CrossRef]
  27. Lluch-Cota, S.E. Coastal upwelling in the eastern Gulf of California. Oceanol. Acta 2000, 23, 731–740. [Google Scholar] [CrossRef]
  28. Monreal-Gómez, M.A.; Pérez-Cruz, L.; Durán-Campos, E.; Salas-de-León, D.A.; Torres-Martínez, C.M.; Coria-Monter, E. Phytoplankton Communities in the Eastern Tropical Pacific Ocean off Mexico and the Southern Gulf of California During the Strong El Niño of 2023/24. Plants 2025, 14, 1375. [Google Scholar] [CrossRef] [PubMed]
  29. Pond, S.; Pickard, G.L. Introductory Dynamical Oceanography; Pergamon Press: Oxford, UK, 1983; p. 329. [Google Scholar]
  30. Baith, K.; Lindsay, R.; Fu, G.; McClain, C.R. SeaDAS, a data analysis system for ocean-color satellite sensors. EoS 2001, 82, 202. [Google Scholar] [CrossRef]
  31. Rocha-Díaz, F.A.; Monreal-Gómez, M.A.; Coria-Monter, E.; Salas-de-León, D.A.; Durán-Campos, E.; Merino-Ibarra, M. Copepod abundance distribution in relation to a cyclonic eddy in a coastal environment in the southern Gulf of California. Cont. Shelf Res. 2021, 222, 104436. [Google Scholar] [CrossRef]
  32. Mojica-Ramírez, E.; Monreal-Gómez, M.A.; Hernández-Trujillo, S.; Salas-de-León, D.A. Influence of a cyclonic gyre and a thermohaline front on the population structure of Centropages furcatus in Bay of La Paz, Gulf of California. Cienc. Mar. 2023, 49, 33370. [Google Scholar] [CrossRef]
  33. Boltovskoy, D. South Atlantic Zooplankton; Publicaciones Especiales del INIDEP: Mar del Plata, Argentina, 1999; p. 1705. [Google Scholar]
  34. Tanaka, O. The pelagic copepods of the Izu region middle Japan Systematic Account X. Publ. Seto Mar. Biol. Lab. 1964, 12, 1–37. [Google Scholar] [CrossRef] [PubMed]
  35. Tanaka, O.; Omori, M. Additional report on Calanoida Copepods from the Izu region—Part 6. Publ. Seto Mar. Biol. Lab. 1992, 35, 253–271. [Google Scholar] [CrossRef] [PubMed]
  36. Palomares-García, J.R.; Suárez-Morales, E.; Hernández-Trujillo, S. Catálogo de los Copépodos (Crustacea) Pelágicos del Pacífico Mexicano; CICIMAR/ECOSUR: La Paz, México, 1998; p. 352. [Google Scholar]
  37. Kramer, D.; Kalin, M.J.; Stevens, E.G.; Thrailkill, J.R.; Zweifel, J.R. Collecting and Processing Data on Fish Eggs and Larvae in the California Current; NOAA Technical Report NMFS 370; NMFS: Seattle, WA, USA, 1972; pp. 1–38. [Google Scholar]
  38. Field, J.G.; Clarke, K.R.; Warwick, R.M. A practical strategy for analyzing multispecies distribution patterns. Mar. Ecol. Progr. Ser. 1982, 8, 37–52. [Google Scholar] [CrossRef]
  39. Legendre, P.; Legendre, L. Numerical Ecology; Elsevier: Amsterdam, The Netherlands, 2012; p. 1006. [Google Scholar]
  40. Ripa, P.; Marinone, S. Seasonal variability of temperature, salinity, velocity, vorticity, and sea level in the central Gulf of California, as inferred from historical data. Quart. J. Roy. Meteor. Soc. 1989, 115, 887–914. [Google Scholar] [CrossRef]
  41. Ripa, P. Seasonal circulation in the Gulf of California. Ann. Geophys. 1990, 8, 559–564. [Google Scholar]
  42. Castro, R.; Lavín, M.F.; Ripa, P. Seasonal heat balance in the Gulf of California. J. Geophys. Res. 1994, 99, 3249–3261. [Google Scholar] [CrossRef]
  43. Ripa, P. Toward a physical explanation of the seasonal dynamics and thermodynamics of the Gulf of California. J. Phys. Oceanogr. 1997, 27, 597–614. [Google Scholar] [CrossRef]
  44. Siokou-Frangou, I. Zooplankton annual cycle in a Mediterranean coastal area. J. Plank. Res. 1996, 18, 203–223. [Google Scholar] [CrossRef]
  45. Cornils, A.; Niehoff, B.; Richter, C.; Al-Najjar, T.; Schnack-Schiel, B. Seasonal abundance and reproduction of clausocalanid copepods in the northern Gulf of Aqaba (Red Sea). J. Plank. Res. 2007, 29, 57–70. [Google Scholar] [CrossRef]
  46. Mazzocchi, M.G.; Paffenhöfer, G.A. Swimming and feeding behaviour of the planktonic copepod Clausocalanus furcatus. J. Plankton Res. 1999, 21, 1501–1518. [Google Scholar] [CrossRef]
  47. Belkin, N.; Guy-Haim, T.; Rubin-Blum, M.; Lazar, A.; Sisma-Ventura, G.; Kiko, R.; Morov, A.R.; Ozer, T.; Gertman, I.; Herut, B.; et al. Influence of cyclonic and anticyclonic eddies on plankton in the southeastern Mediterranean Sea during late summertime. Ocean Sci. 2022, 18, 693–715. [Google Scholar] [CrossRef]
  48. Gaona-Hernández, A.; Suárez-Morales, E.; Linacre, L.; Compaire, J.C.; Lara-Lara, J.R.; Herzka, S.Z. Seasonal variability drives differences in the structure of the calanoid copepod community in two contrasting regions of the Gulf of Mexico. J. Plank. Res. 2024, 46, 158–173. [Google Scholar] [CrossRef]
  49. Huntley, M.E.; Lopez, M.D.G. Temperature-dependent production on marine copepods: A global synthesis. Am. Nat. 1992, 140, 201–242. [Google Scholar] [CrossRef] [PubMed]
  50. Horne, C.R.; Hirst, A.G.; Atkinson, D.; Neves, A.; Kiørboe, T. A global synthesis of seasonal temperature–size responses in copepods. Global Ecol. Biogeogr. 2016, 25, 988–999. [Google Scholar] [CrossRef]
  51. Ashlock, L.; García-Reyes, M.; Gentemann, C.; Batten, S.; Sydeman, W. Temperature and Patterns of Occurrence and Abundance of Key Copepod Taxa in the Northeast Pacific. Front. Mar. Sci. 2021, 8, 670795. [Google Scholar] [CrossRef]
  52. Molinero, J.C.; Ibanez, F.; Souissi, S.; Chifflet, M.; Nival, P. Phenological changes in the Northwestern Mediterranean copepods Centropages typicus and Temora stylifera linked to climate forcing. Oecologia 2005, 145, 640–649. [Google Scholar] [CrossRef] [PubMed]
  53. Hooff, R.C.; Peterson, W. Copepod biodiversity as an indicator of changes in ocean and climate conditions of the northern California current ecosystem. Limnol. Oceanogr. 2006, 51, 2607–2620. [Google Scholar] [CrossRef]
  54. Nawaz, M.A.; Sivakumar, K.; Baskar, G. Seasonal dynamics of body size in calanoid copepods (Calanoida: Copepoda) from the stressed tropical coast of India, Chennai, Bay of Bengal. Aquat. Ecol. 2024, 58, 363–373. [Google Scholar] [CrossRef]
  55. Wang, L.; Du, F.; Wang, X.; Li, Y.; Ning, J. Distribution and role of the genus Oithona (Copepoda: Cyclopoida) in the South China Sea. Oceanologia 2017, 59, 300–310. [Google Scholar] [CrossRef]
Figure 1. The study area: (a) The Gulf of California; the arrows represent the main circulation pattern documented during summer. (b) The Southern Gulf of California, showing the sites where hydrographic data and zooplankton samples were collected. A-A’ represents a transect where hydrographic data and geostrophic velocity were analyzed. The bathymetry is in m.
Jmse 13 01394 g001
Figure 2. (a) Potential temperature Θ S p diagram that shows the water masses recorded during the summer of 2019 (TSW: Tropical Surface Water; GCW: Gulf of California Water; CCW: California Current Water; StSsW: Subtropical Subsurface Water; PIW: Pacific Intermediate Water, and PDW: Pacific Deep Water). (b) Horizontal distribution (at 50 m depth) of temperature (°C). (c) Vertical distribution of temperature (°C) in the upper 200 m layer along A-A’ transect, and (d) geostrophic velocity (cm s−1).
Jmse 13 01394 g002
Figure 3. Satellite images from the Moderate Resolution Imaging Spectroradiometer (MODIS) on 3 July 2019: (a) sea surface temperature (°C) and (b) chlorophyll-a (mg m−3).
Jmse 13 01394 g003
Figure 4. Horizontal distribution of the density (ind m−3) of (a) calanoid copepods and (b) cyclopoid copepods.
Jmse 13 01394 g004
Figure 5. Horizontal distribution of densities (ind m−3) of three dominant species of Calanoid copepods in the Southern Gulf of California during the summer of 2019: (a) Canthocalanus pauper, (b) Clausocalanus furcatus, and (c) Subeucalanus subcrassus.
Jmse 13 01394 g005
Figure 6. Horizontal distribution of densities (ind m−3) of three dominant species of Cyclopoid copepods in the Southern Gulf of California during the summer of 2019: (a) Oithona setigera, (b) Dioithona rigida, and (c) Corycaeus obtusus.
Jmse 13 01394 g006
Figure 7. Dendrogram cluster based on a Bray–Curtis matrix.
Jmse 13 01394 g007
Figure 8. Canonical Correspondence Analysis diagram. Purple dots indicate each copepod species. Red vectors indicate environmental variables. Abbreviations are defined in Table 1.
Jmse 13 01394 g008
Table 1. Composition and density of planktonic copepod species (ind m−3) in the Southern Gulf of California during the summer of 2019.
Species
CalanoidaAbbreviationDensity (ind m−3)
Acartia (Acanthacartia) tonsa Dana, 1849–1852A. ton98.24
Calanus pacificus Brodsky, 1948C. pac197.44
Candacia parafalcifera Brodsky, 1950C. par78.08
Canthocalanus pauper (Giesbrecht, 1888)C. pau2316.80
Centropages furcatus (Dana, 1849–1852)Cen. fur332.80
Clausocalanus furcatus Brady, 1883Cla. fur1593.60
Eucalanus californicus Johnson M.W., 1938E. cal65.92
Eucalanus elongatus (Dana, 1849–1852)E. elo261.12
Labidocera acuta (Dana, 1849–1852)L. acu2.24
Labidocera diandra Fleminger, 1967L. dia12.80
Nannocalanus minor (Claus, 1863)N. min865.60
Odontacartia lilljeborgii Giesbrecht, 1889O. lil389.12
Pleuromamma abdominalis (Lubbock, 1856)P. abd64.32
Pleuromamma gracilis Claus, 1863P. gra512.00
Pseudochirella pacifica (Brodsky, 1950)P. pac71.04
Rhincalanus nasutus Giesbrecht, 1888R. nas432.64
Scolecithrix danae (Lubbock, 1856)S. dan121.60
Subeucalanus subcrassus (Giesbrecht, 1888)S. sub1584.64
Temora discaudata Giesbrecht, 1889T. dis129.92
Undinula vulgaris (Dana, 1849–1852)U. vul33.28
Cyclopoida
Copilia mirabilis Dana, 1849–1852C. mir49.92
Corycaeus obtusus Dana, 1849–1852C. obt139.52
Dioithona rigida (Giesbrecht, 1896)D. rig290.56
Macrocyclops albidus (Jurine, 1820)M. alb7.68
Monocorycaeus robustus (Giesbrecht, 1891)M. rob0.64
Oithona fallax Farran, 1913O. fall70.08
Oithona setigera Dana, 1853–1855O. set963.44
Oncaea venusta Philippi, 1843O. ven235.52
Onychocorycaeus catus (Dahl F., 1894)O. cat0.32
Sapphirina scarlata Giesbrecht, 1891S. sca30.72
Table 2. Distinctive species based on the percentage similarity analysis (SIMPER) based on a Bray–Curtis matrix.
SpeciesAverage DissimilarityPercentage of ContributionCumulative Percentage
C. pauper13.2130.8530.85
S. subcrassus10.7425.155.95
C. furcatus8.5620.0175.96
O. setigera6.1614.3990.35
D. rigida2.565.9896.33
O. venusta1.563.66100
Disclaimer/Publisher’s Note: The statements, opinions and data contained in all publications are solely those of the individual author(s) and contributor(s) and not of MDPI and/or the editor(s). MDPI and/or the editor(s) disclaim responsibility for any injury to people or property resulting from any ideas, methods, instructions or products referred to in the content.

