Article

Experimental Analysis of the Changes in Coral Sand Beach Profiles under Regular Wave Conditions

1
School of Hydraulic and Environmental Engineering, Changsha University of Science & Technology, Changsha 410114, China
2
Key Laboratory of Dongting Lake Aquatic Eco-Environmental Control and Restoration of Hunan Province, Changsha 410114, China
3
Key Laboratory of Water-Sediment Sciences and Water Disaster Prevention of Hunan Province, Changsha 410114, China
*
Author to whom correspondence should be addressed.
J. Mar. Sci. Eng. 2024, 12(2), 287; https://doi.org/10.3390/jmse12020287
Submission received: 16 January 2024 / Revised: 31 January 2024 / Accepted: 2 February 2024 / Published: 5 February 2024
(This article belongs to the Special Issue Advance in Sedimentology and Coastal and Marine Geology)

Abstract

:
This study utilized 50 laboratory experiments to document the evolution of coral beaches under varying regular wave conditions, including five distinct wave periods and ten wave heights. Both the type of equilibrium beach and the shape of sand bars were used to represent beach evolution. The evolution of coral sand beaches was then compared to quartz sand beaches. The experimental results show that the predicted (modeled) equilibrium profile of a quartz sand beach was not applicable to coral sand beaches. Compared to sand bars on quartz sand beaches, the distance from bar crests to the beach berm in coral sand beaches was greater, whereas the erosional depth of sand troughs was deeper. However, the grain size distribution of sand associated with the coral sand beach under wave action was consistent with Celikoglu’s law. Both an equilibrium beach profile classification model and a sand bar shape prediction model for coral sand beaches were developed based on the experimental data.

1. Introduction

Coral reef islands form through the accumulation of reef-derived carbonate sediment (i.e., debris from coral and other marine organism) of sand size (referred to herein as coral sand) [1] on coral reef platforms by wave and current processes [2,3] (Figure 1). Reefs and reef islands support important social and ecological systems. For example, coral reefs serve as natural breakwaters [4] and provide economic services by allowing for urban development [5] and tourism [6]. According to a recent global survey [7], coral reefs generate USD 11.5 billion per year in tourism revenues and USD 6.8 million per year in fisheries revenues and provide USD 10.7 billion in shoreline protection. However, exactly how islands and the communities that inhabit them will respond over the next century is still unclear, particularly given the potential sea-level rises (SLR) initiated by global warming [8].
According to projections by Slangen et al. [9] and Kopp et al. [10], the global sea level will increase by over 2 m by 2100. The rate of SLR is projected to exceed the rate of vertical accretion of coral reef platforms (Figure 1) [11]. As a result, the hydrodynamic conditions of reef flats will change, affecting the entire coral reef island [12]. Previous studies have concluded that without any human armoring of shorelines, these reefs will become uninhabitable, forcing people to migrate [13]. However, a survey of 709 atoll islands in the Pacific and Indian Oceans showed that 73.1% of the reef islands have been stable in size over the past few decades; 15.5% and 11.4% had increased or decreased in size, respectively [14]. Thus, these recent studies [15,16] indicate that coral reef islands are morphodynamically resilient landforms and that the risk of inundation as a result of SLR is (and will be) countered by adjustments in the morphology of ocean and lagoonal beaches (Figure 1: num 4 and 7) associated with the coral reef islands. This natural adaptation of the reef islands suggests that new predictions of the future trajectory of coral island beaches in response to the impacts of SLR are needed [16].
Masselink et al. [16] argue that coral reef islands need to be considered as a separate type of island beach because of their different morphological characteristics. Therefore, a recent trend is to quantify the responses of sandy beaches associated with coral islands to varying hydrodynamic conditions. Unlike coral sand beaches, quartz sand beaches have been extensively studied, and a series of empirical formulas have been proposed through quantitative analyses to provide guidance for marine engineering projects [17,18,19,20,21].
Quartz sand beach evolution experiments, in which they are subjected to the continuous action of waves, show that beach profiles develop an equilibrium state, referred to as the equilibrium beach profile. A large number of studies have analyzed the morphology of balanced beaches and constructed functions to describe them [19,20,22]. Recently, Marini et al. [23,24] extended Dean’s model [19] to beaches of any profile in the presence or absence of submerged breakwaters/bars. In addition, the transport patterns of quartz sand have been analyzed using laboratory experiments and field surveys [17,25,26], allowing for the classification of balanced shorelines on the basis of scouring and siltation [22,27,28]. Researchers have found from these studies that the presence of sand dams protects the coast [29]. This has led scholars to study the morphological parameters [30], formation theories [31], and movement trends of sandbars [32].
An interesting question arises as to whether the theoretical and empirical formulas developed for quartz sand beaches can be directly applied to coral sand beaches. The same problem arises with respect to the settling of coral sand particles [33], their threshold of motion [34,35], and their subsequent dispersion [36]. These findings suggest that coral sand particles, due to their special bio-skeletal structure and density, deviate significantly from the values calculated for these parameters using predictive models for quartz sand.
For this study, wave flume experiments were conducted in which a coral sand beach was subjected to varying regular wave conditions to assess differences in how quartz and coral sand beaches respond to wave conditions. It provides a new set of experimental data on the evolution of coral sand beaches. The evolution of the beach with respect to wave conditions was characterized on the basis of its classified equilibrium beach profile and sand bar morphology, both of which were compared to the evolution of quartz sand beaches. The distribution of coral sand grain sizes during beach evolution was also investigated. The experimental data were ultimately used to modify the equations for an equilibrium shoreline classification prediction model developed by Sunamura and Horikawa [28] and the prediction equations for bar parameters by Günaydın and Kabdaşlı [30].

2. Methodology

Since the 1940s, many researchers have investigated the morphology and evolution of shoreline profiles using experimental approaches and field measurements. The most widely used method of classifying equilibrium beach profiles was proposed by Sunamura and Horikawa [28]. As shown in Figure 2, they suggest that any beach profile can be classified into three types: (1) type A profiles, which are associated with storm or winter beaches that form erosional bars in the direction of the sea, (2) type B profiles, which are found on transitional beaches (the shoreline advances and sand piles up offshore), and (3) type C profiles, which are found on summer beaches (the shoreline progrades and no sand deposition takes place offshore). In this study, we refer to Type A as an erosional beach, Type B as a transient beach, and Type C as a depositional beach.
In the study of Sunamura and Horikawa [28], parameters that may control the motion of oblique particle clouds dictate the type of beach profile, and can be expressed by:
Type   of   equilibrium   beach   profiles = f ( H , L , D 50 , β )
where H is the wave height in the deep sea, L is the wavelength in the deep sea, D50 is the mean diameter of sediment particles, and β is the foreshore slope. Furthermore, Sunamura and Horikawa [28] argue that the dimensionless parameters can be defined as H/L, D50/L, and tanβ; these parameters can be used to develop a predictive model for the classification of equilibrium beach profiles (Table 1). Based on the results of Sunamura and Horikawa [28], Xu [37] proposed a relationship (Equation (2)) between the dimensionless parameter containing the settling velocity and the classification of the shoreline profile. Parameters used to characterise sediment movement contain, in addition to the median particle size, D50, the settling velocity of the particles, ω. This relationship can be expressed as:
Type   of   equilibrium   beach   profiles = f ( H l , g H ω , g H T v , g H T d , tan β )
where g is the constant of gravitational acceleration, ν is the kinematic fluid viscosity, H/L is the wave steepness, (gH)0.5/ω is the relative strength of wave action on the particle, gHT/ν is the same as the Reynolds number in dimension ( g H T ν u L ν ), and g H T d is the relative roughness at the sediment bed. Based on the findings of Jonsson [38], Xu [37] combined g H T ν and g H T d , which represents the bed friction coefficient under wave conditions. Wu [39] believes that the impinging jet formed by the plunging waves is the main driving force for sediment transport initiation. Thus, as shown in Table 1, he added wave breaking parameters ( ξ = tan β ( H / L ) 0.5 ) to the equilibrium beach profile classification model.
For an erosional profile, the sand bar is subjected to coupled hydrodynamic and sediment transport processes which change its shape. In order to further investigate the effect of waves on the shape of sand bars, researchers began to define the shape of sand dams. The most common way to define a sand dam is shown in Figure 3. The geometric characteristics of a sand bar are defined by the distance from the equilibrium point to the original point (Xbe); the water depth at the equilibrium point (hbe); the distance from the crest point to the original point (Xbc); the water depth at the crest point (hbc); the distance from the closure point to the crest point (Xbd); and the water depth at the closure point (hbd). In this paper, we do not consider the effect of coral sand grain size on coral sand bars; thus, we only compare the models of Silvester and Hsu [40] as well as Günaydın and Kabdaşlı [30] (Table 2).

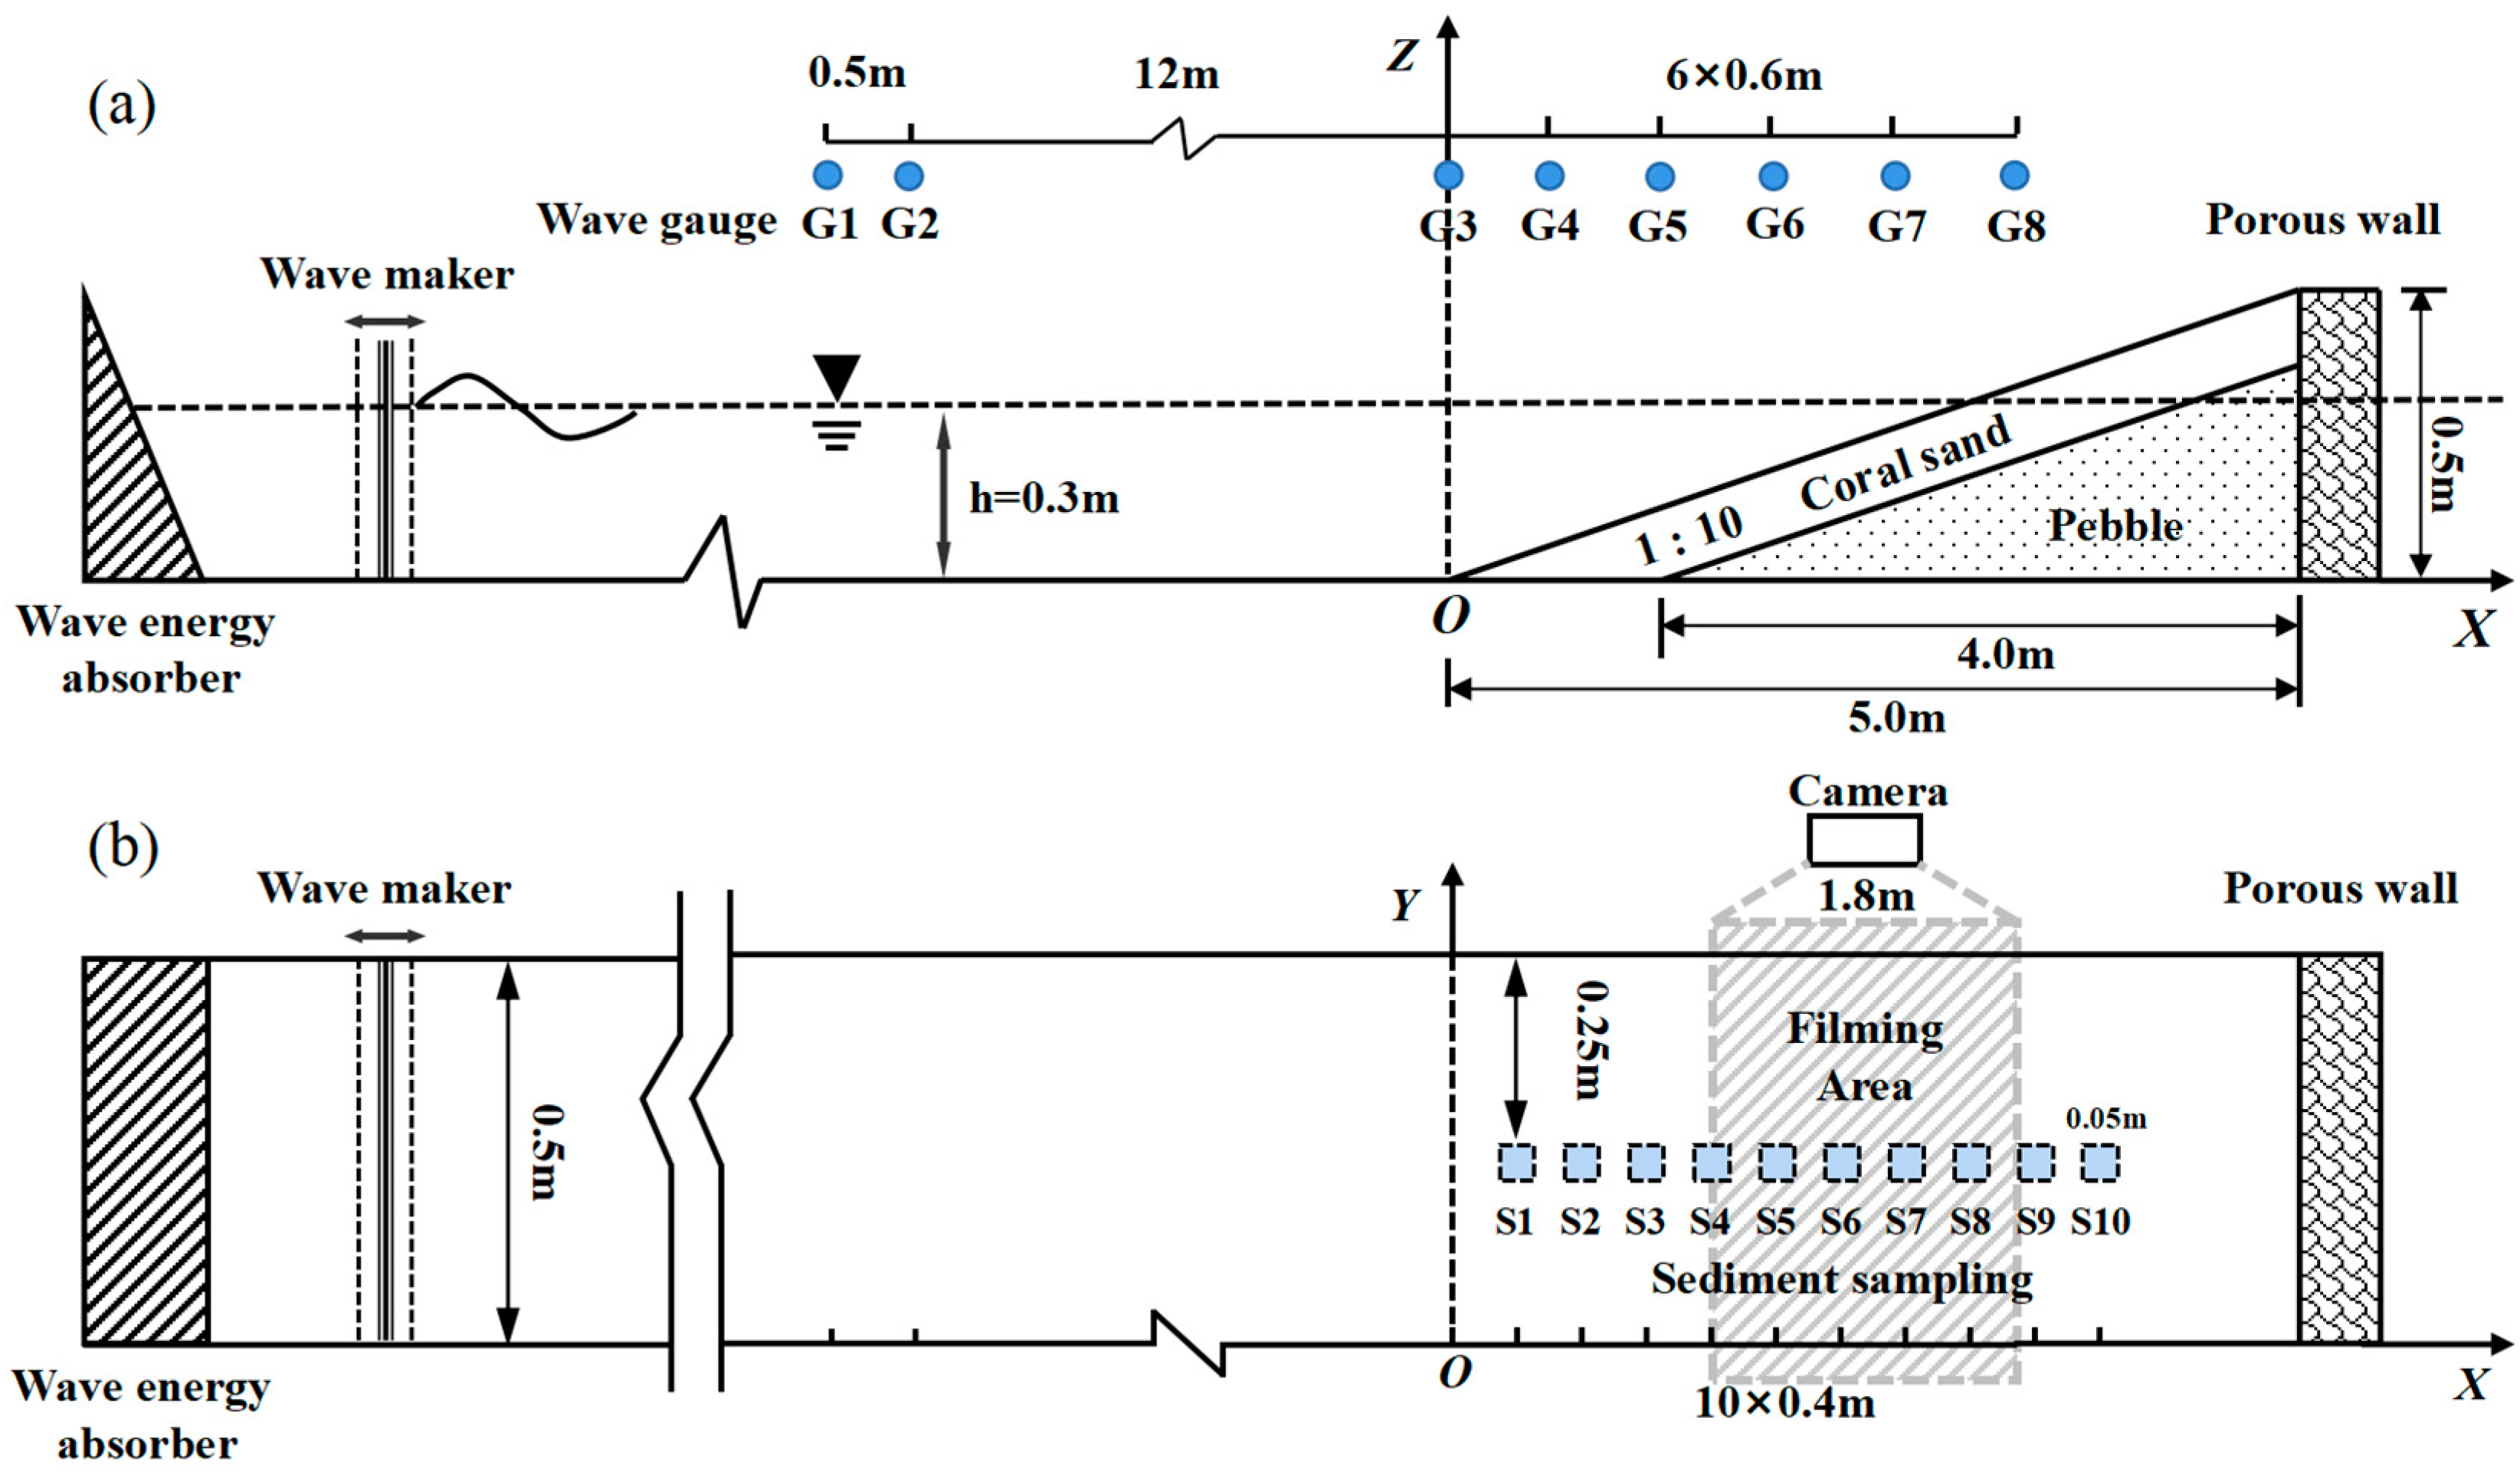
3. Experimental Setup

All experiments were conducted in a glass-walled wave flume in the hydraulics laboratory at the Changsha University of Science and Technology, China. The wave flume is 40.0 m long, 0.5 m wide, and 0.8 m high. A piston-type wave generator was installed at one end of the flume, and a coral sand beach was constructed in the wave flume with its toe 22.0 m away from the wave generator.
Coral sand particles from the South China Sea were used to create the coral sand beach profile (Figure 1). This carbonate sand consists mainly of coral (95%) and the remains of nearby organisms (e.g., gastropods and bivalves; 5%,), with a median diameter (D50) of 0.585 mm, a coefficient of nonuniformity (D75/D25) of 1.7, and a coefficient of graduation (D302/(D60D10)) of 0.942.
The experimental setup was developed to reproduce the action of waves over a coral sand beach environment. Considering the size of the laboratory flume and the wave-making capacity of the wave maker, the experimental coral reef flat was generalized, but allows for the evolution of the coral sand beach (Figure 1). A coral sand profile was built over the flume platform. It was characterized by a slope of 5.5° (1:10), a length of 5.00 m, and a height of 0.50 m (Figure 4). The water level was maintained at 0.3 m above the platform during all experiments. The experiment did not simulate the specific environment of the coral sand beach on the reef flat but was developed such that its parameters could be adjusted to scale the physical model to a modern occurrence of a coral sand beach. As shown in Table 3, the hydrodynamic characteristics over the reef flat exhibited a range in wave heights from 0.0 to 1.0 m, a water depth between 0.3 and 3.0 m, and a wave period ranging from 2.0 to 20 s. Yu et al. [1] analyzed the grain sizes of coral reef sediments from 25 different areas located along the Chinese Nansha Islands. They found that the composition of sand mostly consisted of gravelly coarse sand; the gravel (>2 mm in diameter) makes up 30–50% to, in some areas, 50–80% of the sediment. Research conducted on Lady Elliot Island [41] found that the slope of the coral sand beach on a reef flat is approximately 1:10.
In this paper the main dynamic factor of sediment movement is wave action. Therefore, scaling the experimental model mainly considered two aspects of wave motion, including similarity and sediment motion similarity under wave action. Thus, the geometric scale factor (NL = HPrototype/Hmodel = 4) and the time scale factor followed the Froude criterion (NT = TPrototype/Tmodel = NL0.5 = 2) and were set following the Froude similitude criterion. Table 4 provides the wave conditions in the experiments, each of which was run for 3 h (which was sufficient time to develop an equilibrium profile). The sediment sample area is shown in Figure 4, and it was taken at the depth of 2 cm (to the seabed).
Wave gauges (ULS 80D, General Acoustics, Germany) were used to record the wave data, whereas a topographic surveying system (RUI-III, Wuhan University, Wuhan, China) was used to survey the topo-bathymetry of the beach profile. A camera (Sony IXM 586, Sony, Japan) was used to record the morphological evolution at one-second intervals during the tests. The particle size distribution of the coral sand particles was measured using a laser particle sizer (Malvern Instruments MasterSize2000, Malvern Panalytical, United Kingdom: It uses the technique of laser diffraction to measure the size of particles. It does this by measuring the intensity of light scattered as a laser beam passes through a dispersed particulate sample).

4. Results

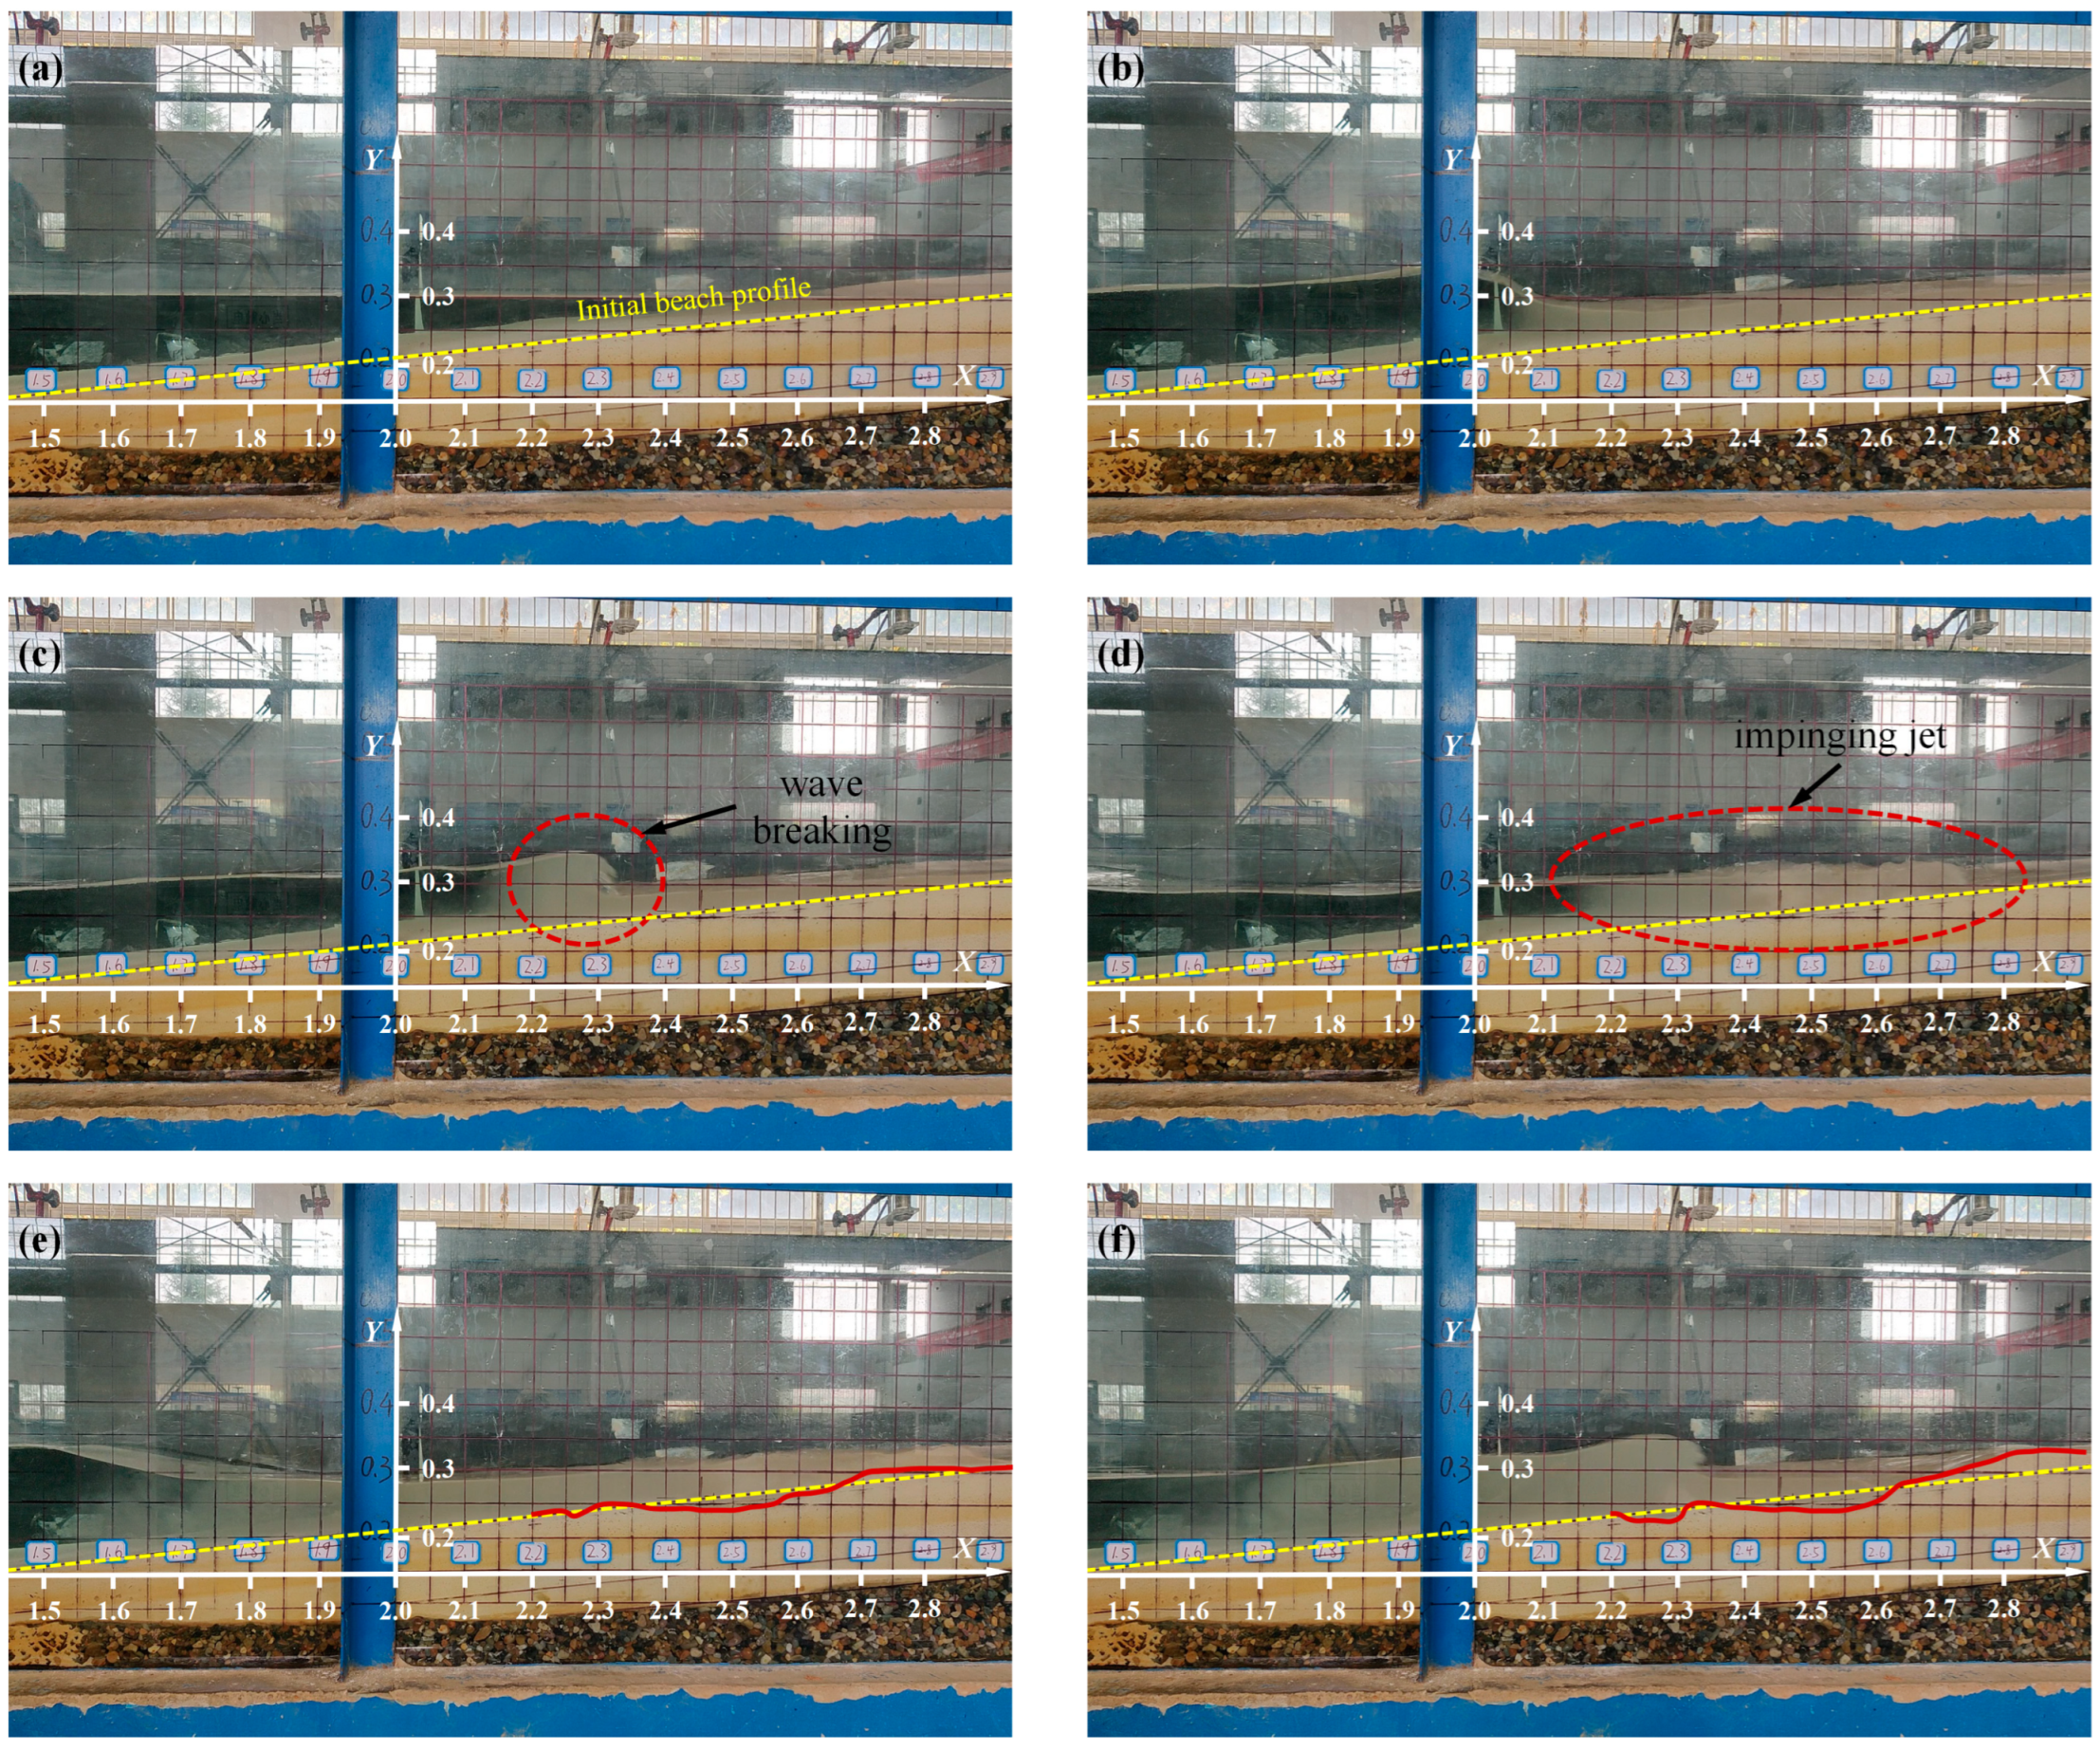
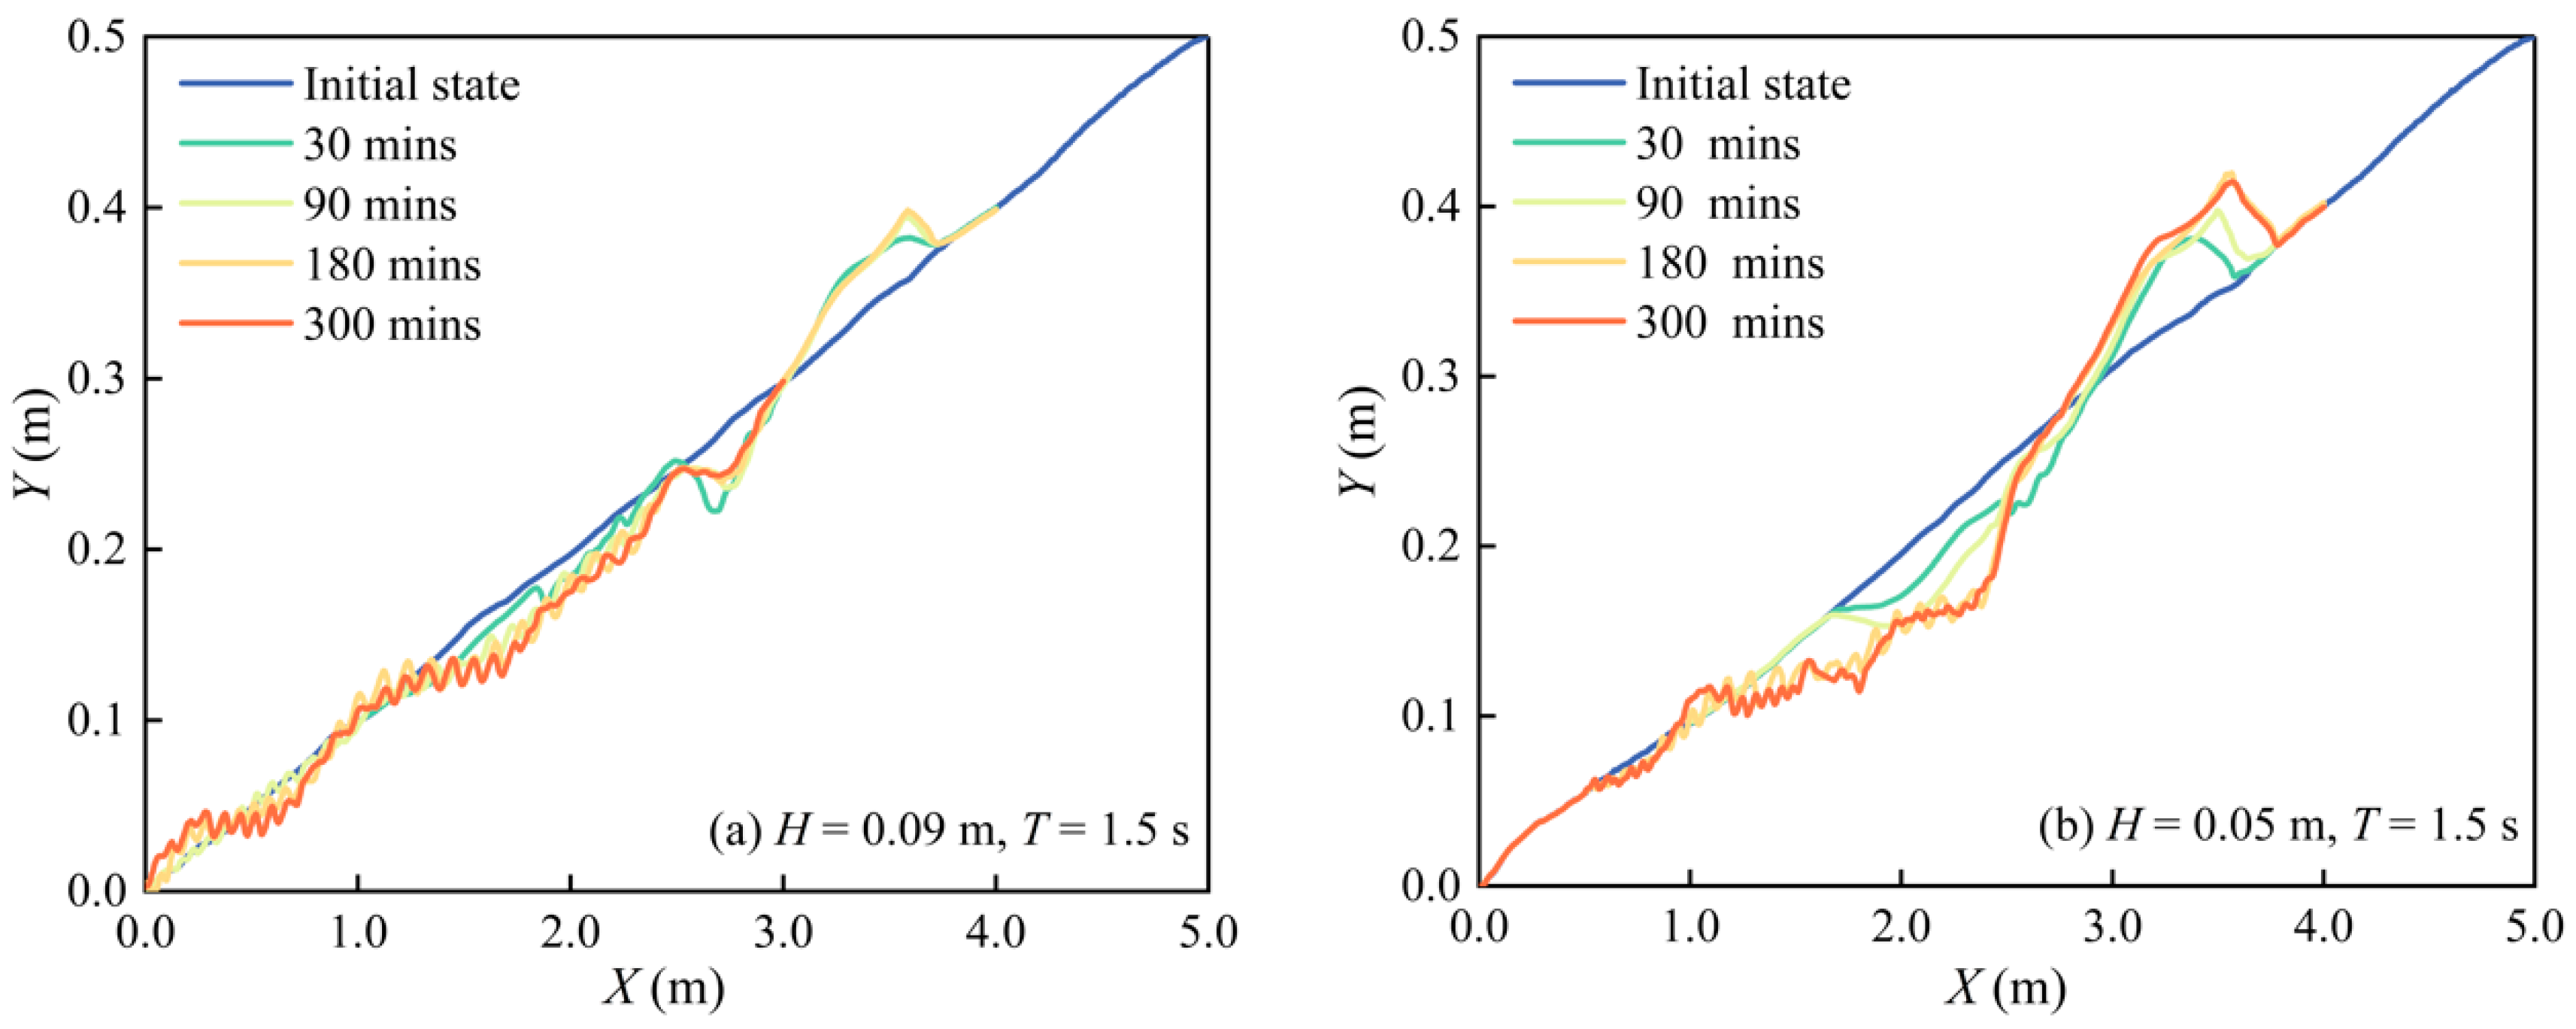
4.1. Evolution of the Coral Sand Beach Profile

For all experiments, our observations revealed that a large amount of coral sand as suspended sediment entered the water column from the sediment bed and started to move as the waves entered the breaking phase. Six snapshots extracted from the video recordings are shown in Figure 5 for waves characterized by h = 0.3 m, H = 0.07 m, and T = 1.8 s. Each of these images shows the same field of view that starts at X = 1.5 m and ends at X = 2.9 m. Figure 5a shows that the surface of the water remains still (calm) and the water is clear before the waves reach the coral sand beach. Figure 5b subsequently shows that when the wave peak reaches x = 2.0 m, the waveform begins to change. A turbid area appears in front of the wave peak (the starting point of the turbid area is located at X = 2.05 m, Figure 5b), indicating that the coral sand has become suspended in the water. The wave begins to break when the peak reaches x = 2.3 m, at which point air bubbles enter the rolled wave, and the starting position of the turbid region moves from X = 2.05 m to X = 2.15 m. As the seawater recedes from the beach, the starting position of the turbid region moves (Figure 5e,f) until it is stabilized at X = 1.6 m. In the wave breaking zone, the bed is scoured to form a sand trough. Meanwhile, a beach berm is formed at the shoreward end and a smaller sand bar is formed at the offshore end. As time increases, the area of the sand trough expands until the morphology of the coral sand beach profile reaches an equilibrium (constant) state.
The initial coral sand beach profile and those after running several hours are plotted in Figure 6 for two cases. In Figure 6b, local scour is observed between X = 1.3 and 2.8 m. The extent of the sand trough increased with the duration of the test, and the depth of the trough reached an equilibrium profile after 300 min. The beach berm appeared between X = 3.0 and 3.8 m. According to the classification of Sunamura and Horikawa [28] (Figure 2), the developed equilibrium beach profile represents a deposition beach. In Figure 6a, the initial beach reached equilibrium after 300 min. A beach berm was formed by siltation between X = 2.8 and 3.8 m, whereas a sand trough was formed by scouring between X = 1.3 and 2.8 m.
When the beach profile reaches equilibrium, bed sands are sampled (blue area in Figure 4) and changes in bed sand characteristics are recorded. The results are shown in Figure 7. The median grain size of the sediment near the top of the shoulder beach and the bottom of the sand channel becomes larger compared to the initial sediment. The median grain size of the sediment near the wave-facing side of the shoulder beach and the sand pattern in the offshore zone becomes smaller. Combined with a series of snapshots, Figure 5 shows that the turbulence increased after wave breaking and a large number of vortices appeared leading to sediment starting. Coarse-grained sediment settles after initiation due to the lack of current carrying capacity, meaning that the median size of the sediment near the sand trough is larger. Fine-grained sediment becomes suspended in the water column with the wave offshore transport movement and finally settles in the offshore area, meaning the median particle size of sediment near the offshore sand grain is smaller. At the same time, the upwelling current carries the bed sediment to the shore, and the coarse-grained sediment is carried to the top. As the upwelling velocity decreases, the coarse-grained sediment is silted up, so the median particle size of the sediment near the beach berm is larger.

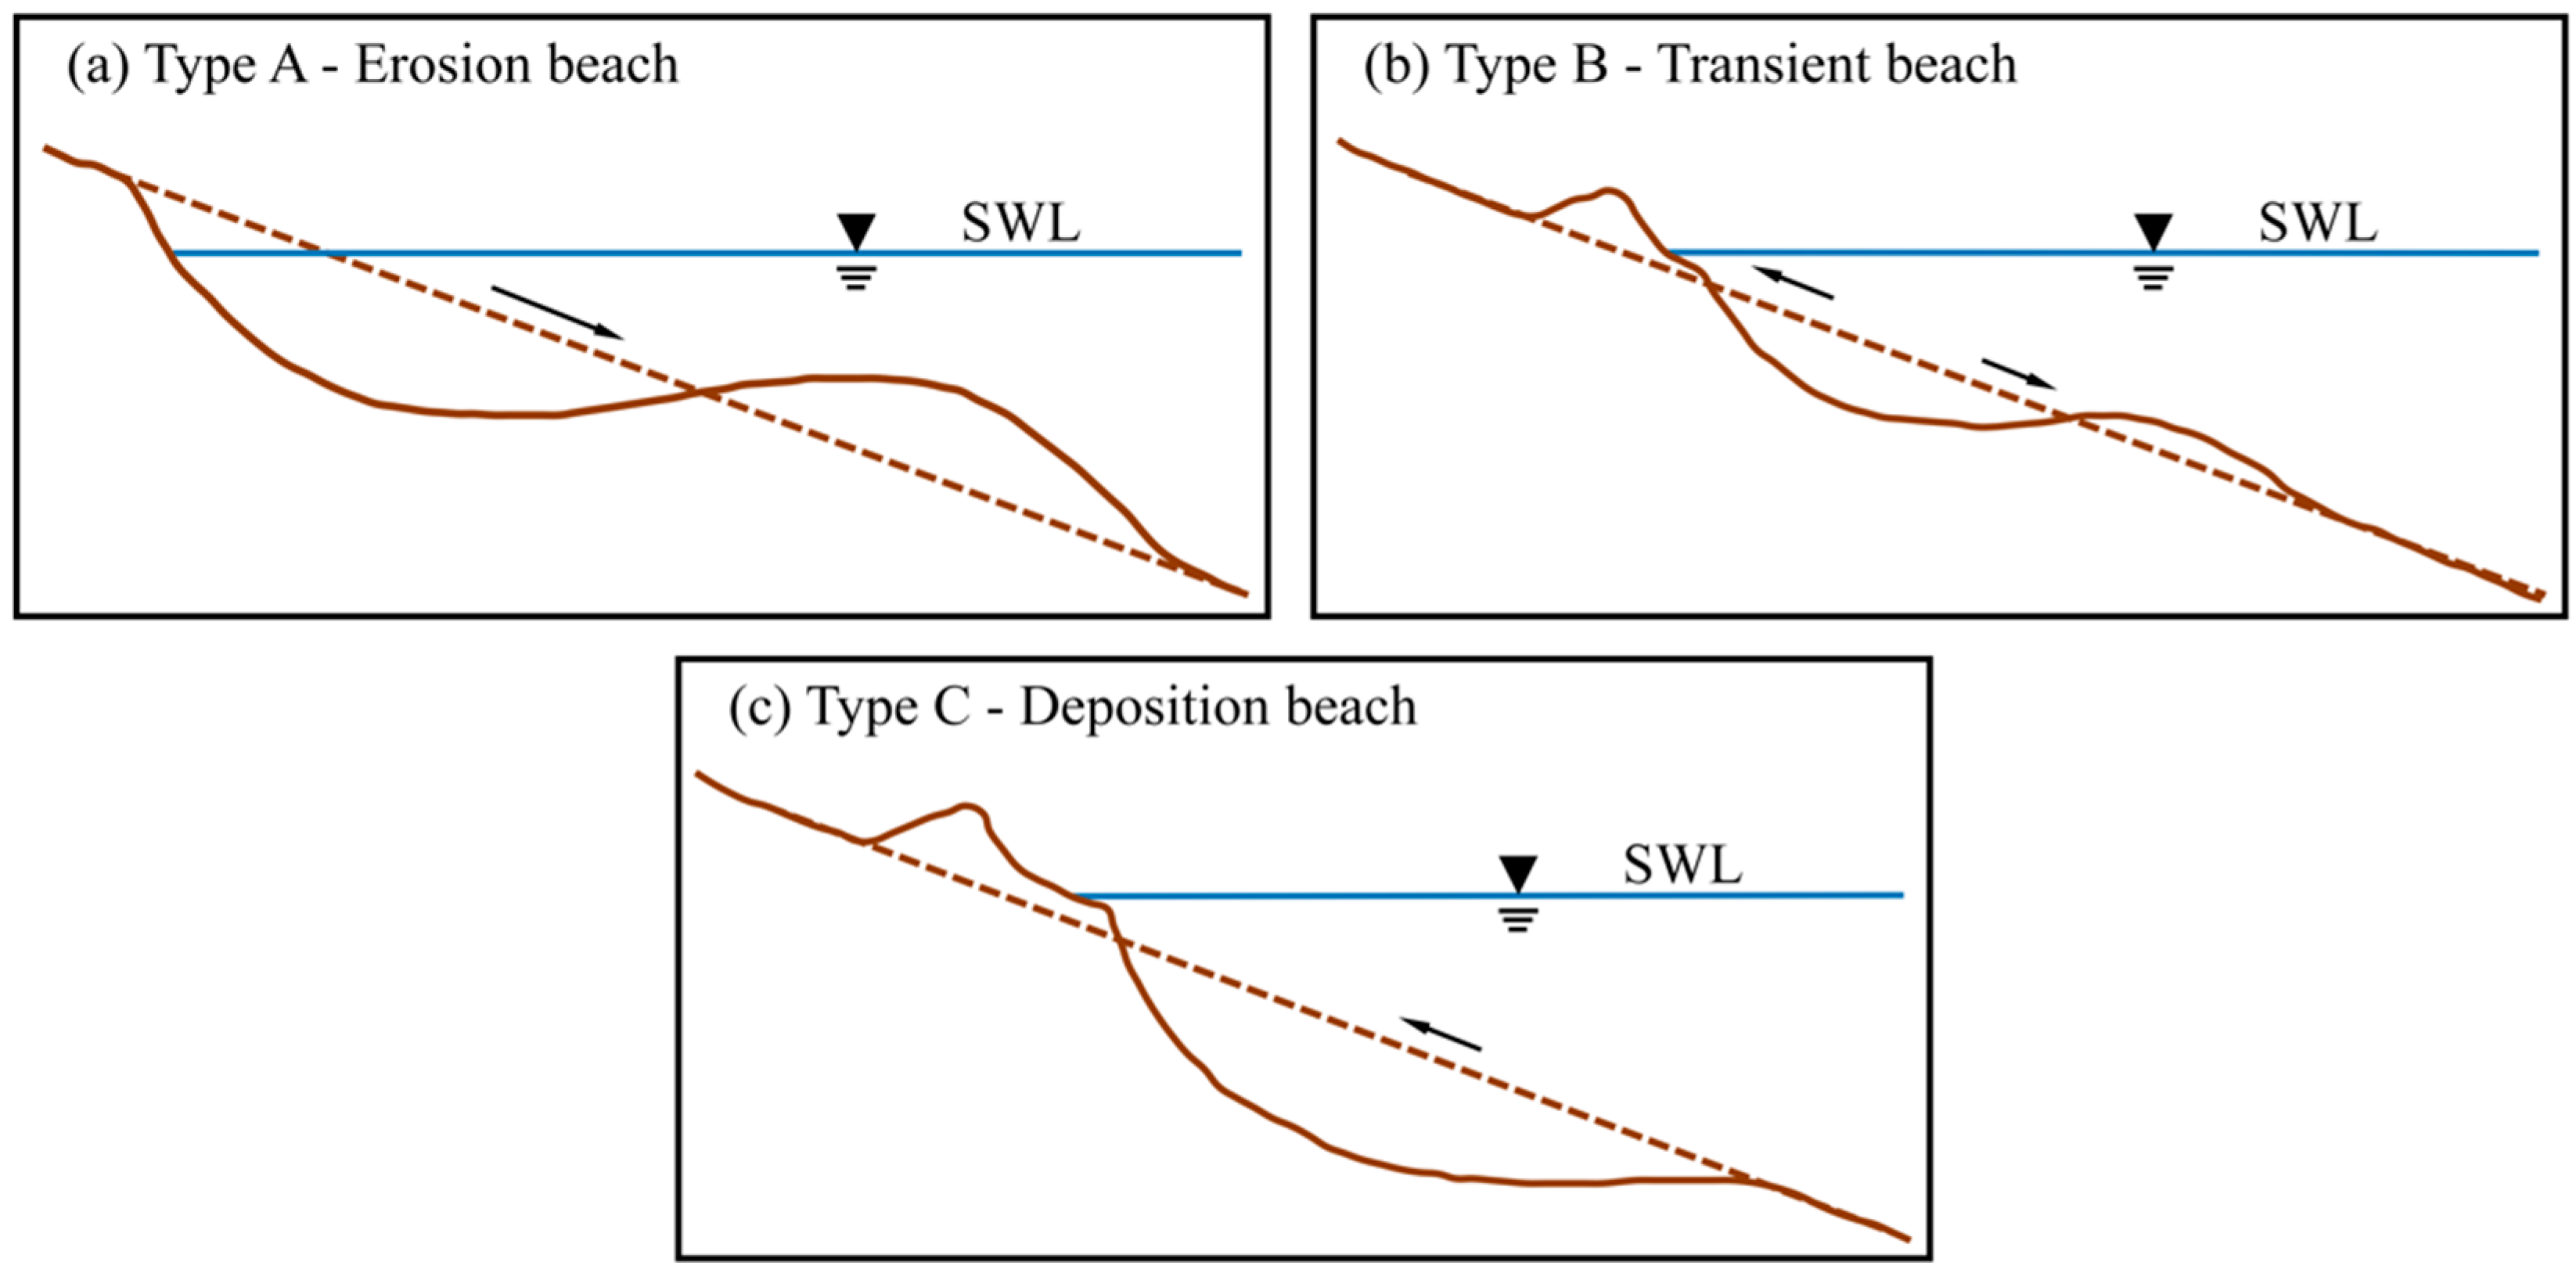
4.2. Classification of Equilibrium Coral Sand Beach Profiles

Independent tests of beach classification (Equations (3)–(5)) were performed using our experimental data. Results of the observed experimental data (shown in Figure 8) were classified using the types of equilibrium beach profiles proposed by Sunamura and Horikawa (1975) (Figure 2). The distribution of the experimental classification data is similar to the results of Sunamura and Horikawa [28], Rector [27], and Watts [50]. The constant terms in Table 1 can be referred to as the coefficients of determination, α. Moreover, the coefficient of determination, α, 4, 8 (the dash line shown in Figure 8a), proposed by Sunamura and Horikawa [28] did not effectively classify the coral sand beach types. For beaches characterized by siltation (type C), the coefficient of determination, α, is smaller than the actual value. Moreover, the coefficient of determination, α, is greater than the actual value for erosional beaches. This indicates that the transitional area of coral beaches is smaller than that associated within quartz sand beaches.
When using the classification method of Xu [37] to predict the coral sand beach type, the erosional beach can be accurately classified, but there are errors in the prediction of the siltation and transitional beaches. As shown in Figure 8b, when α > 3.5, this area includes data points for both siltation and transition beaches. When α is between 2.9 and 4.5, both transitional and erosional beaches are present. Compared with the classification model of Wu [39], α = 0.867 can distinguish siltation beaches and transitional beaches. However, within the interval of 0.394 < α < 0.867, some of the siltation beaches were incorrectly predicted to be transition beaches.
Comparing the trends in the experimental data on the different regime maps, (H0/L0~(D/L0)0.67i−0.27 and (H0/L0)−0.5~(gH)0.5(fw + i)/ω), the slope of the dividing line is most similar to the trends observed on a phase diagram for the same type of experimental data in Sunamura and Horikawa [28]. Therefore, herein we propose an equilibrium beach profile type prediction model that is applicable to coral sand beaches by parameter correcting the predictive classification model of Sunamura and Horikawa [28] (Figure 8a), where:
( H 0 / L 0 ) ( D / L 0 ) 0.67 ( tan β ) 0.27 > 7.35 ,   Type   A Erosional   Beach
5.05 < ( H 0 / L 0 ) ( D / L 0 ) 0.67 ( tan β ) 0.27 < 7.35 ,   Type   B Transient   Beach
( H 0 / L 0 ) ( D / L 0 ) 0.67 ( tan β ) < 5.05 ,   Type   C Depositional   Beach

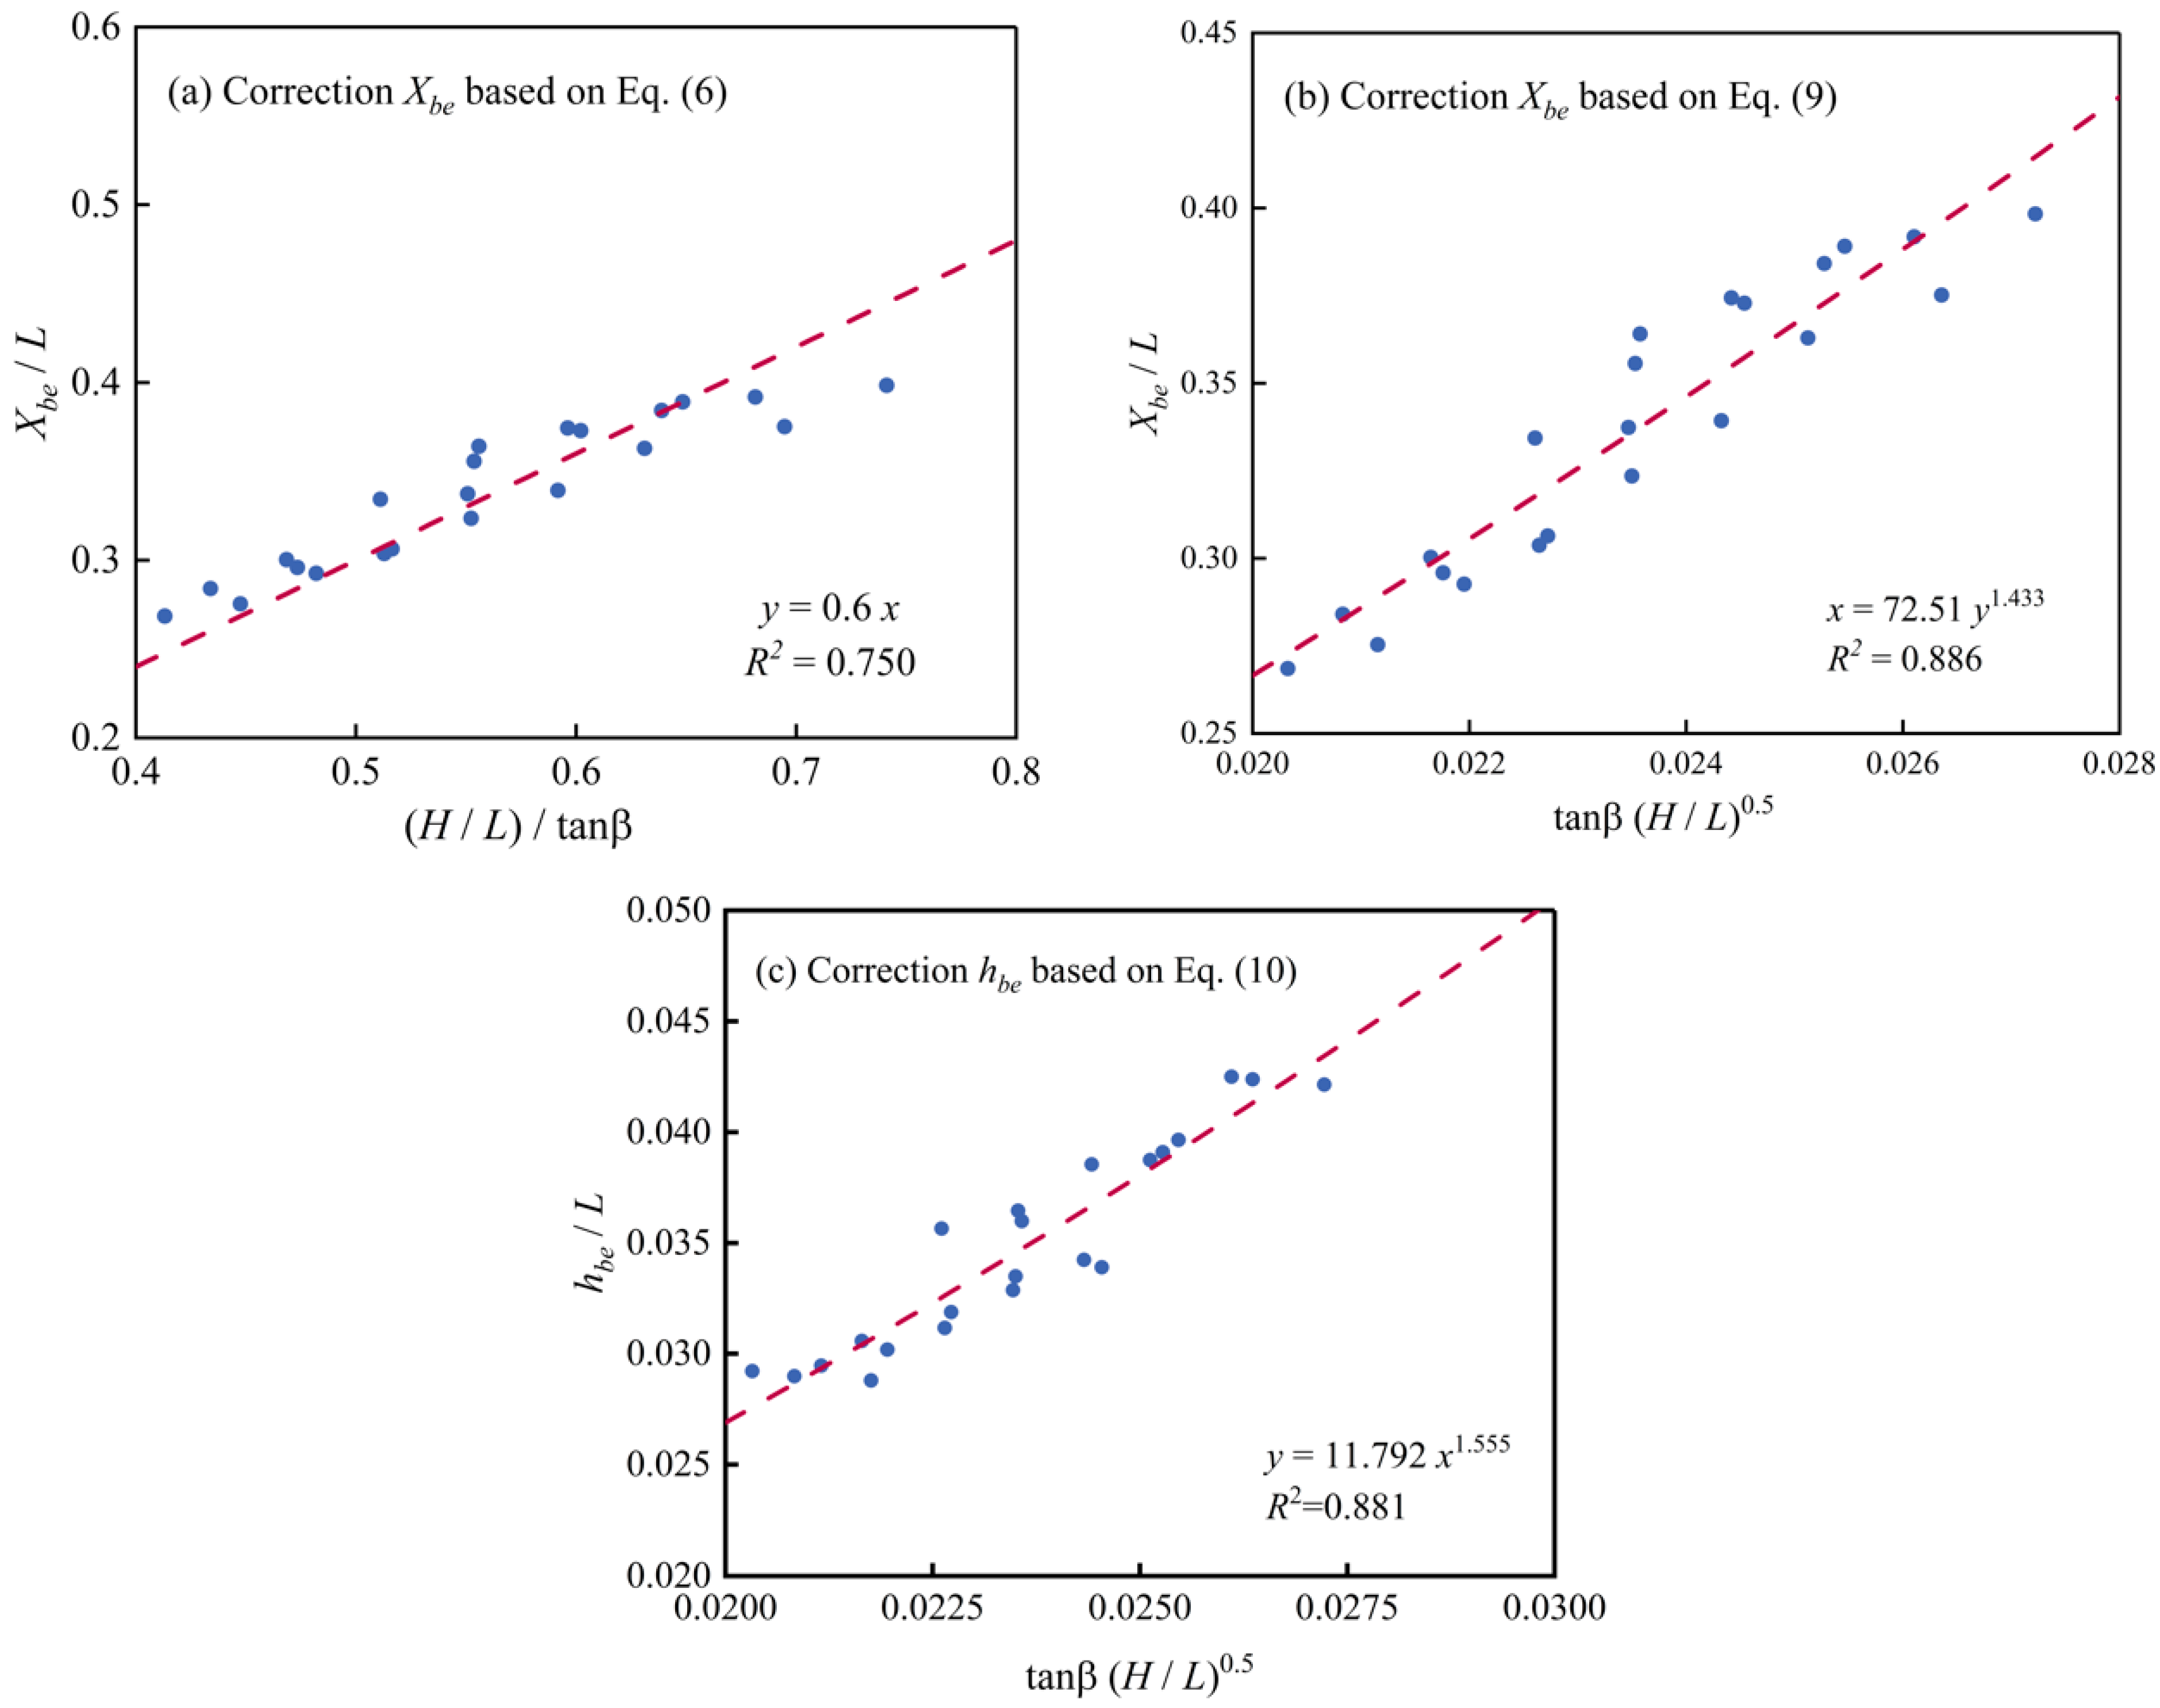
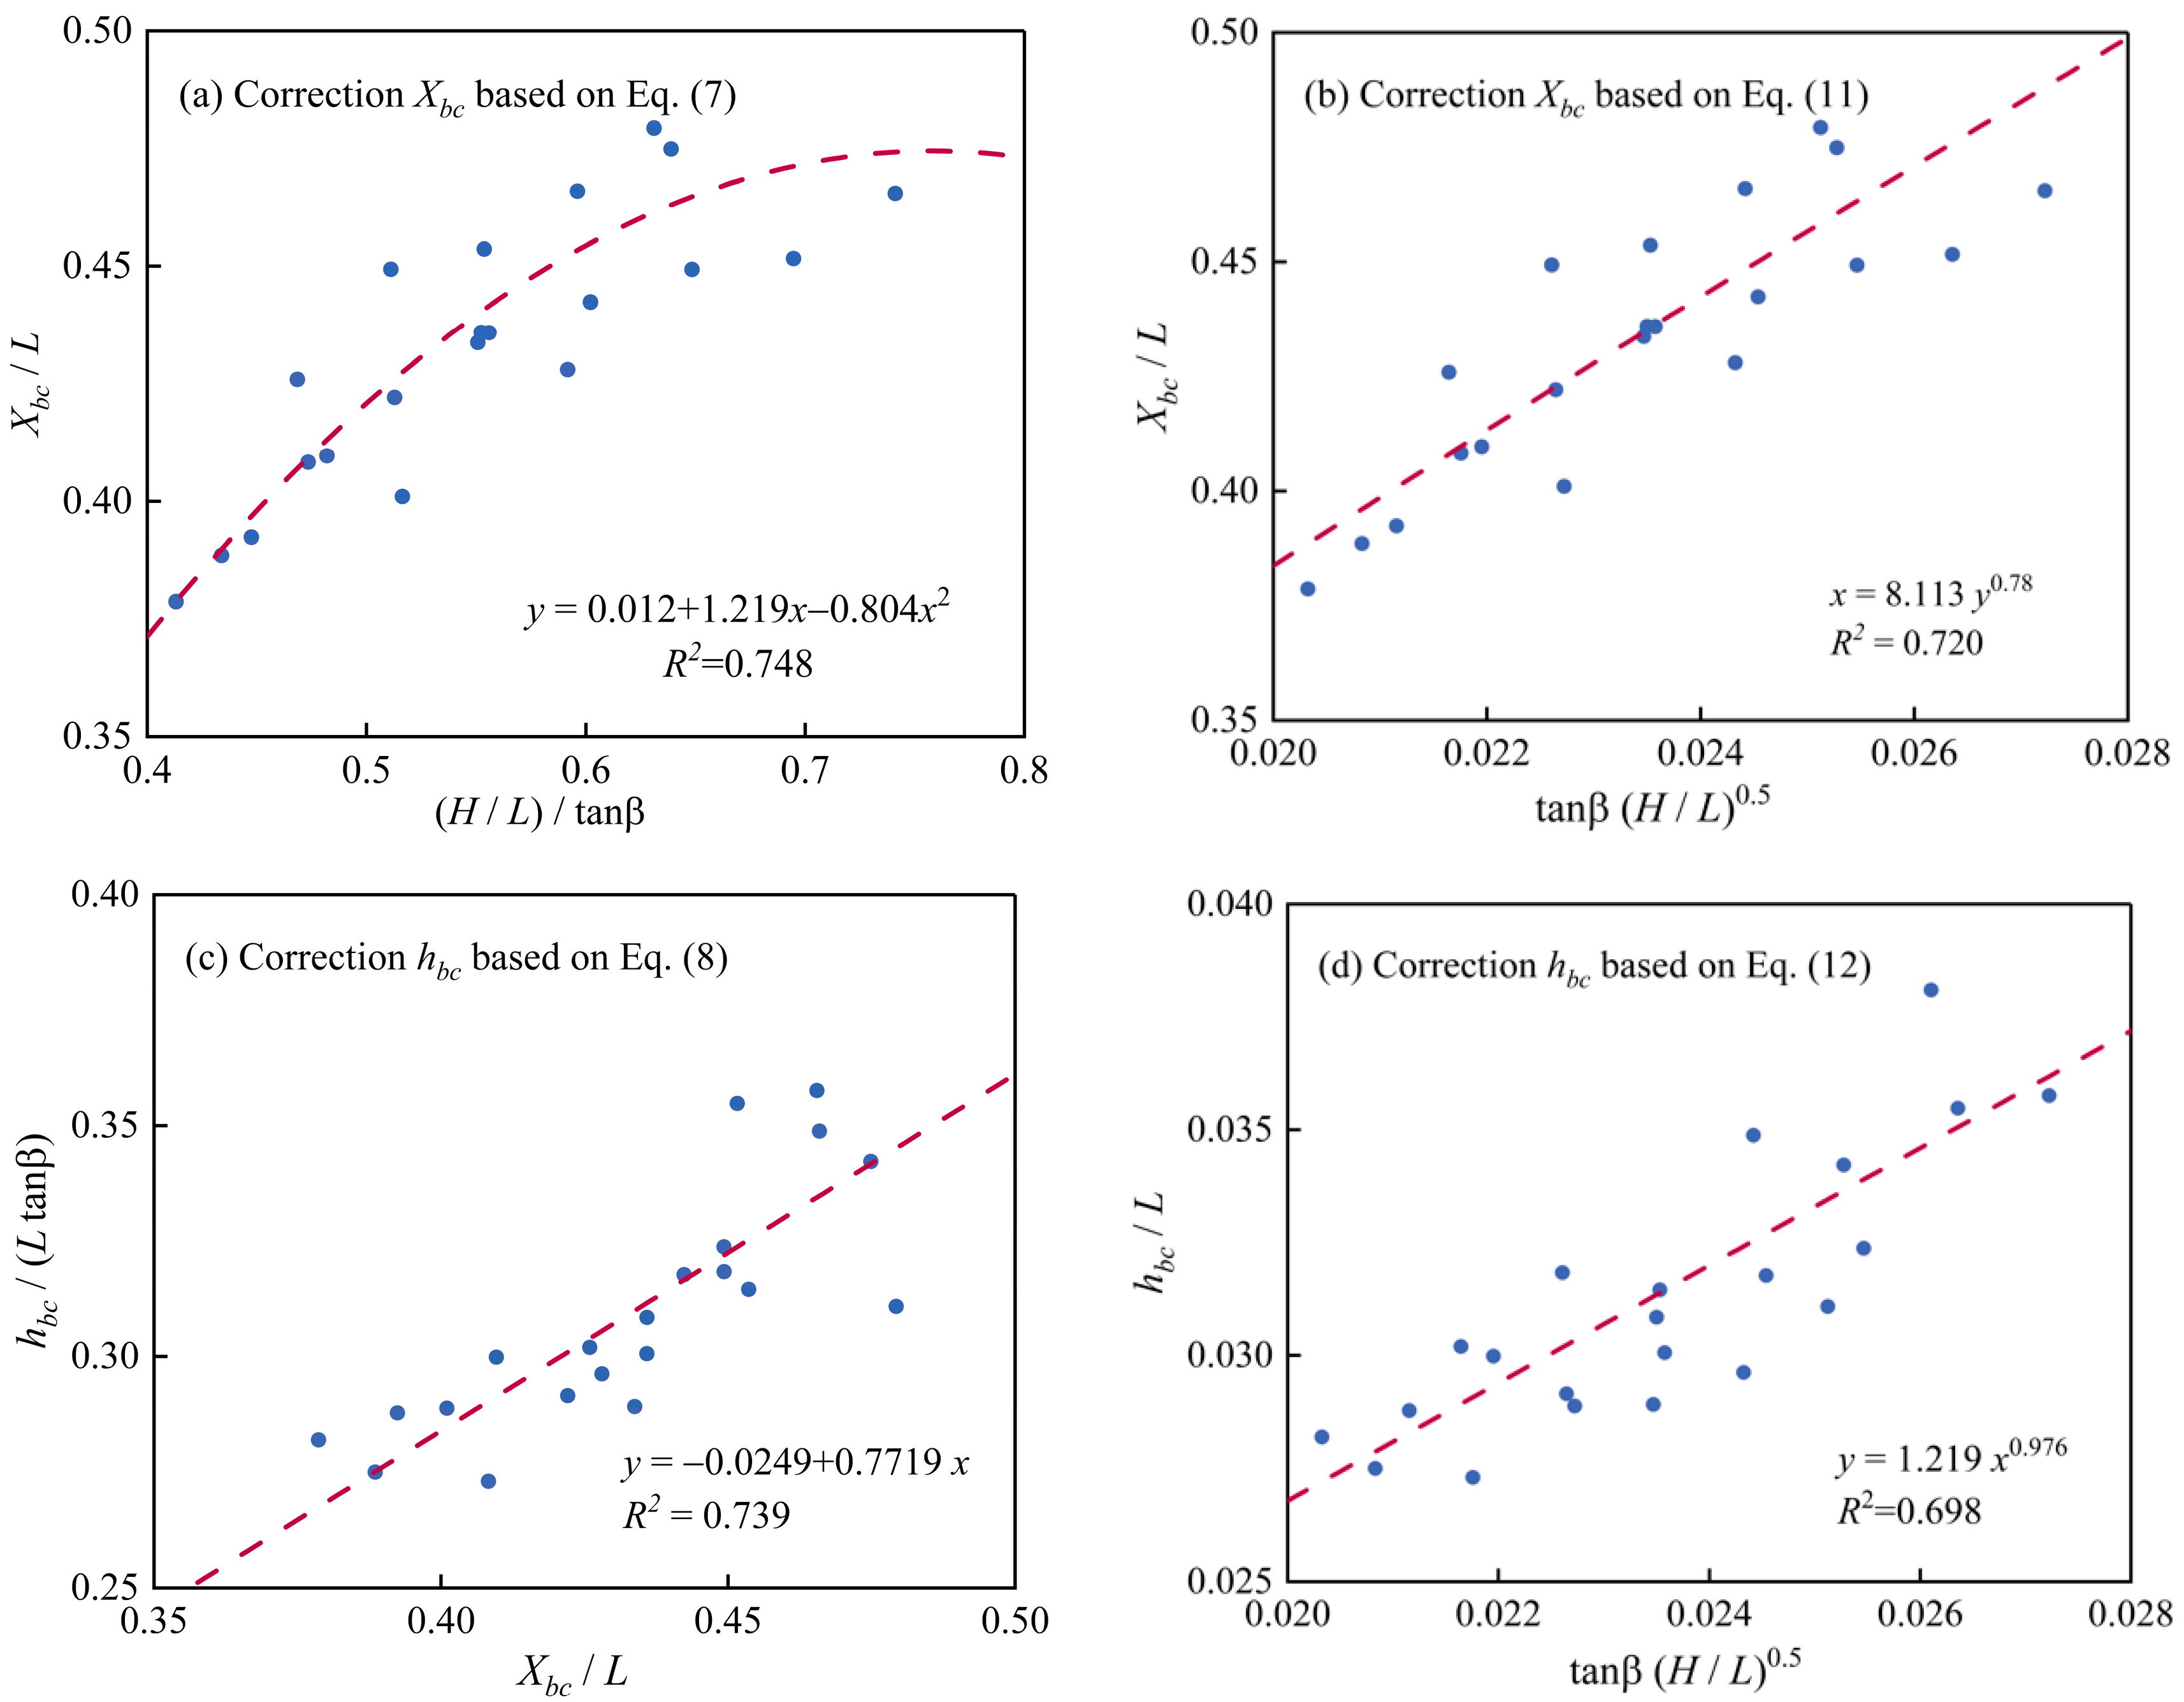
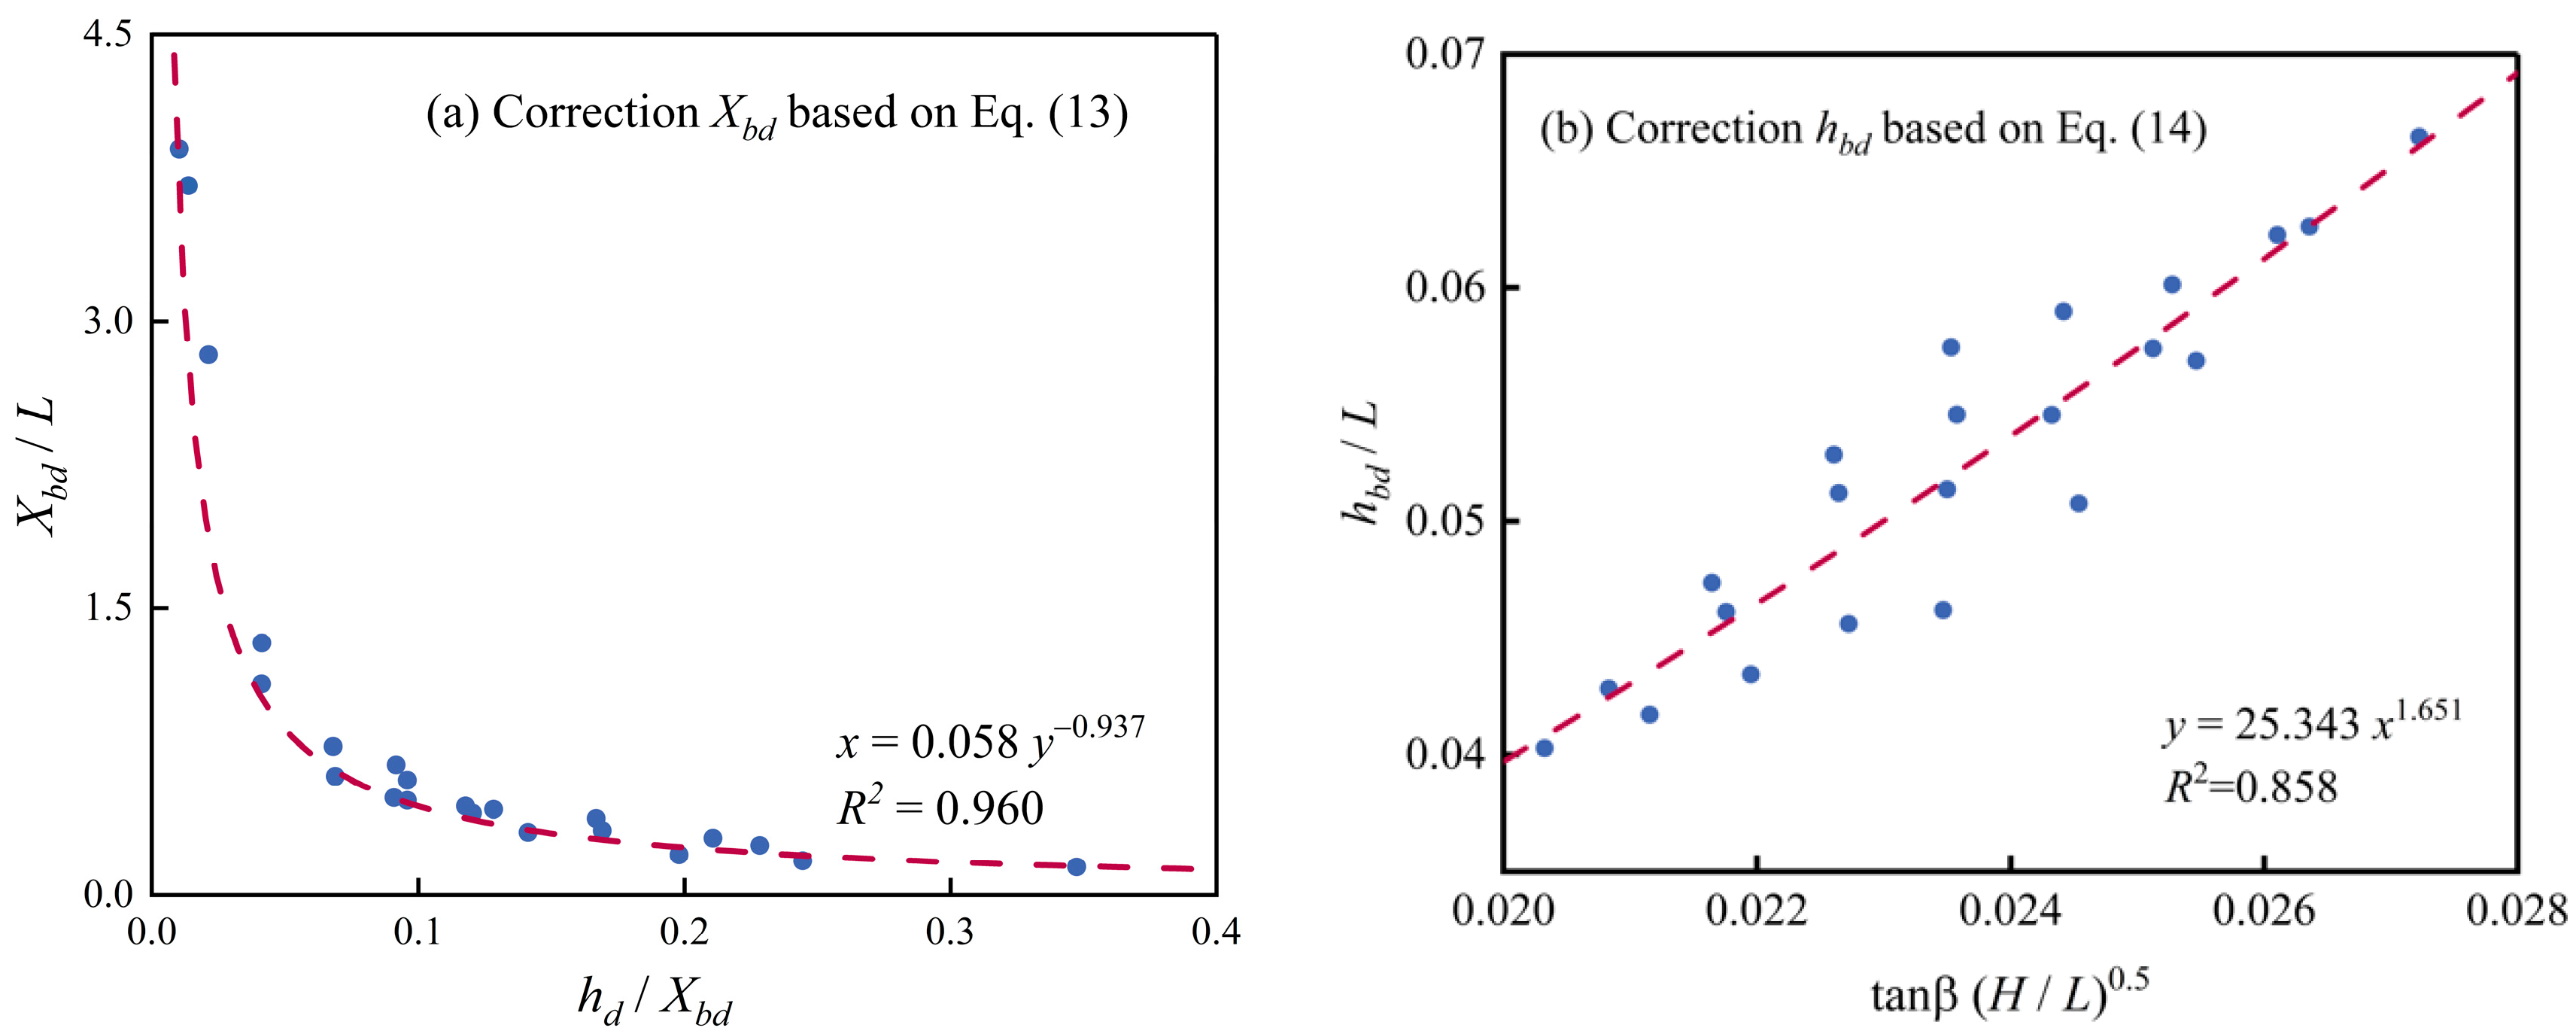
4.3. Geometric Characteristics of Offshore Coral Sand Bars

Figure 9 compares the distance from the wave crest point to the original point (Xbc) and the water depth at the bar crest (hbc) with the value derived from the quartz sand prediction equation used by Günaydın and Kabdaşlı [30]. The water depth at the bar crest is greater for the coral sand bar compared to the quartz sand bar under the same regular wave action. Coral sand bars are located further from the berm. Thus, the depositional location of coral sand particles is further from the berm than for a quartz sand beach. Moreover, with an increase in the dimensionless parameter, tanβ (H0/L0)0.5, Günayd’s model predictions follow the same trend as the measured values obtained during our experiments.
In order to compare the applicability of the predictive model for a quartz sand bar to a coral sand bar, the predictive models proposed by Günaydın and Kabdaşlı [30] and Silvester and Hsu [40] were parametrically corrected. The equations determined by non-linear regression and their correlation coefficients are shown in Table 5. Figure 10, Figure 11 and Figure 12 show the experimental geometric characteristics of coral sand bars and the modified predictive models based on quartz sand bars in relation to the unfactored particle diameters. The figures illustrate that the functional relationship (polynomial structure) obtained through the experiments on the quartz sand bars also applies to the features of coral sand bars.
The regression coefficients for each of the predictive equations are shown in Table 5 (columns 4 and 6). A comparison of the results of the corrected model developed by Günaydın and Kabdaşlı [30] with that of Silvester and Hsu [40] shows that the structure of the model of Silvester and Hsu [40] is applicable to the geometrical characteristics of the crest of the coral sand bar. The model structure of Günaydın and Kabdaşlı [30] was applied to the geometric characteristics of the equilibrium and closure points of coral sand bars.

5. Discussions

During the initial stages of beach evolution under regular wave action, the waves gradually deform by creeping up the slope, creating a wave-generated flow at the bed surface and driving coral sands on the beach into the water column (Table 4, Figure 5b). It is worth noting that the turbid zone occurs before the wave crest and the turbidity is low during this phase. When the wave reaches the region shown in Figure 5c, it begins to break and form an impinging jet [51]. Under the action of the impinging jet, irregular vertical vortices appear at the crest of the wave and descended obliquely [52]. These vortices drive a large amount of coral sand upward, creating the turbid zone, including that at the back of the wave crest. As the impinging jet enters the water column, tumbling occurrs on the free surface (Figure 1d), and a region of high turbidity occurrs between x = 2.45 and 2.75, which indicates that a large number of coral sand particles are lifted into the water column at this stage. This type of sediment movement has been observed in previous studies of quartz sand banks [17], indicating that coral sand beaches are similarly affected by wave movement mechanisms as quartz sand beaches. In addition, as suggested by Çelikoğlu et al. [53], the smaller particles of sediment are easily entrained by a current caused by infiltration into the pore space between the coarse particles. During the return phase of the current, a thin, high-speed layer of water removes coarse particles from the bed surface sediment, while the fine particles remain stationary because of the shading effects by coarse particles. As a result, the median particle size of the bed sediment near the shoreline becomes smaller. In the offshore area, due to the emergence of the breaking waves, strong turbulence leads to a decrease in the sand-carrying capacity of the water current, and the coarse particles of sediment settle rapidly. Thus, the median particle size of sediment in the siltation area becomes larger. This suggests that the pattern of bed sediment sorting of coral sandy beaches under regular wave action is similar to that of quartz sand beaches.
However, the results of equilibrating beach classification show that the existing predictive model for the classification of quartz sand beaches is not applicable to coral sand beaches. This is because the dimensionless parameters from Sunamura and Horikawa [28] consider only the effects of wave steepness, wave intensity, and bank slope while ignoring the characteristics of sediment movement (starting flow velocity, settling velocity, etc.). Previous studies [33,34,35] have shown that coral sands are irregular in shape and have a high porosity, which leads to different settling velocities, starting velocities, and diffusion patterns for coral sand particles in comparison to quartz sand. These particle properties in turn affected the rate of coral sand transport from the shore to offshore and cause variations in the coral sand shoreland delineation boundary coefficients. It is worth noting that while the classification prediction models of Wu [39] and Xu [37] include particle settling velocity, the classification of beach type is unclear (Figure 4b,c). This may be due to the fact that particle settling velocity formulas are not applicable to coral sand particles and that the existing settling formulas for coral sand particles are single particle-dominated. The applicability of these formulas for a large number of particles in motion needs to be investigated. Meanwhile, it is worth noting that the R2 of the modified bar top prediction model is only around 0.7 to 0.8. This suggests that the two forms of formulations do not fully correspond to the physical evolution of the coral sand beach. This phenomenon also occurs when modeling the prediction of coral sand particle initiation velocities [34,35] and settling motions [33]. Moreover, beach profile changes are the result of the complex motions of multiple particles, so in this paper only parameter corrections are used to propose a prediction model applicable to coral sand beach profiles. The predictive models are only applicable to experimental data in regular wave conditions. In the future, it will be necessary to collect field data to test the applicability of the predictive models.

6. Conclusions

In this study, a set of laboratory experiments were conducted to investigate changes in coral sand beach profiles under specified regular wave conditions. A total of 50 runs were performed with regular waves consisting of ten different wave heights and four wave periods. The water depth and initial slope angle, tanβ, were assumed to be constant and equal to 0.3 m and 0.1, respectively, limiting our understanding of sediment deposition on coral sand beaches by regular waves. The following conclusions were drawn from the experiments:
(1)
Observations of hydrodynamic processes and the movement of coral sand on the bed surface suggest that the evolution of a coral sand beach is similar to the evolution of a quartz sand beach. The morphological characteristics of the sand bar show that the erosion depth of a coral sand beach is deeper than that of a quartz sand beach. The location of sand bar formation is further from the horizontal plane than the quartz sand beach. These differences are related to sediment transport and depositional processes, such as the starting flow rate and settling velocity of coral sand particles, among other parameters.
(2)
The results show that the predictive model for the classification of the type of quartz beach profile is not applicable to coral sand beaches. A classification prediction model for coral sand beaches was proposed through parameter modification.
(3)
Geometrical features of coral sand bars on erosional beaches were obtained and compared with a prediction model for a quartz sand bar. The results show that the prediction model for a quartz sand bar is not applicable to a coral sand bar. A prediction model for a coral sand bar was proposed through parameter modification.
Although this paper investigates the effect of regular waves on the evolution of coral sand beaches and compares the prediction models of previous quartz sand beaches, only the evolution of stable coral sand islands and one water depth were considered in this paper. Two other commonly observed cases in which coral sand islands are located in tidal shoals and the sandbar stage were not considered. In order to further study the evolutionary mechanism of coral sand islands under SLR, the model should be generalized for these two stages in the future. That is, beach evolution should be studied when the sand island is becoming submerged and once it becomes completely submerged.

Author Contributions

Conceptualization, J.C. and Z.Y.; methodology, H.L. and Z.Y.; software, Z.Y.; validation, C.B.; formal analysis, H.L.; investigation, J.C. and H.L.; resources, J.C.; data curation, Z.Y. and H.L.; writing—original draft preparation, Z.Y.; writing—review and editing, Z.Y.; visualization, Z.Y.; supervision, J.C.; project administration, C.J., Z.W., B.D. and Y.L.; funding acquisition, J.C. and C.J. All authors have read and agreed to the published version of the manuscript.

Funding

This research was funded by the National Key Research and Development Program of China (Grant No. 2021YFB2601100), the National Natural Science Foundation of China (Grant No. 52271257) and the Natural Science Foundation of Hunan Province (Grant No. 2022JJ10047).

Institutional Review Board Statement

Not applicable.

Informed Consent Statement

Not applicable.

Data Availability Statement

The data (experimental results: the characteristics of coral sand bars) of this study that support its findings are openly available in Baidu Netdisk at [https://pan.baidu.com/s/14zRRZK4HtpTeoIrNgZiocw?pwd=nu3l, accessed on 4 February 2024].

Conflicts of Interest

The authors declare no conflicts of interest.

References

  1. Yu, H.; Sun, Z.; Tang, C. Physical and Mechanical Properties of Coral Sand in the Nansha Islands. Mar. Sci. Bull. 2006, 8, 31–39. [Google Scholar]
  2. Anna, F. Encyclopedia of Modern Coral Reefs: Structure, Form and Process. Ref. Rev. 2011, 25, 39–40. [Google Scholar]
  3. Woodroffe, C.D. Reef-Island Topography and the Vulnerability of Atolls to Sea-Level Rise. Glob. Planet. Chang. 2008, 62, 77–96. [Google Scholar] [CrossRef]
  4. Beetham, E.; Kench, P.S. Predicting Wave Overtopping Thresholds on Coral Reef-Island Shorelines with Future Sea-Level Rise. Nat. Commun. 2018, 9, 3997. [Google Scholar] [CrossRef]
  5. Silva, I.R.; Rossi, J.C.; Nascimento, H.M.; Siqueira, T.G. Geoenvironmental Characterization and Urbanization of the Beaches on the Islands of Tinharé and Boipeba, South Coast of the State of Bahia, Brazil. J. Coast. Res. 2009, II, 1297–1300. [Google Scholar]
  6. Spalding, M.; Burke, L.; Wood, S.A.; Ashpole, J.; Hutchison, J.; zu Ermgassen, P. Mapping the Global Value and Distribution of Coral Reef Tourism. Mar. Policy 2017, 82, 104–113. [Google Scholar] [CrossRef]
  7. Burke, L.; Reytar, K.; Spalding, M.; Perry, A. Reefs at Risk Revisited; World Resources Institute: Washington, DC, USA, 2011. [Google Scholar]
  8. Albert, S.; Leon, J.X.; Grinham, A.R.; Church, J.A.; Gibbes, B.R.; Woodroffe, C.D. Interactions between Sea-Level Rise and Wave Exposure on Reef Island Dynamics in the Solomon Islands. Environ. Res. Lett. 2016, 11, 054011. [Google Scholar] [CrossRef]
  9. Slangen, A.B.A.; Carson, M.; Katsman, C.A.; Van de Wal, R.S.; Köhl, A.; Vermeersen, L.L.; Stammer, D. Projecting Twenty-First Century Regional Sea-Level Changes. Clim. Change 2014, 124, 317–332. [Google Scholar] [CrossRef]
  10. Kopp, R.E.; Horton, R.M.; Little, C.M.; Mitrovica, J.X.; Oppenheimer, M.; Rasmussen, D.J.; Strauss, B.H.; Tebaldi, C. Probabilistic 21st and 22nd century sea-level projections at a global network of tide-gauge sites. Earth Future 2014, 2, 383–406. [Google Scholar] [CrossRef]
  11. Montaggioni, L.F. History of Indo-Pacific Coral Reef Systems since the Last Glaciation: Development Patterns and Controlling Factors. Earth-Science Rev. 2005, 71, 1–75. [Google Scholar] [CrossRef]
  12. Nicholls, R.J.; Cazenave, A. Sea-Level Rise and Its Impact on Coastal Zones. Science 2010, 328, 1517–1520. [Google Scholar] [CrossRef] [PubMed]
  13. Hauer, M.E.; Fussell, E.; Mueller, V.; Burkett, M.; Call, M.; Abel, K.; McLeman, R. Sea-Level Rise and Human Migration. Nat. Rev. Earth Environ. 2020, 1, 28–39. [Google Scholar] [CrossRef]
  14. Duvat, V.K.E.; Magnan, A.K. Rapid Human-Driven Undermining of Atoll Island Capacity to adjust to Ocean Climate-Related Pressures. Sci. Rep. 2019, 9, 15129. [Google Scholar] [CrossRef] [PubMed]
  15. Kench, P.S.; Liang, C.; Ford, M.R.; Owen, S.D.; Aslam, M.; Ryan, E.J.; Turner, T.; Beetham, E.; Dickson, M.E.; Stephenson, W.; et al. Reef Islands Have Continually adjusted to Environmental Change over the Past Two Millennia. Nat. Commun. 2023, 14, 508. [Google Scholar] [CrossRef] [PubMed]
  16. Masselink, G.; Beetham, E.; Kench, P. Coral Reef Islands Can Accrete Vertically in Response to Sea Level Rise. Sci. Adv. 2020, 6, eaay3656. [Google Scholar] [CrossRef] [PubMed]
  17. Chen, J.; Huang, Z.; Jiang, C.; Deng, B.; Long, Y. An Experimental Study of Changes of Beach Profile and Mean Grain Size Caused by Tsunami-Like Waves. J. Coast. Res. 2012, 284, 1303–1312. [Google Scholar] [CrossRef]
  18. Chen, J.; Jiang, C.; Yang, W.; Xiao, G. Laboratory Study on Protection of Tsunami-Induced Scour by Offshore Breakwaters. Nat. Hazards 2015, 81, 1229–1247. [Google Scholar] [CrossRef]
  19. Dean, R.G. Equilibrium Beach Profiles: Characteristics and Applications. J. Coast. Res. 1991, 7, 53–84. [Google Scholar]
  20. Jara, M.; González, M.; Medina, R. Shoreline Evolution Model from a Dynamic Equilibrium Beach Profile. Coast. Eng. 2015, 99, 1–14. [Google Scholar] [CrossRef]
  21. Riazi, A.; Slovinsky, P.A. Subaerial Beach Profiles Classification: An Unsupervised Deep Learning Approach. Cont. Shelf Res. 2021, 226, 104508. [Google Scholar] [CrossRef]
  22. Larson, M.; Kraus, N.C.; Wise, R.A. Equilibrium Beach Profiles under Breaking and Non-Breaking Waves. Coast. Eng. 1999, 36, 59–85. [Google Scholar] [CrossRef]
  23. Francesco, M.; Mancinelli, A.; Corvaro, S.; Rocchi, S.; Lorenzoni, C. Coastal Submerged Structures Adaptation to Sea Level Rise over Different Beach Profiles. Ital. J. Eng. Geol. Environ. 2020, 1, 87–98. [Google Scholar]
  24. Marini, F.; Corvaro, S.; Rocchi, S.; Lorenzoni, C.; Mancinelli, A. Semi-Analytical Model for the Evaluation of Shoreline Recession Due to Waves and Sea Level Rise. Water 2022, 14, 1305. [Google Scholar] [CrossRef]
  25. Aagaard, T.; Brian, G.; Michael, H. Sediment Transport on Dissipative, Intermediate and Reflective Beaches. Earth-Sci. Rev. 2013, 124, 32–50. [Google Scholar] [CrossRef]
  26. Castelle, B.; Gerd, M. Morphodynamics of Wave-Dominated Beaches. Camb. Prism. Coast. Futures 2023, 1, e1. [Google Scholar] [CrossRef]
  27. Rector, R.L. Laboratory Study of Equilibrium Profiles of Beaches; US Beach Erosion Board: Washington, DC, USA, 1954. [Google Scholar]
  28. Sunamura, T.; Horikawa, K. Two Dimensional Beach Transformation Due to Waves. In Proceedings of the Coastal Engineering 1974, Copenhagen, Denmark, 24–28 June 1974; pp. 920–938. [Google Scholar]
  29. Guedes, R.M.; Calliari, L.J.; Holland, K.T.; Plant, N.G.; Pereira, P.S.; Alves, F.N. Short-Term Sandbar Variability Based on Video Imagery: Comparison between Time–Average and Time–Variance Techniques. Mar. Geol. 2011, 289, 122–134. [Google Scholar] [CrossRef]
  30. Günaydın, K.; Kabdaşlı, M.S. Investigation of Offshore Bar Geometry under Regular and Irregular Waves. J. Coast. Res. 2005, 212, 374–382. [Google Scholar] [CrossRef]
  31. Luo, E.C.-R. Formation of Beach Profile with the Design Criteria of Seawalls. Civ. Eng. Arch. 2014, 2, 24–32. [Google Scholar] [CrossRef]
  32. Walstra, D.; Reniers, A.; Ranasinghe, R.; Roelvink, J.; Ruessink, B. On Bar Growth and Decay during Interannual Net Offshore Migration. Coast. Eng. 2012, 60, 190–200. [Google Scholar] [CrossRef]
  33. de Kruijf, M.; Slootman, A.; de Boer, R.A.; Reijmer, J.J. On the Settling of Marine Carbonate Grains: Review and Challenges. Earth-Science Rev. 2021, 217, 103532. [Google Scholar] [CrossRef]
  34. Bian, C.; Chen, J.; Jiang, C.; Wu, Z.; Yao, Z. Threshold of Motion of Coral Reef Sediment under Currents in Flume Experiments. Sedimentology 2023, 70, 1723–1740. [Google Scholar] [CrossRef]
  35. Bian, C.; Chen, J.; Jiang, C.; Wu, Z.; Yao, Z.; Liu, J. Experimental Study of the Incipient Motion Threshold of Coral Sediment for Oscillatory Flow. Ocean Eng. 2023, 278, 114375. [Google Scholar] [CrossRef]
  36. Chen, J.; Yao, Z.; Jiang, C.-B.; Wu, Z.-Y.; Deng, B.; Long, Y.-N.; Bian, C. Experiment Study of the Evolution of Coral Sand Particle Clouds in Water. China Ocean Eng. 2022, 36, 720–733. [Google Scholar] [CrossRef]
  37. Xu, X. Types of Two-Dimension Sandybeaches and Their Criterion. Ocean. Eng. 1988, 4, 51–62. [Google Scholar]
  38. Jonsson, I.G. Wave Boundary Layers and Friction Factors. In Proceedings of the Coastal Engineering 1966, Tokyo, Japan, 5–8 September 1966; pp. 127–148. [Google Scholar]
  39. Wu, Z. Response Rule of Sandy Beach on Change of Wave Dynamic Factors. Master’s Thesis, Changsha University of Science & Technology, Changsha, China, 2014. [Google Scholar]
  40. Silvester, R.; Hsu, J.R.C. Coastal Stabilization; World Scientific: Singapore, 1997; Volume 14. [Google Scholar]
  41. Kench, P.S.; Brander, R.W. Wave Processes on Coral Reef Flats: Implications for Reef Geomorphology Using Australian Case Studies. J. Coast. Res. 2006, 221, 209–223. [Google Scholar] [CrossRef]
  42. Hardy, T.A.; Young, I.R. Field Study of Wave Attenuation on an Offshore Coral Reef. J. Geophys. Res. Ocean. 1996, 101, 14311–14326. [Google Scholar] [CrossRef]
  43. Nelson, R. Hydraulic Roughness of Coral Reef Platforms. Appl. Ocean Res. 1996, 18, 265–274. [Google Scholar] [CrossRef]
  44. Lowe, R.J.; Falter, J.L.; Monismith, S.G.; Atkinson, M.J. Wave-Driven Circulation of a Coastal Reef–Lagoon System. J. Phys. Oceanogr. 2009, 39, 873–893. [Google Scholar] [CrossRef]
  45. Vetter, O.; Becker, J.M.; Merrifield, M.A.; Pequignet, A.; Aucan, J.; Boc, S.J.; Pollock, C.E. Wave Setup over a Pacific Island Fringing Reef. J. Geophys. Res. Oceans 2010, 115, C12066. [Google Scholar] [CrossRef]
  46. Taebi, S.; Lowe, R.J.; Pattiaratchi, C.B.; Ivey, G.N.; Symonds, G.; Brinkman, R. Nearshore Circulation in a Tropical Fringing Reef System. J. Geophys. Res. Ocean. 2011, 116, C02016. [Google Scholar] [CrossRef]
  47. Becker, J.M.; Merrifield, M.A.; Ford, M. Water Level Effects on Breaking Wave Setup for Pacific Island Fringing Reefs. J. Geophys. Res. Oceans 2014, 119, 914–932. [Google Scholar] [CrossRef]
  48. Pomeroy, A.; Lowe, R.; Symonds, G.; Van Dongeren, A.; Moore, C. The Dynamics of Infragravity Wave Transformation over a Fringing Reef. J. Geophys. Res. Oceans 2012, 117, C11022. [Google Scholar] [CrossRef]
  49. Lentz, S.J.; Churchill, J.H.; Davis, K.A.; Farrar, J.T. Surface Gravity Wave Transformation across a Platform Coral Reef in the Red Sea. J. Geophys. Res. Ocean. 2016, 121, 693–705. [Google Scholar] [CrossRef]
  50. Watts, G.M. Laboratory Study of Effect of Varying Wave Periods on Beach Profiles; US Beach Erosion Board: Washington, DC, USA, 1954. [Google Scholar]
  51. Lin, C.; Hwung, H.H. External and Internal Flow Fields of Plunging Breakers. Exp. Fluids 1992, 12, 229–237. [Google Scholar] [CrossRef]
  52. Chang, K.-A.; Liu, P.L.-F. Experimental Investigation of Turbulence Generated by Breaking Waves in Water of Intermediate Depth. Phys. Fluids 1999, 11, 3390–3400. [Google Scholar] [CrossRef]
  53. Celikoğlu, Y.; Yüksel, Y.; Kabdaşlı, M.S. Longshore Sorting on a Beach under Wave Action. Ocean Eng. 2004, 31, 1351–1375. [Google Scholar] [CrossRef]
Figure 1. Conceptual diagram of the coral reef ecosystem. The red dashed area represents the research area in this paper. Reproduced from Duvat et al. [14].
Jmse 12 00287 g001
Figure 2. Classification of equilibrium beach profiles (after Sunamura and Horikawa [28]). The brown dashed line bit the initial beach profile, the brown solid line is the profile when the beach reaches equilibrium under wave action, the blue solid line is the still-water level, and the black arrow is the direction of sediment movement.
Jmse 12 00287 g002
Figure 3. Schematic diagram showing the shape characteristics of a sand bar.
Jmse 12 00287 g003
Figure 4. Schematic diagram of the experimental setup. (a) Plan view; (b) side view. Photographs were obtained from the grey stippled area.
Jmse 12 00287 g004
Figure 5. Snapshots (25 fps) of the wave breaking process and the accompanying change in the coral sand beach profile for a water depth of h = 0.3 m, a wave height H = 0.07 m, and wave period of T = 1.8 s. (a) t = 0 s, (b) t = 8.84 s, (c) t = 9.56 s, (d) t = 10.8 s, (e) t = 10 min, (f) t = 30 min. The yellow dashed line is the initial beach profile and the red solid line is the beach profile under wave action.
Jmse 12 00287 g005
Figure 6. Changes in the coral sand beach profile when affected by regular waves between 30 and 300 min. (a) H = 0.09 m, T = 1.5 s; (b) H = 0.05 m, T = 1.5 s.
Jmse 12 00287 g006
Figure 7. Changes in sediment grain size distributions and the bed elevation after being subjected to regular waves (a,b). X0 and Y0 represent the location of the original point. The value of Y/Y0 indicates siltation and scour (Y/Y0 > 0 means siltation, Y/Y0 < 0 means scour). The value of X/X0 indicates the position relative to the mean water level (i.e., when X/X0 > 1.0 the position is above the mean water level).
Jmse 12 00287 g007
Figure 8. Comparison of the experimental results with the different limits of classification for equilibrium beach profiles. (a) Classification by means of Equation (3) of Sunamura and Horikawa (1975) [28]; (b) classification conducted using Equation (4) of Xu (1988) [37]; (c) classification using Equation (5) of Wu (2014) [39].
Jmse 12 00287 g008
Figure 9. Comparison of our experimental data with the modeled data predicting the distance from the crest point to the original point (Xbc) and water depth at the bar crest (hbc) proposed by Günaydın and Kabdaşlı [30].
Jmse 12 00287 g009
Figure 10. Comparison of the experimental results of the geometric characteristics of the equilibrium point generated herein with the modified prediction models. The red dashed line is the result of the corrected equation.
Jmse 12 00287 g010
Figure 11. Comparison of geometric characteristics of bar crests from the experimental data with the modified prediction models. The red dashed line is the result of the corrected equation.
Jmse 12 00287 g011
Figure 12. Comparison of the geometric characteristics of the closure point of the experimental results with the modified prediction models. The red dashed line is the result of the corrected equation.
Jmse 12 00287 g012
Table 1. Most used classification models for equilibrium quartz sand beach profiles.
Ref.Erosional BeachTransient BeachDepositional BeachEquation No.
Sunamura (1975) [28] ( H / L ) ( D 50 / L ) 0.67 ( tan β ) 0.27 > 8 4 < ( H / L ) ( D 50 / L ) 0.67 ( tan β ) 0.27 < 8 ( H / L ) ( D 50 / L ) 0.67 ( tan β ) 0.27 < 4 (3)
Xu (1988) [37] ( H L ) 0.5 ( g H ω ) ( f w + tan β ) > 0.29 ( H L ) 0.5 ( g H ω ) ( f w + tan β ) < 0.29 0.22 < ( H L ) 0.5 ( g H ω ) ( f w + tan β ) < 0.35 (4)
Wu (2014) [39] ξ > 0.556 ( g H ) 0.5 ω ( f w + tan β ) ξ < 0.556 ( g H ) 0.5 ω ( f w + tan β ) 0.394 ( g H ) 0.5 ω ( f w + tan β ) ξ 0.867 ( g H ) 0.5 ω ( f w + tan β ) (5)
Table 2. Currently used equations for the determination of bar parameters.
LocationGeometric ParametersSilvester and Hsu [40]Equation No.
Equilibrium pointXbe X b e / L 0 = 0.96 ( H / L ) / tan β (6)
hbe\
Bar crestXbc X b c / L 0 = 0.022 + 1.508 ( H L ) / tan β + 0.14 [ ( H L ) / tan β ] 2 (7)
hbc h b c / ( L tan β ) = 0.0269 + 0.391 X b c / L (8)
Closure
point
Xbd\
hbd\
LocationGeometric ParametersGünaydın and Kabdaşlı [30]EquationNo.
Equilibrium pointXbe X b e / L = 113.98 ( tan β H / L ) 1.9762 (9)
hbe h b e / L = 11.87 [ tan β ( H / L ) 0.5 ] 1.7626 (10)
Bar crestXbc X b c / L = 64.966 ( tan β H / L ) 1.6754 (11)
hbc h b c / L = 3.2041 ( tan β H / L ) 1.413 (12)
Closure
point
Xbd X b d / L = 1.4843 ( h b d / X b d ) 0.91 (13)
hbd h b d / L = 102.33 [ tan β ( H / L ) 0.5 ] 1.1813 (14)
Table 3. Summary of hydraulic characteristics measured over the coral reef flats.
Ref.Research LocationWave Height (m)Water Depth (m)Wave Period (s)
Hardy and Young [42]The Great Barrier Reef0.2~1.30.24~2.972.1~9.5
Nelson [43]John Brewer Reef0.1~0.70.8~2.73.0~5.2
Lowe et al. [44]Kaneohe Bay0.4~0.61.2~2.3/
Vetter et al. [45]Ipan, Guam0.0~0.60.3~0.6/
Taebi et al. [46]Ningaloo Reef0.0~0.51.0~2.0
Becker et al. [47]The College of the Marshall Islands0.0~0.30.4~0.86~23.7
Roi-Namur0.0~0.20.4~0.84.3~20.9
Ipan, Guam0.0~0.10.5~0.74.9~19.6
Pomeroy et al. [48]Ningaloo Reef0.0~0.21.0~2.010~20
Lentz et al. [49]Red Sea0.0~0.20.3~1.24~8
Table 4. Summary of scale-reduction factors for the experiments and utilized test conditions.
ParametersNatural Range Scale FactorExperimental Set Value
SedimentParticle size, D (mm)>240.585
HydraulicsWave height, H (m)0.0–1.040.04, 0.05, 0.07, 0.08, 0.11, 0.12, 0.13, 0.14, 0.15, 0.16
Water depth, h (m)0.3–3.040.3
Wave period, T (s)2.0–2021.4, 1.5, 1.6, 1.7, 1.8
Table 5. Modifications of equations for geometric parameters of coral sand bars based on models provided by Günaydın and Kabdaşlı [30] and Silvester and Hsu [40].
LocationGeometric ParametersSilvester and Hsu [40]R2Günaydın and Kabdaşlı [30]R2
Equilibrium pointXbe X b e / L = 0.6 ( H / L ) / tan β 0.75 X b e / L = 72.51 ( tan β H / L ) 1.433 0.89
hbe\ h b e / L = 11.792 [ tan β ( H / L ) 0.5 ] 1.555 0.88
Bar crestXbc X b c / L = 0.012 + 1.219 ( H L ) / tan β 0.804 [ ( H L ) / tan β ] 2 0.75 X b c / L = 8.113 ( tan β H / L ) 0.78 0.72
hbc h b c / ( L tan β ) = 0.0249 + 0.7719 X b c / L 0.74 h b c / L = 0.219 ( tan β H / L ) 0.976 0.70
Closure
point
Xbd\ X b d / L = 0.058 ( h b d / X b d ) 0.937 0.96
hbd\ h b d / L = 25.343 [ tan β ( H / L ) 0.5 ] 1.651 0.86
Disclaimer/Publisher’s Note: The statements, opinions and data contained in all publications are solely those of the individual author(s) and contributor(s) and not of MDPI and/or the editor(s). MDPI and/or the editor(s) disclaim responsibility for any injury to people or property resulting from any ideas, methods, instructions or products referred to in the content.

