Article

Experimental Parametric Study on the Primary Efficiency of a Fixed Bottom-Detached Oscillating Water Column Wave Energy Converter in Short-Fetch Sea Conditions

1
AM3 Spin-Off s.r.l. & A-MARE Joint Laboratory, Florence University, 50142 Florence, Italy
2
LABIMA—Maritime Engineering Laboratory, Department of Civil and Environmental Engineering, University of Florence, 50139 Florence, Italy
*
Author to whom correspondence should be addressed.
J. Mar. Sci. Eng. 2024, 12(12), 2167; https://doi.org/10.3390/jmse12122167
Submission received: 10 October 2024 / Revised: 15 November 2024 / Accepted: 22 November 2024 / Published: 27 November 2024
(This article belongs to the Special Issue Design, Modeling, and Development of Marine Renewable Energy Devices)

Abstract

:
The Oscillating Water Column (OWC) represents a highly promising approach for wave energy conversion. This study presents laboratory experiments conducted on a fixed, bottom-detached OWC device to evaluate the impact of various design parameters (specifically, turbine damping, front wall draft, and chamber length in the direction of wave propagation) on the device’s capture width ratio. Despite the extensive research over the past few decades on OWC devices, most studies and field-tested prototypes have been designed for long-fetch sea conditions. Consequently, these devices tend to be larger in size and have higher rated power outputs. In contrast, short-fetch sea conditions necessitate tuning the OWC to the shorter dominant wave frequencies, which calls for the development of smaller devices and specialized turbines, highlighting the need for focused research. This work specifically addresses short-fetch sea conditions, which are representative of moderate wave climates, such as those found in the central Mediterranean region. The study identifies a maximum capture width ratio of approximately 73%. The experimental dataset generated can serve as a benchmark for numerical models under these specific conditions and assist in the development of air turbines optimized for effective performance in short-fetch wave climates.

1. Introduction and Motivations

The Oscillating Water Column (OWC) wave energy converter (WEC) is one of the most promising devices for the exploitation of wave energy [1,2]. It is a rigid structure that incorporates a hollow chamber partially immersed in the sea, which can constitute either a floating or a fixed device. In the case of fixed OWC-WECs, the external wave motion propagates its dynamical effects inside the chamber through the lower opening, inducing a pulsating pressure field on the internal water column, causing its oscillation. The oscillation of the water column acts as a piston on the upstanding air column, generating an alternating airflow through a conduit connected with the atmosphere. The power of the wave motion is converted into the power of the alternating airflow. The efficiency of this process is called hereafter primary efficiency. Most often, fixed OWC-WECs are proposed as bottom-founded onshore devices. However, a fixed bottom-detached configuration may be more economically viable in deep waters, particularly when supported by piles or integrated into tension-leg moored multipurpose platforms. In this latter case, the frontal and back walls can be asymmetrical, with the frontal wall being relatively short to allow wave-induced dynamic pressure to excite the internal water column, and the back wall being relatively long to intercept most of the wave energy distributed along the water depth. This work focuses on fixed bottom-detached OWC-WECs.
The alternating airflow power can be harvested with self-rectifying air turbines [3] and electricity can be generated with electrical generators. This further assembly of devices constitutes the Power Take Off (PTO) component of the OWC-WEC. The alternating airflow could also be rectified via non-return air valves. This approach, although of proven effectiveness and robustness for small devices, e.g., navigation buoys [4,5], is unpractical for larger devices [6,7] and was progressively abandoned. The PTO conversion processes have their own efficiency (i.e., the secondary efficiency). To maximize the overall OWC-WEC performance, from waves to wire, the maximization of both the primary and the secondary efficiencies is needed.
Under the excitation of given wave conditions, the dynamics of the water column, and consequently the primary efficiency, depends on its hydrodynamic and inertial properties, which are in turn functions of its shape and size [8,9,10]. Each water column has its specific natural frequency of oscillation, and the resonant behaviour occurs when the frequency of the incident wave approaches the device’s natural frequency. A possible approach to promote resonance with given wave conditions is that of varying the length of the water column, thus altering its inertial properties. The proposals for L- or U-shaped OWCs [5,11], which deviate from the conventional prismatic design, are grounded in this fundamental principle. Moreover, since the wave frequencies are strongly related to the fetch length and the size of the storms that characterize a given sea basin, tuning the OWC size to site-specific wave conditions is fundamental to maximize the primary efficiency.
Concerning the PTO, a given turbine imposes a specific relation between the airflow and the air pressure drop [12], and the water column adapts its dynamics to such conditions. Therefore, designing a turbine that optimizes the airflow-pressure drop relationship to maximize primary efficiency, while operating at its highest possible efficiency, is crucial.
Although the OWC concept for wave energy harvesting was proposed several decades ago, only a limited number of full-size prototypes have been built for research or demonstration purposes [13,14,15,16,17].
Almost all the studies and the field-tested prototypes of OWC-WECs concern long-fetch sea conditions, i.e., long waves; therefore, the size of the devices and the rated powers are relatively big. In short-fetch sea conditions, tuning the OWC to the characteristic wave frequencies implies the development of smaller devices and specific turbines, and thus, focused research is mandatory. The short-fetch sea condition is the framework of the present work.
Economic, reliability, and operability concerns remain key factors limiting the commercial diffusion of the OWC technology. The development of floating and offshore OWC devices presents additional challenges, including mooring, energy transmission, survivability in extreme waves, and maintenance. Moreover, the development of multifunctional nearshore structures, such as harbour breakwaters embodying OWC or other WECs, assures the sharing of construction costs decreasing the capital and the operational expenses for the energy devices [18,19,20,21]. As a result, the opportunities to locate nearshore energy hotspots [22,23,24,25] and share construction costs with other maritime structures have renewed interest in advancing fixed and nearshore OWC-WEC devices, particularly for niche markets. The sizing of such kind of OWC-WEC for site-specific wave conditions, along with the optimization of the primary efficiency, appears as one of the most urgent and fundamental improvements to achieve.
Despite the research activities carried out so far on fixed, nearshore OWCs, fundamental research is still needed, particularly concerning the site-specific dimensioning and the optimization of the primary efficiency joined with the optimization of the turbine efficiency. As aforementioned, site-specific studies most frequently refer to sea states representative of highly energetic wave climates (e.g., Oceanic ones), characterized by higher and longer waves than those of short-fetch (or moderate) wave climates such as the Mediterranean or the North Sea.
Laboratory experiments are crucial for analyzing the performance of the device, especially in capturing non-linear phenomena, turbulence, and real fluid effects often overlooked in theoretical or numerical approaches. They are also essential for benchmarking and validating Computational Fluid Dynamics (CFD) models, which may be used for refined optimizations of OWC-WECs.
With the aim of contributing to the development of the OWC-WEC and providing the research community with a specific database of laboratory results for benchmarking CFD models, this work focuses on near-shore, fixed, and prismatic OWCs equipped with a conventional PTO system (i.e., an air turbine), under short-fetch sea conditions. This work also aims to provide the quadratic relationships between the airflow and the air pressure drop that maximize the primary efficiency. Such quadratic relations are proposed to the mechanical engineers’ research community to support the development of efficient self-rectifying impulse turbines able to provide the same airflow–pressure relation. To the authors’ knowledge, direct measurements of the airflow velocity during the inhalation and exhalation phases are not provided in the literature. The present database includes such measurements, strengthening the possibility of using it to benchmark numerical models.
The paper is structured as follows: An overview of previous laboratory experiments on fixed OWCs is given in Section 2. Section 3 describes the laboratory experiments, including the tested OWC models, wave conditions, and the laboratory methodology. Section 4 presents the results, detailing experimental measurements of the key variables that significantly impact the primary efficiency of the OWC. Conclusions and suggestions for future work are summarized in Section 5.

2. State of the Art of Laboratory Tests on Fixed OWC Devices

Early laboratory experiments on two-dimensional fixed OWCs are documented by Count et al. (1981) [26], Robinson et al. (1981) [27], and Maeda et al. (1985) [28]. In these works, for the first time, the presence of a turbine with a non-linear airflow–pressure drop relation was simulated by using orifices, and the results were compared with linear theory predictions. Sarmento et al. [29] performed laboratory tests on simple two-dimensional OWC geometries to assess the validity of previous linear wave theory predictions [30]. The effect of both linear (e.g., the Wells turbine [31]) and non-linear (i.e., impulse turbines [32,33]) PTOs was tested, respectively, by using a porous filter and an orifice. This experimental approach became the standard for laboratory tests in the following years. In all these early works, simplified geometries were tested under incident waves within the limits of the applicability of linear wave theory.
Later, Sarmento (1993) [34] studied the shoreline PICO-power plant on a 1:35 scale model, with the aim to optimize its geometry under irregular waves representative of the Azores islands; therefore, long-fetch wave conditions were studied. Also. in this case, due to the relatively small-scale ratio, it was preferred to mimic the effect of a Wells turbine on the OWC dynamics instead of including a scaled turbine model. This study showed that for a given size of the OWC device, it is possible to select an optimum value of the air pressure drop induced by the turbine. Moreover, the strong sensitivity of primary efficiency on the OWC front wall draught was highlighted.
In 2007, Morris-Thomas et al. [35] also investigated the importance of geometry on the hydrodynamic performance of a shore-based OWC through laboratory tests (at model scale 1:12.5) under the action of regular waves suitable for description by linear wave theory. The tests focused on the OWC front wall draught and thickness. A square vent located on the roof of the chamber imposed a quadratic relation between the airflow and the pressure drop, simulating the presence of a non-linear turbine. Their results proved that the hydrodynamic performance is not prominently affected by the front wall thickness, and that, for relatively short waves, the OWC efficiency increases when the front wall draught decreases.
Sheng et al. [36] later investigated the primary efficiency using laboratory tests on a fixed cylindrical OWC under regular waves covering a wide range of wave periods (with a ratio of the OWC diameter to the incident wavelength between 0.2 and 0.015). The sensitivity to different non-linear turbines was studied by simulating each turbine with a circular-shaped vent. Several vents were tested, with ratios of their area to the horizontal area of the water column between 0.5 and 2.0%. This study confirmed that the most relevant parameter is the draught of the frontal wall, which strongly influences the OWC natural frequency. The study also highlighted significant practical limitations in sizing the OWC sectional area, recommending that, to prevent sloshing motions, which cause energy losses, the length of the OWC chamber in the direction of the waves should not exceed 1/4 to 1/5 of the incident wavelength.
López et al. [37,38,39] used wave flume tests (at a 1:25 scale) to calibrate and validate a numerical model. The OWC model was tested under both regular waves and irregular waves representative of the western Oceanic coast of Spain, i.e., for long-fetch conditions. Different non-linear turbines were simulated by means of circular vents on the top cover. The authors observed that the primary efficiency increases with the wave steepness at low wave frequencies while decreasing at high wave frequencies. Their results also confirmed the importance of studying the coupling between the chamber and the air turbine to optimize the performance under a specific wave climate (as further explored by the same authors employing numerical modelling in [40,41]).
Iturrioz et al. [42,43] in 2014 developed and validated a CFD model with flume experiments to study the dynamics of a fixed detached OWC. Their laboratory tests were performed with a scale factor of 1:30. Regular and irregular waves were tested, representative of relatively long-fetch seas (with periods up to 17 s at full scale). Also, in this case, different circular vents were used to simulate a non-linear PTO, highlighting the complexity of the flow conditions and relevant differences between the process of air inhalation and exhalation, which could not be simulated by using simplified modelling approaches.
Ning et al. [44] performed laboratory tests on a fixed OWC model to assess the effects of incident regular wave amplitude, chamber length, front wall draught, non-linear turbine simulated with different circular vent sizes, and bottom slope. They explored a range of relative water depths kh (k being the wave number and h the water depth) between 0.85 and 3.6 and wave steepness between 0.006 and 0.1. They found a relevant relation between wave non-linearity and the primary efficiency, with the OWC performance at first increasing with the wave amplitude, reaching a maximum for a certain value and then decreasing. Moreover, the authors found that for low-frequency waves, the OWC performance increases when the chamber width increases. As observed in the previous studies, this study confirmed that a deeper frontal wall leads to a lower resonant frequency and a lower primary efficiency and that the optimal efficiency occurs for a given airflow–pressure drop relation.
In 2016, Vyzikas et al. [45] performed laboratory tests on four different shapes of the OWC device, under regular and irregular waves, to suggest potential shape improvements towards its optimization. In their work, better performance was found when using the so-called U-OWC principle [11], with an increase in the capture with a ratio of up to 30% with respect to the standard OWC, under a specific wave condition. However, since a fixed value of the design parameters (draught, damping, chamber width) was considered for each OWC shape, and this experiment was conducted under a limited set of wave conditions, further studies are needed to generalize these results.
He et al. [46] performed laboratory tests at a 1:25 model scale on a fixed bottom-detached and pile-supported OWC, focusing particularly on the vortex-induced energy losses taking place for different values of the applied PTO damping and of the front wall draught. The tested wave conditions (periods, at full scale, between 5 s and 8 s, and height of 0.9 m) can be considered representatives of short-fetch seas. They found that larger damping levels were preferable to increase energy extraction and reduce vortex-induced energy losses.
Elhanafi et al. [47] performed laboratory tests on three-dimensional 1:50 scale models of bottom-detached tension-legs moored OWCs. The effect of a non-linear air turbine was simulated with the usual approach of circular vents. The hydrodynamic conditions tested were representative of the Bass Strait in southern Australia, with periods between 7 and 14 s and heights between 2.5 and 5 m (i.e., a relatively long-fetch wave climate). The impact on the primary efficiency of the airflow–pressure drop relation applied by the turbine and of the device geometry was studied. The authors confirmed again that the turbine characteristics are crucial and fundamentally related to the wave climate, and that an increase in device performance can be achieved by adopting asymmetric back and front walls.
Laboratory experiments at a relatively large scale (1:5–1:9) were performed by Viviano et al. [48], with the aim of investigating the wave reflection coefficient (in random wave conditions) for OWCs integrated into vertical breakwaters. A value of the circular vent size which minimizes the reflection coefficient (to a value of 0.5) was found. The same dataset was later used to formulate prediction formulae of wave loads acting on the OWC front wall [49].
Ashlin et al. [50] studied an array of five OWCs integrated into a detached breakwater with a set of laboratory tests at a 1:20 model scale. They considered regular waves only and studied the effect of different wavelengths, steepness, and spacing between the chambers. The authors found relevant three-dimensional effects of wave convergence and focusing in front of the array, causing an increase in the absorbed wave power compared to the case of an isolated device. The importance of wave concentration phenomena has also been experimentally studied by David et al. [51], who tested a 1:20 scaled model of a bottom-standing OWC with different inclinations of vertical walls located in front of the OWC model resembling collectors to focalize the incident wave energy.
Perez-Collazo et al. [52], in 2018, tested the response of a 1:37.5 scale model of a semi-cylindrical OWC fixed to the monopile substructure of a hybrid wind–wave energy converter under irregular and regular wave conditions characteristic of the Atlantic area of north-west Spain. For this OWC design, a maximum capture width ratio of around 25% was obtained. The results were later used to validate a linearized model based on potential wave theory [53].
Zabihi et al. [54] tested a fixed offshore OWC model at a scale of 1:15, under irregular waves with significant heights between 1.5 and 4.5 m at full scale, and peak periods between 6 and 10 s. The authors studied the sensitivity of the primary efficiency to the main design parameters (i.e., front wall draught and turbine damping), highlighting relevant non-linear effects related to the incident wave heights, with lower performance for higher waves. For fixed wave parameters, the shape of the incident wave spectrum was found to affect the primary efficiency, with better performance for the Pierson–Moskowitz spectrum rather than the JONSWAP spectrum.
Çelik and Altunkaynak [55] performed a test campaign on a fixed OWC (model scale 1:30) varying the diameter of the circular vent simulating the turbine, the chamber draught, and the incident wave steepness. Regular waves were tested, having a full-scale height between 1.2 and 3.6 m and periods of 6 to 10 s. The authors confirmed that the optimal turbine-applied damping for the chamber depends on both the incident wave steepness and the chamber draught.
Later, Ning et al. [56] tested a 1:20 scale model of a fixed, dual-chamber OWC device, assessing the effect of its width, draught, and incoming wave conditions on performance. A fixed-opening circular vent was used to reproduce the turbine behaviour. The tested wave conditions (wave height of 1.2 m and periods ranging between 5 and 10 s at full scale) can be representative of short-fetch wave climates. The authors found that dual-chamber devices may have better performance than single-chamber ones, with an increased effective frequency bandwidth. They further stressed the fundamental relevance of sizing the device according to the reference wave climate.
In 2020, Lopez et al. [57] performed laboratory tests on a two-dimensional model of a fixed, breakwater-integrated OWC at a scale of 1:25. The focus of the tests was evaluating air compressibility scale effects (previously discussed, e.g., in [58,59]) for a device equipped with a circular vent-simulated non-linear PTO. For this purpose, the OWC chamber that was tested was also connected to an external air volume reservoir. A wide range of wave conditions were tested (heights of 0.5–2 m and periods of 5–15 s at full scale). Differences in the primary efficiency up to 30% due to air compressibility were noticed in such a study. The authors also found a significant influence of the turbine-applied damping and the wave height on the efficiency, both governed by the incident wave period.
Liu et al. [60] performed flume experiments on a fixed rectangular-shaped OWC model (chamber planar size: 0.6 × 0.8 m) including a scaled model of an impulse turbine (with a tip diameter of 11.8 cm), tested at different rotational speeds. Both the primary and the secondary efficiencies were measured, with peak values of 67% and 24%, respectively. The authors concluded that, due to manufacturing complexity, the tested turbine size could not be further reduced to match the optimal damping required for the primary efficiency maximization.
Zhao et al. [61] experimentally investigated the performance of a single-, dual-, and triple-chamber fixed OWC, performing Froude-scaled tests at a scale of 1:20 under regular waves with periods of 5–8 s and a height of 1 m. The authors found that the capture width ratio of the multi-chamber device is higher than that of the single-chamber configuration. In 2023, Sun et al. [62] performed tank tests on a bottom fixed OWC equipped with an orifice (ratio of the orifice area to the horizontal cross-sectional area of the air chamber of 0.66%) to reproduce a quadratic PTO. The authors underlined relevant 3D effects and a strong sensitivity of the device’s performance to the incident wave direction (with relative decreases in the capture with up to 20% for a variation of 30° in the incident wave direction). More recently, Liu et al. [63] compared flume and tank tests of a fixed, isolated OWC model Froude-scaled at 1:15, concluding that a decrease in the performance of about 20% was observed in tank tests. The OWC model included a small-scale self-rectifying air turbine as PTO, and it is also proposed for a correction method to be applied to the turbine performance to account for the unavoidable distortions in the Reynolds number between the model and prototype. In this study, however, the size of the turbine model was not optimized to match the OWC chamber’s optimal functioning, which resulted in a relatively low capture width ratio.
From the previous studies reviewed, the following can be stressed:
  • The hydrodynamic and energy-harvesting performances are still mainstream in the research related to OWC devices. Site-specific studies are fundamental, and most of the previous studies refer to long-fetch wave conditions which may be significantly different from short-fetch ones (e.g., those of the Mediterranean or North Sea).
  • Matching studies between the chamber and PTO damping are still needed to provide the manufacturer with the target characteristic functioning of the air turbine to be designed to maximize both the primary and secondary efficiency of the device. Most of the studies on the OWC plant use the orifice or porous media to represent the PTO, given the scaling issues unavailable for the air turbine component. In these studies, the PTO is often characterized in terms of opening ratios only (i.e., the ratio of the area of the orifice to that of the horizontal cross-section of the OWC chamber). The damping coefficient, establishing the relation between the air chamber pressure and airflow rate, is often disregarded, but it could provide more meaningful information for the air turbine’s manufacturing.
The present study aims to provide a database which contributes to fulfil such gaps.

3. Description of Laboratory Tests

Laboratory experiments were carried out at the Maritime Engineering Laboratory (LABIMA) of the Civil and Environmental Department (DICEA) of Florence University, and the OWC model was tested in the LABIMA Wave-Current Flume 1 (WCF1). The WCF1 is 37 m long and 0.80 m wide and has a maximum operational water depth of 0.60 m. Wave motions are generated by a piston-type wave maker and absorbed at the other end of the wave flume through a porous structure.

3.1. Model Description

A three-chamber OWC assembly was tested in the flume (Figure 1, left). The three adjacent OWC chambers, equipped with two flaps connected at their sides (9 cm wide each) to completely occupy the transversal cross-section of the wave flume, formed the 78 cm-wide model. The assembly was rigidly fixed to the fume with an external support structure (Figure 1). The three chambers have identical dimensions and are equipped with the same cylindrical vent duct to mimic the PTO.
Each OWC chamber is a hollow, prismatic, and rectangular-shaped box with vertical walls (Figure 1, left). The assembly was built by using Perspex sheets 8–10 mm thick to allow for the observation of the water column kinematic behaviour inside the OWC chamber during the tests. The cylindrical vent ducts have a length of 10 cm and different diameters. To avoid air losses affecting the behaviour of the device, the air chamber was made water- and airtight by using silicone as sealing. Only the central OWC chamber was equipped with sensors for measuring the fundamental quantities for the analysis of the primary efficiency. Given the fundamentally two-dimensional nature of the wave–structure interaction expected in the tests in the wave flume, we may assume that the dynamics in the central OWC chamber is identical to that in the side chambers, providing results representative of a hypothetically infinitely wide multi-chamber system.

3.2. Variable Model Design Parameters for the Parametric Study

Owing to their key role, as described by the state-of-the-art literature reviewed in Section 2, this work focused on the evaluation of the effect of the following:
(i)
3 sizes of the chamber length, W;
(ii)
3 values of the front wall draught, D;
(iii)
9 circular vent duct diameters, V, with an aperture equal to 0.5%, 1%, and 2% of the OWC horizontal section area (as further described in Section PTO Modelling).
Overall, 36 OWC alternatives were studied—comprising the 9 alternatives in the absence of the vent—and each configuration was tested under different wave conditions, for a total of 288 tests. During each test, the characteristics of each OWC model composing the three-chamber assembly were varied together, i.e., the dimensions and top-cover vent duct size of the lateral chambers were also varied similarly to that of the central one.
The other design parameters of each OWC model in the assembly had fixed values, as follows: the chamber width, B, was 0.20 m; the freeboard, Fc, was 0.16 m above the still water level; the flume water depth was 0.50 m; the assembly was detached from the flume bottom at about 0.21 m; and the draught of the back wall was 0.29 m below the still water level (SWL). The draught of the back wall was chosen to allow for the interception of about 90% of the incident wave power along the water depth, in the tested wave conditions, promoting the wave reflection, thus amplifying the water column oscillations. The values of fixed and varied design parameters are summarized in Table 1.

PTO Modelling

The effect of a self-rectifying impulse turbine, conceived to equip the OWC at the prototype scale, is reproduced using a circular vent duct on the top cover of each OWC chamber. This study investigates different relations between the air pressure drop and the airflow rate, obtained by varying the vent diameter (as in Table 1). By using circular vents, non-linear PTOs having a quadratic relation between the airflow rate, QOWC, and the air chamber pressure POWC were simulated. The experimental measurements of such functional dependence (Figure 2) demonstrate the effectiveness of this laboratory technique for reproducing non-linear PTOs. It is possible to fully define the PTO associated with each vent duct diameter V as a damping coefficient, K = P O W C / Q O W C (with a determination coefficient R2 higher than 0.8 for each case). It is worth noting that a relevant asymmetry is observed between the inhalation phase and the exhalation phase in the laboratory tests (with K determining the best fit for the exhalation phase which is always lower than that for the inhalation phase, with relative differences between 7 and 30%). The damping coefficients calculated from the instantaneous values of QOWC and POWC measured in the laboratory are reported in Table 2, for both the inhalation and the exhalation phase. In the following, we will refer to the K value representing the best fit for the exhalation phase only (K1–K9).
Furthermore, the experimental measurements proved that the damping coefficient cannot be correlated to the ratio between the vent duct area and the OWC horizontal section area: even when the same ratio is imposed, the measured damping coefficient (i.e., the simulated PTO) can be extremely different if a different vent duct size is considered. The damping coefficient is very well correlated to the vent duct diameter, as it can also be modelled by the Darcy–Weisbach equation for head pressure losses (Equation (1)).
Δ P ρ g = λ V 1 2 g Q 2 Ω 2
In the present case, Δ P = P O W C and Q = Q O W C , and so K = 2 2 ρ λ / π   V 5 2 , where V is the vent duct diameter and λ is the function of duct roughness and also of the Reynolds number when the flow regime is not fully turbulent.

3.3. Instrumentation and Data Acquisition

The wave motion time series along the flume were measured by means of six ultrasonic distance sensors (wave gauges, WGs) at a sampling frequency of 1 kHz and positioned as in Figure 3. The first WG (WG1) was placed about 3.5 m from the wave maker, to measure the generated waves, while incident and reflected waves were measured by three wave gauges (WG2, WG3, and WG4) located about one wavelength from the OWC model frontal wall. The transmitted waves were acquired with WG6 and WG7, located behind the model. The position of each WG was fixed based on the two-point method [64], to separate incident and reflected waves.
As for the physical processes involved within the device, the central OWC chamber of the OWC array was equipped as follows (Figure 3, bottom): (i) one ultrasonic distance sensor (WG5) to measure the water column oscillations, ηOWC(t) [m]; (ii) one relative pressure transducer (PT) to measure the air pressure drop POWC(t) [Pa]; and (iii) one hot-wire anemometer (HW) to measure the airflow velocity UOWC(t) [m/s].

3.4. Wave Conditions

The 36 OWC alternatives (27 geometries with different vent diameters and 9 geometries with the vent totally closed) were tested under three regular waves (H = 0.04 m and 0.8 s ≤ T ≤ 1.4 s) and five irregular waves (0.02 ≤ Hs ≤ 0.06 m and 0.9 ≤ Tp ≤ 1.1 s), for a total of 288 tests. The characteristics of the waves are shown in Table 3, with H and f being the wave height and the frequency, respectively, in a water depth of 0.50 m. The values of the regular and the irregular waves were selected referring to sea states representative of a moderate, central Mediterranean wave climate, with specific wave conditions previously assessed in [25] and annual energy distributions among different significant wave heights Hm0 and energy periods Te as in Figure 4. The site, also selected based on an analysis of the nontechnical barriers of environmental, logistical, and social constraints (as discussed in [65]), refers to a location in Central Tuscany, in a water depth of 25 m, and has a mean annual wave power of about 3 kW/m.
Each regular wave test had a duration of 60 s (i.e., about 14–20 wave periods). The five irregular waves tested had a duration of 90 s (i.e., about 80–100 wave periods). In each case, a pre-trigger time of 10 s before wave generation was allotted to record the zero values of each sensor. A JONSWAP wave energy spectrum [66] was chosen, with a peak enhancement factor, γ = 3.3 (representative of fetch-limited wave conditions).
The effective incident wave condition was assessed by generating each wave attack (regular and irregular) in the absence of the model in the flume (W0D0V0 tests) and acquiring the wave motion through an ultrasonic wave probe (WG5) located at the centre of the removed model position, i.e., exactly at the same location where the WG integrated into the OWC model measures the oscillation of its internal free surface. For each wave, the characteristic parameters were measured in a time window during which the local wave motion was fully developed and the reflected wave motion, coming from the passive absorber located at the end of the flume, had not reached the WG position yet. Time domain analysis was used for the regular waves and frequency domain analysis for the irregular waves (Table 3). In the present work, only the analysis of the results obtained for regular wave tests (Wave 1, Wave 2, and Wave 3 in Table 3) are presented. However, the overall set of wave conditions included in the database is introduced here, including irregular waves, aiming to provide the reader with a comprehensive description of the available data which may be further distributed to the research community for numerical modelling benchmarks or for other research-related purposes.

3.5. Data Acquisition and Analysis

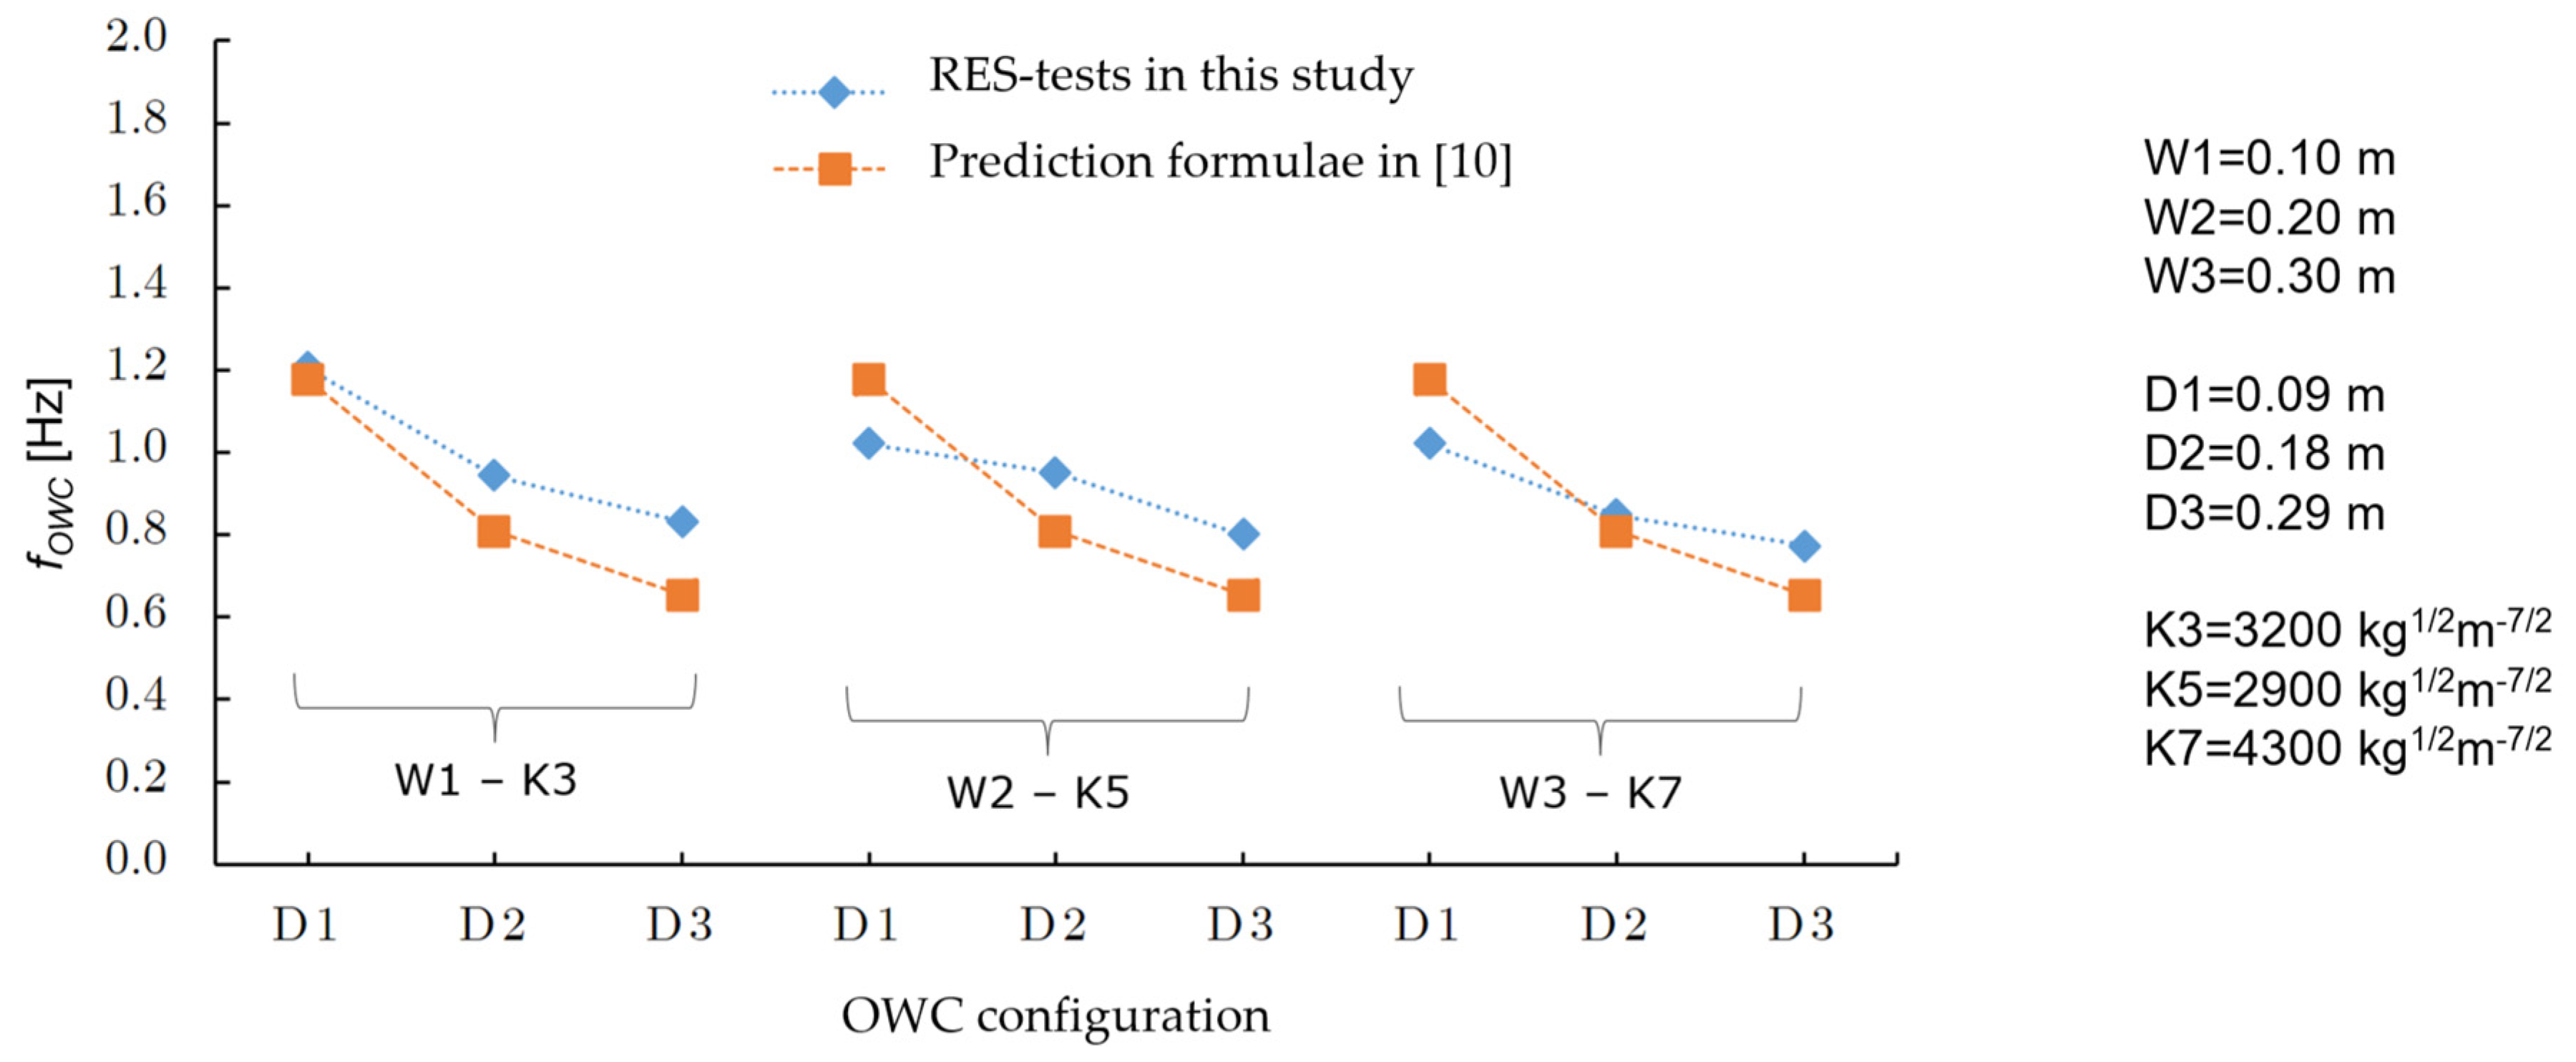
3.5.1. Assessment of the Natural Frequency of the OWC

The performance of an OWC, in terms of wave energy harvesting, may be improved by tuning the OWC device to the incident wave frequency. Generally, the resonance frequency of the device is estimated from the draught of its front wall (D) with an approximated formula [9,10]. In this study, additional free decay tests (called hereafter RES tests) were performed to assess the natural frequency of each OWC alternative. The use of free decay tests to estimate the OWC resonance frequency is quite limited [67,68,69]. Simonetti et al. [67] applied a frequency domain analysis (FDA) to the free-surface time series to directly estimate the resonant frequency. Vyzikas et al. [68] and Çelik and Altunkaynak [69] used a Logarithmic Decrement Method (LDM), finding small differences between the resonant frequencies computed with FDA and LDM for low levels of applied damping [68].
In this work, RES tests were carried out without wave attacks, imposing a free-surface level inside the OWC chamber 0.05 m higher than the external still water level, via air suctioning from the vent duct. After the air suction, the vent duct was closed and then it was suddenly opened, allowing the water column to freely oscillate until the equilibrium state was reached. The time series of free-surface oscillation, ηOWC, was acquired at a sampling frequency of 20 Hz. Both FDA and LDM were comparatively used. In the FDA, the OWC resonant frequency (fOWC = 1/Towc) was determined by applying a Fast Fourier Transform (FFT) to the recorded water column oscillation time series (as exemplarily depicted in Figure 5 for three cases among the whole set of OWC models tested).
In the LDM, the assumption of approximating the OWC with a linear viscous damped system is made [70]. In such a system, the logarithmic decrement δ can be determined using Equation (2):
δ = ln 1 n x t 0 x t n
where x(t0) and x(tn) are the surface displacement at the first and the last peaks considered, respectively. The damping ratio can be determined by the logarithmic decrement δ using Equation (3).
ξ = δ 2 π 2 + δ 2
The damped natural period TdOWC is determined as the average time elapsed between consecutive peaks in the signal (with associated damped natural frequency ωd = 2π/TdOWC). The undamped natural frequency is expressed as Equation (4).
ω n = ω d 1 ξ 2
The undamped natural period of the OWC, TnOWC, is consequently obtained as TnOWC = 2π/ ω n . For the whole set of tested OWC geometries, the differences obtained in the values of TdOWC (obtained via the FDA method) and TnOWC (obtained via the LDM) are lower than 5%. Moreover, for PTO damping K levels lower than 2000 kg1/2 m−7/2, the relative difference between the two methods is always lower than 2%. This highlights a decreasing impact of the inaccuracies in the estimation of the OWC natural frequency arising from the assumption of a linear viscous damping system (as in the LDM) when the non-linear damping applied by the PTO decreases, as expected. However, also for the higher PTO damping levels tested, the differences are negligible. Therefore, the natural period of the OWC is hereafter referred to as TOWC only.
The whole set of measured natural periods for each OWC model tested, obtained by applying FDA and the LDM alternatively, is summarized in Table 4.
Overall, values of TOWC in the range 0.8–1.3 s (corresponding to natural frequencies fOWC of 0.8–1.3 Hz) were found, confirming the crucial effect of the front wall draught on the natural period of each OWC alternative investigated. As expected, a decreasing trend of the natural frequency was observed when the front wall draught increased. For given values of W and D, TOWC is relatively insensitive to the damping coefficient K, with a maximum observed variation of up to 6%.
A first estimation of the natural frequency of a fixed OWC, in which the internal free surface is assumed to move only with a heave motion (as the case at hand), is sometimes obtained with analytical formulae derived in the framework of forced vibrations for linear spring–mass systems (e.g., Equation (5) as in [10,68]).
f O W C = 1 2 π g D + D a
Here, D is the front wall draught and Da is an additional length due to the added mass of the system, here assumed equal to D, as in [68]. To verify to which extent such an equation could provide a reliable estimate of the natural frequency of the OWC device tested in the laboratory, we compared the results obtained with experimental measurements (as in Table 4) with that obtained applying Equation (5) (Figure 6). For the three chamber-length cases (W1–W3), with different front wall draughts (D1–D3) but comparable damping coefficients (i.e., K3 for W1, K5 for W2, and K7 for W3), when using Equation (5), it is possible to note an overestimation of the natural frequency (up to 15%) for the chamber lengths W having the smaller draught (D1) and an underestimation (up to 20%) for draughts D2 and D3 (Figure 6).
For the smallest chamber draught D1, the overestimation of fOWC obtained when using Equation (5) is higher for increasing chamber length W (i.e., for W2 and W3).

3.5.2. Assessment of the OWC Performance

To assess the primary efficiency of the device, many studies refer to the so-called capture width, CW [m] [71], defined as the width of the wave front (assuming uni-directional waves) that contains the same amount of power as that absorbed by the device. CW is thus determined as the ratio of the mean absorbed pneumatic power, Πabs [W], to the averaged wave power associated with the incident waves, Πw [W/m].
C W = Π a b s Π w
For regular waves, the period-averaged incident wave power per unit width [W/m], for a generic water depth h, was evaluated according to the linear theory as in Equation (7):
Π w   r e g = 1 16 ρ g H 2 ω k 1 + 2 k h sinh 2 k h
where ρ is the water density, H is the regular wave height, ω is the wave frequency, and k is the wave number.
It is worth stressing that the averaged incident wave power, Πw [W/m], is computed by using the acquisitions of the ultrasonic wave probe (WG5) located at the centre of the removed model position (i.e., W0D0V0 tests).
The mean absorbed pneumatic power, Πabs [W], was measured by integrating over the duration of the tests, Ttest, the product of the relative air pressure within the OWC chamber, POWC(t), and airflow rate, QOWC(t), throughout the top-cover vent duct as, for instance, in [34]:
Π a b s = 1 T t e s t 0 T t e s t Q O W C t P O W C t d t
Here, the airflow rate QOWC (t) was derived from the time series of air velocity sampled at the centre of the vent duct Umax(t). For this purpose, the average velocity along the duct cross-section Uaverage(t) was calculated based on the value of Reynolds number Re. For Re < 2400, a laminar pipe flow is assumed; hence, Uaverage(t) is calculated as half of Umax(t), while for Re > 2400, the flow inside the pipe is assumed to be fully turbulent and the well-known one-seventh power law [72] is used to compute Uaverage(t) from the velocity profile U(x) along the pipe radius R (Equation (9)).
U ( x ) U m a x = 1 x R 1 / 7
Here, x is the radial coordinate (x = 0 at the centre of the pipe and x = R at the pipe wall). The capture width ratio of the OWC device, CWR, is computed as the ratio of the wave period averaged pneumatic power absorbed by the OWC to the wave period averaged incident wave power, multiplied by the chamber width, B, as defined in Equation (10):
C W R = C W B
In this study, the chamber width B is fixed at a value of 0.20 m (Table 3).

4. Results and Discussion

With the main purpose of facilitating the understanding of the processes involved within the OWC chamber, the sensitivity analysis of the outcomes achieved for the regular wave tests (Wave 1 to Wave 3 in Table 3) is reported in Section 4.1, Section 4.2 and Section 4.3. The performance of the device, for the different geometries tested, is discussed in Section 4.4.

4.1. Effect of the OWC Chamber Length

As shown exemplarily in Figure 7, Figure 8 and Figure 9, the effect of chamber length (in wave propagation direction) on the processes inside the OWC is analyzed by comparing three OWC geometries characterized by different chamber widths (W = 0.10–0.30 m), comparable damping coefficients (K3, K5, and K7), and the same value of the front wall draught (D1 = −0.09 m S.W.L.).
Generally, the water column oscillation measured within the OWC, ηOWC, shows an increasing trend when decreasing the chamber length (Figure 7, from W3 to W1). Comparing ηOWC inside the OWC with ηOWC acquired in the same position and for the same test without the OWC model in the flume (black line in Figure 7), it is possible to observe that for all the regular waves tested, the smallest chamber (W1 = 0.10 m) leads to an amplification of ηOWC. This amplification is directly proportional to the increase in the wavelength from Wave 1 to Wave 3 (Figure 7). With Wave 3, the smallest chamber W1 leads to water column oscillation values approximately 0.03 m higher than that registered without the model in the flume. The medium and largest chamber (W2 = 0.20 m and W3 = 0.30 m, green and red lines in Figure 7, respectively) do not cause an amplification of the free-surface motion registered without OWC; however, it is possible to confirm for both that ηOWC increases with increasing wave periods.
The measurements of airflow velocity UOWC(t) acquired within the vent duct (Figure 8) and air pressure measured within the OWC chamber POWC(t) (Figure 9) show a good consistency with the results for the inner water surface elevation, ηOWC(t). Comparing the results obtained for the longest waves (i.e., Wave 3 in Figure 7c and Figure 8c), the airflow velocity UOWC(t) shows a trend directly proportional to the size of the chamber width, but it is inversely proportional to the inner water surface elevation, ηOWC(t). This could be explained by analyzing, for convenience, the air volume flux obtained for the same regular wave (e.g., Wave 3), for both the largest chamber (W3) and the smallest chamber (W1). In these cases, the air volume flux is denoted as QW3 and QW1, respectively, and under the hypothesis of air incompressibility and of flat motion of the chamber’s inner surface, i.e., absence of sloshing, it can be determined as in Equation (11):
Q W 1 = W 1 · B · η W 1 ( t ) T / 2 ;   Q W 3 = W 3 · B · η W 3 ( t ) T / 2
where W1 = 0.10 m and W3 = 0.30 m are the chamber widths to be compared, T = 1.4 s is the period of Wave 3, and B = 0.20 m is the chamber width perpendicular to the wave propagation direction.
From the air volume flux ratio (Equation (12)), it is possible to highlight the correlation with the water column oscillation registered inside W3 and W1, denoted as ηW3(t) and ηW1(t), respectively.
Q W 3 Q W 1 = W 3 · η W 3 ( t ) W 1 · η W 1 ( t )
Then, since the ratio W3/W1 is equal to 3 and the ratio ηW3/ηW1 is approximately 0.4, it is demonstrated that decreasing the inner water surface elevation while increasing the chamber width (Figure 7c) leads to an increase in air volume flux, as in Equation (13).
Q W 3 = 1.3   Q W 1
The air pressure oscillations POWC(t) (Figure 9) reveal the same trend as the air volume flux for comparable damping coefficients, due to quadratic dependence between QOWC and POWC. Regarding the outcomes achieved for Wave 1 and Wave 2, a negligible influence of chamber width is observed on UOWC(t) and POWC(t) (Figure 8a,b and Figure 9a,b), as the ratio ηW3/ηW1 is about 0.3, and the coefficient in Equation (13) is approximately equal to 1. However, it is confirmed that the influence of chamber width is strictly correlated to the incident wavelength. In the following, ΔηOWC and ΔPOWC represent the amplitude of the oscillation of the free surface and pressure signals inside the chamber (defined as half of the height of the signal, i.e., half of the difference between the peak level and the trough level). The values obtained for the water surface oscillation amplitude ΔηOWC in the OWC, the air pressure oscillation amplitude ΔPOWC, and maximum air volume flux Qmax (obtained from air velocity measurements as detailed in Section 3.5.2) for the tested OWC configurations with comparable damping (i.e., K3, K5, and K7) and different draughts (D1–D3) are reported, respectively, in Figure 10, Figure 11, and Figure 12, which allows for extending the considerations made for draught D1 to the other draughts tested.

4.2. Effect of the OWC Front Wall Draught

As observed during the free decay RES tests, the front wall draught D is of paramount importance in determining the resonance frequency of the device (i.e., increasing D causes a shift in the OWC resonance frequency towards lower values, as reported in Table 4). Therefore, the front wall draught strongly influences the hydrodynamic processes inside the OWC. To assess this effect, the time series obtained for three OWC models characterized by the same chamber length (i.e., W2 = 0.20 m) and damping coefficient (i.e., K6), but different front wall draughts (D1 = −0.09 m, D2 = −0.18 m, and D3 = −0.29 m S.W.L.), are compared in Figure 13. As expected from the RES tests, it is possible to note that under the shortest and the medium wavelengths (Wave 1 in Figure 13a and Wave 2 in Figure 13b), increasing the submergence of the front wall draught leads to a decrease in the water surface elevation ηOWC(t). However, with the longest wave (Wave 3 in Figure 13c), the three draughts show a similar effect.
Comparing ηOWC(t) inside the OWC with ηOWC(t) registered without the model (black line in Figure 13), it is possible to observe that with the medium wavelength (Wave 2 in Figure 13b), the shortest front wall draught (D1) leads to an amplification of the water surface elevation of about 0.02 m. The same amplification is observed for the longest wavelength (Wave 3 in Figure 13c), without any relevant distinction between the different front wall draughts investigated.
The effect of D observed on ηOWC(t) aligns with the results obtained for air pressure POWC(t) (Figure 14) and airflow velocity UOWC(t) (Figure 15). Generally, except in the case of the longest waves (Wave 3 in Figure 14c and Figure 15c), increasing the submergence of the front wall draft leads to a reduction in POWC (t) and UOWC (t). This could be physically attributed to the wave-induced pressure, which decreases exponentially with increasing depth below the still water level (S.W.L.).
The values of ΔηOWC, ΔPOWC, and Qmax for the tested OWC configurations with comparable damping (K3, K5, and K7) for the three draughts tested (D1–D3) in Figure 10, Figure 11 and Figure 12 show that, when the chamber length W and damping K are fixed, the impact of varying the draught is limited for the longest wave condition (Wave 3). However, for other wave conditions, increasing the draught D results in a significant reduction in the amplitude of oscillations in the OWC chamber’s monitored quantities. The dependency of the effect of D on the wave periods derives from the balance between the phenomena of approaching resonance when increasing the wave periods for higher draughts of the OWC chamber, and the reduction in wave-induced pressure acting on the OWC as D increases.

4.3. Effect of the Damping Induced by the PTO

The effect of the damping induced by the air turbine (i.e., the damping coefficient K) can be clearly observed from the results exemplarily obtained for the medium chamber length (W2 = 0.20 m) with the smallest front wall draught (D1 = −0.09 m S.W.L.) tested with different damping coefficients (from K4 = 6700 kg1/2m−7/2 to K6 = 1250 kg1/2m−7/2). As expected, higher damping values lead to a decrease in the free-surface oscillation ηOWC for all the tested wave cases (Figure 16a–c). For Wave 2 and Wave 3 (the longest waves), with the lowest damping K5 and K6, an amplification of ηOWC is observed compared to the condition with no model in the flume. For the shortest wave condition (Wave 1 in Figure 16a), the free-surface oscillation inside the chamber is always smaller than that in the flume without the model, despite the damping value applied. Air pressure in the chamber, POWC(t), and air velocity in the vent duct, UOWC(t), for the same cases are exemplarily reported in Figure 17 and Figure 18. By fixing the geometrical parameters and wave conditions, higher values of K result in higher air pressure within the OWC chamber. The relative impact of changing the damping value is, however, dependent on the incident wave period, e.g., the relative difference between the maximum air pressure POWC with damping levels K4 and K5 is limited to 7% for Wave 2 (Figure 17b), while it is higher than 20% for Wave 1 and Wave 3.
The results obtained for the water surface oscillation amplitude ΔηOWC in the OWC, the air pressure oscillation amplitude ΔPOWC, and maximum air volume flux Qmax (obtained from air velocity measurements as detailed in Section 3.5.2) for all the tested OWC configurations under regular waves are reported, respectively, in Figure 19, Figure 20, and Figure 21.
Generally, the inner water surface oscillation ΔηOWC and the maximum air volume flux Qmax decrease with increasing K: when K increases from 900 to 46,000 kg1/2m−7/2, ΔηOWC decreases from 0.002–0.07 m to 0.001–0.02 m, while Qmax decreases from 3 × 10⁻⁴–5 × 10⁻³ m3/s to 3 × 10⁻⁴–1.5 × 10⁻³ m3/s (Figure 19 and Figure 21). In contrast, an increasing trend of the inner air pressure oscillations ΔPOWC with increasing damping coefficients K (Figure 20), with ΔPOWC = 2–125 Pa for the smallest damping value K9 = 900 kg1/2 m−7/2 and ΔPOWC = 55–460 Pa for the highest damping value K1 = 46,000 kg1/2m−7/2, is observed.
The analysis of the overall dataset confirms what is highlighted in detail for geometry W2D1 in Figure 16, Figure 17 and Figure 18: the relative influence of damping on the OWC functioning is different for different wave conditions, with the greatest relative changes observed for the longest wave (Wave 3, in blue, in Figure 19, Figure 20 and Figure 21). Such a strong dependence of the effect of damping variations on the incident wave period may be related to the distance from the resonance conditions (which are reported in Table 4 for the considered OWC geometries). Previous studies suggest that, in off-resonance conditions, the impact of variations in damping is higher [73].
Moreover, a progressively smaller rate of the decrease in ΔηOWC and increase in ΔPOWC for increasing damping values can be highlighted in the present dataset, as also previously observed in [73].
Considering that the OWC capture width directly depends on the product of air pressure and airflow velocity, as in Equation (5), it is evident that an optimal damping value (i.e., a value that maximizes the capture width) exists for each OWC geometry (as widely confirmed in previous studies, e.g., in [40,44,73].

4.4. Performance of the OWC Device

The overall results obtained for the OWC performance, expressed in terms of dimensionless capture width ratio CWR (Equation (10)) for the tested OWC geometries under regular waves are documented in Figure 22. In this section, dimensionless OWC geometry parameters are also used to present the results to generalize the findings (i.e., the ratio of the chamber length to the incident wavelength, W/L, and of the front wall draught to the incident wave height, D/H).
The highest CWR values in the experimental tests are obtained for the OWC configurations with the following geometries: W2D1K5 (0.19 m, 0.09 m, 3000 kg1/2m−7/2) and W2D1K6 (0.19 m, 0.09 m, 1250 kg1/2m−7/2). CWR = 0.73 is reached for the incident wave with H = 0.04 m and T = 1 s (Wave 2, Figure 22b), while under Wave 1 and Wave 3, CWR is limited to a maximum of 0.55. For fixed values of W and V, lower CWR values are obtained when increasing the front wall draught D, as seen from the trends in POWC and QOWC discussed in Section 4.2. This result is confirmed by several previous studies, e.g., [35,44]. Regardless of the value of the other design parameters, CWR values higher than 0.5 are only obtained for the smallest draught (D1). In the configurations with the highest D (D3 = 0.29 m, D3/H = 7.25), CWR < 0.35 for all tested wave conditions is obtained.
For a given value of the front wall draught D and of the PTO-applied damping K, CWR is always lower for the chamber length W1 (W1/L = 0.03–0.09) than for W2 (W2/L = 0.07–0.19) and W3 (W3/L = 0.11–0.29) (Figure 22). For wave periods T < 1 s (i.e., Wave 1, kh = 3.15 with W2/L = 0.12–0.19, and W3/L = 0.19–0.29), the OWC geometries with chamber width W2 have a CWR about 10% higher than those with chamber W3 (Figure 22a). On the other hand, for OWC geometries with chamber W3, a slightly higher (10–15%) CWR value is obtained for wave period T = 1.4 s (in the case of Wave 3, with kh = 1.2 and W3/λ = 0.11, while W1/L = 0.03 and W2/L = 0.07).
Laboratory tests indicate that higher capture width ratios are obtained for relative chamber width of W/L = 0.07–0.19, relative front wall draught of D/H~2.25, and PTO-applied damping in the range of 900–4300 kg1/2m−7/2. For OWC having a similar range of front wall draught values, an optimal relative length of the OWC chamber W/L in the range of 0.09–0.012 was also confirmed by several previous studies, e.g., in [68,73,74]. A value of the optimal relative chamber length for energy extraction performance of around W/L = 0.10–0.12 was also recently identified for both a fixed, bottom-detached OWC and for a bottom-standing OWC, respectively in [75,76].
Overall, the best-performing OWC geometry obtained from the laboratory tests has a value of the capture width ratio CWR of 0.73. Higher values of CWR could be obtained by further exploring, at a higher resolution, the best-performing range of OWC geometries and PTO damping selected in the present study. Such a second-level optimization approach was adopted, indeed, in the numerical study of Simonetti et al. [73,77], where a maximum CWR of 0.87 was found, which is in line with other experimental results for fixed OWCs, e.g., the laboratory tests of Morris-Thomas et al. [35] (with maximum CWR ~0.8).

Possible Source of Uncertainty in the Estimation of the Performance

It is relevant to underline that several previous studies in the literature [57,59,78,79,80,81] proved that air compressibility may be relevant for full-scale OWC devices, while its effects are improperly reproduced when modelling the device at a small scale, where the airflow behaves as approximately incompressible. This scale effect alters the evaluation of the overall capture with a ratio of the device, with variations in the order of 10–15% for the range of conditions of interest for the present study [59,81]. An even higher alteration of the capture width ratio (in the range of ±30%) was highlighted by [57]. Simonetti et al. [59] also proposed specific corrector factors to be applied to the pressure oscillation amplitude, airflow, and the capture width ratio of an OWC device tested at a small scale to account for the improper scaling of air compressibility. Such correction factors were applied in this study, in order to provide data that could also be used by other researchers for benchmarking numerical wave tanks.
In addition to scale effects, other potential sources of uncertainty in the test campaign may be related to [82]
(i)
the modelling of the PTO component (which, in this case, is schematized only with the damping associated with it);
(ii)
specific laboratory effects such as residual motions inside the flume at the beginning of the test, wave reflections, and transverse non-uniformity;
(iii)
effect of the sensor accuracy, possible calibration errors, and noise on the signal.
A comprehensive evaluation of the uncertainty associated with the laboratory tests is out of the scope of the present work. However, it is useful to consider, as a reference, that an overall error in the measurement of air chamber pressure POWC and in the airflow QOWC in the order of ±2.5% would result in an error in the estimation of CWR in the range of ±5% (i.e., the highest observed CWR in the dataset; CWR = 0.73 could assume values in the range of 0.69–0.76).

5. Conclusions

In the present work, the results of a laboratory test campaign on a fixed and bottom-detached Oscillating Water Column (OWC) device are presented. The study aims to provide a knowledge base for the maximization of the performance of the device in terms of its capture width in short-fetch climates by means of laboratory tests at a small scale and to provide a new dataset for the research community in which 288 different test conditions are available.
The analysis performed on the laboratory results is mainly focussed on investigating the most relevant design parameters (i.e., chamber width W, front wall draught D, and size of the vent simulating the damping of a turbine with a quadratic airflow–pressure relation) affecting the performance of the OWC device. The key results and the implications of the laboratory tests are summarized as follows:
(i)
The natural frequency fOWC of the tested OWC device, as resulting from specifically conceived laboratory tests, is in the range of fOWC = 0.6–1.0 Hz. The value of fOWC is mainly determined by its front wall draught D.
(ii)
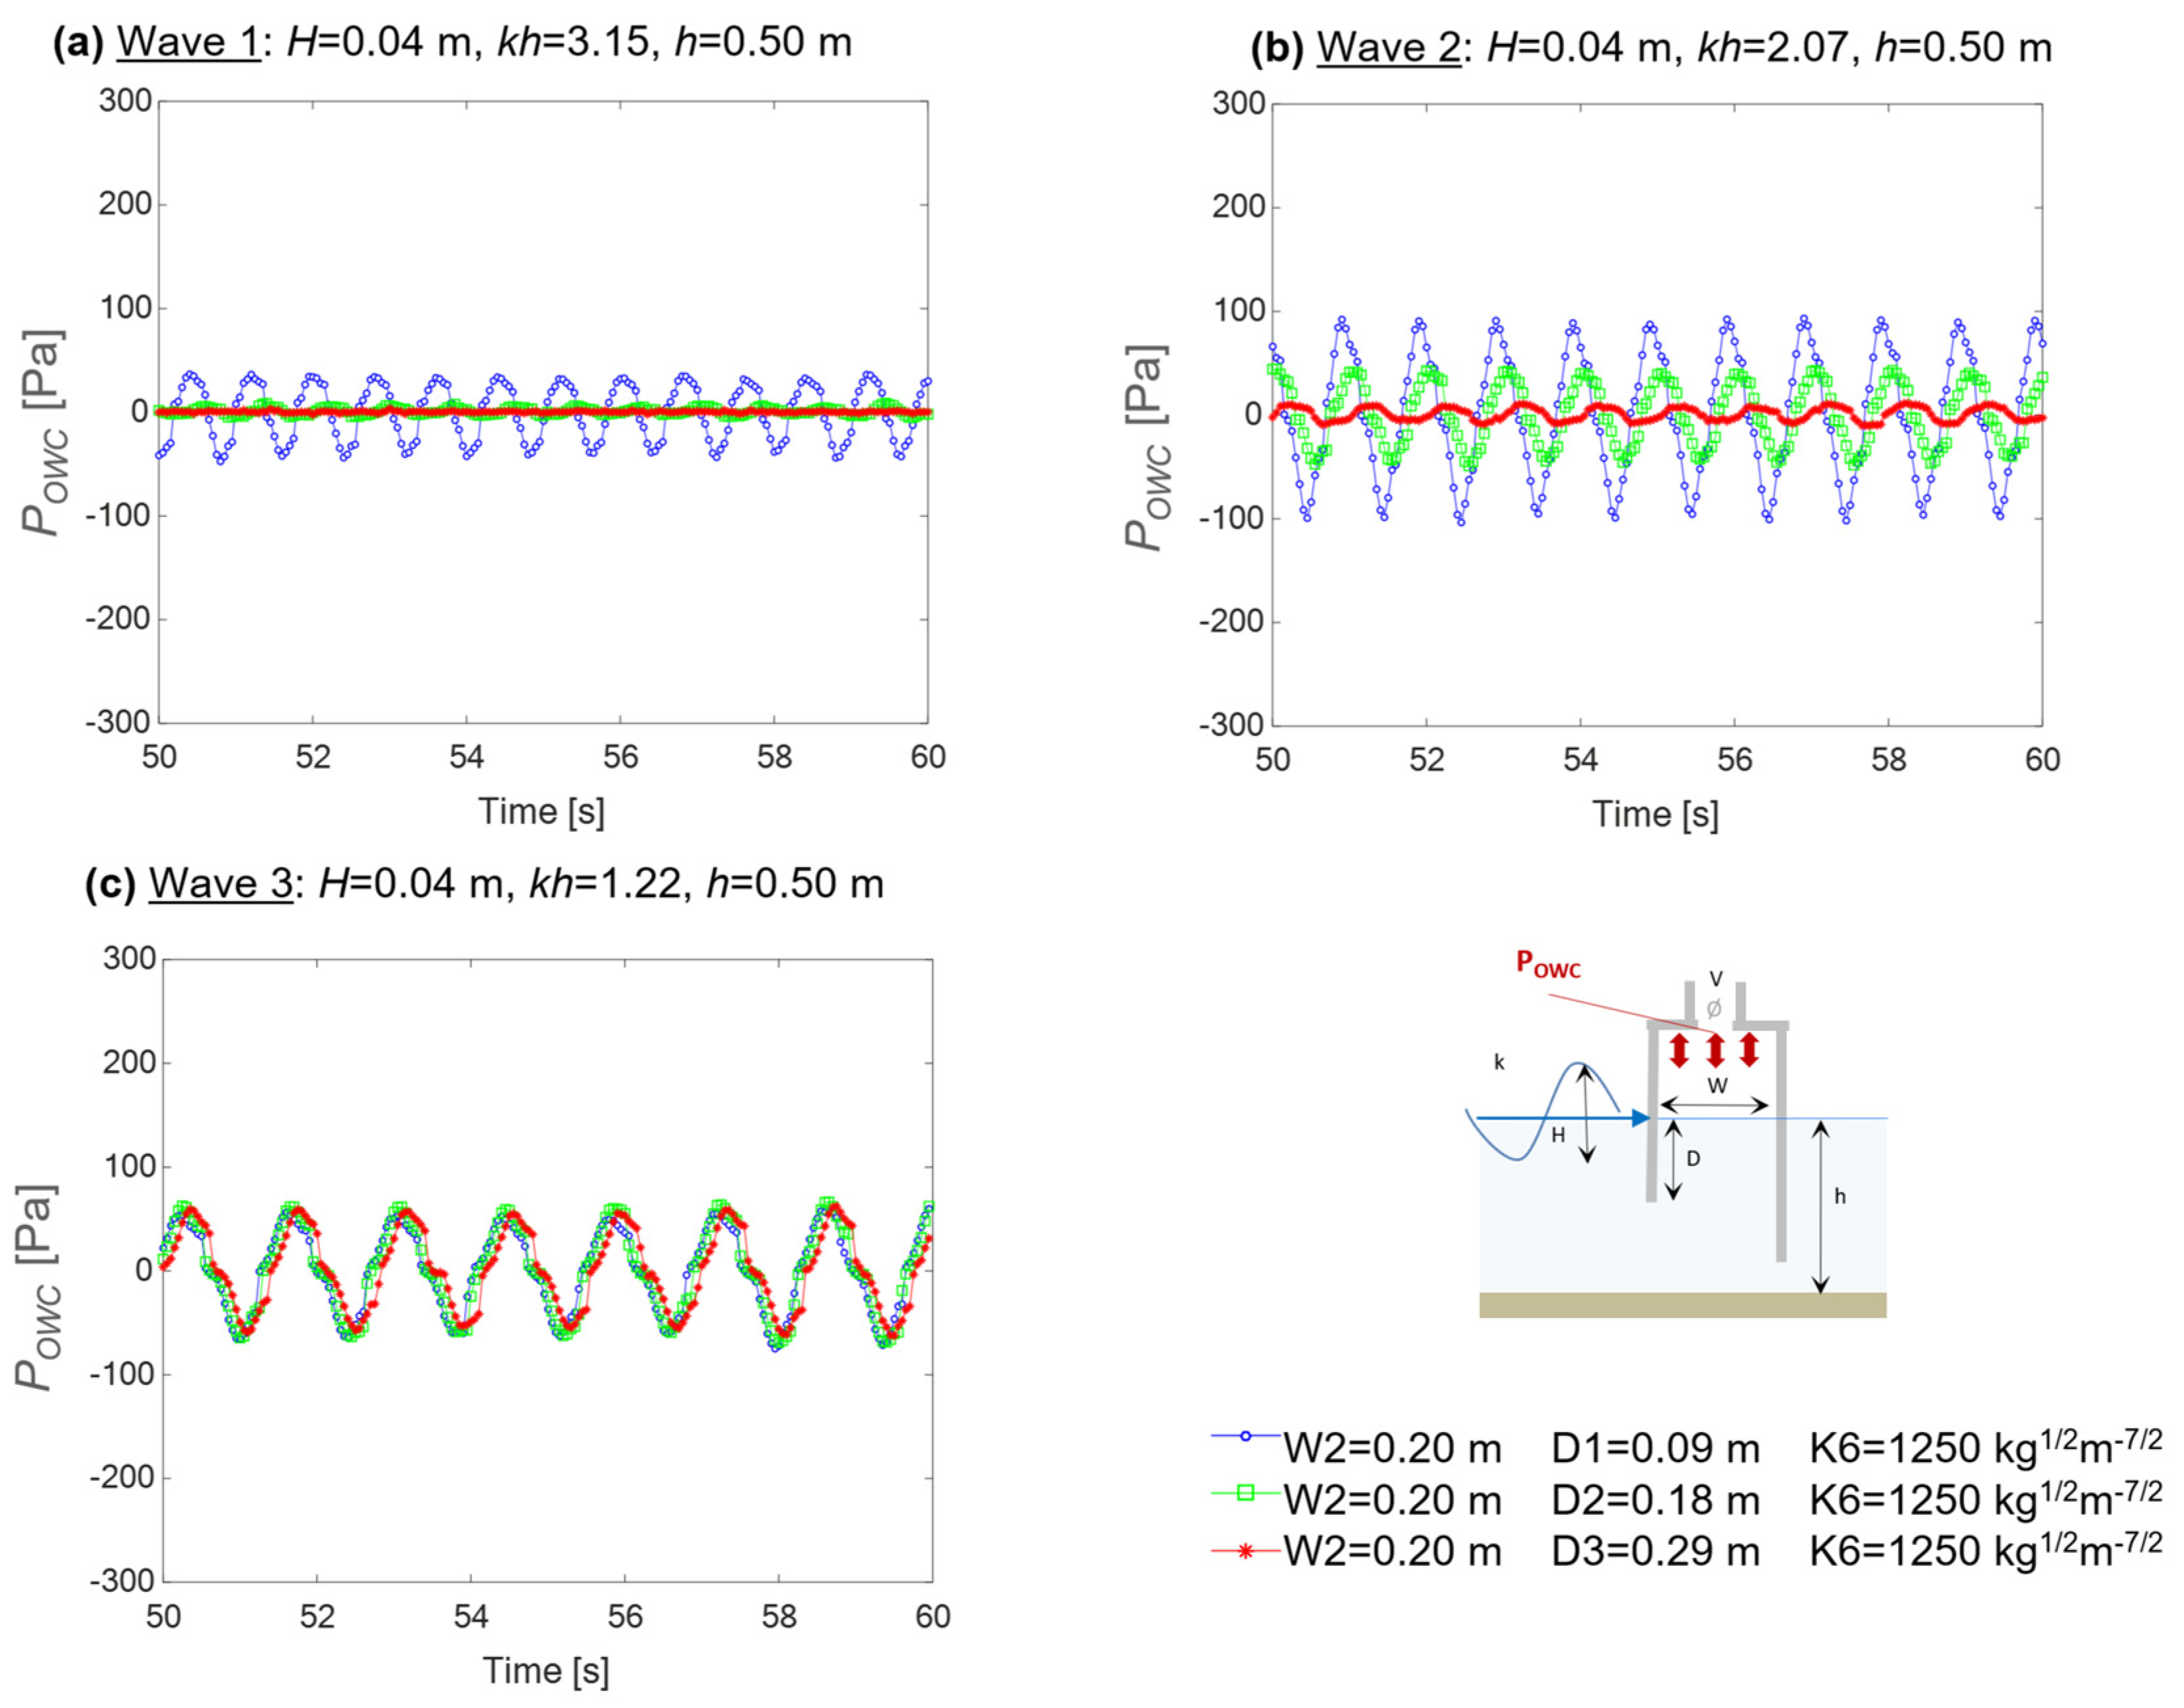
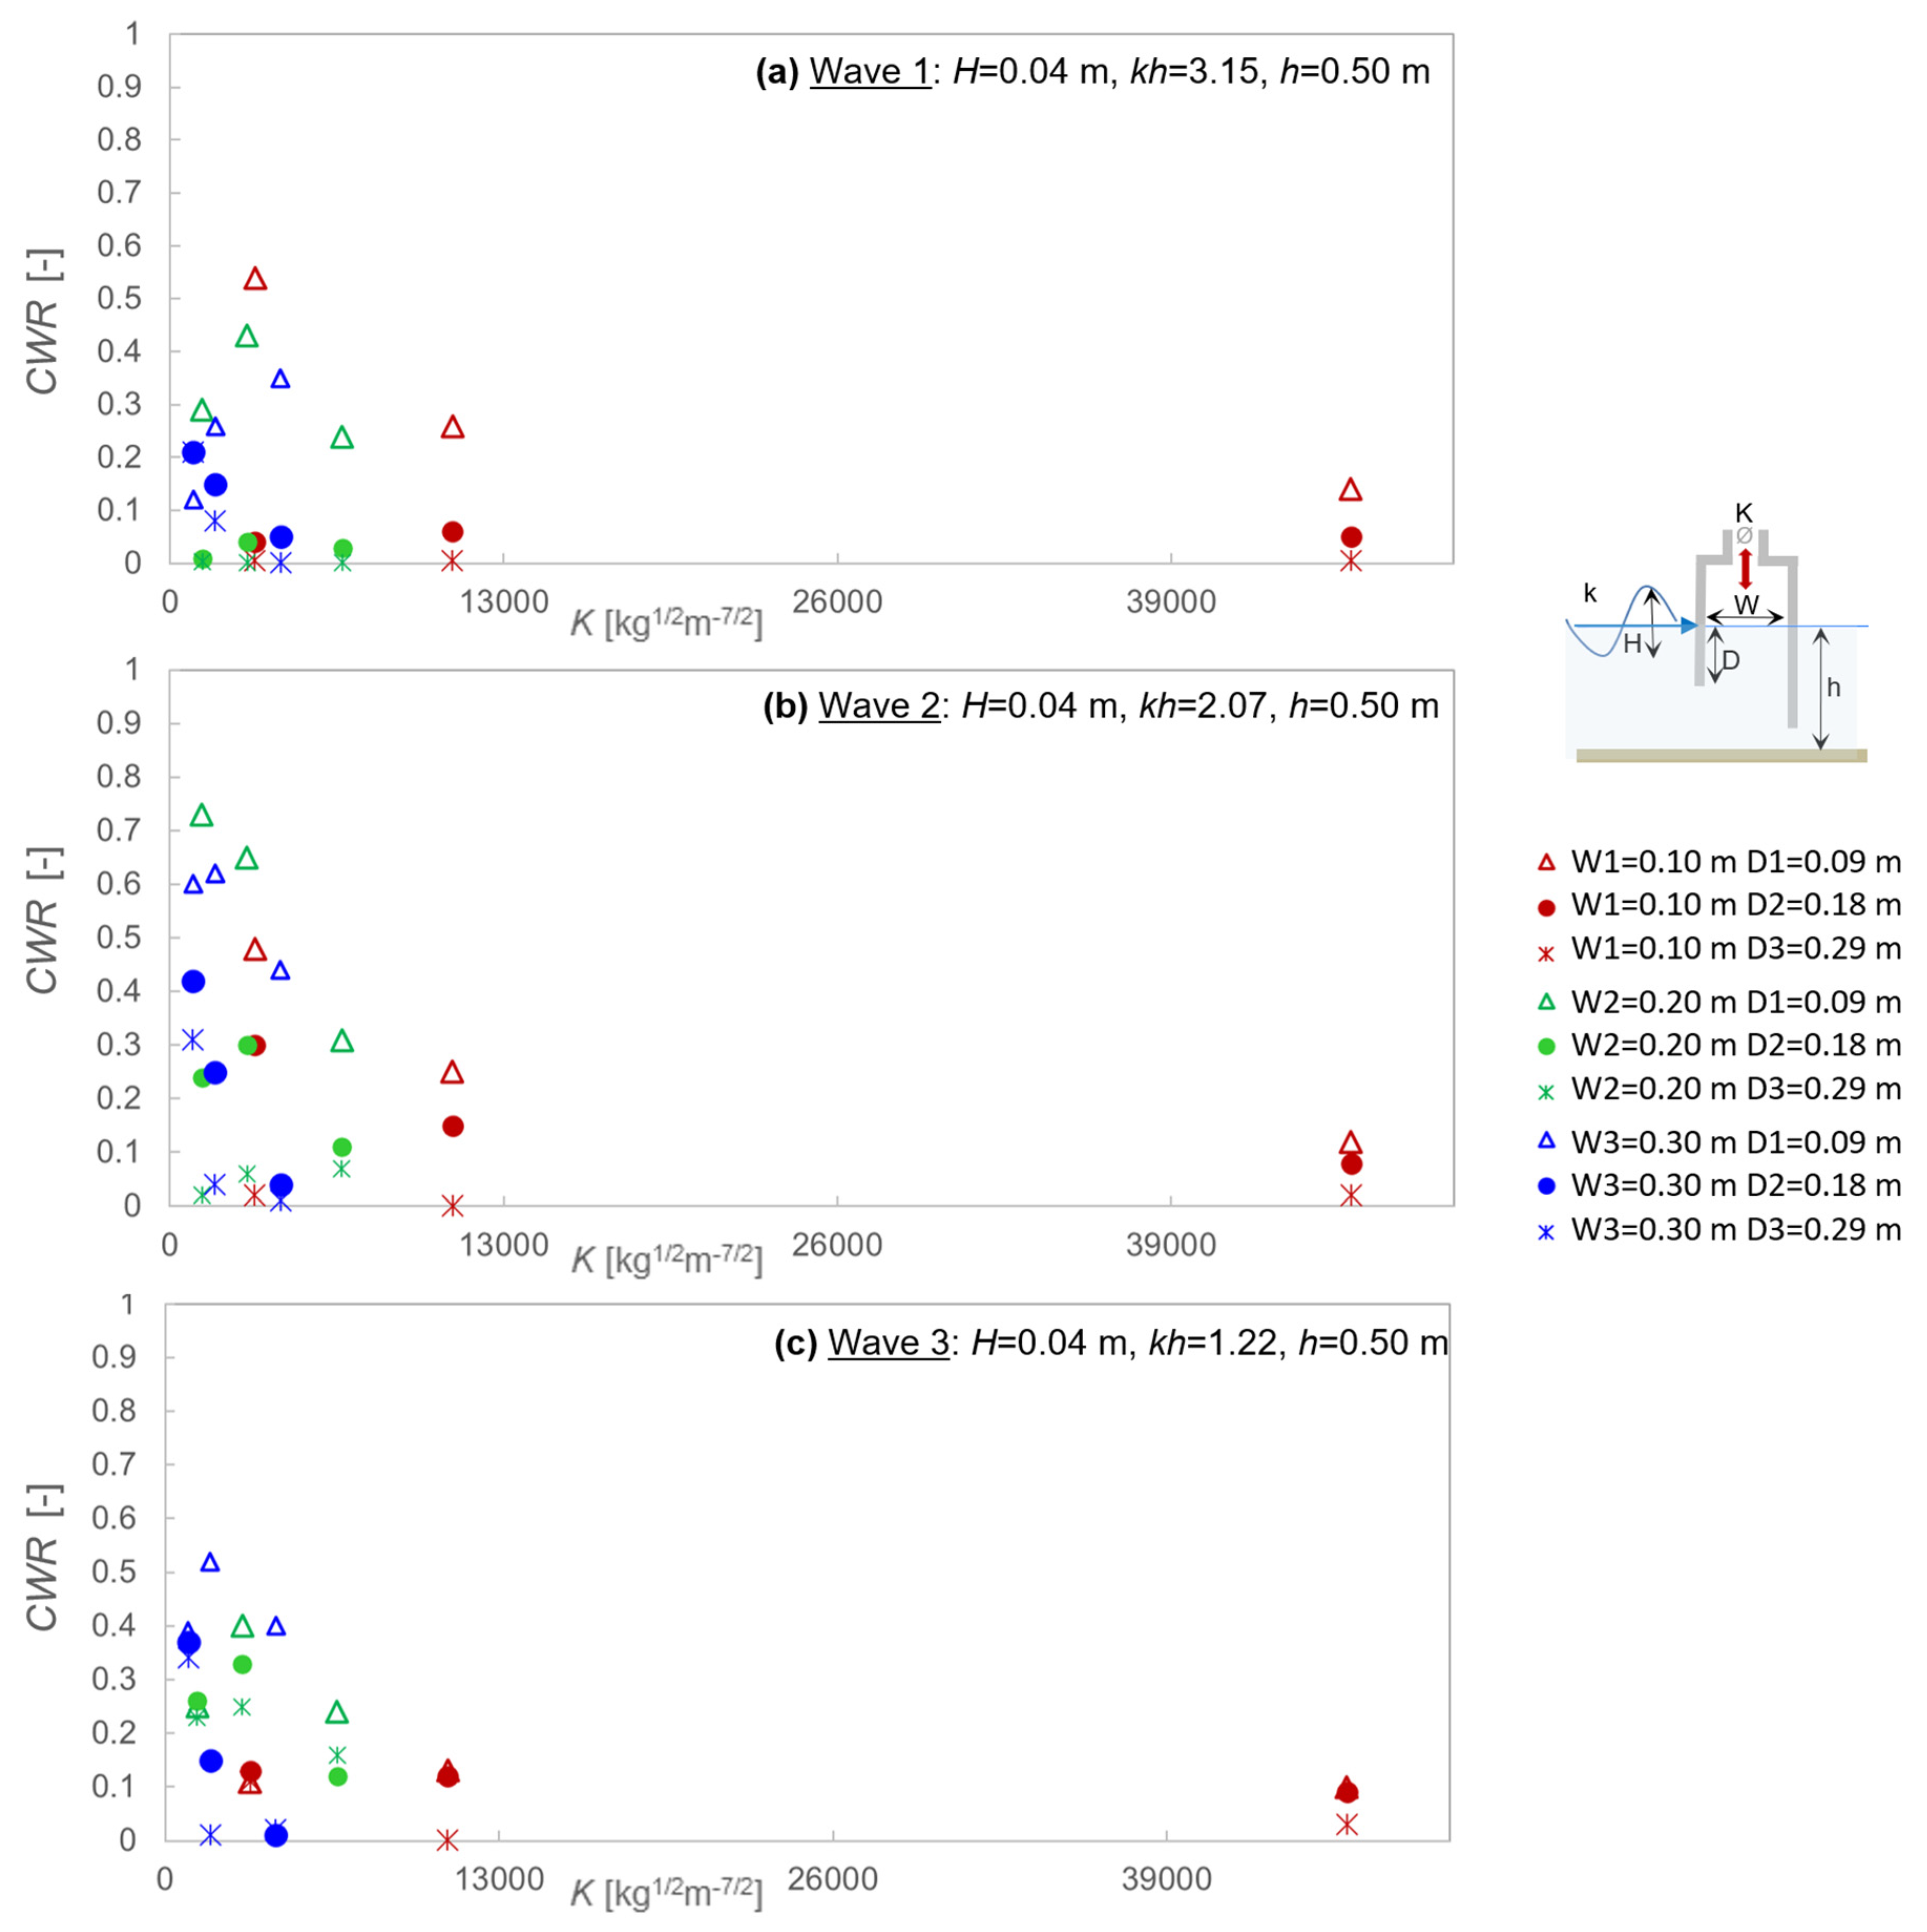
Increasing values of the damping coefficient K associated with each vent diameter V results in higher inner air pressure POWC, but in lower inner water surface oscillations ηOWC and airflow rates QOWC. An optimal value of damping exists for each geometry of the OWC chamber. In the present study, the optimal PTO-applied damping is in the range of 900–4300 kg1/2 m−7/2.
(iii)
For the tested wave conditions and OWC geometries, decreasing the front wall draught D implies an increase in POWC, ηOWC, and QOWC, although, for the longer wave condition (relative water depth kh = 1.22), such differences are strongly attenuated.
(iv)
Laboratory tests indicate that, for the short-fetch conditions of this study, higher capture width ratios are obtained for a relative chamber width of W/L = 0.07–0.19 and a relative front wall draught of D/H~2.25. A maximum value of capture width ratio of around 73% is found in such conditions.
The main contribution of this work consists of having identified the range of PTO damping K values within which, under short-fetch conditions, the optimum for the chamber operation is located. Within this range, turbine manufacturers would need to design a turbine with a quadratic relationship between flow rates and fluxes (i.e., an impulse turbine) that allows for the application of an optimal damping level to the OWC chamber, while simultaneously ensuring satisfactory performance of the turbomachine. Once the optimal turbine is precisely defined, a second-level optimization of the device geometry could be performed, in the vicinity of the geometry identified in the present work, which would keep the designed turbomachine and its related damping characteristics fixed while maximizing the chamber’s performance under this constraint. It must be mentioned that previous studies have shown that climate change may significantly impact wave energy resources in various locations, significantly affecting both the average and extreme wave heights, as well as the intra-annual stability of wave energy. Monthly variations in wave energy are expected to increase across much of the Mediterranean and Atlantic coasts of Europe, potentially doubling in some areas [83,84]. Therefore, wave energy converters may have to face harsher conditions, raising concerns about their survivability. These aspects should be considered in the future development of WECs. However, for the case of a fixed, detached OWC, [85] estimated that the relative variation in the optimal dimensions of the device between the present and the future wave climate scenario (projected to 2100) would be limited to 10%
The experimental dataset presented in this work will be made available upon request for numerical model validation.

Author Contributions

Conceptualization, L.C.; data curation, I.C., A.E. and L.C.; formal analysis, I.C., A.E. and I.S.; investigation, I.C. and A.E.; methodology, I.C., I.S. and L.C.; resources, L.C.; software, L.C.; supervision, L.C.; validation, I.C., I.S. and L.C.; writing—original draft, I.C., I.S. and L.C.; writing—review and editing, I.S. and L.C. All authors have read and agreed to the published version of the manuscript.

Funding

This research received no external funding.

Institutional Review Board Statement

Not applicable.

Informed Consent Statement

Not applicable.

Data Availability Statement

Data is contained within the article.

Conflicts of Interest

The authors declare no conflict of interest.

References

  1. Falcão, A.F.O.; Henriques, J.C.C. Oscillating-water-column wave energy converters and air turbines: A review. Renew. Energy 2016, 85, 1391–1424. [Google Scholar] [CrossRef]
  2. Ozkop, E.; Altas, I.H. Control, power and electrical components in wave energy conversion systems: A review of the technologies. Renew. Sustain. Energy Rev. 2017, 67, 106–115. [Google Scholar] [CrossRef]
  3. Falcão, A.F.O.; Henriques, J.C.C.; Gato, L.M.C. Self-rectifying air turbines for wave energy conversion: A comparative analysis. Renew. Sustain. Energy Rev. 2018, 91, 1231–1241. [Google Scholar] [CrossRef]
  4. Masuda, Y. Wave-Activated Generator; International Colloq Exposition Oceans: Bordeaux, France, 1971. [Google Scholar]
  5. Masuda, Y.; McCormick, M.E. Experiences in pneumatic wave energy conversion in Japan, In Utilization of Ocean Waves: Wave to Energy Conversion; McCormick, M.E., Kim, Y.C., Eds.; Amer Society of Civil Engineers: New York, NY, USA, 1986; pp. 1–33. [Google Scholar]
  6. Whittaker, T.J.T.; McIlhagger, D.S.; Barr, A.G. Wells Turbines for Navigation Buoys; Twidell, J., Riddoch, F., Grainger, B., Eds.; Energy for Rural and Island Communities: Pergamon, Turkey, 1984; pp. 289–297. ISBN 9780080305806. [Google Scholar] [CrossRef]
  7. Falcão, A.F.O.; Gato, L.M.C. Air Turbines. In Comprehensive Renewable Energy; Sayigh, A., Ed.; Elsevier: Oxford, UK, 2012; Volume 8, pp. 111–149. [Google Scholar]
  8. McCormick, M. Ocean Wave Energy Conversion; John Wiley Sons: New York, NY, USA, 1981. [Google Scholar]
  9. Evans, D.; Porter, R. Hydrodynamic characteristics of an oscillating water column device. Appl. Ocean Res. 1995, 17, 155–164. [Google Scholar] [CrossRef]
  10. McCormick, M.E. Ocean Wave Energy Conversion; Dover publications: New York, NY, USA, 2007. [Google Scholar]
  11. Boccotti, P. Comparison between a U-OWC and a conventional OWC. Ocean. Eng. 2007, 34, 799–805. [Google Scholar] [CrossRef]
  12. Falcão, A.F.O.; Henriques, J.C.C.; Gato, L.M.C.; Gomes, R.P.F. Air turbine choice and optimization for floating oscillating-water-column wave energy converter. Ocean. Eng. 2014, 75, 148–156. [Google Scholar] [CrossRef]
  13. Ravindran, M.; Koola, P.M. Energy from sea waves e the Indian wave energy program. Curr. Sci. 1991, 60, 676–680. [Google Scholar]
  14. Heath, T.; Whittaker, T.J.T.; Boake, C.B. The design construction and operation of the LIMPET wave energy converter (Islay, Scotland). In Proceedings of the 4th European Wave Energy Conference, Aalborg, Denmark, 4–6 December 2000; pp. 49–55. [Google Scholar]
  15. Falcão, A.F.O. The shoreline OWC wave power plant at the Azores. In Proceedings of the 4th European Wave Energy Conference, Aalborg, Denmark, 4–6 December 2000; pp. 42–47. [Google Scholar]
  16. Suzuki, M.; Arakawa, C.; Takahashi, S. Performance of a wave power generating system installed in breakwater at Sakata port in Japan. In Proceedings of the 14th International Offshore and Polar Engineering Conference, Toulon, France, 23–28 May 2004. [Google Scholar]
  17. Torre-Enciso, Y.; Ortubia, I.; Lopez de Aguileta, L.I.; Marques, J. Mutriku wave power plant: From the thinking out to the reality. In Proceedings of the 8th European Wave and Tidal Energy Conference, Uppsala, Sweden, 7–10 September 2009; pp. 319–329. [Google Scholar]
  18. Mustapa, M.A.; Yaakob, O.B.; Yasser, M.A.; Rheem, C.-K.; Koh, K.K.; Adnan, F.A. Wave energy device and breakwater integration: A review. Renew. Sustain. Energy Rev. 2017, 77, 43–58. [Google Scholar] [CrossRef]
  19. Vicinanza, D.; Di Lauro, E.; Contestabile, P.; Gisonni, G. Review of Innovative Harbor Breakwaters for Wave-Energy Conversion. J. Waterw. Port Coast. Ocean. Eng. 2019, 145, 03119001. [Google Scholar] [CrossRef]
  20. Simonetti, I.; Cappietti, L. Hydraulic performance of oscillating water column structures as anti-reflection devices to reduce harbour agitation. Coast. Eng. 2021, 165, 103837. [Google Scholar] [CrossRef]
  21. Simonetti, I.; Esposito, A.; Cappietti, L. Experimental Proof-of-Concept of a Hybrid Wave Energy Converter Based on Oscillating Water Column and Overtopping Mechanisms. Energies 2022, 15, 8065. [Google Scholar] [CrossRef]
  22. Iglesias, G.; Carballo, R. Wave energy and nearshore hot spots: The case of the SE Bay of Biscay. Renew. Energy 2010, 35, 2490–2500. [Google Scholar] [CrossRef]
  23. Vicinanza, D.; Contestabile, P.; Ferrante, V. Wave energy potential in the north-west of Sardinia (Italy). Renew. Energy 2013, 50, 506–521. [Google Scholar] [CrossRef]
  24. Hadadpour, S.; Etemad-Shahidi, A.; Jabbari, E.; Kamranzad, B. Wave energy and hot spots in Anzali port. Energy 2014, 74, 529–536. [Google Scholar] [CrossRef]
  25. Vannucchi, V.; Cappietti, L. Wave Energy Assessment and Performance Estimation of State of the Art Wave Energy Converters in Italian Hotspots. Sustainability 2016, 8, 1300. [Google Scholar] [CrossRef]
  26. Count, B.; Fry, R.; Haskell, J.; Jackson, N. The MEL Oscillating Water Column; C.E.G.B. Report RD/M/I 157N81; U.K. Marchwood Eng. Lab.: Marchwood, UK, 1981. [Google Scholar]
  27. Robinson, R.N.; Murray, A. Geometric-wavefield influence on the behaviour of an oscillating water column. In Proceedings of the International Symposium on Hydrodynamics in Ocean Engineering, The Norwegian Institute of Technology, Trondheim, Norway, 24–28 August 1981; pp. 1067–1086. [Google Scholar]
  28. Maeda, H.; Kinoshita, T.; Masuda, K.; Kato, W. Fundamental research on oscillating water column wave power absorbers. J. Energy Res. Tech. 1985, 150, 81–86. [Google Scholar] [CrossRef]
  29. Sarmento, A.J.N.A. Wave flume experiments on two-dimensional oscillating water column wave energy devices. Exp. Fluids 1992, 12, 286–292. [Google Scholar] [CrossRef]
  30. Sarmento, A.J.N.A.; Falco, A.E.d.O. Wave generation by an oscillating surface-pressure and its application in wave-energy extraction. J. Fluid Mech. 1985, 150, 467–485. [Google Scholar] [CrossRef]
  31. Raghunathan, S. The wells air turbine for wave energy conversion. Prog. Aerosp. Sci. 1995, 31, 335–386. [Google Scholar] [CrossRef]
  32. McCormick, M.E. Ocean wave energy concepts. In Proceedings of the MTS-IEEE Oceans 79 Conference, San Diego, CA, USA, 17–19 September 1979; pp. 553–557. [Google Scholar]
  33. Richards, D.; Weiskopf, F.B. Studies with and testing of the McCormick pneumatic wave energy turbine with some comments on PWECS systems. In Utilization of Ocean Waves—Wave to Energy Conversion; McCormick, M.E., Kim, Y.C., Eds.; ASCE: New York, NY, USA, 1986; pp. 80–102. [Google Scholar]
  34. Sarmento, A.J.N.A. Model test optimization of an OWC. Int. J. Offshore Polar Eng. 1993, 3, 66–72. [Google Scholar]
  35. Morris-Thomas, M.; Irvin, R.J.; Thiagarajan, K.P. An Investigation into the Hydrodynamic Efficiency of an Oscillating Water Column. J. Offshore Mech. Arct. Eng. 2007, 129, 273. [Google Scholar] [CrossRef]
  36. Sheng, W.; Lewis, T.; Alcorn, R. On wave energy extraction of oscillating water column device. In Proceedings of the 4th International Conference on Ocean Energy, Dublin, Ireland, 17–19 October 2012; pp. 1–9. [Google Scholar]
  37. López, I.; Iglesias, G.; Lopez, M.; Castro, F.; Rodríguez, M.A. Turbine−chamber coupling in an OWC Wave Energy Converter. Civ. Eng. 2012, 2, 1–7. [Google Scholar]
  38. López, I.; Iglesias, G. Efficiency of OWC wave energy converters: A virtual laboratory. Appl. Ocean. Res. 2014, 44, 63–70. [Google Scholar] [CrossRef]
  39. López, I.; Castro, A.; Iglesias, G. Hydrodynamic performance of an oscillating water column wave energy converter by means of particle imaging velocimetry. Energy 2015, 83, 89–103. [Google Scholar] [CrossRef]
  40. Lopez, I.; Pereiras, B.; Castro, F.; Iglesias, G. Optimisation of turbine-induced damping for an OWC wave energy converter using a RANS-VOF numerical model. Appl. Energy 2014, 127, 105–114. [Google Scholar] [CrossRef]
  41. Pereiras, B.; Lopez, I.; Castro, F.; Iglesias, G. Non-dimensional analysis for matching an impulse turbine to an OWC (oscillating water column) with an optimum energy transfer. Energy 2015, 87, 481–489. [Google Scholar] [CrossRef]
  42. Iturrioz, A.; Guanche, R.; Armesto, J.; Alves, M.; Vidal, C.; Losada, I. Time-domain modeling of a fixed detached oscillating water column towards a floating multi-chamber device. Ocean. Eng. 2014, 76, 65–74. [Google Scholar] [CrossRef]
  43. Iturrioz, A.; Guanche, R.; Lara, J.; Vidal, C.; Losada, I. Validation of OpenFOAM® for Oscillating Water Column three-dimensional modeling. Ocean. Eng. 2015, 107, 222–236. [Google Scholar] [CrossRef]
  44. Ning, D.Z.; Wang, R.Q.; Zou, Q.P.; Teng, B. An experimental investigation of hydrodynamics of a fixed OWC Wave Energy Converter. Appl. Energy 2016, 168, 636–648. [Google Scholar] [CrossRef]
  45. Vyzikas, T.; Deshoulières, S.; Barton, M.; Giroux, O.; Greaves, D.; Simmonds, D. Experimental investigation of different geometries of fixed oscillating water column devices. Renew. Energy 2016, 104, 248–258. [Google Scholar] [CrossRef]
  46. He, F.; Huang, Z. Hydrodynamic performance of pile-supported OWC-type structures as breakwaters: An experimental study. Ocean. Eng. 2014, 88, 618–626. [Google Scholar] [CrossRef]
  47. Elhanafi, A.; Macfarlane, G.; Fleming, A.; Leong, Z. Experimental and numerical investigations on the hydrodynamic performance of a floating–moored oscillating water column wave energy converter. Appl. Energy 2017, 205, 369–390. [Google Scholar] [CrossRef]
  48. Viviano, A.; Naty, S.; Foti, E.; Bruce, T.; Allsop, W.; Vicinanza, D. Large-scale experiments on the behaviour of a generalised Oscillating Water Column under random waves. Renew. Energy 2016, 99, 875–887. [Google Scholar] [CrossRef]
  49. Pawitan, K.A.; Dimakopoulos, A.S.; Vicinanza, D.; Allsop, W.; Bruce, T. A loading model for an OWC caisson based upon large-scale measurements. Coast. Eng. 2019, 145, 1–20. [Google Scholar] [CrossRef]
  50. Ashlin, S.J.; Sannasiraj, S.A.; Sundar, V. Performance of an array of oscillating water column devices integrated with an offshore detached breakwater. Ocean. Eng. 2018, 163, 518–532. [Google Scholar] [CrossRef]
  51. David, D.R.; Vallam, S.; Annamalaisamy, S.S. Effect of Harbor Walls on the Efficiency of an Oscillating Water Column. J. Waterw. Port Coast. Ocean. Eng. 2018, 144, 04017043. [Google Scholar] [CrossRef]
  52. Perez-Collazo, C.; Greaves, D.; Iglesias, G. Hydrodynamic response of the WEC sub-system of a novel hybrid wind-wave energy converter. Energy Convers. Manag. 2018, 171, 307–325. [Google Scholar] [CrossRef]
  53. Michele, S.; Renzi, E.; Perez-Collazo, C.; Greaves, D.; Iglesias, G. Power extraction in regular and random waves from an OWC in hybrid wind-wave energy systems. Ocean. Eng. 2019, 191, 106519. [Google Scholar] [CrossRef]
  54. Zabihi, M.; Mazaheri, S.; Montazeri Namin, M. Experimental hydrodynamic investigation of a fixed offshore Oscillating Water Column device. Appl. Ocean. Res. 2019, 85, 20–33. [Google Scholar] [CrossRef]
  55. Celik, A.; Altunkaynak, A. Experimental investigations on the performance of a fixed-oscillating water column type wave energy converter. Energy 2019, 188, 116071. [Google Scholar] [CrossRef]
  56. Ning, D.; Wang, R.; Chen, L.; Sun, K. Experimental investigation of a land-based dual-chamber OWC wave energy converter. Renew. Sustain. Energy Rev. 2019, 105, 48–60. [Google Scholar] [CrossRef]
  57. López, I.; Carballo, R.; Taveira-Pinto, F.; Iglesias, G. Sensitivity of OWC performance to air compressibility. Renew. Energy 2020, 145, 1334–1347. [Google Scholar] [CrossRef]
  58. Falcão, A.F.O.; Henriques, J.C.C. Model-prototype similarity of oscillating water-column wave energy converters. Int. J. Mar. Energy 2014, 6, 18–34. [Google Scholar] [CrossRef]
  59. Simonetti, I.; Cappietti, L.; Elsafti, H.; Oumeraci, H. Evaluation of air compressibility effects on the performance of fixed OWC wave energy converters using CFD modelling. Renew. Energy 2018, 119, 741–753. [Google Scholar] [CrossRef]
  60. Liu, Z.; Xu, C.; Qu, N.; Cui, Y.; Kim, K. Overall performance evaluation of a model-scale OWC wave energy converter. Renew. Energy 2020, 149, 1325–1338. [Google Scholar] [CrossRef]
  61. Zhao, X.; Zhang, l.; Li, M.; Johanning, L. Experimental investigation on the hydrodynamic performance of a multi-chamber OWC-breakwater. Renew. Sustain. Energy Rev. 2021, 150, 111512. [Google Scholar] [CrossRef]
  62. Sun, Y.; Ning, D.; Mayon, R.; Chen, Q. Experimental and numerical investigation on hydrodynamic performance of a 3D land-fixed OWC wave energy converter. Appl. Ocean. Res. 2023, 141, 103805. [Google Scholar] [CrossRef]
  63. Liu, Z.; Xu, C.; Kim, K.; Zhang, X.; Ning, D. Hydrodynamic and energy-harvesting performance of an isolated oscillating water column device: An experimental study. Coast. Eng. 2024, 189, 104459. [Google Scholar] [CrossRef]
  64. Goda, Y.; Suzuki, Y. Estimation of incident and reflected waves in regular wave experiments. Ocean. Eng. 1995, 22, 77–86. [Google Scholar] [CrossRef]
  65. Vannucchi, V. Wave Energy Harvesting in the Mediterranean Sea. Ph.D. Thesis, Florence University, Florence, Italy, 2012. [Google Scholar]
  66. Hasselmann, K.; Barnett, T.P.; Bouws, E.; Carlson, H.; Cartwright, D.E.; Enke, K.; Ewing, J.A.; Gienapp, A.; Hasselmann, D.E.; Kruseman, P.; et al. Measurements of Wind-Wave Growth and Swell Decay during the Joint North Sea Wave Project (JONSWAP). Ergaenzungsheft Dtsch. Hydrogr. Z. Reihe A 1973, 95. [Google Scholar]
  67. Simonetti, I.; Cappietti, L.; El Safti, H.; Oumeraci, H. Numerical modelling of fixed oscillating water column wave energy conversion devices: Toward geometry hydraulic optimization. In Proceedings of the International Conference on Offshore Mechanics and Arctic Engineering—OMAE, St. John’s, NL, Canada, 31 May–5 June 2015; Volume 9. [Google Scholar]
  68. Vyzikas, T.; Deshoulieres, S.; Giroux, O.; Barton, M.; Greaves, D. Numerical study of fixed Oscillating Water Column with RANS-type two-phase CFD model. Renew. Energy 2017, 102, 294–305. [Google Scholar] [CrossRef]
  69. Celik, A.; Altunkaynak, A. Determination of hydrodynamic parameters of a fixed OWC by performing experimental and numerical free decay tests. Ocean. Eng. 2020, 204, 106827. [Google Scholar] [CrossRef]
  70. Silva, C.W.d. Vibration: Fundamentals and Practice, 2nd ed.; CRC Press: Boca Raton, FL, USA, 2006. [Google Scholar]
  71. Cruz, J. Ocean Wave Energy Current Status and Future Perspectives; Springer Science & Business Media: New York, NY, USA, 2008. [Google Scholar]
  72. White, F.M. Fluid Mechanics, 7th ed.; McGraw-Hill Series in Mechanical Engineering: London, UK, 2016; p. 1023. [Google Scholar]
  73. Simonetti, I.; Cappietti, L.; Elsafti, H.; Oumeraci, H. Optimization of the geometry and the turbine induced damping for fixed detached and asymmetric OWC devices: A numerical study. Energy 2017, 139, 1197–1209. [Google Scholar] [CrossRef]
  74. Chen, J.; Wen, H.; Wang, Y.; Wang, G. A correlation study of optimal chamber width with the relative front wall draught of onshore OWC device. Energy 2021, 225, 120307. [Google Scholar] [CrossRef]
  75. Qu, M.; Yu, D.; Li, Y.; Gao, Z. Effect of relative chamber width on energy conversion and mechanical characteristics of the offshore OWC device: A numerical study. Energy 2023, 275, 127372. [Google Scholar] [CrossRef]
  76. He, F.; Pan, J.; Lin, Y.; Song, M.; Zheng, S. Development of an oscillating water column-type wave absorber for anti-reflection and effective energy extraction. Appl. Ocean. Res. 2024, 144, 103910. [Google Scholar] [CrossRef]
  77. Simonetti, I.; Crema, I.; Cappietti, L.; El Safti, H.; Oumeraci, H. Site-specific optimization of an OWC wave energy converter in a Mediterranean area. In Progress in Renewable Energies Offshore, Proceedings of the 2nd International Conference on Renewable Energies Offshore, Lisbon, Portugal, 24–26 October 2016; CRC Press: Boca Raton, FL, USA; pp. 343–350.
  78. Nguyen, D.T.; Chow, Y.; Lin, C. Modeling and performance estimation for L-shaped OWC wave energy converters with a theoretical correction for spring-like air compressibility. Renew. Energy 2024, 237 Pt A, 121499. [Google Scholar] [CrossRef]
  79. Falcão, A.F.O.; Henriques, J.C.C.; Gomes, R.P.F.; Portillo, J.C.C. Theoretically based correction to model test results of OWC wave energy converters to account for air compressibility effect. Renew. Energy 2022, 198, 41–50. [Google Scholar] [CrossRef]
  80. Falcão, A.F.O.; Henriques, J.C.C. The spring-like air compressibility effect in oscillating-water-column wave energy converters: Review and analyses. Renew. Sustain. Energy Rev. 2019, 112, 483–498. [Google Scholar] [CrossRef]
  81. Elhanafi, A.; Macfarlane, G.; Fleming, A.; Leong, Z. Scaling and air compressibility effects on a three-dimensional offshore stationary OWC wave energy converter. Appl. Energy 2017, 189, 1–20. [Google Scholar] [CrossRef]
  82. Orphin, J.; Nader, J.; Penesis, I. Uncertainty analysis of a WEC model test experiment. Renew. Energy 2021, 168, 216–233. [Google Scholar] [CrossRef]
  83. Sierra, J.P.; Castrillo, R.; Mestres, M.; Mösso, C.; Lionello, P.; Marzo, L. Impact of Climate Change on Wave Energy Resource in the Mediterranean Coast of Morocco. Energies 2020, 13, 2993. [Google Scholar] [CrossRef]
  84. Simonetti, I.; Cappietti, L. Projected Trends in Wave Energy Potentials along the European Coasts and Implications for Wave Energy Exploitation (1976–2100). J. Mar. Sci. Eng. 2024, 12, 239. [Google Scholar] [CrossRef]
  85. Simonetti, I.; Cappietti, L. Mediterranean coastal wave-climate long-term trend in climate change scenarios and effects on the optimal sizing of OWC wave energy converters. Coast. Eng. 2023, 179, 104247. [Google Scholar] [CrossRef]
Figure 1. Overview of the 3-chamber OWC assembly installed in the flume (left) and a sketch of the parameters’ naming convention ((right)—parameters that were varied in the laboratory tests are marked in red).
Jmse 12 02167 g001
Figure 2. Instantaneous values of air volume flux QOWC vs. air chamber pressure POWC, down-sampled at 50 Hz, for the nine vent duct diameters V with the associated damping coefficients K estimated as best-parabolic fit for the exhalation phase. Data refer to the draft level D2 (Table 1) and to the wave condition H02 (Table 3) only since acquisitions for other cases are substantially analogous.
Jmse 12 02167 g002
Figure 3. Experimental setup indicating the locations of the OWC model and the wave probes (WGs), the hot-wire anemometer (HW), and the pressure transducer (PT) along the wave-current flume (top) and details of the instrumental setup of the OWC central chamber (bottom).
Jmse 12 02167 g003
Figure 4. Localization of the reference site for characterizing the testing wave conditions (left), and distribution of the total annual energy per metre of wave front [kW/m] among different significant wave heights Hm0 and wave energy periods Te for the reference installation site (Central Tuscany, water depth 25 m, data from Vannucchi 2012) (right).
Jmse 12 02167 g004
Figure 5. Time series of water level oscillations inside the OWC chamber recorded in the RES laboratory tests (a) and Fast Fourier Transform power spectra of the water surface oscillations (b) for the OWC models W1D2K2, W2D1K5, and W2D1K6.
Jmse 12 02167 g005
Figure 6. Natural frequency of the OWC assessed using the prediction formula proposed in [10], compared with the results of RES tests for three chamber lengths, with different front wall draught and turbine damping (K3 for W1, K5 for W2, and K7 for W3).
Jmse 12 02167 g006
Figure 7. Effect of chamber width W on the water surface elevation ηOWC(t) compared to η(t) without any model in the flume (time series recorded at the centre of the OWC, for regular wave tests).
Jmse 12 02167 g007
Figure 8. Effect of chamber width W on airflow velocity UOWC(t) for regular wave tests.
Jmse 12 02167 g008
Figure 9. Effect of chamber width W on air pressure POWC(t) for regular wave tests.
Jmse 12 02167 g009
Figure 10. Effect of chamber width W and front wall draught D on air pressure oscillation amplitude ΔηOWC for comparable damping levels and regular wave tests.
Jmse 12 02167 g010
Figure 11. Effect of chamber width W and front wall draught D on the air pressure ΔPOWC at the centre of the OWC chamber for comparable damping levels and regular wave tests.
Jmse 12 02167 g011
Figure 12. Effect of chamber width W and front wall draught D on maximum air volume flux Qmax for comparable damping levels and regular wave tests.
Jmse 12 02167 g012
Figure 13. Effect of front wall draught D on water surface elevation ηOWC(t), compared with the η(t) recorded at the same location without any model (time series recorded at the centre of the OWC), for regular wave tests.
Jmse 12 02167 g013
Figure 14. Effect of front wall draught D on air pressure POWC(t) for regular wave tests.
Jmse 12 02167 g014
Figure 15. Effect of front wall draught D on airflow velocity UOWC(t) for regular wave tests.
Jmse 12 02167 g015
Figure 16. Effect of damping K on water surface elevation ηOWC(t) compared with the η(t) recorded at the same location in the same test without any model.
Jmse 12 02167 g016
Figure 17. Effect of damping K on air pressure POWC(t) for regular wave tests.
Jmse 12 02167 g017
Figure 18. Effect of damping K on the airflow velocity UOWC(t) for regular wave tests.
Jmse 12 02167 g018
Figure 19. Effect of damping coefficient K on water surface oscillations ΔηOWC at the centre of the OWC for regular wave tests.
Jmse 12 02167 g019
Figure 20. Effect of damping coefficient K on air pressure oscillation amplitude ΔPOWC for regular wave tests.
Jmse 12 02167 g020
Figure 21. Effect of damping coefficient K on maximum air volume flux Qmax in the pipe for regular wave tests.
Jmse 12 02167 g021
Figure 22. Capture width ratio CWR versus damping K for the regular wave tests.
Jmse 12 02167 g022
Table 1. Fixed and varied design parameters.
FIXED DESIGN PARAMETERS
NotationDescription[Unit]Value
BChamber width[m]0.20
GBack wall length[m]0.45
FcFreeboard[m]+0.16 S.W.L.
G-FcBack wall draught[m]0.29
thfbtFront-, back-, and top-cover wall thickness[m]0.01
thsSide wall thickness [m]0.008
VARIED DESIGN PARAMETERS
NotationDescription[Unit]Value
WChamber length[m]W1 = 0.10
W2 = 0.20
W3 = 0.30
DFront wall draught[m]D1 = 0.09
D2 = 0.18
D3 = 0.29
VVent duct diameter[m]V1 = 0.008
V2 = 0.014
V3 = 0.020
V4 = 0.016
V5 = 0.021
V6 = 0.030
V7 = 0.018
V8 = 0.026
V9 = 0.036
Table 2. Damping coefficients K calculated for each vent duct diameter tested.
Vent Duct Diameter V [m]OWC Length W [m]Damping K [kg1/2 m−7/2]-
Best Fit for the Exhalation Phase
Damping Kin [kg1/2 m−7/2]-
Best Fit for the Inhalation Phase
V1 = 0.008W1 = 0.1K1 = 46,000Kin1 = 49,000
V2 = 0.014W1 = 0.1K2 = 11,000Kin2 = 15,000
V3 = 0.020W1 = 0.1K3 = 3300Kin3 = 3800
V4 = 0.016W2 = 0.2K4 = 6700Kin4 = 10,000
V5 = 0.021W2 = 0.2K5 = 3000Kin5 = 3600
V6 = 0.030W2 = 0.2K6 = 1250Kin6 = 1700
V7 = 0.018W2 = 0.3K7 = 4300Kin7 = 4900
V8 = 0.026W2 = 0.3K8 = 1750Kin8 = 2150
V9 = 0.036W2 = 0.3K9 = 900Kin9 = 1000
Table 3. Incident effective wave parameters as obtained from time domain analysis (for regular waves) and frequency domain analysis (for irregular waves) of wave data acquired during wave tests in the absence of the model (water depth 0.50 m).
Regular Waves
WaveH [m]T [s]f [Hz]kh [-]H/λ [-]Sampling Duration [s]
10.0420.81.253.150.04070
20.0431.01.002.070.02570
30.0421.40.711.220.01370
Irregular Waves
Wave *Hs [m]Tp [s]fp [Hz]kh [-]H/λ [-]Duration [s]
40.0210.91.112.680.021100
50.0211.01.002.280.019100
60.0381.01.002.230.028100
70.0401.01.001.880.024100
80.0571.10.911.850.034100
* The five irregular waves tested, with Hs and fp being the significant wave height and peak frequency, respectively.
Table 4. Natural period of the OWC models considered in the free decay RES tests in this study.
OWC ModelTOWC [s] FDATOWC [s] LDMOWC ModelTOWC [s] FDATOWC [s] LDMOWC ModelTOWC [s] FDATOWC [s] LDM
W1D1K1- *-W2D1K4-0.98W3D1K7-0.98
W1D2K1--W2D2K4-1.13W3D2K7-1.18
W1D3K1--W2D3K41.231.25W3D3K7-1.29
W1D1K20.820.85W2D1K51.000.98W3D1K81.031.02
W1D2K21.051.00W2D2K51.101.05W3D2K81.101.12
W1D3K21.211.23W2D3K51.301.25W3D3K81.201.20
W1D1K30.830.83W2D1K60.920.94W3D1K91.041.05
W1D2K31.061.03W2D2K61.101.09W3D2K91.101.12
W1D3K31.201.18W2D3K61.201.18W3D3K91.191.19
* [-] OWC configurations for the free-surface oscillation in the RES test were damped too quickly to permit a precise estimation of the OWC natural frequency TOWC.
Disclaimer/Publisher’s Note: The statements, opinions and data contained in all publications are solely those of the individual author(s) and contributor(s) and not of MDPI and/or the editor(s). MDPI and/or the editor(s) disclaim responsibility for any injury to people or property resulting from any ideas, methods, instructions or products referred to in the content.

