Article

Resolved CFD-DEM Simulation of Free Settling of Polyhedral Particles with Various Orientations: Insights Provided by Oscillation Behavior in Quiescent Liquid

1
Key Laboratory of Coastal Urban Resilient Infrastructures (MOE), Shenzhen University, Shenzhen 518060, China
2
College of Civil and Transportation Engineering, Shenzhen University, Shenzhen 518060, China
3
Shenzhen Key Laboratory of Green, Efficient and Intelligent Construction of Underground Metro Station, Shenzhen University, Shenzhen 518060, China
*
Author to whom correspondence should be addressed.
J. Mar. Sci. Eng. 2023, 11(9), 1685; https://doi.org/10.3390/jmse11091685
Submission received: 7 August 2023 / Revised: 22 August 2023 / Accepted: 24 August 2023 / Published: 26 August 2023
(This article belongs to the Special Issue Advances in Numerical Modeling of Coupled CFD Problems)

Abstract

:
Particle settling is the process by which particulates move toward the bottom of a liquid, which can affect the sediment transport and energy balance of marine systems. However, the deficiency in understanding the resolved fluid–particle interactions with complex boundaries in the settling process awaits resolution. This study employs a hybrid approach that combines computational fluid dynamics (CFD) with the discrete element method (DEM) to fully simulate the free-settling behavior of polyhedral particles in water. The accuracy of the method is verified by comparing numerical results with experimental data of ellipsoidal particle settling. Two series of tests with horizontal and vertical particle release directions are established to investigate the effects of particle shape features, such as the aspect ratio (AR) and corner (C), on the particles’ mechanical behavior and hydrodynamic characteristics. The results demonstrate that particle shape exerts a substantial influence on fluid resistance, rotational motion, and fluid disturbance throughout the settling process. The maximum velocities in vertically released cases are roughly 1.2–1.3 times greater than those in horizontally released cases. The study highlights the potency of the resolved CFD-DEM method as a robust technique for comprehending fluid–particle phenomena within the marine geotechnical engineering, including sedimentation and erosion of seabed sediments.

1. Introduction

The free-settling behavior refers to the process of a specific particle falling as a result of gravity in a quiescent fluid involving complex interactions between multiphase fluid and irregular-shaped particles. This sedimentation process is common in nature and understanding it has significant implications in fields such as marine and geotechnical engineering, in which it will help to uncover the mechanisms of transportation, deposition, and erosion of marine sediments and assess their impact on the marine environment. Some scholars [1,2,3,4] have conducted extensive experiments on particle free settling and have offered insights into the dynamic behavior during the particles’ entry into fluid. The settling velocity of particles in fluid, one of the dominant factors influencing soil’s erodibility and bulk behavior such as the interactions and motions [5], can be accurately measured using the Particle Image Shadow-graph (PIS) [1] and particle imaging velocimetry (PIV) [3]. They determined the relationship between the velocity evolution during settling process and the flow Reynolds numbers. Moreover, Wang et al. [4] measured the terminal falling velocity of different calcareous sand in solutions of various viscosities to develop a newly shape-dependent fluid–particle drag model. Collectively, these studies indicated that the velocity and trajectory of particles falling into the water are closely related to fluid characteristics and particle properties, as well as the interaction between particles and container walls. Since these experiments have predominantly focused on the macroscopic behavior, complex fluid–particle interactions of particle settling in the micro-scale are challenging to fully capture through experimental means [6,7].
Fortunately, numerical simulation provides an alternative approach to facilitate a better understanding of micro-scale behavior for the particle and fluid during free settling. Many coupled methods have been proposed and employed to resolve the obstacles that exist in the way of modeling geotechnical problems related to particle–fluid interaction. The motion of fluids can be governed by the so-called Navier–Stokes (NS) equations [8] in some numerical methods, such as smoothed particle hydrodynamics (SPH) [9] and CFD [10], while the Lattice–Boltzmann method (LBM) stands as an important alternative to traditional Navier–Stokes approaches [11]. For particle modeling, the DEM is a general and robust technique [12,13] used to model granular materials, and it has extensive applications in many engineering fields due to its excellent algorithmic compatibility with other techniques, such as SPH-DEM [14,15,16], LBM-DEM [7,17,18], CFD-DEM [6,19,20,21]. Specifically, the coupled SPH-DEM approach cannot accurately calculate the dynamic pore pressure [22] and presents some obstacles with regard to characterizing the variation in permeability and porosity [23]. Although the LBM-DEM may be an option for modeling particle–fluid interactions, it generally has less computational efficiency compared to CFD-DEM [23]. The scale level between the fluid cells and particles needs to be determined in the coupling of the CFD and DEM, which can categorize the CFD-DEM coupled approach into an unresolved and a resolved one [5]. To deal with large fluid–particle systems, the unresolved CFD-DEM [24,25] is the appropriate approach, in which the particle size is markedly smaller than the size of cells in the fluid phase to ensure the computational efficiency [26,27]. For example, the internal erosion of soil induced by seepage has been successfully investigated according to this unresolved approach [19,28,29,30]. However, the flow around each particle cannot be fully resolved in the framework of the unresolved method, which is approached by solving the locally volume-averaged NS equations [28,31,32], resulting in a coarse-scale simulation of fluid–particle interaction. Since the resolved method discretizes the fluid phase to a particle scale and fully describes the flow surrounding each particle [33], it can be used to handle problems which require more fine meshing of the fluid. Schnorr Filho et al. [34] investigated hydraulic transport of grains in a curved pipe and presented a validation of this resolved method. Gago et al. [35] conducted resolved CFD-DEM simulations of fluid–solid interaction and successfully capture the dynamics in the solid system behavior. Consequently, the resolved CFD-DEM method can be considered one of the most suitable techniques with which to simulate the free-settling process and accurately capture the mechanical behavior of particles, as well as the hydraulic behavior of the fluid after water entry Ma et al. [36]. However, there is little published research on the application of the resolved method for simulating free settling, while the unresolved method is widely used [4,37]. In the unresolved CFD-DEM method, the fluid grid size even surpasses that of the particles [2,4,37]. Although this unresolved method can effectively reproduce experimental results [2,4,38], it cannot capture detailed information about the fluid around particles and also struggles to handle complex boundary problems. In contrast, within the resolved CFD-DEM framework, the boundaries of polygonal particles can be accurately identified [5]. Moreover, this method captures the fluid behavior surrounding the particles, thereby facilitating a more meticulous examination of particle sedimentation behavior in water.
Unlike ideal spherical particles, soil particles in nature exhibit more complex geometrical characteristics and entry conditions (e.g., original orientation), and using particles with more irregular shape in the simulation can reflect a more realistic free-settling process. In view of this, Chen et al. [39] investigated the flow characteristics and clogging mechanism of irregularly shaped particles in hydraulic conveying pipelines. Ma et al. [36] introduced several examples about the application of the non-spherical particles in the resolved CFD-DEM simulations of solid–fluid systems and various particle models such as the multi-sphere model [40] and polyhedral model [41]. Additionally, the polyhedral granular material is characterized by three main shape parameters [42,43]: roughness, angularity, and sphericity, as illustrated in Figure 1. The difference between irregular and spherical particles significantly affects the dynamic properties of fluid–solid interaction. To the best of the authors’ knowledge, far too little attention has been paid to the effect of these shape characteristics and the original orientation of particles on the kinematics behaviors and fluid during the free-settling process.
The objective of this study is to gain a better understanding of the influence of particle shapes on the fluid–particle interaction during the free-settling process using the resolved CFD-DEM method. The accuracy of the numerical analysis in representing the mechanical behavior of the freely falling particle is experimentally verified by comparing the velocity of the particle settling in the water. Then, a series of numerical model tests of particles with different AR and C values are conducted to investigate the mechanical and hydraulic behavior of the fluid–particle systems, such as velocity field, revolution of particles and vortex of fluid.

2. Methodology of Resolved CFD-DEM

The main focus of this study is the issue of particle free-settling commonly encountered in marine engineering. Considering the scarcity of particles involved in this matter, a resolved CFD-DEM coupling approach is employed, which addresses fluid flow equations at scales smaller than individual particles. The fluid–particle interaction is achieved by exchanging data from CFD and DEM after the governing equations of the fluid domain and particles are separately solved using the two methods. These data exchange processes at regular intervals N c , for instance at each five CFD time iteration [33]. When fully resolving the pore flow interacting particles, several methods are available, such as the body-conformal mesh methods, the Immersed Boundary (IB) methods, and the Fictitious Domain (FD) methods [32].

2.1. Governing Equations of DEM

Within the DEM system where the fluid is considered, the complex translational and rotational movements of each particle i are simultaneously governed by Newton’s second law of motion at any time t (modified from Zou et al. [44] and Cheng et al. [32]):
m i d v i d t = w F i w c + F i g + F i h
I i d ω i d t = w M i w c + M i h
where m i is the mass of particle i and I i denote the moment of inertia; v i and ω i are the translational and angular velocities of particle i, respectively; m i and the mass; F i j c and M i j c are the contact force and torque acting on particle i by particle j or a wall section w; F i w c and M i w c are the force and torque acting on the contact point between a particle i or a wall; F i h is the total hydraulic force the fluid conveys to particle i and M i h is the hydraulic moment induced by F i h ; F i g is the gravitational force. Since the free-settling simulation only takes one particle into account, there are no terms concerning the contact force between particles in the above equations.
The Hertz–Mindlin contact force model is widely used in studies involving granular materials to investigate the motion behaviors of each particle and their interactions with neighboring particles. The Hertzian spring–dashpot model controls the normal force F n , in which the damping and elastic components of F n are nonlinear functions of the overlap in the normal force model [45,46], and the F n is given by:
F n = C s ˙ n s n 1 4 + K s n 3 2
C = 2 η h e r t z m e K
K = 4 3 E r r e
where s n account for the contact normal overlap between two contacting surfaces, and s ˙ n denotes the time derivative of s n . C and K indicate the damping and contact stiffness coefficients, respectively. η h e r t z is the damping ratio, m e and r e represent the equivalent mass and radius, and E r is the reduced Young’s modulus.
On the other hand, the tangential component of the contact force F τ is calculated according to the Mindlin–Deresiewicz model [47], is given by:
F τ = μ F n s τ | s τ | 1 ς 3 2 + η τ s ˙ τ ς 1 4 6 μ F n m e s τ m
ς = 1 m i n | s τ | , s τ m s τ m
η τ = l n ε π 2 + l n 2 ε
where μ and ε are the friction and restitution coefficients. s τ and s ˙ τ represent the tangential relative displacement and velocity at the contact, respectively, and s τ m denotes the maximum value.

2.2. Immersed Boundary Methods for Fluid

In the framework of resolved CFD-DEM, several methods are available to fully resolve the particulate flows around particles, as mentioned. The IB method [48] is adopted in this study, and it proves particularly valuable with regard to addressing problems involving particles submerged in fluid. Each particle typically does not need to conform to the fluid grid, resulting in some of the computational meshes being split by the boundary of particles. Consequently, the governing equations of the fluid cells near the particle boundary are required to be modified. In this methodology, the boundary of particles ( Γ p ) established through a sequence of Lagrangian points (Figure 2) can be used to classify the grid points of the fluid as internal, external, or part of the interface [49]. Within this context, the internal points inside the particles do not require the solution of the fluid equations. Subsequently, the enforcement of boundary conditions is achieved by incorporating a body forcing term denoted by F into the Navier–Stokes equations at predefined boundary points
ρ ( u t + u · u ) = p + μ u + F
u = 0   in   Ω f   and
u = u Γ   on   Γ p
where u and p represent the velocity and pressure of fluid, respectively. The ρ is the fluid density and μ denotes its viscosity. Γ p is the particle boundary and Ω f denotes the surrounding domain occupied by fluid. In the forcing method used in this study, the immersed boundaries can be described as a series of material Lagrangian points with positions x k . The cumulative external force f ( x k ) exerted on these points arises from both hydrodynamic interactions and boundary deformation [49], and it can effectively spread to the adjacent fluid meshes, completing the interaction between the particle boundary and fluid domain. The spreading process is approached by employing a Dirichlet function δ to disperse the total boundary forces across the fluid domain based on their respective distances between the Lagrangian boundary point and the Eulerian fluent point
F ( x ) = k f k δ ( x x k )
where x k and x represent the Lagrangian position vector and the Eulerian position vector, respectively. The F ( x ) represent the Eulerian force which will be applied in the NS equations, as mentioned. To prevent oscillations and instabilities in the numerical solution, multiple smooth distribution functions are proposed as alternatives to the sharp delta function [50,51].

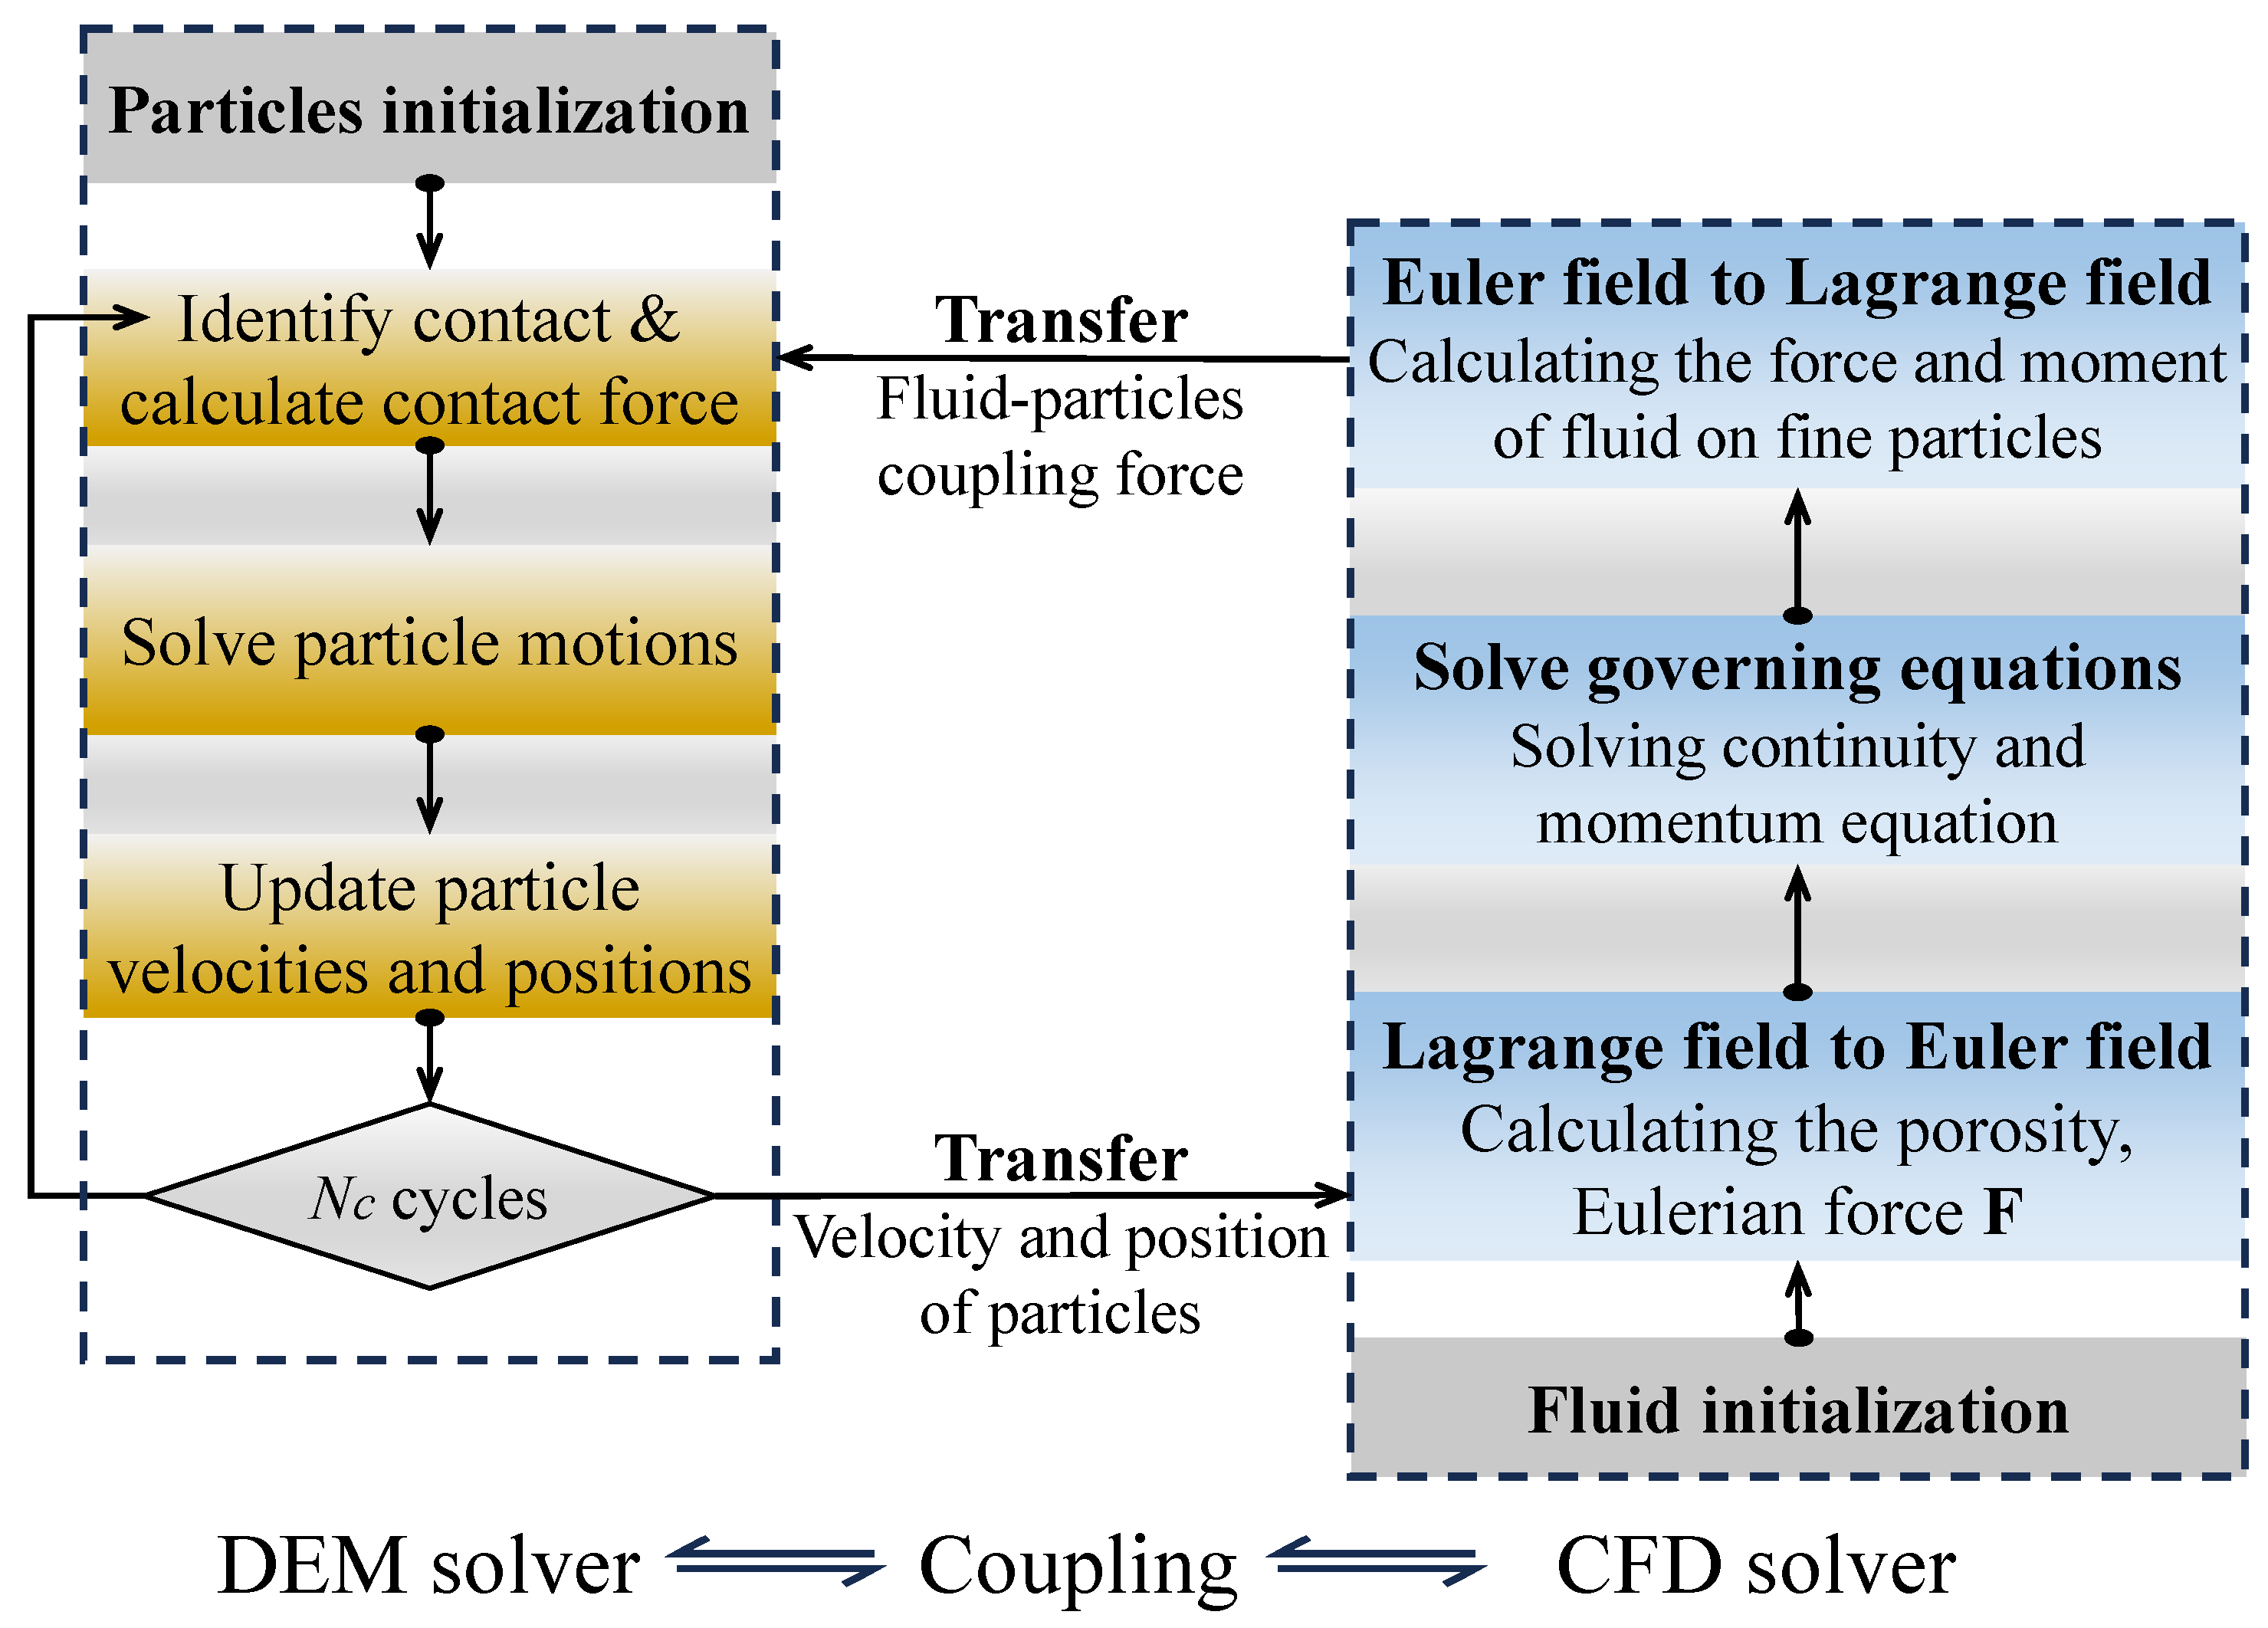
2.3. Numerical Scheme of Fluid–Particle Interaction

The CFD-DEM coupling method can be categorized into three approaches, including resolved, semi-resolved, and unresolved methods, based on the ratio of the fluid cell size ( Δ ) to the particle diameter d, as shown in Figure 3. In the process of particle free settling in the water, strong emphasis is placed on the hydraulic behavior of fluid in this study. Therefore, the flow cell size is typically set to 1/10 or smaller than the particle diameter, ensuring that detailed fluid information around the particles can be captured accurately [52]. As the ratio Δ / d increases to the range from 1/10 to 3, the method is classified as semi-resolved. While the precise capture of fine fluid details around particles is not achievable, computational efficiency is enhanced, making it suitable for larger-scale problems. When the ratio exceeds threefold of 3, a single fluid cell can encompass numerous particles, which are typically applicable to engineering problems involving tens of thousands of particles or more.
The CFD-DEM coupling process starts by initializing the particle data, and then contact forces of the particle assemble are calculated to update the velocities and positions of the particle (Figure 4). Once the calculation of intervals N c are complete, the Lagrangian fields of particles, such as positions and velocities, are transferred into the Eulerians domain. Furthermore, the forcing term F is obtained from the force density on the Lagrangian point in the particle boundaries and incorporated into the following solution of the fluid motion, namely, the NS equations. Subsequently, these coupling forces are calculated based on the pressure and velocity of the fluid and transmitted to the DEM solver, which are then employed in the ensuing cycle.

3. Method Verification

Simulation of the ellipsoidal particle free-settling experiment performed by Guo et al. [2] is conducted to validate the proposed resolved CFD-DEM method, including non-spherical particle generation, fluid handling through the IB methods, and the resolved coupling approach. The simulation results are then compared with the experimental data.
An ellipsoidal particle comprising triangular facets is fabricated, as depicted in Figure 5. The ellipsoidal particle exhibits a shape similar to that of three overlapping spheres with varying radii, where R = 3.5 mm and an AR value of 1.30. The particle density is set to 1031 kg·m−3, aligning with the 3D printing material. For further details of the setup, refer to Guo et al. [2].
The experimental process involved the release of ellipsoidal particles into a cylindrical container filled with water, as depicted in Figure 6a. Subsequently, the particle sunk freely under the force of gravity. With an increase in velocity, the particle experienced a gradual increase in the upward resistance until it was balanced by the force of gravity, ultimately leading to a state of equilibrium. At this point, the velocity stabilized, attaining the terminal settling velocity. For numerical simulation using the proposed resolved method, the parameters of the elliptical particles are consistent with the experimental setup (including shape, size, density, and initial orientation). As shown in Figure 6b, the dimensions of the CFD domain are 0.07 m × 0.07 m × 0.3 m, avoiding an excessive scale effect [53]. The upper boundary of the fluid has been designated as a pressure-inlet condition; all other boundaries have been defined as non-slip walls. The Δ is set to 0.6 mm, which is approximately 1/12 of the short axis of the elliptical particle. Time steps for the fluid and solid phases are set to 1.0 × 10 4 s and 1.0 × 10 7 s, respectively.
Figure 7 illustrates the comparison between the resolved result from resolved CFD-DEM and the experimental and simulated data from Guo et al. [2], indicating excellent agreement in the settling velocity. The resolved CFD-DEM algorithm effectively characterizes the free settling of the ellipsoidal particle and adequately represents the intricate fluid–particle interactions. This provides a robust basis for the in-depth exploration of the mechanics and hydraulic behavior of fluid–particle systems.

4. Establishment of the CFD-DEM Model

This study aims to explore both macroscopic and microscopic behaviors exhibited by non-spherical particles in fluid. The free-settling process of polyhedral particles with different AR and C values submerged in water under the influence of gravity is investigated to demonstrate the capabilities of the resolved CFD-DEM approach. The corner count C of a particle refers to the number of triangular facets composing the particle, reflecting its complexity and roundness. In the context of this article, polyhedral particles are constructed using triangular facets. A higher value of corner count C signifies a particle shape that is closer to spherical, while a lower value of corner count C indicates a more irregular shape. Two different corner count (C = 20 and 50) values are employed to generate polyhedral particles, and their impact on the settling process is investigated. This section offers a thorough and comprehensive overview of the geometric conditions and parameters utilized within the numerical model. Additionally, the construction of the particle free-settling model is elaborated, outlining the sequential steps and modeling techniques utilized in this study.
Particles with complex shapes can be characterized by polyhedral particles, possessing specific angles, edges, and triangular planes [36]. Consequently, this study centers on polyhedral particles as the subject of investigation. Additionally, eight polyhedral particles with varying AR and C values are generated using a particle generator capable of controlling individual morphological parameters. The particle morphologies are presented in Figure 8. The particle sizes are expressed in terms of equivalent sphere diameter d, with a fixed value of 10 mm, and the particle density is 2650 kg·m−3.
Particle free-settling occurs within a CFD domain, in which the Δ is set to 0.8 mm. The chosen ratio Δ / d , which is less than 0.1, satisfies the criteria required for the resolved CFD-DEM algorithm [52]. The particles are initially generated at z = 0.28 m. Horizontally placed and submerged in water, they sink freely under gravity’s influence. Furthermore, simulations of vertically released particles are carried out to capture complex fluid–particle interactions. All the simulation cases carried out in this study are shown in Table 1. To provide a comprehensive understanding, the key parameters have been summarized in Table 2, drawing upon insights from relevant prior research and the characteristic properties of natural soil particles and water [5,54,55]. The coupling process allows for parallel computation of the CFD solver on a CPU device (Intel(R) Xeon(R) Platinum 8268 CPU @ 2.90 GHz) and the DEM solver on a GPU device (NVIDIA GeForce RTX(TM) 4080Ti).

5. Numerical Results of Free-Settling

The sedimentation characteristics of a particle in water are influenced by its shape, size, and density, as well as various properties of the surrounding fluid. This section primarily delves into the underlying mechanisms governing the behavior of particles with different AR and C values when subjected to horizontal and vertical release. Many observations and insights into the evolution of settling velocity and fluid dynamics behaviors that occur during the sedimentation process (Figure 9), particularly the turbulence of the fluid, have profound implications on the natural gravel-sized particle sedimentation behavior in marine Geotechnical Engineering.

5.1. Horizontal Deposing Particles Cases

5.1.1. Effects of the Particle Shape on Free Settling Velocity

Figure 10 illustrates the temporal evolution of settling velocity for particles exhibiting different AR and C values. The settling velocity change is characterized by three discernible stages. Stage I is initiated by basically linear acceleration a p , in which particles undergo relatively stable resistance during settling. In the second stage, the a p gradually decelerates, leading to a smaller increasing rate in settling velocity until a plateau is reached (critical velocity, V c ). In stage III, the force acting on the particle by fluid is balanced by gravity, resulting in nearly uniform sinking, which can be also observed in previous studies ([3,57]). Prior to hitting the bottom, the settling rate start to slows down, indicating a change in the fluid–particle interaction. Eventually, particles reach the bottom, and their velocity rapidly drops to zero upon contact with the floor. Some of the faster particles exhibit a bouncing behavior after touching the bottom. Remarkably, the settling process of particles with different A R and C demonstrates a consistent trend, wherein all particles exhibit a monotonic increasing pattern before reaching the bottom. This trend has been defined as the steady-flat pattern in Stringham et al. [56].
The evolution of setting velocity in these cases remained consistent for particles which are subjected to a horizontal release, but the A R and C exerted an influence on the final stabilized velocity V c to some extent. As illustrated in Figure 11, the critical velocity gradually decreases with the increase in A R , but conversely, when C increases from 20 to 50, the final velocity grows slightly. The increase in the number of triangular facets comprising the particle leads to smoother edges in the cross-section, resulting in a particle that is closer to being round. As a consequence, the particle experiences less resistance during its settling. The influence of the C value on free-settling behavior becomes more evident when the particles are vertically released (see the next section for details). The particles of the larger A R , despite possessing an equivalent significant gravitational force to the particles of the smaller A R , experience a more pronounced influence of fluid force on their velocity owing to their increased contact with the surrounding fluid cells.

5.1.2. Kinematics Behavior during Settling

As mentioned in the previous section, particles with larger AR experience more resistance compared to those with smaller AR. As illustrated in Figure 12, during the stage I, the resolved force of the fluid ( F r e s ) cell gradually increases due to the particles’ increasing settling velocity. However, after 0.2 s, all particles are subjected to almost the same critical force F c , and there is a surge of F r e s just before they hit the bottom, corresponding to a short deceleration of the particles in Figure 10. During the acceleration phase, particles with larger A R experience greater F r e s . Force balance occurs when the gravitational forces acting on the particles are counteracted by the fluid force, resulting in equilibrium states. At this point, the particle velocity reaches a maximum, and as a consequence, the fluid resistance remains constant, forming a closed loop.

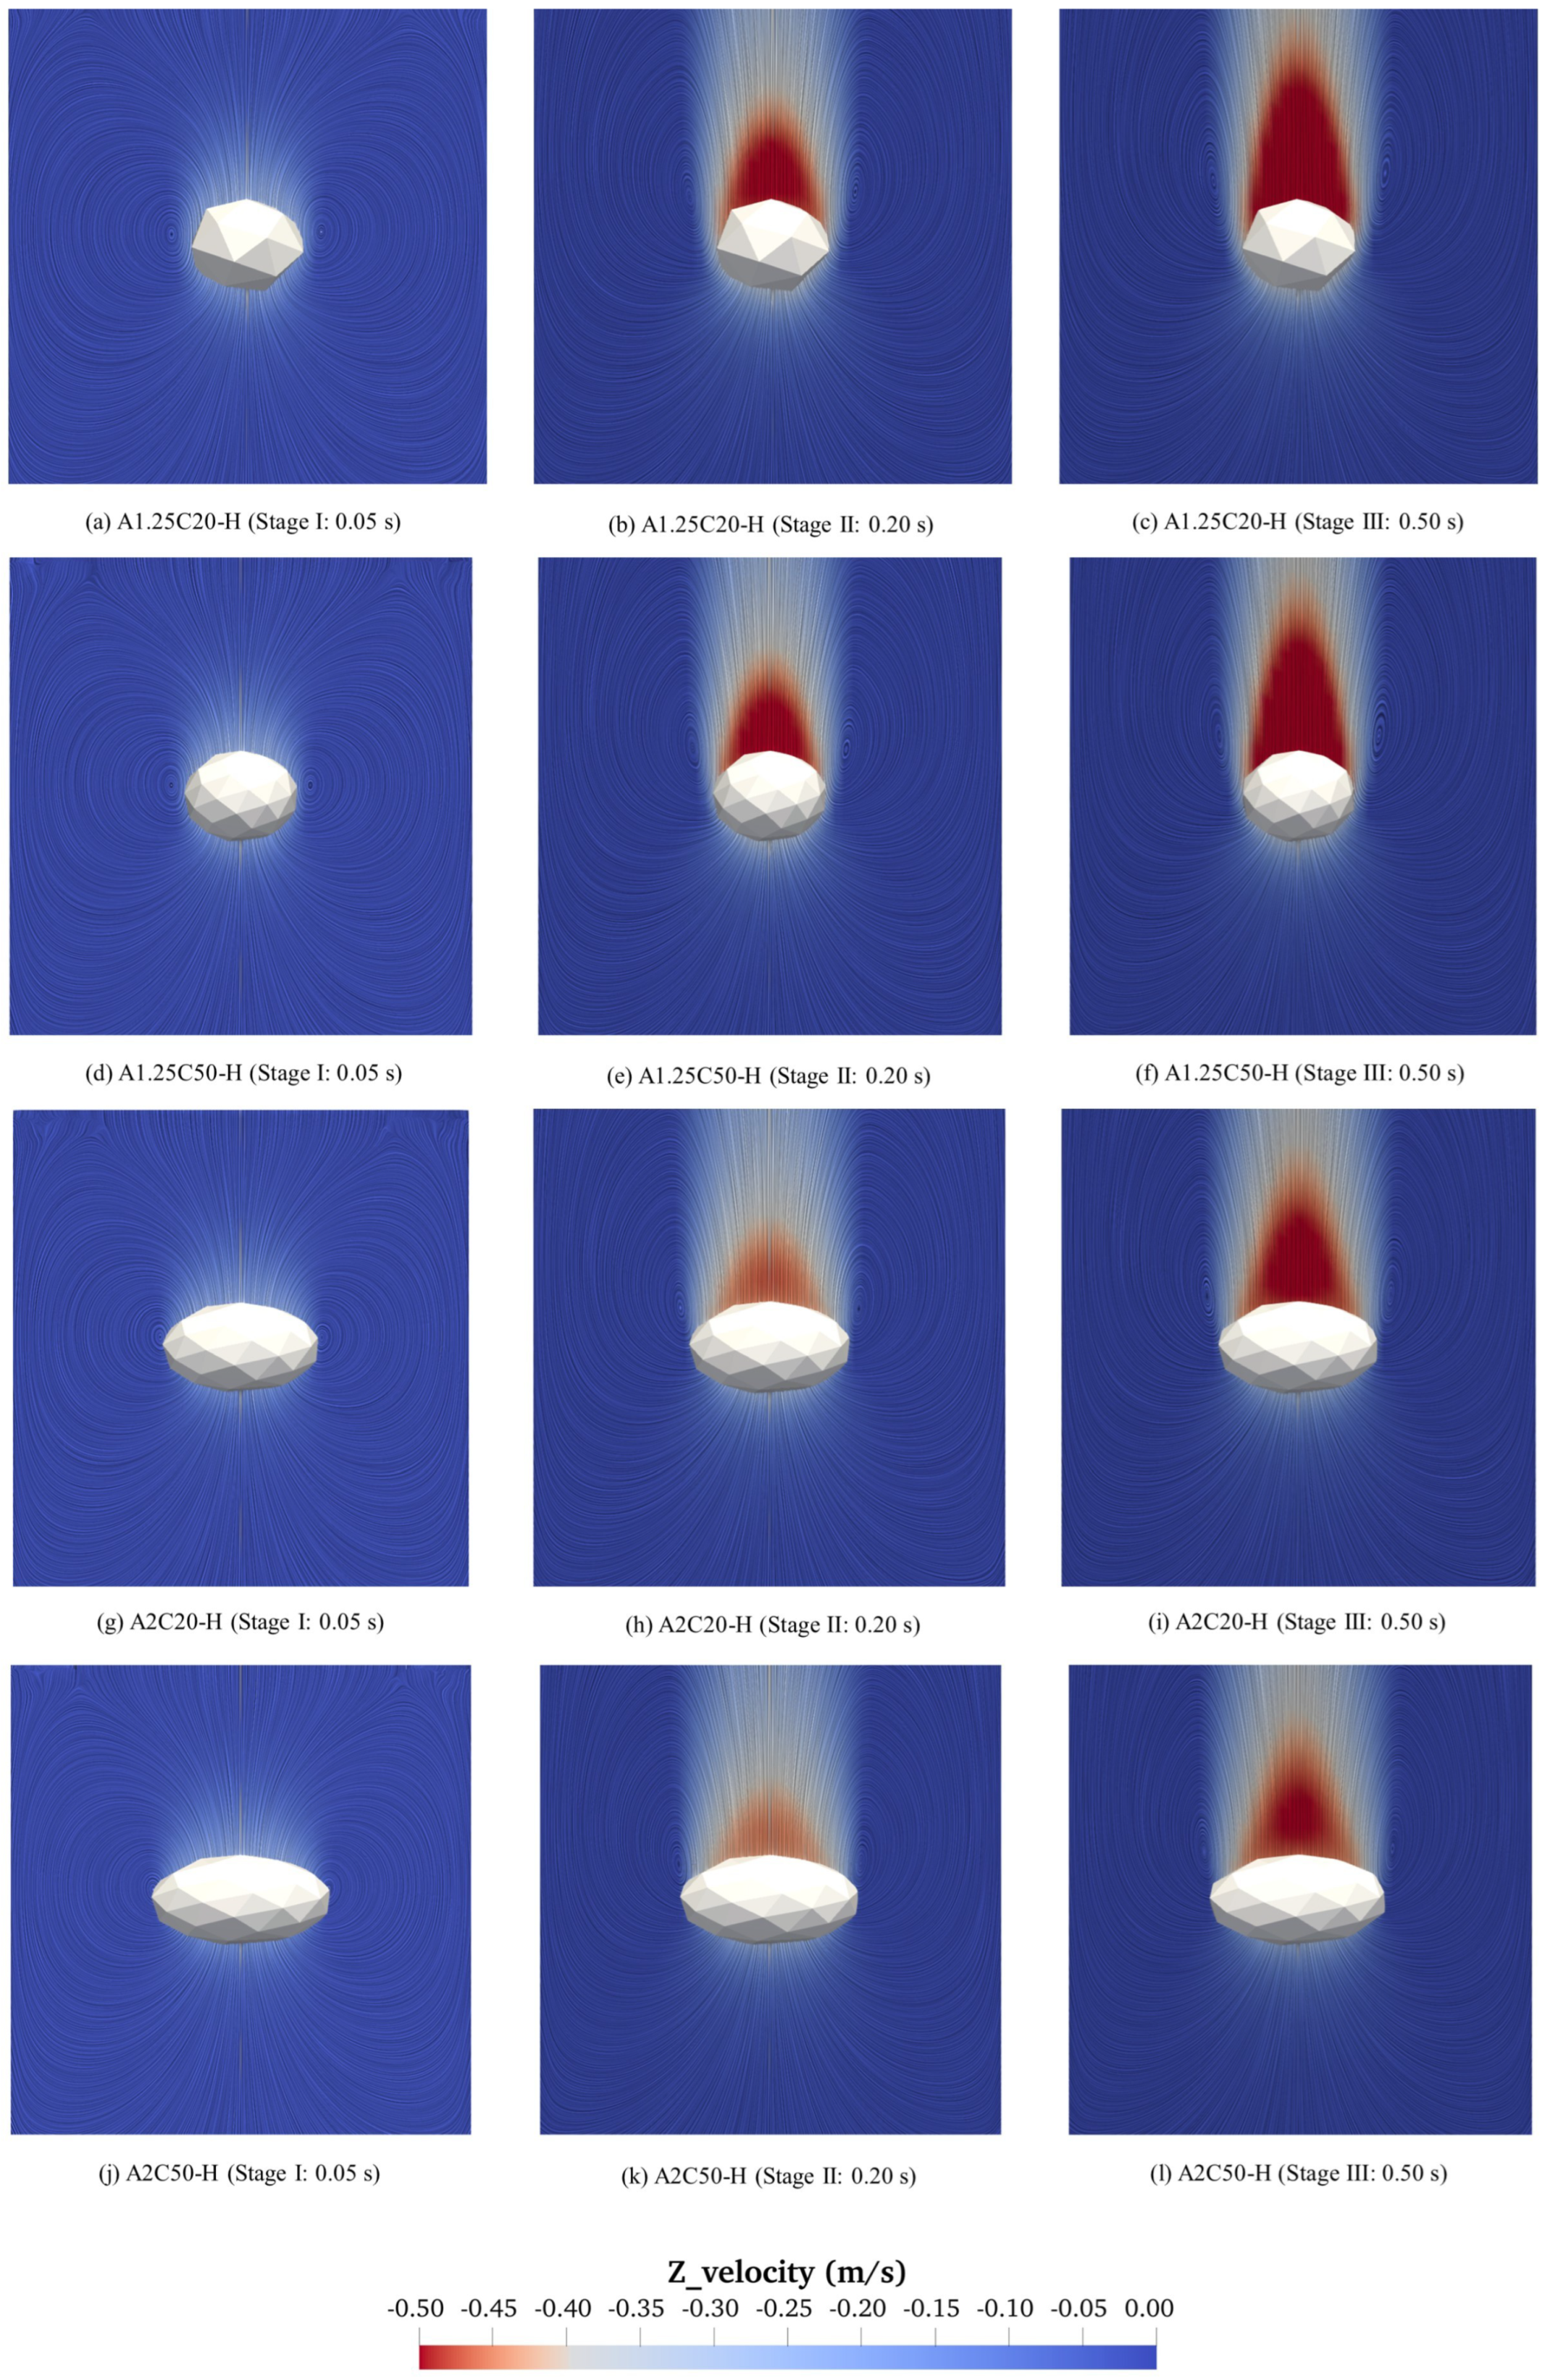
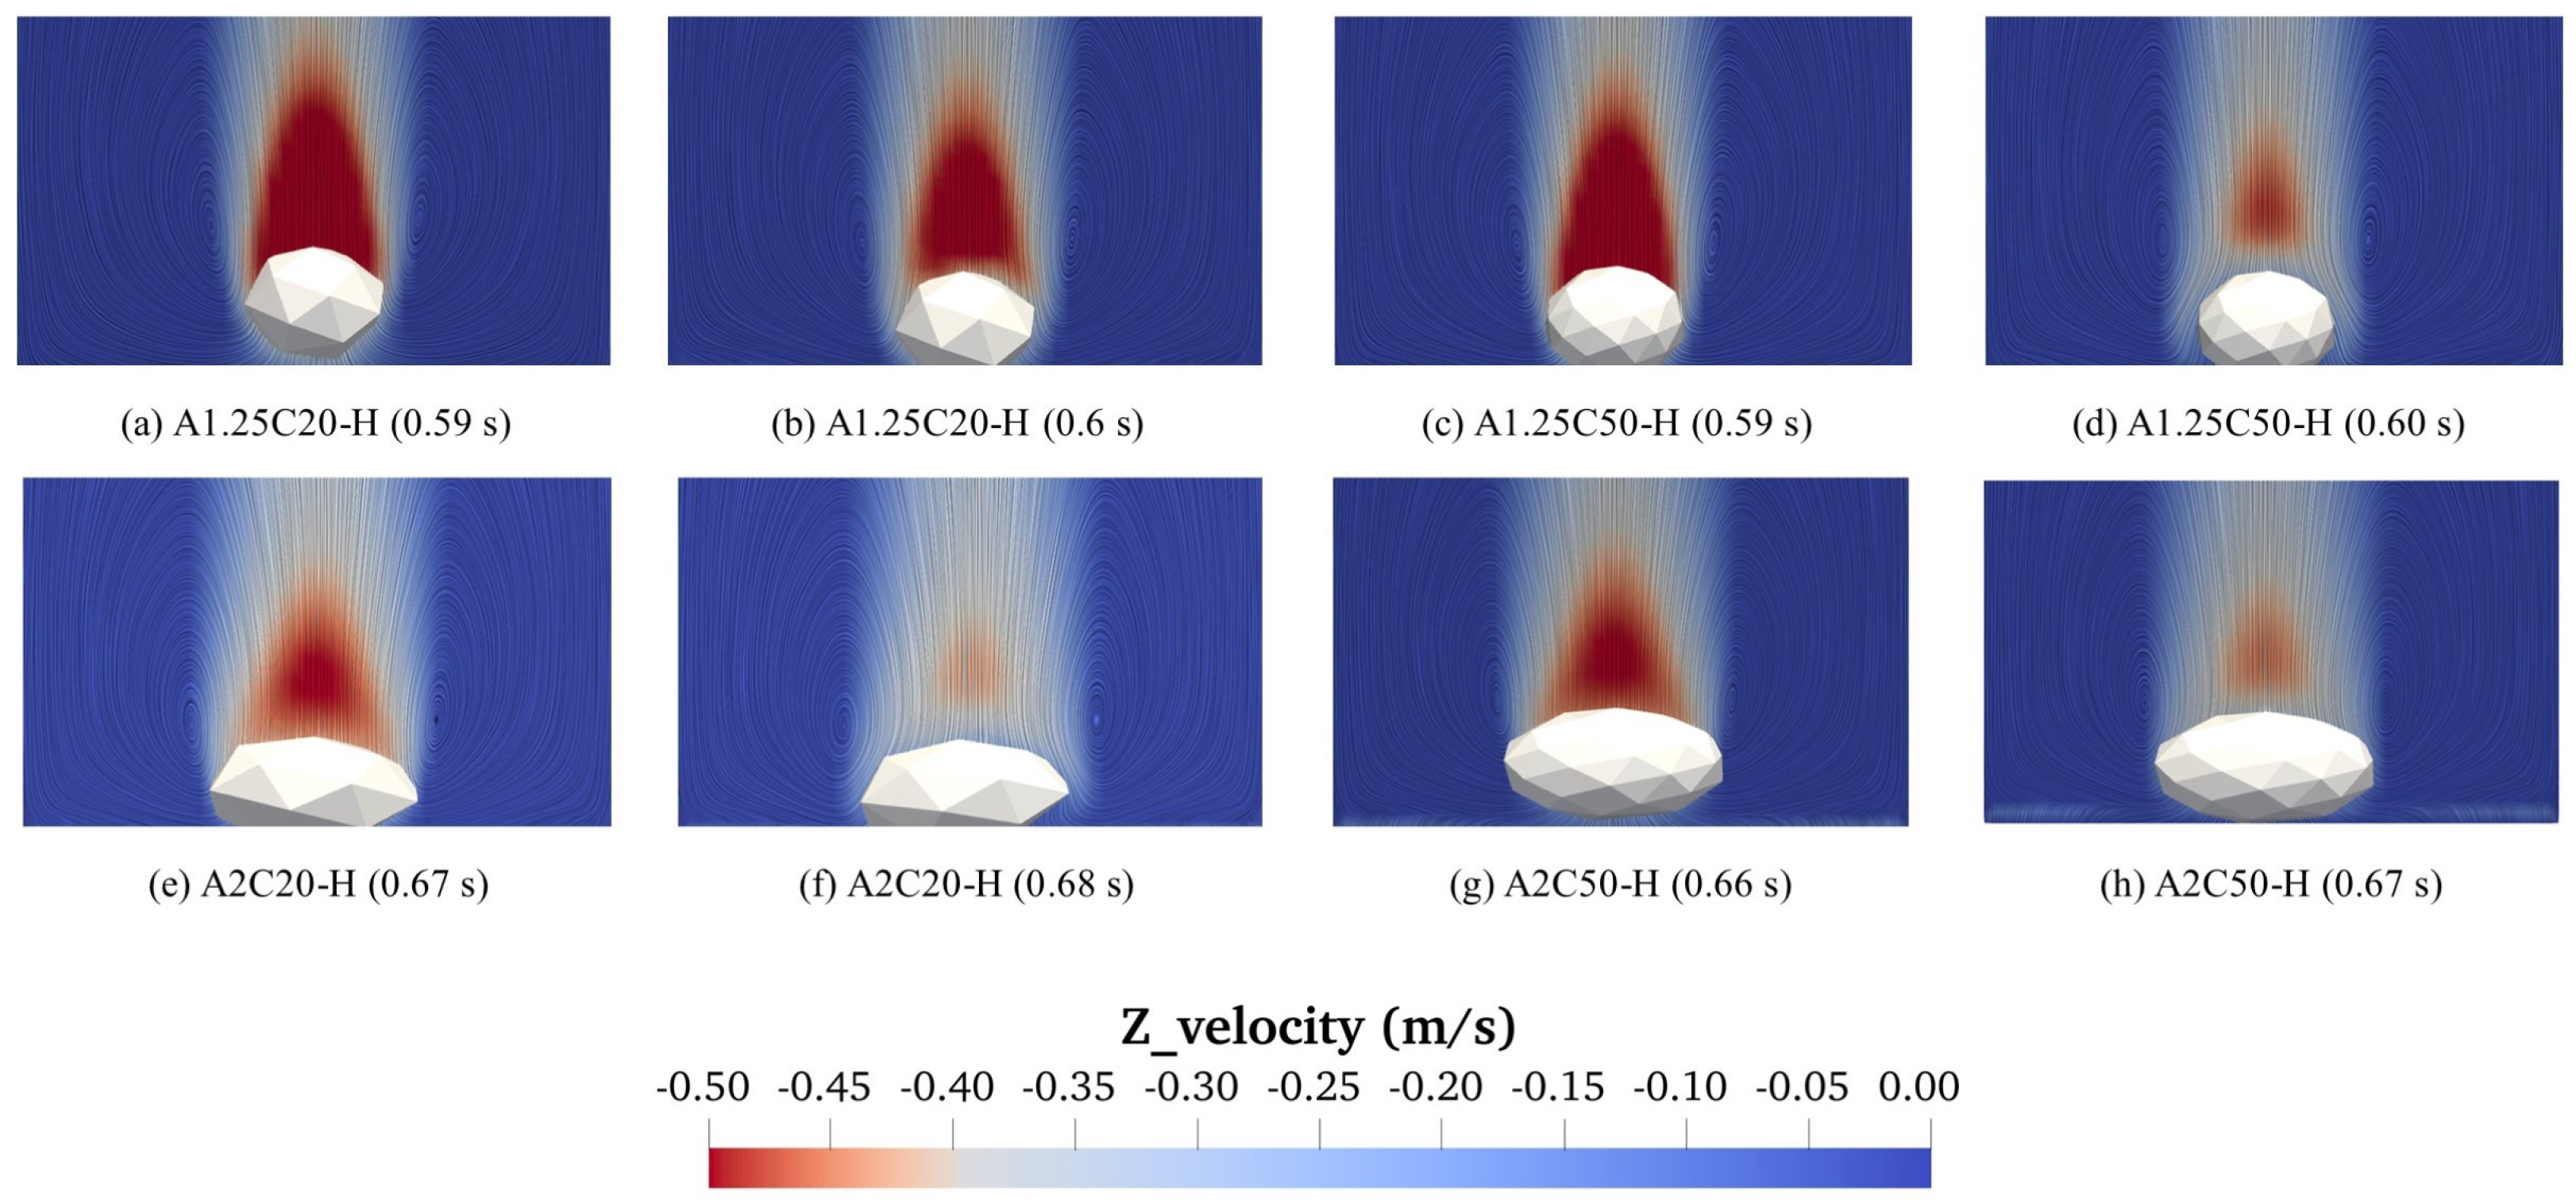
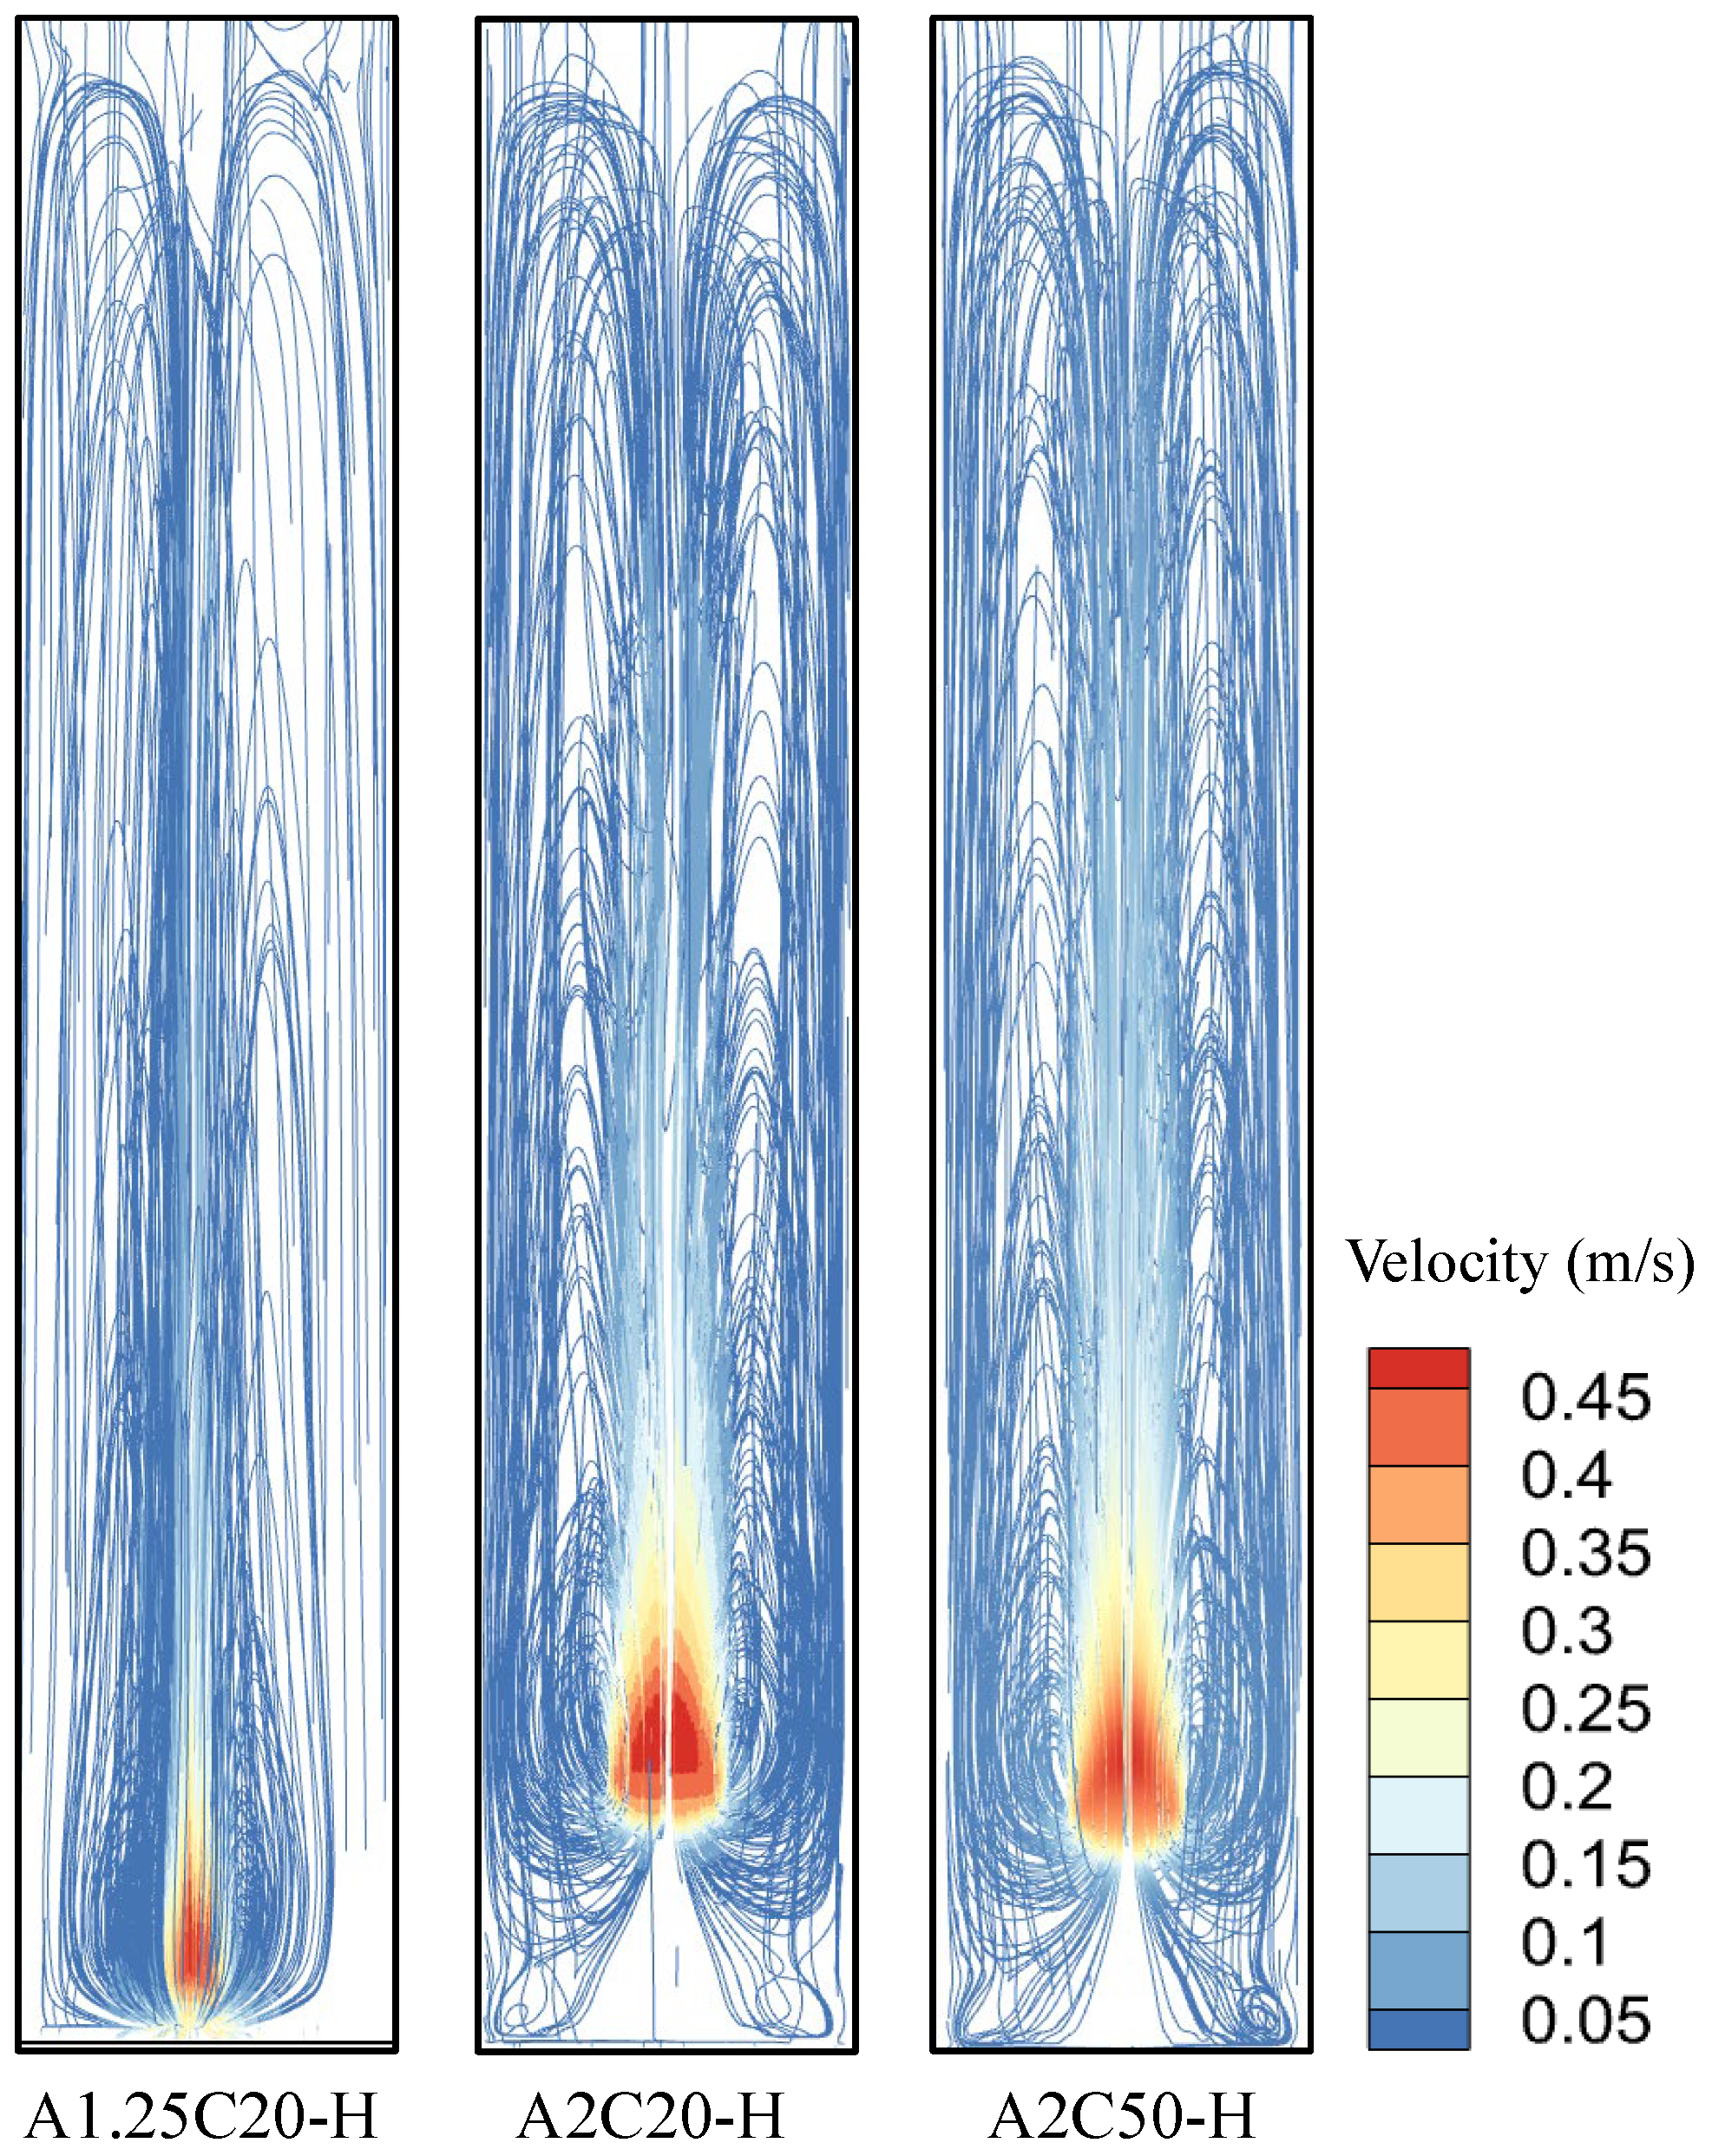
5.1.3. Hydrodynamic Characteristics in the Fluid

The interactions of fluid with particles and boundaries enhance the complexity of the fluid motion. The study of hydrodynamic characteristics in fluid–solid systems plays a crucial role in comprehending the fluid behavior in various natural and engineered phenomena. The evolution of fluid velocity fields leads to diverse hydrodynamic responses, including vortices, turbulence, boundary layer interactions, and wake patterns. These phenomena exert a substantial influence on the macroscopic behavior and microscopic characteristics of the fluid.
The resolved CFD-DEM method offers an effective way to forecast the evolution of fluid velocity fields and gain insights into complex flow patterns that are difficult to be capture through experiments. In this study, the line integral convolution (LIC) is employed to visualize the velocity field in resolved CFD. LIC is a widely accepted technique used to represent intricate fluid flow patterns and convey crucial information regarding velocity distribution in the fluid domain. By convolving the velocity vectors with a noise texture, this technique generates streak-like patterns that correspond to the flow’s direction and magnitude [58,59].
Figure 13 shows representative snapshots of the velocity field at different stages (Stage I, II, and III) of the free-settling process for various-shaped particles. The influence of gravity causes particles to experience a continuous downward acceleration, leading to a gradual increase in particle velocity. In stage I, the particle velocity is comparatively low, and the fluid velocity field remains relatively smooth. With the increasing settling velocity of particles, the F r e s correspondingly rises. During stage II, a significant transformation is observed in the velocity field of the fluid. As the particles descend, both the particle velocity and F r e s continue to increase, leading to non-uniformity in the fluid’s velocity field around the particles. The fluid beneath the particles experiences rapid compression, while the fluid above undergoes stretching, resulting in a reduction in velocity and the emergence of the gradient. Additionally, a wake forms in the fluid behind the particles. Within this wake, the fluid velocity is faster, with the highest velocity occurring at the center and gradually decreasing as it extends outward. In stage III, the velocity of the particles stabilizes, and they experience nearly balanced forces, resulting in dynamic equilibrium. The center velocity in the wake region reaches its maximum value during the free-settling process, leading to the formation of distinct vortex patterns. This phenomenon arises due to the uneven distribution of fluid velocities induced by the motion of particles [60,61].
Furthermore, as particles continuously descend, their velocities and the fluid wake region velocity remain stable. When particles approach the bottom boundary, variations in the fluid velocity field start to emerge in its vicinity. The presence of the bottom boundary alters the fluid velocity patterns, giving rise to a gradient in the fluid velocity field, as depicted in Figure 14. Substantial changes in the fluid velocity field arise upon particle collisions with the bottom boundary, resulting in rapid variations in fluid velocity and the formation of vortices. These interactions subject the particles to a reactive force from the bottom boundary, leading to deceleration. Additionally, these representative snapshots of the velocity fields demonstrate the influence of particle shape, particularly as the particle’s AR value increases. Larger surface contact with the fluid occurs beneath the particles, leading to elevated resistance. Resolved CFD-DEM effectively captures the intricate boundaries of the polyhedral particles.
The velocity contours and streamlines of the fluids in three cases (A1.25C20-H, A2C20-H, A2C50-H) at the time of 0.6s are presented in Figure 15. Notably, it can be observed that the fluid surrounding the particles exhibits higher velocity, while the fluid situated above the particles experiences deceleration as the height increases. It is evident that the fluid velocities differ across each case. For instance, for A2C20-H, the particle exhibits a slower velocity, yet its associated fluid velocity is relatively higher. This observation is attributed to the larger reaction force exerted by the particle on the fluid. Additionally, the velocity distribution of the fluid displays greater symmetry within its domain, with vortices being observed solely around the particles [5].
By understanding the progressive changes in hydrodynamic characteristics within fluid systems, we can improve our capacity to forecast and manipulate fluid behaviors in various contexts.

5.2. Vertical Deposing Particles Cases

As discussed in the preceding section, wherein particles were released horizontally, their velocity direction coincided with the orientation of the particles’ short diameter, resulting in enhanced stability during settling and reduced susceptibility to fluid disturbances. The determination of particle instability in water relies on assessing whether there is a change in the orientation of their long diameter during the settling process. Conversely, in this section, the particles are released with their long sides perpendicular to the settling direction, significantly increasing the possibility of particle destabilization due to the fluid forces acting on their sides.

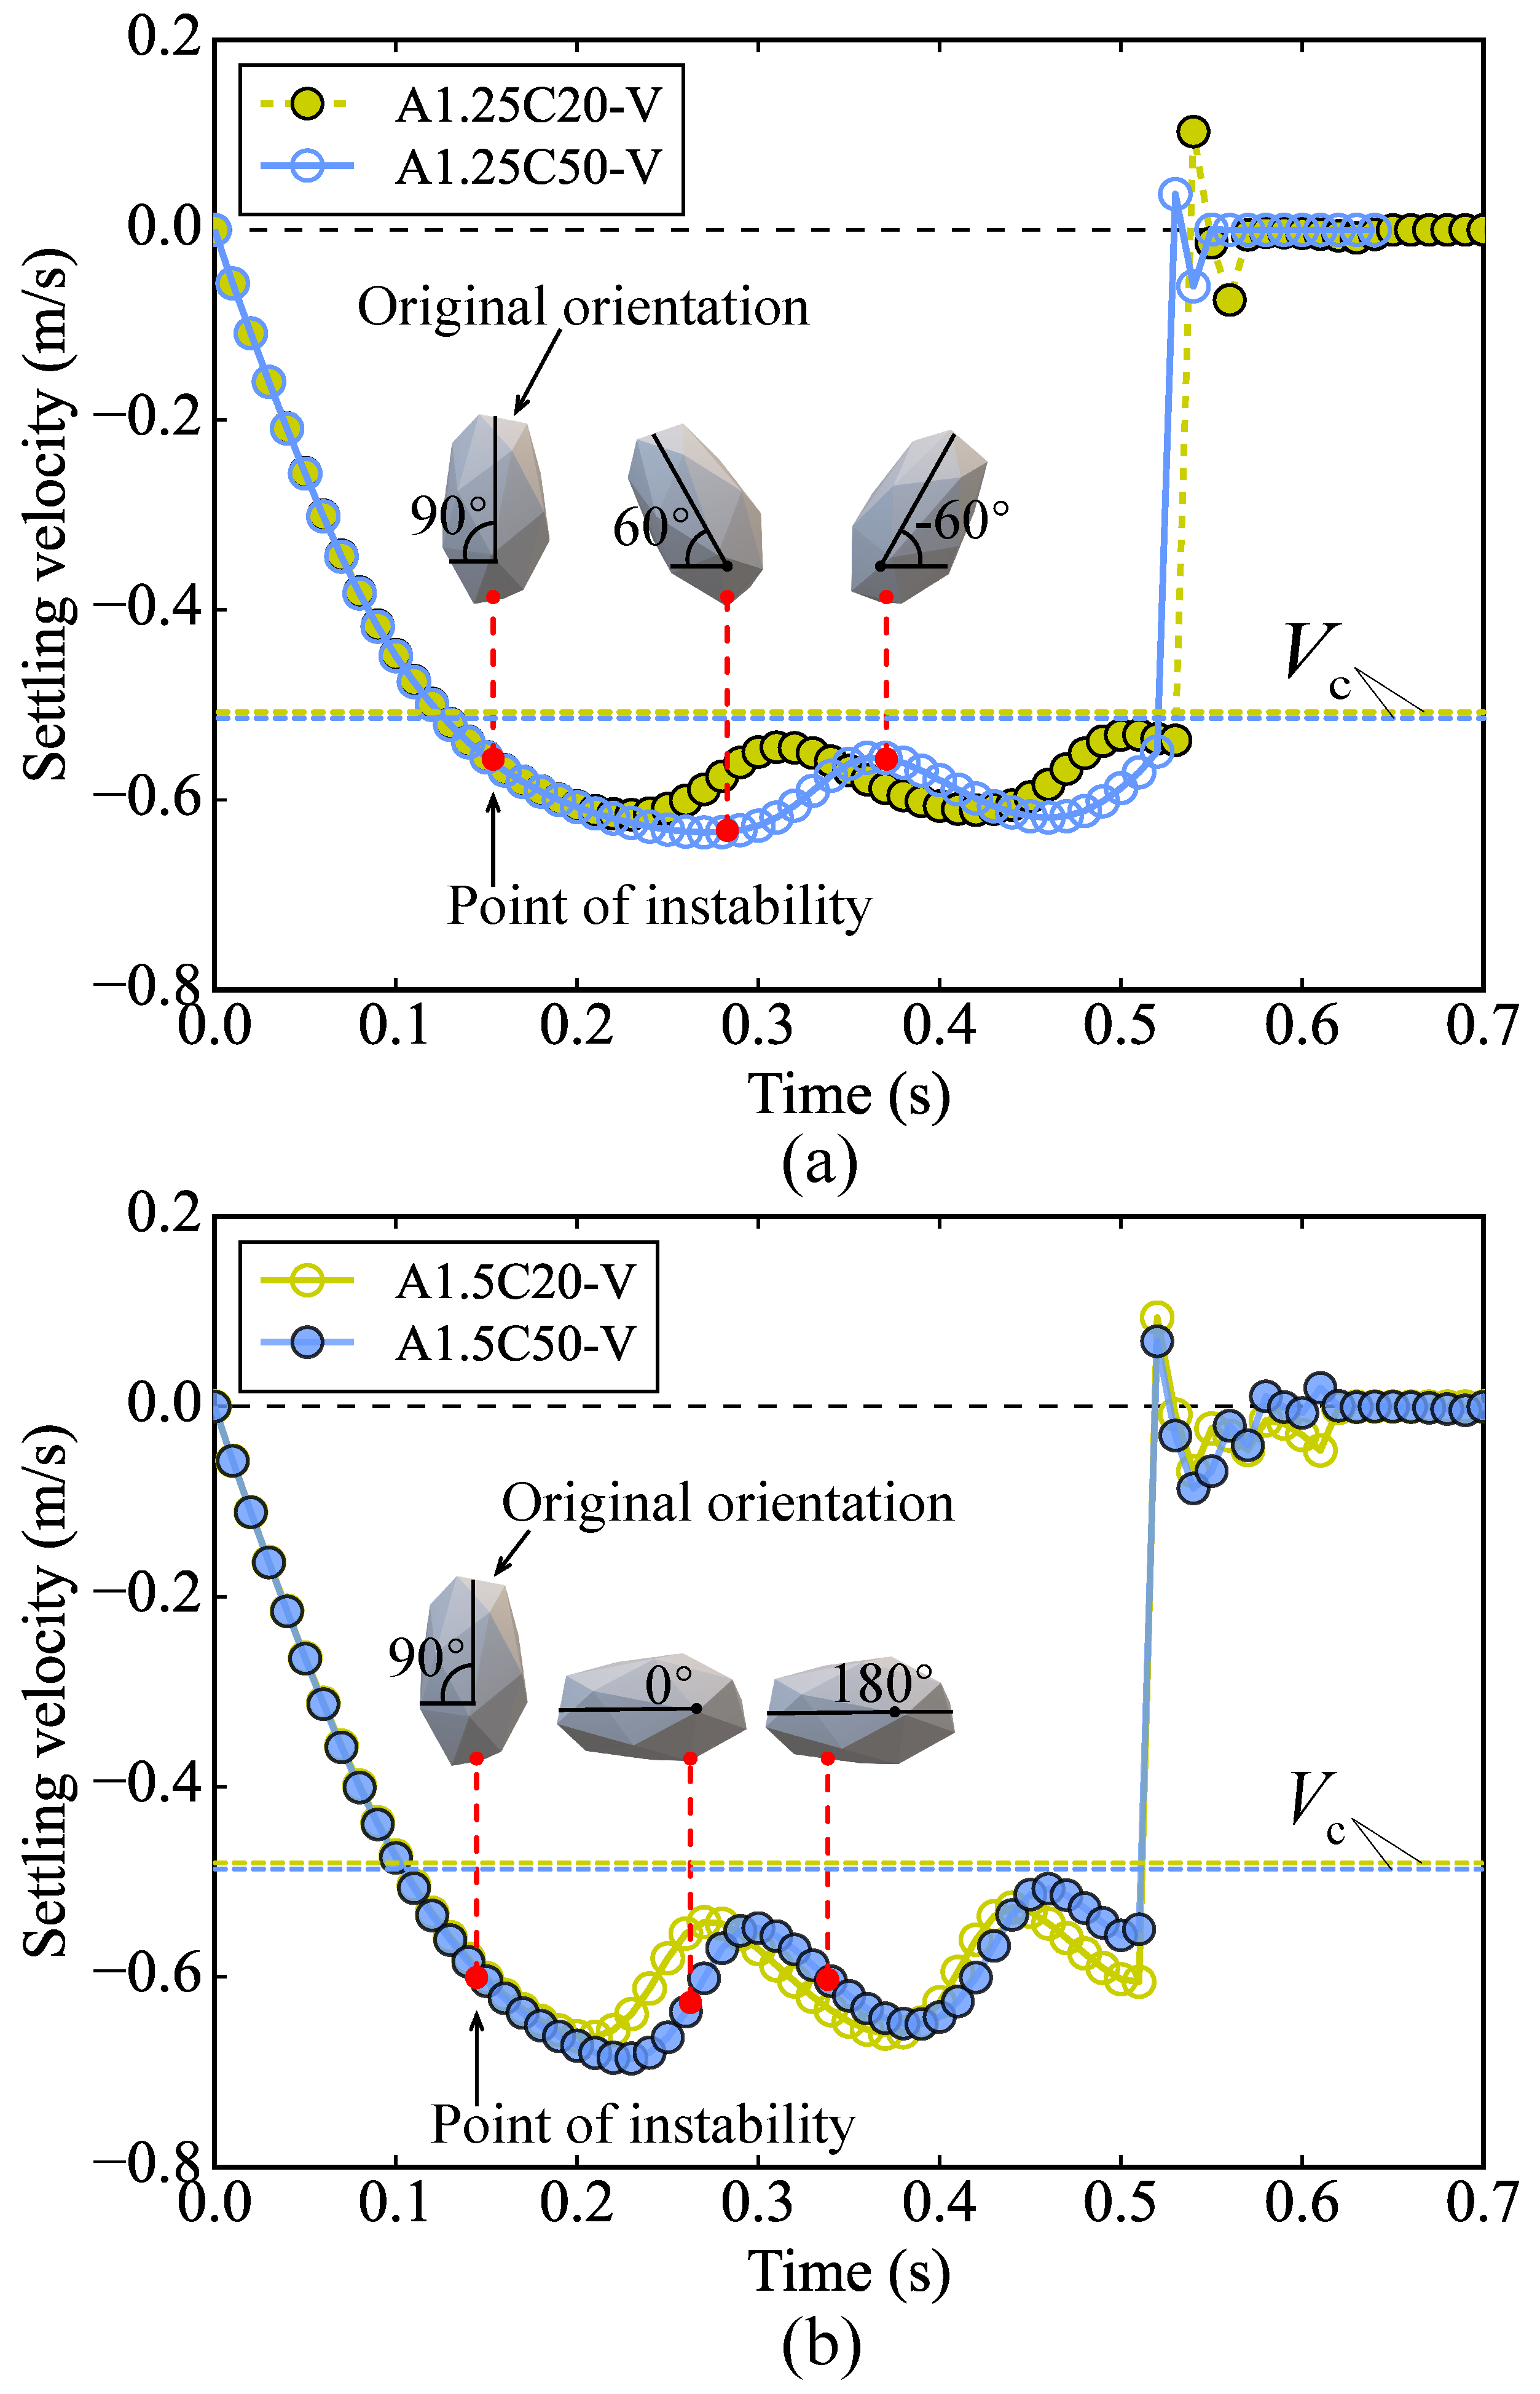
5.2.1. Effects of the Particle Shape on Free-Settling Velocity

As depicted in Figure 16, it is evident that the settling velocity in all four cases does not reach a stable plateau after initial acceleration. Instead, there is a tendency toward deceleration once the velocity reaches a certain point, followed by a subsequent increase after a period of time. This cyclic pattern of acceleration and deceleration continues until the particle eventually reaches the bottom. Based on these observations, the deceleration behavior observed during particle sedimentation is attributed to rotational motion. The presence of an asymmetric fluid disturbance subjects the particles to lateral forces, inducing rotation towards one side, which can be defined as oscillation behavior in Stringham et al. [56]. Consequently, during the rotation process, the upstream surface area of the particles gradually increases, resulting in a progressive increase in resistance. Notably, the velocity at this point exceeds the critical velocity V c discussed in the previous chapter, causing the fluid’s resistance to outweigh gravity, thereby leading to the deceleration of the particle. During the rotation of particles, the settling velocity curve exhibits peaks and valleys, while the particle velocity gradually converges towards the V c through repeated cycles of acceleration and deceleration. Furthermore, our observations reveal that the particles undergo destabilization at a specific point, leading to a rotation of the long diameter orientation to 60° from the horizontal, which reaches maximum velocity at the same time. Meanwhile, at the trough of the wave, the particles are oriented at an angle of 60° from the horizontal (Figure 16a). Additionally, the particles will attain a horizontal position between the peak and trough of the wave (Figure 16b). During the settling process of vertically released particles, those with a higher C value exhibit prolonged stabilization times, indicating greater resistance to fluid perturbation. This phenomenon can be attributed to the presence of more triangular facets comprising the particles, which results in a more uniform interaction of the fluid on the particles.
Figure 17 illustrates the rotational velocity of particles during the settling process. When subjected to an asymmetric fluid disturbance, the particles undergo deflection towards one side. This asymmetric force induced by fluid becomes more pronounced as the settling z-velocity increases. Consequently, after a certain duration of settling, the rotational velocity of the particles experiences rapid growth until the long axis of the particles aligns parallel to the horizontal line, reaching its peak rotational velocity. At this point, the particles encounter less disturbance, leading to a gradual decline in rotational speed. However, when the particles rotate in the direction of a larger fluid disturbance again due to inertia, particles begin to accelerate their rotation. During the settling process, particles with larger C values initiate rotation earlier and reach their peak rotational velocity faster. Particles with larger A R are capable of attaining higher maximum rotational speeds.

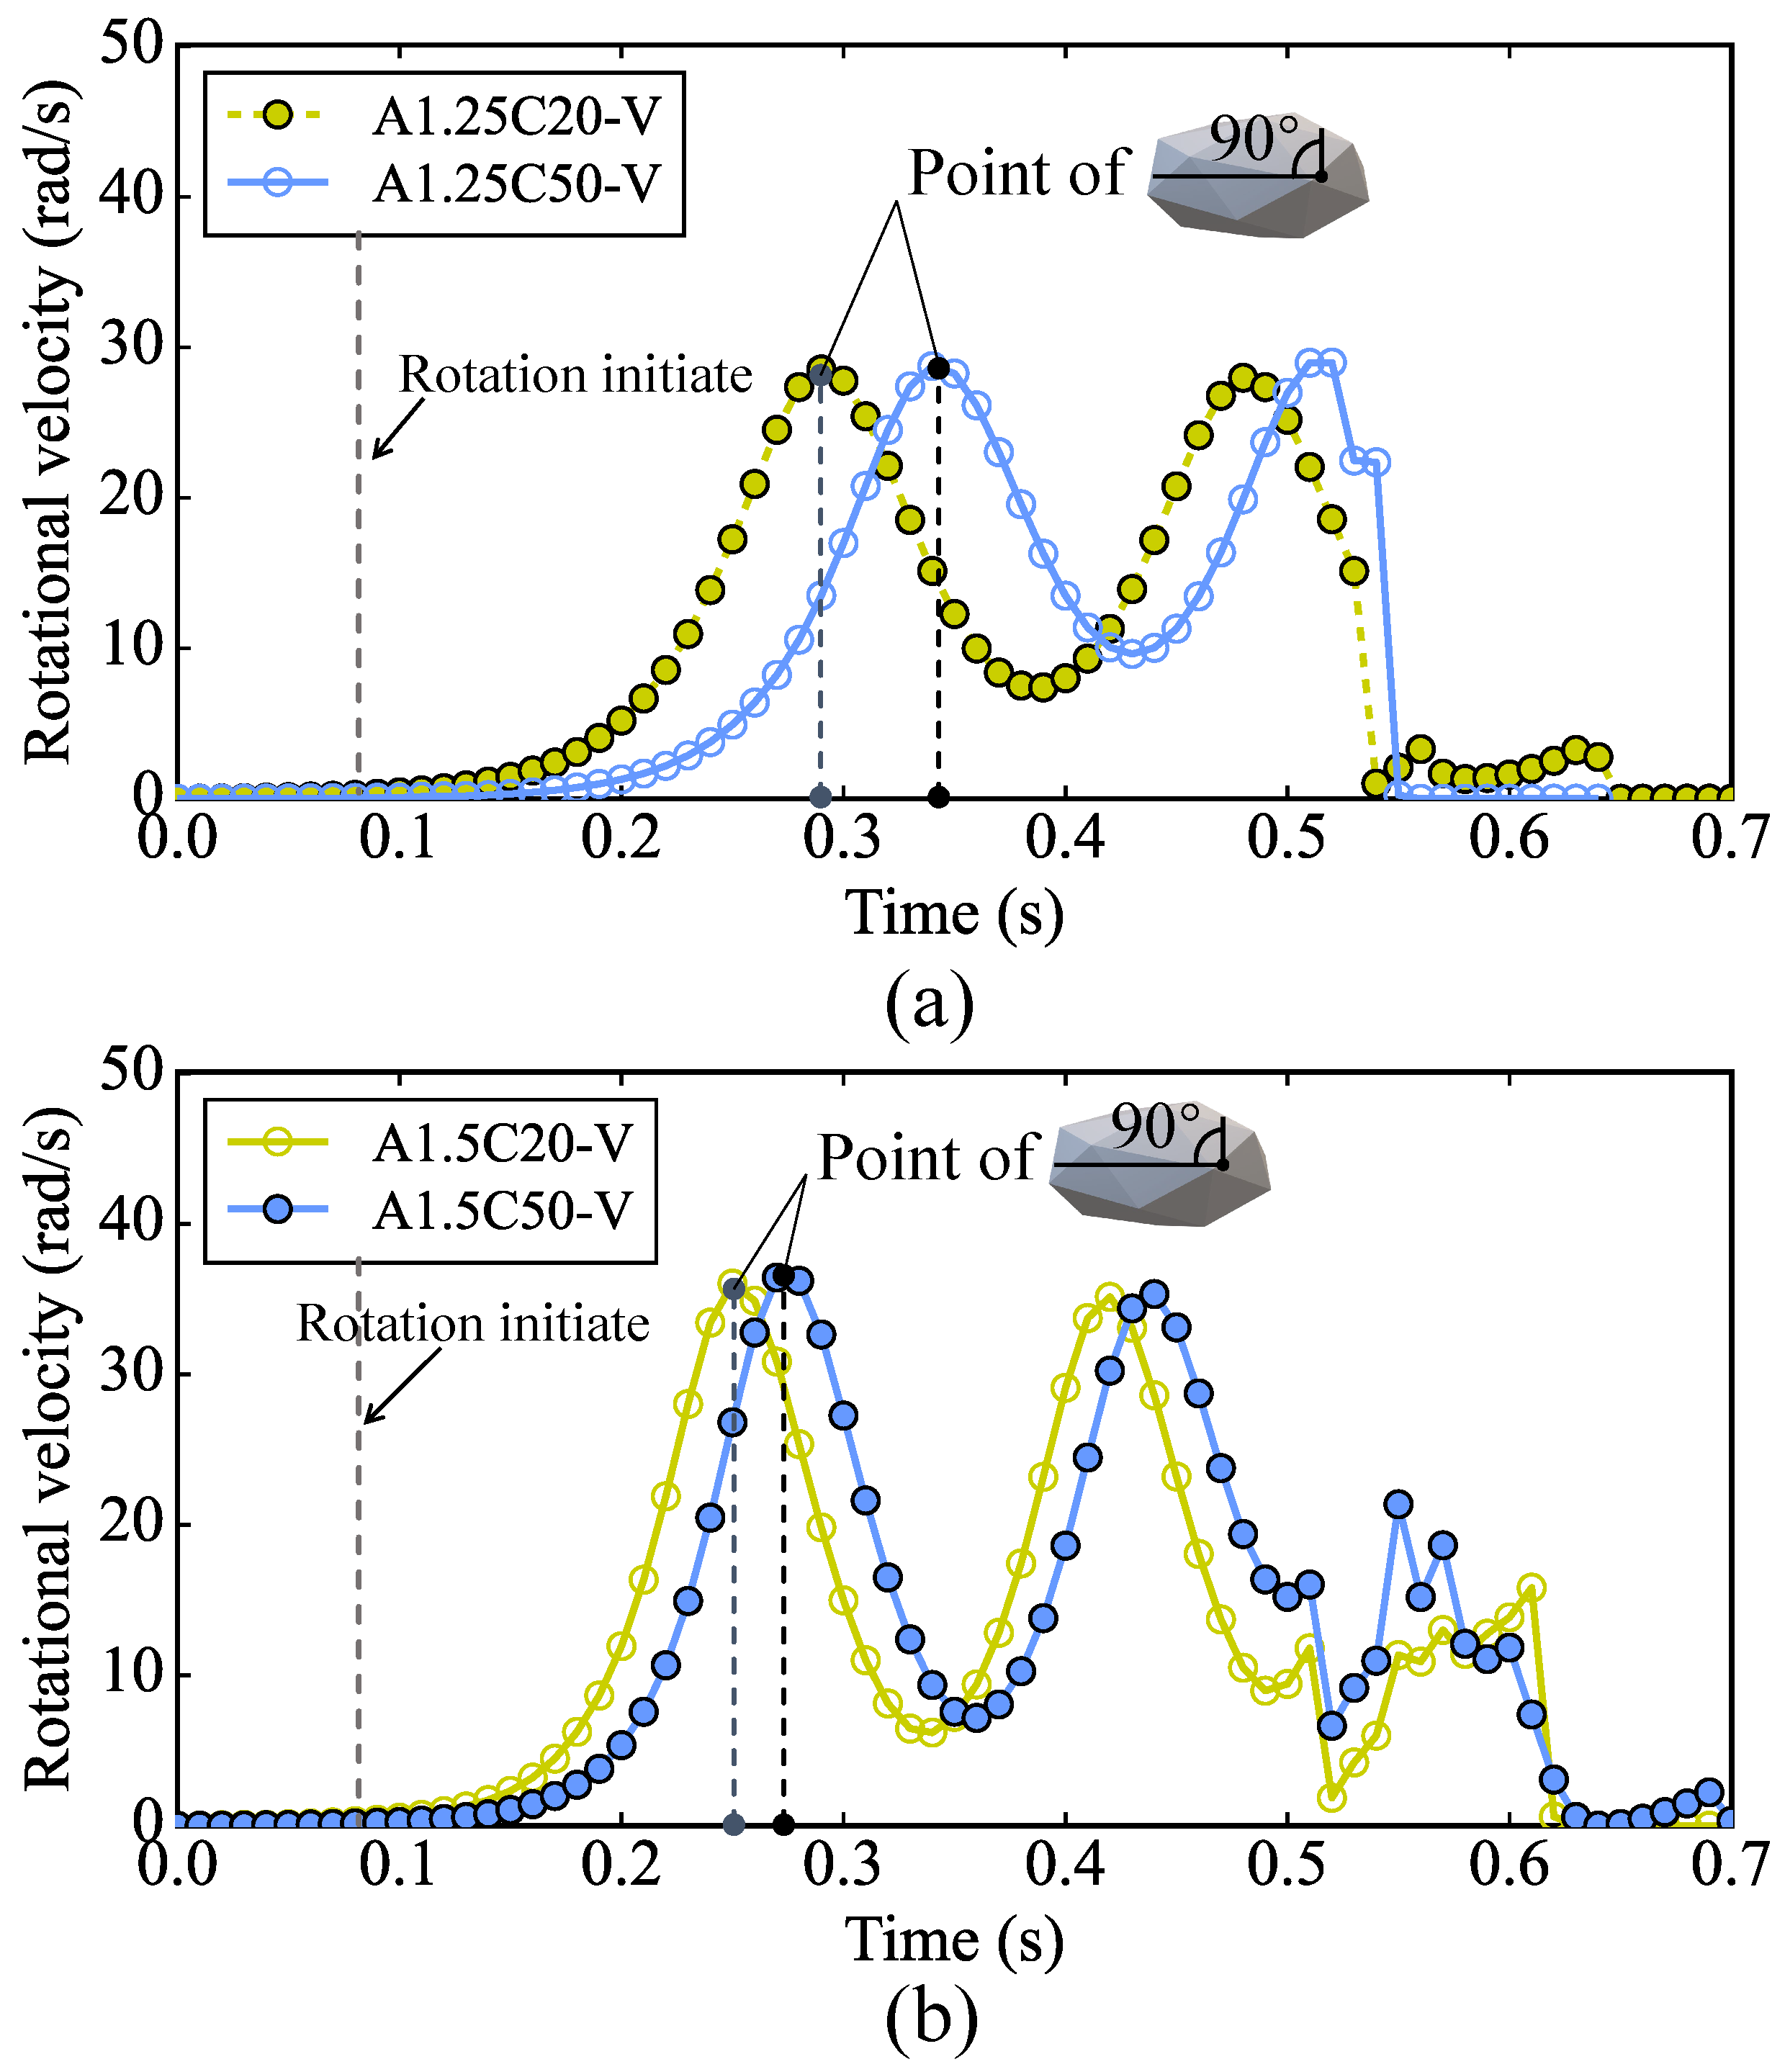
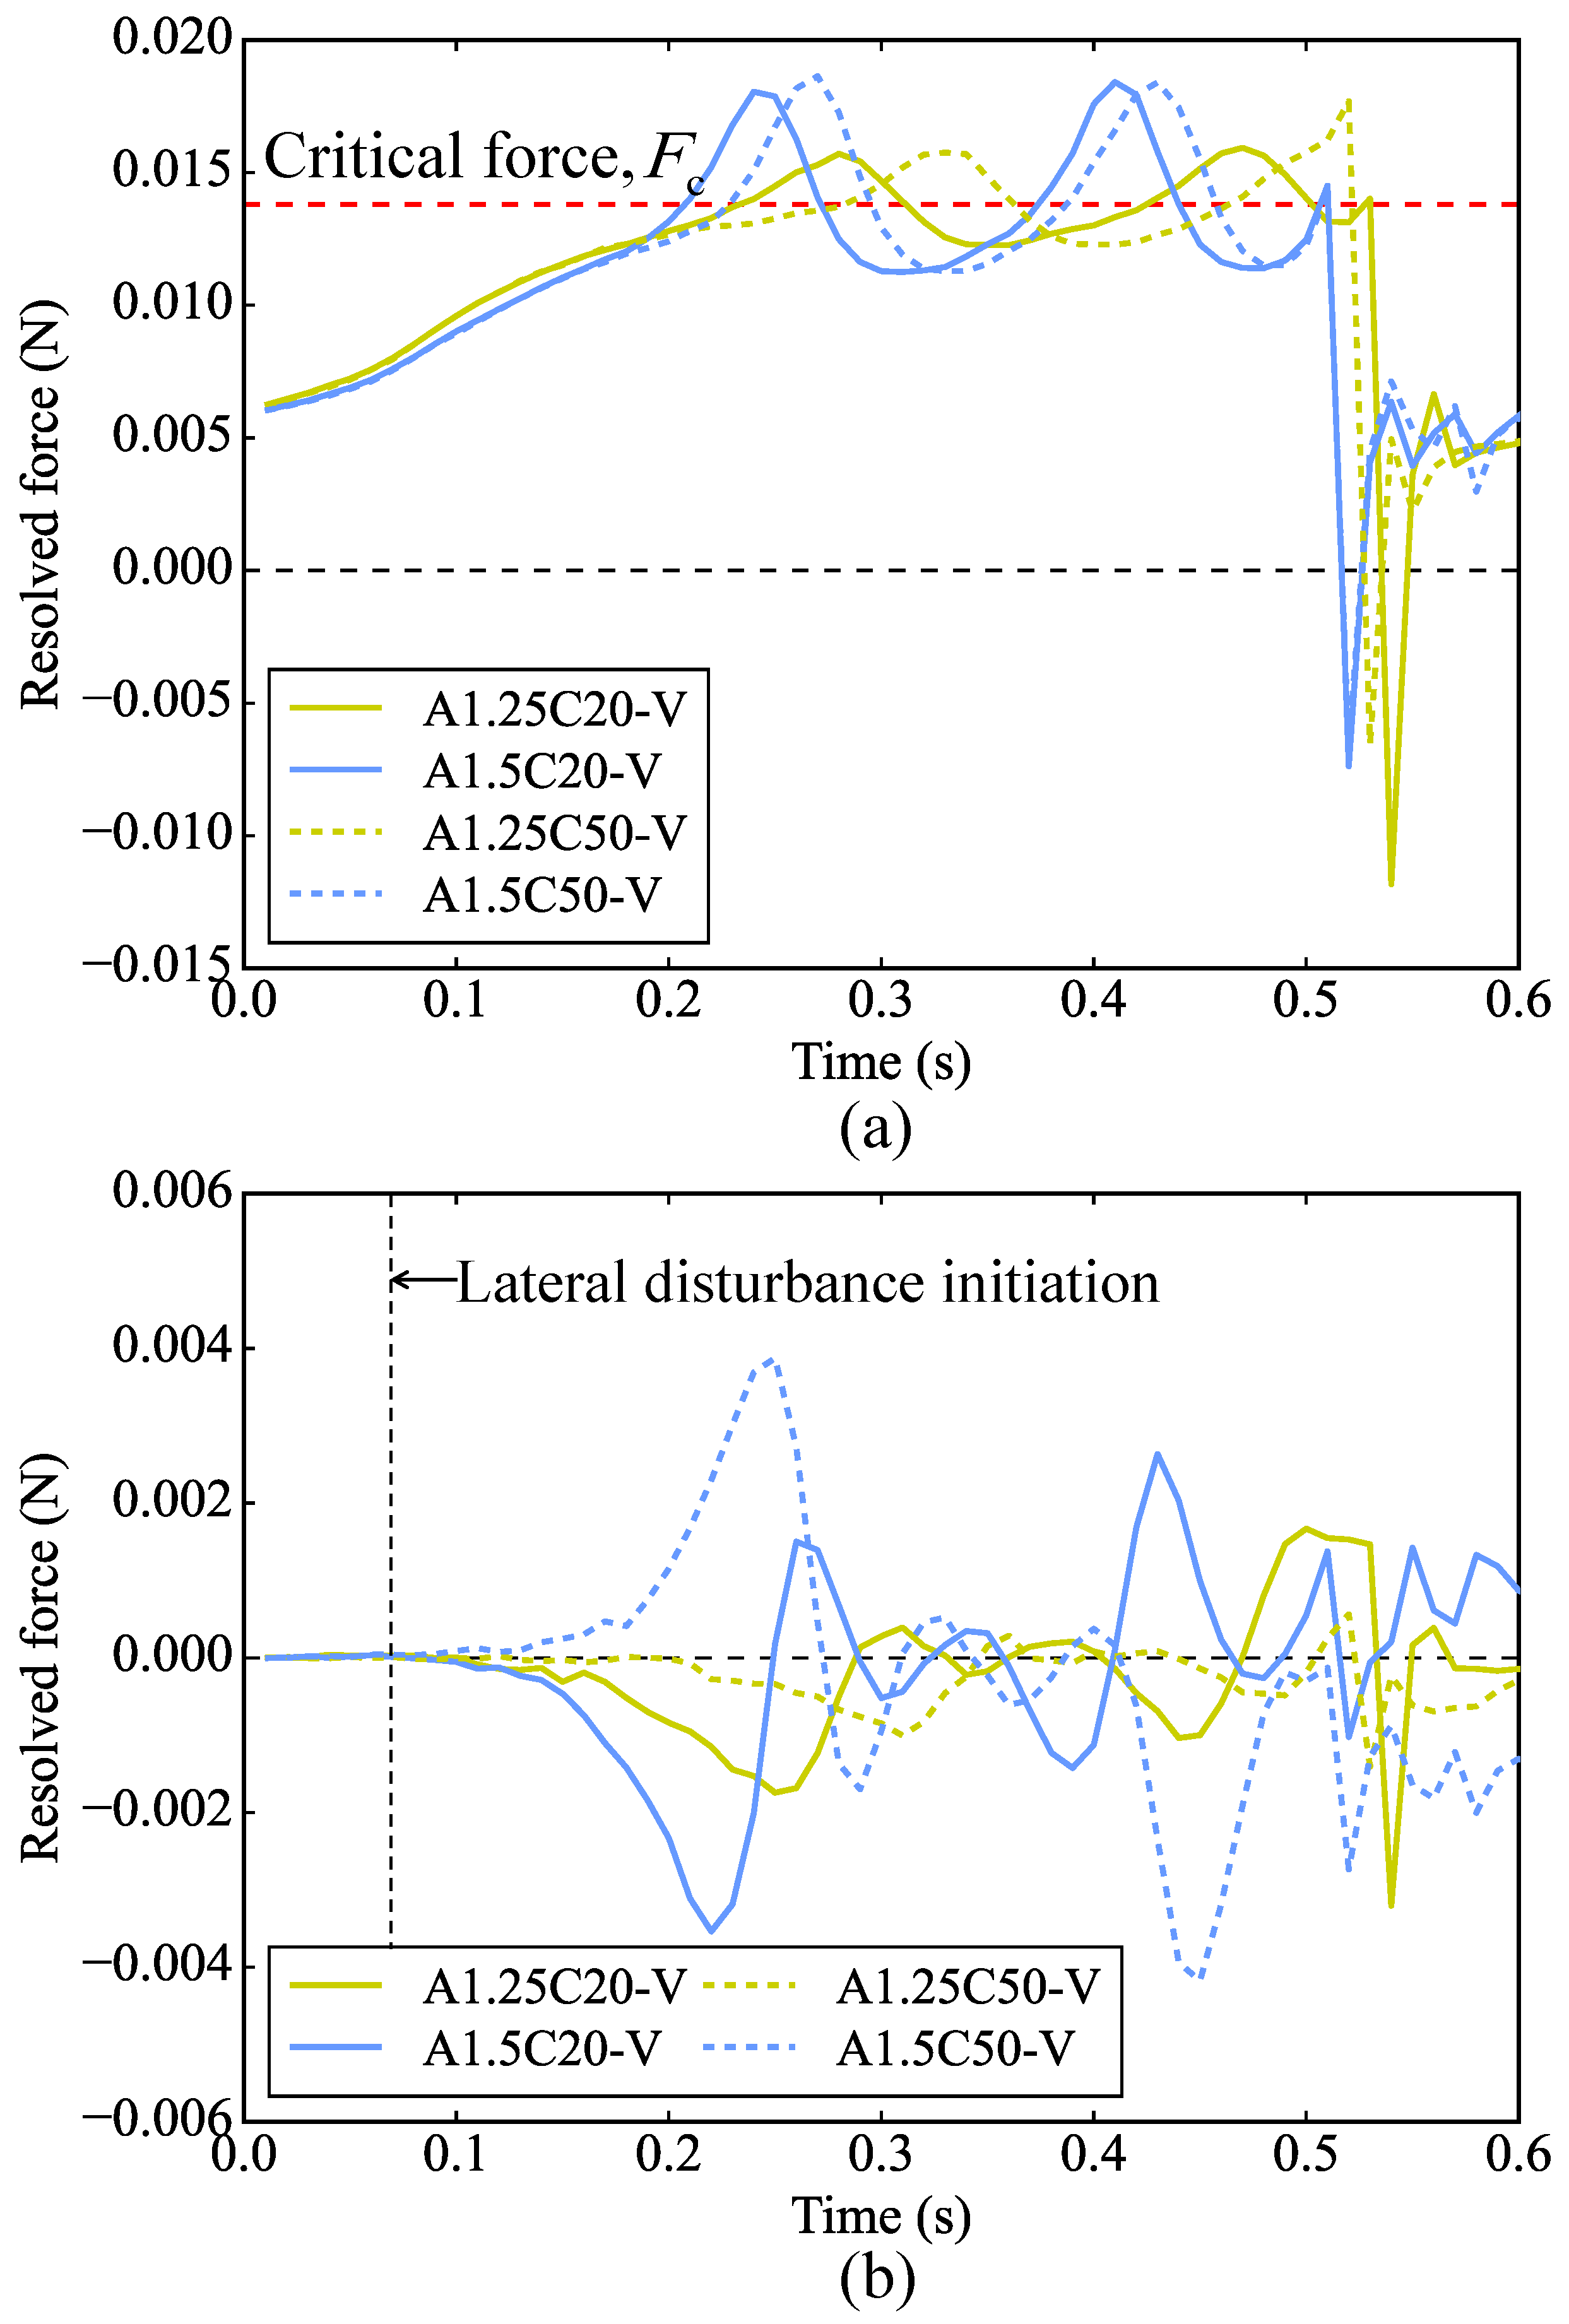
5.2.2. Kinematics Behavior during Settling

Figure 18 illustrates the vertical and horizontal forces acting on the particles via fluid during the settling process. Initially, the vertical force surpasses the F c at 0.2 s due to the smaller water-facing area resulting from the vertical release. However, the presence of lateral disturbance by fluid induces rotation of the particles, which in turn leads to an enlargement in the water-facing area. As the velocity increases, fluid resistance exceeds gravity, causing the particles to decelerate. Subsequently, when the deceleration is less than the F c , gravity prevails over resistance, leading to the acceleration of the settling particles. The fluid force undergoes repeated fluctuations around the F c until the particle ceases its rotation. After hitting the bottom, the particle briefly bounces back, during which the velocity direction becomes opposite to the direction of gravity. As a result, the fluid force acts in the same direction as gravity. After the particles have come to rest, the only remaining fluid force acting on them is buoyancy. Moreover, the horizontal force exerted on the particle gradually increases after 0.07 s, indicating an escalation in lateral disturbance of the particle by the fluid.

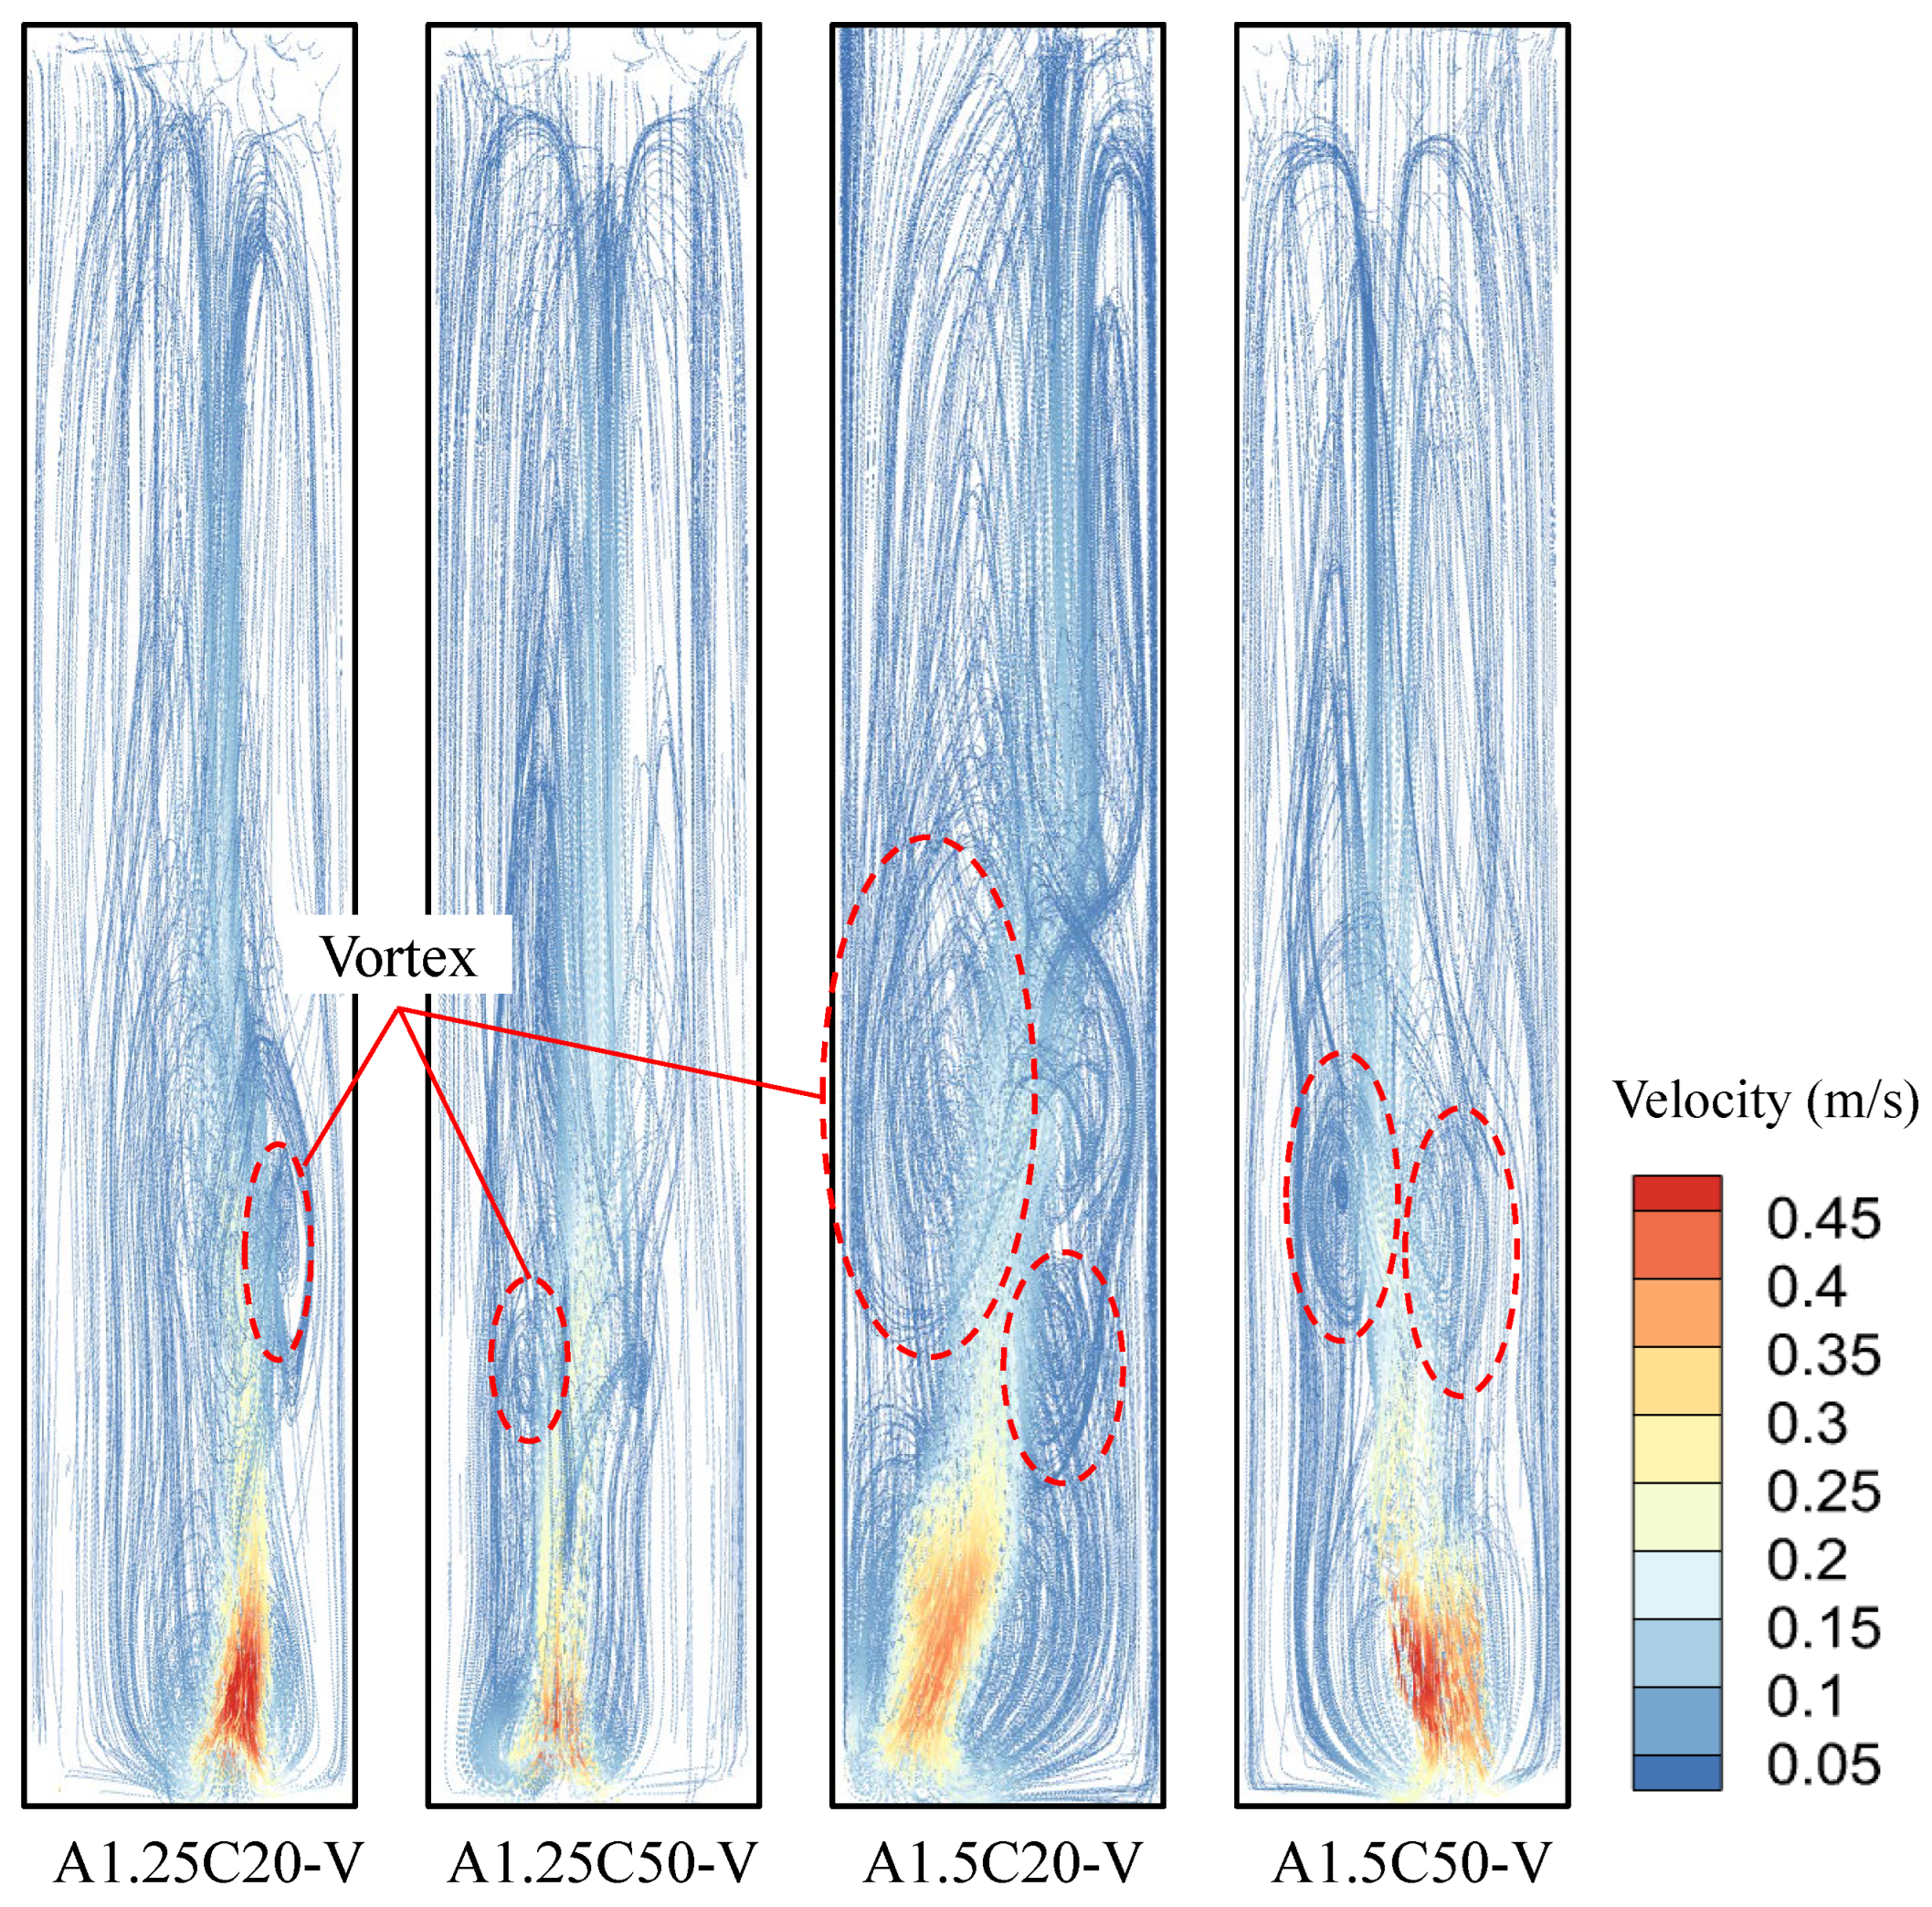
5.2.3. Hydrodynamic Characteristics in the Fluid

Figure 19 displays a momentary representation of the velocity field at both the peaks and valleys of the settling velocity curves (see Figure 16), obtained during the free-settling process with vertical release, for the distinct particle shapes. As depicted in the figure, due to the asymmetric fluid disturbance, a complex velocity field forms around them, resulting in the particles experiencing forces of different directions and magnitudes. The particles encounter greater fluid forces in specific directions, leading to changes in their orientations and inducing rotation. Particle rotation modifies the fluid’s velocity field, generating vortices and a velocity gradient. The particle velocities experience repetitive acceleration and deceleration cycles until they collide with the bottom boundary.
The fluid’s streamlines in the four cases (A1.25C20-V, A1.25C50-V, A1.5C20-V, A1.5C50-V) at the moment of 0.56 s are depicted in the Figure 20. Numerous vortices have congregated above the fluid, primarily due to the rotational motion of the particles. Notably, in the A1.5C20-V test scenario, the fluid experiences the highest level of disturbance, characterized by a broader array of vortices. Conversely, the A1.25C50-V test exhibits fewer and smaller vortices. This observation underscores the substantial influence of particle shape attributes (AR and C) on the entire fluid velocity domain. Specifically, a higher AR value results in a more pronounced disturbance of the fluid by the particles, as evidenced by the degree of fluid turbulence.
The simulation results not only facilitate the prediction of fluid behavior but also enhance comprehension of the fluid flow physics beyond the scope attainable through traditional experiments.

6. Conclusions

The article has presented a resolved CFD-DEM method to simulate the free-settling behavior of polyhedral particles in water. The method has been verified by comparing it with experimental data of ellipsoidal particle settling. The effects of particle shape parameters, such as aspect ratio and corner, on the settling velocity, kinematics, and hydrodynamic characteristics of the fluid–particle systems have also been explored. The study demonstrates that the resolved CFD-DEM method is a powerful technique for predicting complex particle–fluid phenomena in marine geotechnical engineering, include the transport, sedimentation, and erosion of seabed sediments, along with their environmental implications in marine ecosystems. Besides, the significant impact of particle shape on fluid disturbance and vortex generation offers insights and methods for controlling and optimizing fluid behavior.
1. Particle shape affects the particle velocity and its rotation during the settling process. As the AR value increases, the fluid resistance exerted on the particles strengthens, leading to a reduction in settling velocity. Conversely, an increase in the C weakens the fluid resistance towards the particles. These effects can be more pronounced when the particle is released in a vertical orientation.
2. Upon releasing particles with a long axis parallel to the settling direction, the particles are subjected to asymmetric fluid disturbance, causing the particles to deflect to one side and generate rotational motion. The particle z-velocity exhibits periodic cycles of acceleration and deceleration during the settling process.
3. Upon horizontal particle release, the fluid force exerted on the particles escalates in tandem with an augmented AR. The F c corresponding to gravitational balance remains the same among all these cases. In the case of vertical particle release, particle rotation triggers oscillations in the fluid force, repeatedly surpassing and falling below the critical force threshold. This dynamic explains the recurring deceleration and acceleration experienced by the particles.
4. The fluid velocity field around the particles changes significantly as the particles rotate due to the asymmetric fluid disturbance. The fluid below the particles is compressed, while the fluid above is stretched, resulting in a velocity gradient and a wake region behind the particles. The wake region has a higher fluid velocity and forms distinct vortex patterns that reflect the particle shape and orientation. The article also reveals that the larger the AR value, the more pronounced the fluid disturbance and turbulence caused by the particles, as evidenced by the degree of fluid vorticity and non-uniformity.

Author Contributions

Conceptualization, Z.Z.; Data curation, Z.Z. and Y.Q.; Formal analysis, Z.Z., Y.Q. and R.T.; Funding acquisition, H.X.; Investigation, Y.Q.; Methodology, H.X.; Resources, R.T.; Supervision, H.X.; Writing—Original draft, Z.Z.; Writing—Review and editing, Y.Q. and R.T. All authors have read and agreed to the published version of the manuscript.

Funding

This work was financially supported by the National Natural Science Foundation of China (No.52090084, No.52208354, and No.51938008).

Institutional Review Board Statement

Not applicable.

Informed Consent Statement

Not applicable.

Data Availability Statement

Not applicable.

Conflicts of Interest

The authors declare no conflict of interest.

Sample Availability

Samples are available from the corresponding author.

References

  1. Shahi, S.; Kuru, E. An experimental investigation of settling velocity of natural sands in water using Particle Image Shadowgraph. Powder Technol. 2015, 281, 184–192. [Google Scholar] [CrossRef]
  2. Guo, Y.; Yang, Y.; Yu, X.B. Influence of particle shape on the erodibility of non-cohesive soil: Insights from coupled CFD–DEM simulations. Particuology 2018, 39, 12–24. [Google Scholar] [CrossRef]
  3. Ten Cate, A.; Nieuwstad, C.; Derksen, J.J.; Van den Akker, H. Particle imaging velocimetry experiments and lattice-Boltzmann simulations on a single sphere settling under gravity. Phys. Fluids 2002, 14, 4012–4025. [Google Scholar] [CrossRef]
  4. Wang, Y.; Zhou, L.; Yang, Q. Hydro-mechanical analysis of calcareous sand with a new shape-dependent fluid-particle drag model integrated into CFD-DEM coupling program. Powder Technol. 2019, 344, 108–120. [Google Scholar] [CrossRef]
  5. Lai, Z.; Zhao, J.; Zhao, S.; Huang, L. Signed distance field enhanced fully resolved CFD-DEM for simulation of granular flows involving multiphase fluids and irregularly shaped particles. Comput. Methods Appl. Mech. Eng. 2023, 414, 116195. [Google Scholar] [CrossRef]
  6. Hu, Z.; Zhang, Y.; Yang, Z. Suffusion-induced deformation and microstructural change of granular soils: A coupled CFD–DEM study. Acta Geotech. 2019, 14, 795–814. [Google Scholar] [CrossRef]
  7. Ma, Q.; Wautier, A.; Zhou, W. Microscopic mechanism of particle detachment in granular materials subjected to suffusion in anisotropic stress states. Acta Geotech. 2021, 16, 2575–2591. [Google Scholar] [CrossRef]
  8. Temam, R. Navier-Stokes Equations: Theory and Numerical Analysis; American Mathematical Soc.: Providence, RI, USA, 2001; Volume 343. [Google Scholar]
  9. Hermange, C.; Oger, G.; Le Chenadec, Y.; Le Touzé, D. A 3D SPH–FE coupling for FSI problems and its application to tire hydroplaning simulations on rough ground. Comput. Methods Appl. Mech. Eng. 2019, 355, 558–590. [Google Scholar] [CrossRef]
  10. Zawawi, M.H.; Saleha, A.; Salwa, A.; Hassan, N.; Zahari, N.M.; Ramli, M.Z.; Muda, Z.C. A review: Fundamentals of computational fluid dynamics (CFD). In AIP Conference Proceedings; AIP Publishing: New York City, NY, USA, 2018; Volume 2030. [Google Scholar]
  11. Husson, J.; Terracol, M.; Deck, S.; Le Garrec, T. Critical assessment of wall model numerical implementation in LBM. Comput. Fluids 2023, 257, 105857. [Google Scholar] [CrossRef]
  12. Tavarez, F.A.; Plesha, M.E. Discrete element method for modelling solid and particulate materials. Int. J. Numer. Methods Eng. 2007, 70, 379–404. [Google Scholar] [CrossRef]
  13. Wachs, A. A DEM-DLM/FD method for direct numerical simulation of particulate flows: Sedimentation of polygonal isometric particles in a Newtonian fluid with collisions. Comput. Fluids 2009, 38, 1608–1628. [Google Scholar] [CrossRef]
  14. Ren, B.; Jin, Z.; Gao, R.; Wang, Y.X.; Xu, Z.L. SPH-DEM modeling of the hydraulic stability of 2D blocks on a slope. J. Waterw. Port Coast. Ocean Eng. 2014, 140, 04014022. [Google Scholar] [CrossRef]
  15. Wu, K.; Yang, D.; Wright, N. A coupled SPH-DEM model for fluid-structure interaction problems with free-surface flow and structural failure. Comput. Struct. 2016, 177, 141–161. [Google Scholar] [CrossRef]
  16. Canelas, R.B.; Crespo, A.J.; Domínguez, J.M.; Ferreira, R.M.; Gómez-Gesteira, M. SPH–DCDEM model for arbitrary geometries in free surface solid–fluid flows. Comput. Phys. Commun. 2016, 202, 131–140. [Google Scholar] [CrossRef]
  17. Han, K.; Feng, Y.; Owen, D. Numerical simulations of irregular particle transport in turbulent flows using coupled LBM-DEM. Comput. Model. Eng. Sci. 2007, 18, 87. [Google Scholar]
  18. De Rosis, A.; Falcucci, G.; Ubertini, S.; Ubertini, F. A coupled lattice Boltzmann-finite element approach for two-dimensional fluid–structure interaction. Comput. Fluids 2013, 86, 558–568. [Google Scholar] [CrossRef]
  19. Xiong, H.; Yin, Z.Y.; Zhao, J.; Yang, Y. Investigating the effect of flow direction on suffusion and its impacts on gap-graded granular soils. Acta Geotech. 2021, 16, 399–419. [Google Scholar] [CrossRef]
  20. Xiong, H.; Zhang, Z.; Sun, X.; Yin, Z.y.; Chen, X. Clogging effect of fines in seepage erosion by using CFD–DEM. Comput. Geotech. 2022, 152, 105013. [Google Scholar] [CrossRef]
  21. Chen, F.; Xiong, H.; Wang, X.; Yin, Z.Y. Transmission effect of eroded particles in suffusion using the CFD-DEM coupling method. Acta Geotech. 2022, 18, 335–354. [Google Scholar] [CrossRef]
  22. Wang, X.; Tang, Y.; Huang, B.; Hu, T.; Ling, D. Review on numerical simulation of the internal soil erosion mechanisms using the discrete element method. Water 2021, 13, 169. [Google Scholar] [CrossRef]
  23. Zhang, F.; Wang, T.; Liu, F.; Peng, M.; Furtney, J.; Zhang, L. Modeling of fluid-particle interaction by coupling the discrete element method with a dynamic fluid mesh: Implications to suffusion in gap-graded soils. Comput. Geotech. 2020, 124, 103617. [Google Scholar] [CrossRef]
  24. Xiong, H.; Qiu, Y.; Liu, J.; Yin, Z.Y.; Chen, X. Macro–microscopic mechanism of suffusion in calcareous sand under tidal fluctuations by coupled CFD-DEM. Comput. Geotech. 2023, 162, 105676. [Google Scholar] [CrossRef]
  25. Xiong, H.; Zhang, Z.; Yang, J.; Yin, Z.Y.; Chen, X. Role of inherent anisotropy in infiltration mechanism of suffusion with irregular granular skeletons. Comput. Geotech. 2023, 162, 105692. [Google Scholar] [CrossRef]
  26. Kanitz, M.; Grabe, J. The influence of the void fraction on the particle migration: A coupled computational fluid dynamics–discrete element method study about drag force correlations. Int. J. Numer. Anal. Methods Geomech. 2021, 45, 45–63. [Google Scholar] [CrossRef]
  27. Golshan, S.; Sotudeh-Gharebagh, R.; Zarghami, R.; Mostoufi, N.; Blais, B.; Kuipers, J. Review and implementation of CFD-DEM applied to chemical process systems. Chem. Eng. Sci. 2020, 221, 115646. [Google Scholar] [CrossRef]
  28. Hu, Z.; Zhang, Y.; Yang, Z. Suffusion-induced evolution of mechanical and microstructural properties of gap-graded soils using CFD-DEM. J. Geotech. Geoenvironmental Eng. 2020, 146, 04020024. [Google Scholar] [CrossRef]
  29. Qian, J.G.; Li, W.Y.; Yin, Z.Y.; Yang, Y. Influences of buried depth and grain size distribution on seepage erosion in granular soils around tunnel by coupled CFD-DEM approach. Transp. Geotech. 2021, 29, 100574. [Google Scholar] [CrossRef]
  30. Mu, L.; Zhang, P.; Shi, Z.; Huang, M. Coupled CFD–DEM investigation of erosion accompanied by clogging mechanism under different hydraulic gradients. Comput. Geotech. 2023, 153, 105058. [Google Scholar] [CrossRef]
  31. Anderson, T.B.; Jackson, R. Fluid mechanical description of fluidized beds. Equations of motion. Ind. Eng. Chem. Fundam. 1967, 6, 527–539. [Google Scholar] [CrossRef]
  32. Cheng, K.; Wang, Y.; Yang, Q. A semi-resolved CFD-DEM model for seepage-induced fine particle migration in gap-graded soils. Comput. Geotech. 2018, 100, 30–51. [Google Scholar] [CrossRef]
  33. Bérard, A.; Patience, G.S.; Blais, B. Experimental methods in chemical engineering: Unresolved CFD-DEM. Can. J. Chem. Eng. 2020, 98, 424–440. [Google Scholar] [CrossRef]
  34. Schnorr Filho, E.A.; Lima, N.C.; Franklin, E.M. Resolved CFD-DEM simulations of the hydraulic conveying of coarse grains through a very-narrow elbow. Powder Technol. 2022, 395, 811–821. [Google Scholar] [CrossRef]
  35. Gago, P.A.; Raeini, A.Q.; King, P. A spatially resolved fluid-solid interaction model for dense granular packs/soft-sand. Adv. Water Resour. 2020, 136, 103454. [Google Scholar] [CrossRef]
  36. Ma, H.; Zhou, L.; Liu, Z.; Chen, M.; Xia, X.; Zhao, Y. A review of recent development for the CFD-DEM investigations of non-spherical particles. Powder Technol. 2022, 412, 117972. [Google Scholar] [CrossRef]
  37. Song, S.; Park, S. Unresolved CFD and DEM coupled solver for particle-laden flow and its application to single particle settlement. J. Mar. Sci. Eng. 2020, 8, 983. [Google Scholar] [CrossRef]
  38. Zhou, C.; Qian, J.G.; Yin, Z.Y.; Liu, Y.J.; Du, Z.B. Effect of particle shape and bedding angle on suffusion in gap-graded granular soils by coupled CFD-DEM method. Int. J. Numer. Anal. Methods Geomech. 2023, 47, 1373–1398. [Google Scholar] [CrossRef]
  39. Chen, Q.; Xiong, T.; Zhang, X.; Jiang, P. Study of the hydraulic transport of non-spherical particles in a pipeline based on the CFD-DEM. Eng. Appl. Comput. Fluid Mech. 2020, 14, 53–69. [Google Scholar] [CrossRef]
  40. Ning, Z.; Boerefijn, R.; Ghadiri, M.; Thornton, C. Distinct element simulation of impact breakage of lactose agglomerates. Adv. Powder Technol. 1997, 8, 15–37. [Google Scholar] [CrossRef]
  41. Williams, J.R.; Pentland, A.P. Superquadrics and modal dynamics for discrete elements in interactive design. Eng. Comput. 1992, 9, 115–127. [Google Scholar] [CrossRef]
  42. Wadell, H. Volume, shape, and roundness of rock particles. J. Geol. 1932, 40, 443–451. [Google Scholar] [CrossRef]
  43. Mitchell, J.K.; Soga, K. Fundamentals of Soil Behavior; John Wiley & Sons: New York, NY, USA, 2005; Volume 3. [Google Scholar]
  44. Zou, Y.; Chen, C.; Zhang, L. Simulating progression of internal erosion in gap-graded sandy gravels using coupled CFD-DEM. Int. J. Geomech. 2020, 20, 04019135. [Google Scholar] [CrossRef]
  45. Hertz, H. Über die Berührung Fester Elastischer Körper (on the contact of elastic solids). J. FüR Reine Angew. Math. 1986, 92, 156. [Google Scholar]
  46. Tsuji, Y.; Tanaka, T.; Ishida, T. Lagrangian numerical simulation of plug flow of cohesionless particles in a horizontal pipe. Powder Technol. 1992, 71, 239–250. [Google Scholar] [CrossRef]
  47. Mindlin, R.D.; Deresiewicz, H. Elastic spheres in contact under varying oblique forces. J. Appl. Mech. 1953, 20, 327–344. [Google Scholar] [CrossRef]
  48. Peskin, C.S. Flow patterns around heart valves: A numerical method. J. Comput. Phys. 1972, 10, 252–271. [Google Scholar] [CrossRef]
  49. Verzicco, R. Immersed boundary methods: Historical perspective and future outlook. Annu. Rev. Fluid Mech. 2023, 55, 129–155. [Google Scholar] [CrossRef]
  50. Saiki, E.M.; Biringen, S. Numerical simulation of a cylinder in uniform flow: Application of a virtual boundary method. J. Comput. Phys. 1996, 123, 450–465. [Google Scholar] [CrossRef]
  51. Lai, M.C.; Peskin, C.S. An immersed boundary method with formal second-order accuracy and reduced numerical viscosity. J. Comput. Phys. 2000, 160, 705–719. [Google Scholar] [CrossRef]
  52. Wang, Z.; Liu, M. Semi-resolved CFD–DEM for thermal particulate flows with applications to fluidized beds. Int. J. Heat Mass Transf. 2020, 159, 120150. [Google Scholar] [CrossRef]
  53. Chen, F.; Jiang, S.; Xiong, H.; Yin, Z.y.; Chen, X. Micro pore analysis of suffusion in filter layer using tri-layer CFD–DEM model. Comput. Geotech. 2023, 156, 105303. [Google Scholar] [CrossRef]
  54. Bao, X.; Wu, H.; Xiong, H.; Chen, X. Particle shape effects on submarine landslides via CFD-DEM. Ocean Eng. 2023, 284, 115140. [Google Scholar] [CrossRef]
  55. Chen, F.; Xiong, H.; Yin, Z.Y.; Chen, X. Impermeable and mechanical stability of filter cake under different infiltration conditions via CFD-DEM. Acta Geotech. 2023, 18, 4115–4140. [Google Scholar] [CrossRef]
  56. Stringham, G.E.; Simons, D.B.; Guy, H.P. The Behavior of Large Particles Falling in Quiescent Liquids; US Government Printing Office: Washington, DC, USA, 1969.
  57. Xie, Z.; Wang, S.; Shen, Y. A novel hybrid CFD-DEM method for high-fidelity multi-resolution modelling of cross-scale particulate flow. Chem. Eng. J. 2023, 455, 140731. [Google Scholar] [CrossRef]
  58. Karimi, D.; Jaguemont, J.; Behi, H.; Berecibar, M.; Van Den Bossche, P.; Van Mierlo, J. Passive cooling based battery thermal management using phase change materials for electric vehicles. In Proceedings of the EVS33 International Electric Vehicle Symposium, Portland, OR, USA, 14–17 June 2020. [Google Scholar]
  59. Hlawatsch, M.; Sadlo, F.; Weiskopf, D. Hierarchical line integration. IEEE Trans. Vis. Comput. Graph. 2010, 17, 1148–1163. [Google Scholar] [CrossRef]
  60. Wu, S.; Zuo, Z.; Stone, H.A.; Liu, S. Motion of a free-settling spherical particle driven by a laser-induced bubble. Phys. Rev. Lett. 2017, 119, 084501. [Google Scholar] [CrossRef] [PubMed]
  61. Xu, W.J.; Yao, Z.G.; Luo, Y.T.; Dong, X.Y. Study on landslide-induced wave disasters using a 3D coupled SPH-DEM method. Bull. Eng. Geol. Environ. 2020, 79, 467–483. [Google Scholar] [CrossRef]
Figure 1. Three main shape parameters: roughness, angularity, and sphericity.
Jmse 11 01685 g001
Figure 2. (a) Immersed boundary illustration; (b) entire computational domain Ω divided into particle domain Ω p and fluid domain Ω f , and their boundaries Γ p and Γ f , respectively.
Jmse 11 01685 g002
Figure 3. Illustration of the simulation gap between resolved, semi-resolved, and unresolved CFD–DEM approaches.
Jmse 11 01685 g003
Figure 4. Flowchart for the computational procedure of resolved CFD-DEM coupling.
Jmse 11 01685 g004
Figure 5. Construction of ellipsoidal Particle by triangular facets: (a) Ellipsoidal particle used in Guo et al. [2]; (b) ellipsoidal particle in this verification.
Jmse 11 01685 g005
Figure 6. Diagrams of free-settling experiment and simulation: (a) Experiment conducted by Guo et al. [2]; (b) resolved model in this verification.
Jmse 11 01685 g006
Figure 7. Calibration of the resolved CFD-DEM method and the material parameters of particle and fluid [2].
Jmse 11 01685 g007
Figure 8. Diagrams of particle shapes employed in simulations, equivalent sphere diameter d = 1 mm: (a) AR = 1.25, C = 20; (b) AR = 1.25, C = 50; (c) AR = 1.5, C = 20; (d) AR = 1.5, C = 50; (e) AR = 1.75, C = 20; (f) AR = 1.75, C = 50; (g) AR = 2.0, C = 20; (h) AR = 2.0, C = 50.
Jmse 11 01685 g008
Figure 9. Schematic diagram of a particle subjected to a fluid causing: (a) pure rotation; (b) pure translation; (c) rotation and translation (modified from Stringham et al. [56]).
Jmse 11 01685 g009
Figure 10. Evolution of settling velocity of polyhedral particles with different C value: (a) C = 20; (b) C = 50.
Jmse 11 01685 g010
Figure 11. The ultimate settling velocity of polyhedral particles with different AR and C values.
Jmse 11 01685 g011
Figure 12. The resolved force acting on particle by the fluid.
Jmse 11 01685 g012
Figure 13. Representative snapshots of velocity field at different stages.
Jmse 11 01685 g013
Figure 14. Representative snapshots of velocity field pre- and post- collision with bottom boundary.
Jmse 11 01685 g014
Figure 15. Velocity contours and streamlines of the fluid field for various types of particles at 0.6 s.
Jmse 11 01685 g015
Figure 16. Evolution of settling velocity of polyhedral particles with: (a) AR = 1.25; (b) AR = 1.5.
Jmse 11 01685 g016
Figure 17. Evolution of rotational velocity of polyhedral particles with: (a) AR = 1.25; (b) AR = 1.5.
Jmse 11 01685 g017
Figure 18. The resolved force acting on particle by the fluid: (a) vertical force; (b) horizontal force.
Jmse 11 01685 g018
Figure 19. Representative snapshots of velocity field at the peaks and valleys.
Jmse 11 01685 g019
Figure 20. Velocity contours and streamlines of the fluid field for various types of particles at 0.56 s.
Jmse 11 01685 g020
Table 1. Details of simulation cases.
Numerical CaseAspect RatioCorner NumberRelease Direction
A1.25C20-H1.2520Horizontal
A1.25C50-H1.2550Horizontal
A1.5C20-H1.520Horizontal
A1.5C50-H1.550Horizontal
A1.75C20-H1.7520Horizontal
A1.75C50-H1.7550Horizontal
A2C20-H2.020Horizontal
A2C20-H2.050Horizontal
A1.25C20-V1.2520Vertical
A1.25C50-V1.2550Vertical
A1.5C20-V1.520Vertical
A1.5C50-V1.550Vertical
Table 2. Parameters adopted in the verification at standard atmospheric pressure.
PropertyUnitValue
Fluid
Densitykg·m−3 1.0 × 10 3
Dynamic viscosityPa·s 1.0 × 10 3
CFD time step sizes 1.0 × 10 4
Temperature°C25
Fluid cell size ( Δ )mm0.8
Particle
Densitykg·m−3 2.650 × 10 3
Young’s modulusGPa0.1
Poisson’s ratio0.3
Particle friction coefficient0.2
Restitution coefficient0.3
DEM time step sizes 1.0 × 10 7
Fluid—particle interaction
Coupling durations1
Coupling time step sizes 1.0 × 10 4
Coupling steps- 1.0 × 10 4
Disclaimer/Publisher’s Note: The statements, opinions and data contained in all publications are solely those of the individual author(s) and contributor(s) and not of MDPI and/or the editor(s). MDPI and/or the editor(s) disclaim responsibility for any injury to people or property resulting from any ideas, methods, instructions or products referred to in the content.

