Article

Assemblage Distribution of the Larval and Juvenile Myctophid Fish in the Kuroshio Extension Region: Winter 2020

1
College of Marine Sciences, Shanghai Ocean University, Shanghai 201306, China
2
National Engineering Research Center for Oceanic Fisheries, Shanghai Ocean University, Shanghai 201306, China
3
The Key Laboratory of Sustainable Exploitation of Oceanic Fisheries Resources, Ministry of Education, Shanghai 201306, China
4
Key Laboratory of Oceanic Fisheries Exploration, Ministry of Agriculture and Rural Affairs, Shanghai 201306, China
*
Author to whom correspondence should be addressed.
J. Mar. Sci. Eng. 2023, 11(5), 898; https://doi.org/10.3390/jmse11050898
Submission received: 30 March 2023 / Revised: 15 April 2023 / Accepted: 21 April 2023 / Published: 23 April 2023
(This article belongs to the Special Issue Feature Papers in Marine Biology)

Abstract

:
Myctophids are an ecologically important mesopelagic species in the eastern Pacific Ocean. Due to the wide distribution, great diversity and variable biological characteristics of the species, there is a lack of reliable information regarding their spawning and nursery grounds in the Kuroshio extension region. In this study, we identified a total of 110 myctophid individuals using DNA barcoding and morphological techniques, among which, the dominant genus was Ceratoscopelus, comprising 37.27% of the entire catch. The abundance of each sampling station was calculated, and its relationship with environmental variables was analyzed. Tweedie-Generalized Additive Model (GAM) analysis showed that copepod density, oceanic dynamic processes, and sea surface temperature were the primary factors influencing the distribution pattern of larvae and juvenile myctophid fish. The results further indicate that the Kuroshio extension plays a dominant role in the biological processes of these fish in this region. These findings provide crucial dynamic information for the scientific conservation and exploitation of myctophids, which could have significant implications for the management of these fish populations.

1. Introduction

Myctophidae (Myctophiformes), commonly known as lantern fishes, are the most abundant species of mesopelagic fish found in oceans [1]. The Myctophidae family comprises about 252 species in 34 genera [2]. Due to their large biomass and availability, lantern fishes are considered as a potentially important economic species and have been a target of exploratory fisheries for several years [3,4]. More importantly, they occupy a vital position in the energy transfer within the mesopelagic ecosystem, linking low-trophic-level species to higher marine predators such as fishes, squids and marine mammals [5]. More importantly, myctophids contribute to the matter and energy cycle through their metabolic behavior during vertical migration and the top-down control of zooplankton [6,7]. Their larvae and juveniles have also been reported as the dominant species in the ichthyoplankton assemblage in epipelagic waters [8]. Most lantern fishes spawn all year in mesopelagic waters, and their eggs hatch during the rise to the surface [9]. Larvae develop in epipelagic waters, and their swimming ability gradually increases [10]. It has been reported that the myctophid larvae are primarily distributed in the vertical direction between 0 and 200 m.
The larval and juvenile stage is the most vulnerable and sensitive period during the life history of fish, with external environmental factors having a significant impact on their growth and survival rates [11,12], and the mortality rate of larval and juvenile fish largely determines their recruitment and population dynamic [13]. Larvae and juvenile fish play an important role in the stability and resilience of marine ecosystems, and their assemblage structure is an essential indicator of community succession and fishery resources’ statuses. Physical and biological environmental processes, such as mesoscale hydrodynamic features, upwelling [14], surface currents [15], climate model [16], frontal regimes [17,18] and the distribution of the prey and predator [19,20,21], can largely determine their spatial distribution and transport.
The Kuroshio merges with a portion of flows of the Oyashio current near southern Japan (about 35° N), then turns to the east and extends to 160° E, forming what is known as the Kuroshio extension (KE) region. Due to the opposite characteristics of the Kuroshio and Oyashio in terms of temperature, salinity and nutrients, the spatial and temporal differences in the distribution of environmental conditions in the KE region are significant. The interactions of the two currents promote mesoscale eddy activity in the KE region, temporarily affecting the structure of physical and chemical features in the upwelling waters [22]. Furthermore, the exchanges of heat between the ocean and atmosphere in the KE region are the most extensive in the extratropical North Pacific, and the long-time-scale sea surface temperature (SST) and subsurface temperature in this region exhibit strong interannual variability [23]. These complex hydrodynamic processes are known to impact the primary productivity changes and fuel regional phytoplankton blooms in the open sea [24,25,26]. In the winter and spring, the Kuroshio–Oyashio transition region, KE and its adjacent regions serve as important spawning and nursery grounds for pelagic species, such as Japanese sardines (Sardinops melanostictus), Pacific saury (Cololabis saira), the Pacific stock of chub mackerel (Scomber japonicus) and Neo flying squids (Ommastrephes bartramii). Previous studies have suggested that environmental variables in the KE region may influence the dynamics of these species [27]. It has been reported that the winter SST in the KE and its southern recirculation area is correlated with the recruitment of Pacific saury [28,29], and the population dynamics of Japanese sardine were strongly associated with changes in the KE Front and the Oyashio Front [30].
Numerous investigations have revealed that there are more than 40 species or types of larval and juvenile myctophid fish distributed in the Kuroshio and Oyashio currents, as well as their transition region [8,31,32]. However, due to incomplete data of larval and juvenile taxonomy, it has often been challenging to accurately identify myctophid fish larvae and juveniles at the species level using morphological characteristics alone. Fortunately, the development of DNA barcoding has provided a powerful tool for the precise identification of fish at any developmental stage [13,33,34]. The Barcode of Life Data System (BOLD) currently contains DNA barcodes for more than 25,000 fish species (including Actinopterytidae, Chondrichthidae, Hagprey and Cephalocrustaceans) (http://www.barcodinglife.org, accessed on 30 March 2023), while the Fish Barcode of Life Campaign (FISH-BOL, http://www.Fishbol.org/, accessed on 30 March 2023) has been designed to collect fish DNA barcodes. Moreover, local BLAST Databases of DNA Barcode libraries can be constructed by adult fish samples. For example, Paola et al. [35] compared the morphological and molecular identification results of 28 specimens of larval myctophids in the Gulf of Mexico, improving the accuracy of identification and facilitating the accumulation of morphological characteristics in early larval stages of Myctophidae. Pappalardo et al. [36] applied cytochrome c oxidase subunit I (COI) as DNA barcode sequences to delimit 45 Myctophidae larvae samples which were ambiguous or impossible to be identified to 5 species. Ayala et al. [37] identified at least 32 myctophid species in approximately 3500 specimens collected in the Subtropical Convergence Zone of the Sargasso Sea using morphological and DNA barcoding identification techniques.
To comprehend the spatial distributions of larval and juvenile myctophid fish and their relationship with environmental heterogeneity in the KE region in greater detail, we collected ichthyoplankton samples in the winter of 2020. Our study utilized both DNA barcodes and morphologies to identify fish larvae and juveniles, with a focus on describing the distribution pattern of myctophid specimens during the winter season. Additionally, our study analyzed the linkages between abundances and corresponding hydrographical and biological information using the generalized additive model (GAM) [38]. Given the ecological importance and potential economic value of this fish family, our study aimed to enrich our knowledge of resource situations and ultimately enhance our understanding of the dynamics and biogeographical distributions of myctophids.

2. Materials and Methods

2.1. Sample Collection

Myctophid larvae and juveniles were obtained from ichthyoplankton and zooplankton samples collected during the investigation trip by the Shanghai Ocean University’s oceanic fisheries survey cruise of “SongHang” in the KE region (146.00–156.00° E, 29.00–35.00° N) from 6 to 19 December 2020 (Figure 1). Horizontal ichthyoplankton samples were collected with zooplankton nets (0.8 m in diameter, 2.7 m long, and 505 mm mesh, with a cod-end container mesh of 400 mm) at the surface (20 min at about 2 knts), and vertical samples were collected with Bongo nets (0.57 m in diameter, 2.8 m long, and 200 mm mesh, with a cod-end container mesh of 200 mm) towed vertically for about 10 min from a maximum depth of 200 m up to the surface; both nets were equipped with General Oceanic flow meters. Half of the specimens were quickly moved into sea water with 75% ethanol–solution and then preserved in <−20 °C for molecular identification; the other half of the samples was stored in 4% buffered formaldehyde for morphological identification.

2.2. Laboratory Analysis

Sample individuals of ichthyoplankton from each station were picked out using a stereomicroscope, and each individual was photographed using a Zeiss microscope (Axioplan 2 imaging E). Copepods in zooplankton specimens were selected and counted with a stereomicroscope for further analysis. Fish larvae and juveniles were identified through the combined use of the morphological identification and DNA barcodes. DNA extraction, primer selection and PCR processes were conducted as Hou et al. did in their study [39]. Cytochrome c oxidase subunit I (COI) was used to identify specimens to the lowest taxonomic level based on the Barcode of Life Data (BOLD) system, and the blast search criteria followed the initial proposal of Hebert [40].

2.3. Data Analysis

The abundance of larval and juvenile myctophid fish was standardized in the following formula [41]:
G = N/(S·L·C)
where G is the number of individuals per unit volume of water (ind./1000 m3), N is the number of individuals collected per tow (ind.), S is the net mouth area (m2), L is the revolution of flow meter, and C is the number of flow meter correction (C = 0.3).
Due to the large number of low values, true zeroes and occasional large values in the abundance data, Tweedie-GAM was used to statistically evaluate the effect of environmental factors [42,43]. Previous studies have shown the sensitivity of larval and juvenile myctophid fish to a variety of environmental factors [8,44,45]. This study selected sea surface temperature, sea surface salinity (SSS), sea level anomaly (SLA), concentration of chlorophyll a (Chla), eddy kinetic energy (EKE) and copepod density (Dc) as key environmental factors. SST, SSS, SLA and Chla data corresponding to the sampling stations were from OceanWatch (https://oceanwatch.pifsc.noaa.gov/, accessed on 1 January 2023); velocities data of the current (U and V) were obtained from Copernicus Marine Service (https://data.marine.copernicus.eu/products, accessed on 1 January 2023). The EKE value was estimated as follows [46]:
EKE = 1 2 U 2 + V 2
where U and V represent the horizontal and vertical velocities of the current, respectively.
The variance inflation factor (VIF) was used to exclude collinearity variables for the five environmental factors to avoid the co-curvilinear problem in model fitting. It is generally believed that when V I F < 2 , there is a multicollinearity problem between variables.
The probability density function of the Tweedie distribution is expressed in the following formula [47]:
f y : μ , σ 2 , p = a y : σ 2 , p exp 1 2 σ 2 d y : μ , p
where μ is the location parameter; σ 2 is the diffusion parameter; p is the power parameter. Different power parameters p correspond to different types of distribution. When the power parameter p is 0, 1, 2 and 3, it corresponds to Normal, Poisson, Gamma and inverse Gaussian distributions, respectively. When 1 < p < 2, the distribution is expressed as the Gamma–Poisson distribution.
X ~ T W P   θ ,   φ M = E X ln μ = X · α + s   F
where X is the abundance of larval and juvenile myctophid fish (ind./1000 m3); θ is the specification parameter; φ is the dispersion parameter; p is the power parameter; μ is the expected value of X; ln(μ) represents the contact function using natural logarithms; α is the estimated parameter in model; s is the natural smooth spline; F is the variable factor.
The Tweedie-GAM expression in this study is as follows:
X = s S S T + s S S S + s S L A + s C h l a + s E K E + s D c
The “vif” function in the “car” package was used to test for the multicollinearity of environmental factors. The “tweedie.profile” in “Tweedie” package was used to determine power parameter p, and then, we built the model using the “mgcv” package. The restricted maximum likelihood (REML) was calculated using the smoothing parameter of model, and the Akaike Information Criterion (AIC) was used to determine the best-fitting model.

3. Results

3.1. Species Identification and Abundance

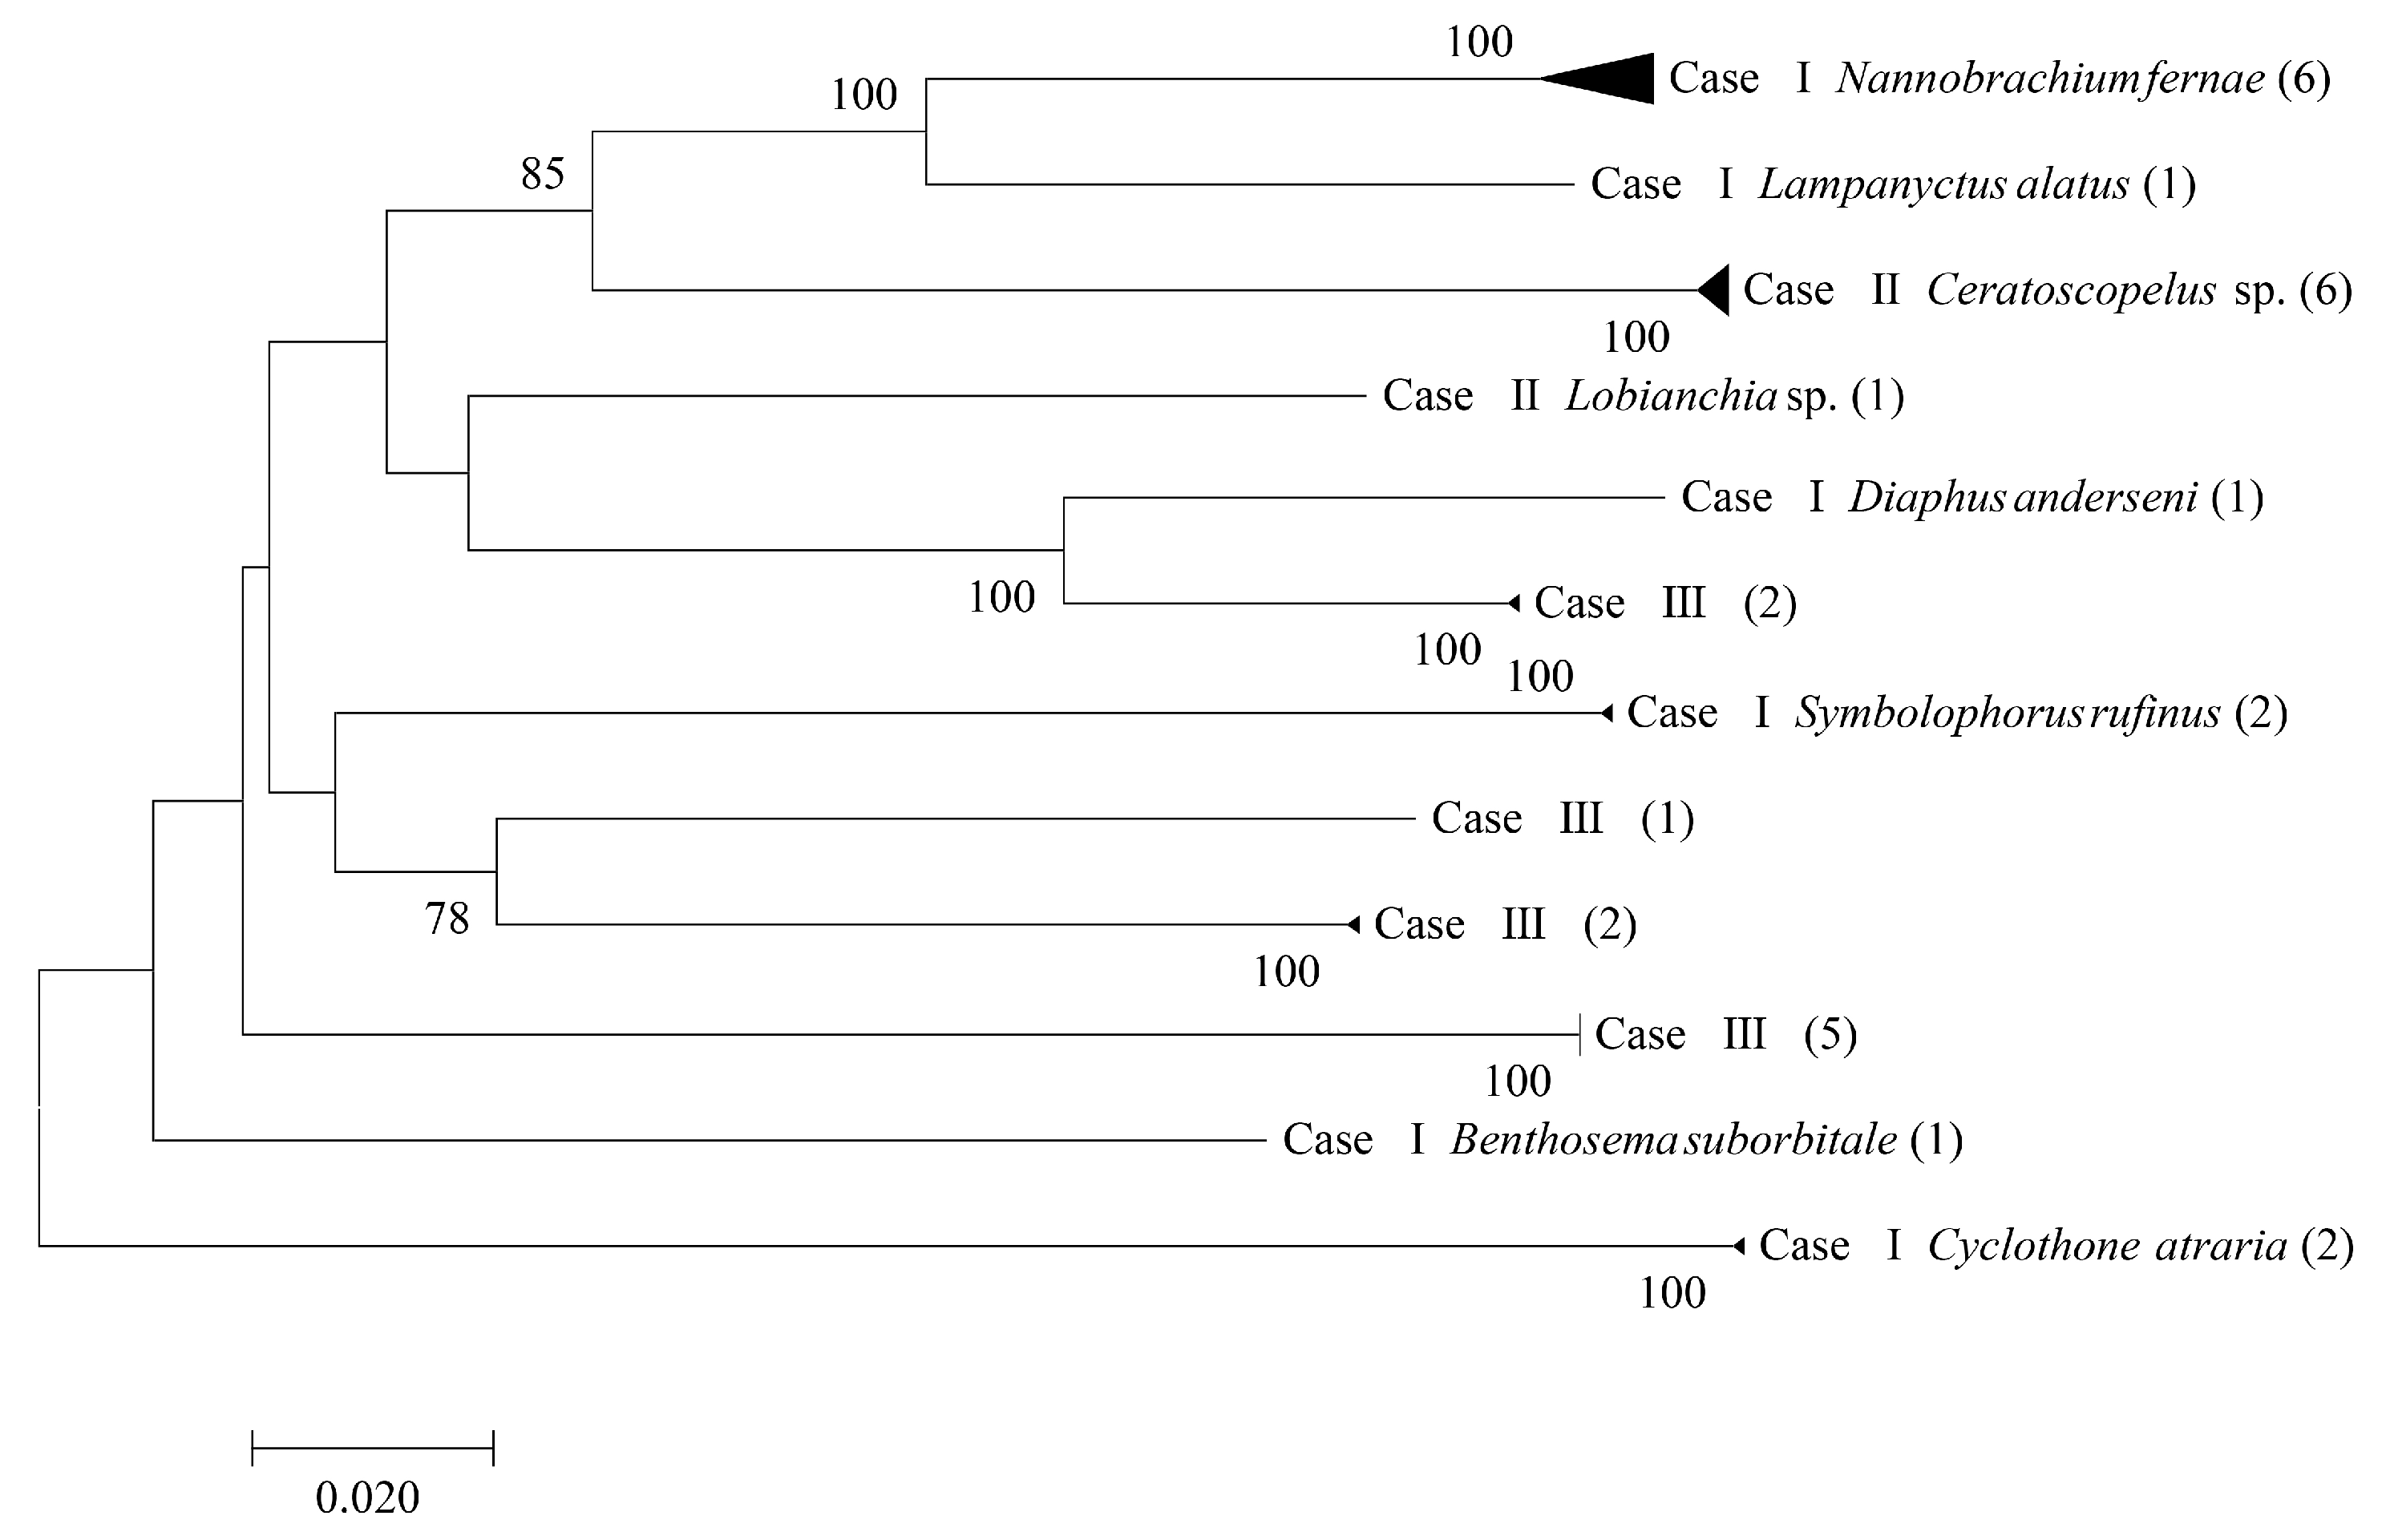
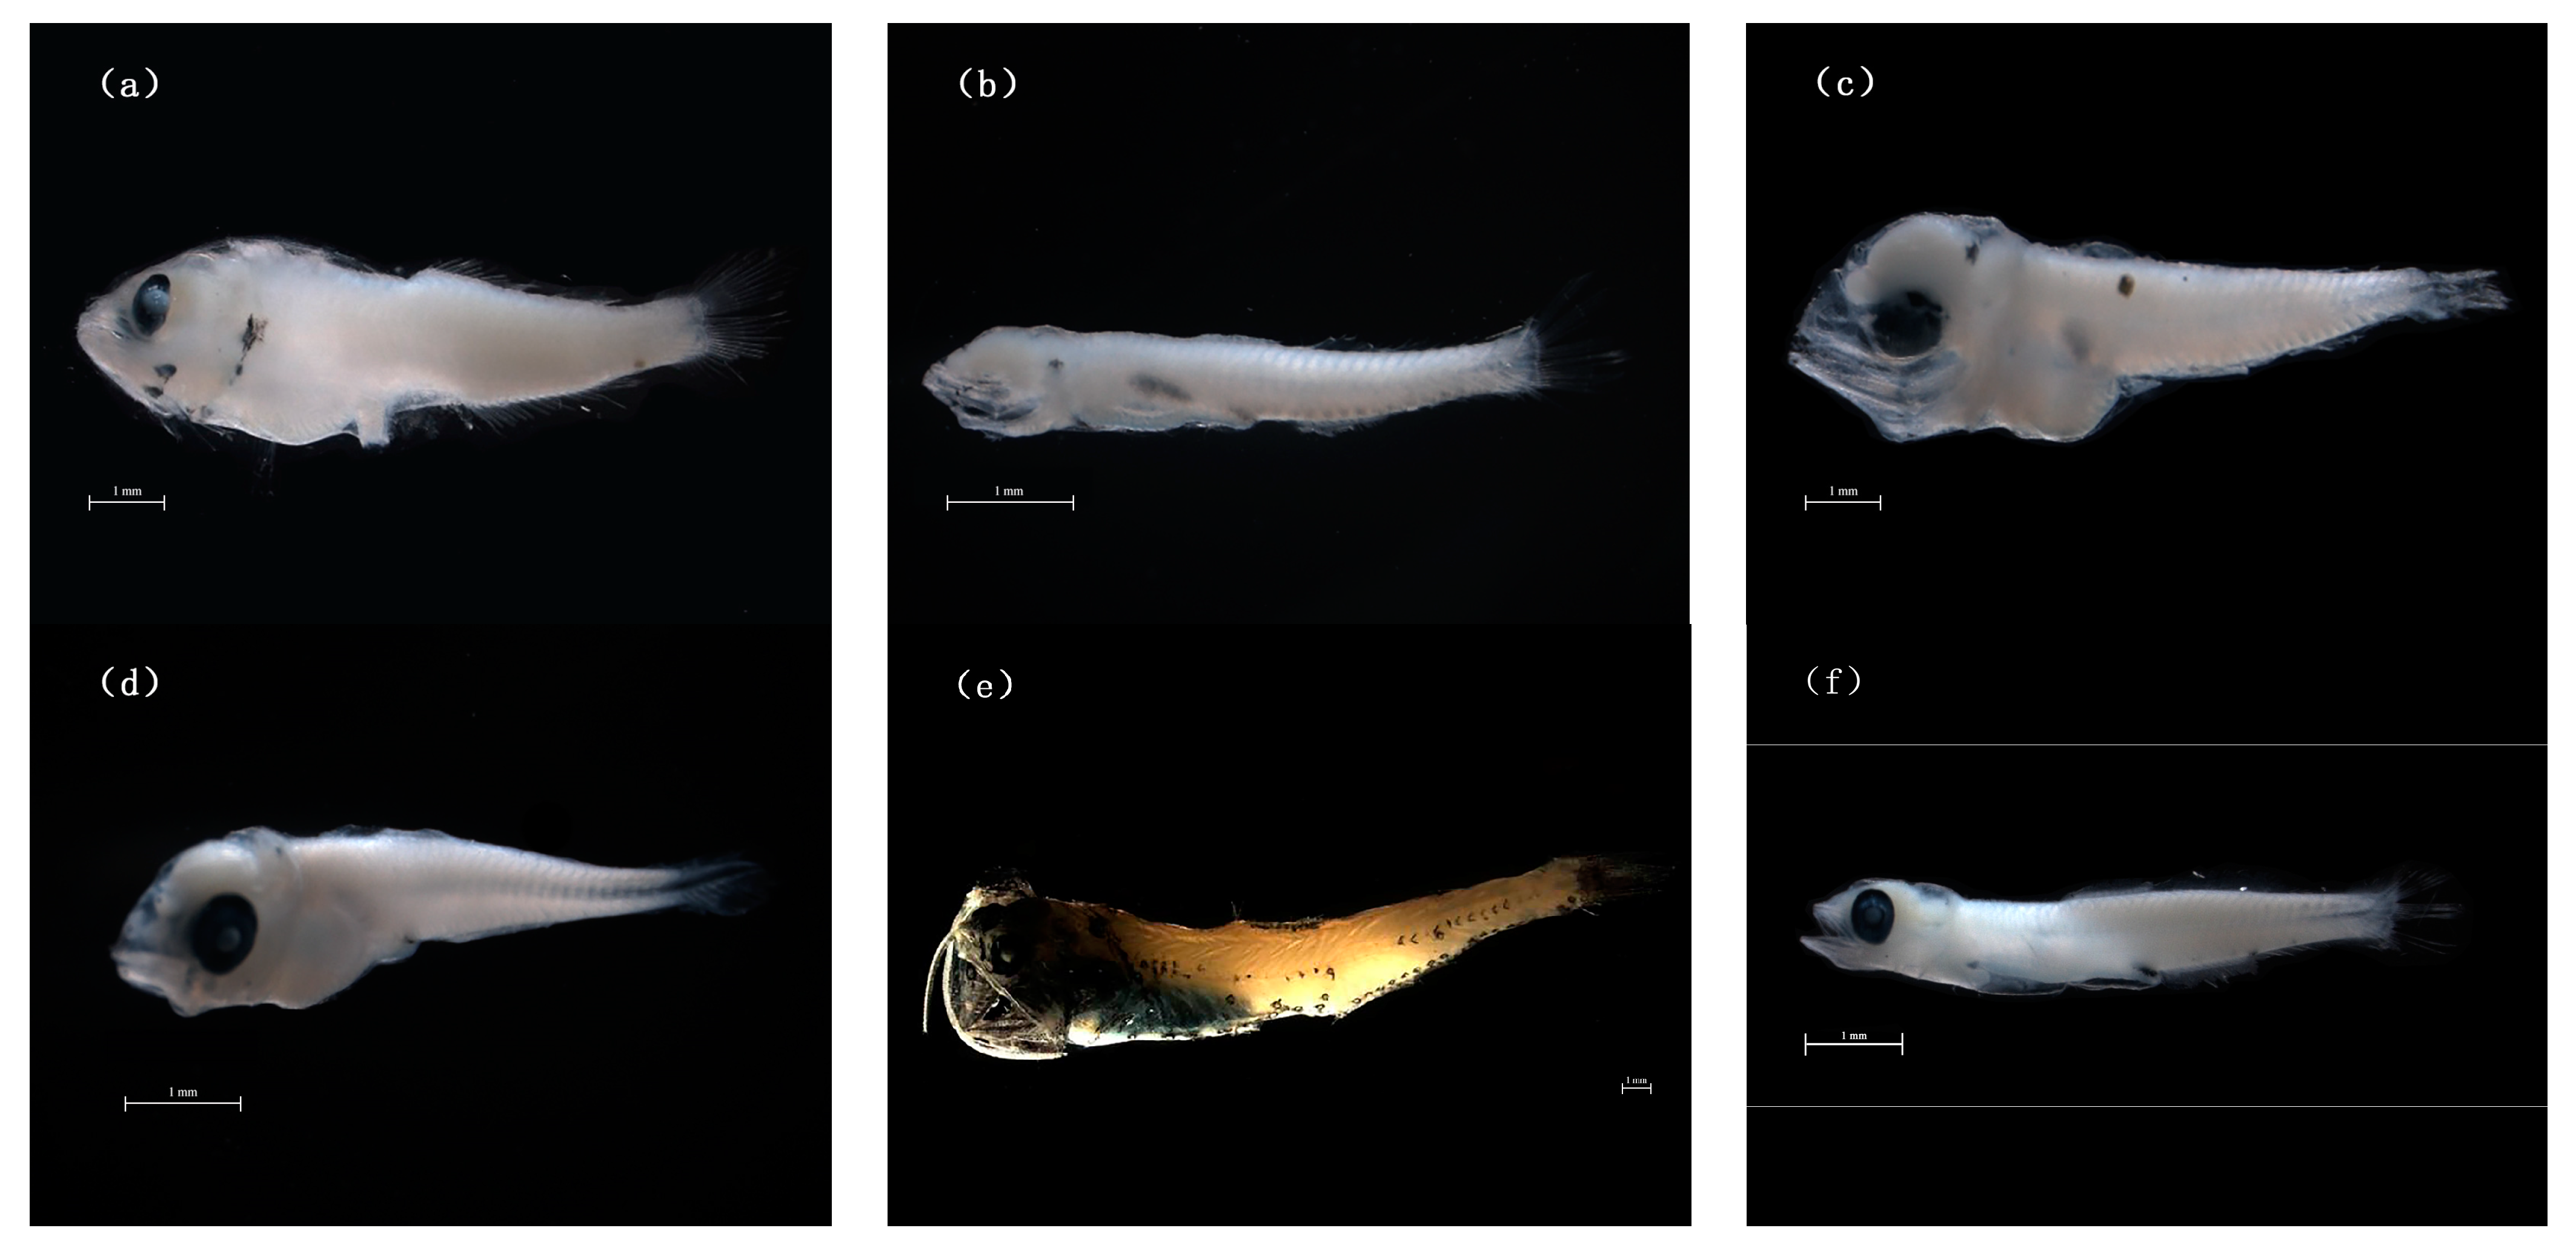
A total of 110 larval and juvenile myctophid fishes were identified from ichthyoplankton specimens: 27 individuals were identified to six species (Benthosema suborbital, Diaphus anderseni, Lampanyctus alatus, Nannobrachium fernae, Symbolophorus rufinus and Ceratoscopelus townsendi) (Figure 2), 40 individuals were identified to two genera (Ceratoscopelus and Lobianchia), and 43 individuals were identified to myctophidae, including four taxa; the neighbor-joining tree based on COI is shown in Appendix A Figure A1 (Ceratoscopelus townsendi was identified via its morphology). Ceratoscopelus contributed 37.27% to the total abundance. In vertical and horizontal tows, the mean total abundance of larval and juvenile myctophid fish was 0.85, 0.96 ind./1000 m3, and the max abundance was 17.75, 5.78 ind./1000 m3, respectively. The region with high abundance was concentrated in the western part of the sampling area.

3.2. Model Performance

The multicollinearity tests showed that the V I F values of all six predictor factors were less than 2. There were no significant multicollinearity problems, so all of them were adopted for further analysis (Table 1). Log-likelihood function values were calculated with changing power parameters; when p = 1.431 and 1.780, the log-likelihood function values were maximized in horizontally and vertically hauled net tows, respectively. Hence, the data distribution type of X of both tows were Gamma–Poisson distributions, and p values were used to build Tweedie-GAM.
The best combination of factors in horizontal tows was the copepod density and EKE (Table 2), and the deviation explanation rate of each factor was 45.1% and 24.3%, respectively, while both factors were significant (p < 0.05), and the copepod density contributed the most explanation (45.1%). The best combination of factors in vertical tows was the copepod density, SST and Chla The deviation explanation rate of each factor was 22.1%, 50.3% and 8.8%, respectively, all three factors were significant (p < 0.05), and the SST contributed the most explanation (50.3%). For brevity, the best model based on horizontal tows was called Horizontal-GAM, and another was called Vertical-GAM.

3.3. Results of Model

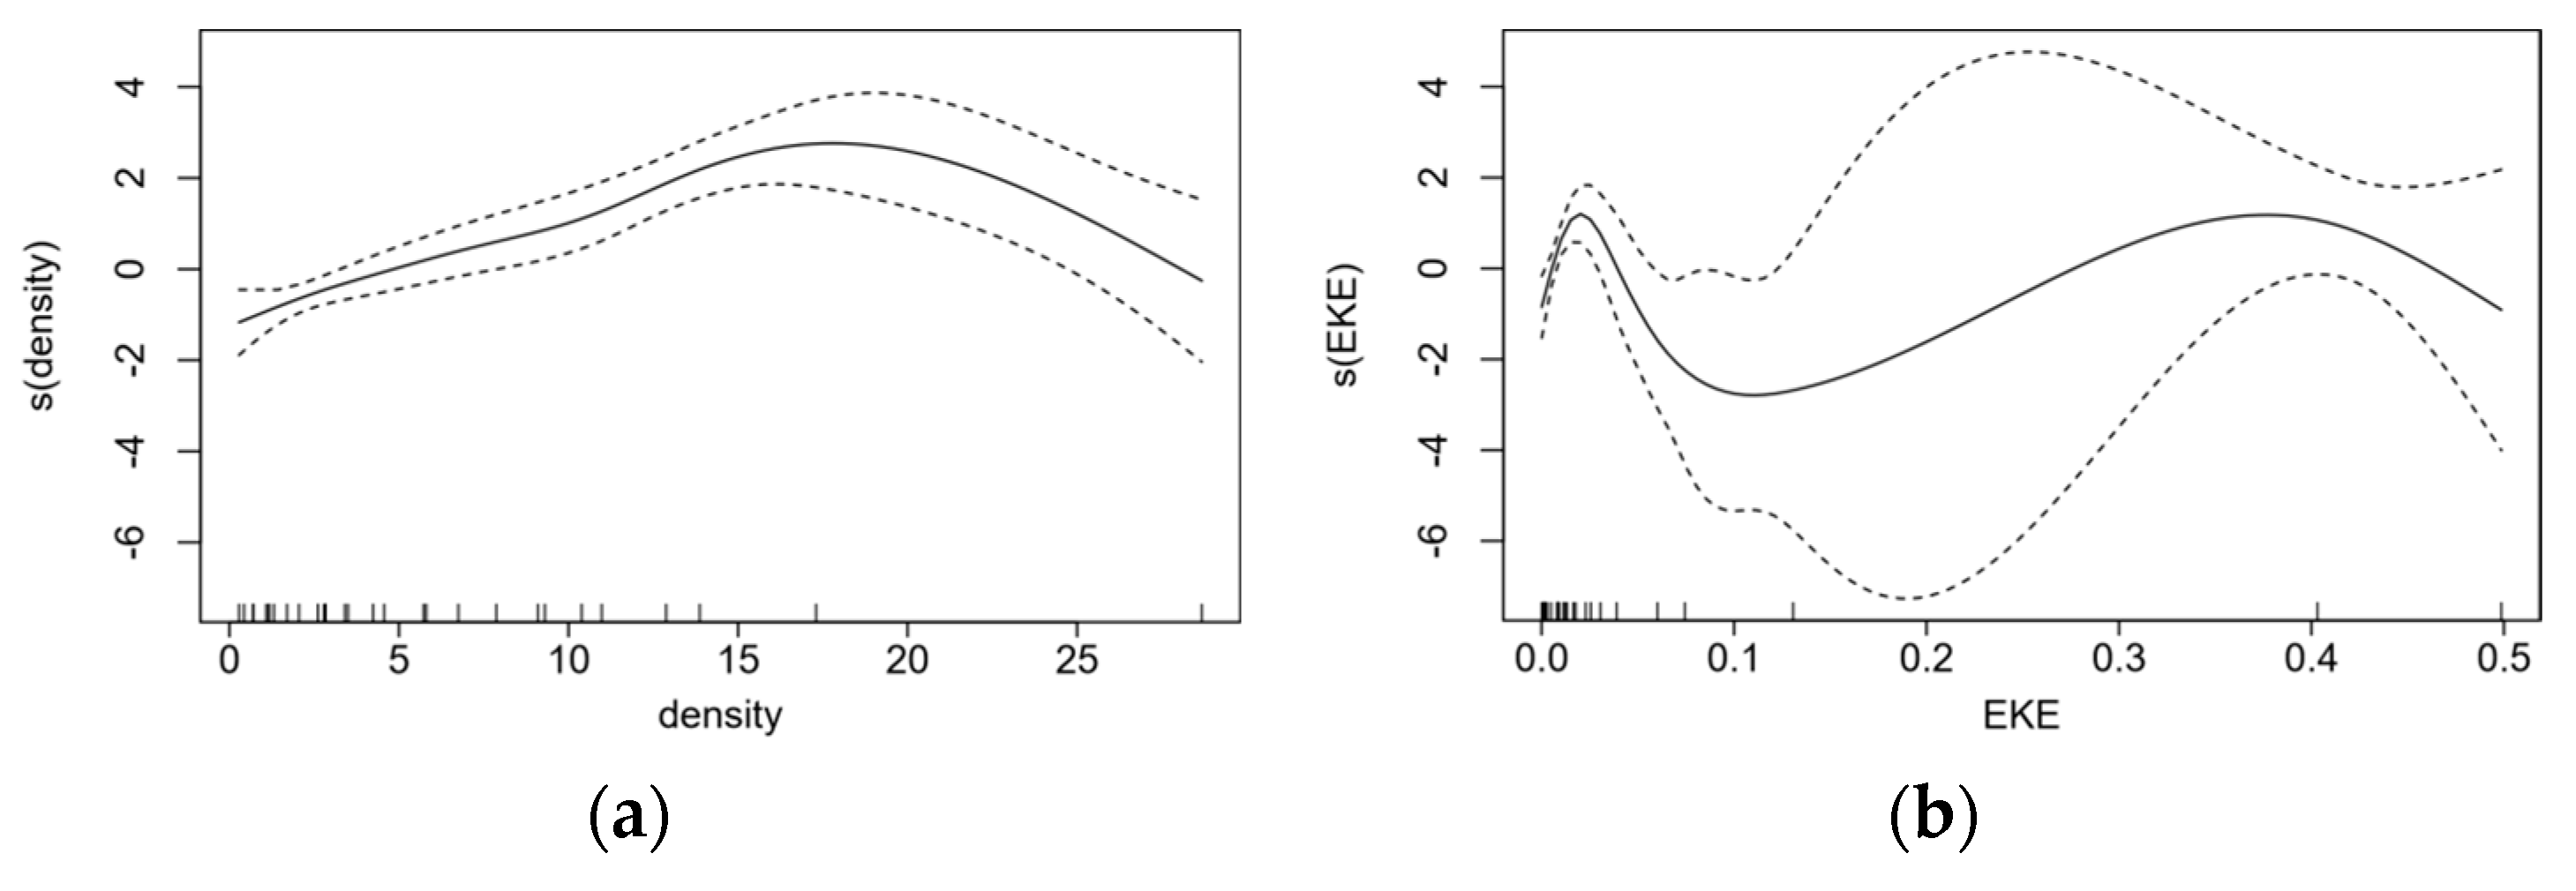
In the results of Horizontal-GAM, the abundance of larval and juvenile myctophid fish (X) increased and then decreased with the increasing copepod density, with the maximum of abundance of copepod density at 17.5 ind/m3, but the data points were concentrated in 0–14 ind/m3, and the positive correlation was significant in this range (Figure 3a). In the relationship between abundance and EKE, the abundance increased and then decreased when EKE was between 0 and 0.1 m2/s2, with one peak occurring when EKE was 0.03 m2/s2, and the other one occurring when EKE was 0.4 m2/s2 (Figure 3b). However, there were only three data points when EKE was larger than 0.1 m2/s2, and the fitting of the curve may be affected by extreme values.
In the results of Vertical-GAM, ranging from 0 to 25.7 ind/m3 of copepod density, the relationship between the copepod density and X was linearly positive (Figure 4a). In the relationship between X and SST, ranging from 20 to 25.3 °C, X showed a fluctuating decrease with two peaks occurring at 22 °C and 24.7 °C (Figure 4b). In the range of 0.1–0.41 mg/m3, the X increased and then decreased with the increase in copepod density (Figure 4c).

3.4. Relationship between Abundance and Environmental Factors

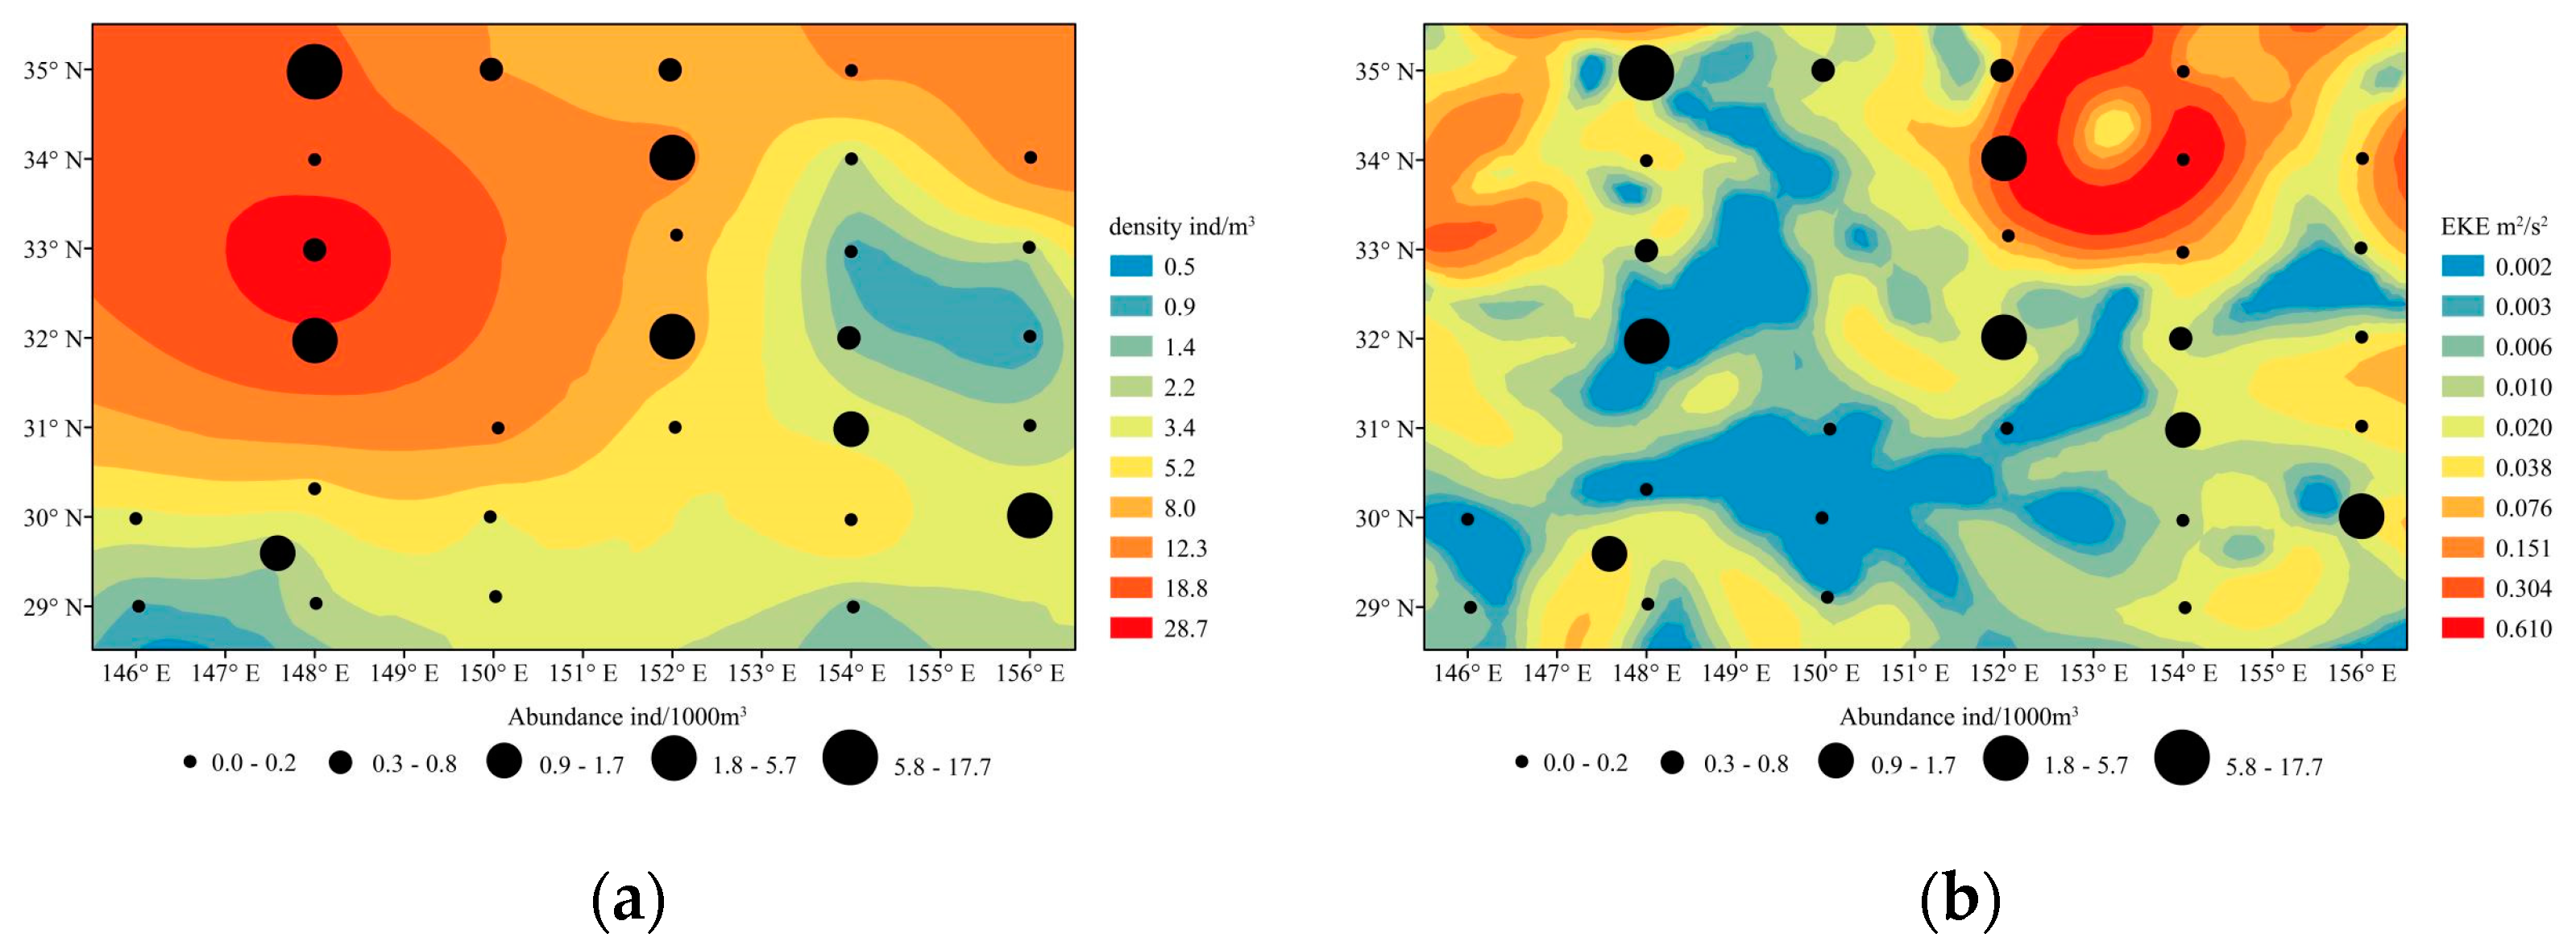
The copepod density had significant gravity of distribution, with the highest density occurring at around 148° E, 33° N and gradually decreasing in regions far away from the center (Figure 5a). The suitable copepod density range was 15–20 ind/m3. There were three obvious mesoscale eddies and a part of the KE (Figure 5b). The highest abundance station was located on the edge of the KE, and the highest abundance was distributed in the low EKE region. In vertical tows, the highest abundance was distributed in the region with the high copepod density (Figure 6a). As shown in Figure 6b,c, overall, the Chla was significantly higher in the north than in the south of the sampling region, while SST in the north was lower than that in the south, and the highest abundance was distributed in the transition zone of Chla and SST.

4. Discussion

4.1. Species Composition and Abundance

Myctophids are one of the most diverse families in the northwest Pacific Ocean, with over 80 species [8]. Due to their ecological importance and potential economic value, their life history has been the subject of contemporary research. However, the migration and reproduction strategies of myctophids, particularly those found in open oceans, have been little studied due to the sampling challenges posed by their long-distance horizontal and vertical migration. In previous research, myctophids were found to be abundant in the Kuroshio and transition region [48,49], and their spawning grounds were determined by the investigation of mature adults, eggs, larvae or juveniles [14,50,51]. These findings suggest significant spatial and temporal differences in the composition of myctophid ichthyoplankton assemblages. The present study reports the distribution and abundance of larval and juvenile myctophid fish in the KE and its adjacent regions in the winter for the first time. We identified Ceratoscopelus as the dominant genus, present at the majority of sampling stations. As a typical Myctophid species, Ceratoscopelus accounted for almost 30% of larval myctophid fish specimens in the Kuroshio Countercurrent region, with a few individuals occurring on the onshore side of the Kuroshio and Kuroshio–Oyashio transition region [32,52,53]. In addition, the mean total abundance of vertical tows was slightly larger than that of horizontal, and the distribution patterns of their abundance were not synchronized, regardless of sampling errors and extreme values, which may be due to the enhanced swimming ability of the larval and juvenile myctophid fish for vertical migration and responding to environmental factors.

4.2. Effect of Biological Factors

In this study, the abundance of fish larvae and juveniles was positively correlated with the density of copepods but negatively correlated with Chla. Although high primary productivity in the KE is essential to maintain the energy intake of larval and juvenile fish, considering the lagging effect of Chla on the ecosystem, the relationship between Chla and abundance in this study still needs further study. Intriguingly, fish in the early life history stages did not rely on phytoplankton to receive the energy required for growth and development; instead, they primarily fed on copepods of varying sizes and developmental periods, depending on the size of the fish mouth [54,55,56]. For example, Bernal et al. [57] indicated that myctophid larvae off the coast of western Australia feed predominantly on nauplii and copepodites. Contreras et al. [58] showed that copepods dominated the larval diet of Diaphus vanhoeffeni, Hygophum macrochir and Myctophum affine in the equatorial and tropical Atlantic. The feeding pattern of larvae and juvenile fishes regulated their energy intake and consumption during feeding, which directly affected their growth and development. Thus, larvae and juvenile fishes employed numerous strategies to optimize their feeding efficiency, which led to their unique spatial and temporal distribution adaption patterns. For instance, trends in the abundance of larvae and juvenile fishes were consistent with the changes in zooplankton [20,59], but competition for prey between species was also an important factor for their distribution, especially in the KE region, an important spawning ground for a variety of species. Actually, different larvae and juvenile fish species reduced the overlap of trophic niches through staggered vertical migration patterns, distribution patterns, predation times and the differential selection of feeding targets [54,60].

4.3. Effect of Physical Factors

In addition to biological factors, ocean dynamic processes and environmental factors were critical drivers of the distribution of larvae and juvenile myctophid fish. Based on EKE, the ocean dynamic processes that were the focus of our study were the Kuroshio and mesoscale eddies in this study. Firstly, the abundance at the sampling stations near the KE was much higher than others, and considering the role of the Kuroshio in the transport of fish eggs and larvae, myctophid larvae and juveniles may enter the slow flow area at the Kuroshio bend after being transported by the Kuroshio. Secondly, the effect of mesoscale eddies on the early life history stages of fish was primarily reflected in the influence of environmental factors such as temperature, salinity and nutrients in the area controlled by eddies, as well as the accumulation and transportation of eggs, larvae and juvenile fish by water flows. With the growth of fish, the distribution patterns of fish larvae and juveniles of different species in mesoscale eddies were significantly biased [55,61,62]. On the sea surface, the myctophid larvae and juveniles preferred to be distributed in the low EKE areas that were remote from eddies. However, there was no significant correlation between distribution patterns and EKE in vertical tows, mainly due to the significant structure of the physical properties of the mesoscale eddy in the vertical direction, and sea surface EKE was insufficiently representative of the flow characteristics of all the water. Moreover, temperature influences the distribution of larvae and juveniles mainly through its effects on the metabolism and locomotion of fish [63,64]. This study revealed a non-linear negative correlation between abundance and temperature at 20–25.5 °C, which confirmed that prolonged high temperature may be detrimental to the growth of juvenile fish and may cause increased mortality. The Kuroshio and its extension region were transitional regions for sea surface temperature [65]. Due to the sensitivity of ichthyoplankton to temperature, larvae and juvenile myctophid fishes were predominantly distributed in the northern region where the water temperature was relatively low.

5. Conclusions and Future Work

The fluctuation of community structure and the spatial and temporal distribution of larval and juvenile fish is a comprehensive response to biological and physical factors. Under the background of climate anomaly, habitat degradation and fishery resource exploitation, the survival conditions of potentially economically important fish species in the early life history stage have attracted more and more attention. Although our investigation region and density of sampling station were limited, we addressed the issue of model fitting ability with more zero-valued data by using Tweedie-GAM. This allowed us to explore the influence of environmental factors in the Kuroshio extension on the abundance of larval and juvenile myctophid fish during the winter season. According to our findings, copepod density, ocean dynamic processes and SST were the most influential determinants on the distribution pattern of larvae and juvenile myctophid fish, and the dominant role of the Kuroshio extension in this process was described. However, the environmental conditions in the KE region are known to be variable, with significant interannual and inter-monthly fluctuations, and the role of the Kuroshio in the transport of ichthyoplankton needs to be further verified by expanding the sampling area. Therefore, the objective of future research is to investigate long time series and to expand survey stations to the Kuroshio flow region. In addition, considering the prey selection of larval and juvenile fish and the dietary shift during development, as well as the potential food sources, feeding ecology research could be used to support how biological factors affect larval and juvenile fish.

Author Contributions

Data analysis was performed by H.X., B.L. and Y.C.; H.X. wrote the first draft of the manuscript; B.L. designed the survey; B.L. revised the manuscript and approved it for submission. All authors have read and agreed to the published version of the manuscript.

Funding

This work was sponsored by Follow-up program for Professor of Special Appointment (Eastern Scholar) at Shanghai Institutions of Higher Learning under Contract (22GZ03); Monitoring and Assessment of Global Fishery Resources (Comprehensive scientific survey of fisheries resources at the high seas).

Institutional Review Board Statement

Not applicable.

Informed Consent Statement

Not applicable.

Data Availability Statement

Data are contained within the article.

Acknowledgments

We would like to thank the teachers and students from Shanghai Ocean University and Guangdong Ocean University for sample collection and data analysis.

Conflicts of Interest

The authors declare no conflict of interest.

Appendix A

Figure A1. The neighbor-joining tree based on COI sequences of larval and juvenile myctophid fish.
Jmse 11 00898 g0a1

References

  1. Gjoesaeter, J.; Kawaguchi, K. A review of the world resources of mesopelagic fish. FAO Fish. Tech. Pap. 1980, 193, 1–151. [Google Scholar]
  2. Fricke, R.; Eschmeyer, W.N.; Van der Laan, R. Eschmeyer’s Catalog of Fishes: Genera, Species, References. 2023. Available online: http://researcharchive.calacademy.org/research/ichthyology/catalog/fishcatmain.asp (accessed on 14 April 2023).
  3. Collins, M.A.; Xavier, J.C.; Johnston, N.M.; North, A.W.; Enderlein, P.; Tarling, G.A.; Waluda, C.M.; Hawker, E.J.; Cunningham, N.J. Patterns in the distribution of myctophid fish in the northern Scotia Sea ecosystem. Polar. Biol. 2008, 31, 837–851. [Google Scholar] [CrossRef]
  4. Javadzadeh, N.; Valinassab, T.; Fatemi, M.R. Morphometric features of mesopelagic lanternfish, Diaphus garmani, from the Oman Sea, Iran: First record. World Appl. Sci. J. 2012, 17, 489–493. [Google Scholar]
  5. Kosenoka, N.S.; Chuchukalo, V.I.; Savinykh, V.F. The Characteristics of Feeding of Diaphus theta (Myctophidae) in the Northwestern Part of the Pacific Ocean in the Summer–Autumn Period. J. Ichthyol. 2006, 46, 606–612. [Google Scholar] [CrossRef]
  6. Smith, A.D.M.; Brown, C.J.; Bulman, C.M.; Fulton, E.A.; Johnson, P.; Kaplan, I.C.; Lozano-Montes, H.; Mackinson, S.; Marzloff, M.; Shannon, L.J.; et al. Impacts of fishing low–trophic level species on marine ecosystems. Science 2011, 333, 1147–1150. [Google Scholar] [CrossRef]
  7. Bulman, C.M.; He, X.; Koslow, J.A. Trophic ecology of the mid-slope demersal fish community off southern Tasmania, Australia. Mar. Freshwater. Res. 2002, 53, 59–72. [Google Scholar] [CrossRef]
  8. Sassa, C.; Kawaguchi, K.; Hirota, Y.; Ishida, M. Distribution patterns of larval myctophid fish assemblages in the subtropical–tropical waters of the western North Pacific. Fish. Oceanogr. 2004, 13, 267–282. [Google Scholar] [CrossRef]
  9. Sundby, S.; Kristiansen, T. The principles of buoyancy in marine fish eggs and their vertical distributions across the world oceans. PLoS ONE 2015, 10, e0138821. [Google Scholar] [CrossRef] [PubMed]
  10. Conley, W.J.; Gartner, J.V. Growth among larvae of lanternfishes (Teleostei: Myctophidae) from the Eastern Gulf of Mexico. Bull. Mar. Sci. 2009, 84, 123–135. [Google Scholar]
  11. Chambers, R.C.; Trippel, E.A. Early Life History and Recruitment in Fish Populations; Springer: Berlin/Heidelberg, Germany, 1997; pp. 515–549. [Google Scholar]
  12. Fielder, D.S.; Bardsley, W.J.; Allan, G.L.; Pankhurst, P.M. The effects of salinity and temperature on growth and survival of Australian snapper, Pagrus auratus larvae. Aquaculture 2005, 250, 201–214. [Google Scholar] [CrossRef]
  13. Hou, G.; Chen, Y.Y.; Wang, S.J.; Chen, W.T.; Zhang, H. Formalin-fixed fish larvae could be effectively identified by DNA barcodes: A case study on thousands of specimens in South China Sea. Front. Mar. Sci. 2021, 8, 634575. [Google Scholar] [CrossRef]
  14. Del Favero, J.M.; Katsuragawa, M.; Zani-Teixeira, M.; Turner, J.T. Spawning areas of engraulis anchoita in the southeastern brazilian bight during late-spring and early summer. Prog. Oceanogr. 2017, 153, 37–49. [Google Scholar] [CrossRef]
  15. Klimova, T.N.; Subbotin, A.A.; Vdodovich, I.V.; Zagorodnyaya, Y.A.; Podrezova, P.S.; Garbazei, O.A. Distribution of ichthyoplankton in relation to specifics of hydrological regime off the crimean coast (the black sea) in the spring–summer season 2017. J. Ichthyol. 2021, 61, 259–269. [Google Scholar] [CrossRef]
  16. Ottersen, G.; Planque, B.; Belgrano, A.; Post, E.; Reid, P.C.; Stenseth, N.C. Ecological effects of the North Atlantic Oscillation. Oecologia 2001, 128, 1–14. [Google Scholar] [CrossRef] [PubMed]
  17. Møller, P.; John, M.S.; Lund, T.; Madsen, K.P. Identifying the effect of frontal regimes on condition in larval and juvenile sand lance (Ammodytes sp.): Utilisation of food web specific tracer lipids. Gastroenterological. Endosc. 1998, 50, 1344–1353. [Google Scholar]
  18. Townsend, D.W.; Pettigrew, N.R. The role of frontal currents in larval fish transport on Georges Bank. Deep-Sea Res. II 1996, 43, 1773–1792. [Google Scholar] [CrossRef]
  19. Turner, J.T.; Tester, P.A.; Conley, W.J. Zooplankton feeding ecology: Predation by the marine cyclopoid copepod Corycaeus amazonicus F. Dahl upon natural prey. J. Exp. Mar. Biol. Ecol. 1984, 84, 191–202. [Google Scholar] [CrossRef]
  20. Rodriguez, J.M.; Gonzalez-Nuevo, G.; Gonzalez-Pola, C.; Cabal, J. The ichthyoplankton assemblage and the environmental variables off the NW and N Iberian Peninsula coasts, in early spring. Cont. Shelf. Res. 2009, 29, 1145–1156. [Google Scholar] [CrossRef]
  21. Purcell, J.E. Predation on zooplankton by large jellyfish, Aurelia labiata, Cyanea capillata and Aequorea aequorea, in Prince William Sound, Alaska. Mar. Ecol. Prog. Ser. 2003, 246, 137–152. [Google Scholar] [CrossRef]
  22. Nagai, T.; Clayton, S. Nutrient interleaving below the mixed layer of the Kuroshio Extension Front. Ocean Dynam. 2017, 67, 1027–1046. [Google Scholar] [CrossRef]
  23. Vivier, F.; Kelly, K.A.; Thompson, L.A. Heat budget in the Kuroshio Extension region: 1993–99. J. Phys. Oceanogr. 2002, 32, 3436–3454. [Google Scholar] [CrossRef]
  24. Akihiro, S. Efficiency of water-column light utilization in the subarctic northwestern Pacific. Limnol. Oceanogr. 2000, 45, 982–987. [Google Scholar] [CrossRef]
  25. Isada, T.; Kuwata, A.; Saito, H.; Ono, T.; Ishii, M.; Yoshikawa-Inoue, H.; Suzuki, K. Photosynthetic features and primary productivity of phytoplankton in the Oyashio and Kuroshio–Oyashio transition regions of the northwest Pacific. J. Plankton Res. 2009, 31, 1009–1025. [Google Scholar] [CrossRef]
  26. Wang, T.; Chai, F.; Xing, X.; Ning, J.; Jiang, W.; Riser, S.C. Influence of multi-scale dynamics on the vertical nitrate distribution around the Kuroshio Extension: An investigation based on BGC-Argo and satellite data. Prog. Oceanogr. 2021, 193, 102543. [Google Scholar] [CrossRef]
  27. Chen, X.J.; Cao, J.; Chen, Y.; Liu, B.L.; Tian, S.Q. Effect of the Kuroshio on the spatial distribution of the red flying squid Ommastrephes bartramii in the Northwest Pacific Ocean. Bull. Mar. Sci. 2011, 88, 63–71. [Google Scholar] [CrossRef]
  28. Watanabe, Y. Latitudinal variation in the recruitment dynamics of small pelagic fishes in the western North Pacific. J. Sea Res. 2007, 58, 46–58. [Google Scholar] [CrossRef]
  29. Yasuda, I.; Watanabe, T. Chlorophyll a variation in the Kuroshio extension revealed with a mixed-layer tracking float: Implication on the long-term change of pacific saury (Cololabis saira). Fish. Oceanogr. 2007, 16, 482–488. [Google Scholar] [CrossRef]
  30. Ebisawa, Y.; Kinoshita, T. Relationship of surface water temperature in Boso-Sanriku area and recruitment per spawning biomass of the Japanese sardine. Bull. Ibaraki Prefect. Fish. Exp. Stn. 1998, 36, 49–55. [Google Scholar]
  31. Sassa, C.; Kawaguchi, K.; Taki, K. Larval mesopelagic fish assemblages in the Kuroshio-Oyashio transition region of the western North Pacific. Mar. Biol. 2007, 150, 1403–1415. [Google Scholar] [CrossRef]
  32. Sassa, C.; Kawaguchi, K.; Hirota, Y.; Ishida, M. Distribution depth of the transforming stage larvae of myctophid fishes in the subtropical–tropical waters of the western North Pacific. Deep-Sea Res. Part I 2007, 54, 2181–2193. [Google Scholar] [CrossRef]
  33. Collet, A.; Durand, J.D.; Desmarais, E.; Cerqueira, F.; Valade, P.; Ponton, D. DNA barcoding post-larvae can improve the knowledge about fish biodiversity: An example from La Reunion, SW Indian Ocean. Mitochondrial DNA A 2018, 29, 905–918. [Google Scholar] [CrossRef] [PubMed]
  34. Burrows, M.; Browning, J.; Bønnelycke, E.M.; Zhang, Y.J.; Hu, C.M.; Armenteros, M.; Murawski, S.; Peebles, E.; Breitbart, M. DNA barcoding of fish eggs collected off northwestern Cuba and across the Florida Straits demonstrates egg transport by mesoscale eddies. Fish. Oceanogr. 2020, 29, 340–348. [Google Scholar]
  35. Batta-Lona, P.G.; Galindo-Sánchez, C.E.; Arteaga, M.C.; Robles-Flores, J.; Jiménez-Rosenberg, S.P.A. DNA barcoding and morphological taxonomy: Identification of lanternfish (Myctophidae) larvae in the Gulf of Mexico. Mitochondrial DNA A 2019, 30, 375–383. [Google Scholar] [CrossRef] [PubMed]
  36. Pappalardo, A.M.; Cuttitta, A.; Sardella, A.; Musco, M.; Maggio, T.; Patti, B.; Mazzola, S.; Ferrito, V. DNA barcoding and COI sequence variation in Mediterranean lanternfishes larvae. Hydrobiologia 2015, 749, 155–167. [Google Scholar] [CrossRef]
  37. Ayala, D.; Riemann, L.; Munk, P. Species composition and diversity of fish larvae in the subtropical convergence zone of the sargasso sea from morphology and DNA barcoding. Fish. Oceanogr. 2016, 25, 85–104. [Google Scholar] [CrossRef]
  38. Hastie, T.J. Generalized additive models. In Statistical Models in S; Routledge: Abingdon, UK, 2017; pp. 249–307. [Google Scholar]
  39. Hou, G.; Wang, J.; Chen, Z.; Zhou, J.; Huang, W.; Zhang, H. Molecular and morphological identification and seasonal distribution of eggs of four Decapterus fish species in the northern South China Sea: A key to conservation of spawning ground. Front. Mar. Sci. 2020, 7, 970. [Google Scholar] [CrossRef]
  40. Hubert, N.; Espiau, B.; Meyer, C.; Planes, S. Identifying the ichthyoplankton of a coral reef using DNA barcodes. Mol. Ecol. Resour. 2015, 15, 57–67. [Google Scholar] [CrossRef]
  41. Li, L.F.; Zhong, J.S.; Jiao, Z.; Rao, Y.Y.; Yang, C.H.; Liu, H. Vertical distribution and changes during day and night of Coilia nasus larvae and juveniles depending on flood and ebb tide in southern branch of Yangtze River estuary. J. Shanghai Ocean Univ. 2020, 29, 74–82. [Google Scholar]
  42. Munk, P.; Cardinale, M.; Casini, M.; Rudolphi, A. The community structure of over-wintering larval and small juvenile fish in a large estuary. Estuar. Coast. Shelf Sci. 2014, 139, 27–39. [Google Scholar] [CrossRef]
  43. Long, X.; Wan, R.; Li, Z.; Ren, Y.P.; Song, P.B.; Tian, Y.J.; Xu, B.D.; Xue, Y. Spatio-temporal distribution of Konosirus punctatus spawning and nursing ground in the South Yellow Sea. Acta Oceanol. Sin. 2021, 40, 133–144. [Google Scholar] [CrossRef]
  44. Sassa, C.; Kawaguchi, K. Larval feeding habits of Diaphus theta, Protomyctophum thompsoni, and Tarletonbeania taylori (Pisces: Myctophidae) in the transition region of the western North Pacific. Mar. Ecol. Prog. Ser. 2005, 298, 261–276. [Google Scholar] [CrossRef]
  45. Rodriguez-Grana, L.; Castro, L.; Loureiro, M.; Gonzalez, H.E.; Calliari, D. Feeding ecology of dominant larval myctophids in an upwelling area of the humboldt current. Mar. Ecol. Prog. 2005, 290, 119–134. [Google Scholar] [CrossRef]
  46. Jia, F.; Wu, L.; Qiu, B. Seasonal Modulation of Eddy Kinetic Energy and Its Formation Mechanism in the Southeast Indian Ocean. J. Phys. Oceanogr. 2011, 41, 657–665. [Google Scholar] [CrossRef]
  47. Shono, H. Application of the tweedie distribution to zero-catch data in cpue analysis. Fish. Res. 2008, 93, 154–162. [Google Scholar] [CrossRef]
  48. Watanabe, H.; Kawaguchi, K. Decadal change in abundance of surface migratory myctophid fishes in the Kuroshio region from 1957 to 1994. Fish. Oceanogr. 2003, 12, 100–111. [Google Scholar] [CrossRef]
  49. Sassa, C.; Takahashi, M. Comparative larval growth and mortality of mesopelagic fishes and their predatory impact on zooplankton in the Kuroshio region. Deep-Sea Res. Part I 2018, 131, 121–132. [Google Scholar] [CrossRef]
  50. Flores, E.A.; Castro, L.R.; Narváez, D.A.; Lillo, S.; Balbon, F.; Osorio-Zúñiga, F. Inter-annual and seasonal variations in the outer and inner sea spawning zones of southern hake, Merluccius australis, inferred from early life stages distributions in Chilean Patagonia. Prog. Oceanogr. 2019, 171, 93–107. [Google Scholar] [CrossRef]
  51. Moku, M.; Tsuda, A.; Kawaguchi, K. Spawning season and migration of the myctophid fish Diaphus theta in the western North Pacific. Ichthyol. Res. 2003, 50, 0052–0058. [Google Scholar] [CrossRef]
  52. Sassa, C.; Kawaguchi, K.; Oozeki, Y.; Sugisaki, H. Distribution patterns of larval myctophid fishes in the transition region of the western North Pacific. Mar. Biol. 2004, 144, 417–428. [Google Scholar] [CrossRef]
  53. Sassa, C.; Hirota, Y. Seasonal occurrence of mesopelagic fish larvae on the onshore side of the Kuroshio off southern Japan. Deep-Sea Res. Part I 2013, 81, 49–61. [Google Scholar] [CrossRef]
  54. Landaeta, M.F.; Bustos, C.A.; Contreras, J.E.; Salas-Berríos, F.; Palacios-Fuentes, P.; Alvarado-Niño, M.; Letelier, J.; Balbontín, F. Larval fish feeding ecology, growth and mortality from two basins with contrasting environmental conditions of an inner sea of northern Patagonia, Chile. Mar. Environ. Res. 2015, 106, 19–29. [Google Scholar] [CrossRef] [PubMed]
  55. Ojaveer, H.; Lankov, A.; Teder, M.; Simm, M.; Klais, R. Feeding patterns of dominating small pelagic fish in the Gulf of Riga, Baltic Sea. Hydrobiologia 2017, 792, 331–344. [Google Scholar] [CrossRef]
  56. Bernal, A.; Olivar, M.P.; Beckley, L.E. Dietary composition of myctophid larvae off Western Australia. Deep-Sea Res. Part II 2020, 179, 104841. [Google Scholar] [CrossRef]
  57. Bernal, A.; Castro, L.R.; Soto, S.; Cubillos, L.A. Ichthyoplankton distribution and feeding habits of fish larvae at the inshore zone of northern Patagonia, Chile. Mar. Biodivers. 2020, 50, 56. [Google Scholar] [CrossRef]
  58. Contreras-Catala, F.; Sanchez-Velasco, L.; Lavín, M.F.; Victor, M.G. Three-dimensional distribution of larval fish assemblages in an anticyclonic eddy in a semi-enclosed sea (Gulf of California). J. Plankton Res. 2012, 34, 548–562. [Google Scholar] [CrossRef]
  59. Vélez, J.A.; Watson, W.; Arntz, W.; Wolff, M.; Schnack-Schiel, S.B. Larval fish assemblages in Independencia Bay, Pisco, Peru: Temporal and spatial relationships. Mar. Biol. 2005, 147, 77–91. [Google Scholar] [CrossRef]
  60. Sánchez-Hernández, J.; Gabler, H.M.; Amundsen, P.A. Prey diversity as a driver of resource partitioning between river-dwelling fish species. Ecol. Evol. 2017, 7, 2058–2068. [Google Scholar] [CrossRef]
  61. Lobel, P.S.; Robinson, A.R. Larval fishes and zooplankton in a cyclonic eddy in Hawaiian waters. J. Plankton Res. 1988, 10, 1209–1223. [Google Scholar] [CrossRef]
  62. Wu, C.Y.; Wang, X.G.; Zhong, J.S.; Ju, J.L.; Li, C.H. Spatial Patterns of Larval and Juvenile Fish Assemblages in an Eddy Area in the Western South China Sea. Front. Mar. Sci. 2022, 9, 832817. [Google Scholar] [CrossRef]
  63. Shi, Z.H.; Xie, M.M.; Peng, S.M.; Zhang, C.J.; Gao, Q.X. Effects of temperature stress on activities of digestive enzymes and serum biochemical indices of Pampus argenteus juveniles. Prog. Fish. Sci. 2016, 37, 30–36. [Google Scholar]
  64. Fu, C.; Cao, Z.D.; Fu, S.J. The influence of temperature and starvation on resting metabolic rate and spontaneous movement of juvenile Cyprinus carpio. Chin. J. Zool. 2012, 47, 85–90. [Google Scholar]
  65. Nonaka, M.; Xie, S.P. Covariations of sea surface temperature and wind over the Kuroshio and its extension: Evidence for ocean-to-atmosphere feedback. J. Clim. 2003, 16, 1404–1413. [Google Scholar] [CrossRef]
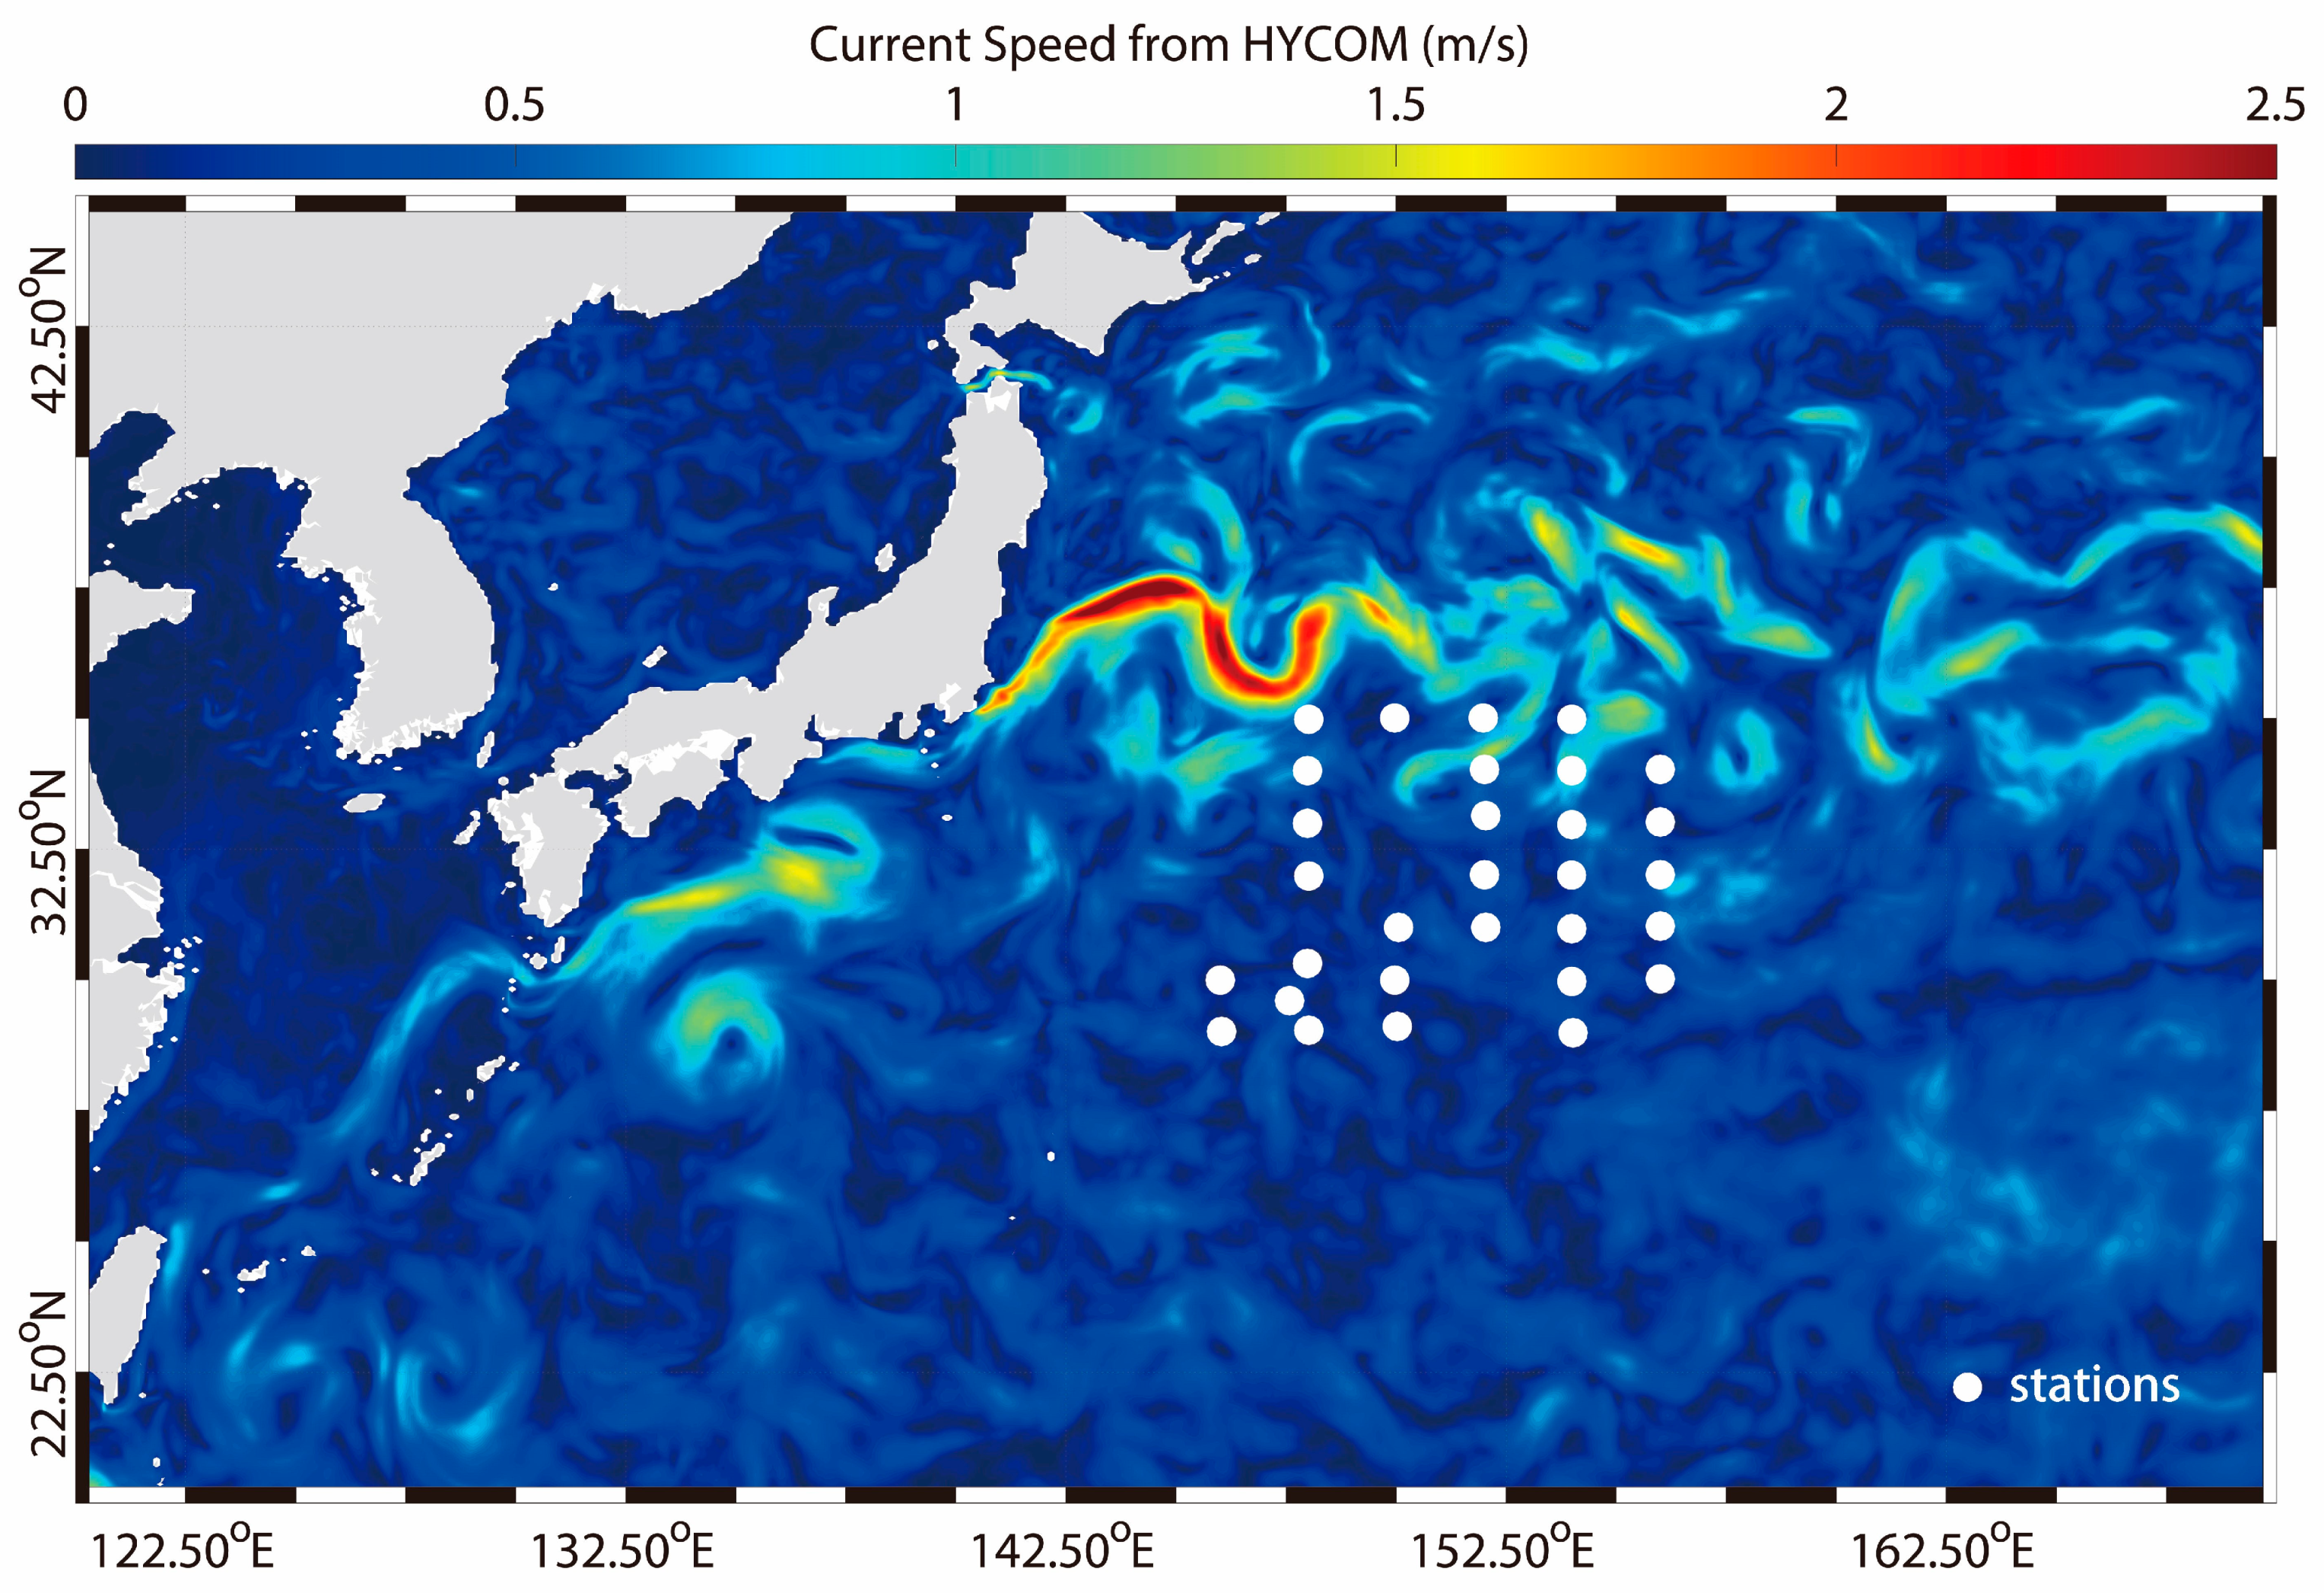
Figure 1. Sampling stations of ichthyoplankton and zooplankton in KE region.
Jmse 11 00898 g001
Figure 2. Photographs of identified species: (a) Benthosema suborbital, (b) Diaphus anderseni, (c) Lampanyctus alatus, (d) Nannobrachium fernae, (e) Symbolophorus rufinus, (f) Ceratoscopelus townsendi.
Jmse 11 00898 g002
Figure 3. Effects of environmental factors on abundance of larval and juvenile myctophid fish in KE region based on horizontal tows: (a) effect of copepod density; (b) effect of EKE. The solid line in the figure represents the effect, and the dotted line represents the 95% confidence interval of the effect.
Jmse 11 00898 g003
Figure 4. Effects of environmental factors on abundance of larval and juvenile myctophid fish in KE region based on vertical tows: (a) effect of copepod density; (b) effect of SST; (c) effect of Chla. The solid line in the figure represents the effect, and the dotted line represents the 95% confidence interval of the effect.
Jmse 11 00898 g004
Figure 5. Relationship between the abundance of larval and juvenile myctophid fish and environmental factors in KE region based on horizontal tows: (a) effect of copepod density; (b) effect of EKE. The solid line in the figure represents the effect, and the dotted line represents the 95% confidence interval of the effect.
Jmse 11 00898 g005
Figure 6. Relationship between the abundance of larval and juvenile myctophid fish and environmental factors in KE region based on vertical tows: (a) effect of copepod density; (b) effect of Chla; (c) effect of SST. The solid line in the figure represents the effect, and the dotted line represents the 95% confidence interval of the effect.
Jmse 11 00898 g006
Table 1. Variance inflation factor among explanatory variables.
Explanatory VariableSSTSLASSSChlaEKEDensity
VIF2.201.151.111.961.301.16
Table 2. Results of the optimal Tweedie-GAM model fitting and parameter analysis of influencing factors.
ModelExplanatory VariableAIC ValueCumulative Deviance ExplainedDeviance Explanation of Each Factorp
Horizontal-GAM+density99.4245.1%45.1%<0.001 ***
+EKE80.6969.4%24.3%0.005 **
Vertical-
GAM
+density60.5422.1%22.1%<0.001 ***
+SST38.7572.4%50.3%<0.001 ***
+Chla32.4881.2%8.8%0.04 *
Note: * means p < 0.05, ** means p < 0.01, *** means p < 0.001.
Disclaimer/Publisher’s Note: The statements, opinions and data contained in all publications are solely those of the individual author(s) and contributor(s) and not of MDPI and/or the editor(s). MDPI and/or the editor(s) disclaim responsibility for any injury to people or property resulting from any ideas, methods, instructions or products referred to in the content.