1. Introduction
Safety onboard passenger ships, despite its significant improvement throughout the years, still remains a critical challenge for the maritime industry, as it holds the highest occurrence number among all ship types [
1], with several well-known accidents, such as Costa Concordia and Norman Atlantic [
2]. Navigational accidents, such as collisions, contacts, and groundings, represent approximately 43% of total occurrences, while fire/explosion incidents hold a non-negligible 15%, leading to serious threats for passengers and crew [
1]. Thus, it is evident that fire and flooding hazards should be carefully considered when focusing on the safety of large passenger vessels, based on the Safety of Life at Sea (SOLAS) Convention [
3] and beyond.
The challenge is either to prevent such events from happening [
2] or to minimize the impact that navigational or fire/explosion accidents have on the persons onboard [
4]. Prevention measures are commonly introduced for all ship types, especially when it comes to navigational accidents. However, in the case of large passenger ships, dealing with the consequences is of utmost importance. In this respect, the main focus for consequence analysis is the evacuation process, which mainly involves two phases, mustering and abandonment, as defined by the International Maritime Organization (IMO) through the MSC.1/Circ.1533 [
5] and by the fourth session of the IMO Sub-Committee on Ship System and Equipment (SSE) [
6]. The mustering phase includes the movement of passengers from any possible space onboard the ship that could be threatened to safer areas, and finally, to the designated muster stations. Abandonment involves the transfer and embarkation of passengers from the mustering stations to the location of lifeboats or other Life-Saving Appliances (LSAs), and the launching process of lifeboats or other LSAs.
Overall, evacuation can be a very big challenge for onboard decision-makers during emergencies but it also troubles designers of the continuously growing-in-size cruise and large passenger vessels. Dealing with this challenge is of utmost importance for the industry in terms of safety, which is proven in practice by a large number of research efforts [
7,
8,
9]. However, as the literature suggests, risk analysis does not refer directly to the evacuation process (e.g., [
10,
11]). Thus, the present paper aims to facilitate the understanding of the risks involved in the evacuation of large passenger vessels by directly focusing on the process and its phases through the development of an enhanced risk model. This will provide the ability to thoroughly examine each step of the process individually in order to specifically identify shortcomings and possible solutions. The developed risk model should also work as a framework to assess these solutions as risk control options (RCOs) and provide recommendations with respect to their adoption. The model is developed in the context of the EU-funded SafePASS project through a combination of techniques and is based both on publicly available well-established previous studies, such as the work by Hamann [
8] and Konovessis et al. [
10], and expert contributions.
The following Section provides the literature review, the background for the model development, and the tools and methods utilized, while afterward the enhanced risk model is presented in detail. Following this, results are provided for both the baseline scenario and the considered RCO that is used for model demonstration purposes. The final Section presents the conclusions and discussions of the developed model and its results.
2. Materials and Methods
This Section presents the conducted literature review, the background for the model development regarding the evacuation context, and the methods and techniques that were utilized for its materialization, in the context of risk analysis and assessment.
2.1. Literature Review
In general, the evacuation of a large and complex environment, such as a cruise or RoPax vessel, is a very demanding safety-critical and time-sensitive task, which requires thousands of moving people to carefully follow directions and the crew must correctly guide passengers throughout the process. Its criticality is evident from the increased research interest regarding evacuation analysis, strategy making [
4,
9,
12,
13,
14], evacuation risk modeling [
8,
15], and technical solutions [
7,
16]. The assumption that all these people will manage to comprehend and follow instructions, or even that the crew will be able to communicate verbally during a crisis, is very optimistic. In addition, fast and accurate evaluation of the ship’s conditions, which is of paramount importance for timely mustering and abandonment, constitutes a very big challenge for ship officers and often is inadequately conducted. In most cases, actual evacuation is insufficiently executed, particularly in the presence of flooding, fire hazards, and in extreme environmental conditions [
12,
13]. Furthermore, considering that current ship designs are not adjusted for facilitating evacuation, imposing delays within the evacuation process, a complete re-thinking of LSA and associated ship designs is necessary. Therefore, it is crucial to further focus on the evacuation process in order to facilitate the understanding of the related risks and provide solutions for risk mitigation.
To that end, major studies have tried to effectively capture the overall risks that derive from major flooding and fire accidents during an evacuation. The concept of risk is defined by the International Organization of Standardization (ISO), as well as the IMO and its “Revised Guidelines for Formal Safety Assessment (FSA) for use in the IMO rule-making process” (MSC-MEPC.2/Circ.12/Rev.2) [
17], as the combination of the frequency or probability of occurrence and the severity of consequences regarding an unfortunate event. These studies include the work conducted in the GOALDS project [
18], the BMVI study [
8], the EMSA III study [
10,
19,
20], and of course, the FSA studies based on the IMO’s guidelines [
17], beginning with the FSA on bulk carriers back in 2002 [
21], but mostly focusing on passenger vessels through the FSA studies on cruise and RoPax ships [
22,
23]. Additionally, a wide range of research has been conducted recently in the same direction, but by individually focusing on either flooding or fire cases. Indicatively, regarding flooding risks, Vassalos and Mujeeb-Ahmed provide important recommendations on the way forward for ship damage stability and flooding risk assessment [
24]; while in another work deriving from the EC-funded FLARE project, Vassalos et al. introduce a multi-level approach for flooding risk estimation on passenger ships [
11]. As for fire risks, Spyrou and Koromila propose a risk model for assessing a passenger ship’s fire safety at the design stage [
25], while Sarshar et al. present an evacuation model for evaluating the evacuation time while a fire happens onboard [
15].
From most of the aforementioned studies and published research, it is understood that risk modeling does not directly refer to the evacuation process. Instead, they are focusing either on the flooding or fire propagation and ship conditions [
10,
22,
23], or individually on evacuation analysis [
9,
14], fire safety [
25], flooding damage stability, and flooding risk assessment [
11,
18,
24]. In this respect, risk analysis on the basis of the evacuation process is justified and should offer a new perspective to consider for enhancing safety in cruise and large passenger vessels.
2.2. Background
In general, risk models in the context of the considered maritime accidents and, consequently, the evacuation process, are based on a high-level event sequence [
10,
22,
23]. As explained earlier, this event sequence is usually referring to the flooding or fire propagation (e.g., slow or rapid sinking in flooding cases, fire containment, etc.), and factual information (e.g., struck or striking a vessel for flooding accidents, the density of people for fire cases, etc.). Indicatively,
Figure 1 shows the high-level event sequence for collision accidents, which follows the aforementioned rationale. Another approach that refers to the high-level sequence of the subsequent events, which more accurately describes the evacuation process, is adapted from the FSA on bulk carriers [
21] and comprises the following:
Evaluation of the situation/ship condition;
The mustering of passengers (and preparation of LSAs);
Abandonment to the survival craft/water;
Survival in the survival craft/at sea;
Rescue/safe haven.
A more accurate approach and description of the evacuation process was introduced through a similar model by an IMO Sub-Committee [
6]. This approach is describing the event sequence in emergency cases and is presented in
Figure 2, also highlighting the focus of the risk model introduced in this paper. Given the accident, the process sequentially considers the evaluation of the situation and alarm triggering, the mustering process, the preparation of LSAs, the embarkation process, and the deployment and survival of LSAs. Jump to sea and, therefore, survival at sea or retrieval to lifeboats or other LSAs, is considered in extreme occasions, where escape or embarkation is not possible.
2.3. Methods and Tools
In the context of risk analysis, as defined by the IMO’s FSA guidelines [
17], with respect to the evacuation process as described earlier, a risk model can be developed by utilizing different tools and techniques. The method should be adequate for the context under consideration in order to provide reliable results. Indicatively, fault tree analysis (FTA), event tree analysis (ETA), influence diagrams, and Bayesian networks (BNs) are some of the most popular techniques [
17]. Furthermore, quantification of the model can be very challenging, depending on the availability of data. If available, accident and failure data, as well as other sources of information, including previous studies, can be very useful. Otherwise, the use of established techniques for expert judgment may be necessary. Sensitivity analysis and uncertainty analysis should be also considered in parallel with the model quantification, in order to identify and deal with uncertainties [
17] and certainties FSA of C [
17].
Since the present work is based on well-established previous studies that utilized ETA [
10,
22] and several influence models following the rationale of influence diagrams and BNs, a combined methodology of ETA and BNs were employed for developing the considered risk model for the evacuation process in flooding and fire emergencies.
Event tree analysis (ETA) is a well-known risk modeling technique that is used to analyze the effects of an accident [
26,
27]. It is based on a logic diagram of multiple gates, formulating various success and failure paths, based on an event sequence. ETA allows for a structured identification of the possible consequences based on an initiating event/accident [
17,
28]. The analysis starts by placing on the left-hand side or top the initiating event and then arranging the rest of the intermediate events in chronological order up until the bottom or right-hand side where the consequences are being quantified. The success and failure paths lead to various consequences of differing severity or magnitude. Multiplying the likelihood of the accident by the probabilities of failure or success in each path gives the likelihood of each consequence. Consequences are usually introduced through a utility function which expresses the population exposed to the consequences. In this respect, ETA may provide results in terms of societal risk.
Bayesian networks (BNs) are probabilistic graphical models that represent a set of random variables and their conditional dependencies through a directed acyclic graph [
29]. Arrows represent dependencies and they are directed from parent to child nodes, which are all assigned with a conditional probability table (CPT). As a technique, they have been utilized in a variety of research works [
15,
30,
31,
32]. The BN rationale can be easily understood through the example of the probabilistic relationships between diseases and symptoms [
17]. Given any symptoms, a BN model can be used to estimate the probability of the presence of disease, and vice versa, and given the disease, the BN can estimate the probability of developing symptoms. In general, BNs are a well-established technique that is based on Bayes’ theorem which is proven to be a coherent method for mathematically expressing a decrease in uncertainty gained by an increase in knowledge [
33]. Its mathematical expression is shown in Equation (1) for a parameter
θ, which is given a parameter
x. The factor
represents the posterior probability of occurrence for
θ given the condition that
x occurs,
stands for the prior occurrence probability of
θ,
denotes the marginal occurrence probability of
x, and
stands for the conditional probability of occurrence for
x given that
θ occurs.
In practice, the process of calculating posterior probabilities of an observed parameter in a BN is called Bayesian inference, which is a type of statistical inference where Bayes’ theorem is used to update the probability for a hypothesis as more evidence or information becomes available. The process requires the calculation of joint probabilities for the entire network based on the assigned CPTs, which is materialized through the chain rule presented in Equation (3). The chain rule is a generalization of the fundamental rule of BNs, presented in Equation (2) [
29].
represents the joint probability of parameter
θ and
x,
theoretically denotes the joint probability of an entire network of
n parameters, while
represents the conditional relationship between the child parameter
and its parents. Additionally, the marginalization of joint probabilities is required in the process of Bayesian inference and is simply expressed by Equation (4) [
29].
Computationally, Bayesian inference is achieved through specific algorithms, such as the junction tree algorithm, while the development and calculations are facilitated through the use of complete software packages that include both the graphical and computational parts. In this work, the GeNIe modeler software from the Bayes Fusion package is utilized for developing the respective part of the risk model [
34]. GeNIe also facilitates additional functions, such as sensitivity analysis, as will be later presented.
3. Risk Model
The model was developed based on the detailed analysis of the evacuation process and on an established previous study that contained a number of influence models that are providing the probability of success/failure of the elements of the generic evacuation sequence [
8]. The risk model starts with the evaluation of the situation and by defining the threat context, and concludes with the survival in a lifeboat, in another LSA, or at sea. The most important threat is the capsizing of the vessel for flooding accidents, providing a lower bound for the available evacuation time. This is assumed to result in untenable conditions for the evacuation and leads to an unorderly evacuation. For fire accidents, the containment and spreading of the fire are carefully considered to define untenable conditions, respectively, and, therefore, define the scenario of normally executing the evacuation event sequence. A variety of hazards that may lead to fatalities have been taken into account, including failing to muster from technical problems or human error, missing survival craft due to preparation failure or incapacitation, failure in the abandonment process, either embarkation, lowering, or clearing, and being unable to survive in the craft or at sea [
8]. The model is structured into two levels, following an approach that combines ETA and BNs. Thus, this Section, in the following paragraphs, presents the two-level structure and some considerations for the risk calculations, and it concludes with a review process for the developed risk model and the presentation of an RCO case.
3.1. Model Structure—Event Tree Analysis
The first level refers to an event tree, which includes all relevant steps of the evacuation process, and serves as the “backbone” of the model. For the purpose of covering all four accident categories considered, i.e., collision, grounding, contact, and fire/explosion, two generic trees are developed, one for flooding and one for fire accidents, resulting in a total of four event trees, and one for each accident category considered. Of course, event trees for the three flooding accident categories have an identical structure, but they differ when it comes to quantification.
Figure 3 presents the event tree that corresponds to flooding accidents, while
Figure 4 shows the event tree that refers to fire/explosion accidents.
Based on the high-level sequence presented earlier, the event trees include the following phases, as clearly illustrated in the figures:
The mustering process;
The lifeboat or other LSA availability and preparation;
The transfer toward and embarkation to the lifeboats or other LSAs during the abandonment phase;
The lifeboat lowering, as part of the abandonment phase;
The lifeboat or other LSAs clearing off the shipside during abandonment and whether not clearing off its life-threatening;
Survival while waiting for rescue, either in a lifeboat, in another LSA, or at sea.
Not all event gates correspond to an evacuation phase. These, however, are crucial for the model structure, as indicated during the model review process by experts, which will be later presented. In more detail, the first event gates are introducing a couple of scenarios to consider in the risk analysis with respect to the significance of the hazards considered (e.g., rapid capsize or uncontrolled fire). For flooding accidents, the extent of the damage should be considered in order to assess the flooding potential, as well as the distinction between orderly evacuation and untenable conditions (unorderly evacuation). Orderly evacuation leads to the sequence of evacuation phases, while untenable conditions lead directly to fatalities for the exposed population. In the case of fire/explosion accidents, the compression and containment of the fire are of utmost importance. If the fire is rapidly extinguished, then no fatalities can be assumed. In the case of a contained fire, either within a compartment or even within a fire zone, then the sequence of evacuation process phases should be followed. If the fire is uncontrollable, e.g., rapidly escalating beyond the fire zone leading to a total loss of the ship, then, as an analogy to the untenable conditions of the flooding case, it will lead directly to fatalities in the exposed population. Finally, the event tree corresponding to fire/explosion accidents excludes the lifeboat or another LSA clearing phase during abandonment, since the lifeboat, and thus the lives of passengers or crew, are not threatened by a possible ship capsize, as in flooding accidents.
3.2. Model Structure—Bayesian Networks
The second level corresponds to several sub-models, which are developed as static Bayesian networks, based on a previous study [
8], but further restructured and refined. Each of the networks focuses on a specific phase of the evacuation process by incorporating all identified hazards and defining causal relationships among its parameters. Their purpose is to provide an estimation of probability for the observed parameters, which represent the failure or success of the respective evacuation process steps. These results can be easily introduced as input to the developed event trees, in order to influence the probabilities in event tree gates, aiming at a more accurate risk modeling and probability estimation. Practically, the results from BNs will be directly inserted into the respective event tree gates, quantifying the entire event tree. Some additional considerations for the quantification of the event trees are discussed in the next Section.
However, the main part of the model quantification refers to Bayesian networks and their conditional probability tables. This was possible mainly through the available statistical data that were provided by previous studies [
8,
10,
22] and the accident database developed within the SafePASS project. Thus, frequencies identified from within the data sets were used to directly quantify probabilities, since they were produced by a sufficient set of observations. The unavoidable scarcity of data regarding certain parameters and their relationships was overcome through expert contribution. Experts with different backgrounds, including seagoing experience, safety engineering, and academic and research experience, directly provided their judgment regarding selected parameters and their conditional probabilities with respect to other model parameters. Quantification simply assumed their average for CPTs. In general, this multi-source data and expert approach is widely used in the case of Bayesian networks for quantification purposes [
28,
30], which is also described as a comparative advantage for BNs [
29], among other risk analysis techniques.
After an iterative process of review and revision during their development, and through a detailed review by experts afterward, BNs were finalized both in structure and quantification. The final list of BNs is presented in
Table 1.
Obviously, most Bayesian networks correspond to a phase of the evacuation process. Only the first one, which refers to untenable conditions in flooding accidents, is not directly linked to an evacuation phase. This network serves to define the conditions of the evacuation, based on the hazard’s significance (e.g., rapid capsize), and whether a normal execution of the evacuation event sequence may be allowed or not. However, this network includes one of the most important aspects of the evacuation process, which corresponds to the evaluation of the situation [
8]. Additionally, BNs 09a and 09b are linked to the lifeboat lowering and clearing during abandonment, respectively, and are utilized to define the probability of fatalities following an unsafe lowering or a failure to clear off.
Indicatively, BNs referring to the mustering process are presented in
Figure 5 and
Figure 6, for flooding and fire/explosion accidents, respectively. The rest of the BNs are presented in
Appendix A.
The green nodes correspond to qualitative parameters for the Bayesian networks, indicating their effect on other model parameters. Their actual impact in quantitative terms could not be defined since the lack of data or relative references, in conjunction with a great deal of uncertainty that would be introduced by expert judgment, did not allow their quantification. These parameters are mainly referring to the human element, which has many difficulties in terms of quantification. The yellow nodes, one for each Bayesian network, represent the observed parameters; the values of which are introduced into the event trees. The grey nodes represent parameters that are given evidence, following the definition of a specific scenario. The standard evidence given normally for all Bayesian networks, where applicable, are referring to the “Accident Category”, “Ship Type” and “Sea Area” parameters. For the accident category, “Collision”, “Grounding”, and “Contact” may be chosen, as far as flooding accidents are concerned. For fire/explosion accidents, the respective evidence is given in the “Accident Category” parameter. The “Sea Area” is chosen, respectively, among specific sea areas or for worldwide cases, while for the “Ship Type”, the focus is either on cruise or RoPax ships. Finally, the cyan nodes are referring to probabilistic parameters, without considering any evidence.
3.3. Risk Calculation Considerations
Given the two-level structure of the model and its quantification, the model may provide results. However, there are still a couple of issues that should be defined carefully regarding the risk calculation, which are discussed below.
First of all, the risk analysis should have the appropriate formal risk metric. As such events are referring to a large population of passengers and crew, the risk calculation should refer to societal risk. Indeed, societal risk is used to estimate risks of accidents affecting a significant number of persons, where individual risk could be insufficient [
17]. Societal risk could refer to a single accident type (e.g., collision), or could combine all types of accidents considered since it can have a common expression. A simple measure (expression) of societal risk is the Potential Loss of Life (PLL) which is defined as the expected value of the number of fatalities per year [
17]. PLL can be described as an integral of the product of probability (or frequency) and consequence for all potential undesired events that could occur. Thus, for the risk model, the PLL is adopted as a metric to calculate risk for each considered accident and to combine them for calculating the total risk.
Furthermore, with respect to the PLL calculation, all potential undesired events that could occur based on the event trees and their quantification through BNs, correspond to a probability of occurrence. In order to calculate risk, the utility function introducing the consequences should be defined as well, which is usually the expected consequences [
30]. In this respect, the utility function is defined as the exposed population to each of the undesired scenarios, which could be either the total population capacity or a percentage of the total population capacity of each scenario. The utility function for each undesired scenario is based on the developed Bayesian networks, previous studies, or expert judgment. The total exposed population can be equal to the passengers’ capacity and serving crew (e.g., in the case of untenable conditions), to the passengers’ capacity (e.g., in the phases of mustering or embarkation), or to the capacity of the lifeboat or another LSA (e.g., unsafe lowering or survival in a lifeboat).
The Bayesian network that can provide the actual exposed population fatalities for the respective potential undesired events is the BN 09
a, which corresponds to the unsafe lowering scenario, and the BN 09
b, which refers to the fatalities in case of clearing fails. Additionally, the EMSA III study provides percentages of 80% and 5% for the cases of fast and slow flooding, respectively [
10]. Thus, for the actual exposed population, 80% of the total exposed population is assumed for the case of untenable conditions, and 5% for the cases of failing to muster, failing to transfer, and embarking to the lifeboats during the abandonment. For fire/explosion accidents, the study provides percentages of 7.5% and 2.5% for the cases of an uncontrollable fire leading to a total loss of the ship and a contained fire in high-density spaces, respectively [
10]. So, for the actual exposed population, 7.5% of the total exposed population is assumed for the case of an uncontrollable fire, and 2.5% for the cases of failing to transfer and embark to lifeboats during the abandonment process. In the case that a fire is rapidly extinguished, only 0.1% of the total exposed population is considered by expert judgment. For the rest of the undesired events, which correspond to either the survival in a lifeboat/LSA or at sea, the total population is assumed (100%) as the actual exposed population.
Additionally, in order to appropriately consider the accident and its characteristics, several factors are identified and inserted into the model as scaling factors for the flooding cases. In other words, these factors are describing the accident just before the question of whether there will be a capsize or not. Thus, given the accident occurrence and these conditions, the evacuation process is unrolled. The scaling factors are presented in
Table 2, and their values derive from the EMSA III study [
10] and the FSA of cruise ships [
22]. For the fire/explosion event tree, no scaling factors are considered, while the frequencies for uncontrollable and rapidly extinguished fires are extracted from the two aforementioned studies.
Finally, several additional assumptions are considered for the model, regarding the event trees and their quantification:
The probability of LSA unavailability is approximately 10% of the probability of conventional lifeboat unavailability, based on expert judgment.
The probability of transfer and embarkation during abandonment is considered the same for both lifeboats and LSAs.
The probability of not surviving in an LSA is double the probability of not surviving in a lifeboat, according to expert judgment.
3.4. Risk Model Review
To finalize the model, a detailed review process was followed. The review was conducted by experts from the plan approval and fire safety departments of RINA, in the context of the SafePASS project. The experts reviewed the model both directly, regarding the Bayesian networks, and through a workshop, regarding the generic event trees. The review focused more on the fire/explosion case, providing suggestions and highlighting weaknesses that were addressed to enhance the model overall. The flooding case was not examined thoroughly, as it was based on solid work from a previous study [
8]. The following paragraphs present only the key points of the final model revision that was conducted based on the review outcome.
Firstly, regarding the sub-models, only two of the fire-related networks were significantly revised based on the outcomes of this review. These were BN 02
FX, i.e., “Reach Muster Station” and BN 04
FX, i.e., “Transfer and Embark to lifeboats”. The focus of the revision was the fire effluents, i.e., heat, smoke, and toxicity, and the possibility of debris from the fire, and consequently, their effect on the probability of blocked routes during either mustering or abandonment. A single “route blocked” parameter was considered for both networks, affected by debris and fire effluents parameters. However, toxicity could not be quantified due to its complexity and lack of data, and thus it remained as a qualitative parameter. Regarding the Bayesian network that refers to the availability of lifeboats, as it is far less complex, only simple considerations were made. The only major consideration, as the lifeboats may be damaged also from fire, were the influence of the “Accident Category” parameter and the “Damaged in Accident” parameter, which were thoroughly discussed in terms of quantification. All three BNs were graphically presented in
Section 3.2 and
Appendix A. Finally, developing a Bayesian network for defining untenable conditions in fire accidents, due to the various contradictions regarding its parameters, and thus the complexity of modeling a fire situation, was not suggested by experts. Instead, direct quantification of the frequencies for the spreading scenarios that are presented in the fire/explosion generic event tree, i.e., rapidly extinguished, contained, and uncontrolled, was preferred and achieved through previous studies [
10,
22].
The workshop review of the generic event trees focused firstly on the flooding case and provided a few comments, which were addressed. In more detail, failing to muster and failing to transfer and embark during abandonment was carefully examined for whether they should directly lead to fatalities or not. In this respect, a percentage was introduced on the exposed population, to limit the fatality potential. In addition, when stuck in the process of lowering, it is not easy for the passengers to jump to sea, especially if the lifeboat is stuck early, at a significant height. Thus, an additional event gate was considered, in order to have both scenarios: jumping and not jumping to sea. For the case of jumping to sea, survival at the sea event gate is appropriate, while for the latter case, the event gate regarding capsizing would be appropriate, since capsizing is the only scenario that would lead to fatalities when stuck in lowering.
The workshop review continued with the review of the fire/explosion generic event tree and the course of events defined by its structure. The input and comments received from the discussion were utilized to refine the model accordingly. Firstly, the term untenable conditions in fire cases is to be carefully defined, according to the review. Normally, a fire should be rapidly suppressed by means of active fire protection, or else it will be contained by means of passive fire protection. Spreading rapidly to the entire ship, leading to an unorderly evacuation, is an extreme scenario, but nevertheless, it could happen. Thus, as described earlier and illustrated in
Figure 4, the first event gate of the generic fire/explosion event tree introduces three different scenarios: a fire that is rapidly extinguished without the need for evacuation; a contained fire, either within a compartment, adjacent compartments, or fire zone, for which an orderly evacuation is executed; and an uncontrollable fire leading to an unorderly evacuation. For defining the probabilities for such scenarios, a Bayesian network referring to untenable conditions in the case of fire was initially considered, but abandoned later, after expert review. Furthermore, it was explained that when stuck in lowering, the threat is the fire spreading, and not a possible ship capsize. If the fire spreads and extends to the position of the lifeboat, then all passengers are exposed. Thus, an event gate was introduced and quantified by experts, referring to whether fire threatens the lifeboat when stuck. However, as far as uncontrolled lowering is considered, it is assumed that the lifeboat or other LSAs will not be available in an earlier phase, and thus, the lifeboat would not be considered for abandonment before the lowering phase. Therefore, the hazards related to uncontrolled lowering do not include fire or fire effluents. In addition, it was suggested that the clearing phase is not applicable for fire accidents, as there is no threat, in contrast to the flooding case where the vessel might capsize. Thus, it was eliminated from the event tree for the fire/explosion case, while an additional gate was introduced for whether a stuck lifeboat may be affected by fire when jumping into the sea is not possible.
3.5. Risk Control Option
In order to demonstrate the model, in terms of risk reduction calculation, a single RCO is considered. To calculate the residual risk and, therefore, the risk reduction, the solution is introduced into Bayesian networks, through parameters that affect certain nodes within the sub-models and, therefore, the observed parameter.
The considered RCO is a guiding system for passengers during the evacuation, the Dynamic Exit Signs. They are conceptualized, designed, and developed within the context of the SafePASS project, and consist of both hardware and software modules. Their overall purpose is to provide real-time dynamic navigation instructions to passengers on the cruise ship during an emergency, via a real-time application hosted in the Dynamic Exit Signs hardware. The Dynamic Exit Signs continuously update the optimal safe paths to the nearest exit based on the conditions of an emergency situation, where static exit signs may lead to a place on the ship which may have become unsafe. This happens since the conditions in the ship may change during a hazard, so the safest path may also change after re-evaluating the parameters and the available paths. These safe paths are calculated in real-time by the system software and sent to the Dynamic Exit Signs in order to be translated into clear visual instructions to the passengers on the route they have to follow during an evacuation incident.
A theoretical improvement regarding the Dynamic Exit Signs was provided by the participants in the pilot tests conducted in the context of the SafePASS project onboard an actual cruise vessel. The participants were asked to evaluate the system with a specifically designed questionnaire after the completion of the pilot tests, based on their impressions and experience. Thus, the parameters related to the Dynamic Exit Signs and their influence are quantified mainly based on that feedback. Ideally, simulations should have been conducted in order to define more accurately the expected enhancement, but such a choice was not possible due a lack of resources. Therefore, the theoretical improvement percentage introduced by the Dynamic Exit Signs and considered for quantification was estimated as 54.69%, which can be verified in the order of magnitude by the respective improvement (55%) that another RCO introduces into the evacuation process, according to Sarshar et al. [
15].
Indicatively, the sub-model for the mustering process is presented in
Figure 7, and it also considers the Dynamic Exit Signs’ RCO. The only influence identified is on the “Trapped/Lost” parameter, as the Dynamic Exit Signs can help passengers find their way through the ship more easily, and thus, they should facilitate the mustering process. Later, in
Section 4.4, results in terms of risk reduction are presented for the considered RCO, following the results from the affected Bayesian networks, while earlier, in
Section 4.2, an indicative model sensitivity analysis focuses on the sub-model for the mustering process, including the Dynamic Exit Signs.
4. Results
Having fully defined both levels of the risk model, it should be implemented on a typical passenger vessel and it should provide results regarding the risk level. This will also serve as the baseline scenario for assessing the considered RCO, as part of the model demonstration. For the implementation and demonstration of the risk model, a specific reference vessel is considered. It is an existing cruise vessel with an overall length of 300 m, a breadth of 35 m, and a design draught of 8 m. The capacity of the vessel is 3000 passengers and 700 crew members, resulting in an overall capacity of 3700 persons on board, while the capacity for the lifeboats and ship’s Marine Evacuation System (MES) are 150 and 500 passengers, respectively. These capacities are later utilized for calculating societal risk. The ship complies with SOLAS regulations and can be assumed as representative of current cruise ships.
Having defined the reference vessel, all calculations will be applicable only for this vessel since several modifications may be needed to adjust the model to another vessel. These refer mainly to the capacity considered, regarding the event tree level, and the quantification regarding the evacuation time and the time to capsize regarding the Bayesian network level. Additional parameters may differ and may need adjustment, mainly within the Bayesian network. Additionally, it is assumed that this specific vessel can be wherever in the world, and not in a specific sea area, e.g., North or Baltic Sea, and that the accident occurs with the ship being en route (not near berth). From these assumptions, specific evidence arises that should be given to the model in order to provide results.
The following Sections provide results from the Bayesian networks and the final results of the model overall, based on the event tree, while also including the demonstration, in terms of risk reduction, and indicative sensitivity analysis of the model for the RCO considered.
4.1. Bayesian Inference
Through the Bayesian networks, and by considering all accident categories, i.e., collision, grounding, and contact, all necessary results are extracted and introduced into the event tree corresponding to the flooding case. The respective process is followed for the fire/explosion case, regarding all sub-models. The results are generated through the GeNIe modeler software [
34], as mentioned earlier. Of course, evidence is given where appropriate, based on the considered accident categories, ship, and sea area. For the accident category, “Collision”, “Grounding”, and “Contact” are chosen in a sequence as far as Bayesian networks related to flooding accidents are concerned, while for the fire/explosion case, the respective evidence is given by the “Accident Category” parameter. The “Sea Area” parameter provides the evidence that corresponds to worldwide cases, while the “Ship Type” parameter is fixed on cruise ships.
Table 3 presents the results from GeNIe regarding all Bayesian networks for the respective accident types. These correspond to the baseline scenario for each accident case and may be introduced into the event trees for overall risk results in terms of PLL.
Additionally, in order to verify the model at the level of the Bayesian networks, the estimated probabilities are compared to the results from the reference study from Hamann [
8]. Indicatively, according to the performed calculations, the BN
01 calculates the probability of the observed parameter “Capsize/Untenable Conditions” as 1.38 × 10
−1 for collision accidents and for all passenger ships worldwide, while the reference study calculates it as 1.51 × 10
−1. Additionally, the BNs 02
FL and 02
FX calculate the probability of the observed parameter “Reach Muster Station” as 5.2 × 10
−2 for the general case (no evidence given), while the aforementioned study estimates the same probability as 3.3 × 10
−2.
Furthermore, the overall probability of a person being killed in evacuation following an accident is calculated as 0.185 based on the presented risk model, which is a little lower than the respective calculated probability, namely 0.235 of the reference study. This probability corresponds to the individual risk of being killed in evacuation, given that an accident has occurred, and evacuation is ordered and executed. All these comparisons serve as verification for the model and should support its results at the level of Bayesian networks. A lack of resources did not allow an experimental verification of the models, especially in terms of quantification, as efforts within the SafePASS project mostly focused on functionality issues of the produced technical solutions. However, this is considered a future direction for further validating and enhancing the developed model.
4.2. Sensitivity Analysis
In order to define the effect that solutions have on a targeted parameter [
32], a sensitivity analysis has been conducted indicatively for the case of the “Reaching Muster Station” Bayesian network by considering only the Dynamic Exit Signs solution.
In general, sensitivity analysis aims to describe in what way and how much the outputs of a model are influenced by the inputs of the model [
35]. In other words, it refers to the close examination of the significance of the uncertainty in the model outputs, which may be considered in the decision-making process based on the model outputs. The approaches for the sensitivity analysis vary, depending on the field of interest, the model structure, the type of data, and other parameters. In the case of Bayesian networks, sensitivity analysis is considered a technique that can help validate the probability parameters of a Bayesian network [
36]. This is performed by investigating the effect of small changes in the model’s numerical parameters (i.e., prior and conditional probabilities) on the output parameters (e.g., posterior probabilities). Highly sensitive parameters affect the reasoning results more significantly. Identifying them allows for a directed allocation of effort in order to obtain accurate results of a Bayesian network model. GeNIe [
34] implements an algorithm proposed by Kjaerulff and van der Gaag [
37] that performs a simple sensitivity analysis in Bayesian networks. In more detail, the algorithm quickly computes a complete set of derivatives of the posterior probability distributions over the target parameter for each of the Bayesian network’s numerical parameters. These derivatives indicate the significance of network numerical parameter precision in generating target posterior probabilities. If the derivative
dp for a parameter is high, then a little change in
p may result in a large change in the target posteriors. When the derivative is tiny, even massive changes in the parameter have minimal effect on the posteriors.
Thus, following the analysis above, in
Figure 8, the Bayesian network “Reach Muster Station” is presented. As for producing results, specific evidence is given in certain parameters, and evidence is given in this case of sensitivity analysis as well. The “Accident Category” is fixed in the collision case and the “Ship Type” is fixed on cruise vessels, while the “Sea Area” is considered worldwide. These parameters are shown in a grey color in the figure. Additionally, the target parameter of “Reach Muster Station” appears in grey. The rest of the grey parameters have CPTs deriving in simple logic, and thus do not have a probabilistic contribution. The other parameters appearing in a scale of white and red are the ones that are studied with respect to their effect on the target parameter. In principle, the redder they are, the more effect they have, while the whiter they are, the less effect they have.
For the indicative case considered,
Figure 9 presents a tornado chart, generated from the GeNIe modeler software [
34] for the top influencing combinations of parameters in 100% of their value spread, with respect to the estimated probability value. Based on the chart, key parameters that are affecting the target parameter stand out, such as being retrieved by the crew significantly affecting the target parameter, as well as discovering other signals by passengers and being trapped or lost due to the flooding situation. These acknowledgments indicate where the focus of solutions should be, with respect to the mustering process. In addition, the parameter of Dynamic Exit Signs is significantly influencing the target parameter, and thus any enhancement brought in by this RCO can largely affect mustering and improve the mustering process.
In addition,
Table 4 presents these top twenty parameters, together with the derivate of each parameter. The derivatives show the potential of greater effect if a larger spread of the current values of parameters will be considered. A smaller spread, e.g., 10%, does not show any significant changes, except the order of the top 20 influencing parameters already identified.
4.3. Baseline Scenario Results
Given the results of the Bayesian networks, the event trees are quantified considering the scaling factors, the utility function specifications, and the assumptions presented in
Section 3.3. Thus,
Figure 10 and
Figure 11 present the quantified event trees corresponding to collision and fire/explosion accidents, respectively. The quantified event trees for the cases of grounding and contact accidents are included in
Appendix B. All event trees correspond to the baseline scenario describing the current situation in the accident response and evacuation process.
To describe the calculations, the collision case is indicatively examined. So, the PLL is calculated by adding all products of the following factors for each of the undesired events of the event tree: collision accident frequency 3.36 × 10
−3 taken from the EMSA III study [
10]; scaling factors, as presented in
Section 3.3 (ship en route: 3.44 × 10
−1, the ship being struck: 5.16 × 10
−1, and water ingress: 3.33 × 10
−1); the probability of a person being killed during an evacuation, i.e., the probability of occurrence for that undesired event; and the utility function, namely the passengers and crew threatened in each case. This product, for the baseline scenario of collision accidents for cruise ships, on a worldwide scale, is estimated as a PLL of 1.14 × 10
−1 per ship/year. If multiplied by 30 years, i.e., the assumed ship lifetime, it results in an overall PLL of 3.42 per ship/lifetime.
The generated results are introduced in
Table 5 for each accident category. The total PLL is simply calculated by adding the PLL for all accident categories. The table also includes the frequency of casualties, i.e., accidents per ship/year, as provided by the EMSA III study [
10], and used in all four event trees. Additionally, the respective results from the EMSA III study [
10] and the FSA for Cruise Ships [
22] are included in the table as well, for comparison reasons. This enables the comparison between the three studies, and thus may serve as a verification of the model both at the event tree level and overall. Indeed, the developed risk model results for the baseline scenario presented above are of the same order of magnitude, and very close to the results from previous studies for all accident categories and in total. It is noted that grounding and contact categories are considered separately and as one in order to serve the comparison with both previous studies.
4.4. Risk Reduction Demonstration
The model’s ability to provide risk reduction from an RCO can be demonstrated following the results for the baseline scenario for all accident categories. The first step is calculating the residual risk from the introduction of the considered RCO, namely the Dynamic Exit Signs. All Bayesian networks affected by the RCO provide updated probabilities for their observed (output) parameters, based on evidence introduced in each network, following the indicative example of BN 02
FL, presented in
Figure 7. The updated probabilities are then provided to the respective event tree gates, and through a recalculation, the event tree delivers an updated PLL value. Indicatively, the updated collision event tree is shown in
Figure 12, highlighting the updated result, namely the residual risk, and the updated probabilities together with the respective event gates. Then, the residual risk is simply subtracted from the initial baseline risk, resulting in risk reduction in the case of flooding accidents.
The same process is performed for all accident categories and provides risk reduction for each one of them. The total risk reduction is simply calculated by adding the risk reductions for all accident categories.
Table 6 presents these results for the case of Dynamic Exit Signs, which provide a total risk reduction of 1.3 lives per lifetime of the ship. The order of magnitude is verified by the results from the FSA on cruise ships [
22], for which the risk reduction for a number of RCOs range from 0.95 to 2.10 lives saved per ship/year, in an assumed lifetime of 30 years.
5. Discussion and Conclusions
The developed model is structured following an alternative approach of modeling the risks that are involved in accident response for large passenger vessels. Instead of using the event sequence of previous studies that focus on the accident propagation and factual information regarding the accident and ship conditions, this work is based on the event sequence of the evacuation process. This serves a number of purposes, laying the ground for a wide range of applications.
First of all, the model structure allows focusing on a specific part of the ship evacuation process, which can be further examined and analyzed. The objectives of such an activity can be either to mitigate the risks in the identified high-risk areas through risk control options or to evaluate new solutions in terms of safety. The latter can either aim at risk reduction or it can ensure at least the same level of safety with respect to the baseline scenarios. These describe the current situation in ship safety with respect to the existing regulatory framework. This application can be rather important, as it may be utilized in the context of the IMO’s regulatory framework for the analysis of alternative design and arrangements [
38,
39]. Furthermore, designers can make good use of the risk model to preliminarily test their solutions in terms of safety, as conducted within the SafePASS project for a number of technical solutions, which serve as risk control options.
Additionally, since the model follows the event sequence of the evacuation process, a dynamic application of the model can be supported, which will be able to provide a real-time estimation of the risk during an emergency. This can result in an enhanced decision support tool for managing emergencies onboard large passenger vessels. This is attempted to a great extent within the SafePASS project, following exactly the rationale of the developed risk model, namely Bayesian networks and the event sequence of the event trees.
The risk model can be applied for each of the above cases since it has been compared to previous studies for verification purposes. Comparison has been conducted in both levels of the risk model. Firstly, by focusing on Bayesian networks and the risk of a person being killed during an evacuation, and then by focusing on the event trees and the overall risk expressed in terms of PLL per ship/year or ship/lifetime.
In terms of managerial implications, the risk model is destined to support decision-making. Thus, considering all the aforementioned possible applications, it should be linked to both operational and design levels in terms of management. On the one hand, understanding the implicated risk, as well as identifying the evacuation process steps and the respective factors that are most contributing to the overall risk, various operational measures could be adopted for mitigation. Indicatively, the crew can employ technical measures to locate trapped or lost passengers in order to assist them in the process of mustering, while novel LSA solutions allow the repositioning of craft by the designated crew if threatened (e.g., by fire propagation). On the other hand, a possible overall high-risk evaluation indicates the necessity for mitigation measures to the ship owner, providing the respective incentives in terms of a cost–benefit analysis. Thus, design measures should be adopted, such as smart solutions that facilitate passengers throughout the mustering process, or novel LSAs that may accelerate the abandonment process. All aforementioned indicative examples constitute RCO solutions that are examined within the context of the SafePASS project, such as the one included in the present paper.
Regarding future directions, following the indicative risk reduction calculation for a single RCO case, the model should include a cost–benefit assessment (CBA) step, in order to introduce cost effectiveness as a criterion. This could completely redefine the results, despite the significant achieved risk reduction from the considered RCO. Thus, CBA is considered a future step following the present work and is already in progress within the SafePASS project. Additionally, more RCO cases may be considered for the model, or combinations of RCOs, in order to widely test the model application. Finally, future research directions can mainly focus on the aforementioned real-time dynamic risk assessment.
Author Contributions
Conceptualization, N.P.V., E.B. and F.S.; methodology, N.P.V., E.B., P.S., F.S., M.A. and V.C.P.; software, M.A. and V.C.P.; validation, A.M. and S.C.; formal analysis, A.M. and S.C.; data curation, M.A. and V.C.P.; writing—original draft preparation, M.A.; writing—review and editing, P.S.; visualization, M.A. and V.C.P.; supervision, N.P.V. All authors have read and agreed to the published version of the manuscript.
Funding
This research was funded by the EU under the Grant Agreement ID 815146.
Institutional Review Board Statement
Not applicable.
Informed Consent Statement
Not applicable.
Data Availability Statement
Acknowledgments
This work was performed within the EU H2020 program “SafePASS- Next generation of life SAving appliances and systems for saFE and swift evacuation operations on high-capacity PASSenger ships in extreme scenarios and conditions”. The opinions expressed herein are those of the authors and the European Commission is not responsible for any use that may be made of the information it contains.
Conflicts of Interest
The authors declare no conflict of interest.
Appendix A
This Appendix presents the Bayesian network models described in
Section 3.2 and
Table 1, except BNs 02
FL and 02
FX, which are presented in
Figure 5 and
Figure 6 previously. Grey nodes correspond to parameters that are given evidence, green nodes represent qualitative parameters, yellow nodes correspond to the output parameters for each Bayesian network, and cyan nodes are all the rest probabilistic model parameters that are somehow influencing the output parameter.
Figure A1.
A Bayesian network for capsize/untenable conditions in flooding accidents (01).
Figure A1.
A Bayesian network for capsize/untenable conditions in flooding accidents (01).
Figure A2.
A Bayesian network for lifeboat availability in flooding accidents (03FL).
Figure A2.
A Bayesian network for lifeboat availability in flooding accidents (03FL).
Figure A3.
A Bayesian network for lifeboat availability in fire/explosion accidents (03FX).
Figure A3.
A Bayesian network for lifeboat availability in fire/explosion accidents (03FX).
Figure A4.
A Bayesian network for transfer and embarkation to lifeboats in flooding accidents (04FL).
Figure A4.
A Bayesian network for transfer and embarkation to lifeboats in flooding accidents (04FL).
Figure A5.
A Bayesian network for transfer and embarkation to lifeboats in fire/explosion accidents (04FX).
Figure A5.
A Bayesian network for transfer and embarkation to lifeboats in fire/explosion accidents (04FX).
Figure A6.
A Bayesian network for lifeboat lowering in both flooding and fire/explosion accidents (05).
Figure A6.
A Bayesian network for lifeboat lowering in both flooding and fire/explosion accidents (05).
Figure A7.
A Bayesian network for lifeboat clearing in flooding accidents (06).
Figure A7.
A Bayesian network for lifeboat clearing in flooding accidents (06).
Figure A8.
A Bayesian network for survival in the lifeboat in flooding and fire/explosion accidents (07).
Figure A8.
A Bayesian network for survival in the lifeboat in flooding and fire/explosion accidents (07).
Figure A9.
A Bayesian network for survival at sea in both flooding and fire/explosion accidents (08).
Figure A9.
A Bayesian network for survival at sea in both flooding and fire/explosion accidents (08).
Figure A10.
A Bayesian network for fatalities in unsafe lowering in both flooding and fire/explosion accidents (09a).
Figure A10.
A Bayesian network for fatalities in unsafe lowering in both flooding and fire/explosion accidents (09a).
Figure A11.
A Bayesian network for capsizing and evacuation in flooding accidents (09b).
Figure A11.
A Bayesian network for capsizing and evacuation in flooding accidents (09b).
Appendix B
Following the presentation of the calculations and final model results for collision and fire/explosion accidents, this Appendix includes the respective figures regarding event tree calculations and final model results for the other two accident types considered, namely grounding and contact accidents.
Figure A12.
Event tree calculations and results for the baseline scenario of grounding accidents.
Figure A12.
Event tree calculations and results for the baseline scenario of grounding accidents.
Figure A13.
Event tree calculations and results for the baseline scenario of contact accidents.
Figure A13.
Event tree calculations and results for the baseline scenario of contact accidents.
References
- EMSA. Annual Overview of Marine Casualties and Incidents 2021; European Maritime Safety Agency: Lisbon, Portugal, 2021. [Google Scholar]
- Chae, C.J.; Kim, K.H.; Kang, S.Y. Limiting Ship Accidents by Identifying Their Causes and Determining Barriers to Application of Preventive Measures. J. Mar. Sci. Eng. 2021, 9, 302. [Google Scholar] [CrossRef]
- IMO. SOLAS Consolidated Edition; International Maritime Organization: London, UK, 2020. [Google Scholar]
- Lee, D.; Kim, H.; Park, J.H.; Park, B.J. The Current Status and Future Issues in Human Evacuation from Ships. Saf. Sci. 2003, 41, 861–876. [Google Scholar] [CrossRef]
- MSC.1/Circ.1533; Revised Guidelines On Evacuation Analysis For New And Existing Passenger Ships. International Maritime Organization Maritime Safety Committee: London, UK, 2016.
- SSE 4/3—Safety Objectives And Functional Requirements of The Guidelines On Alternative Design And Arrangements For SOLAS Chapters II-1 AND III-Report of the Correspondence Group. Submission by Sweden; International Maritime Organization Ship System and Equipment Sub-Committee: London, UK, 2017.
- Boulougouris, E.; Vassalos, D.; Stefanidis, F.; Karaseitanidis, G.; Karagiannidis, L.; Amditis, A.; Ventikos, N.; Kanakidis, D.; Petrantonakis, D.; Liston, P. SafePASS-Transforming Marine Accident Response. In Proceedings of the 8th Transport Research Arena TRA 2020, Helsinki, Finland, 27–30 April 2020. [Google Scholar]
- Hamann, R. BMVI Study on Safety Model for Life-Saving Appliances-Risk Model; DNV GL: Hamburg, Germany, 2019. [Google Scholar]
- Liu, Y.; Zhang, H.; Zhan, Y.; Deng, K.; Dong, L. Evacuation Strategy Considering Path Capacity and Risk Level for Cruise Ship. J. Mar. Sci. Eng. 2022, 10, 398. [Google Scholar] [CrossRef]
- Konovessis, D.; Hamann, R.; Eliopoulou, E.; Luhmann, H.; Cardinale, M.; Routi, A.-L.; Kujanpaa, J.; Bertin, R.; Harper, G.; Pang, E. Risk Acceptance Criteria and Risk Based Damage Stability, Final Report, Part 2: Formal Safety Assessment; DNV GL: Høvik, Norway, 2015. [Google Scholar]
- Vassalos, D.; Paterson, D.; Mauro, F.; Murphy, A.; Mujeeb-Ahmed, M.P.; Michalec, R.; Boulougouris, E. A Multi-Level Approach for Flooding Risk Estimation and Assessment of Passenger Ships. In Proceedings of the SNAME Maritime Convention, Houston, TX, USA, 27–29 September 2022. [Google Scholar]
- Hu, M.; Cai, W. Research on the Evacuation Characteristics of Cruise Ship Passengers in Multi-Scenarios. Appl. Sci. 2022, 12, 4213. [Google Scholar] [CrossRef]
- Vassalos, D.; Bole, M.; Vassalos, G.C.; Bole, M.; Kim, H.S.; Majumber, J. Advanced Evacuation Analysis–Testing the Ground on Ships. In Proceedings of the 2nd International Conference on Pedestrian and Evacuation Dynamics, Greenwich, UK, 20–22 August 2003. [Google Scholar]
- Liu, L.; Zhang, H.; Xie, J.; Zhao, Q. Dynamic Evacuation Planning on Cruise Ships Based on an Improved Ant Colony System (IACS). J. Mar. Sci. Eng. 2021, 9, 220. [Google Scholar] [CrossRef]
- Sarshar, P.; Granmo, O.C.; Radianti, J.; Gonzalez, J.J. A Bayesian Network Model for Evacuation Time Analysis during a Ship Fire. In Proceedings of the 2013 IEEE Symposium on Computational Intelligence in Dynamic and Uncertain Environments, CIDUE 2013–2013 IEEE Symposium Series on Computational Intelligence, SSCI 2013, Singapore, 16–19 April 2013; pp. 100–107. [Google Scholar]
- Ventikos, N.P.; Zagkliveri, T.; Kopsacheilis, I.; Annetis, M.; Pollalis, C.D.; Sotiralis, P. Reducing Ship Evacuation Time: The Case of a Rail Platform for Integrating Novel LSA Lifeboats on Ship Architectural Structures. In Proceedings of the 1st International Conference on the Stability and Safety of Ships and Ocean Vehicles, Glasgow, UK, 6–11 June 2021. [Google Scholar]
- MSC-MEPC.2/Circ.12/Rev.2; Revised Guidelines for Formal Safety Assessment (FSA) for Use in the IMO Rule-Making Process. Iinternational Maritime Organization Maritime Safety and Marine Environmental Protection Committees: London, UK, 2018.
- Papanikolaou, A.; Hamann, R.; Lee, B.S.; Mains, C.; Olufsen, O.; Vassalos, D.; Zaraphonitis, G. GOALDS—Goal Based Damage Ship Stability and Safety Standards. Accid. Anal. Prev. 2013, 60, 353–365. [Google Scholar] [CrossRef] [PubMed]
- Zaraphonitis, G.; Bulian, G.; Lindroth, D.; Hamann, R.; Luhmann, H.; Cardinale, M.; Routi, A.-L.; Bertin, R.; Harper, G. Evaluation of Risk from Raking Damages Due to Grounding, Final Report; DNV GL: Høvik, Norway, 2015. [Google Scholar]
- Spouge, J.; Skjong, R. Risk Acceptance Criteria and Risk Based Damage Stability. Final Report, Part 1: Risk Acceptance Criteria; DNV GL: Høvik, Norway, 2015. [Google Scholar]
- MSC 75/5/2; Formal Safety Assessment—Bulk Carriers. Submitted by Japan; International Maritime Organization Maritime Safety Committee: Tokyo, Japan, 2002.
- MSC 85/17/1; Formal Safety Assessment—Cruise Ships. Submitted by Denmark; International Maritime Organization Maritime Safety Committee: London, UK, 2008.
- MSC 85/INF.3; Formal Safety Assessment—RoPax Ships. Submitted by Denmark; International Maritime Organization Maritime Safety Committee: London, UK, 2008.
- Vassalos, D.; Mujeeb-Ahmed, M.P.; Papanikolaou, A.; Antonini, A. Conception and Evolution of the Probabilistic Methods for Ship Damage Stability and Flooding Risk Assessment. J. Mar. Sci. Eng. 2021, 9, 667. [Google Scholar] [CrossRef]
- Spyrou, K.J.; Koromila, I.A. A Risk Model of Passenger Ship Fire Safety and Its Application. Reliab. Eng. Syst. Saf. 2020, 200, 106937. [Google Scholar] [CrossRef]
- Matsuoka, T.; Mitomo, N.; Kaneko, F. Evaluation of Occurrence Frequencies of Marine Accidents by Event Tree Analysis. In Probabilistic Safety Assessment and Management; Springer: London, UK, 2004; pp. 3269–3274. [Google Scholar] [CrossRef]
- Raiyan, A.; Das, S.; Islam, M.R. Event Tree Analysis of Marine Accidents in Bangladesh. Procedia Eng. 2017, 194, 276–283. [Google Scholar] [CrossRef]
- Sotiralis, P.; Louzis, K.; Ventikos, N.P. The Role of Ship Inspections in Maritime Accidents: An Analysis of Risk Using the Bow-Tie Approach. Proc. Inst. Mech. Eng. O J. Risk Reliab. 2019, 233, 58–70. [Google Scholar] [CrossRef]
- Jensen, F.V.; Nielsen, T.D. Bayesian Networks and Decision Graphs. Statistics for Engineering and Information Science; Springer: New York, NY, USA, 2007; ISBN 0-387-95259-4. [Google Scholar]
- Ventikos, N.P.; Sotiralis, P.; Annetis, E. A Combined Risk-Based and Condition Monitoring Approach: Developing a Dynamic Model for the Case of Marine Engine Lubrication. Transp. Saf. Environ. 2022, 4, tdac020. [Google Scholar] [CrossRef]
- Ventikos, N.P.; Sotiralis, P.; Drakakis, M. A Dynamic Model for the Hull Inspection of Ships: The Analysis and Results. Ocean. Eng. 2018, 151, 355–365. [Google Scholar] [CrossRef]
- Sotiralis, P.; Ventikos, N.P.; Hamann, R.; Golyshev, P.; Teixeira, A.P. Incorporation of Human Factors into Ship Collision Risk Models Focusing on Human Centred Design Aspects. Reliab. Eng. Syst. Saf. 2016, 156, 210–227. [Google Scholar] [CrossRef]
- Zhang, D.; Yan, X.P.; Yang, Z.L.; Wall, A.; Wang, J. Incorporation of Formal Safety Assessment and Bayesian Network in Navigational Risk Estimation of the Yangtze River. Reliab. Eng. Syst. Saf. 2013, 118, 93–105. [Google Scholar] [CrossRef]
- BayesFusion GeNIe Modeler. Available online: https://www.bayesfusion.com/genie/ (accessed on 23 November 2022).
- Loucks, D.P.; van Beek, E.; Stedinger, J.R.; Dijkman, J.P.M.; Villars, M.T. Model Sensitivity and Uncertainty Analysis. In Water Resources Systems Planning and Management: An Introduction to Methods, Models and Applications; UNESCO: Paris, France, 2005; pp. 255–290. ISBN 9231039989. [Google Scholar]
- Castillo, E.; Gutiérrez, J.M.; Hadi, A.S. Sensitivity Analysis in Discrete Bayesian Networks. IEEE Trans. Syst. Man Cybernetics Part A Syst. Hum. 1997, 27, 412–423. [Google Scholar] [CrossRef]
- Kjærulff, U.; van den Gaag, L.C. Making Sensitivity Analysis Computationally Efficient. Proceedings of the Sixteenth Conference on Uncertainty in Artificial Intelligence (UAI2000). arXiv 2000, arXiv:1301.3868. [Google Scholar] [CrossRef]
- ISO ISO Guide 73:2009; Risk Management—Vocabulary. Available online: https://www.iso.org/standard/44651.html (accessed on 22 November 2022).
- MSC.1/Circ.1212; Guidelines on Alternative Design and Arrangements for SOLAS Chapters II-1 and III. International Maritime Organization Maritime Safety Committee: London, UK, 2006.
Figure 1.
A high-level event sequence for collision accidents that was adapted from the GOALDS project [
18].
Figure 1.
A high-level event sequence for collision accidents that was adapted from the GOALDS project [
18].
Figure 2.
Event sequence in emergency cases which highlights the risk model focus, adapted from SSE 4/3 (2017) [
6].
Figure 2.
Event sequence in emergency cases which highlights the risk model focus, adapted from SSE 4/3 (2017) [
6].
Figure 3.
Event tree for flooding accidents.
Figure 3.
Event tree for flooding accidents.
Figure 4.
Event tree for fire/explosion accidents.
Figure 4.
Event tree for fire/explosion accidents.
Figure 5.
Bayesian network for the mustering process in flooding accidents (02FL).
Figure 5.
Bayesian network for the mustering process in flooding accidents (02FL).
Figure 6.
Bayesian network for the mustering process in fire/explosion accidents (02FX).
Figure 6.
Bayesian network for the mustering process in fire/explosion accidents (02FX).
Figure 7.
The Bayesian network for “Reaching Muster Station” in flooding accidents. Grey nodes: generic evidence (accident category = collision, ship type = cruise, and sea area = worldwide), blue nodes: RCO parameter (Dynamic Exit Signs), green nodes: qualitative parameter, yellow nodes: output parameter.
Figure 8.
A Bayesian network for the mustering process, including Dynamic Exit Signs, with “Reach Muster Station” as the target parameter for the sensitivity analysis (accident category = collision, ship type = cruise, and sea area = worldwide).
Figure 8.
A Bayesian network for the mustering process, including Dynamic Exit Signs, with “Reach Muster Station” as the target parameter for the sensitivity analysis (accident category = collision, ship type = cruise, and sea area = worldwide).
Figure 9.
A tornado chart (generated from the GeNIe modeler) of the Bayesian network referring to the mustering process, by assuming Dynamic Exit Signs, for 100% of the spread for the calculated value.
Figure 9.
A tornado chart (generated from the GeNIe modeler) of the Bayesian network referring to the mustering process, by assuming Dynamic Exit Signs, for 100% of the spread for the calculated value.
Figure 10.
Event tree calculations and results for the baseline scenario of collision accidents.
Figure 10.
Event tree calculations and results for the baseline scenario of collision accidents.
Figure 11.
Event tree calculations and results for the baseline scenario of fire/explosion accidents.
Figure 11.
Event tree calculations and results for the baseline scenario of fire/explosion accidents.
Figure 12.
Event tree calculations and results for collision accidents, by considering the Dynamic Exit Signs’ RCO.
Figure 12.
Event tree calculations and results for collision accidents, by considering the Dynamic Exit Signs’ RCO.
Table 1.
The final list of Bayesian networks that are considered for the risk model.
Table 1.
The final list of Bayesian networks that are considered for the risk model.
| ID | Descriptive Bayesian Network Title |
|---|
| 01 | Capsize/Untenable Conditions, for flooding accidents |
| 02FL 1 | Reaching Muster Station, for flooding accidents |
| 02FX 1 | Reaching Muster Station, for fire/explosion accidents |
| 03FL 1 | Lifeboat Availability, for flooding accidents |
| 03FX 1 | Lifeboat Availability, for fire/explosion accidents |
| 04FL 1 | Transfer and Embark to the Lifeboat, for flooding accidents |
| 04FX 1 | Transfer and Embark to the Lifeboat, for fire/explosion accidents |
| 05 | Lifeboat Lowering, for both flooding and fire/explosion accidents |
| 06 | Lifeboat Clearing, for flooding accidents |
| 07 | Survive in the Lifeboat, for both flooding and fire/explosion accidents |
| 08 | Survive at Sea, for both accident types |
| 09a | Fatality in Unsafe Lowering, for both accident types |
| 09b | Capsize and Evacuate, to estimate the probability of fatality when clearing fails, for flooding accidents |
Table 2.
Scaling factors as provided by EMSA III [
10] and FSA on cruise ships [
22].
Table 2.
Scaling factors as provided by EMSA III [
10] and FSA on cruise ships [
22].
| Collision | Grounding | Contact |
|---|
| Water ingress | 0.333 | Water ingress | 0.305 | Hull breach | 0.857 |
| Being struck | 0.516 | Hull breach | 0.857 | Icebergs, bridges, and offshores | 0.400 |
| En route | 0.334 | En route | 0.424 | En route | 0.424 |
| Minor damage | 0.270 | Sinking | 0.567 | Sinking | 0.200 |
Table 3.
GeNIe results for all Bayesian networks and accident categories.
Table 3.
GeNIe results for all Bayesian networks and accident categories.
| ID | Description of Results | Acc. Type 1 | Probability |
|---|
| 01 | Probability of capsize/untenable conditions, applicable only for flooding accidents. | CN | 0.1384 |
| GR | 0.1381 |
| CT | 0.1384 |
| 02FL | Probability of successful mustering, referring only to flooding accidents. | CN | 0.9734 |
| GR | 0.9737 |
| CT | 0.9735 |
| 02FR | Probability of successful mustering, referring only to fire/explosion accidents. | FX | 0.9933 |
| 03FL | Probability of lifeboat availability, referring only to flooding accidents. | CN | 0.8523 |
| GR | 0.9012 |
| CT | 0.8523 |
| 03FR | Probability of lifeboat availability, referring only to fire/explosion accidents. | FX | 0.9209 |
| 04FL | Probability of successful transfer and embarkation to lifeboats during abandonment, referring only to flooding accidents. | CN | 0.9909 |
| GR | 0.9909 |
| CT | 0.9909 |
| 04FR | Probability of successful transfer and embarkation to lifeboats during abandonment, referring only to fire/explosion accidents. | FX | 0.9992 |
| 05 | Probability of unsafe lowering, applicable for all types of accidents. | ALL | 0.0088 |
| Probability of no lowering/stuck, applicable for all types of accidents. | ALL | 0.0030 |
| 06 | Probability of successful lifeboat clearing, applicable only for flooding accidents. | FL | 0.9486 |
| 07 | Probability of survival in the lifeboat, applicable for all types of accidents. | ALL | 0.9988 |
| 08 | Probability of surviving at sea, applicable for all types of accidents. | ALL | 0.8892 |
| 09a | Probability of fatalities in the case of unsafe lowering, applicable only for flooding accidents. | FL | 0.0006 |
| 09b | Probability of capsize and successful evacuation, applicable only for flooding accidents (to estimate fatalities when clearing fails). | CN | 0.0459 |
| GR | 0.0462 |
| CT | 0.0459 |
Table 4.
Results for ΔR (lives saved per ship/lifetime) for the RCO considered, per accident type and in total.
Table 4.
Results for ΔR (lives saved per ship/lifetime) for the RCO considered, per accident type and in total.
| # | Parameter and Evidence (100% Parameter Spread) | dp |
|---|
| 1 | Being Retrieved by the Crew = Yes|Accident Category = Collision | 0.0668 |
| 2 | Flooding = Slow|Ship type = Cruise, Accident Category = Collision | 0.0254 |
| 3 | Discover Other Signals = Yes | 0.0123 |
| 4 | Trapped/Lost = Yes|Dynamic Exit Signs = No, Excessive Heel/Trim = No, Extreme Acceleration = No, Escape Route Blocked = Yes | −0.0125 |
| 5 | Dynamic Exit Signs = Yes | 0.0131 |
| 6 | Trapped/Lost = Yes|Dynamic Exit Signs = Yes, Excessive Heel/Trim = No, Extreme Acceleration = No, Escape Route Blocked = Yes | −0.0125 |
| 7 | Escape Route Blocked = Yes|Flooding = Slow, TTC = 10 to 15 min | −0.0126 |
| 8 | Escape Route Blocked = Yes|Flooding = Slow, TTC = 15 to 20 min | −0.0157 |
| 9 | Escape Route Blocked = Yes|Flooding = Fast, TTC = 10 to 15 min | −0.0028 |
| 10 | Escape Route Blocked = Yes|Flooding = Fast, TTC = 15 to 20 min | −0.0035 |
| 11 | Escape Route Blocked = Yes|Flooding = Slow, TTC = 20 to 25 min | −0.0146 |
| 12 | Trapped/Lost = Yes|Dynamic Exit Signs = No, Excessive Heel/Trim = Yes, Extreme Acceleration = No, Escape Route Blocked = No | −0.0054 |
| 13 | Weather/Wave = Hs 2|Sea Area = Worldwide | 0.0040 |
| 14 | Acoustic Alarm not Followed = Yes|Age = less than 50 | −0.0320 |
| 15 | Escape Route Blocked = Yes|Flooding = Fast, TTC = 20 to 25 min | −0.0032 |
| 16 | TTC = 10 to 15 min|Weather/Wave = Hs 3 | −0.0091 |
| 17 | TTC = 10 to 15 min|Weather/Wave = Hs 4 | −0.0066 |
| 18 | Escape Route Blocked = Yes|Flooding = Slow, TTC = 25 to 30 min | −0.0126 |
| 19 | TTC = 10 to 15 min|Weather/Wave = Hs 2 | −0.0092 |
| 20 | Acoustic Alarm not Followed = Yes|Age = between 50 and 70 | −0.0158 |
Table 5.
Risk model results for the baseline scenario in terms of PLL per ship/year for all accidents of interest, including the frequency of casualties and results from previous studies.
Table 5.
Risk model results for the baseline scenario in terms of PLL per ship/year for all accidents of interest, including the frequency of casualties and results from previous studies.
| Accident Type 1 | Casualties Ship/Year | EMSA III [10]
(Cruise Ships) | FSA for
Cruise Ships [22] | Risk Model (Cruise Ships) |
|---|
| CN | 6.36 × 10⁻³ | 6.57 × 10⁻² | 2.27 × 10⁻¹ | 1.14 × 10⁻¹ |
| GR | 7.48 × 10⁻³ | | 2.20 × 10⁻¹ | 1.49 × 10⁻¹ |
| CT | 8.23 × 10⁻³ | | 1.30 × 10⁻² | 9.93 × 10⁻² |
| GR + CT | | 3.34 × 10⁻¹ | 2.33 × 10⁻¹ | 2.48 × 10⁻¹ |
| FX | 7.86 × 10⁻³ | 2.10 × 10⁻² | 1.70 × 10⁻² | 2.54 × 10⁻² |
| T | | 4.21 × 10⁻¹ | 5.20 × 10⁻¹ | 3.89 × 10⁻¹ |
Table 6.
Results for ΔR (lives saved per ship/lifetime) for the RCO considered, per accident type and in total.
Table 6.
Results for ΔR (lives saved per ship/lifetime) for the RCO considered, per accident type and in total.
| RCO | Collision | Grounding | Contact | Fire | Total |
|---|
| Dynamic Exit Signs | 3.38 × 10⁻¹ | 5.05 × 10⁻¹ | 3.33 × 10⁻¹ | 7.83 × 10⁻² | 1.30 |
| Disclaimer/Publisher’s Note: The statements, opinions and data contained in all publications are solely those of the individual author(s) and contributor(s) and not of MDPI and/or the editor(s). MDPI and/or the editor(s) disclaim responsibility for any injury to people or property resulting from any ideas, methods, instructions or products referred to in the content. |
© 2023 by the authors. Licensee MDPI, Basel, Switzerland. This article is an open access article distributed under the terms and conditions of the Creative Commons Attribution (CC BY) license (https://creativecommons.org/licenses/by/4.0/).


 ,
, 


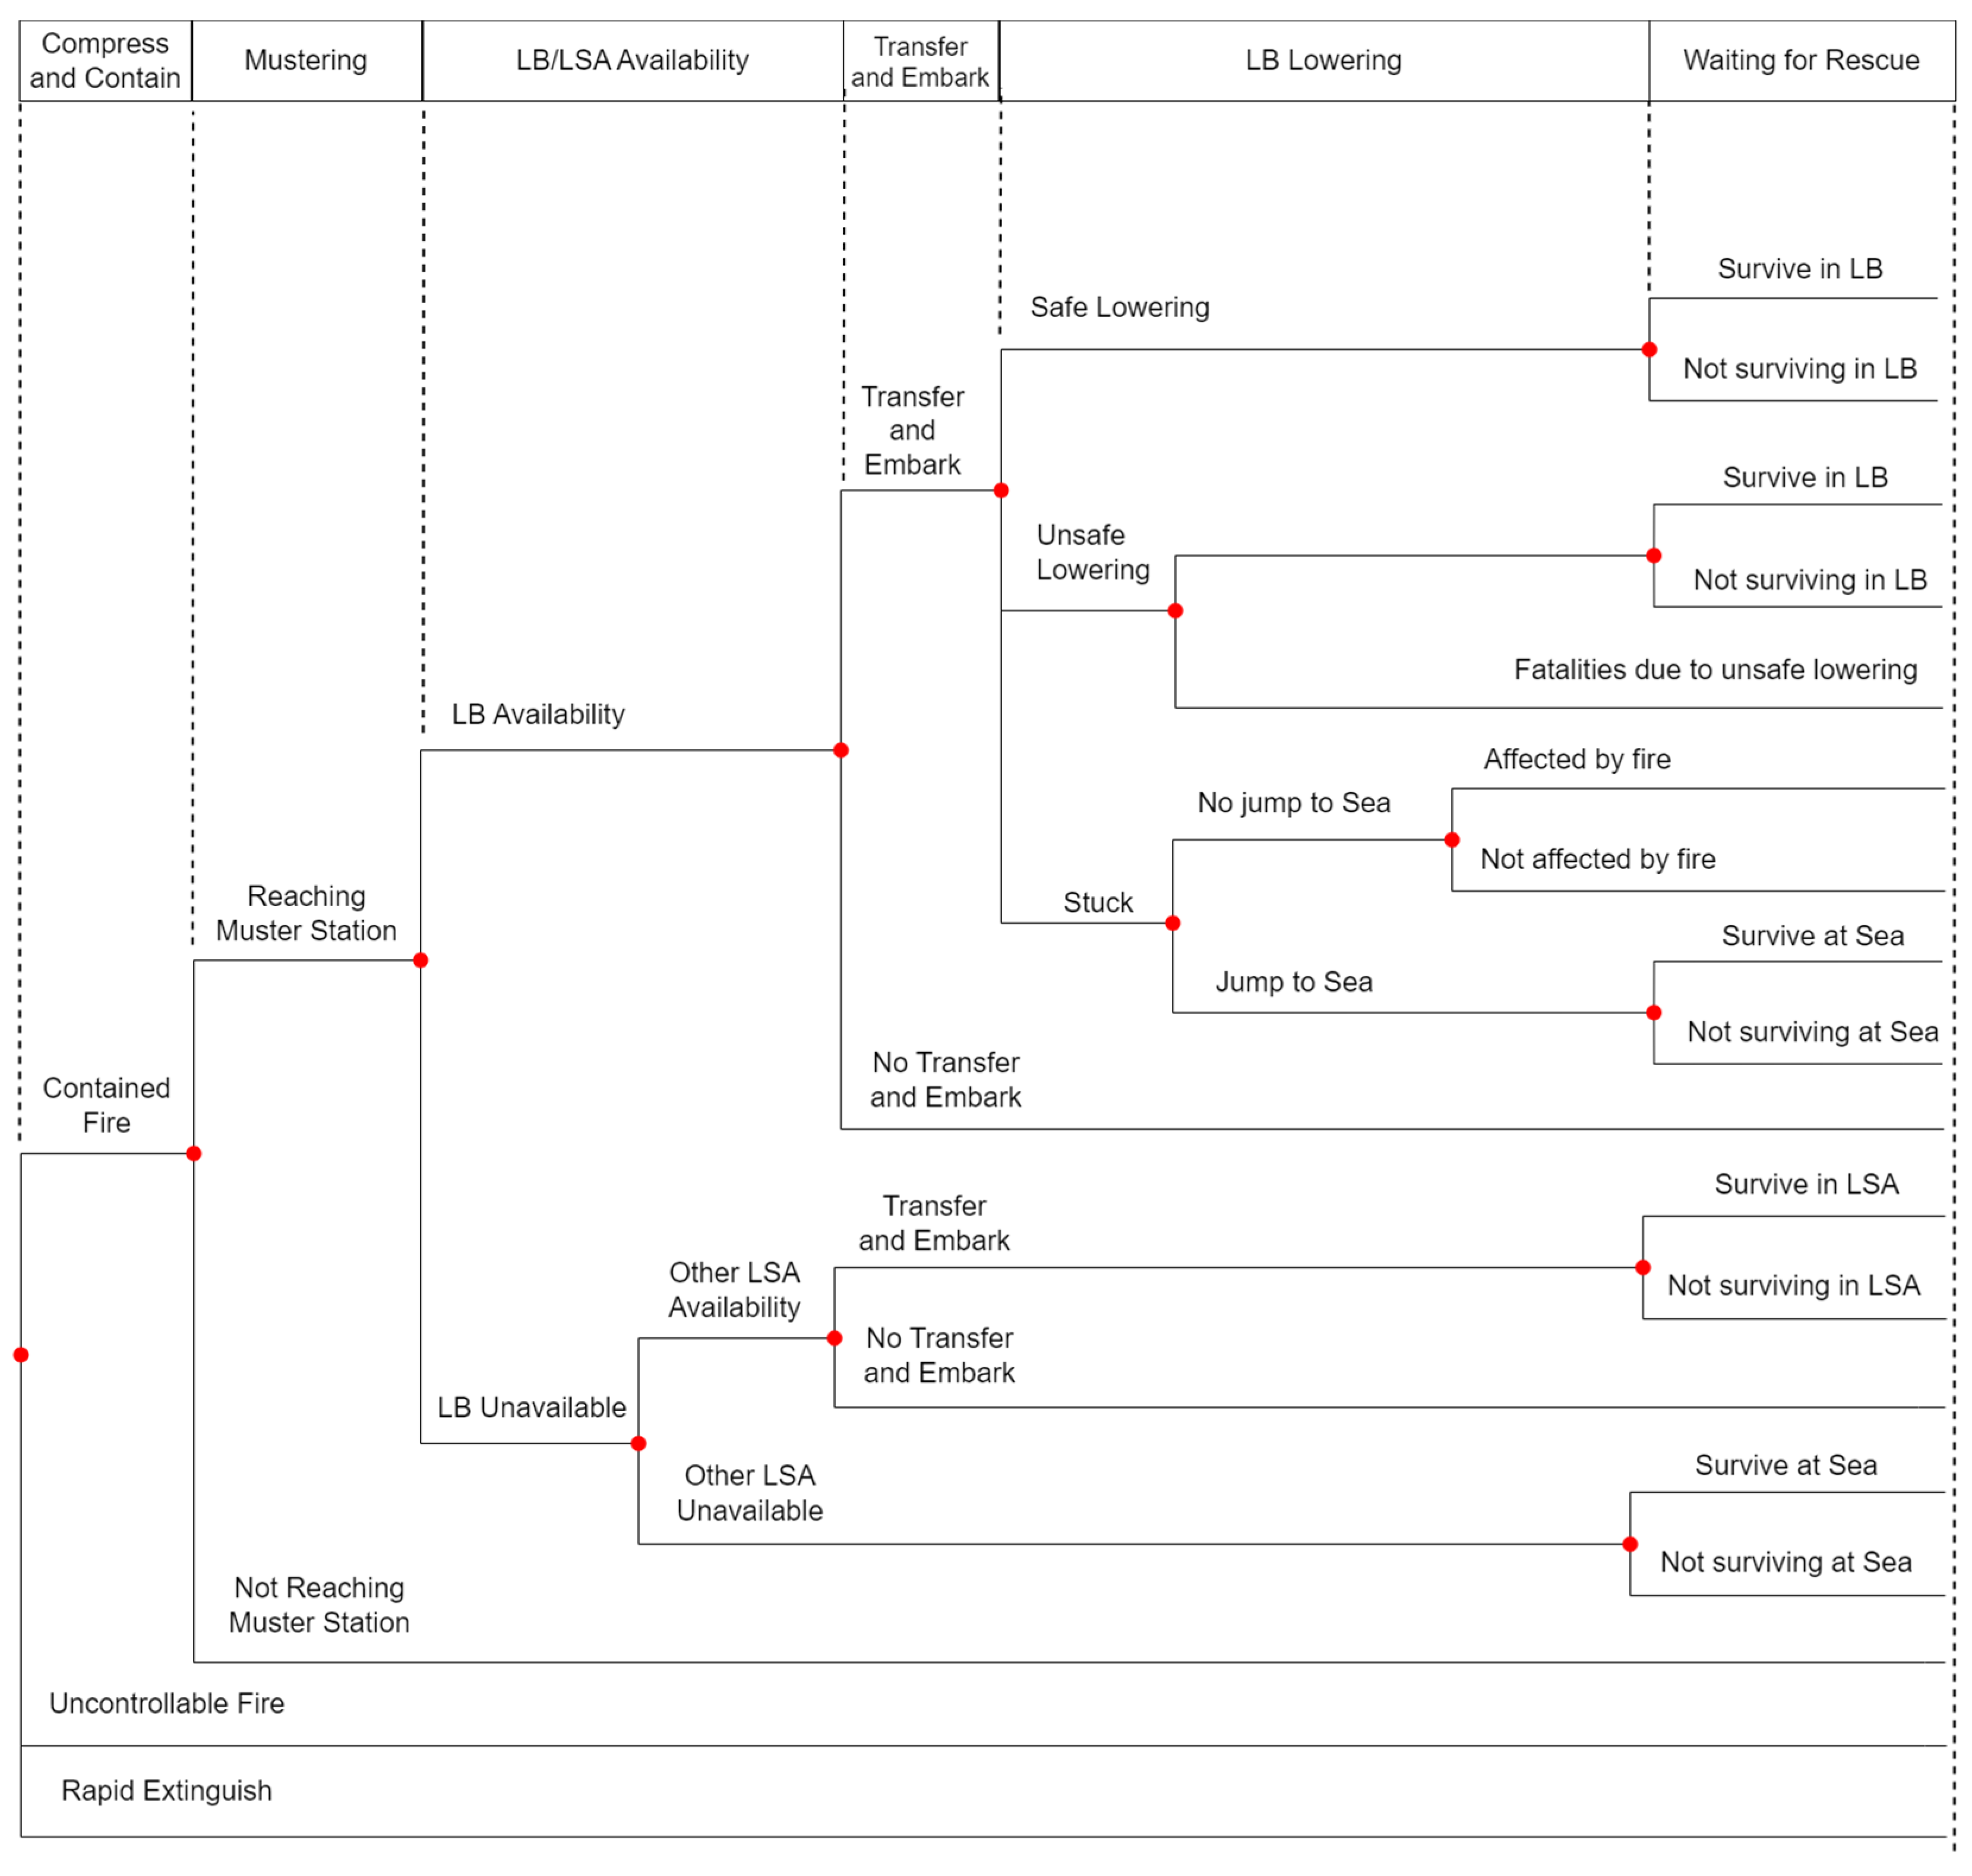
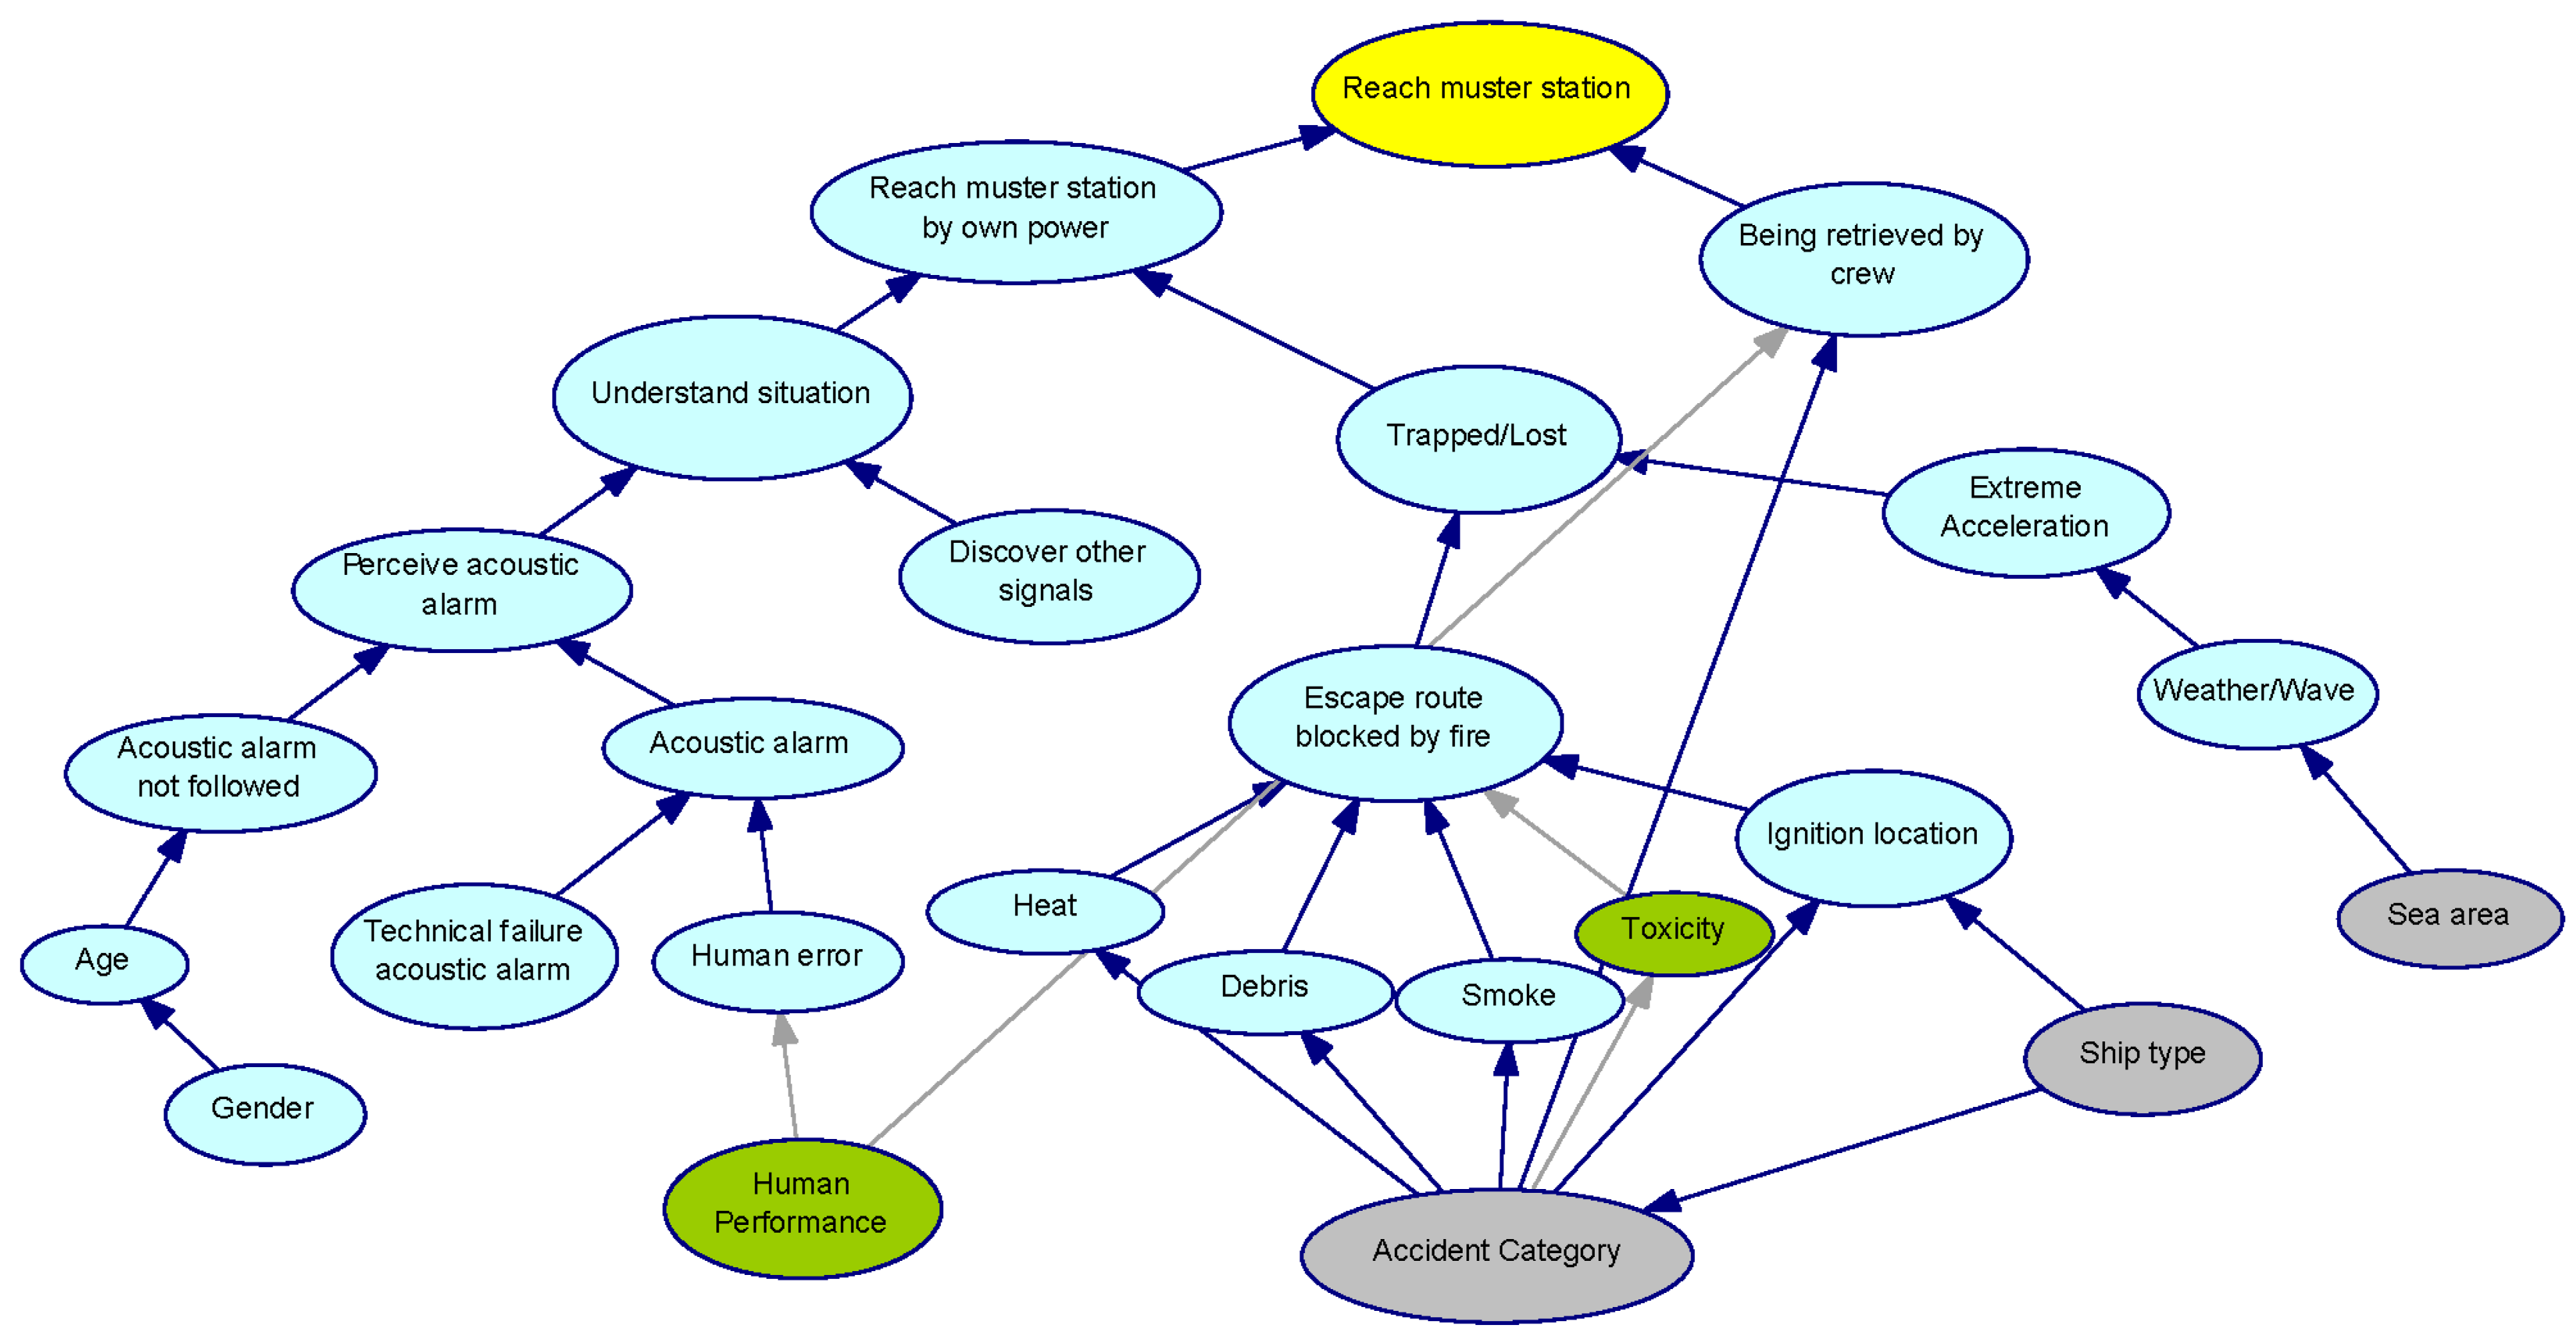
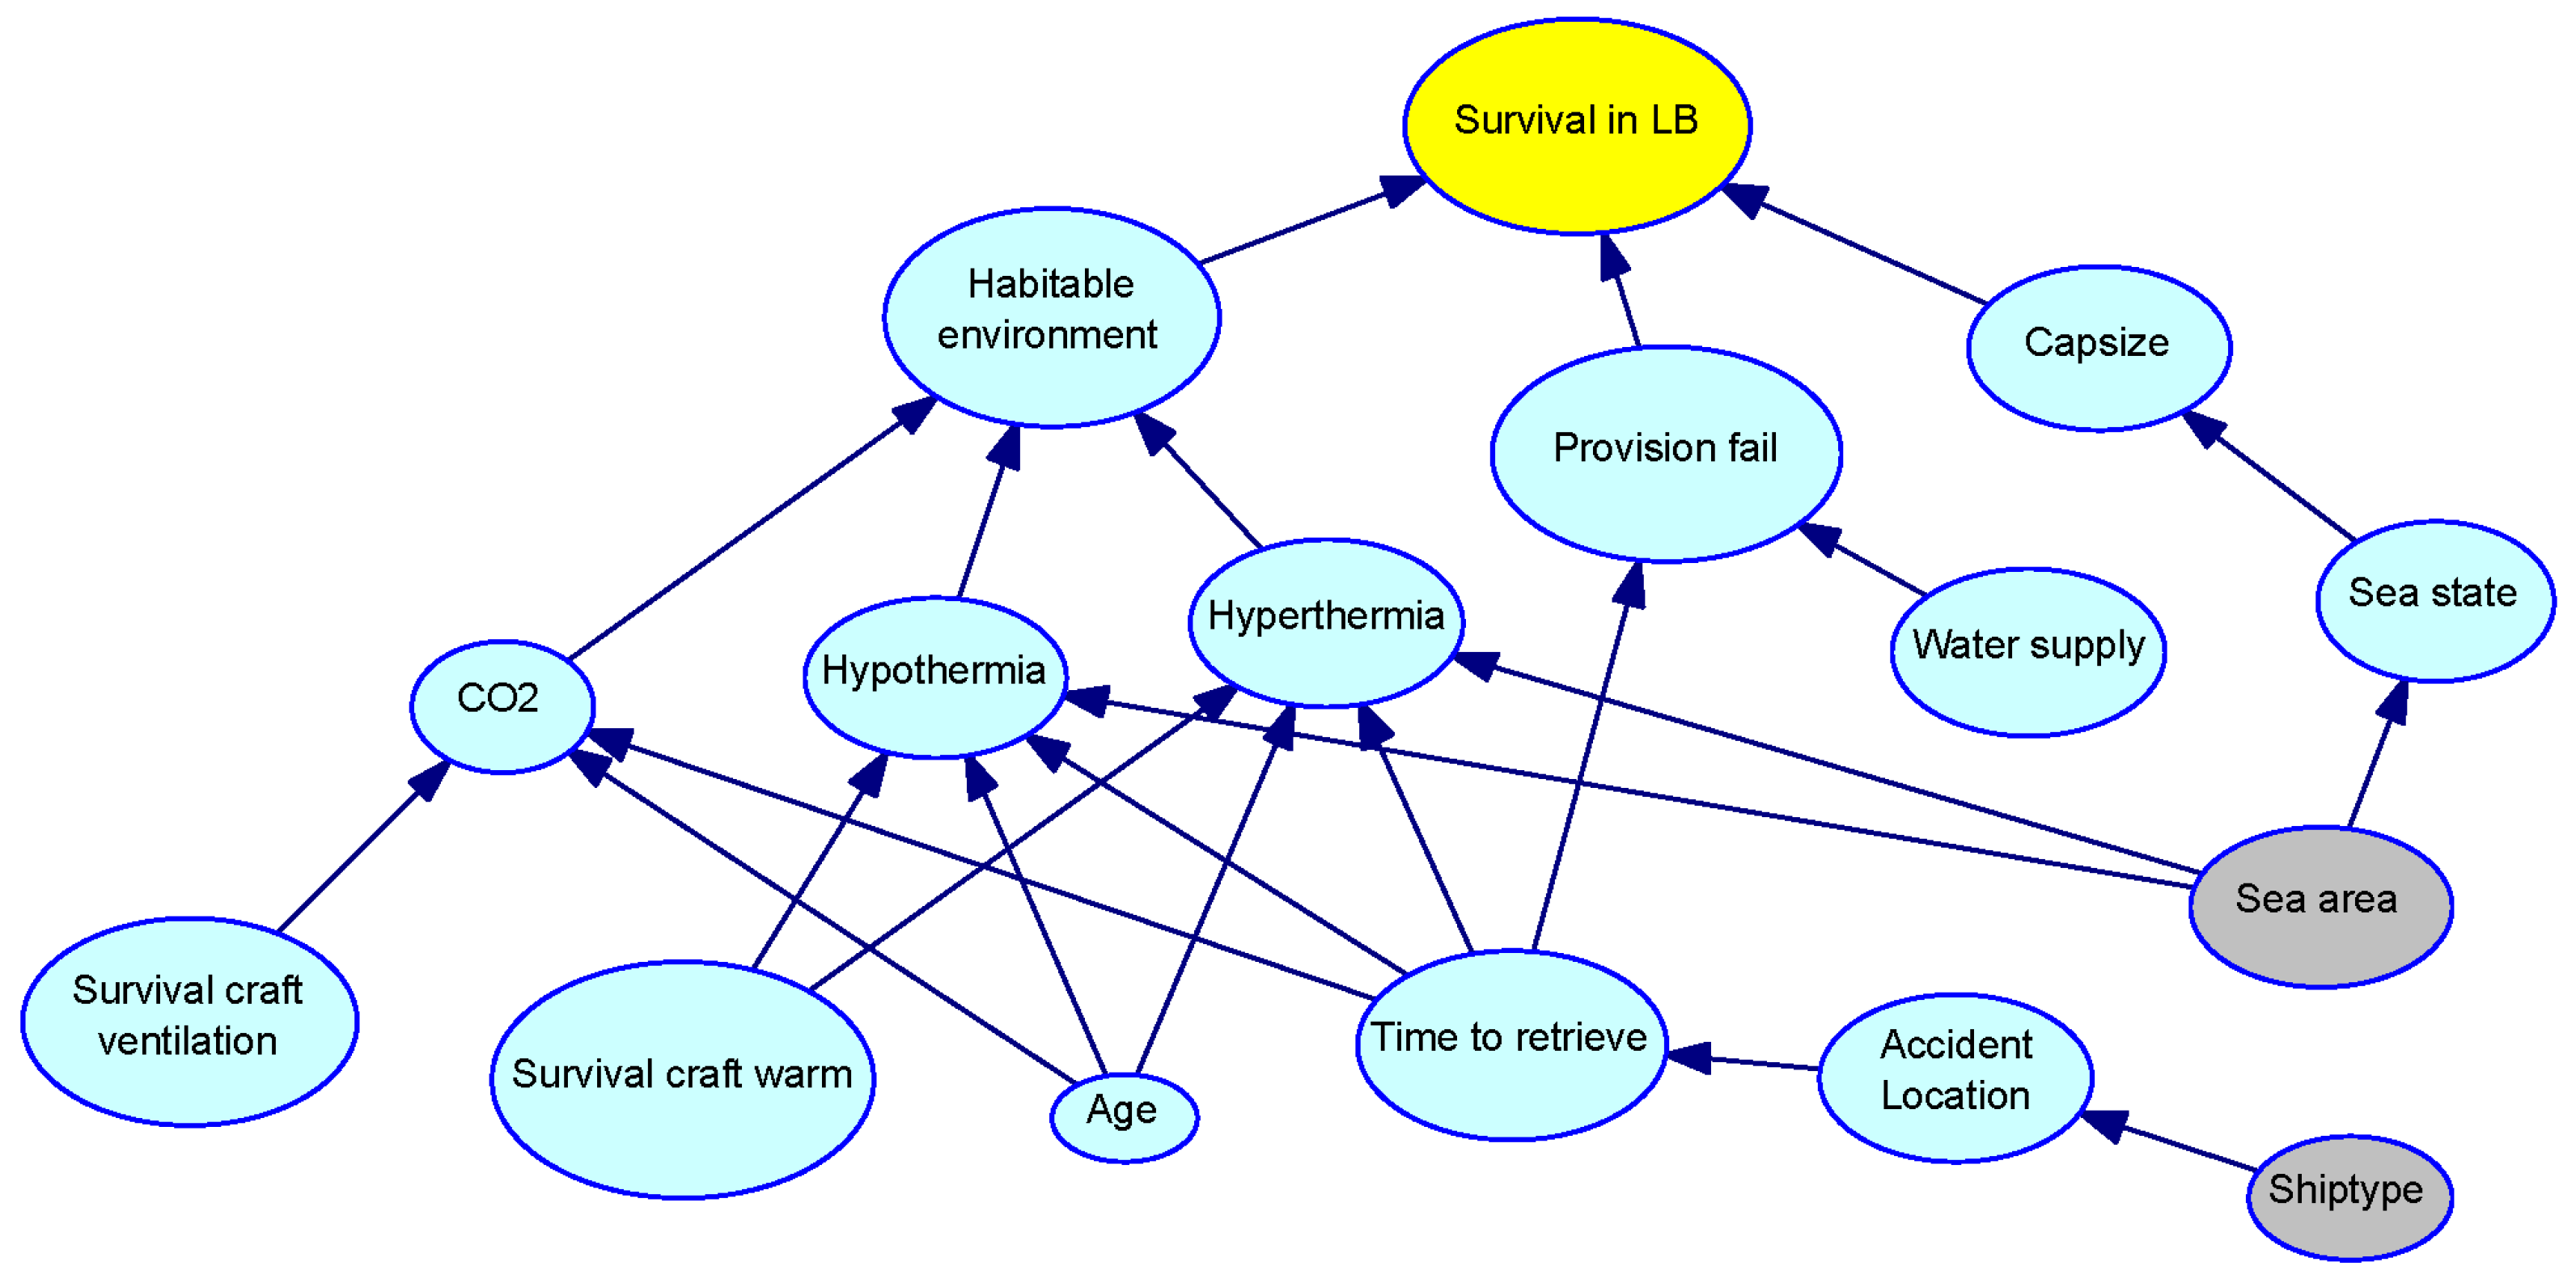
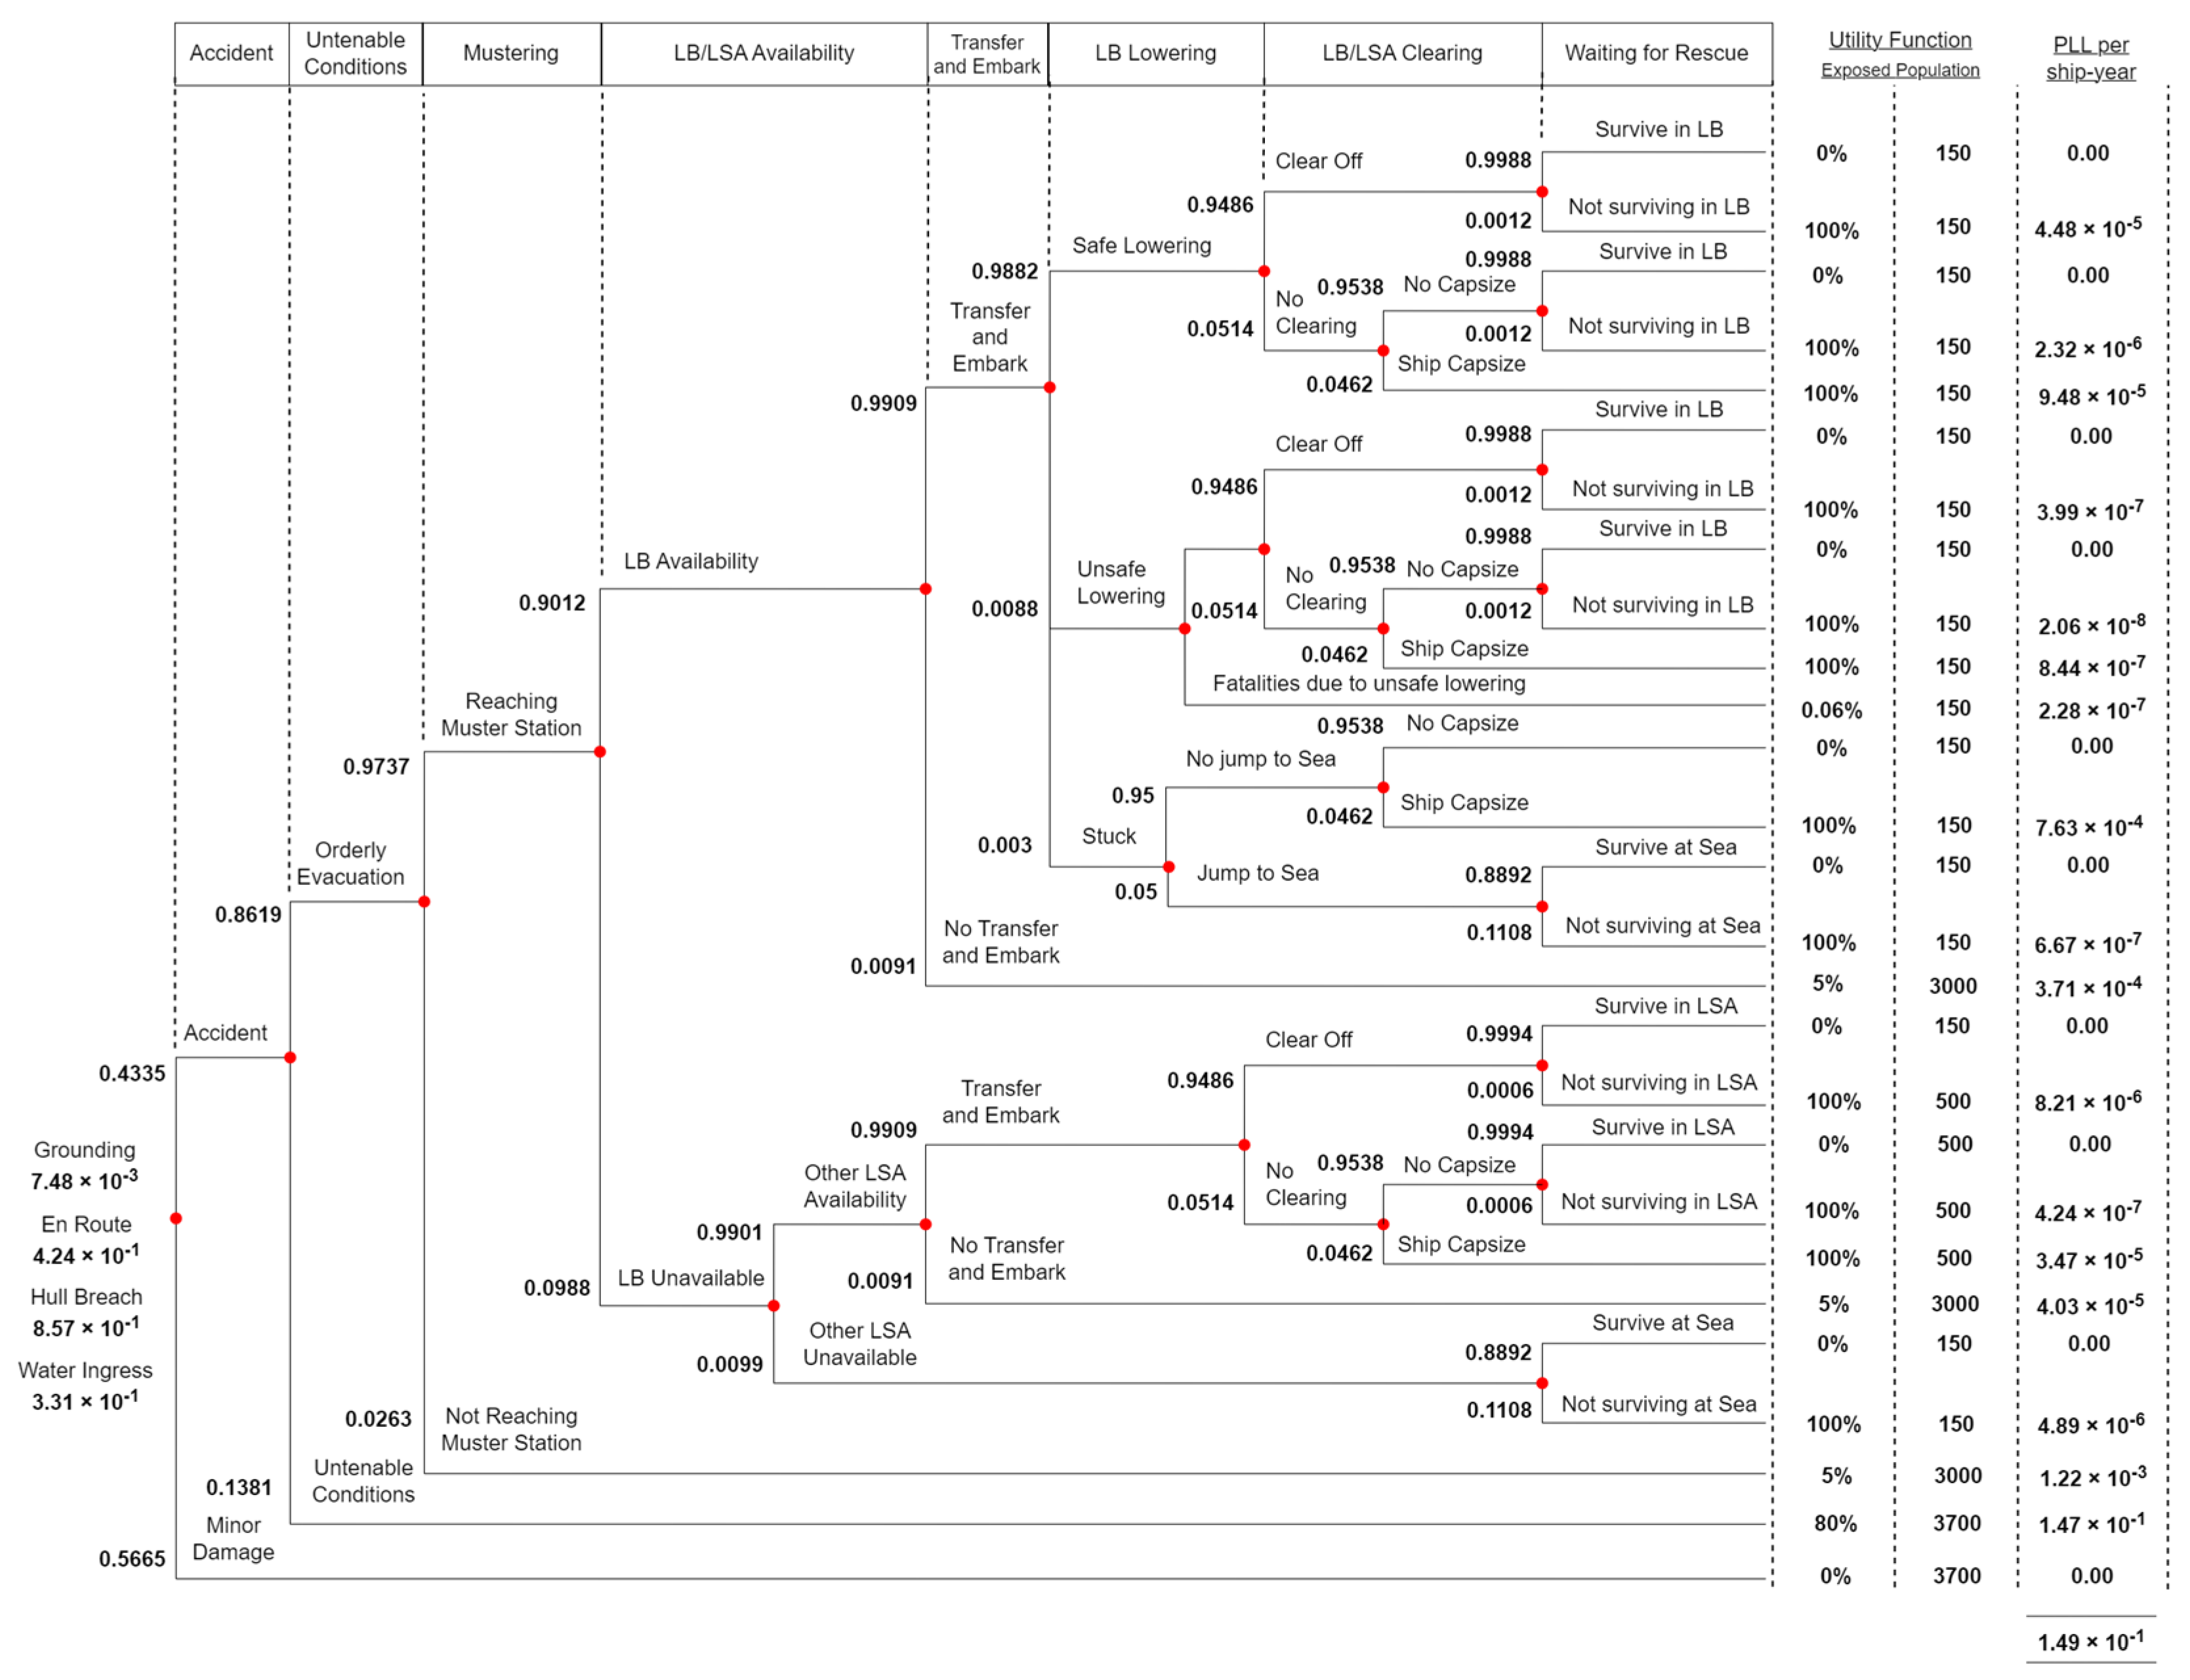