Article

Molecular Characterization, Evolution and Expression Analysis of TNFSF14 and Three TNFSF Receptors in Spotted Gar Lepisosteus oculatus

1
Key Laboratory of Exploration and Utilization of Aquatic Genetic Resources, Ministry of Education, Shanghai Ocean University, Shanghai 201306, China
2
International Research Center for Marine Biosciences, Ministry of Science and Technology, Shanghai Ocean University, Shanghai 201306, China
3
National Demonstration Center for Experimental Fisheries Science Education, Shanghai Ocean University, Shanghai 201306, China
4
Laboratory for Marine Biology and Biotechnology, Qingdao National Laboratory for Marine Science and Technology, Qingdao 266200, China
*
Authors to whom correspondence should be addressed.
J. Mar. Sci. Eng. 2022, 10(8), 1035; https://doi.org/10.3390/jmse10081035
Submission received: 30 June 2022 / Revised: 23 July 2022 / Accepted: 23 July 2022 / Published: 27 July 2022
(This article belongs to the Special Issue Nutrition and Immunity for Sustainable Marine Aquaculture Development)

Abstract

:
The tumor necrosis superfamily (TNFSF) and their receptors (TNFRs) play an essential role in inflammatory responses. In this study, tnfsf14, tnfrsf1a, tnfrsf1b and tnfrsf14 were identified in spotted gar. All the genes have conserved genomic organization and synteny with their respective homologs in zebrafish and humans. The putative TNFSF protein contains a typical TNF homology domain in the extracellular region. All three TNFRSFs possess characteristic cysteine-rich domains. TNFRSF1a has a death domain in the cytosolic region which is absent in the TNFRSF1b and TNFRSF14. Notably, TNFRSF14 lacks a transmembrane domain and is predicted to be secreted. Protein structure modeling revealed that the key residues involved in the interaction between TNFSF14 and TNFRSF14 are well conserved in spotted gar. All four genes were ubiquitously expressed in the spleen, liver, kidney, gills and intestine. Infection with Klebsiella pneumoniae resulted in remarkable downregulation of tnfsf14 and tnfrsf14 in tissues but upregulation of tnfrsf1a and tnfrsf1b. The results indicate that tnfsf14, tnfrsf1a, tnfrsf1b and tnfrsf14 are involved in the immune response to bacterial infection, and expand knowledge on the TNF system in the primitive ray-finned fish.

1. Introduction

The spotted gar (Lepisosteus oculatus) is a primitive ray-finned fish (Actinopterygii) and its genome has not undergone the teleost specific whole genome duplication (WGD) that had occurred in the ancestor of teleost fish [1,2]. It is generally believed that the WGD gave rise to the expansion of gene paralogs, resulting in neofunctionalization, subfunctionalization or nonfunctionalization [3]. The spotted gar genome provides valuable resources to investigate the evolution and diversification of the vertebrate immune system. A number of immune factors including Toll-like receptors, novel immune-type receptors, C-type lectin receptors, RIG-I-like receptors, tumor necrosis factor-alpha-induced protein 8 (TNFAIP8) and diverse immunoglobulin-domain-containing proteins are known to be well conserved in spotted gar and have not been expanded as seen in teleosts [3,4]. Some of the immune genes such as the tnfaip8 gene have been lost in teleosts during the teleost specific WGD [4].
The tumor necrosis factor superfamily (TNFSF) consists of a large number of structurally related proteins. They bind to the TNF receptors (TNFRs) to elicit cellular responses and play vital roles in the regulation of a variety of physiological processes including apoptosis, tissue development and inflammatory responses [5,6]. To date, 19 TNFSF and 29 TNFR superfamily (TNFRSF) members have been found in humans [7]. TNFSF ligands are type II membrane proteins and possess a conserved TNF homology domain (THD). The THD is composed of 10 β-strands and forms homotrimers to interact with receptors [7,8]. It is believed that TNFSFs and their receptors have evolved prior to the emergence of the adaptive immune system [7]. They exist in invertebrates including insects, mollusks, crustaceans and lampreys [9,10,11]. To date, most of the TNFSFs and receptors have been identified in teleosts except for TNFSF4/OX40, TNFSF7/CD27 and TNFSF8/CD30 and their cognate receptors which appear to be absent [12]. Curiously, as an important member of TNFSF, TNFSF14 has not been well studied in lower vertebrates. TNFSF14 binds to LTbR/TNFRSF3, TNFRSF14 and DCR3/TNFRSF6b, and is essential for the regulation of inflammation and inhibition of tumor formation [13,14]. Recently, it was shown that TNFSF14 was highly expressed in the spleen of mefugu (Takifugu obscures) and zebrafish (Danio rerio) and that it was able to activate LTbR/TNFRSF3 to mediate the NF-kB pathway in mefugu [14,15,16].
The TNFRSF members are type I membrane proteins and possess several conserved cysteine-rich domains (CRDs) in the extracellular region [10,17]. The CRD contains six cysteine residues, which is the hallmark of TNFRSF members, and interacts with the THD of TNFSF ligands [6]. TNFRSFs contain one to six CRDs [7]. In humans, TNFRSF1a, TNFRSF4 and TNFRSF7 comprise three CRDs while TNFRSF1b, TNFRSF5 and TNFRSF16 have four [9]. Based on the features of intracellular domains, TNFRSFs can be categorized into three groups containing a cytosolic death domain (DD), a cytosolic region lacking the DD or no cytosolic region [12]. In humans, TNFRSF1a is a DD-containing TNFRSF receptor and is expressed in most cells [18]. In contrast, the TNFRSF1b lacks a DD and its expression is limited to endothelial cells, neurological cells and immune cells [5]. In teleosts, the tnfrsf1a and tnfrsf1b genes have been identified in several species, including rainbow trout (Oncorhynchus mykiss), zebrafish (Danio rerio), grass carp (Ctenopharyngodon idella), goldfish (Carassius auratus) and Japanese flounder (Paralichthys olivaceus) [5,10,19,20,21]. Fish tnfrsf1a is highly expressed in immune tissues including spleen, kidney and gills and can be induced in response to lipopolysaccharide (LPS) and bacterial infection [10]. Tnfrsf1b can be modulated by interferon-γ (IFN-γ), LPS and Aeromonas schubertii in snakehead (Channa argus) [22]. TNFRSF1a promotes apoptosis and tissue regeneration in zebrafish, upregulates the expression of il-1b in grass carp head kidney leukocytes (HKLs) and reduces the respiratory burst response of goldfish macrophages [12,23,24]. Moreover, it regulates NF-κB signaling pathway in the hematopoietic stem cells [23]. In grass carp, TNFRSF1b abrogates TNFSF1a activated inflammatory signaling [5]. In addition, TNFRSF1b is critical to H2O2 production and inhibition of inflammation in the skin of zebrafish [12]. Some tnfrsf genes have been expanded in teleosts due to the teleost specific WGD [12]. For instance, in zebrafish, eight copies of tnfrsf14 have been found [12].
In this study, we identified tnfsf14, tnfrsf1a, tnfrsf1b and tnfrsf14 in the spotted gar. To understand the evolution of these genes, synteny, genomic structures, phylogeny and expression were analyzed. Protein structure modeling was performed to identify the key amino acid residues involved in the interaction between TNFSF14 and TNFRSF14.

2. Materials and Methods

2.1. Experimental Fish

Healthy spotted gars (37 ± 4 g) were purchased from a commercial company (Guangdong, China). Fish were kept in freshwater tanks at 28 ± 1 °C [25]. All experiments complied with the regulations regarding the use of laboratory animals for research at Shanghai Ocean University (SHOU-DW-2019-003) [26].

2.2. Gene Cloning

Partial sequences of tnfsf14, tnfrsf1a, tnfrsf1b and tnfrsf14 were obtained from the NCBI database (https://www.ncbi.nlm.nih.gov/) (accessed on: 10 May 2020). Total RNA was extracted from the kidney of healthy spotted gars using the Trizol reagent (Invitrogen, Waltham, MA, USA). The first strand cDNA was synthesized using the method previously described [27]. The full-length cDNA sequences were amplified by 5′ and 3′ rapid amplification of cDNA ends (RACE) (TaKaRa, Beijing, China). The full coding region sequence (CDS) was amplified using a single pair of primers in the 5′ and 3′ untranslated regions. Gene primers were designed by Primer 5.0 and synthesized by GENEWIZ (Suzhou, China). All the PCR primers are given in Table 1.

2.3. Sequence Analysis

The CDS and protein sequences were predicted by the NCBI ORF Finger program (http://www.ncbi.nlm.nih.gov/projects/gorf/) (accessed on: 29 June 2022). The homologous protein sequences were searched by the BLAST program (http://www.ncbi.nlm.Nih.gov/BLAST/) (accessed on: 5 July 2021). The protein domains, signal peptide and transmembrane region were predicted using the SMART program (http://smart.embl-heidelberg.de/) (accessed on: 8 July 2021) and SignalP 5.0 server (https://services.healthtech.dtu.dk/service.php?SignalP-5.0) (accessed on: 8 November 2021). The molecular weight, isoelectric point (pI) and N-glycosylation sites were predicted using the online ExPASy server (https://www.expasy.org/) (accessed on: 10 November 2021) and NetNGlyc 1.0 Server (http://www.cbs.dtu.dk/services/NetNGlyc/) (accessed on: 10 November 2021). Multiple sequence alignment was performed by the Clustal Omega program (https://www.ebi.ac.uk/Tools/msa/clustalo/) (accessed on: 15 November 2021) and shaded with the Jalview program. The phylogenetic tree was constructed by the Neighbor-Joining method (1000 bootstrap replication) within the MEGA 5.1 program and modified by photoshop software. The 3D protein structural models were constructed by Multiple-Sequence alignment, which was performed with Clustal Omega and ESPript3.0 (http://espript.ibcp.fr/ESPript/ESPript/) (accessed on: 15 November 2021).

2.4. Tissue Expression Analysis

Five tissues (liver, spleen, kidney, intestine, gills) were collected from five healthy spotted gar and homogenized in 1 mL TRIzol reagent for RNA extraction. Total RNA was measured using NanoDrop 2000c (Thermo Fisher Scientific, Waltham, MA, USA) and reverse-synthesized cDNA by Hifair ® II 1st Strand cDNA Synthesis SuperMix (gDNA digester plus) (YEASEN, Shanghai, China) [27]. The reverse transcription reaction was set using the following conditions: 1 cycle of 25 °C/5 min; 1 cycle of 42 °C/30 min and 1 cycle of 80 °C/5 min. The reversed cDNA samples were stored at −20 °C for quantitative real-time PCR (qRT-PCR). The qRT-PCR was run using the Light Cycler® 480 II System (Roche, Switzerland) under the following conditions: 1 cycle of 95 °C/30 s; 40 cycles of 95 °C/10 s, 60 °C/20 s, 72 °C/20 s; 1 cycle of 95 °C/10 s, 65 °C/60 s, 97 °C/1 s [25]. The standard curves were established by serial 10- fold dilutions of the plasmids containing target genes (from 10−1 to 10−7 fmol) and used to evaluate the quantification. The expression of target genes was calculated relative to that of elongation factor-1 alpha (ef-1α).

2.5. Expression Analysis during Infection of Klebsiella Pneumoniae

Klebsiella pneumoniae (K. pneumoniae, KPY01 strain) was isolated from diseased spotted gar [25]. The bacteria were cultured in LB medium at 28 °C for 24 h (200 rpm), centrifuged at 4000× g for 10 min and resuspended in phosphate-buffered saline (PBS). For the challenge experiment, five fish were randomly selected as a control without any treatment and the other two groups (15 fish each group) were intraperitoneally (i.p.) injected with 100 µL bacteria suspension (1 × 10⁷ CFU/mL or 1 × 10⁹ CFU/mL). At 2 d, 4 d and 8 d after injection, five tissues (liver, spleen, kidney, intestine, gills) were sampled and homogenized in 1 mL TRIzol reagent. RNA was extracted and reverse transcribed into cDNA as described above.

2.6. Statistical Analysis of Data

The qRT-PCR data were analyzed using one-way ANOVA and the LSD post hoc test, with the SPSS package 20.0 (SPSS Inc., Chicago, IL, USA) and GraphPad Prism 5.0 (GraphPad Software, Inc., California, USA). “* p < 0.05, ** p < 0.01” were considered significant.

3. Results

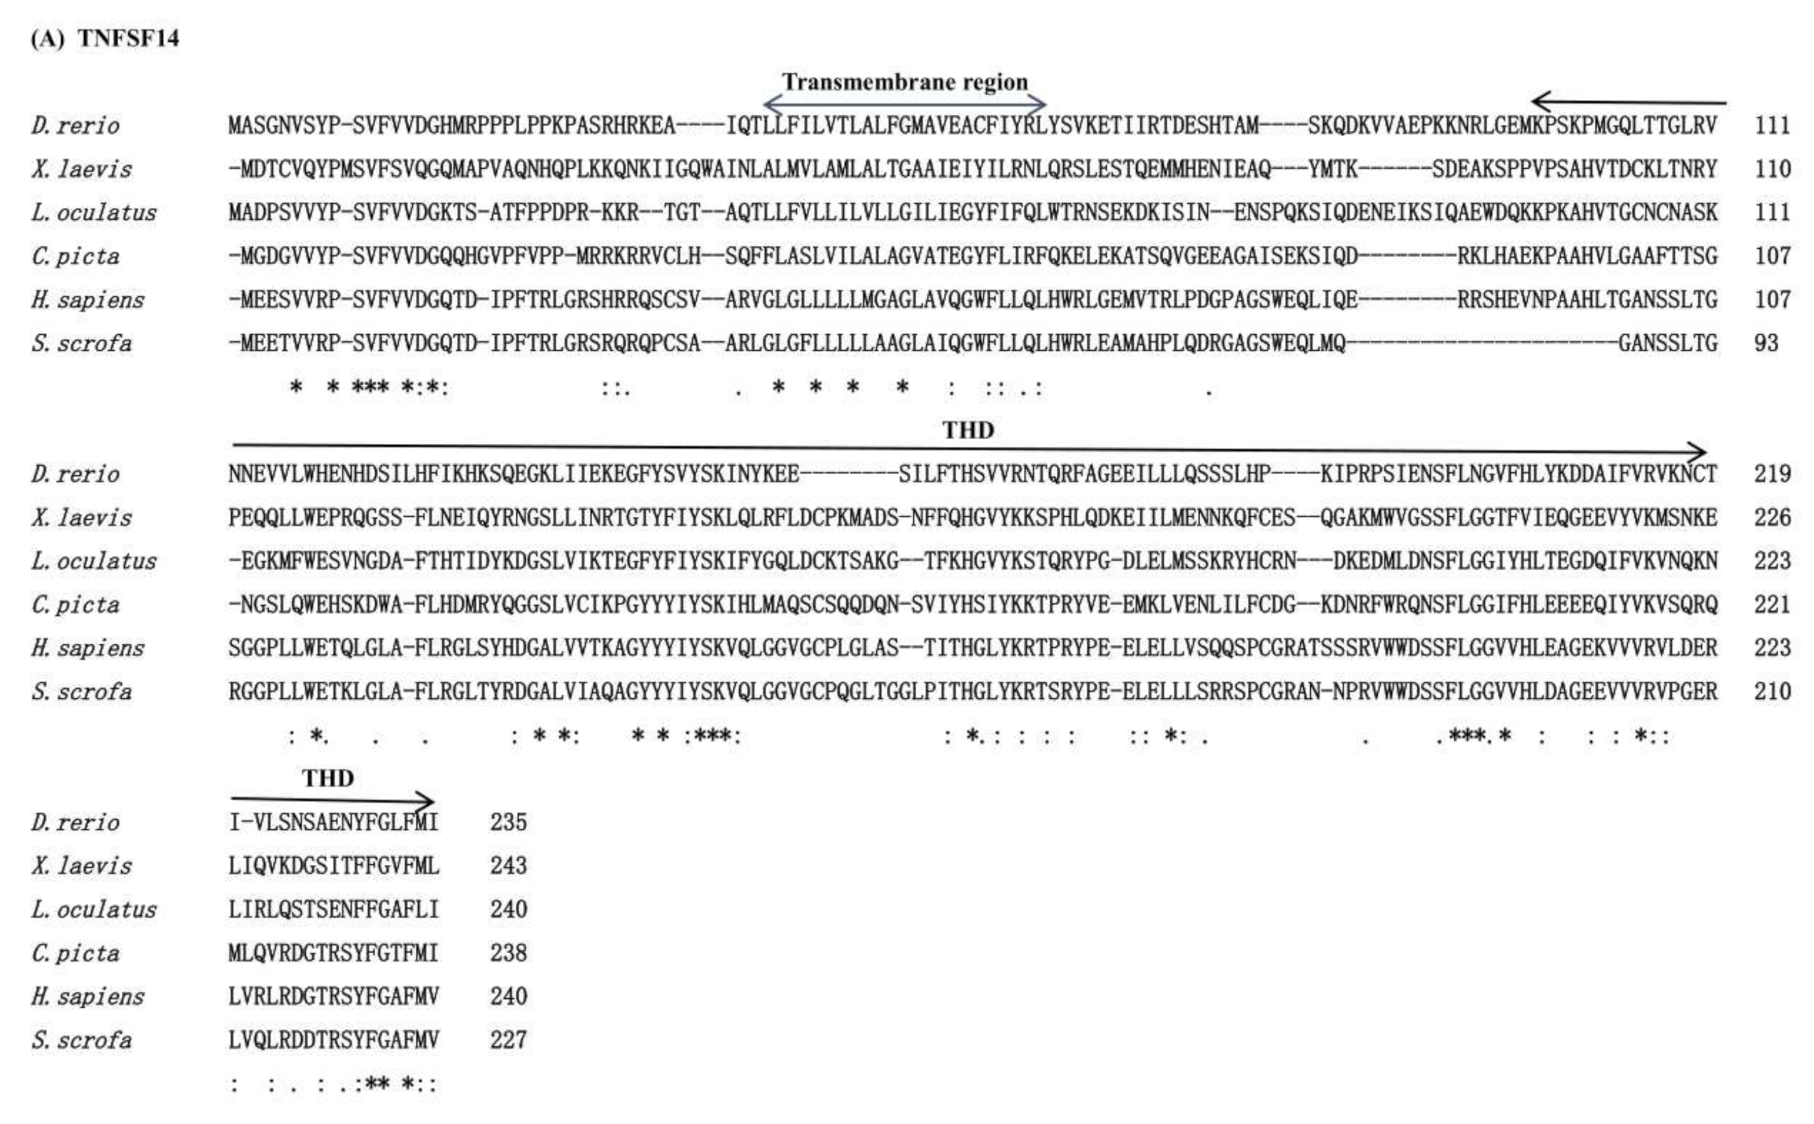
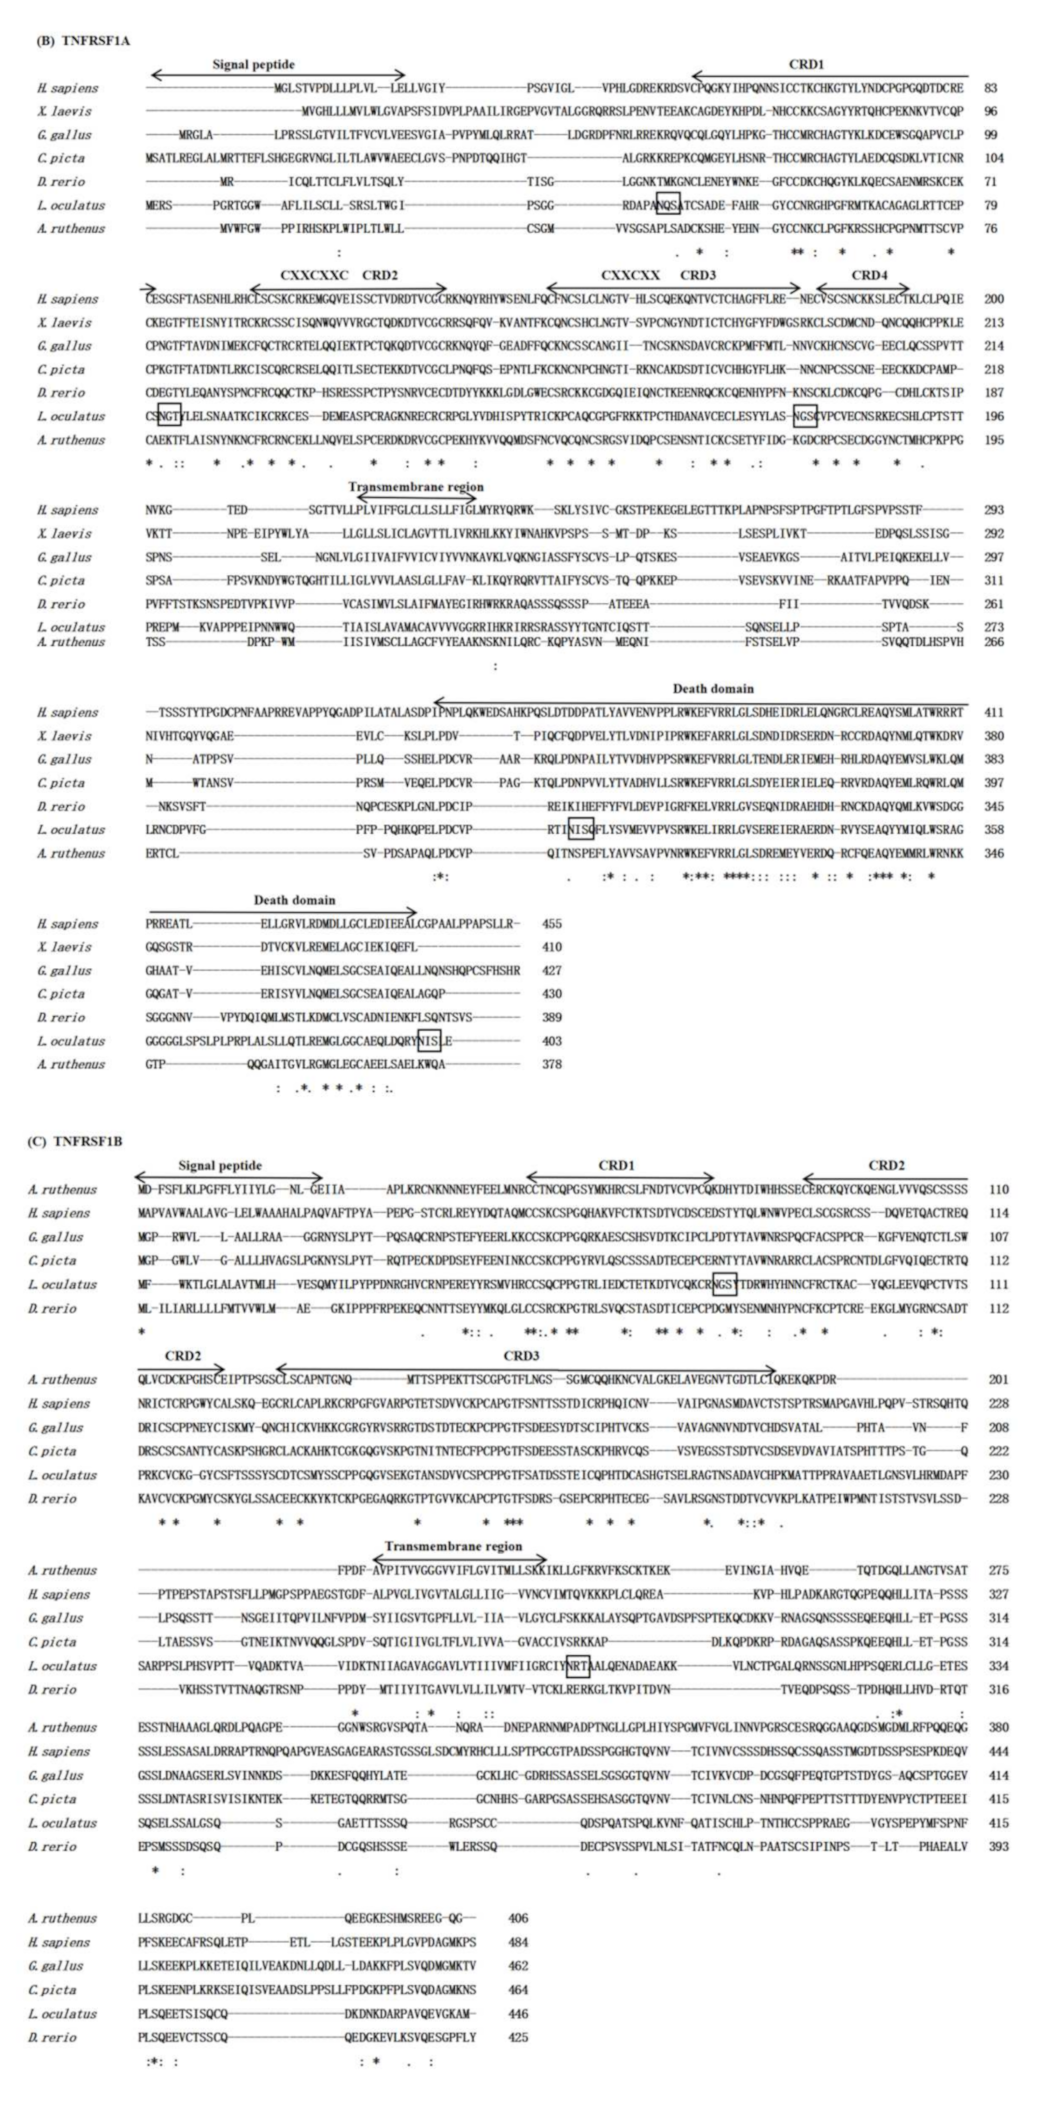
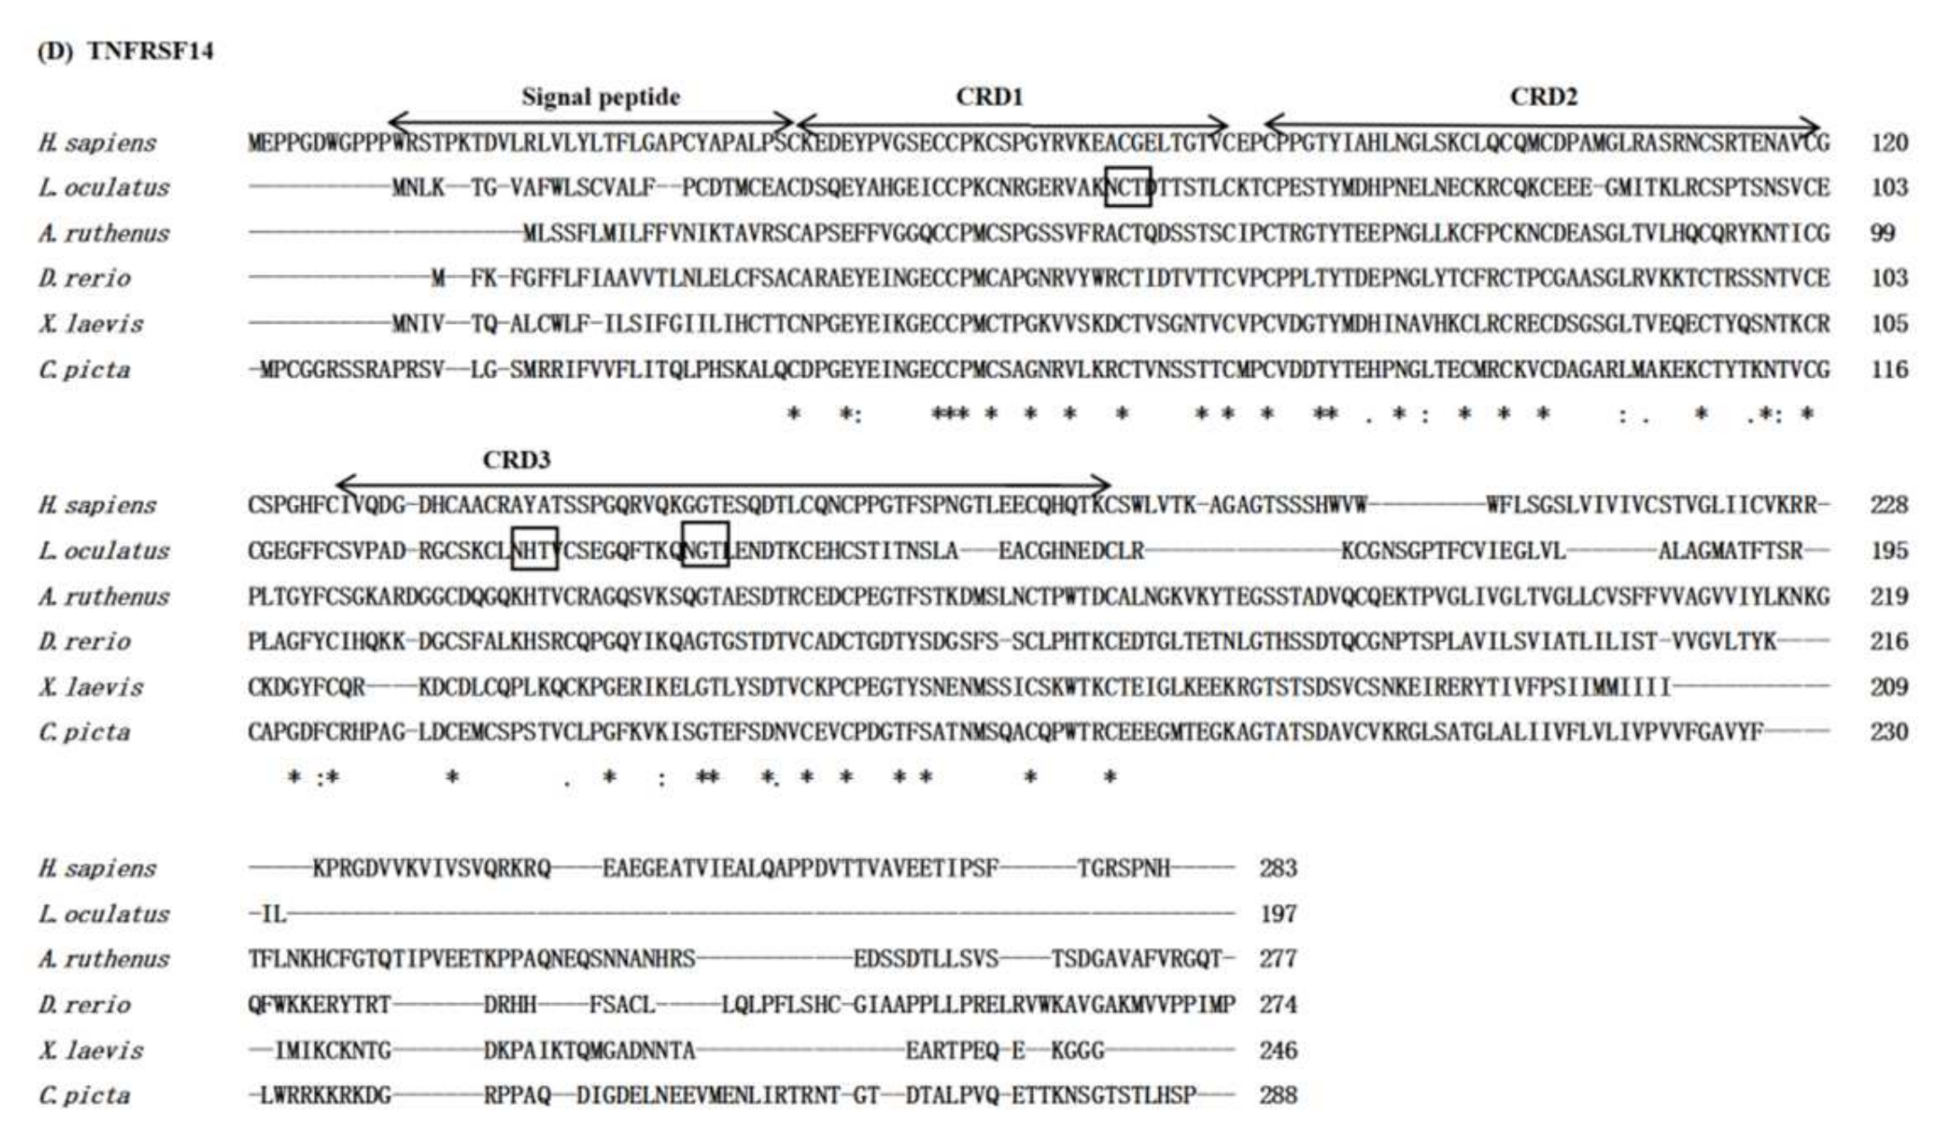
3.1. Sequence Analysis

The open reading frame (ORF) of tnfsf14 is 723 bp in length and encodes a protein of 240 aa (Figure 1A, Figure S1A). It contains a transmembrane domain of 23 aa and a conserved THD of 43 aa. No signal peptide was predicted. Spotted gar TNFSF14 shares 34.1% and 37.7% protein sequence similarity with zebrafish and human counterparts, respectively.
The ORF of tnfrsf1a is 1212 bp in length and encodes a protein of 403 aa (Figure 1B, Figure S1B). It contains a signal peptide of 27 aa, an ectodomain of 184 aa, a transmembrane region of 23 aa and a cytosolic region of 169 aa. The ectodomain contains four CRDs with the fourth CRD having four cysteine residues. Two CXXCXXC motifs are found in the CRD2 (C95 XXC98 XXC101) and CRD3 (C137 XXC140 XXC143). Notably, the cytosolic region contains a death domain (DD) of 106 aa, indicating it is a typical DD containing a TNFRSF member. In addition, five potential N-glycosylated sites (N38QS, N82GT, N172GS, N302IS and N399IS) were predicted.
The ORF of tnfrsf1b is 1341 bp in length and encodes a protein of 446 aa (Figure 1C, Figure S1C). Like TNFRSF1a, TNFRSF1b consists of a signal peptide (19 aa), an ectodomain (239 aa), a transmembrane region (23 aa) and a cytosolic region of 165 aa. However, TNFRSF1b lacks a DD in the intracellular region. Two putative N-glycosylated sites (N77GS and N286RT) were found.
The full length of tnfrsf14 cDNA is 1364 bp in length and contains an ORF of 594 bp (Figure 1D, Figure S1D). A canonical poly(A) adenylation site (AATAAA) is present at 1316 bp and is located at 17 bp upstream of poly(A) tail. It translates into a protein of 197 aa with a predicted signal peptide of 25 aa but lacks a transmembrane domain, suggesting that it is a secreted protein. Three CRDs and three putative N-glycosylated sites (N50CT, N123HT and N136GT) are predicted.

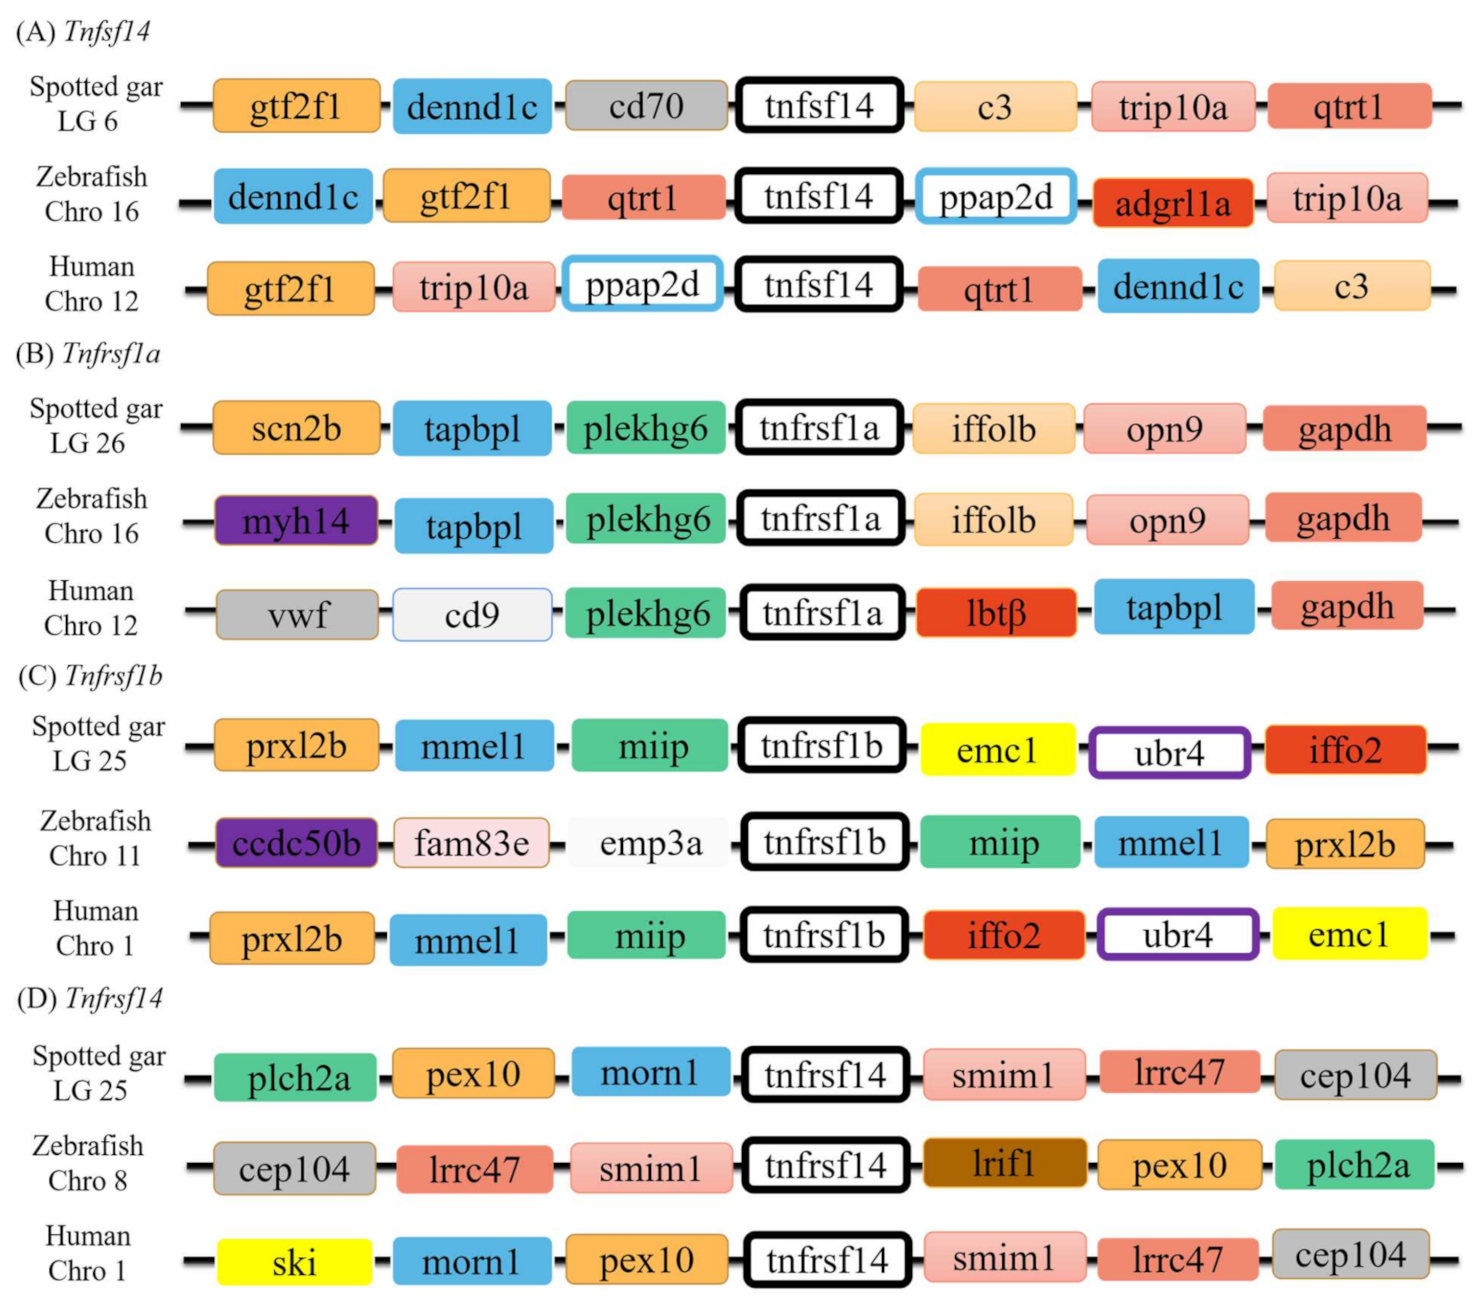
3.2. Genomic Structure and Synteny

The genomic organization of tnfsf14 and three tnfrsf genes were analyzed (Figure 2). The tnfsf14 gene of spotted gar has a 4 exons/3 introns organization, the same as that in zebrafish and humans. The fourth exon contains a 413 bp coding sequence and a 751 bp untranslated sequence. The genomic structure of the spotted gar tnfrsf1a gene could not be determined due to the incomplete sequence of the genome. It is predicted to contain 9 or 10 exons. It is worth noting that the size of the last exon is relatively big and is comparable to the corresponding exons in human and zebrafish counterparts. The tnfrsf1b gene organization of spotted gar is similar to that of human homolog, consisting of 10 exons and 9 introns. Tnfrsf14 has a 7 exons/6 introns organization in spotted gar and zebrafish.
Figure 3 shows that synteny of all the four genes are well conserved in humans, zebrafish and spotted gar. Spotted gar tnfsf14 is located in linkage group (LG) 6 and is linked with qtrt1, gtf2f1 and dennd1c genes. This chromosomal arrangement is also seen in other species (Figure 3A). Most genes located in the tnfrsf1a locus in spotted gar, such as plekhg6, tapbpl and gapdh, could be found in the corresponding locus in humans and zebrafish. Both tnfrsf1b and tnfrsf14 genes are present in LG25 (Figure 3C,D). In humans, these two genes are also linked in chromosome (Chro) 1. However, in zebrafish, the tnfrsf1b and tnfrsf14 are located in two chromosomes, Chro16 and Chro11. The segregation of tnfrsf1b and tnfrsf14 may have occurred during the teleost specific WGD.

3.3. Phylogenetic Analysis

To understand the evolutionary relationships of spotted gar TNFSF14 and TNFRSFs with their respective homologs in vertebrates, phylogenetic trees were constructed using the protein sequences. Spotted gar TNFSF14 groups with the TNFSF14s of zebrafish and humans with a bootstrap value of 61%. It has a close evolutionary relationship with the zebrafish homolog (Figure 4A). Similarly, the TNFRSF1a, TNFRSF1b and TNFRSF14 molecules of spotted gar, zebrafish, chicken and humans are well-clustered in their respective branches (Figure 4B).

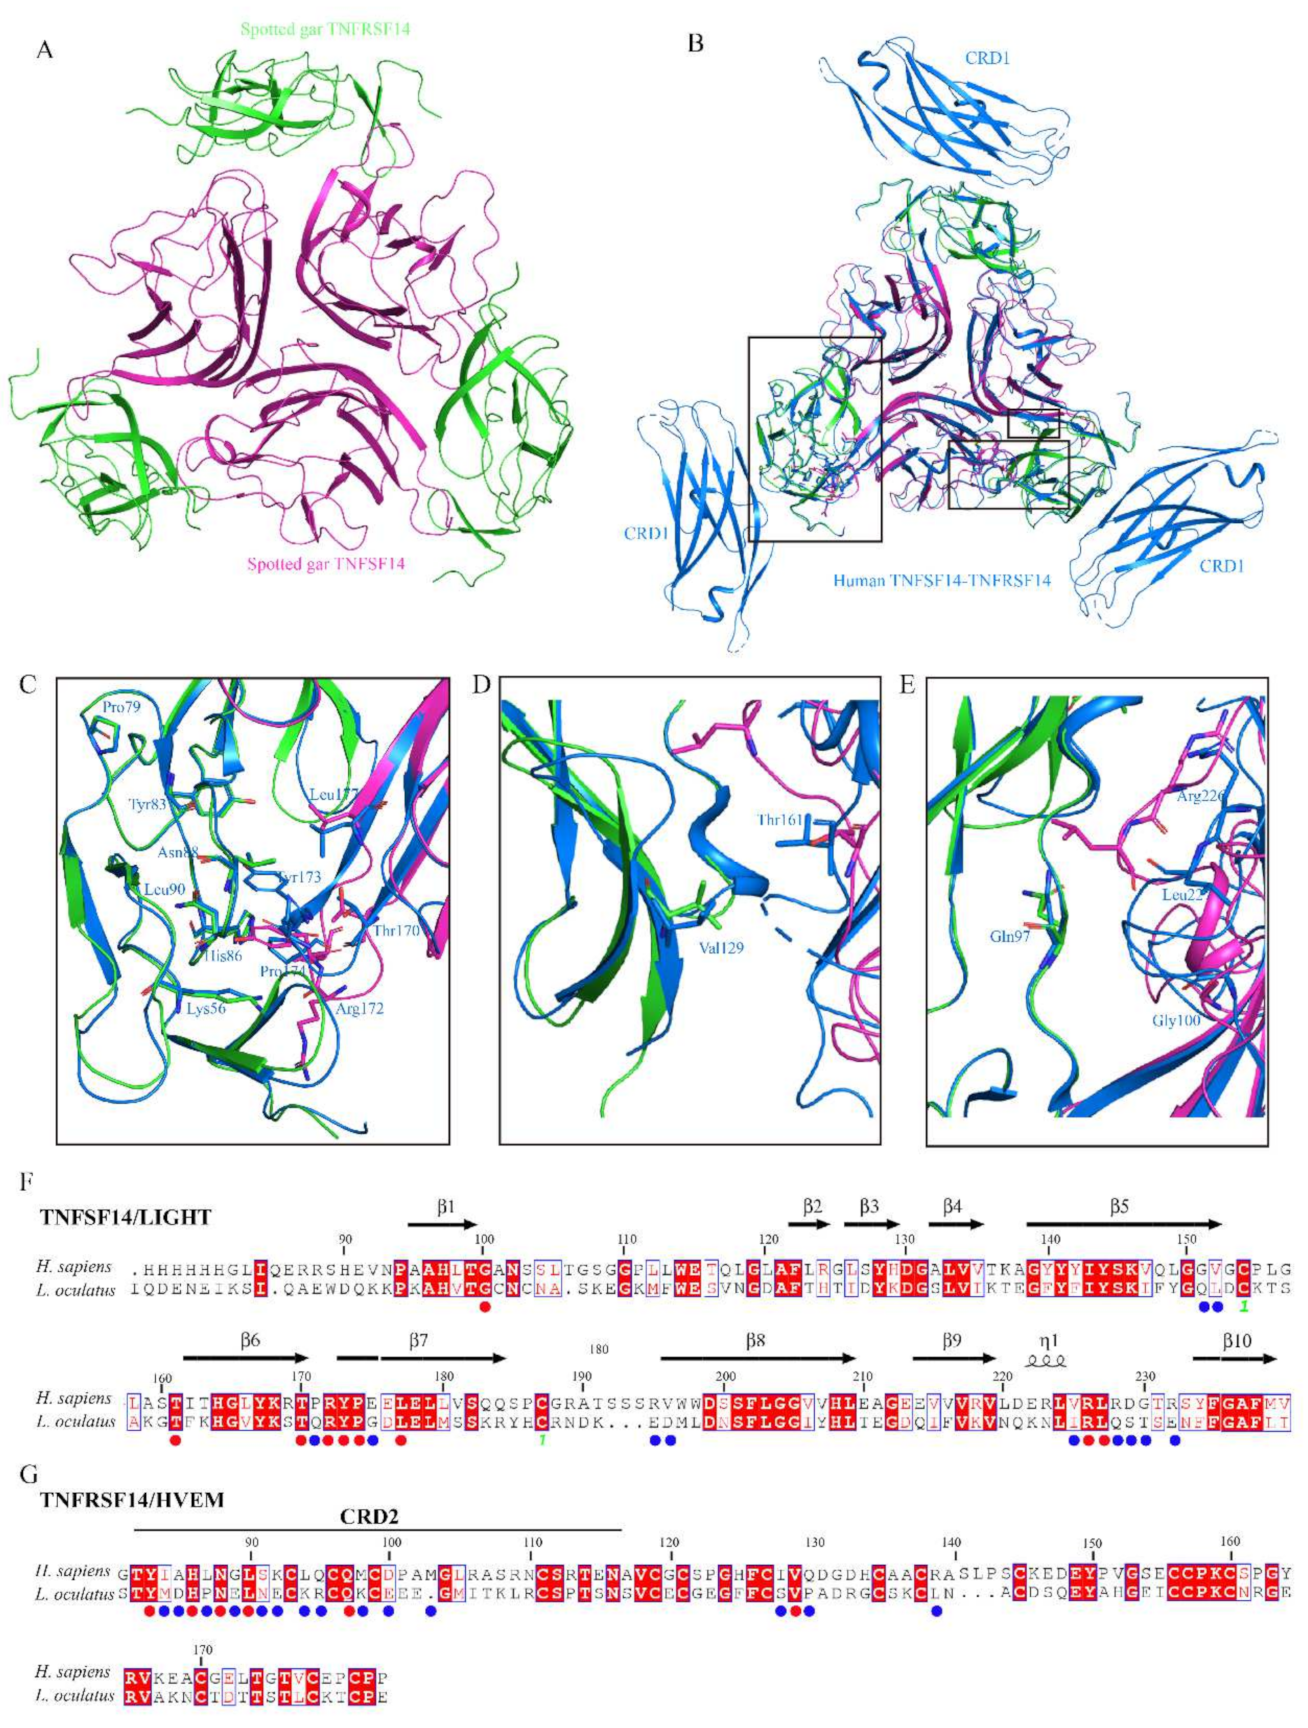
3.4. Protein Structure Modeling

The 3D structure of TNFSF14 and TNFRSF14 proteins were determined through homology modeling via SWISS-MODEL, the identity index between the target (TNFSF14 and TNFRSF14) to the templates (PDB codes: 3ugn and 4rsu) was 37% and 40%, respectively. The 3D structure of the TNFSF14/TNFRSF14 complex is shown in Figure 5A. The overall structure conformation is similar to human TNFSF14 with a RMSD value of 0.4. Interestingly, compared to human TNFRSF14/HVEM, the CRD1 appears to be absent in spotted gar TNFRSF14 (Figure 5A). The modeling structure complex superposed well with that of the human HVEM/LIGHT (TNFSF14/TNFRSF14) complex (PDB code: 7msg) (Figure 5B). In the structure of the hHVEM/hLIGHT complex, the CRD1, CRD2 and CRD3 of TNFRSF14/HVEM are the key domains that interact with TNFSF14/hLIGHT, in particular, the interaction between the hHVEM CRD2 and hLIGHT sheet D-loop DE-sheet E segment is important for the binding between hLIGHT and hHVEM (Figure 5C,E). Seven residues including Thr170, Pro171, Arg172, Tyr173, Pro174, Glu175 and Leu177 in the sheet D-loop and DE-sheet E of hLIGHT are involved in the interaction with hHVEM CRD2, five of which could be identified in spotted gar TNFSF14 (Figure 5F). Of note, Tyr173 is essential for receptor binding [28]. However, other residues involved in the ligand/receptor interaction are poorly conserved. These include residues interacting with CRD2 GH loop (Gly100, Val225-Gly230 and Arg232) and CRD3 (G151-V152 and A159-T161) and residues Q183, R195-V196 and W198, which are located in the EF loop (Figure 5F). Sixteen residues of hHVEM CRD2 participate in the interaction with hLIGHT, six of which are conserved in spotted gar TNFRSF14 (Figure 5G), including Asn88 and His86, which was experimentally determined [28].

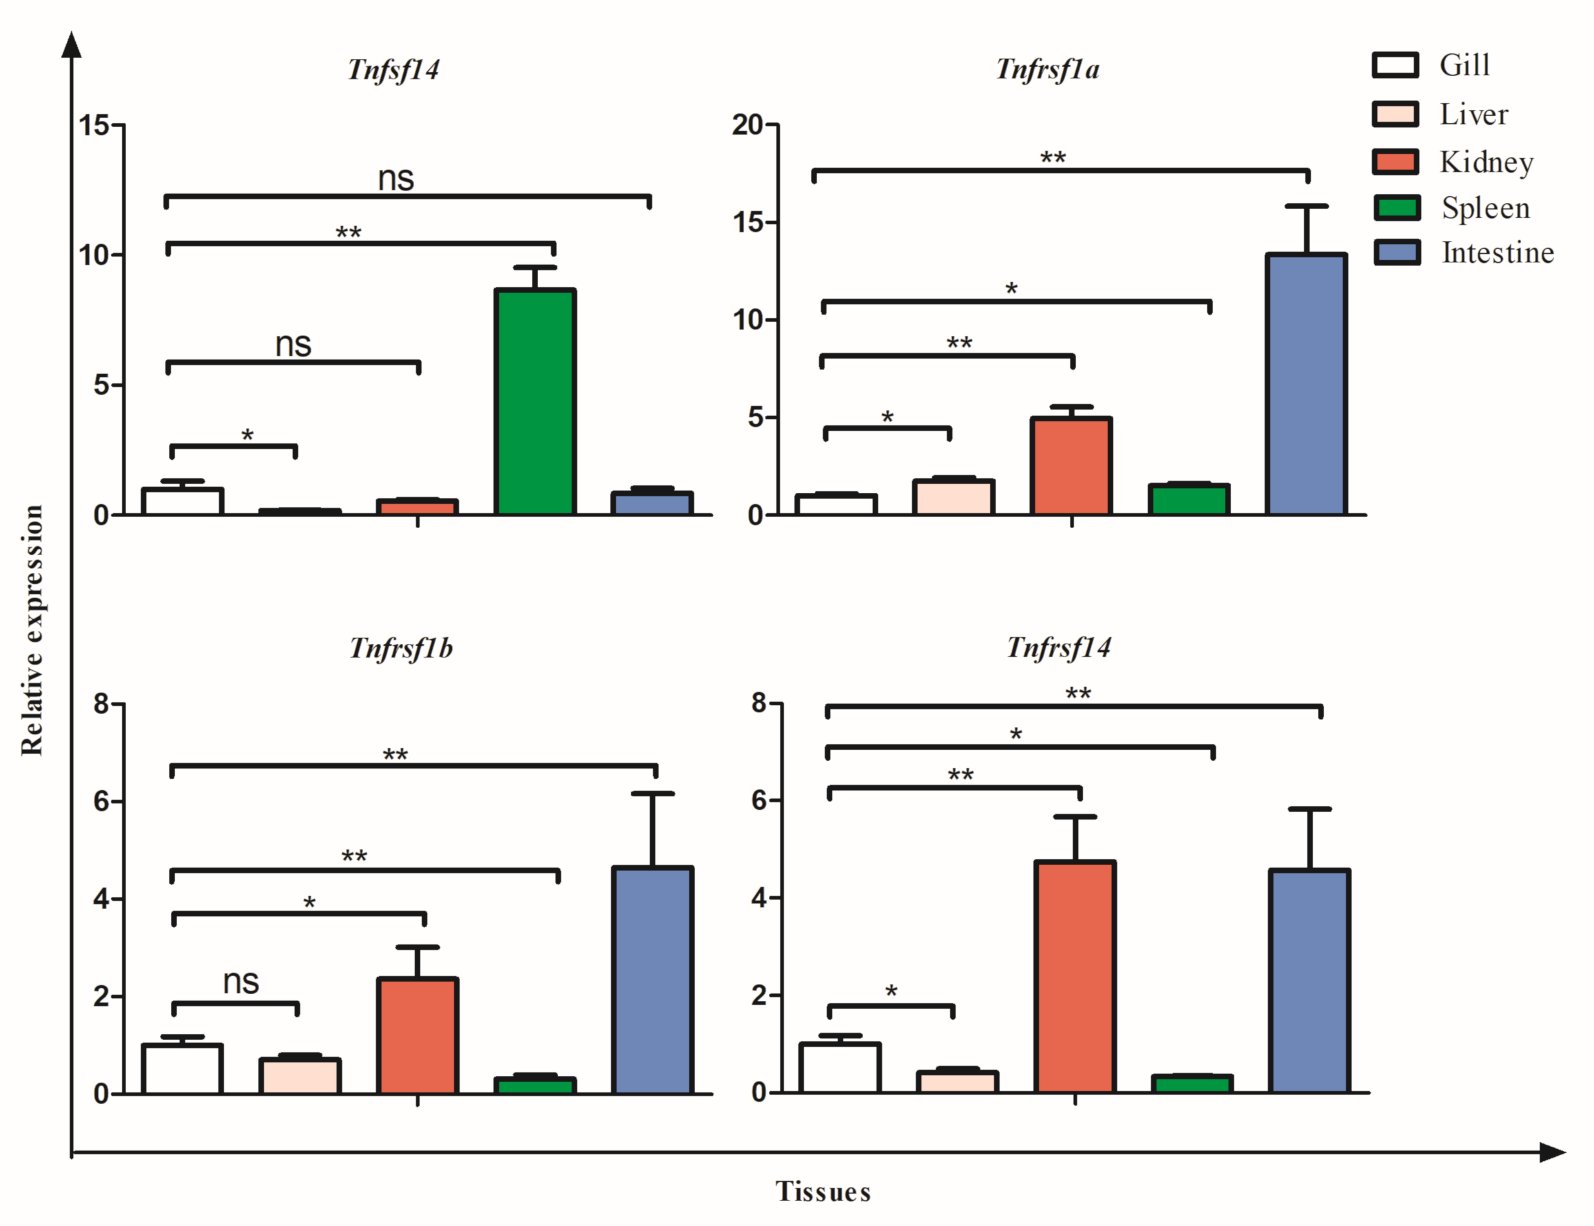
3.5. Tissue Expression

The expression of tnfsf14, tnfrsf1a, tnfrsf1b and tnfrsf14 were analyzed by qRT-PCR in five tissues of healthy spotted gar, including gills, liver, kidney, spleen and intestine (Figure 6). In general, the four genes were ubiquitously expressed in all five tissues. The highest expression of tnfsf14 was detected in the spleen and the lowest in the liver. The transcripts of tnfrsf1a, tnfrsf1b and tnfrsf14 were abundant in the kidney and intestine and relatively low in the gills and liver. The lowest expression of tnfrsf1b and tnfrsf14 was found in the spleen.

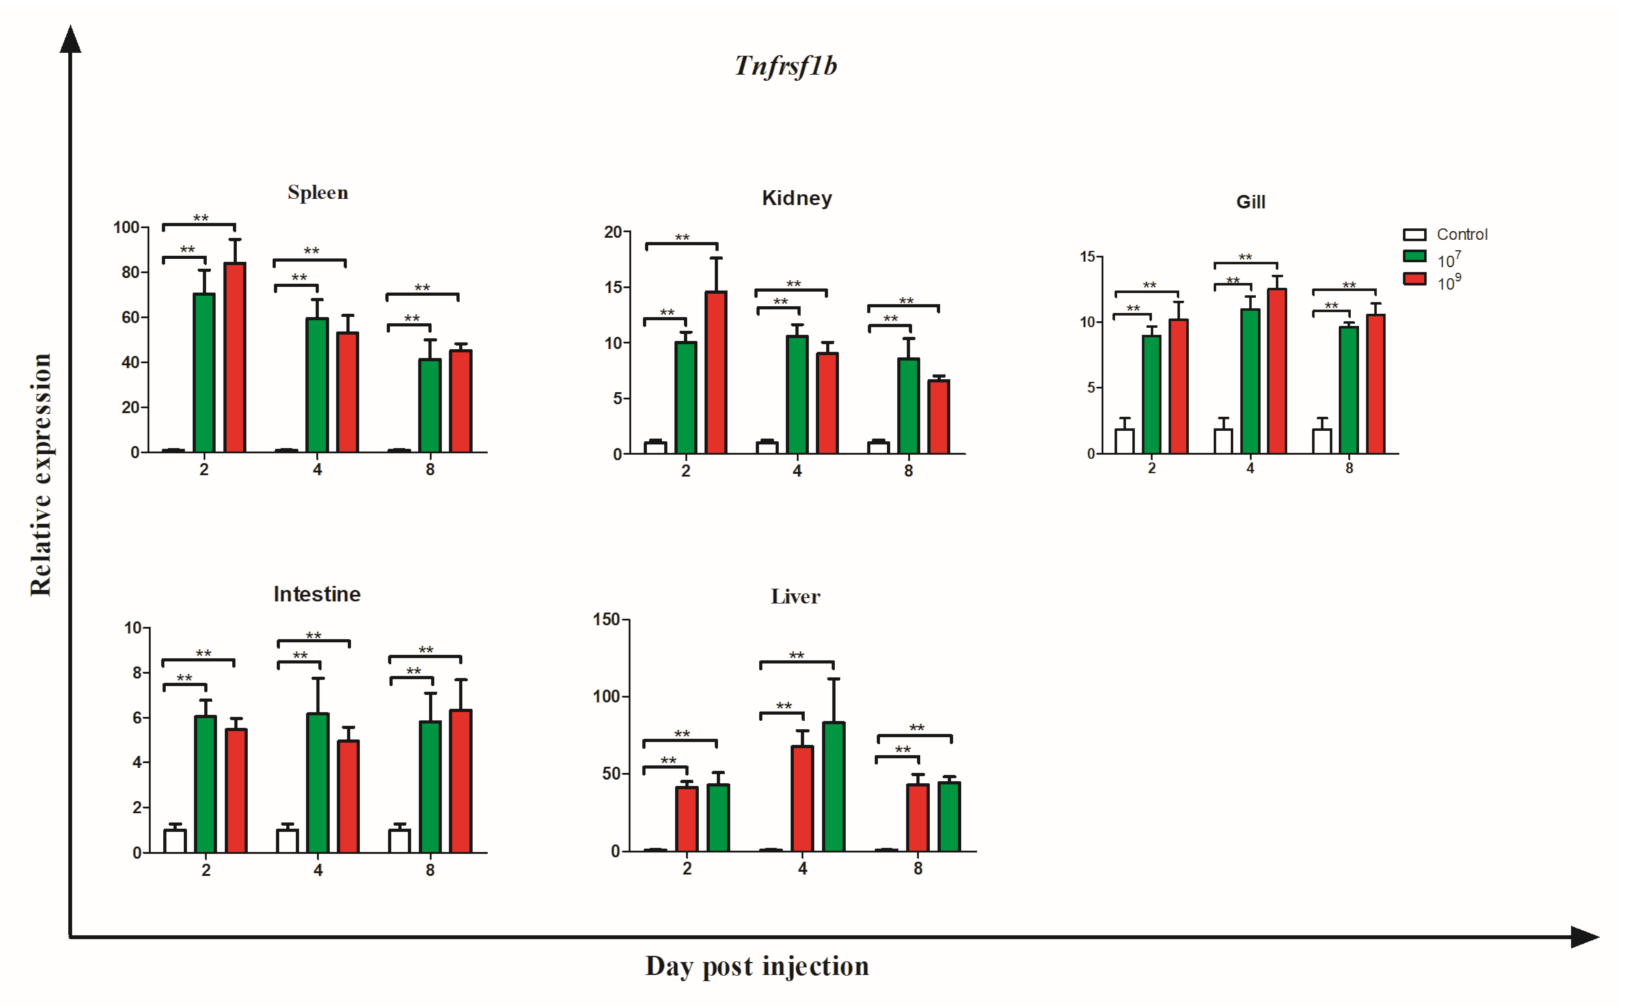
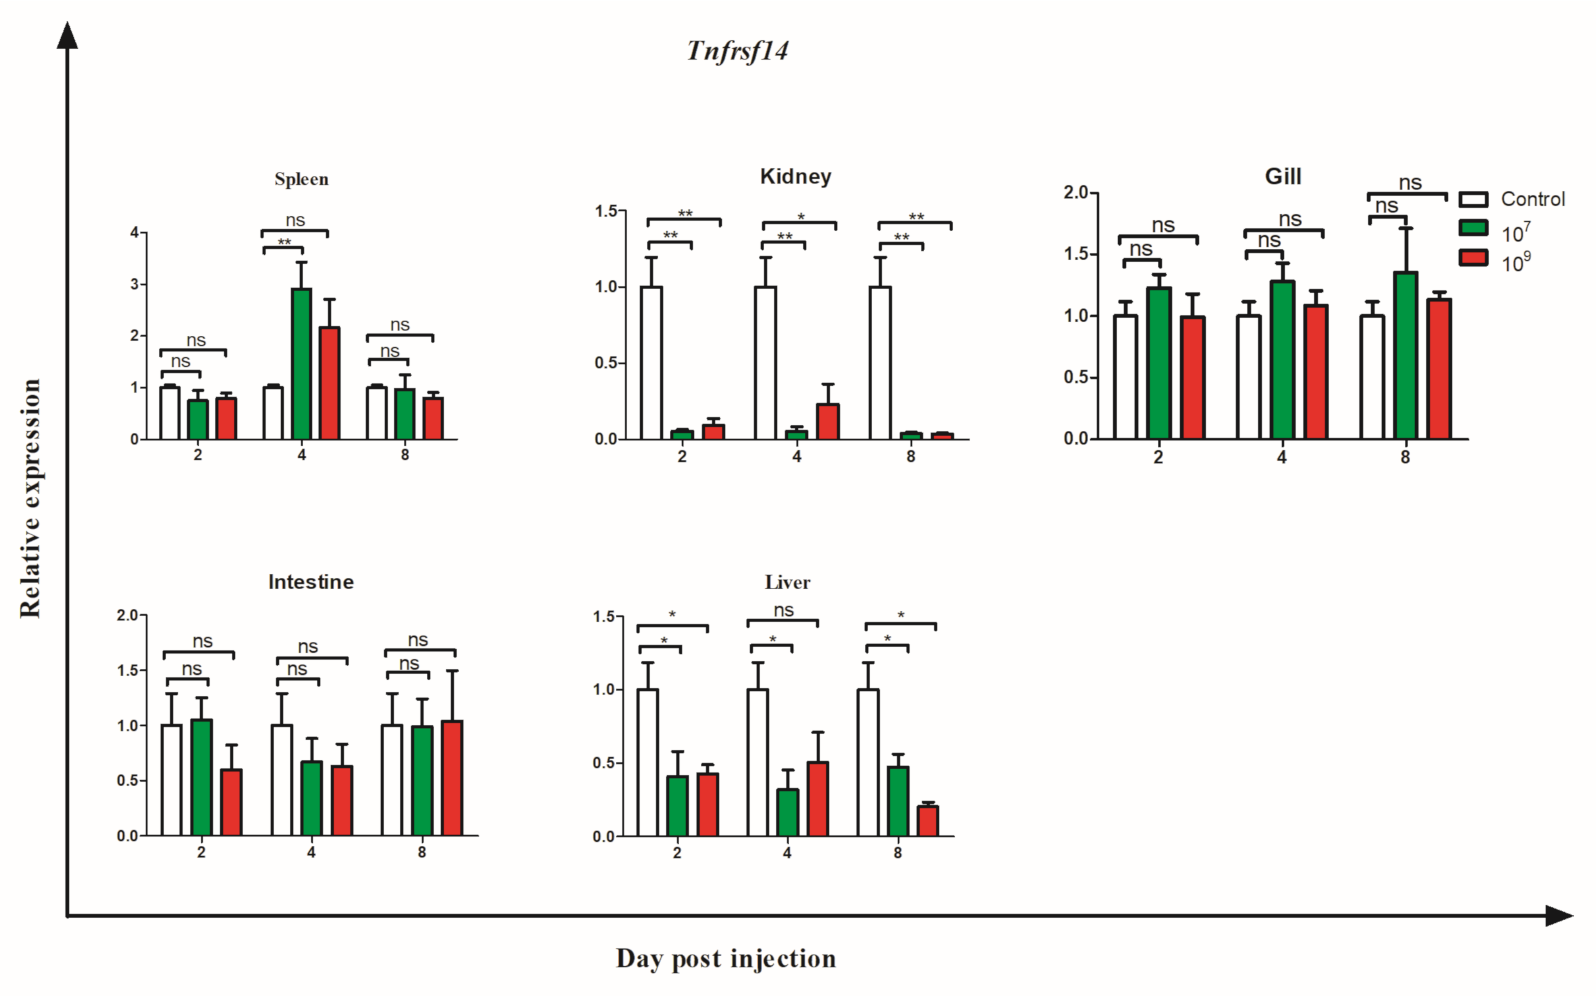
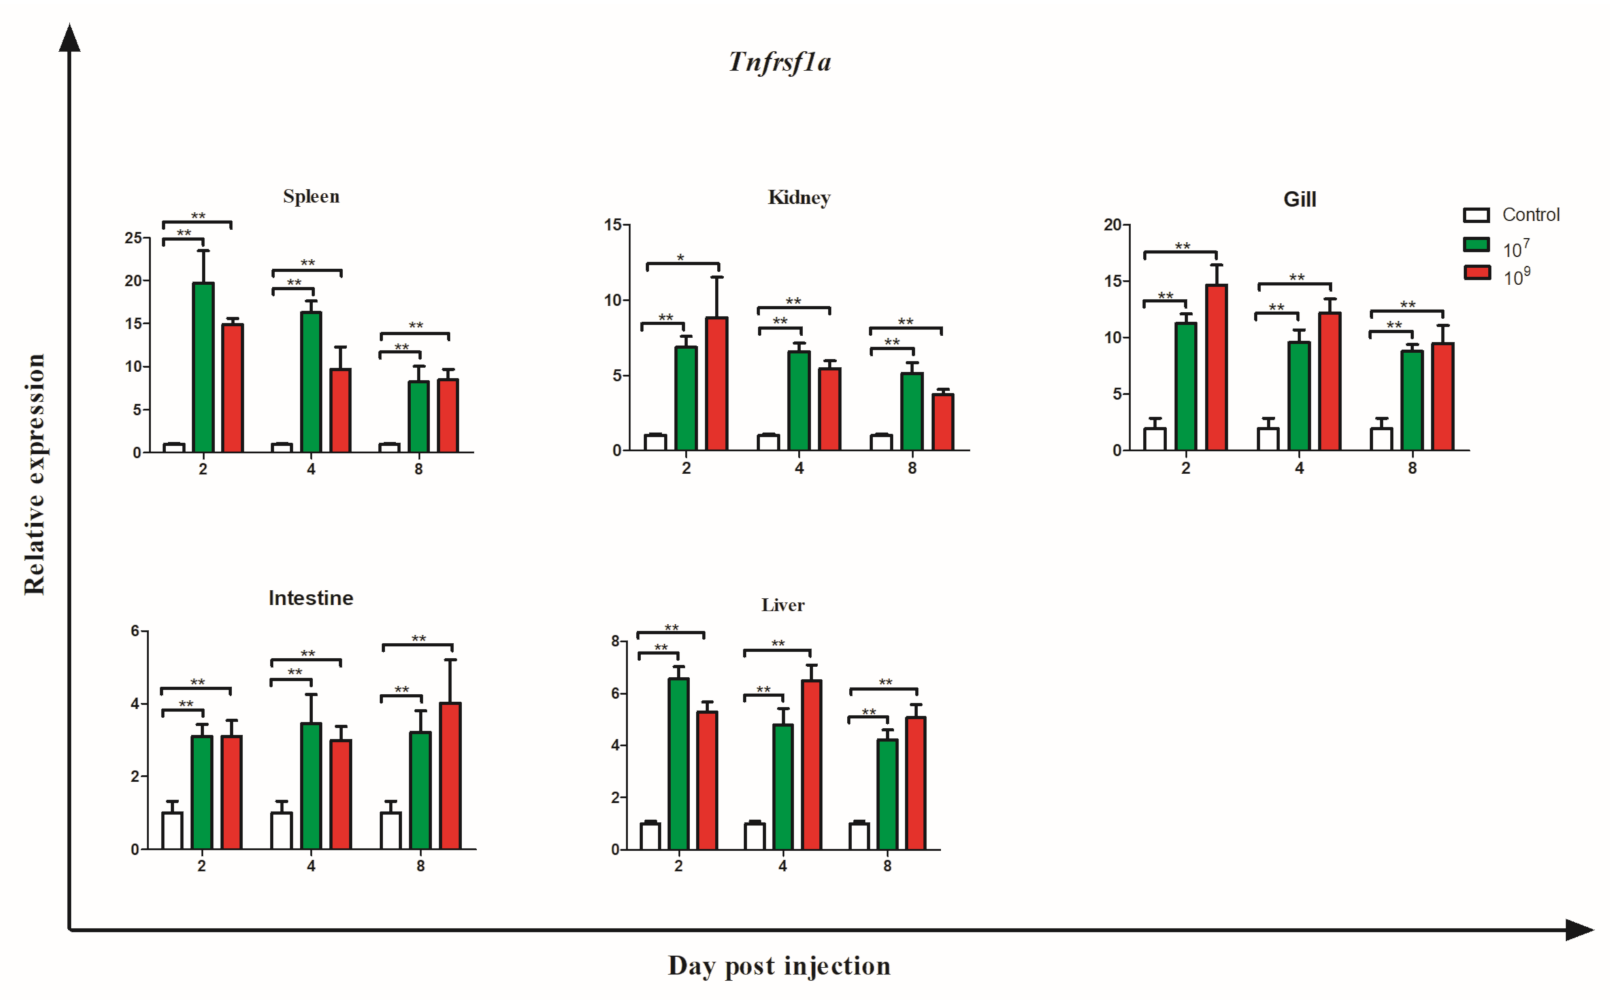
3.6. Gene Expression during Bacterial Infection

The expression levels of the four genes were determined in the gills, liver, kidney, spleen and intestine of spotted gar after infection with K. pneumoniae (Figure 7, Figure 8, Figure 9 and Figure 10). Fish were i.p. injected with 0.1 mL 1 × 10⁷ or 109 CFU/mL bacteria and sampled at 2, 4 and 8 days post-infection (dpi). It was found that tnfsf14 was significantly downregulated in most tissues after bacterial infection. Of note, drastic decreases of tnfsf14 expression were detected in the spleen, with a 34.9-fold decrease at 4 dpi (Figure 7).
The three tnfrsfs genes showed different expression patterns in tissues after K. pneumoniae infection. The expression levels of tnfrsf1a and tnfrsf1b were upregulated in all the tissues after challenge, while the expression levels of tnfrsf14 were moderately increased in the spleen. The highest increases of expression for the tnfrsf1a and tnfrsf1b genes were 19.7-fold and 84-fold in the spleen of fish injected with 1 × 10⁷ or 1 × 10⁹ CFU/mL bacteria respectively (Figure 8 and Figure 9) and gradually descended from 2 dpi to 8 dpi. In addition, tnfrsf1a was also highly upregulated in the gills with 8.8–14.6-fold increases and induced moderately in the intestine, kidney and liver. In contrast, the liver exhibited 41.3–83.2 fold increases of expression levels for the tnfrsf1b gene but the gills and intestine showed weakened induction. The tnfrsf14 gene was downregulated in the kidney and liver, with more pronounced decreases detected in the kidney (Figure 10). Its expression was not changed in the gills, intestine and spleen except for that infected with 1 × 10⁷ CFU/mL bacteria on day 2 (Figure 10).

4. Discussion

In this study, tnfsf14 and three tnfrsf genes were identified in spotted gar. Sequence analysis revealed that their genomic organizations, synteny and protein structural domains are conserved during evolution. For instance, tnfsf14 is linked with the qtrt1 and ddnnd1c genes and the tnfsf1a gene is clustered with plekhg6 in the genomes of spotted gar, zebrafish and humans (Figure 3). The tnfsf14 and tnfsf1a genes are located in the same chromosome in zebrafish and humans. It is unclear whether these two genes are located in the same chromosome in spotted gar since they are found in two different linkage groups (LG6 and LG26). TNFSF14 contains a well THD which is a characteristic feature seen in TNFSF members [14]. The three TNFRSFs also possess several conserved CRDs in their ectodomains. Spotted gar TNFRSF1a contains four CRDs, one more than the TNFRSF1a molecules in goldfish, Japanese flounder and striped murrel [29,30], and belongs to the DD containing TNFRSF group. In contrast, spotted gar TNFRSF1b lacks a DD which is vital for signaling transduction [5]. Interestingly, TNFRSF14 consists of a putative signal peptide but is devoid of a transmembrane domain (Figure 1D), suggesting that it is secreted. We speculate that the secreted form of TNFRSF14 may antagonize the functions of TNFSF14 by competing for the ligand with membrane-bound receptors.
The tnfsf14 and three tnfrsf genes showed differential expression in the gills, liver, kidney, spleen and intestine (Figure 6). This suggests that they may be expressed in different cell types in these tissues. High levels of tnfsf14 expression were detected in the spleen, followed by the gills and intestine (Figure 7), consistent with the observations in fugu and zebrafish [14,15]. Moreover, the tnfrsf1a was highly expressed relative tnfrsf1b and tnfrsf14 in most tissues. Similarly, in rainbow trout and mammals, the transcript levels of tnfrsf1b were also lower than that of tnfrsf1a [10,31]. In addition, high constitutive expression was observed in the intestine of goldfish and kidney of grass carp, snakehead and Japanese flounder [20,22,30,32]. Interestingly, high transcript levels of tnfrsf1a were detected in the heart of grass carp, goldfish and lamprey [5,9,20]. These data suggest that the tnfsf14, tnfrsf1a, tnfrsf1b and tnfrsf14 genes may play important roles in homeostasis in a tissue dependent manner.
K. pneumoniae is an opportunistic Gram-negative bacterial pathogen and infects a variety of fish species and land animals [33]. In recent years, it has become an emerging pathogen for the major aquaculture fish including common carp (Cyprinus carpio), clownfish (Amphiprion nigripes) and Japanese threadfin bream (Nemipterus japonicus) [25,34,35]. In our previous study, we isolated K. pneumoniae from diseased spotted gar and showed that K. pneumoniae infection caused severe inflammation and upregulation of proinflammatory genes [25]. In this study, we found that the tnfsf14 and three tnfrsf genes were differentially modulated in response to K. pneumoniae infection. TNFSF14 is an important cytokine involved in inflammation, T cell proliferation and apoptosis [16]. A recent study has demonstrated that it binds to LTbR/TNFRSF3 in mefugu to activate the NFkB pathway [16]. We showed here that tnfsf14 was consistently downregulated in all the tissues after K. pneumoniae challenge. TNFRSF14 is the core receptor activated by TNFSF14. The expression of tnfrsf14 was also downregulated in the kidney and liver. The results suggest that the TNFSF14 may dampen inflammation caused by K. pneumoniae infection through activation of TNFRSF14.
Contrary to the tnfsf14 and tnfrsf14, the tnfrsf1a and tnfrsf1b were remarkably upregulated in all the five issues analyzed after K. pneumoniae infection (Figure 8 and Figure 9). This observation is in line with previous studies that they could be induced by a range of bacterial pathogens in teleost fish. It has been shown that the tnfrsf1a expression was markedly elevated in the spleen of yellow catfish following infection with Edwardsiella ictaluri and in the head kidney and gills of grass carp infected with Aeromonas hydrophila [32,36]. Similarly, Snakehead challenged with E. ictaluri resulted in increased expression of tnfrsf1b in the spleen and head kidney [36]. However, it is interesting that downregulation of tnfrsf1b was reported in the liver and gills of yellow catfish infected E. ictaluri [36]. These contradictory observations on the modulation of tnfrsf1b expression in different teleost fish warrant further investigations on how it is regulated in response to infection with different bacterial pathogens.
In summary, tnfsf14 and three tnfrsfs genes were sequenced in spotted gar. The gene synteny, protein domains and structures are well conserved to their respective homologs in humans. A secreted form of Tnfrsf14 was identified. They were constitutively expressed in immune tissues including kidney, spleen, gills, intestine and liver. While Tnfsf14 and Tnfrsf14 were downregulated in response to K. pneumoniae infection, tnfrsf1a and tnfrsf1b were induced.

Supplementary Materials

The following supporting information can be downloaded at: https://www.mdpi.com/article/10.3390/jmse10081035/s1, Figure S1: cDNA and deduced amino acid sequences of LoTNFSF14 (A), TNFRSF1A (B), TNFRSF1B (C), and TNFRSF14 (D) in spotted gar. The open reading frame (ORF) is shown in upper case and the 5’-UTR and 3’-UTR sequences are in lower case. The translation initiation codon, stop codon and polyadenylation signal site are boxed. The transmembrane regions are shaded in gray.

Author Contributions

Conceptualization, Y.W., J.Z. and J.W.; methodology, Y.W., Z.J., H.D., H.X., W.H., Q.L., K.C. and L.Z.; validation, Y.W., J.Z. and J.W.; formal analysis, Y.W. and Z.J.; investigation, Y.W.; resources, J.Z. and J.W.; data curation, J.Z. and J.W.; writing—original draft preparation, Y.W.; writing—review and editing, J.Z. and J.W.; visualization, J.W.; supervision, J.Z. and J.W.; project administration, J.Z. and J.W.; funding acquisition, J.Z. All authors have read and agreed to the published version of the manuscript.

Funding

This work is funded by the National Natural Science Foundation of China (Grant numbers: 32030112 and U21A20268) and the Science and Technology Commission of Shanghai Municipality (Grant number: 19390743100).

Institutional Review Board Statement

The animal study protocol was approved by the Ethics Committee of Shanghai Ocean University (SHOU-DW-2019-003, approved on 2 April, 2020)” for studies involving animals.

Conflicts of Interest

The authors declare no conflict of interest.

References

  1. Sun, Y.; Liu, C.; Huang, M.; Huang, J.; Liu, C.; Zhang, J.; Postlethwait, J.-H.; Wang, H. The molecular evolution of circadian clock genes in spotted gar (Lepisosteus oculatus). Genes 2019, 10, 622. [Google Scholar] [CrossRef] [Green Version]
  2. Sukeena, J.M.; Galicia, C.A.; Wilson, J.D.; McGinn, T.; Boughman, J.W.; Robison, B.D.; Postlethwait, J.H.; Braasch, I.; Stenkamp, D.L.; Fuerst, P.G. Characterization and evolution of the spotted gar retina. J. Exp. Zool. B Mol. Dev. Evol. 2016, 326, 403–421. [Google Scholar] [CrossRef] [PubMed] [Green Version]
  3. Wcisel, D.J.; Ota, T.; Litman, G.W.; Yoder, J.A. Spotted Gar and the Evolution of Innate Immune Receptors. J. Exp. Zool. B Mol. Dev. Evol. 2017, 328, 666–684. [Google Scholar] [CrossRef] [PubMed]
  4. Sullivan, C.; Lage, C.R.; Yoder, J.A.; Postlethwait, J.H.; Kim, C.H. Evolutionary divergence of the vertebrate TNFAIP8 gene family: Applying the spotted gar orthology bridge to understand ohnolog loss in teleosts. PLoS ONE 2017, 12, e0179517. [Google Scholar] [CrossRef] [PubMed] [Green Version]
  5. Zhang, S.; Wang, X.; Li, C.; Feng, S.; Zhang, A.; Yang, K.; Zhou, H. Identification and functional characterization of grass carp (Ctenopharyngodon idella) tumor necrosis factor receptor 2 and its soluble form with potentiality for targeting inflammation. Fish Shellfish Immunol. 2019, 86, 393–402. [Google Scholar] [CrossRef] [PubMed]
  6. Zhu, Y.; Li, J.; Li, Q.; Pang, Y. Characterization of lamprey (Lampetra japonica) tnfr10-like gene: A potential granulocyte marker molecule and its immune functions. Mol. Immunol. 2020, 124, 25–34. [Google Scholar] [CrossRef] [PubMed]
  7. Tafalla, C.; Granja, A.G. Novel insights on the regulation of B cell functionality by members of the tumor necrosis factor superfamily in jawed fish. Front. Immunol. 2018, 9, 1285. [Google Scholar] [CrossRef] [PubMed] [Green Version]
  8. Bodmer, J.L.; Schneider, P.; Tschopp, J. The molecular architecture of the TNF superfamily. Trends Biochem. Sci. 2002, 27, 19–26. [Google Scholar] [CrossRef] [Green Version]
  9. Zhu, Y.; Pang, Y.; Li, Q. Molecular evolution of the tnfr gene family and expression profiles in response to pathogens in lamprey (Lethenteron reissneri). Fish Shellfish Immunol. 2020, 96, 336–349. [Google Scholar] [CrossRef]
  10. Hong, S.; Wang, T.Y.; Secombes, C.J.; Wang, T. Different origins of paralogues of salmonid TNR1 and TNFR2: Characterisation and expression analysis of four TNF receptor genes in rainbow trout Oncorhynchus mykiss. Dev. Comp. Immunol. 2019, 99, 103403. [Google Scholar] [CrossRef] [PubMed]
  11. Pozzolini, M.; Scarfì, S.; Ghignone, S.; Mussino, F.; Vezzulli, L.; Cerrano, C.; Giovine, M. Molecular characterization and expression analysis of the first Porifera tumor necrosis factor superfamily member and of its putative receptor in the marine sponge Chondrosia reniformis. Dev. Comp. Immunol. 2016, 57, 88–98. [Google Scholar] [CrossRef] [PubMed]
  12. Li, Y.; Xiao, T.; Zou, J. Fish TNF and TNF receptors. Sci. China Life Sci. 2021, 64, 196–220. [Google Scholar] [CrossRef] [PubMed]
  13. Kim, W.J.; Kang, Y.J.; Koh, E.M.; Ahn, K.S.; Cha, H.S.; Lee, W.H. LIGHT is involved in the pathogenesis of rheumatoid arthritis by inducing the expression of pro-inflammatory cytokines and MMP-9 in macrophages. Immunology 2005, 114, 272–279. [Google Scholar] [CrossRef]
  14. Tian, A.Y.; Yang, H.J.; Zhu, S.C.; Zhang, Y.S.; Jiang, Z.A.; Song, J.Y.; Liu, H.Z.; Zhang, S.Q. Isolation and characterization of LIGHT (TNFSF14) gene homologue in zebrafish (Danio rerio). Int. Immunopharmacol. 2012, 14, 629–634. [Google Scholar] [CrossRef]
  15. Li, C.; Shen, Y.; Liang, D.; Yin, F.; Ai, H.; Sun, B.; Lin, S.; Zhang, S. Cloning, expression, and characterization of TNFSF14 (LIGHT) gene in mefugu, Takifugu obscurus. Mol. Cell Biochem. 2013, 379, 87–96. [Google Scholar] [CrossRef] [PubMed]
  16. Maeda, T.; Suetake, H.; Odaka, T.; Miyadai, T. Original ligand for LTβR is LIGHT: Insight into evolution of the LT/LTβR system. J. Immunol. 2018, 201, 202–214. [Google Scholar] [CrossRef] [PubMed]
  17. Quistad, S.D.; Stotland, A.; Barott, K.L.; Smurthwaite, C.A.; Hilton, B.J.; Grasis, J.A.; Wolkowicz, R.; Rohwer, F.L. Evolution of TNF-induced apoptosis reveals 550 My of functional conservation. Proc. Natl. Acad. Sci. USA 2014, 111, 9567–9572. [Google Scholar] [CrossRef] [Green Version]
  18. Balkwill, F. Tumour necrosis factor and cancer. Nat. Rev. Cancer 2009, 9, 361–371. [Google Scholar] [CrossRef]
  19. Eimon, P.M.; Kratz, E.; Varfolomeev, E.; Hymowitz, S.G.; Stern, H.; Zha, J.; Ashkenazi, A. Delineation of the cell-extrinsic apoptosis pathway in the zebrafish. Cell Death Differ. 2006, 13, 1619–1630. [Google Scholar] [CrossRef] [Green Version]
  20. Grayfer, L.; Belosevic, M. Molecular characterization of tumor necrosis factor receptors 1 and 2 of the goldfish (Carassius aurutus L.). Mol. Immunol. 2009, 46, 2190–2199. [Google Scholar] [CrossRef]
  21. Candel, S.; de Oliveira, S.; López-Muñoz, A.; García-Moreno, D.; Espín-Palazón, R.; Tyrkalska, S.D.; Cayuela, M.L.; Renshaw, S.A.; Corbalán-Vélez, R.; Vidal-Abarca, I.; et al. Tnfa signaling through tnfr2 protects skin against oxidative stress-induced inflammation. PLoS Biol. 2014, 12, e1001855. [Google Scholar] [CrossRef] [PubMed] [Green Version]
  22. Cui, Z.W.; Kong, L.L.; Zhao, F.; Tan, A.P.; Deng, Y.T.; Jiang, L. Two types of TNF-α and their receptors in snakehead (Channa argus): Functions in antibacterial innate immunity. Fish Shellfish Immunol. 2020, 104, 470–477. [Google Scholar] [CrossRef] [PubMed]
  23. Espín, R.; Roca, F.J.; Candel, S.; Sepulcre, M.P.; González-Rosa, J.M.; Alcaraz-Pérez, F.; Meseguer, J.; Cayuela, M.L.; Mercader, N.; Mulero, V. TNF receptors regulate vascular homeostasis in zebrafish through a caspase-8, caspase-2 and P53 apoptotic program that bypasses caspase-3. Dis Models Mech. 2013, 6, 383–396. [Google Scholar] [CrossRef] [PubMed] [Green Version]
  24. Nguyen-Chi, M.; Laplace-Builhé, B.; Travnickova, J.; Luz-Crawford, P.; Tejedor, G.; Lutfalla, G.; Kissa, K.; Jorgensen, C.; Djouad, F. TNF signaling and macrophages govern fin regeneration in zebrafish larvae. Cell Death Dis. 2017, 8, e2979. [Google Scholar] [CrossRef] [PubMed]
  25. Wu, Y.X.; Yang, Y.B.; Dang, H.F.; Xiao, H.H.; Huang, W.J.; Jia, Z.; Zhao, X.; Chen, K.Y.; Ji, N.; Guo, J.H.; et al. Molecular identification of Klebsiella pneumoniae and expression of immune genes in infected spotted gar Lepisosteus oculatus. Fish Shellfish Immunol. 2021, 119, 220–230. [Google Scholar] [CrossRef] [PubMed]
  26. Xue, Y.; Jiang, X.; Gao, J.; Li, X.; Xu, J.; Wang, J.; Gao, Q.; Zou, J. Functional characterisation of interleukin 34 in grass carp Ctenopharyngodon idella. Fish Shellfish Immunol. 2019, 92, 91–100. [Google Scholar] [CrossRef] [PubMed]
  27. Sun, Z.; Qin, Y.; Liu, D.; Wang, B.; Jia, Z.; Wang, J.; Gao, Q.; Zou, J.; Pang, Y. The evolution and functional characterization of CXC chemokines and receptors in lamprey. Dev. Comp. Immunol. 2021, 116, 103905. [Google Scholar] [CrossRef]
  28. Shrestha, R.; Garrett-Thomson, S.C.; Liu, W.; Almo, S.C.; Fiser, A. Redesigning HVEM interface for selective binding to LIGHT, BTLA, and CD160. Structure 2020, 28, 1197–1205.e2. [Google Scholar] [CrossRef]
  29. Palanisamy, R.; Kumaresan, V.; Harikrishnan, R.; Arasu, M.V.; Al-Dhabi, N.A.; Arockiaraj, J. Functional roles and gene regulation of tumor necrosis factor receptor 1 in freshwater striped murrel. Mol. Immunol. 2015, 66, 240–252. [Google Scholar] [CrossRef]
  30. Park, C.I.; Kurobe, T.; Hirono, I.; Aoki, T. Cloning and characterization of cDNAs for two distinct tumor necrosis factor receptor superfamily genes from Japanese flounder Paralichthys olivaceus. Dev. Comp. Immunol. 2003, 27, 365–375. [Google Scholar] [CrossRef]
  31. Yang, S.; Wang, J.; Brand, D.D.; Zheng, S.G. Role of TNF-TNF receptor 2 signal in regulatory T cells and its therapeutic implications. Front. Immunol. 2018, 9, 784. [Google Scholar] [CrossRef] [PubMed] [Green Version]
  32. Zhang, S.; Zhang, R.; Ma, T.; Qiu, X.; Wang, X.; Zhang, A.; Zhou, H. Identification and functional characterization of tumor necrosis factor receptor 1 (TNFR1) of grass carp (Ctenopharyngodon idella). Fish Shellfish Immunol. 2016, 58, 24–32. [Google Scholar] [CrossRef] [PubMed]
  33. Brisse, S.; Fevre, C.; Passet, V.; Issenhuth-Jeanjean, S.; Tournebize, R.; Diancourt, L.; Grimont, P. Virulent clones of Klebsiella pneumoniae: Identification and evolutionary scenario based on genomic and phenotypic characterization. PLoS ONE 2009, 4, e4982. [Google Scholar] [CrossRef] [PubMed] [Green Version]
  34. Das, A.; Acharya, S.; Behera, B.K.; Paria, P.; Bhowmick, S.; Parida, P.K.; Das, B.K. Isolation, identification and characterization of Klebsiella pneumoniae from infected farmed Indian Major Carp Labeo rohita (Hamilton 1822) in West Bengal, India. Aquaculture 2018, 482, 111–116. [Google Scholar] [CrossRef]
  35. Gopi, M.; Thankappanpillai, T.; Kumar, A.; Prakash, S. Opportunistic pathogen Klebsiella pneumoniae isolated from Maldive’s clown fish Amphiprion nigripes with hemorrhages at Agatti Island, Lakshadweep archipelago. Int. J. Fish. Aquat. Stud. 2016, 4, 464–467. [Google Scholar]
  36. Hu, Y.H.; Zhou, X.; Jiang, X.X.; Zhang, G.R.; Shi, Z.C.; Ji, W.; Ma, X.F.; Luo, Z.L.; Wei, K.J. Molecular characterization, expression analysis and function identification of Pf_TNF-α and its two receptors Pf_TNFR1 and Pf_TNFR2 in yellow catfish (Pelteobagrus fulvidraco). Int. J. Biol. Macromol. 2021, 185, 176–193. [Google Scholar] [CrossRef]
Figure 1. Multiple sequence alignment of TNFSF14 (A) and TNFRSF1A (B), TNFRSF1A (C), TNFRSF14 (D) with selected homologs. Putative signal peptide, cysteine-rich domain (CRD), death domain (DD) and TNF homology domain (THD) in the spotted gar proteins are indicated by double arrows. The predicted N-glycosylated sites are boxed. Identical (*), most similar (:) and similar residues are indicated below the sequences.
Jmse 10 01035 g001aJmse 10 01035 g001bJmse 10 01035 g001c
Figure 2. Genomic organization of tnfsf14 (A), tnfrsf1a (B), tnfrsf1a (C) and tnfrsf1a (D). The genomic organization was obtained by comparing the cDNA sequences with the genomic sequences retrieved from the NCBI database. Colored boxes represent the coding exons and hollow boxes indicate non-coding exons. The size (bp) of exons is indicated. Note intron size is disproportionate.
Jmse 10 01035 g002
Figure 3. Gene synteny of tnfsf14 (A), tnfrsf1a (B), tnfrsf1b (C) and tnfrsf14 (D). The synteny information for human, zebrafish and spotted gar genes was obtained from the NCBI database. Acronyms of genes are adopted from the NCBI database.
Jmse 10 01035 g003
Figure 4. Phylogenetic trees of TNFSF14 (A) and TNFRSFs (B) proteins. The phylogenetic trees were constructed using the NJ method within the MEGA5.1 program and run for 1000 replications. The percentages of bootstrap values (>50%) for branches are shown. Spotted gar TNFSF14 and TNFRSFs are colored red.
Jmse 10 01035 g004
Figure 5. Structural modeling of the Spotted gar TNFSF14/TNFRSF14 complex. (A) the 3D structures of spotted gar TNFSF14/TNFRSF14. The structure is shown in cartoon and colored in magenta and green, respectively. (B) Superposition of the modeled structure with the hLIGHT/hHVEM (TNFSF14/TNFRSF14) complex. Black box indicates the key interaction area. (CE) The conserved residues that participate in the interaction between hLIGHT and hHVEM and the corresponding residues in spotted gar TNFSF14-TNFRSF14 were also shown. (F,G) Structure-based amino acid sequence alignment of TNFSF14 and TNFRSF14. Black arrows and cylinders above the alignment indicate β-strands and α-helices. The residues involved in the interaction between ligand and receptor are indicated by red (identical) and blue (not identical) dots.
Jmse 10 01035 g005
Figure 6. Expression analysis of tnfsf14 and tnfrsf genes in tissues. The expression levels of tissues were normalized to that of gills. Data are presented as mean + SEM (n = 5). ns = no significant difference, * p < 0.05, ** p < 0.001.
Jmse 10 01035 g006
Figure 7. Expression analysis of tnfsf14 after infection with K. peneumoniae. Fish were i.p. injected with 0.1 mL 1 × 10⁷ or 1 × 10⁹ CFU/mL K. pneumoniae suspension. Ef-1α was used as an internal reference gene for normalization of gene expression. The expression levels of genes were compared with that of the control group (defined as 1). Bars represent mean + SEM (n = 5). Significant differences are indicated by * (p < 0.05) and ** (p < 0.01). ns = no significant difference.
Jmse 10 01035 g007
Figure 8. Expression analysis of tnfrsf1a after infection with K. peneumoniae. Fish were i.p. injected with 0.1 mL 1 × 10⁷ or 1 × 10⁹ CFU/mL K. pneumoniae suspension. Ef-1α was used as an internal reference gene for normalization of gene expression. The expression levels of genes were compared with that of the control group (defined as 1). Bars represent mean + SEM (n = 5). Significant differences are indicated by * (p < 0.05) and ** (p < 0.01).
Jmse 10 01035 g008
Figure 9. Expression analysis of tnfrsf1b after infection with K. peneumoniae. Fish were i.p. injected with 0.1 mL 1 × 10⁷ or 1 × 10⁹ CFU/mL K. pneumoniae suspension. Ef-1α was used as an internal reference gene for normalization of gene expression. The expression levels of genes were compared with that of the control group (defined as 1). Bars represent mean + SEM (n = 5). Significant differences are indicated by ** (p < 0.01).
Jmse 10 01035 g009
Figure 10. Expression analysis of tnfrsf14 after infection with K. peneumoniae. Fish were i.p. injected with 0.1 mL 1 × 10⁷ or 1 × 10⁹ CFU/mL K. pneumoniae suspension. Ef-1α was used as an internal reference gene for normalization of gene expression. The expression levels of genes were compared with that of the control group (defined as 1). Bars represent mean + SEM (n = 5). Significant differences are indicated by * (p < 0.05) and ** (p < 0.01). ns = no significant difference.
Jmse 10 01035 g010
Table 1. Primers used in this study.
Primer NamePrimer Sequences (5′-3′)Application
tnfsf14-F1GGTCATCAAGACTGAAGGC3′-RACE
tnfsf14-F2GAGACCTGGAGCTCATGAGC
tnfrsf1a-F1AGCACAAACAGCCTGAGCTG3′-RACE
tnfrsf1a-F2GTATAACATCAGCCTGGAG
tnfrsf1b-F1GCACTACCACAACAACTGC3′-RACE
tnfrsf1b-F2GTAGCTGTCATCGACAAGAC
tnfrsf14-F1ATGTGTGAGGCATGTGATTC3′-RACE
tnfrsf14-F2GCTGTCCTAAGTGCAATCGTG
tnfsf14-R1GCCTTCAGTCTTGATGACC5′-RACE
tnfsf14-R2CCATCCACCACAAAGACTG
tnfrsf1a-R1CTCCAGGCTGATGTTATAC5′-RACE
tnfrsf1a-R2CACAGCTGGATCATGTAGTAC
tnfrsf1b-R1GTCTTGTCGATGACAGCTAC5′-RACE
tnfrsf1b-R2GCAGTTGTTGTGGTAGTGC
tnfrsf14-R1GTCCTTCTGAACATACAGTG5′-RACE
tnfrsf14-R2CACGATTGCACTTAGGACAGC
tnfsf14-F3CTCTCACGAAGGTCTTCCTGVerify the full length
tnfsf14-R3GAGACATAGAGCTGAATGTAG
tnfrsf1a-F3CACGTTGGAGACCTCGATGVerify the full length
tnfrsf1a-R3GATGTGCTTATGCTCATGAC
tnfrsf1b-F3CGAGTTGAGAGGGCGTGCTGVerify the full length
tnfrsf1b-R3CTGGTACTGCCCTTGCATG
tnfrsf14-F3GAATTCCAGGGTCCACGTGGGVerify the full length
tnfrsf14-R3TTCAAAGTATTCTTGATGTAAATGTTGC
tnfsf14-qFCAGCATCAATGAAAACAGTCCqRT-PCR
tnfsf14-qRCAGATTCCCAGAACATCTTTCC
tnfrsf1a-qFAGCACAAACAGCCTGAGCTGqRT-PCR
tnfrsf1a-qRCACAGCTGGATCATGTAGTAC
tnfrsf1b-qFCACACTGACTGTGCCTCACACqRT-PCR
tnfrsf1b-qRGTCTTGTCGATGACAGCTAC
tnfrsf14-qFGGGTGTTGCATTTTGGCTGAGqRT-PCR
tnfrsf14-qRGCATCTTTTGCACTCATTCAG
ef-1α-qFCAAGGATATCCCGTCGTGGCAqRT-PCR
ef-1α-qRAATACGCCAAGAGGAGG
UPM-LongCTAATACGACTCACTATAGGGCAAGCAGTGGTATCAACGCAGAGT
UPM-ShortCTAATACGACTCACTATAGGGC
NUPAAGCAGTGGTATCAACGCAGAGT
Publisher’s Note: MDPI stays neutral with regard to jurisdictional claims in published maps and institutional affiliations.

