Article

Improving Computational Efficiency in WEC Design: Spectral-Domain Modelling in Techno-Economic Optimization

Marine Offshore Renewable Energy Lab (MOREnergyLab), Department of Mechanical and Aerospace Engineering (DIMEAS), Politecnico di Torino, Corso Duca degli Abruzzi 24, 10129 Turin, Italy
*
Author to whom correspondence should be addressed.
J. Mar. Sci. Eng. 2022, 10(10), 1468; https://doi.org/10.3390/jmse10101468
Submission received: 16 September 2022 / Revised: 6 October 2022 / Accepted: 7 October 2022 / Published: 10 October 2022

Abstract

:
Wave energy converter (WEC) optimization often underlines incremental and iterative approaches that result in suboptimal solutions, since all the elements that concur with a techno-economical evaluation are optimized separately due to computation constraints. A design process should rely on precise WEC models to ensure high result accuracy while minimizing the computational demand. These conflicting objectives can be addressed with non-linear time-domain models, known to be numerically accurate, and frequency-domain models due to their high computational efficiency. This work pursues the development of an all-encompassing optimization tool for a gyroscopic-type WEC called ISWEC that applies a new modelling technique named spectral-domain technique as a substitution to the complex time-domain model previously employed. In particular, the spectral-domain technique provides accurate and fast performance predictions of the ISWEC system and offers the possibility to model a hydraulic power take-off, not representable in the frequency domain. The article illustrates techno-economic trends associated with an early-stage design of the ISWEC in high-energy sea-sites, where the low-speed and high-torque profiles call for the use of hydraulic transmissions as opposed to the old electro-mechanical transmissions. The design tool proposed could facilitate the development of WEC technologies via efficient and accurate power assessment and via the possibility of carrying out advanced techno-economic optimisation that goes beyond linear models.

1. Introduction

In the renewable energy context, wave energy converters (WECs) are not yet economically competitive with other technologies, i.e., onshore and offshore wind turbines, due to the excessive cost of energy at the current stage of development. Moreover, despite the enormous energy potential of ocean waves, the extraction capabilities of WECs could be poor due to non-optimal designs. The main challenges faced in designing WECs and their PTO systems include [1,2] the high variability of the wave resource in the short-term period; the slow, bi-directional and irregular kinematic behaviour of bodies forced by waves; and the harsh and corrosive marine environment that impacts the life cycle of the WEC. The optimization of a WEC system is dominated by iterative methods in which design parameters are managed in a trial and error fashion [3]. The authors of this work already stressed the use of a multi-objective techno-economic perspective by proposing an all-embracing design tool [4,5,6] that implements better design practices in respect to the current state of the art considering representative wave-to-wire models of WECs, technological and control boundaries, and economic evaluations. Recently, the use of heuristic optimizations gained popularity in the wave energy context due to their ability to deal with multi-objective targets even in the presence of numerous free variables. Two of the first application of a genetic optimization can be found in [7,8], where the SEAREV WEC was designed through a GA in a multi-objective framework with techno-economic considerations. Both constraints regarding the design and control optimization were implemented. In [4,5,6], several applications of genetic algorithms (GA) has been reviewed, and many recent works deal with the use of GA for WEC optimization. In [9], an extensive review of the layout optimization strategies of offshore parks was collected, focusing, among other things, on evolutionary computation techniques, which are the most widespread. In [10], a GA method was applied to optimize the orifice diameter and draft depth of an oscillating water column. In [11,12,13], various GAs were proposed to optimize the layouts of a WEC array; in [14], a differential evolution algorithm was used to optimize an oscillating buoy-type WEC relying on submerged buoy volume to power the capture ratio. In [15], which is an extension of [16], both GAs and particle swarm optimization were applied to the geometric optimization of different WEC types including manufacturability considerations. In [17], a holistic optimization method that relates both energy production maximization (for operational conditions) and structural assessment (for severe conditions) were proposed at an early stage of WEC development. Despite the fact that valuable insights into WEC design have been reported in previous works, they mainly promote the use of frequency-domain or simplified time-domain models in order to bound the computational time required to optimize the WEC architecture, and on simplified key performances that lack of techno-economic considerations. In particular, to the best of the authors’ knowledge, no unified guidelines or closed-form procedures are reported in the literature that effectively provide a design process with particular regard to the power take-off (PTO) system. Regarding the case of a hydraulic PTO (HPTO), Pedersen [18] assessed that “in references where the hydraulic PTO system is mentioned, this is generally a simple non-optimized fluid power transmissions with very limited efficiency”. In [19], a model-based design of a multiple cylinder HPTO for the Wavestar WEC [20] was proposed. The design relies on the transmission requirements, taking into account the efficiencies of the transmission components. In [21], which was an extension and a continuation of the research of [22], the authors investigated how the magnitude of the HPTO force influences the power capture ability of a two-raft-type WEC. According to Zheng, these would provide a valuable guidance for the optimal design of a PTO unit by altering the parameters of the hydraulic components. In [23], a parametric evaluation of the hydraulic transmission was carried out to highlight the influence of each variable on the capture width ratio of the device. Holistic optimization approaches were proposed in [24], where a GA is applied to the control parameters and the attachment point of the hydraulic cylinders to the absorber arms. The optimization was conducted on 8 different HPTO configurations. In [25], an HPTO system was optimised using a special GA optimisation tool in the Simcenter Amesim software [26]. The simulation results showed that GA was effective at determining the optimal configuration parameters of an HPTO system, such as the diameter of the piston, the diameter of the rod, accumulator capacity, accumulator pre-charge pressure, and hydraulic motor displacement. The objective of the work was to maximise the energy production of the system. In the work of Calvario [27], the GA was formulated as a constrained optimization problem with a death-penalty method, assigning a high cost to penalize infeasible solutions. The optimization aimed to maximize the average absorbed power. The decision variables were the distance of the mounting point of the cylinder and PTO control parameters. These variables were optimized with a heuristic approach based on the evolutionary computation already applied in [28,29].
Due to the proven effectiveness of holistic methods, this work applies a GA to design a well-known ISWEC (inertial sea wave energy converter) device [30] introducing a determinant innovation: the use of the spectral-domain modelling technique in a multi-objective design process. The proposed design logic was first introduced by Sirigu in [4] and applied to another device developed at the Politecnico di Torino, named PeWEC [31]. Afterwards, Carapellese [5] and Giorcelli [6] proposed a multi-objective optimization algorithm, know as non-dominated sorting genetic algorithm II (NSGA-II) [32], and compared it with the GA used in [4]. This work follows the optimization algorithm proposed in [4] introducing a thorough description of a HPTO, whereas previous optimizations was based on simpler electro-mechanical PTO. The spectral-domain model (SDM) applied to the ISWEC has been demonstrated to be more accurate than the frequency-domain model used in [4] and faster than its time-domain counterpart [33]. This allows to manage the time-consuming optimization process carried out by the GA in a reasonable time due to a fast and accurate SDM1. Moreover, the use of a frequency-domain model for the HPTO is not possible since no linear representation exists for a hydraulic transmission [35,36]. The work presents some techno-economic trends related to the ISWEC, focusing on a multi-objective evaluation of its performances in terms of: (I) the maximization of the annual energy production and (II) the minimization of the associated cost of energy. The ISWEC system will be optimized in respect to its main components: the hull, the gyroscope, and the PTO; their parametrization is presented and discussed along with the resultant techno-economic trends. The influence of the hull dimensions, gyroscope size, PTO components and control is reported against the objectives pursued by the GA optimization. Overall, the main outcome will be providing a detailed practice of optimising a WEC during its early-stage development through the use of SDMs, taking into account techno-economical aspects. This paper also shows how the SDM approach can be applied to various components, even those that are highly nonlinear, and still be implemented in a computationally demanding holistic optimization.
This work is organised in five sections: Section 2 presents the working principle of the ISWEC and its numerical model used into the design tool; Section 3 illustrates the architecture of the design tool and the parametrisation of the ISWEC, explaining how a single solution is evaluated on the sea-site of interest; Section 4 discusses the optimization results. Some final remarks are given in Section 5.

2. The ISWEC Concept

An ISWEC device is a well-known gyroscope based WEC developed by the Marine Offshore Renewable Energy Lab (MOREnergyLab). It is composed of a sealed hull carrying two or more gyroscopic units inside, as shown in Figure 1.
Each unit is constituted of a flywheel driven by an electric motor, which is mounted on a support frame that is directly connected to an electrical generator. The wave energy is captured by damping the rocking motion of the floater by controlling the oscillation of the gyroscopes. Notwithstanding the energy required to keep the flywheel in rotation, the possibility to regulate its speed allows the adaptation of the natural resonant frequency of the system to the incoming wave [37,38]. Moreover, the ISWEC resonance could be enhanced through the so-called U-tank, a U-shaped water tank installed inside the floater, used to tune the pitch resonance frequency as a function of the prevalent incoming wave period [39]. However, the use of U-tank technology requires a different design of the ISWEC, accounting for its encumbrances and morphology, which affect both its fabrication and its dynamic behaviour. Its technological and control aspects are still under study. Therefore, the U-tank system is neither reported in Figure 1 nor considered in this paper. The gyroscope mechanical energy can be converted into electrical energy through different PTO technologies. The gyroscope and PTO components are enclosed within the main structure, ensuring low maintenance and risk of failure. A detailed description of the ISWEC device components, along with its technological concept, can be found in [40,41,42].

2.1. Time-Domain Model

A time-domain model (TDM) represents an appealing solution to provide the final steps toward cost and performance estimates of a WEC system due to its ability to model non-linear hydrodynamic effects [43], to test complex control algorithms [44], and to simulate complex WEC subsystems [45] or structural components [46]. For a TDM, a generic non-linear state-space equation reads:
M X ¨ + B X ˙ + K X + Θ ( X , X ˙ , X ¨ ) = f ( t )
System (1) includes the state variable of interest X , the mass matrix M , the damping matrix B , the stiffness matrix K , the non-linear function Θ ( X , X ˙ , X ¨ ) and the external forces f ( t ) . The non-linear term Θ ( X , X ˙ , X ¨ ) includes several non-linearities involving the gyroscope and, depending on the ISWEC architecture, the PTO. The TDM presented hereafter is reported with the purpose to make explicit the equations used to derive its spectral-domain counterpart. In fact, the SDM is derived from the non-linear equations that describe the dynamic behaviour of the system in the time-domain.

2.1.1. Floater and Gyroscope System

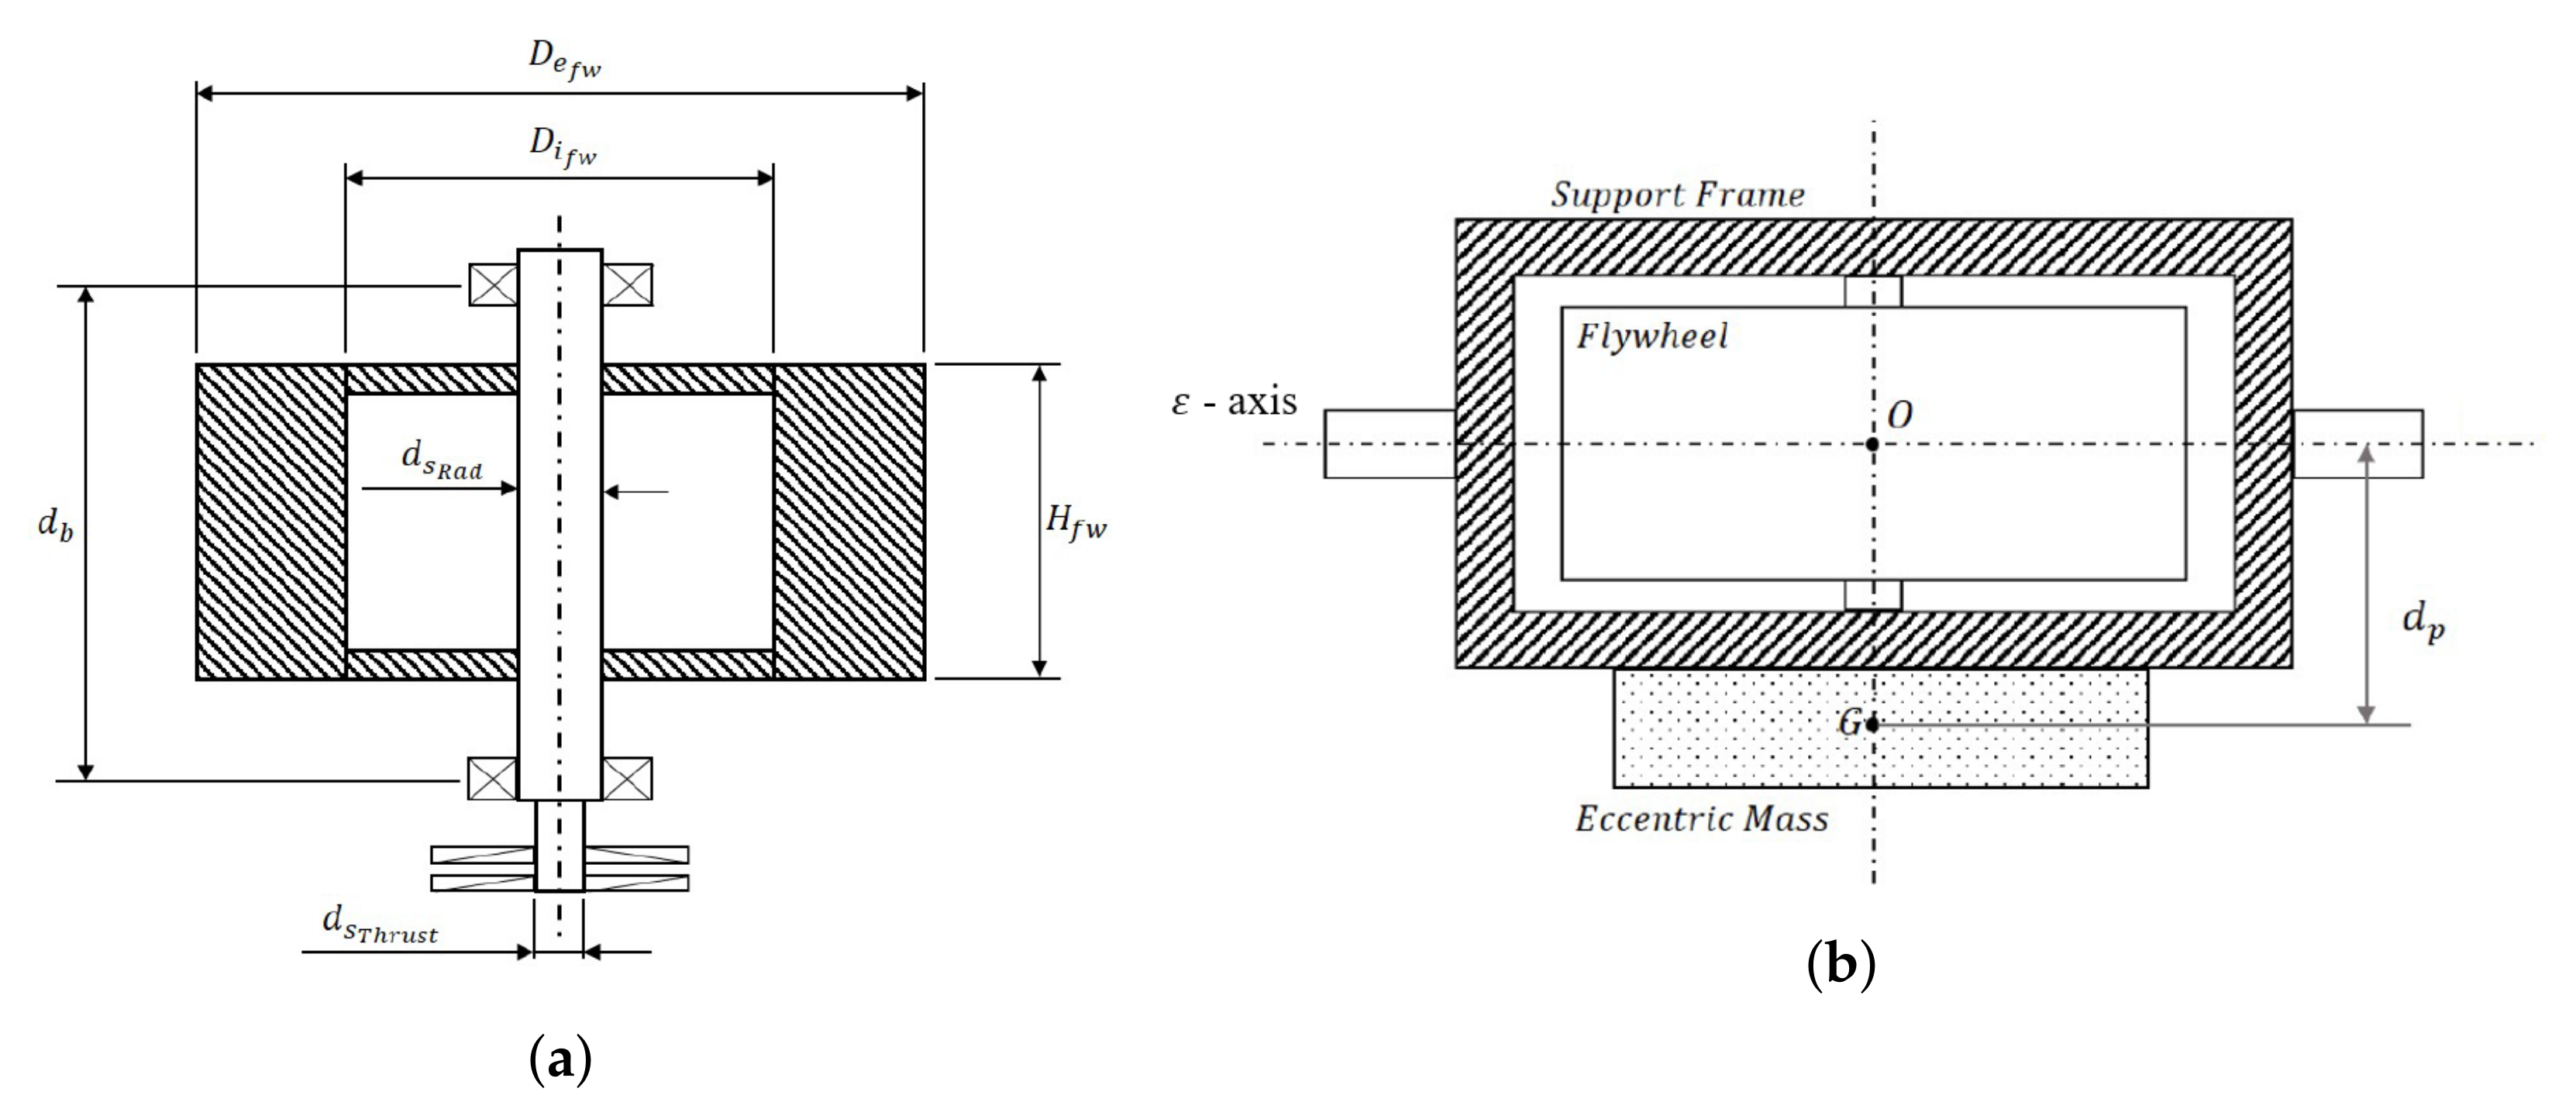
For the hydrodynamic model, Cummins’ equation [47] is used here with the assumption of linear potential flow theory [48] and mono-directional waves aligned with the longitudinal axis of the hull, as shown in Figure 2a. Concerning the gyroscope equation, a single degree of freedom (DoF) model of the gyroscope is considered coherently with the hypothesis of a mono-directional wave and the planar motion of the floater. The gyroscopic system is excited only along its precession axis, indicated with ε (see Figure 2b). Moreover, an eccentric mass, named the pendulum in Figure 2b, is fixed at the support frame of the gyroscope, avoiding the stalling position of the gyroscope around its 90 deg orientation due to the cancellation of the gyroscopic effect [42].
The floater-gyroscope equations read:
M f + A ( ) X ¨ f + C R ζ + D R X ˙ f + K f X f = f E ( t ) f g f
ζ ˙ = A R ζ + B R X ˙ f
I g ε ¨ + m p d p g sin ( ε ) = J φ ˙ δ ˙ cos ( ε ) T H P T O
where X f = x z δ T are the floater planar DoFs, M f is the inertia matrix, A ( ) is the added mass contribution evaluated for an infinite oscillation frequency, K f is the hydrostatic stiffness matrix, f E ( t ) is the wave excitation force, and f g f = 0 0 J φ ˙ ε ˙ cos ( ε ) T is the gyroscopic reaction acting on the hull, where J is the rotational inertia of the flywheel, φ ˙ is the angular speed of the flywheel, and ε and ε ˙ are the angular displacement and velocity of the gyroscope, respectively. The vector ζ represents the state vector that approximates the radiation force contributions through the state space matrices A R , B R , C R and D R [49]. I g is the inertia of the gyroscope around the precession axis, m p is the pendulum mass, and d p is the distance between the centre of mass of the pendulum and the ε DoF. T H P T O indicates the HPTO reaction on the gyroscope.

2.1.2. Hydraulic PTO

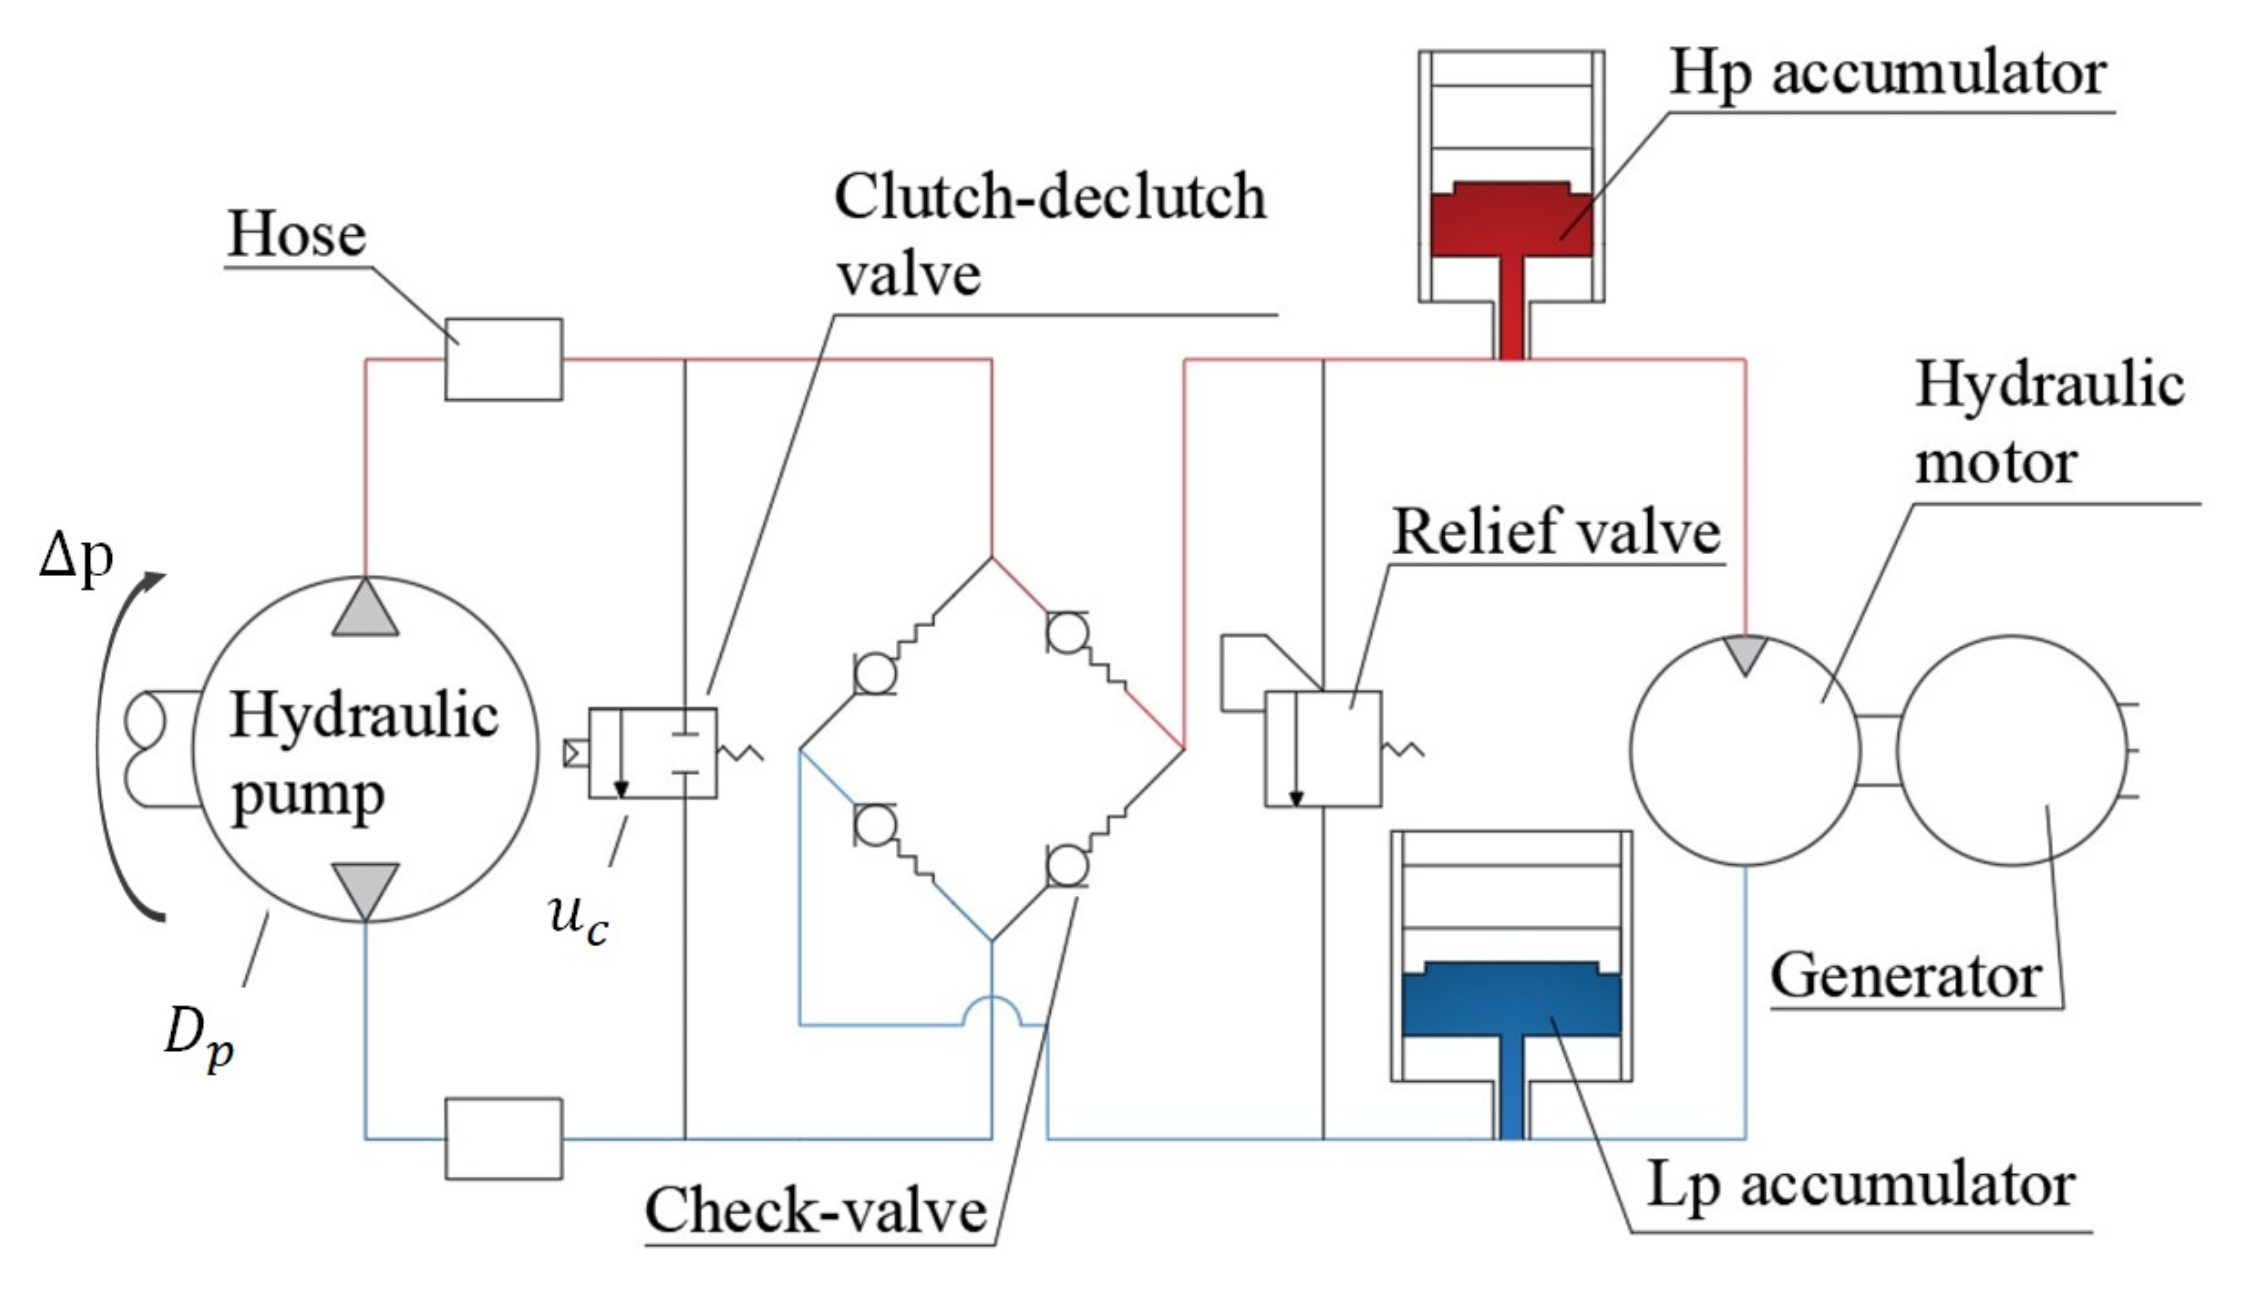
For our system, the HPTO architecture is shown in Figure 3. The prime mover (the gyroscope) is coupled to a hydraulic pump which is in a closed-circuit connection with a hydraulic motor. At the other end of the transmission, pressurised fluid is used to move a rotary hydraulic motor coupled with an electrical generator. A clutch-declutch valve is installed to perform the well-known declutch control [50,51]. Downstream of the clutch-declutch valve, a Graetz bridge, composed of four check-valves, is employed to rectify the bi-directional flow generated by the oscillating motion of the pump. Two cylinder-type accumulators are used to smooth the flow fluctuations and to provide a minimum charge pressure for the low-pressure ram in order to avoid cavitation. A simplified model of the HPTO is considered here to derive its spectral-domain version [35]. As proposed in [52,53], under the assumption of large high-pressure and low-pressure accumulators, the downstream of the hydraulic transmission is decoupled from the upstream part, and the pressure drop over the hydraulic pump and motor is considered as a constant. Thus, the magnitude of the T H P T O depends only on such a pressure drop Δ p and the pump displacement D p as follows:
T H P T O = u c sign ( ε ˙ ) Δ p D p
Under this simplification, the system is truncated to the ε variable since the hydraulic PTO states, such circuit pressures, accumulator volumes and motor-generator speed, are not considered. The pressure drop Δ p is considered as a control parameter, and u c is the clutch-declutch variable, equal to 0 or 1 depending on the angular speed of the hydraulic pump [34,35,50]. The accuracy of this simple formulation is questionable in the presence of small accumulators since their dynamic behaviour could influence the power extraction of the whole system. In this regard, a TDM model that accounts for the accumulation system, the relief valve, the hydraulic motor and generator, should be used to accurate predict the transmission power performances. On the other hand, this formulation is justified by the need of derive a spectral-domain framework for the HPTO, with the main aim to improve the computational efficiency of the ISWEC design at an early stage. Despite the fact that the ISWEC system has been already deployed in full-scale, the research effort behind its development is not over, driven by the need to make the resultant cost of energy economically competitive. Since no previous work analysed the ISWEC with a HPTO, representing a promising solution to reduce the device cost, the design stage proposed here has to be considered an early stage, in which a novel mathematical representation (spectral-domain) has been implemented to speed up the optimization process. Further works will deal with the TDM applied to design the whole hydraulic transmission.

2.2. Spectral-Domain Model

The spectral domain is a modelling technique based on probabilistic models of a system with the assumption that its input may be represented as a stochastic ergodic process [54,55]. In order to obtain an approximate solution of the generic time-domain Equation (1), it is useful to introduce an equivalent linear system, as follows:
M S X ¨ + B S X ˙ + K S X = f ( t )
where X is the augmented state vector comprising the hull states ( X f ), the radiation states ( ζ ) and the precession angle of the gyroscope ( ε ). The matrices M S , B S and K S are defined as:
M S = M + M e q
B S = B + B e q
K S = K + K e q
The matrices (7) are composed of a linear part, concerning the linear terms of the time-domain Equation (1), and an equivalent part indicated with the subscript “ e q ” [36,56]. Under the assumption of a Gaussian distribution of the system response, in order to minimize the mathematical expectation of the difference between the non-linear system and the linearised system, the equivalent matrices can be calculated as follows:
M e q = X ¨ Θ
B e q = X ˙ Θ
K e q = X Θ
where the operator X indicates the gradient with respect to the vector X , and · is the expected value operator. The equivalent matrices could be interpreted as a statistical representation of the time-varying behaviour of the system in time-domain. In fact, as reported in Equation (1), the non-linear time-domain function can be seen as time-varying inertial, damping and stiffness coefficients that are statistically linearised. Then, the linearised matrices can be used to compute the transfer function between the wave forces and the ISWEC states as:
H f X ( ω ) = I ω 2 M S + i ω B S + K S
where ω is the wave frequency, and I is an identity matrix of appropriate dimension. Similarly to a frequency-domain model, the WEC output statistics are obtained through the power spectral density (PSD) of the input wave force and the linear transfer function of the WEC, as follows:
S X X ( ω ) = H f X ( ω ) S f f ( ω ) H f X * ( ω )
where H f X represents the WEC numerical model in the spectral domain, and S f f ( ω ) is the PSD of the input wave force. The operator * stands for the complex-conjugate transpose. An SDM represents an intermediate solution between the time and frequency domains that exploits a statistical linearisation method to include non-linear effects inside the simulation. No analytical solution exists to this problem, and an iterative procedure is employed [36,54]. This modelling technique founds its main application in other engineering fields, e.g., wind loading and earthquake response calculations [55]. In the WEC industry, the first application dates back to 1983, when Gudmestad [57] applied an SDM to solve the dynamics of a floating offshore structure. More recent applications of the spectral-domain technique applied to WECs are reported in [36,56,58,59]. The full analytical description of the SDM for the ISWEC is derived in [34,35], demonstrating the high potential associated with this modelling framework: an almost perfect overlap between the SDM and TDM of the HPTO is reported for most of the control conditions of the ISWEC, while the reduction in computational time is demonstrated to be, at least, one order of magnitude between the two models. Hereafter, the resulting SDM equations are shown, which will feed into the GA presented in this paper.
The linear terms M , B and K can be defined as:
M = M f + A ( ) 0 0 0 0 0 0 0 I g
B = D R 0 0 B R I 0 0 0 0
K = K f C R 0 0 A R 0 0 0 0
The terms 0 and I are zeros and identity matrices of appropriate dimensions. The ISWEC shows non-linearities in term of gyroscope actions, pendulum elastic recall, and a constant-amplitude coulomb-like PTO torque acting on the gyroscope axis. The equivalent matrices are obtained as follows:
M e q = 0
B e q = 0 0 0 0 0 0 0 0 0 0 0 0 0 0 J φ ˙ cos ( ε ) 0 0 0 0 0 0 0 J φ ˙ cos ( ε ) 0 T H P T O ε ˙
K e q = 0 0 0 0 0 0 0 0 0 0 0 0 0 0 J φ ˙ ε ˙ sin ( ε ) 0 0 0 0 0 0 0 0 0 m p d p g cos ( ε ) J φ ˙ δ ˙ sin ( ε )

2.2.1. Floater and Gyroscope Equations

For what concerns the stiffness matrix K e q , the term J φ ˙ ε ˙ sin ( ε ) is zero since ε ˙ and ε are uncorrelated [60] with zero-mean, and the sin ( · ) function is odd. Second, the pendulum contribution and the gyroscopic effect are linearised as follows [35]:
m p d p g cos ( ε ) = m p d p g e σ ε 2 2
J φ ˙ δ ˙ sin ( ε ) = J φ ˙ 2 π σ δ ˙ σ ε 1 ρ δ ˙ ε 2 δ ˙ sin ( ε ) e 1 2 1 ρ δ ˙ ε 2 δ ˙ 2 σ δ ˙ 2 2 ρ δ ˙ ε δ ˙ ε σ δ ˙ σ ε + ε 2 σ ε 2 d δ ˙ d ε
where σ ε are σ δ ˙ are the standard deviations of the gyroscope precession motion and the pitching rate, respectively, ρ δ ˙ ε = σ δ ˙ ε σ δ ˙ σ ε is the correlation coefficient of δ ˙ and ε , and σ δ ˙ ε is the covariance between δ ˙ and ε . Considering the equivalent damping matrix B e q , the term J φ ˙ cos ( ε ) can be derived as:
J φ ˙ cos ( ε ) = J φ ˙ e σ ε 2 2

2.2.2. Hydraulic PTO Equation

The HPTO torque defined in Equation (5) can be redefined as a piecewise constant function of the declutch and clutch speed limits ε ˙ c and ε ˙ d with the following formulation [35]:
T H P T O = 0 if ε ˙ d < ε ˙ < ε ˙ d Δ p D p ε ˙ c ε ˙ d ( ε ˙ ε ˙ d ) if ε ˙ d ε ˙ < ε ˙ c Δ p D p ε ˙ c ε ˙ d ( ε ˙ + ε ˙ d ) if ε ˙ c < ε ˙ ε ˙ d Δ p D p if ε ˙ ε ˙ c Δ p D p if ε ˙ ε ˙ c
Then, its spectral domain representation can be derived as:
T H P T O ε ˙ = Δ p D p ε ˙ c ε ˙ d erf ε ˙ c 2 σ ε ˙ erf ε ˙ d 2 σ ε ˙
From the hypotheses of a Gaussian sea as an input and Gaussian variables as an output, the expected value of the gross power extracted from the hydraulic pump follows [36,56]:
P ¯ g = Δ p D p ε ˙ c ε ˙ d erf ε ˙ c 2 σ ε ˙ erf ε ˙ d 2 σ ε ˙ ε ˙ 2 = = Δ p D p ε ˙ c ε ˙ d erf ε ˙ c 2 σ ε ˙ erf ε ˙ d 2 σ ε ˙ σ ε ˙ 2
Concerning the net power, the hydraulic circuit efficiency has to be considered for a correct quantification of its power extraction capabilities. Through the expected values of the mean absolute pump torque and angular speed, the expected pump efficiency is computed via the lookup table reported into the supplier catalogues (Bosch Rexroth in our case [61]). The motor-generator efficiencies along with the circuit power losses are considered constant and derived from the supplier catalogues and from the analyses reported in [62]. The circuit efficiency is fixed to 95% to obtain an average global efficiency ranging from 70% to 80% [62,63]. Then, the net power expression follows:
P ¯ n = P ¯ g η ¯ p η c η m g
where η ¯ p is the expected value of the pump efficiency, η c is the hydraulic circuit efficiency, and η m g the motor-generator efficiency.

3. Design Tool Architecture

The optimization tool proposed here implements three consecutive steps, explained in detail hereafter and reported in Figure 4:
  • Single device definition;
  • Single device optimization;
  • Key performance calculation.
Due to its numerical formulation and architecture, the hydraulic system should be evaluated both with an SDM and TDM. For the purpose of this work, the ISWEC device is designed accounting for the hull, gyroscope and the upstream part of the HPTO, considering only the hydraulic pump and its control. Further optimizations will be required to optimize the remaining components of the HPTO (accumulators, hydraulic motor and electrical generator) since only a time-domain framework is suitable to simulate all the hydraulic transmission [34,35]. An early optimization stage based on the SDM is suggested due to the high computational effort required by the TDM that is impossible to be used to design the whole system.

3.1. Device Parametrization and Assumptions

The number of parameters that describes the ISWEC device can be numerous and not handy to manage, especially in a preliminary design phase. Therefore, some simplifications and assumptions are needed to relate some system parameters in order to uniquely define a device. Here, 12 free parameters are chosen to describe the ISWEC, summarised in Table 1 and hereafter discussed in detail: six for the hull, four for the gyroscope and two for the HPTO. For what regards the hull and the gyroscope, the lower and upper bounds (LB and UB, respectively) of the optimization parameters have been chosen according to technological and manufacturing constraints, derived both from experience gained on two full-scale ISWEC prototypes deployed in the Mediterranean Sea and from limits imposed by the shipyards considered for system fabrication. Concerning the bearings and the hydraulic pump, they depend on commercial components available on the market, and the GA considers them as a “single solution on catalogue”, as explained hereafter. Then, the hydraulic control refers to four different available logics to be implemented, and it is still considered as an integer “id”.

3.1.1. Floater Geometry and Parameters

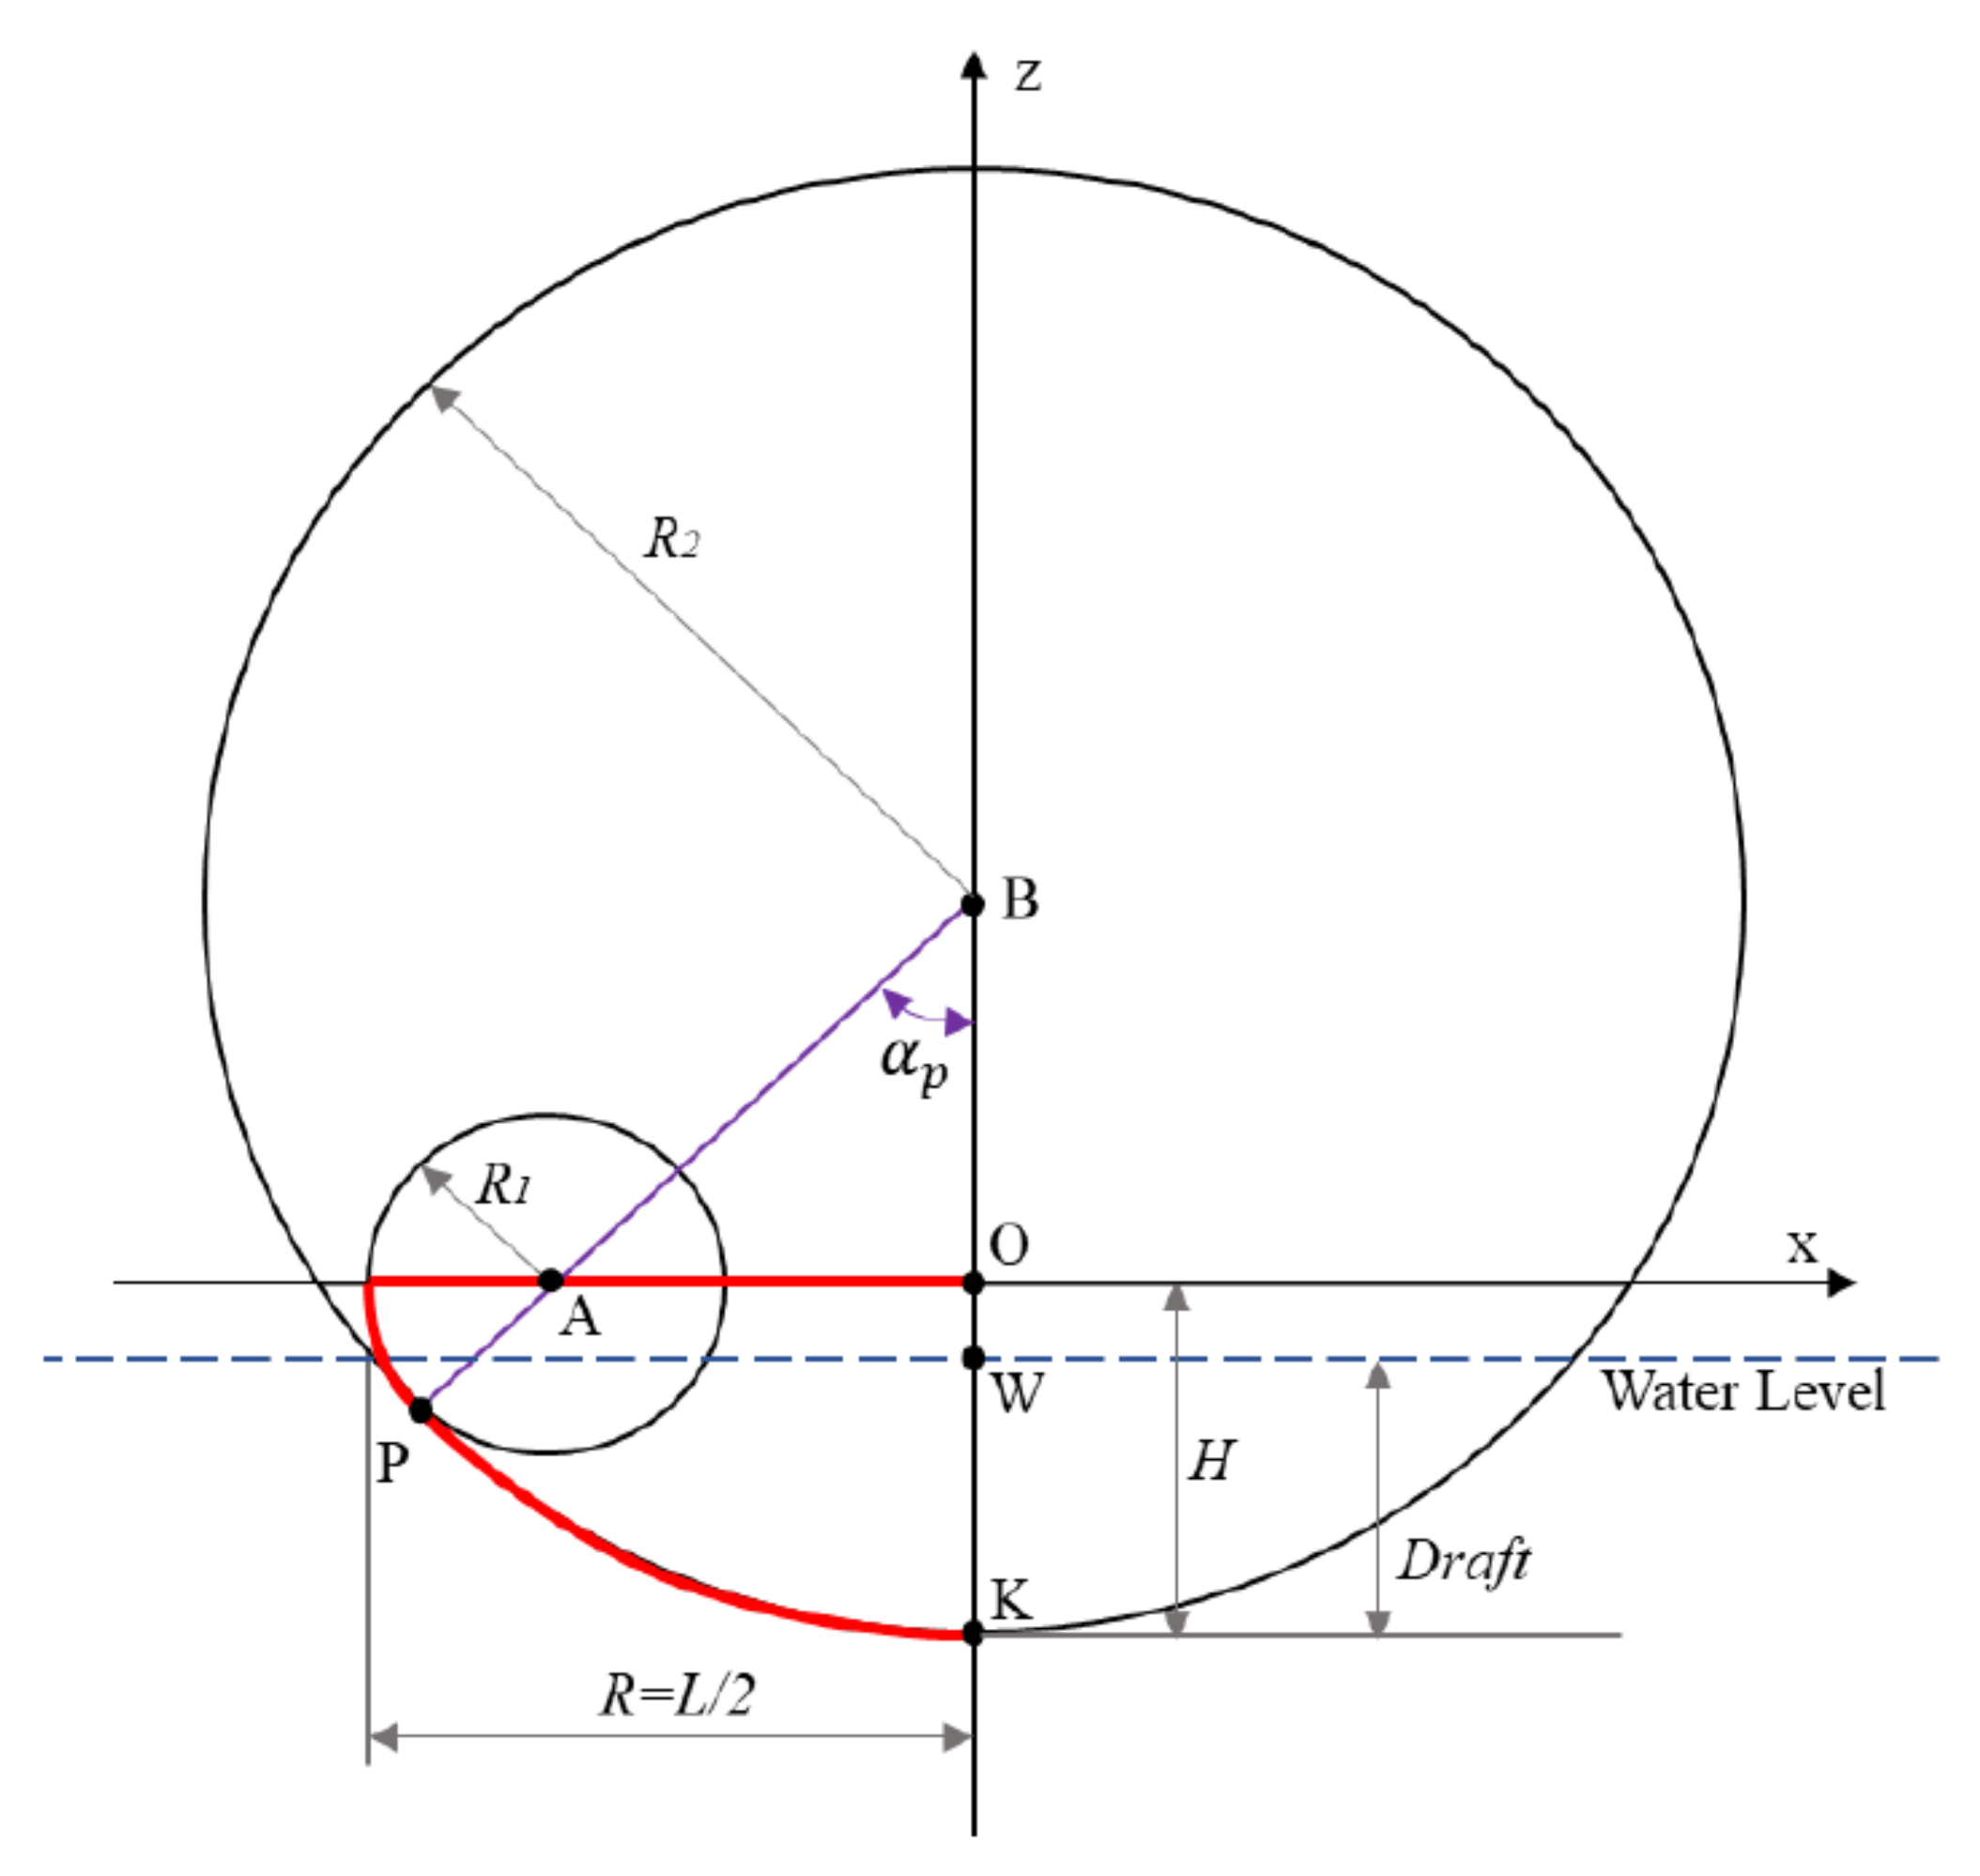
The floater shape and its inertial properties play an important role in the dynamics and power absorption of the device. The hull parametrization is based on a previous work of the authors [4] and relies on past experience gained in developing the full-scale prototypes of the ISWEC. For both technological effectiveness [64] and hydrodynamic performance (minimal viscous damping along the pitch degree of motion [65]), the hull profile is assumed to be cradle-shaped; then, it can be composed of a bottom circumference tangential to two circumferences in the bow/stern sections, while the transversal section is extruded for all the hull width, resulting in a floater symmetrical with respect to the y z and x z planes, as shown in Figure 5. A subset of six independent geometrical and inertial parameters is defined, which are used in the GA:
  • L = 2 R : length of the floater;
  • W f = W / ( W g × n g y r o s ) : hull width factor. It defines the width of the hull W as a function of the gyroscope unit dimension W g and the number of gyroscopic units n g y r o s ;
  • h = x A / R : bow/stern circumference ratio;
  • k = D / H : height ratio;
  • δ 0 = tan 1 H D R : maximum pitching angle, defined as the maximum pitch rotation to avoid the deck to be submerged. It defines the hull draft D function of the floater semi-length R and the floater height H;
  • B F R : ballast filling ratio, which is defined as the ratio of ballast located in aft/fore ballast tanks over the total ballast ( B F R = 1 : all the ballast is stored in aft/fore ballast tanks; B F R = 0 : all the ballast is stored in the bottom ballast tank).
Therefore, the floater profile can be expressed uniquely as a function of these design parameters:
R 1 = R x A = R ( 1 h )
z B = R k 2 + 1 + 2 k h 2 h 2 k 2 2 h
R 2 = z B + H = z B + R 1 k t a n ( δ 0 )
α p = sin 1 z B x A
where x A is derived from h and R. Then, the floater profile function z ( x ) can be defined as:
z ( x ) = R 1 2 x x A 2 if R < x < R 2 sin ( α p ) z B R 2 2 x x B 2 if R 2 sin ( α p ) < x 0
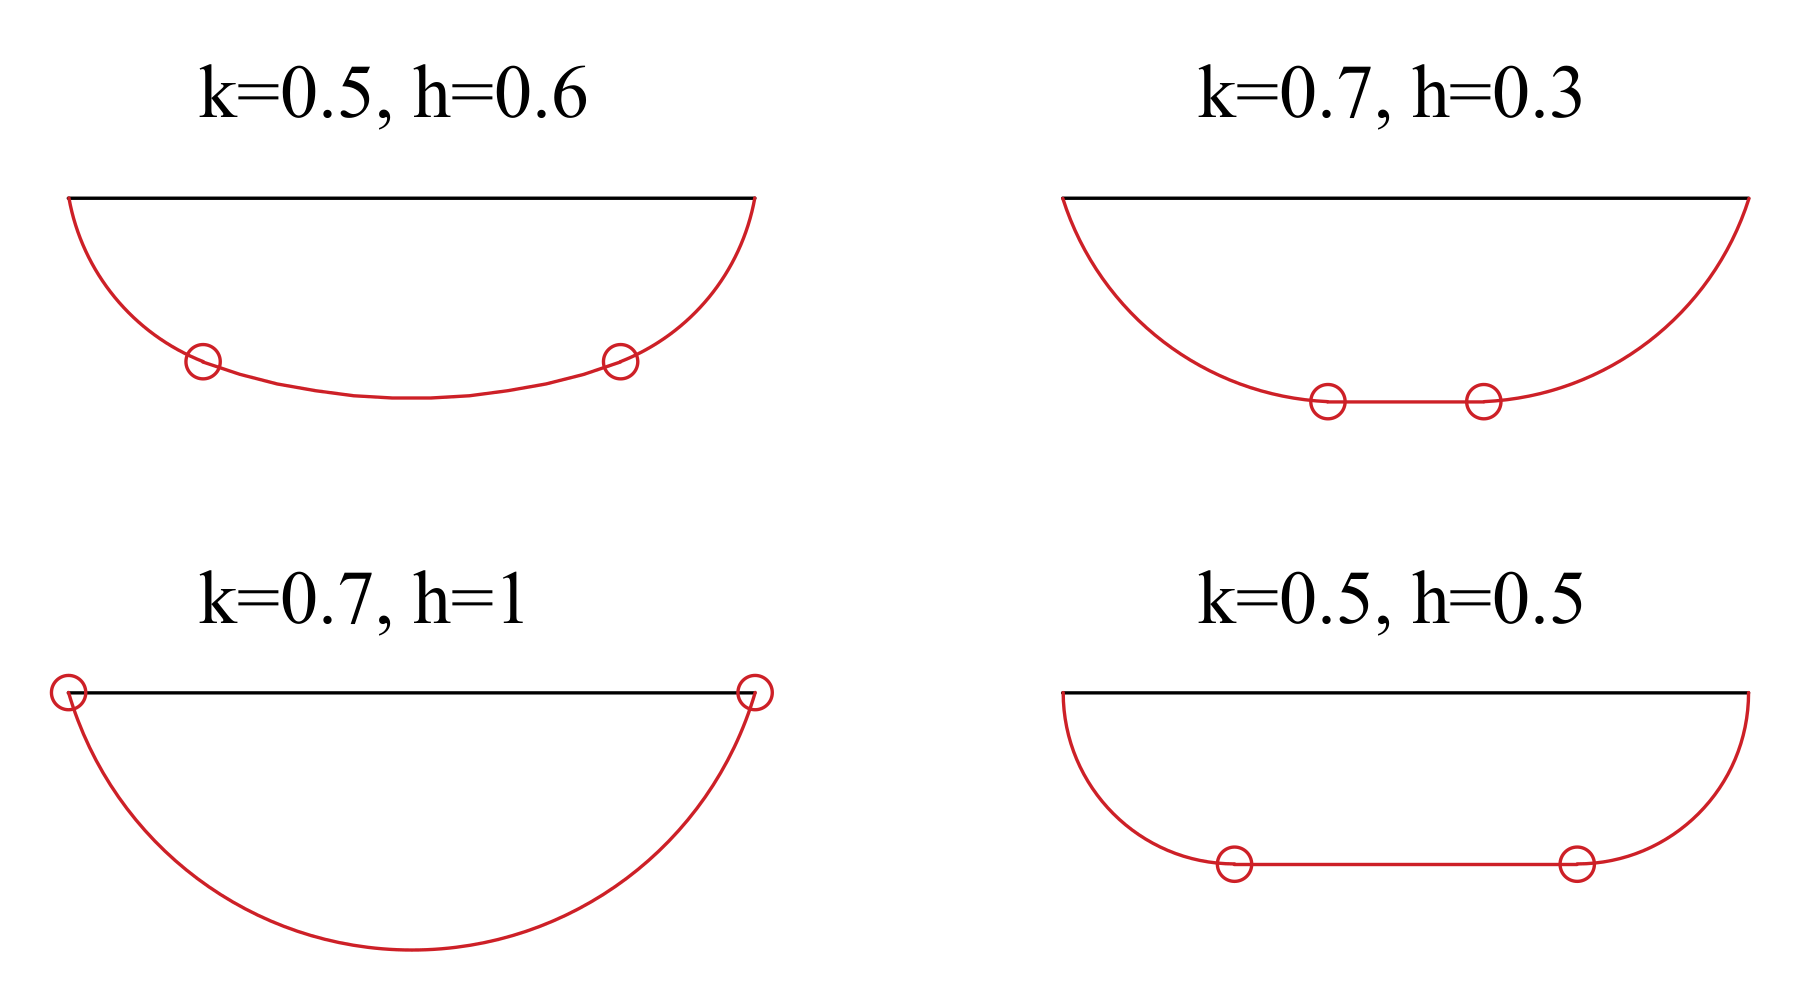
Figure 6 shows how the geometrical ratios k and h influence the hull profile for a fixed hull length.
For what concern the ballast filling ration B R F , a schematic example of different filling ratios B F R is shown in Figure 7. The hull material is considered to be concrete to reduce the device costs with respect to a steel-made hull. Then, assuming the walls of the floater as thin plates, the equivalent structural thickness can be calculated from the lateral surface of the floater and the hull mass, making the computation of inertial properties of the hull possible.

3.1.2. Gyroscope Parameters

The gyroscope represents the core of the energy conversion, and its geometrical optimization influences the maximization of power absorption, its costs and construction feasibility. Through the experience gained from the full-scale devices deployed in the Pantelleria and Adriatic Seas, the technological solution shown in Figure 2b is considered the most effective in terms of construction feasibility and costs. Two design parameters are used for the gyroscopic system:
  • J: the flywheel inertia about its vertical rotational axis. J determines the angular momentum of the gyroscope, and it is used to derive its dimensions;
  • n g y r o s : the number of gyroscopic units inside the hull. The realization of one single gyroscope with a high inertia J can result in high loads and costs. Moreover, the device will be not balanced on the roll axis since the precession motion of one single gyroscope affects the equilibrium around the α -axis of the floater.
With reference to Figure 8a, the flywheel structure can be simplified as a hollow cylinder for which the geometrical properties are defined by an external diameter, D e f w , an internal diameter D i f w , and a height H f w , expressed as follows:
D e f w = 2 J 0.5 π ρ f w ( 1 0 . 75 4 ) 0.2
D i f w = 0.75 D e f w
H f w = 0.5 D e f w
This parametrization is derived from the full-scale prototype deployed in 2015 in Patelleria (Italy) [66]. Then, the derivation of the principal moments of inertia for a hollow cylinder about its rotational axis is straightforward. Similar to the flywheel, the inertial ratios are derived from the ISWEC full-scale device design experience. Finally, it is assumed that the overall dimensions of the gyroscope unit are a linear function of the flywheel external diameter.
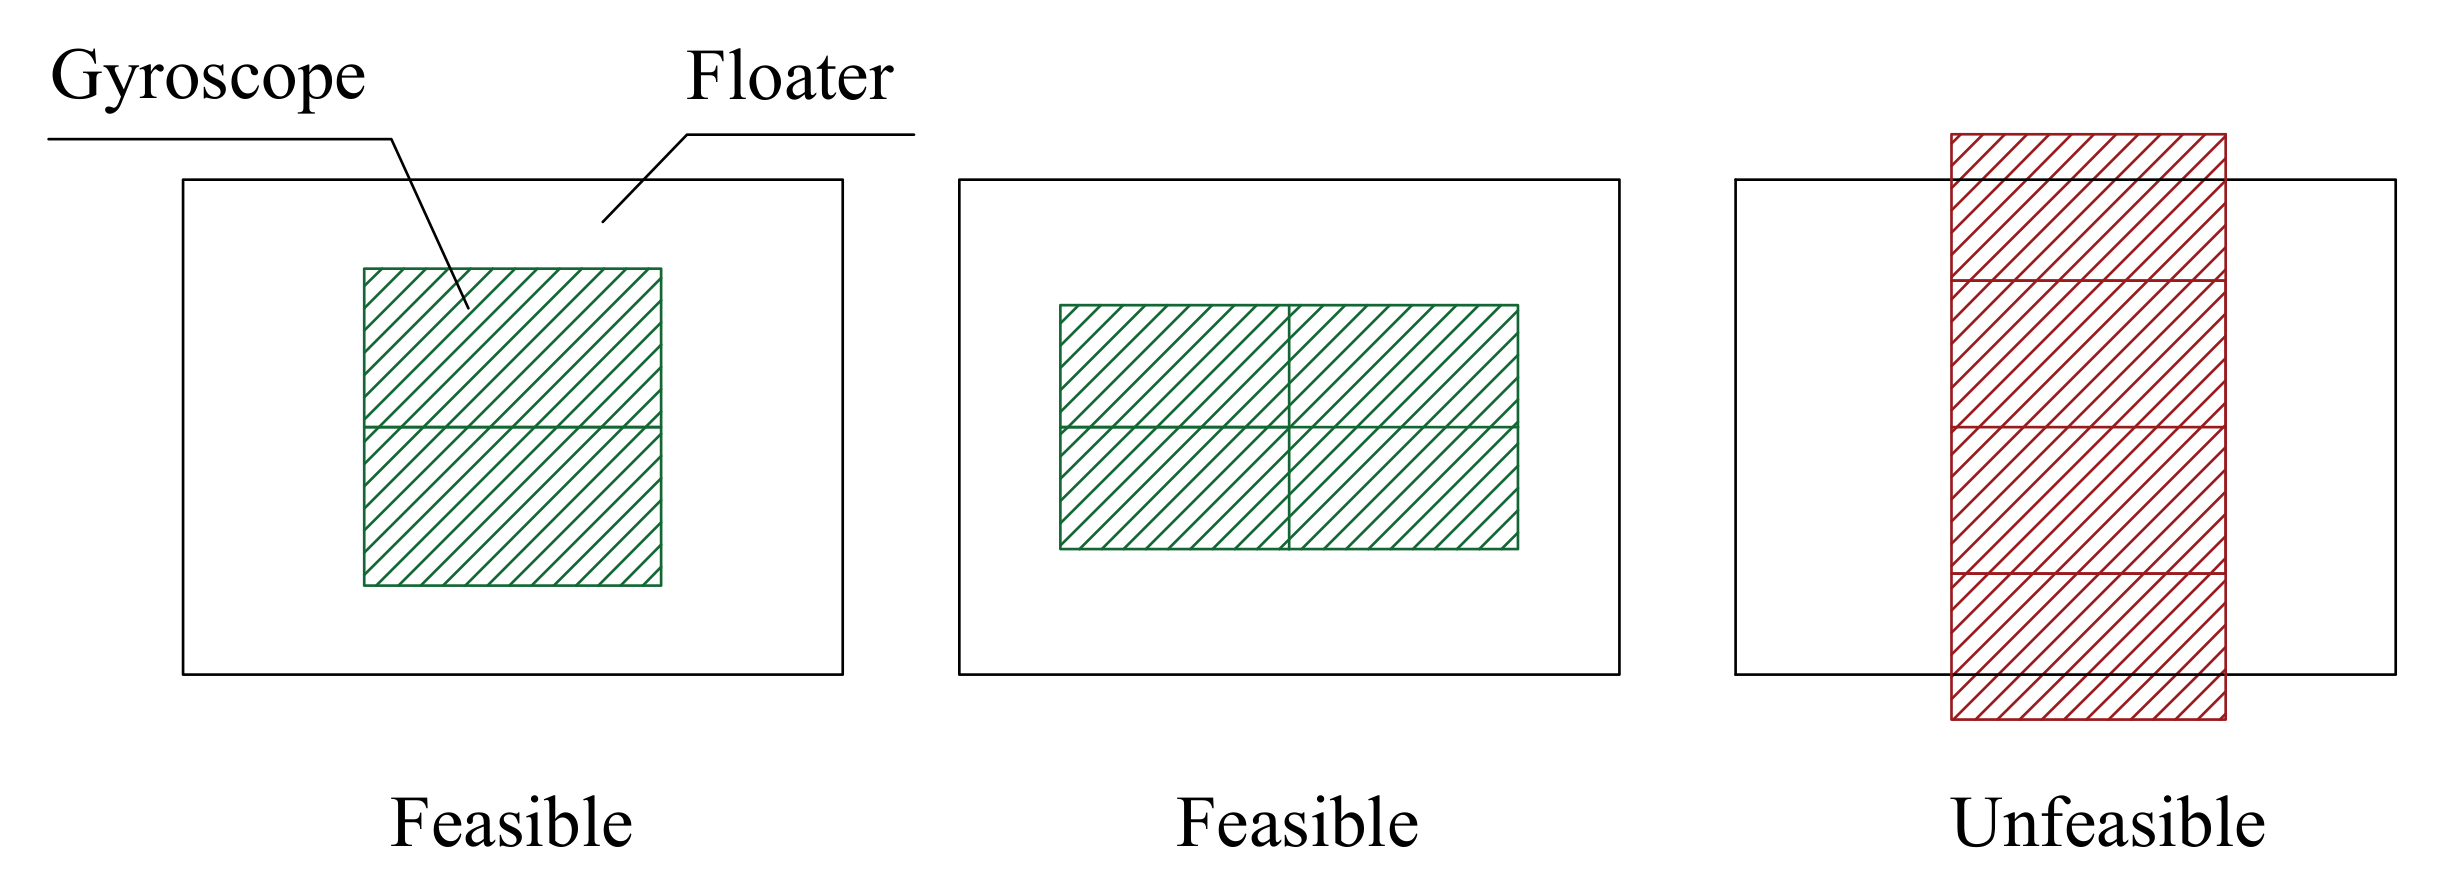
The verification of the internal encumbrances represents one of the feasibility checks performed. The number of gyro units n g y r o s influence this feasibility check. It is assumed that the gyroscopic units are an even number to avoid roll torques on the hull. The algorithm tries to locate the units along the y-axis of the floater, and, if the total width of the gyroscope units exceeds the hull width, it tries to arrange the units in two parallel and adjacent lines. The aim is to fit all the gyros into the floater in relation to their dimensions. Examples of two feasible and one unfeasible arrangement are depicted in Figure 9.
The parameter used to define the pendulum subsystem is its mass m p , which, combined with the distance d p , determines the magnitude of the elastic recall provided on the gyroscope around its precession axis. Figure 8b shows the scheme of the pendulum installed at the base of the flywheel support frame in the x z reference plane. It is assumed that the distance d p between the precession of the gyroscope and the centre of gravity of the eccentric mass is equal to the flywheel height:
d p = H f w
Then, given the mass and the distance of the eccentric mass, it is possible to compute the inertia tensor of the pendulum.

3.1.3. Flywheel Bearings

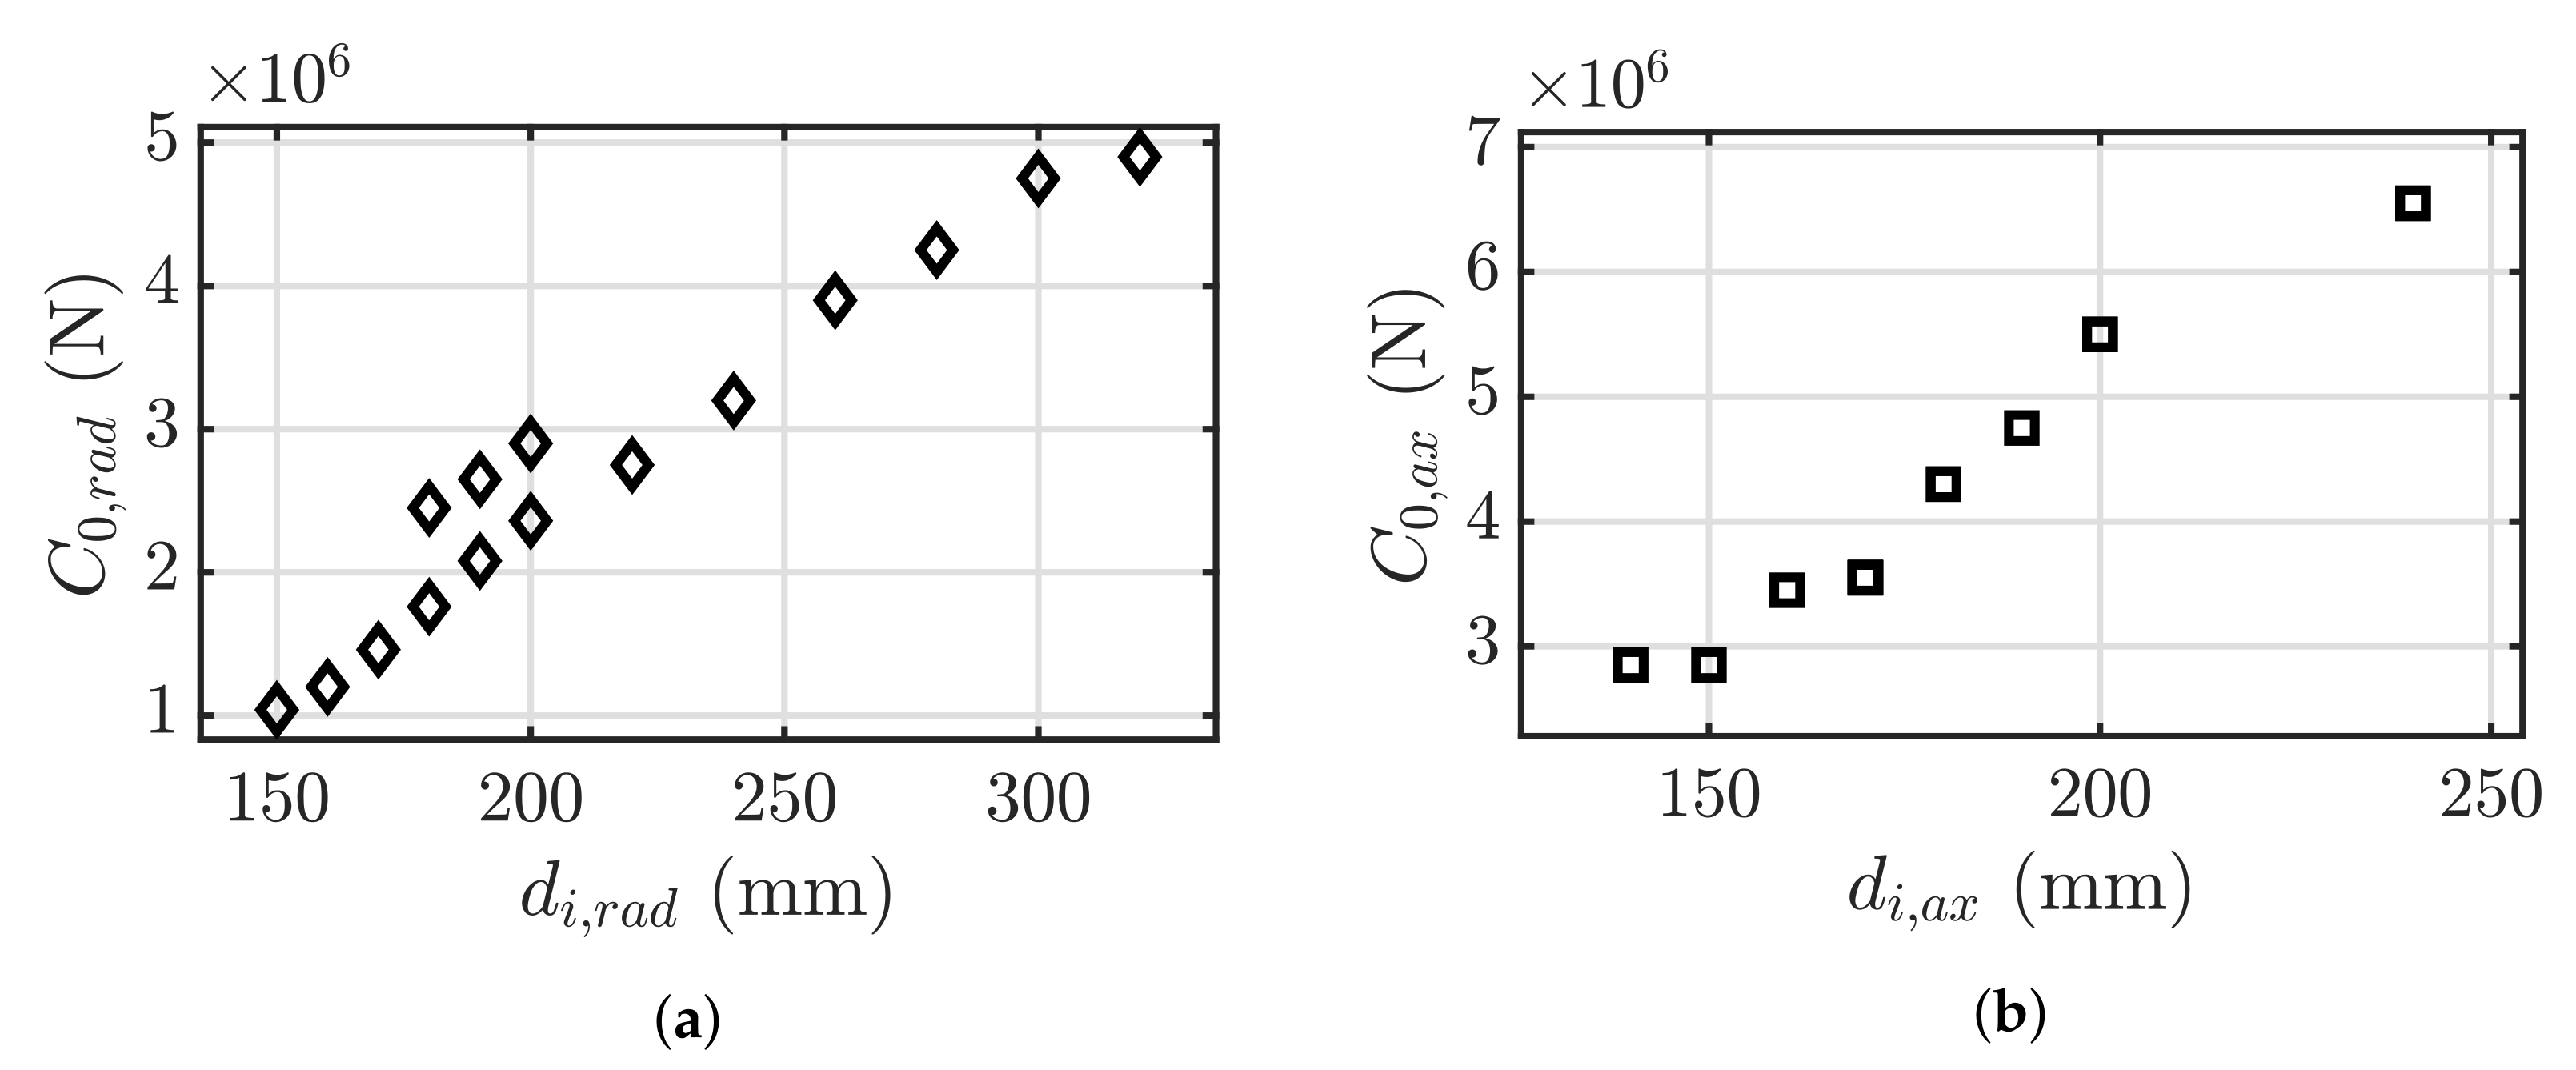
The flywheel bearings affect both the power losses of the system and its lifespan, determining part of the power consumed by the flywheel motor and the maximum gyroscopic load tolerable. The maximum static load is given in the bearing SKF catalogue [67]; during the optimization of the system control parameters, a load verification is performed. A total of 15 representative bearings couples are defined with the features shown in Figure 10, and the related optimization parameter is named I D b . Such diagrams relate the inner diameter of the radial and axial bearings with their admissible static load. The optimization algorithm chooses from these bearing combinations to determine the optimal solution to fit the requirement of admissible loads (large bearings) and low power losses (small bearings). The distance between the radial bearings d b is supposed to be related to the flywheel height H f w as follows:
d b = 1.75 H f w
Each bearing considered has been modelled according to the SKF catalogue [67] to carry out the power losses associated with it.

3.1.4. Hydraulic PTO Parameters

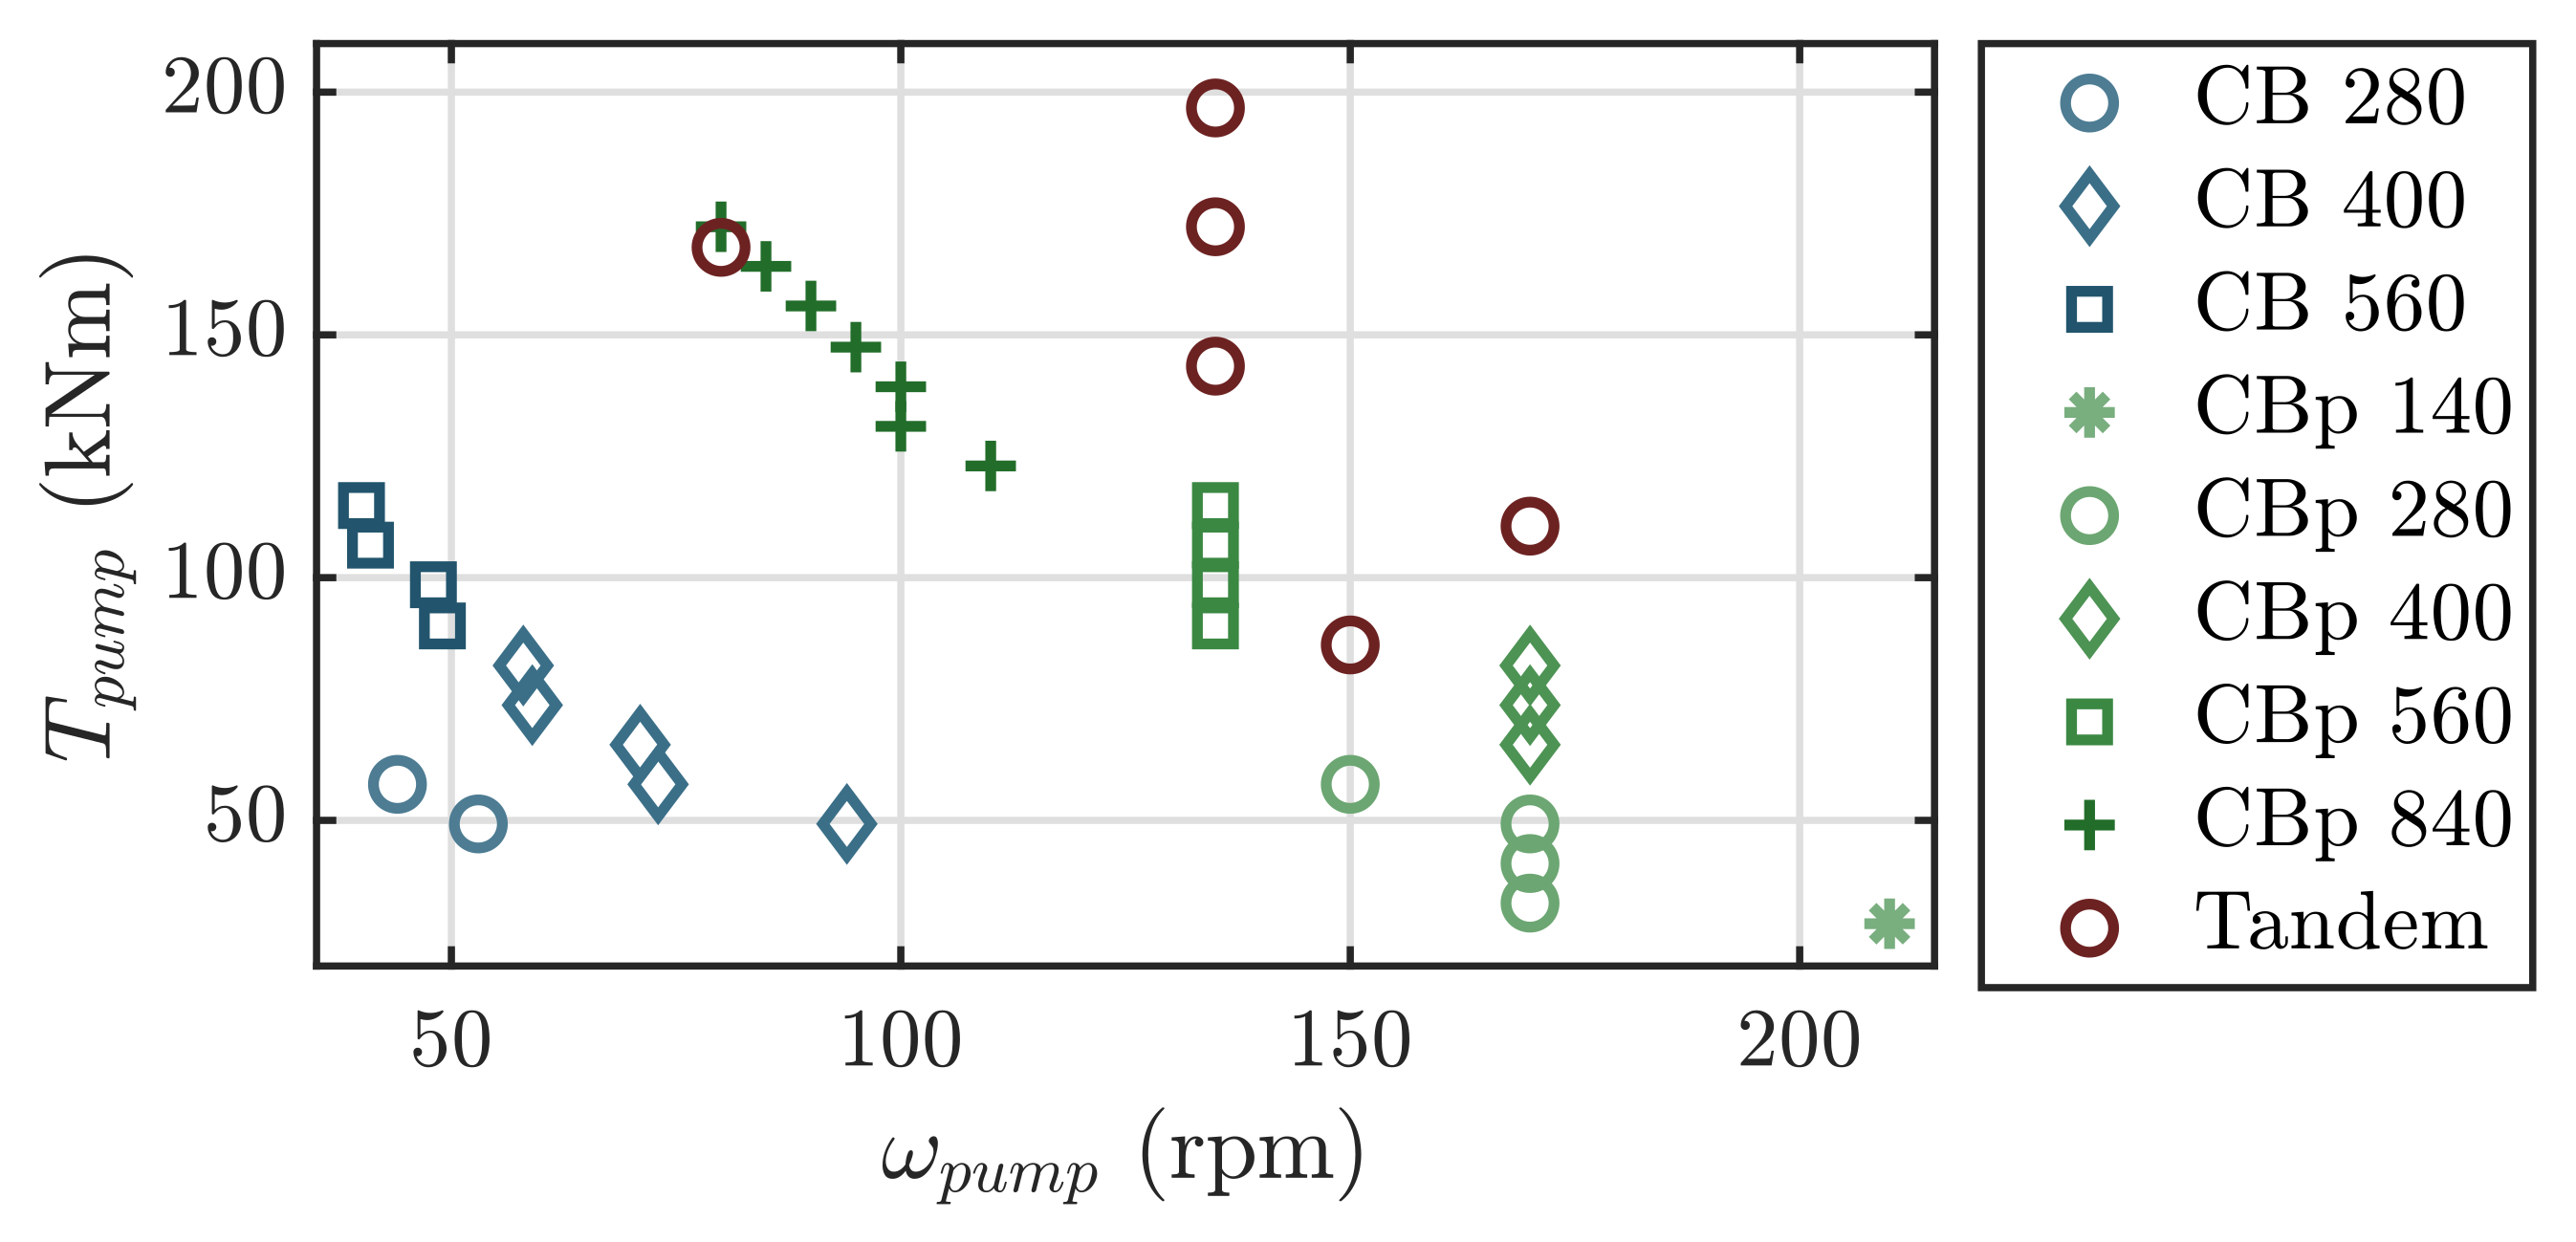
The hydraulic pump is chosen from the Hägglunds CB and CBp radial piston pump catalogues offered by Bosch Rexroth [61]. The CBp series replicate the sizes of the CB ones, offering a powerful torque and speed range. Moreover, some tandem configurations are considered. The range of speed ( ω p u m p ) and torque ( T p u m p ) offered by the Hägglunds catalogue is reported in Figure 11, where 36 different solutions are considered. The pump model I D p refers to one of the pump units summarized in Figure 11. Each series, identified with the prefix CB or CBp, can offer more than one solution (e.g., the series CBp 560 offers four different solutions: CBp 560-440, CBp 560-480, CBp 560-520 and CBp 560-560). The tandem configurations are composed of CBp units, for example CBp 280 + CBp 140. More details about the displacement, peak torque, peak speed, rated power, efficiency and main dimensions of each unit can be found in the online catalogue [61].
The control mode of the primary pump I D c is an optimization parameter since different control architectures can be considered with different benefits and drawbacks. First, it is possible to implement or not implement the declutching control logic. Since the hydraulic pumps have a fixed displacement, the only way to regulate the torque acting on the gyroscope is to short-circuit the pump for some period of the wave cycle. This control could significantly improve the power production of the ISWEC system with respect to a solution without the clutch-declutch valve. However, the clutch-declutch valve can be prone to failures due to the number of open-close cycles demanded and thus can affect the reliability of the system, increasing the down-time, which can turn out to be costly in term of maintenance required (not accounted for in this work). A further degree of controllability is added to the system if tandem units are used, allowing to switch from one, two or three different total displacements and introducing regulation with respect to the PTO torque. Additionally, in this case, the optimization algorithm can choose from considering or not considering the switching of the pump units. The four control possibilities are summarized in Table 2.

3.1.5. Device Cost Estimation

The ISWEC optimization includes a preliminary evaluation of the total cost of the device in order to evaluate the investment behind a specific configuration. Similar to [4], the overall cost is composed of: the floater expenditures (materials and constructions), the gyroscope units along with its main and auxiliary components (flywheel motor, cooling system, power electronics of the flywheel motor, etc.) and the PTO system with its power and electronic systems. The mooring system is not considered here since its parametrization is under study and no clear automatic definition could be tackled in such an early design stage. No operational and maintenance expenditure are considered in this work due to their low magnitude with respect to the capital cost [4].
Under these assumptions, the overall cost of the device C T O T is given by the sum of the costs of each subsystem:
C T O T = C H U L L + C G Y R O + C H P T O
The cost of the floater C H U L L is proportional to its overall volume. As studied in [46], an interesting method to reduce the costs of ISWEC manufacturing and its environmental footprint could be found in the use of concrete structures, as opposed to traditional steel ones. In the naval carpentry sector, the cost per unit of overall volume can be reasonably assumed to be 275 €/m3 if concrete is used as a construction material.
The gyroscope cost function includes the material and manufacturing costs of the flywheel, support frame structures, shafts and bearings. The cost of the gyroscope C G Y R O can be set to be proportional to its structural mass m g . In mechanical manufacturing, the cost per unit mass produced can be reasonably assumed to be 6000 €/ton if steel is considered as a fabrication material.
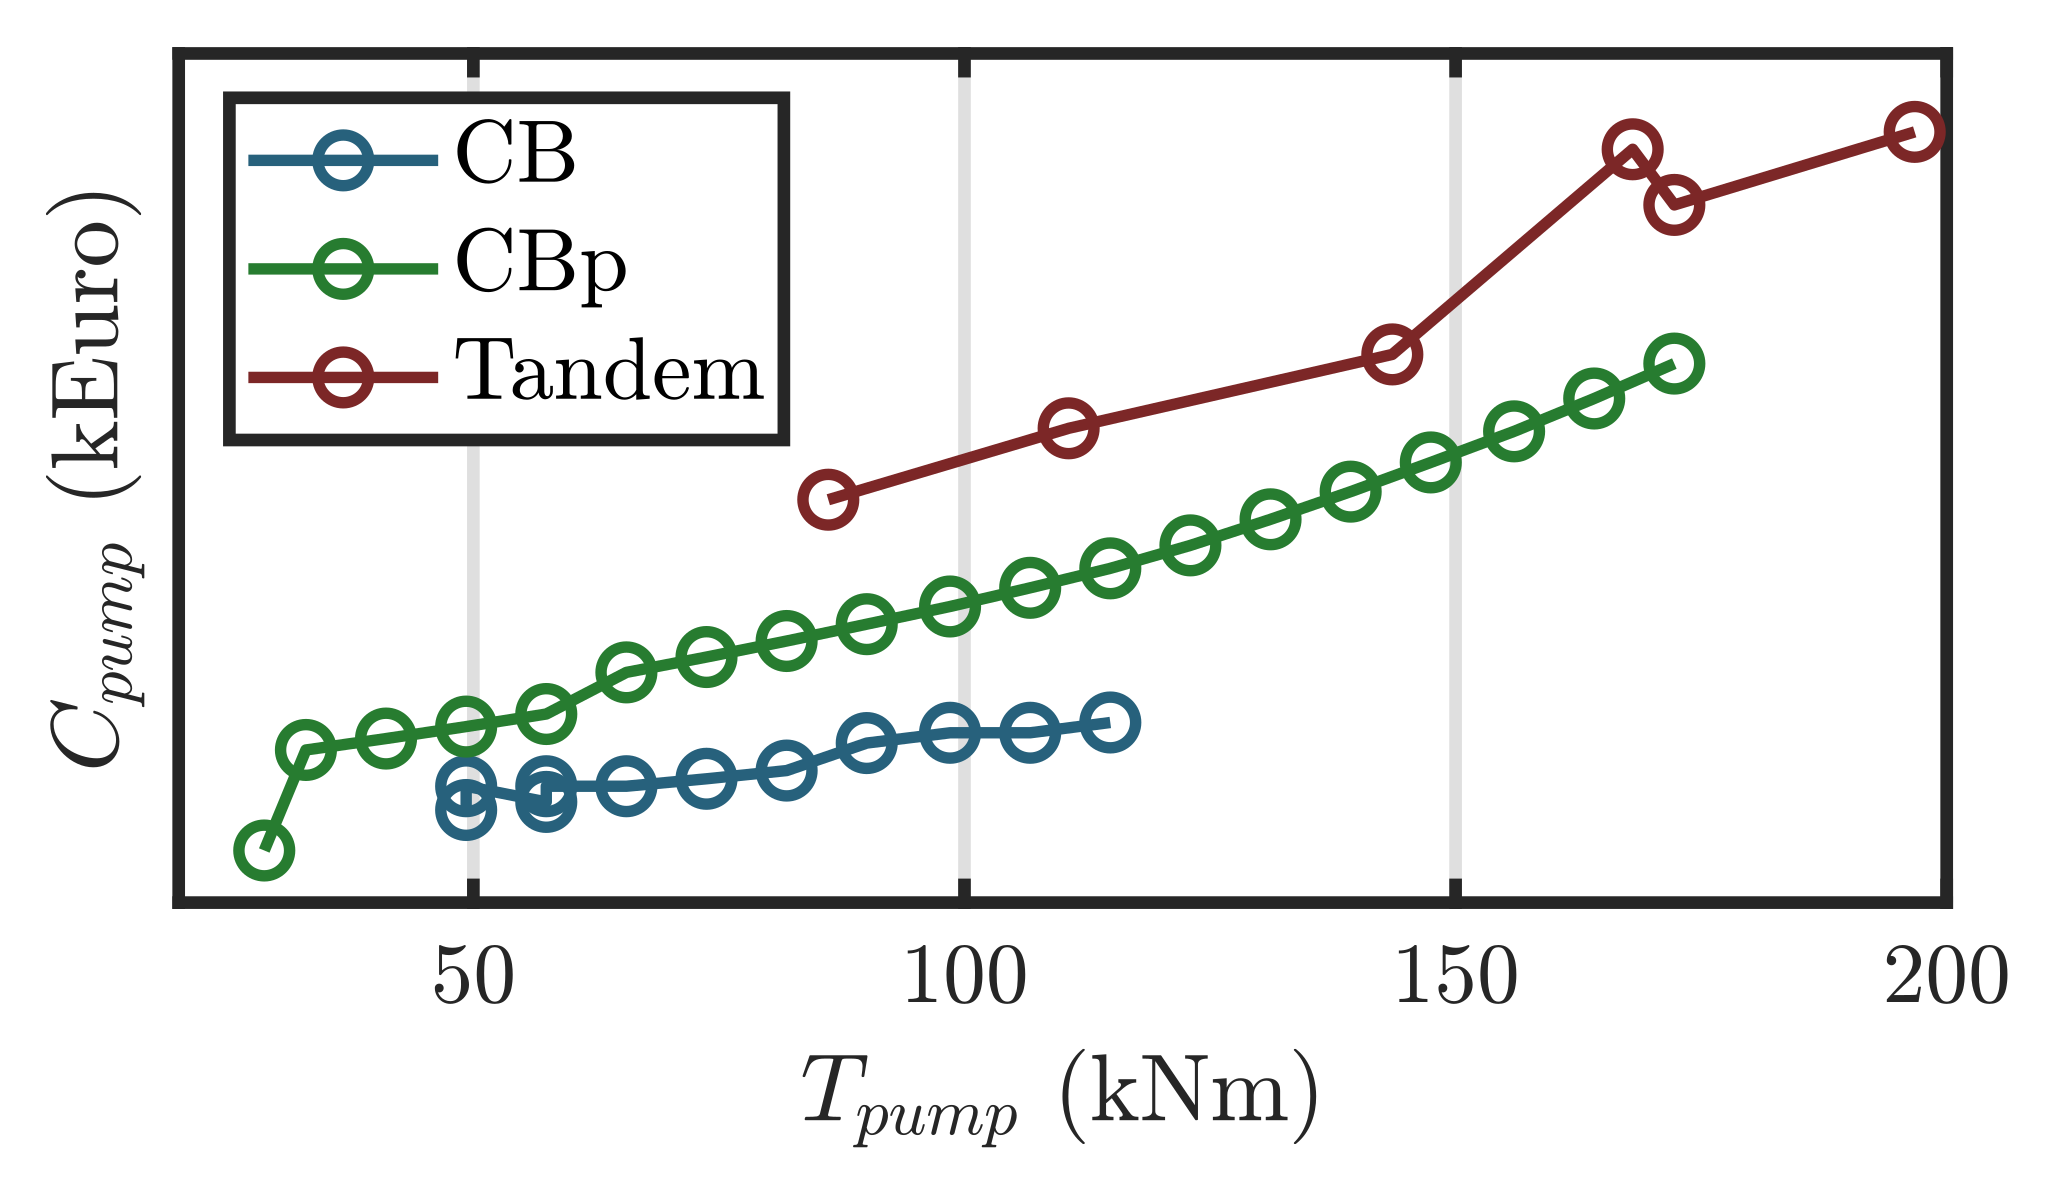
The cost magnitudes of the hydraulic pumps are summarized in Figure 12 with respect to their rated torque T p u m p .
Such costs have been collected through close collaboration with Bosch Rexroth, which allowed us to obtain the costs of 36 of its hydraulic pump solutions. As specified in Section 3.1.4, the hydraulic pumps have been chosen from the Hägglunds CB and CBp radial piston pump catalogues, available at [61], and costs have been omitted for confidentiality. As shown in Figure 12, the cost of the CB units are considerably lower than the CBp ones, since a lower specific power is deliverable. On the other hand, the tandem units are the most expensive solutions since two hydraulic pumps are installed for each tandem unit. Despite the higher investment required, the tandem solution allows to switch between each other, giving different values of the total displacement available.
The rest of the hydraulic transmission, e.g., the accumulators, manifold, valves, hydraulic motor and electrical generator, is not modelled at this optimization stage. However, the cost of such components has to be taken into account. The cost of the accumulator can be expressed as a function of the accumulator’s total volume, fixed to 600 L or 1000 L if two or four gyroscopic units are considered due to the experience gained designing hydraulic transmission for the ISWEC with the size of interest. An accurate market investigation allowed us to determine the cost per litre as equal to EUR 22/L when associated with the standard accumulator volume of 100 L. The cost can be determined considering multiple 100 L modules plus the cost of junctions and tubes needed for the connection of the accumulators with the manifold, which are fixed to EUR 250 per accumulator unit. Concerning the manifold, the cost has been fixed to EUR 17,500 or EUR 20,000 if two or four gyroscopic units are considered. As the number of gyroscopes, and thus the number of the associated hydraulic pump units connected to one single manifold increases, the dimensions and the auxiliary parts grow, increasing the cost per manifold. Concerning the auxiliary components, the cost associated with a single manifold unit is equal to EUR 5000, accounting for the clutch-declutch valve, check-valves, relief valves and sensors. The oil cost is given as equal to EUR 4.5/L.
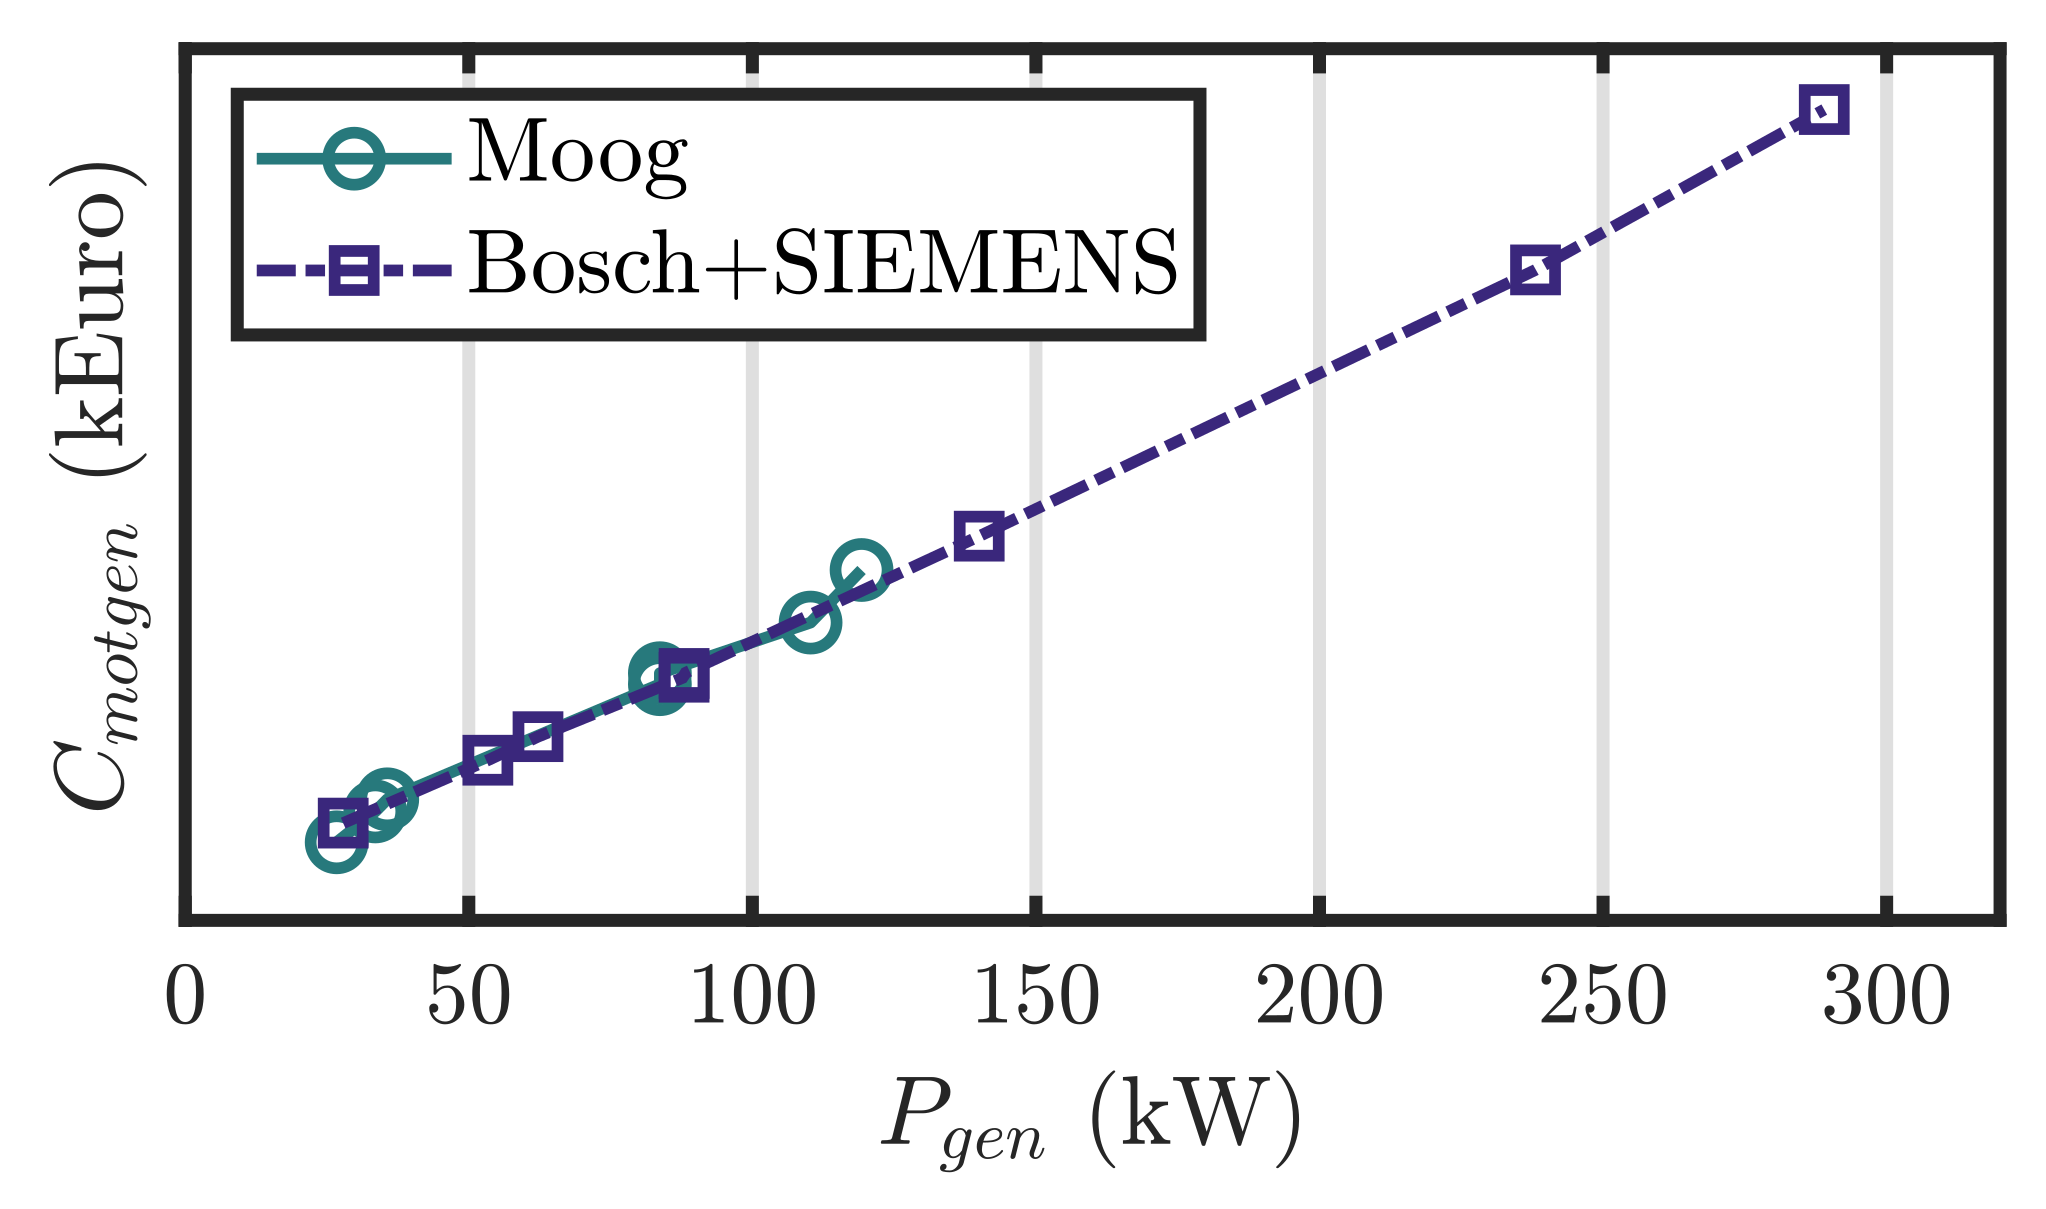
The cost magnitudes of the motor-generator stage, consisting of the hydraulic motor, electric generator, and associated electrical and electronic components, are summarized in Figure 13 with respect to the rated power of the electric generator P g e n . The solutions offered by Moog [68], composed of a hydraulic motor coupled with a permanent magnet synchronous generator (PMSG), are completely comparable with the custom solutions obtained from the combination of the Bosch Rexroth hydraulic motors [69] and the SIEMENS electric generators [70] in terms of cost per kW of installed power. Since the motor-generator stage is not modelled here, its cost is selected depending on the number of gyroscopes considered ( n g y r o s ) and on the mean cost of the units: the cost has been fixed to EUR 180,000 or EUR 300,000 if two or four gyroscopic units are considered, respectively. This procedure has to be considered as a first approximation to account for the motor-generator stage cost, and further analyses will be conducted. Similarly to the pump costs, the motor-generator quotations have been omitted for confidentiality.
These assumptions have to be considered as preliminary, and further analysis will be performed to accurately design the power generation stage associated with an HPTO unit with the TDM of the transmission.

3.2. Single Device Optimization

The second step toward the evaluation of a single ISWEC individual consists of simulating and optimizing the annual productivity of the system. Once all the device parameters are defined and the hydrodynamic properties and forces are computed, spectral-domain simulations are performed under some hypotheses and restrictions. The aim is to maximize the performance for all the sea states considered.

3.2.1. Sea States Definition

The simulation waves were defined according to the scatter diagram of Figure 14, concerning the annual occurrences and wave energy carried in the Balder sea site, an oceanic site located in the North Sea. The data presented refer to hindcast data from the period 1958–2014 (56 years) and with a sea state duration of 3 h. As shown in Figure 14, the proper number of waves as well as their synthetic parameters ( T e and H s ) were chosen (highlighted with red dots) with the aim to cover at least 99% of the annual energy of the sea site. All the waves were simulated for a single device considering a JONSWAP (Joint North Sea Wave Project [71]) spectrum, since it is the most representative of the sea site of interest. At the end of the simulation process, the ISWEC performances are computed.

3.2.2. Control Tuning

The single individual was simulated varying its control parameters ( φ ˙ , Δ p , and ε ˙ c ) with the aim of maximizing the power extracted for each wave considered. Note that, at this stage, it is essential to include a control-informed optimization, since it has the ability to significantly increase power production performance over the operational sea [72,73,74]. For each sea state, the optimization of the control parameters was performed with a Nelder–Mead simplex method [75] implemented in MATLAB with the native function fminsearch, considering the following cost function J o p t :
J o p t = P ¯ n + c I c p c
Equation (26) includes two terms: P ¯ n is the mean net power extracted from the system for a single sea state, and c I c p c are the sum of the “penalty costs” associated to the violation of the physical constraints I c . As discussed in [76], when an optimization algorithm is applied to a dynamical model, there is the probability that some state variables overcome the limit conditions, making the results not reliable or representative of the true system performance. Therefore, due to the impossibility of including explicit constraints into a SDM, soft constraints were considered in the cost function by adding a penalty term to the optimization problem defined as:
p c = 1 + tanh ( k c ( | x c | x c , l i m ) ) 2 | x c |
The penalty term p c associated with the system variable x c and constrained to the value x c , l i m is computed with Function (27). k c is the steepness coefficient to make the tanh function similar to a step function. When the variable x c is below its limit x c , l i m , the value of the penalty function is equal to zero. On the other hand, as x c exceeds the limit x c , l i m , the penalty function increases, affecting the value of the cost function J o p t . As specified in [77], larger loads on the gyroscope and on the hull structure will increase the investment cost for a given working principle or, in general, lead to larger failure rates for a given design and, consequently, higher maintenance and inspection costs. Then, the most critical variables are accounted for in the penalty function: hull and gyroscope angular displacements and torques, PTO angular speed and torque, and bearing loads.

3.3. Key Performance Indicators

Techno-economic optimization underlines the maximization of the economic efficiency of the system, giving different solutions that have to be selected by balancing the performance of the system and the investment required [78,79]. Two conflicting objectives are considered here:
  • AEP: annual energy production (MWh/y). With AEP, we refer to the ISWEC production, computed through the net power produced by the system for each wave considered and with the annual occurence distribution associated to the sea site of interest:
    A E P = 8760 10 6 w = 1 n W P ¯ n , w o w
    where n W is the total number of waves, P ¯ n , w is the average net power extracted with the w t h wave, and o w is the annual occurrence associated with the n t h wave. The coefficient 8760 10 6 converts the annual productivity into MWh/y.
  • CoE: cost of energy (Euro/MWh). In this work, the CoE is defined as the ratio between the device cost and the AEP multiplied by the lifetime of the device, fixed to 25 years:
    C o E = C T O T 25 × A E P
The objective of the genetic algorithm is finally explicitly formulated: a multi-objective optimization regarding the AEP and the CoE. The multi-objective problem can be stated as follows:
min x Ω A E P ( x ) , min x Ω C o E ( x ) s . t . x L x x U
where the objective functions A E P ( x ) : R n x R and C o E ( x ) : R n x R are functions of a vector x R n x subject to lower and upper bounds, x L R n x and x U R n x . n x is the dimension of the problem.

3.4. Optimization Algorithm

The optimization problem of a WEC falls within the field of multi-objective optimizations (known also as Pareto optimizations), where more than one objective concur. Two different multi-objective approaches have been used by the authors so far: (I) in [4], several single-objective optimisations have been performed, and the performance index has been computed as a weighted average of multiple objectives through the native MATLAB function ga; (II) in [5,6], the multi-objective NSGA-II method [32] has been used through the native MATLAB function gamultiobj. Here, approach (I) is employed to highlight different techno-economical trends obtained by pursuing contrasting objectives: maximization of the annual productivity and minimization of the cost of energy. In this regard, the Pareto front is built by aggregating the results of five single-objective optimisations with the pairs of weights reported in Table 3:
The cost function, concerning the mininimization problem, can finally be presented as follows:
J c ( x ) = A E P ( x ) w 1 + C o E ( x ) w 2 if feasible device C + Δ c if unfeasible device
In order to deal with unfeasible solutions, constraints are enforced by applying a death penalty that worsens the fitness values by a constant C increased by a measure Δ c of how much that constraint is violated [80,81]. The most common reasons for solution unfeasibility are the geometrical intersection of the internal subsystems, the gyroscope and the ballast encumbrances with respect to the available space, and the hydrodynamic instability. They are recognized by the algorithm and labelled as unfeasible solutions.
The tuning factors of the algorithm are summarized in Table 4. It is worthwhile to specify that, although beyond of the scope of this work, a sensitivity analysis on the ga parameters can potentially improve the convergence rate of the algorithm. The interested reader should refer to [82,83,84] for a detailed description of evolutionary algorithms.

4. Optimization Results

In this chapter, the optimization results are discussed. Attention is given to the annual energy production, the device cost, its manufacturability and feasibility. The reader should note that all the AEP, CoE and cost values have been hidden for confidentiality, and only qualitative results and relative percentage differences are reported here. The purpose is to point out the techno-economic trends of a HPTO-based ISWEC device preliminarily designed with the spectral domain technique. However, the order of magnitude of AEP, CoE and cost are reported in the axes’ legend to give insight into the power capabilities and cost of the ISWEC.

4.1. Convergence Analysis

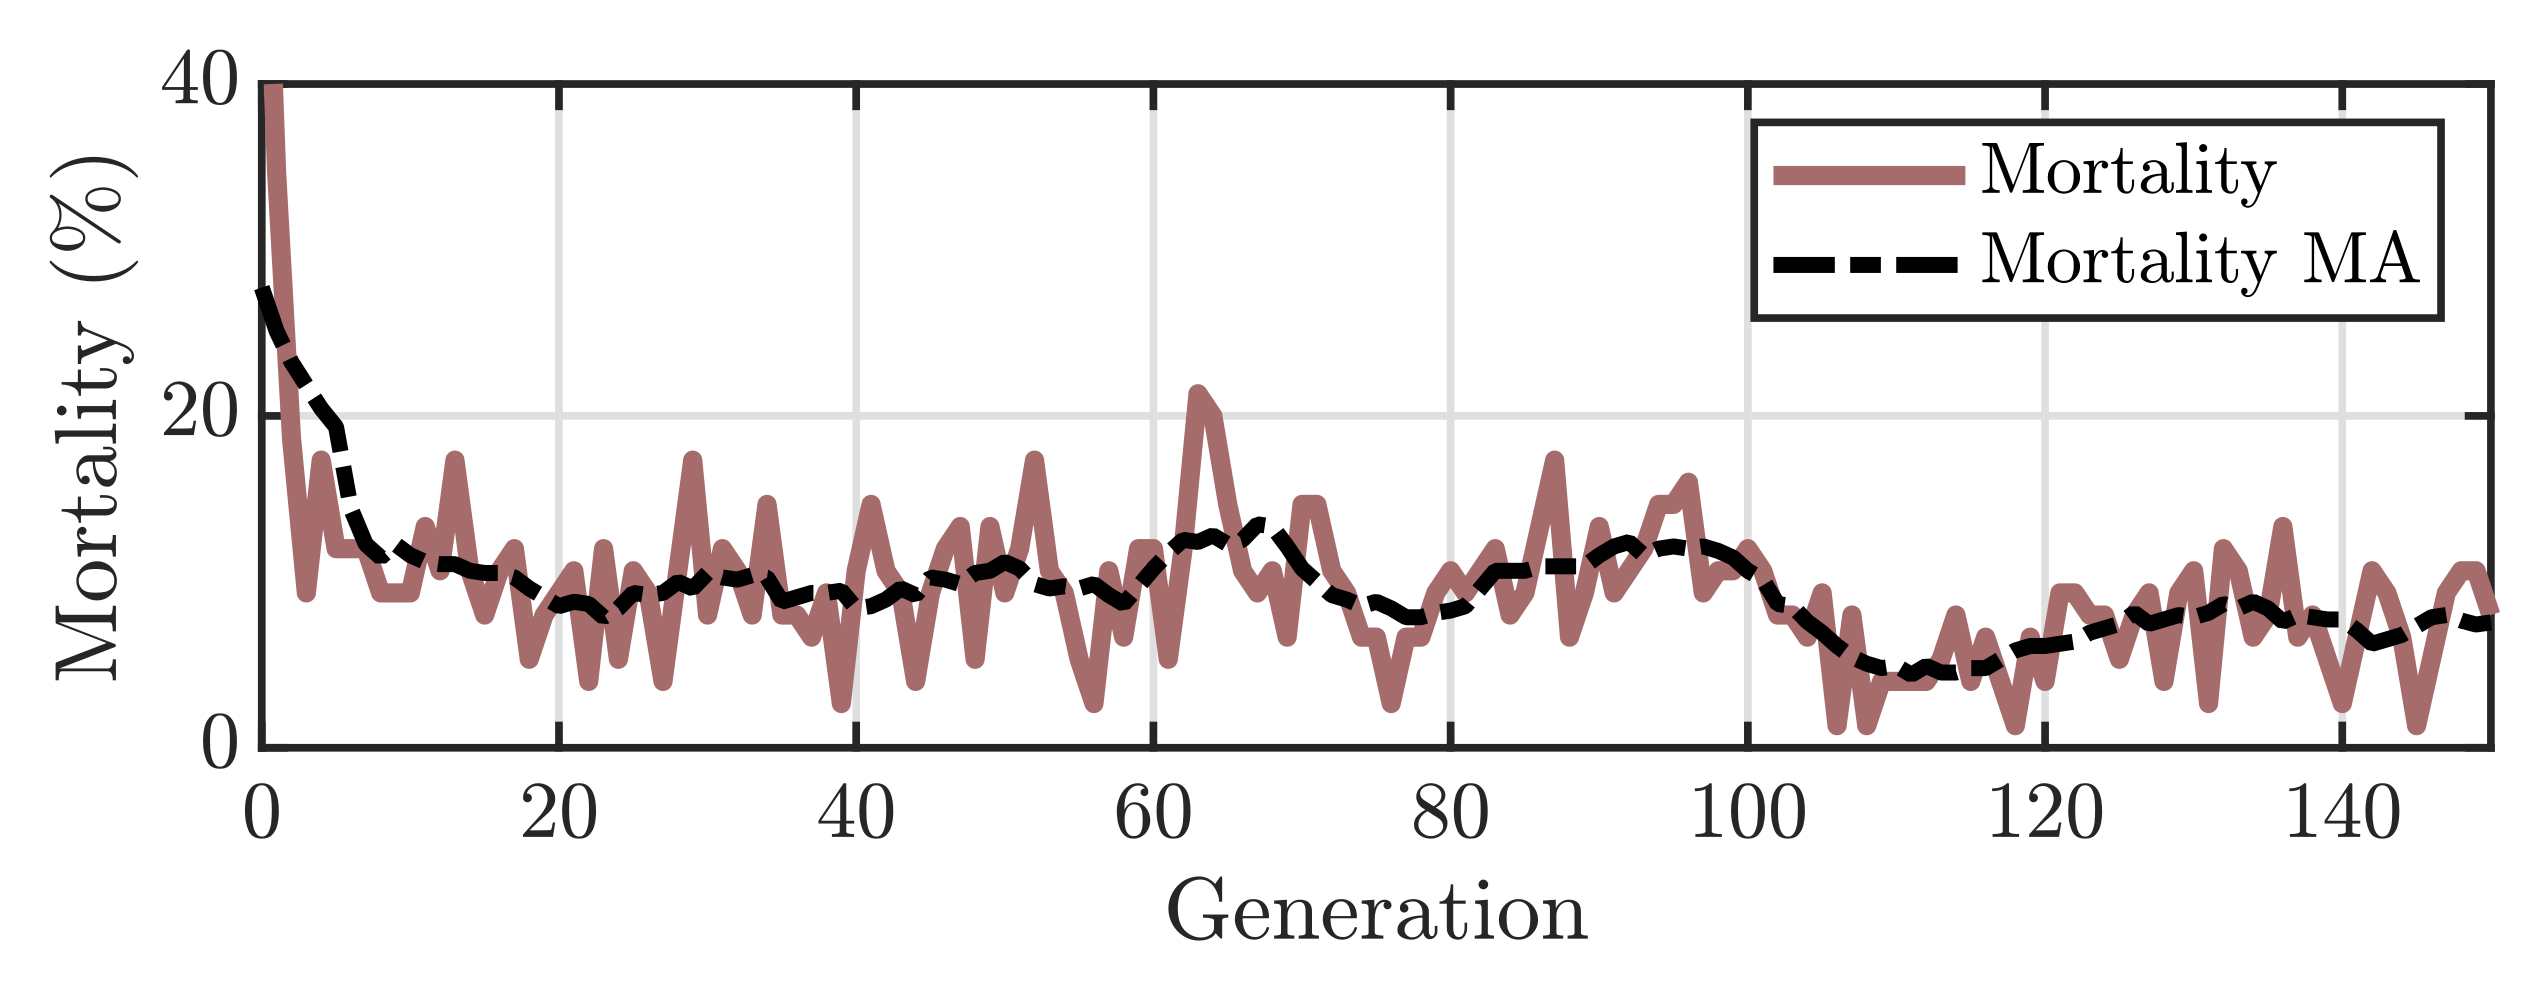
The ISWEC parameters cannot be combined at will, and some unfeasible solutions appear during the optimization process. The so-called mortality rate, defined as the ratio between the number of unfeasible individuals and the total individuals, is shown through generations in Figure 15.
The dashed line is the moving average (MA) of the mortality rate computed by grouping 10 generations at once. The mortality drastically decreases in the first 20 generations and slighty increases again between generation 80 and 100; then, it moves below 10% at the end of the optimization process. Overall, the method proposed to handle unfeasible devices is demonstrated to be effective since the mortality rate decreases as generations progress. However, the mortality does not go to zero due to the exploratory nature of the GA, which explores the solution domain in a stochastic way during the crossover and mutation operations.
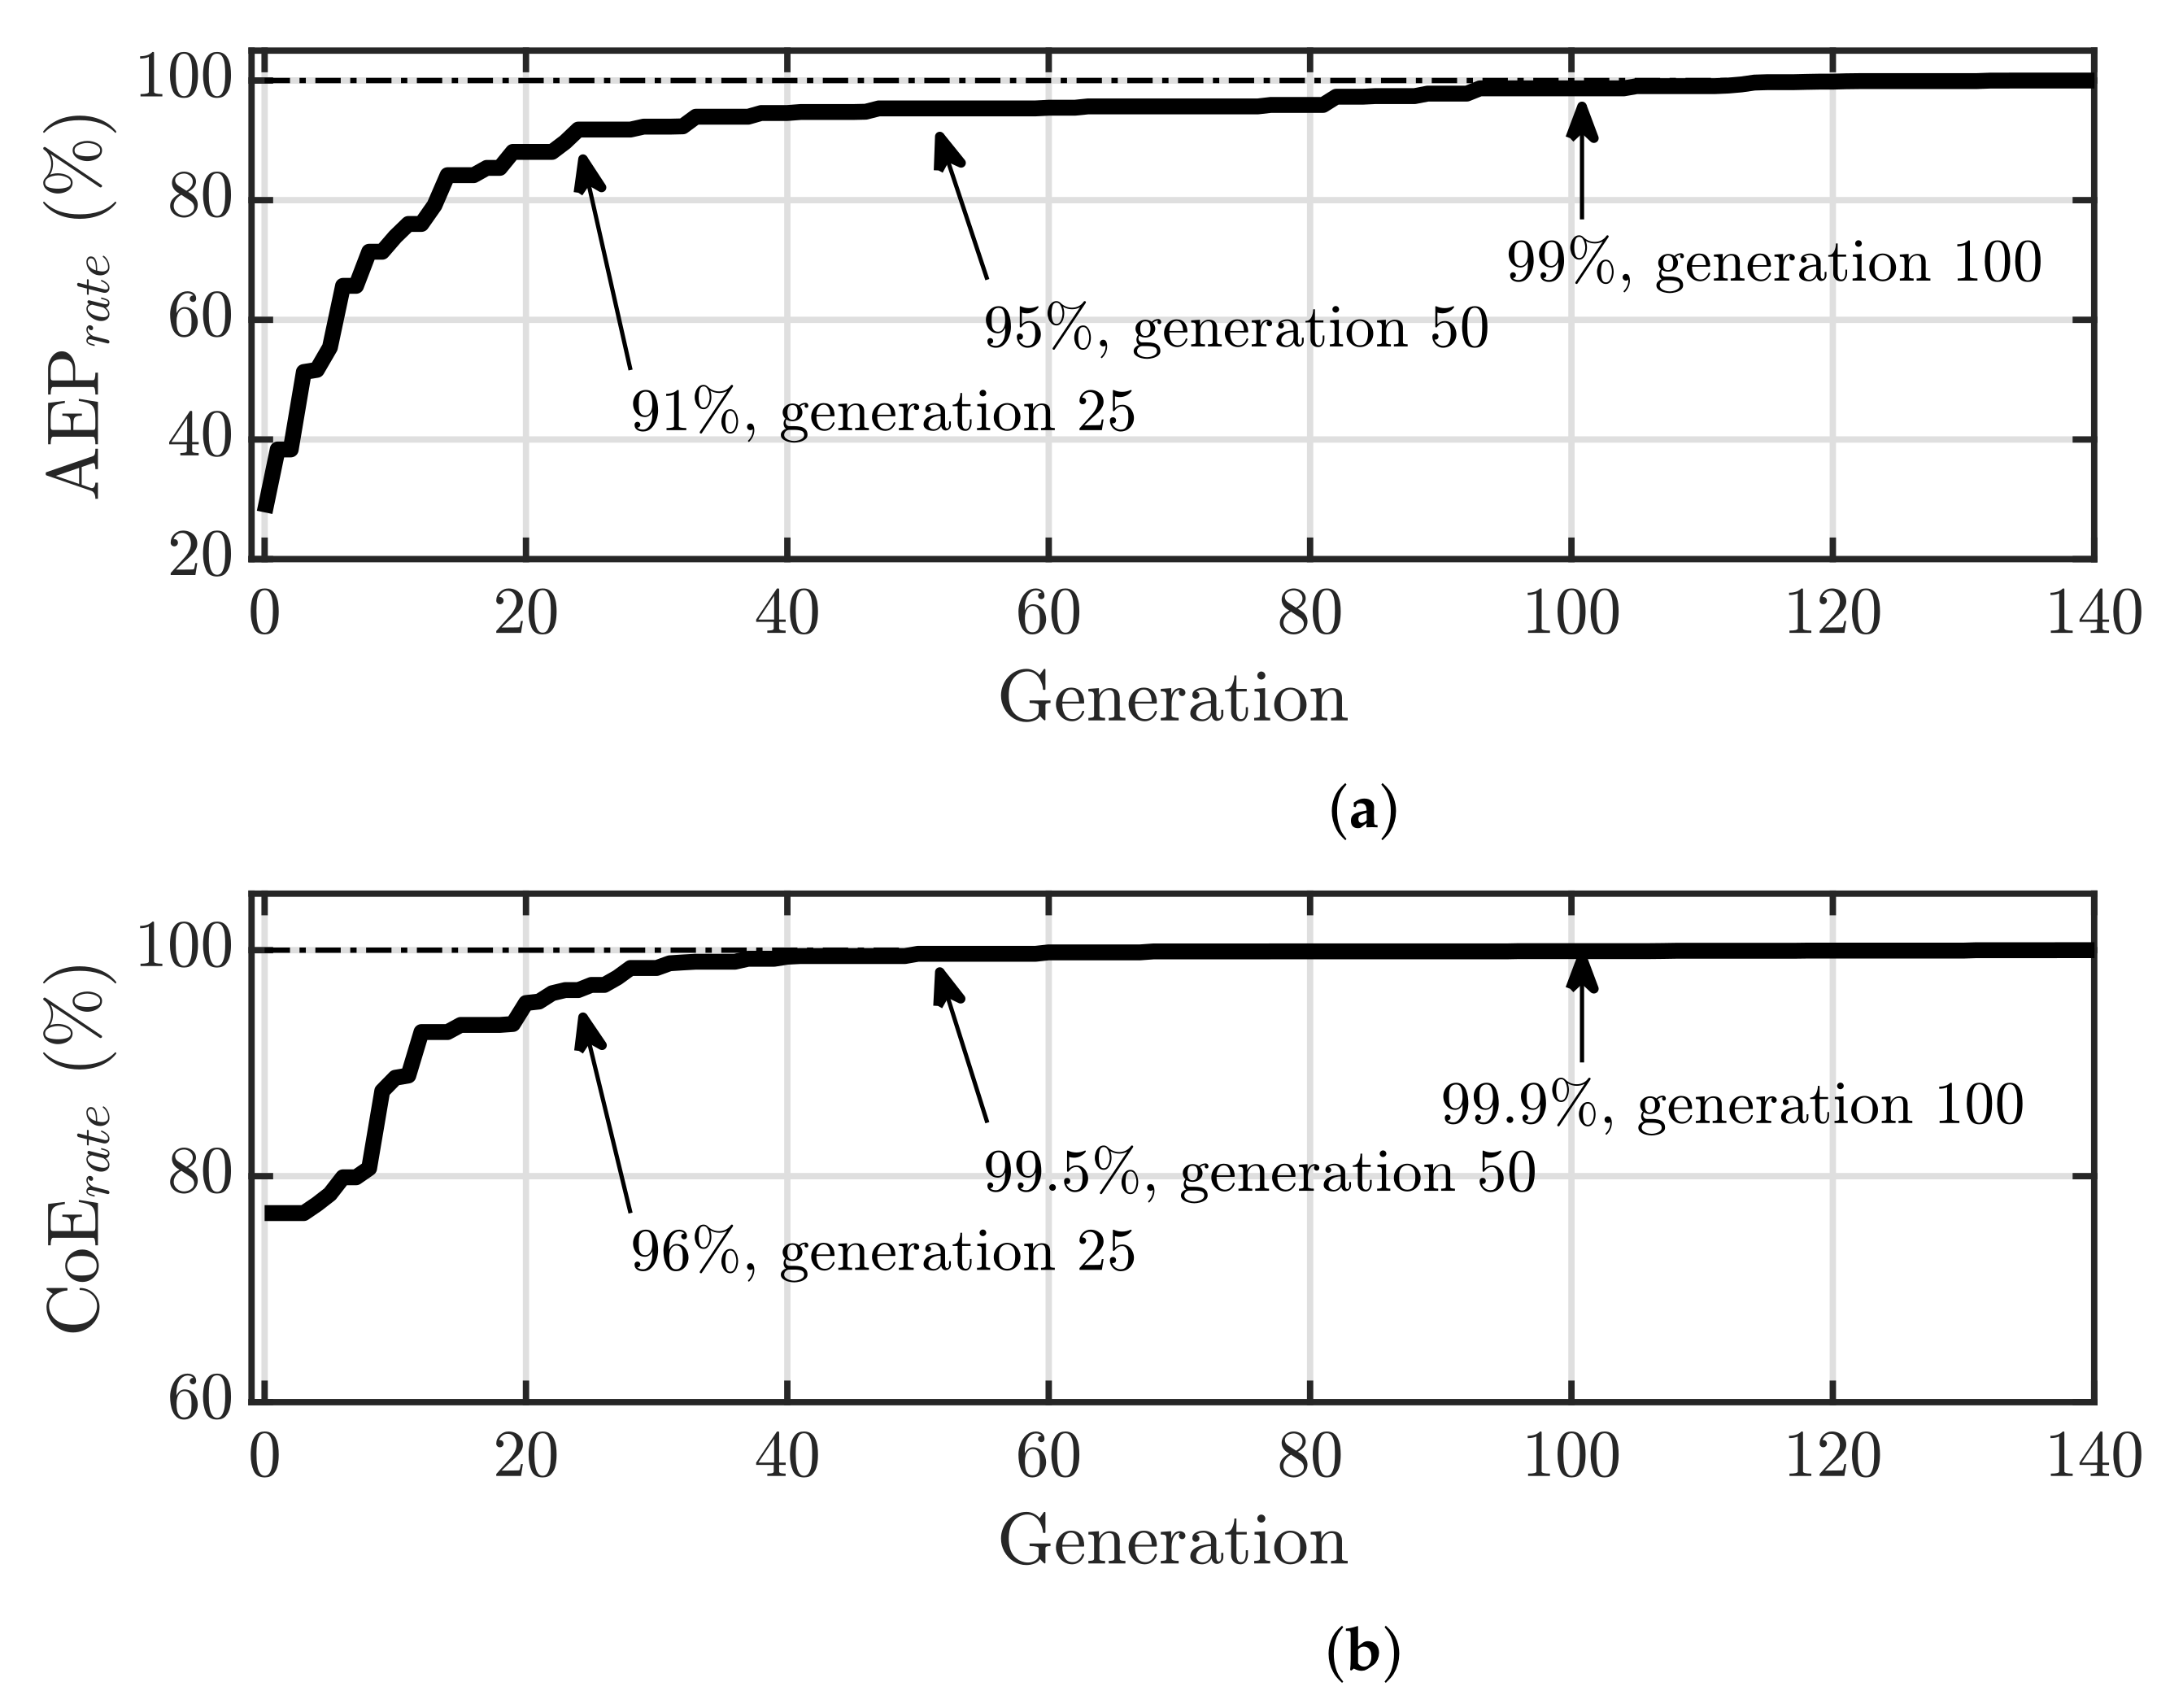
The development of the algorithm is shown in Figure 16 for the example of the AEP and CoE performances.
Figure 16 has the purpose of showing the rate of the fittest individuals over the whole population as the generation number increases with respect to the best individual for each performance index; the improvement is abrupt in early generations (until generation 25–50) and slows down afterwards (until generation 100). It is believed that the current setup provides appropriate convergence and satisfactory results; thus, the maximum number of generations allowed, G m , could be reduced to 100 or 120 to reduce the computational time. This result is confirmed in Figure 16a,b, where the AEP and CoE rate is reported in respect to the generation number, defined as follows:
A E P r a t e = 1 A E P m a x A E P g A E P g 100 %
C o E r a t e = 1 + C o E m i n C o E g C o E g 100 %
where A E P g is the AEP of the fittest value at generation g, and A E P m a x is the best AEP value among all individuals. The same nomenclature is valid for the C o E r a t e definition. It is shown that at generation 100, the best individual performs 99% equal to the absolute best, and for the subsequent 50 generations no relevant improvement of the fitness function are found. The GA is able to find the optimal solution near generation 100 by evaluating approximately 7500 individuals (75 individuals in 100 generations) despite the billions of feasible combinations.

4.2. Optimization Output and Techno-Economic Trends

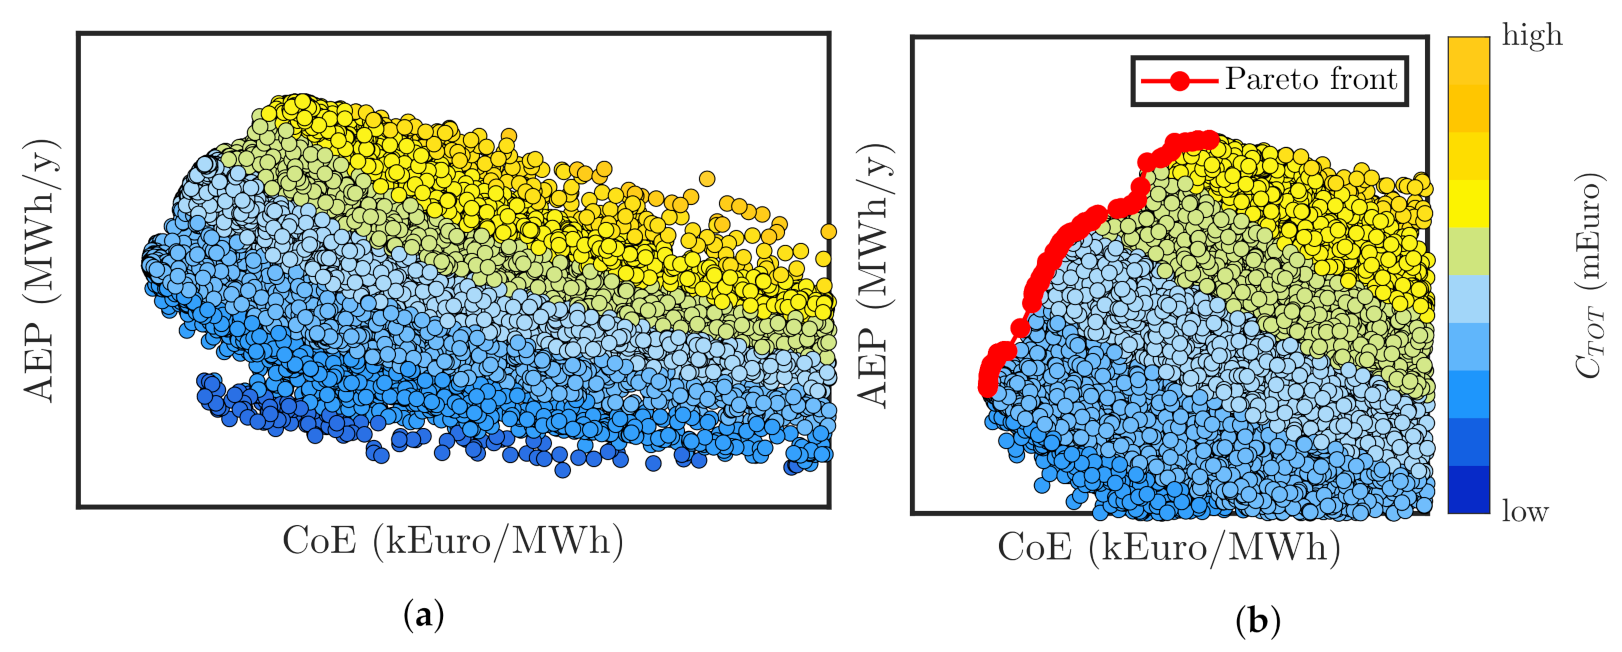
Figure 17a shows the ensemble of all the individuals generated from the optimisation. Each point represents a feasible individual with its related AEP and CoE. The colour code is proportional to the device cost magnitude. Figure 17b highlights the Pareto front (red line) concerning the best individuals according to the two evaluation metrics considered. Each individual on the Pareto front can be interpreted as a non-dominated solution of the solution set, and here stand the optimal devices. As expected, the optimal device with the best AEP differs from the one with lowest CoE. In fact, designing a system with high productivity leads to an increase in the system dimensions and costs; on the other hand, since there is not a linear relationship between the system performances and its investment, the economic efficiency of the ISWEC has to be maximized with a CoE-driven optimization. The CoE-driven area is attracted towards the AEP axis, while the AEP-driven optimisation extends the furthest along the CoE axis. In between, the multi-objective optimisation will reach a good compromise of the two metrics. The optimal devices stand in the north-west corner of the diagram, where the AEP is maximized and the CoE is minimized. As expected, the most expensive devices appear in the top part of the device point cloud where the AEP is maximized.
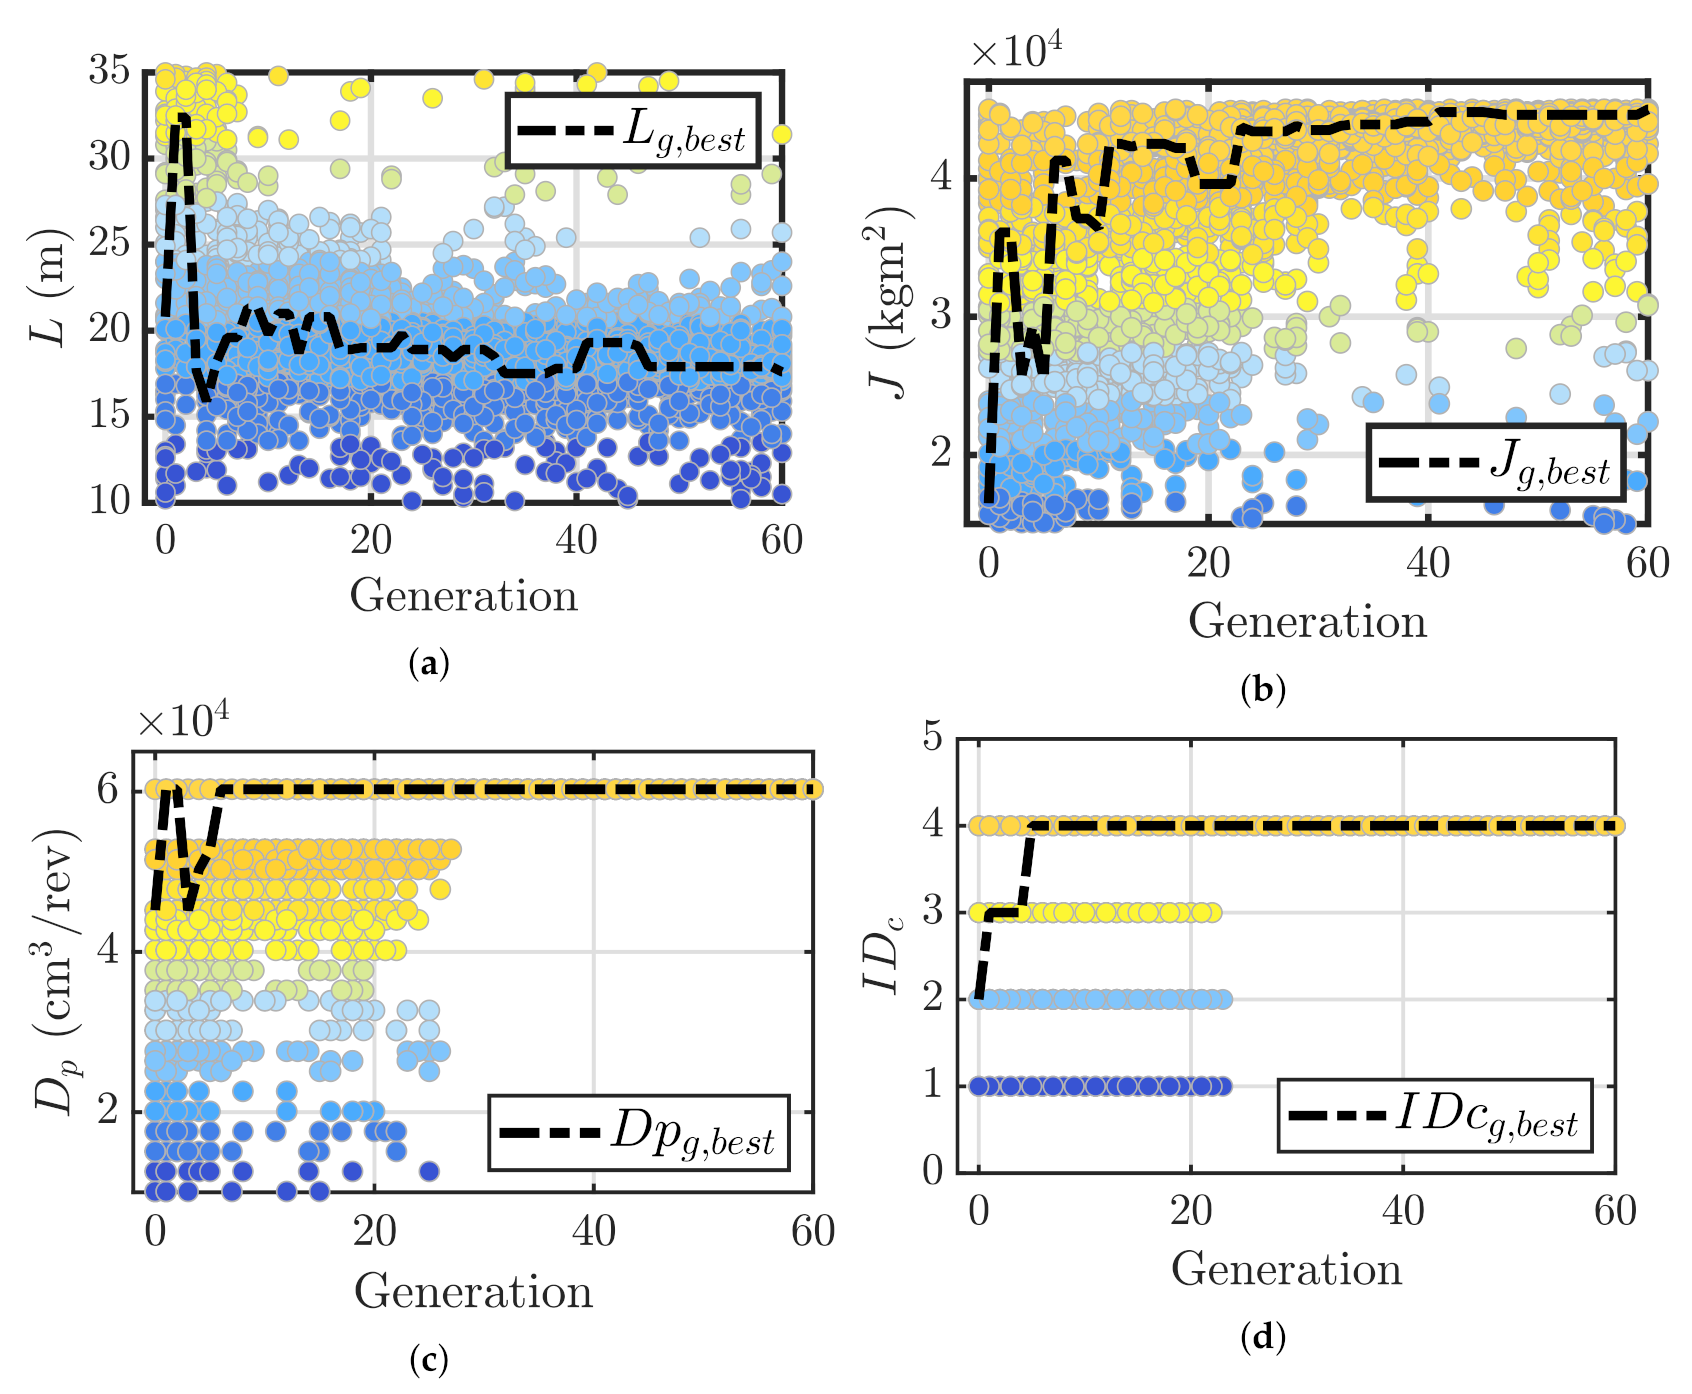
Figure 18 aims to highlight the convergence of the hull length L, the gyroscope moment of inertia J, the pump displacement D p and the hydraulic control I D c driven by the maximization of AEP.
First, in Figure 18a, the behaviour of the hull length L through generations shows that the hull length rapidly converges to the optimal value (represented with a black dashed line) that refers to the best individual of the generation g. An optimal value around 17 m is found for the most well-performing device; small and large hull length are not optimal. This result is consistent with the hydrodynamic theory and, more in specific, the hydrodynamic of floating bodies: short devices compared with the incident wavelength are expected to behave like a point-absorber-WEC, inducing a predominant heave motion that, in our case, does not contribute to the power generation; on the other hand, long devices acts like a low-pass filter due to the peak-to-trough distance of the wave crest, which is not suitable to induce their oscillation. Concerning the gyroscope’s moment of inertia, J, Figure 18b demonstrates that, as expected, in order to maximize the system productivity, large gyroscopic units are required, and thus the J g , b e s t value converges to the upper bound imposed on J, equal to 45,000 kgm2 (see Table 1). Concerning the hydraulic parameters, the pump displacement D p and the hydraulic control type I D c are reported in Figure 18c and Figure 18d, respectively. It is worthwhile to remember that the free parameter of the pump is an ID that uniquely corresponds to a pump unit in the Bosch Rexroth catalogue. However, in order to give an engineering meaning to the results presented, the pump displacement is used to represent the trend obtained during the optimization. The pump displacement D p is directly related to its maximum torque capabilities and gives insight into the size of the pump. The results of Figure 18c,d are also consistent with intuition: the AEP is maximized through the largest pump unit available in the catalogue, which is able to exert the highest torque on the gyroscope unit, and, thus, no theoretical limits exist in extracting the available power generated by the gyroscope motion. In this regard, the pump unit can be interpreted as an electrical generator: the larger the torque available, the larger its saturation limits, and all the available power transferred to the gyroscope can be converted into electricity (unless the HPTO efficiency). Figure 18d determines that the most well-performing hydraulic control logic is the I D c = 4 regarding the switching of the pump displacements and the clutching speed threshold (see Table 2). The control mode I D c = 4 is the most versatile and ensures the best controllability of the hydraulic system: the clutch-declutch valve is able to regulate the pressure acting on the primary pump, and, if a tandem configuration is installed, the possibility to switch between three different pump displacement allows a further degree of regulation of the PTO torque. Similarly to L and J, the algorithm finds the best D p and I D c before the 50th generation.
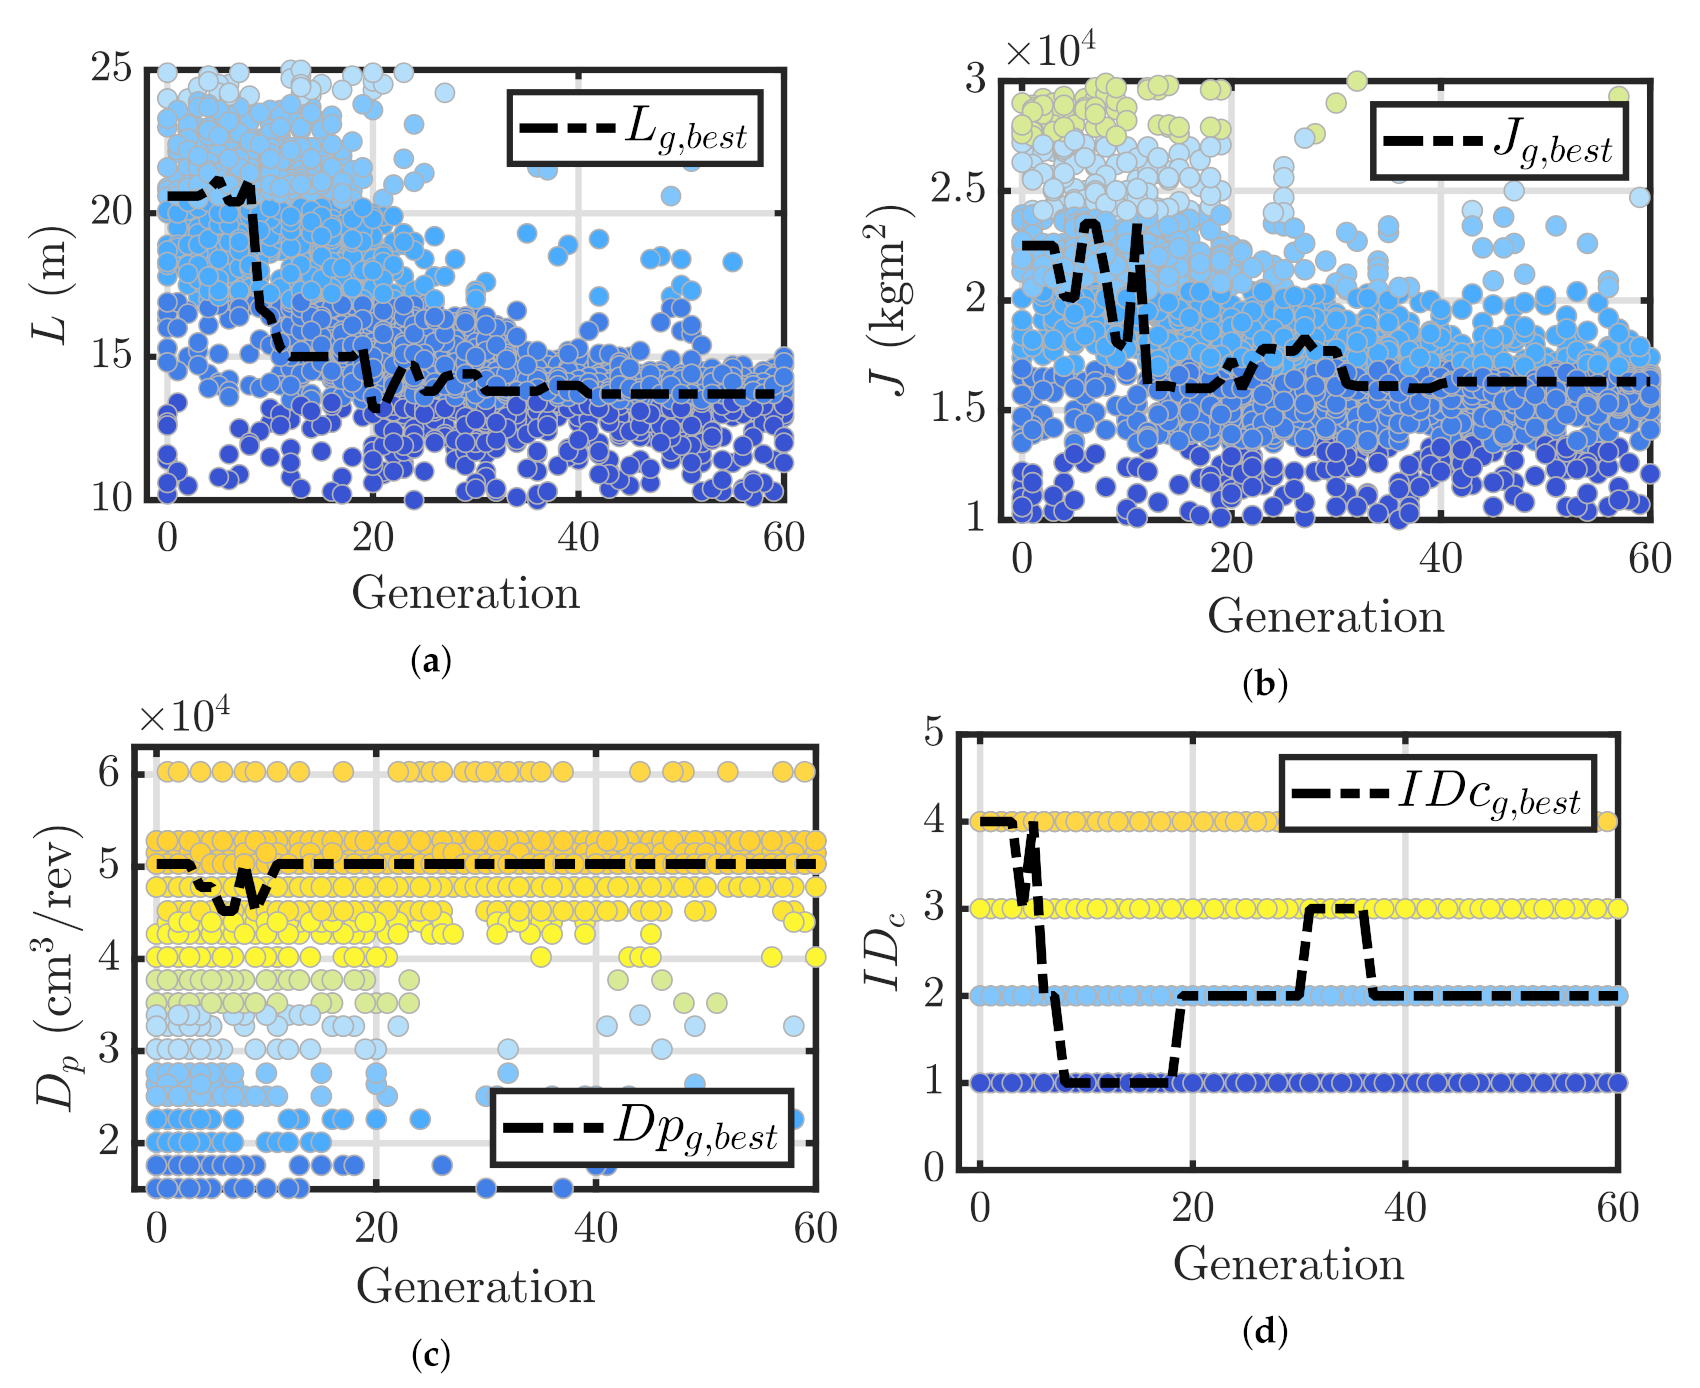
Concerning the CoE, the resultant optimal parameters are shown in Figure 19.
In Figure 19a, it is shown that the hull length converges to lower values compared to a AEP-driven optimization, almost equal to 14 m. However, such a result confirms that the optimal hull longitudinal dimension stands in the same range regardless of the optimization target in order to maximize the hydrodynamic performance of the system. Conversely, the gyroscope moment of inertia J is almost three times lower for a CoE-optimum device, standing around 16,300 kgm2 (see Figure 19b). This represents the main difference emerging from the two optimizations: as shown hereafter, the gyroscope cost represents almost 40 ÷ 45% of the total device cost, and, in a CoE-driven design, the economic efficiency is favoured over the system performances, reducing the size of the gyroscopic units. The pump displacement optimal value, reported in Figure 19c, is slightly lower than the AEP-optimum one, and it refers to a single displacement unit. Despite the economical efficiency of the system being preferred to its annual productivity, the selected pump is again one of the larger units in the catalogue. Balder is a high-energy sea site, and the algorithm typically explores the most powerful PTO solution available to maximize system productivity. Moreover, the hydraulic pump requires a low investment compared to the gyroscope unit, and no relevant impact on the overall cost is obtained. As shown in Figure 19d, the most performing hydraulic control logic is I D c = 2, concerning the clutch-declutch logic. The pump switch is not possible here because the optimal pump is a single displacement unit. Overall, the best value of L, J, D p and I D c are found in generation 50, again demonstrating the high rate of convergence of the GA.
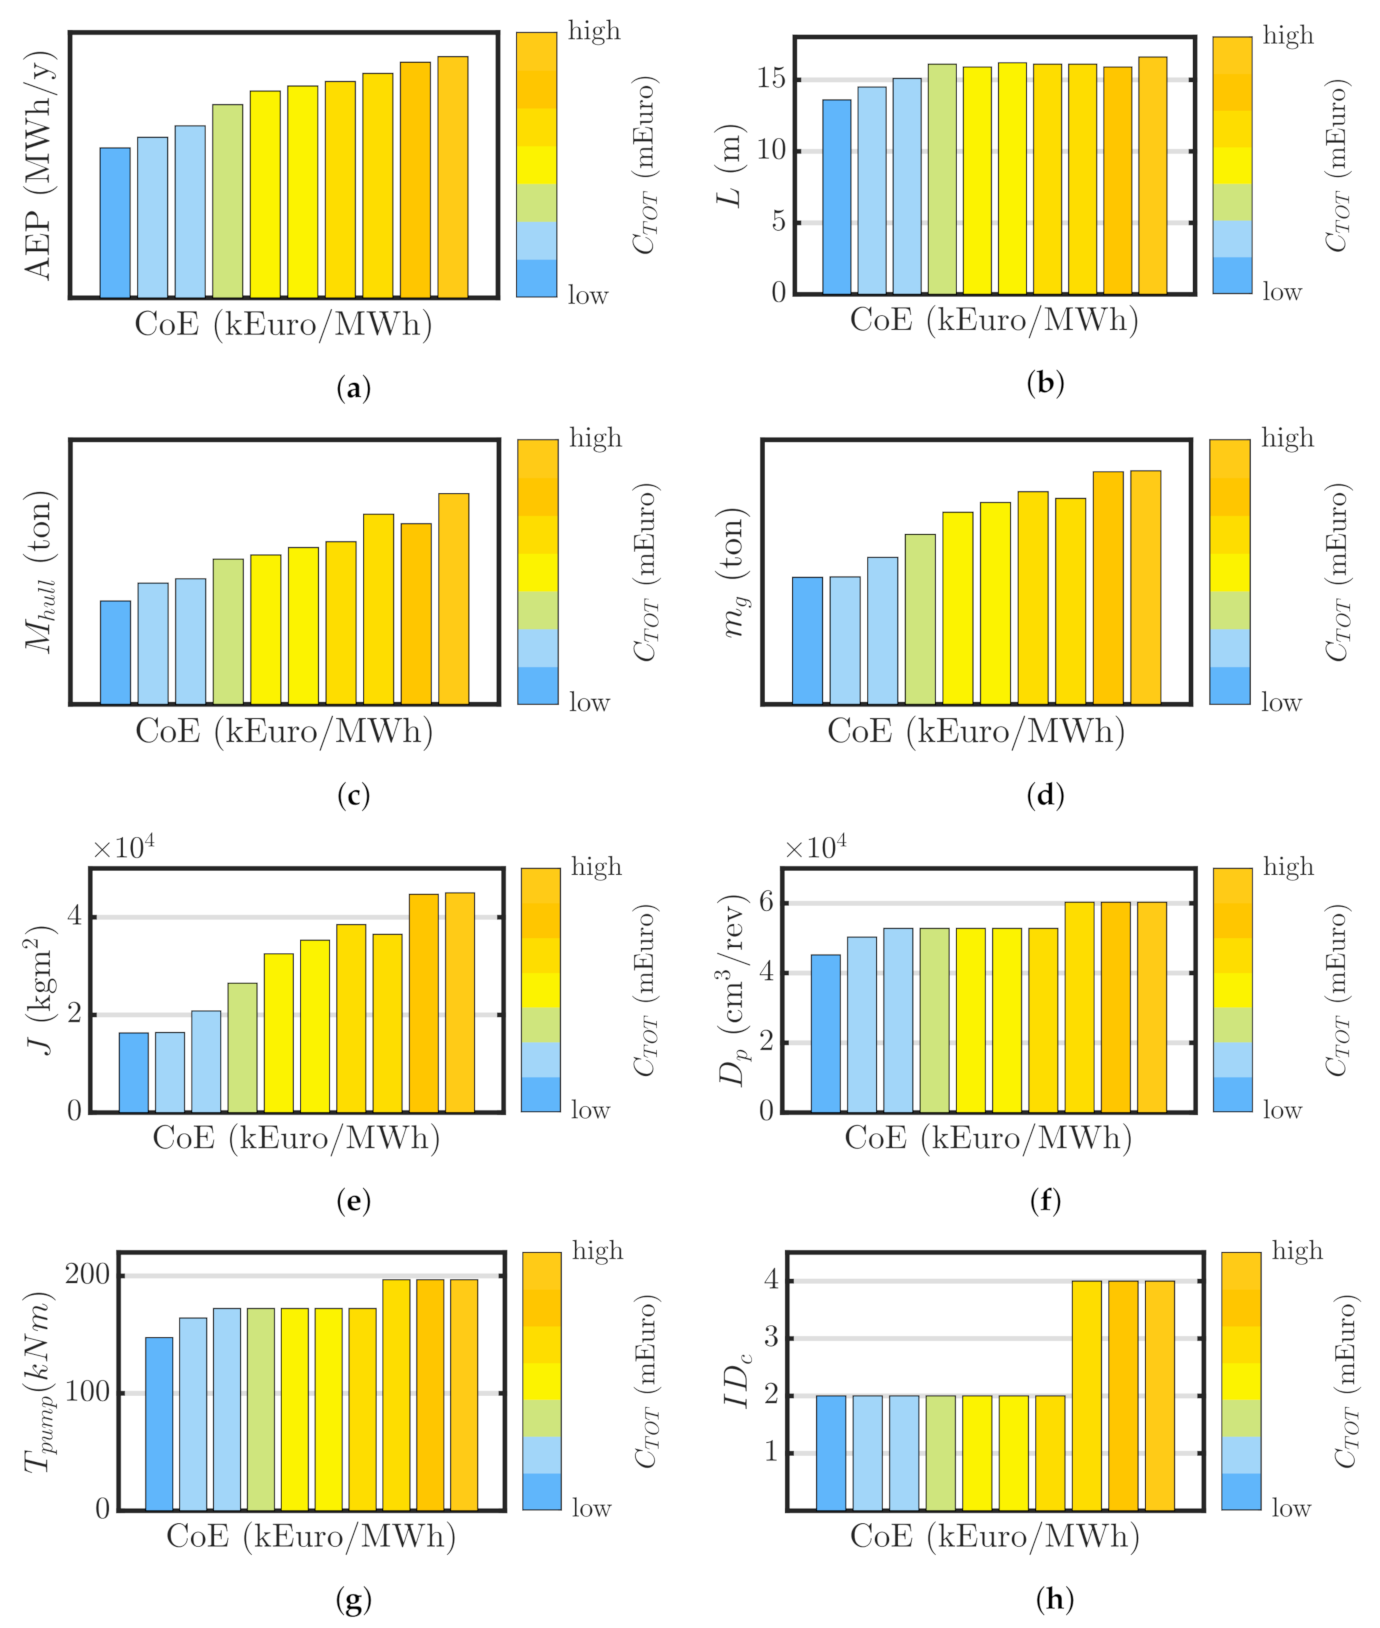
In order to investigate significant and more informative trends, Figure 20 shows relevant results and design parameters for a selection of ten devices standing on the Pareto Front, chosen in order to be representative of the fittest individuals in the whole population.
In order to highlight the most convenient individual, according to each metric, bars colour proportional to the device cost are used, so that cheapest devices are represented by sky-blue bars, while most expensive ones in orange. The highest AEP and the lowest CoE are achieved with significantly different individuals. In particular, it is evident that the increase in AEP is slower than the increase in cost, so the lowest CoE is found in the low cost region in spite of a lower AEP. Contrary, achieving high AEP generally requires such an increase in device cost that the overall economical effort becomes unfavourable. Specifically, Figure 20b,c explores variations in the hull length and mass, which are the main drivers of hydrodynamic performance and hull cost. While CoE consistently increases with the hull length, longer hulls generate high AEP, despite the hull longitudinal dimension remaining bounded between 14 m and 17 m. The same behaviour is shown in the hull mass, which reports a slight upward trend as the AEP increases. Similarly, Figure 20e,d depicts that productive devices call for heavy and large gyroscopes. Despite the relevant increase in the gyroscope unit inertia, from J = 16,500 kgm2 to J = 45,000 kgm2, the gain in productivity does not follow the same rate of growth, confirming that the incremental investment required to produce more energy is not cost-effective. Concerning the pump unit, mainly as a consequence of the high AEP demand, the optimal pump displacement and rated torque grow from left to right, resulting in more powerful hydraulic units installed (see Figure 20f,g). Finally an optimal hydraulic control requires the use of the clutch-declutch logic and (if a tandem unit is installed) the pump switching.
The device cost and the relative impact of different system parts on the total device cost is reported in Figure 21. The costs are divided into hull, gyroscope unit and HPTO. Figure 21a demonstrates that the absolute cost of each subcomponent tends to increase more rapidly than the resultant increase in AEP, leading to higher CoE for high investments. The rates of increase seem to be different: the hull cost tends to become less relevant in favour of the gyroscope cost, although the mass of the hull increases, as shown in Figure 20c; therefore, the proportional increase in gyroscope unit size has a higher impact on the overall cost than the increase in hull dimensions and mass. In conclusion, a cost-effective solution seeks compact gyroscopic units rather than small hulls. Overall, hull and gyroscope almost equally split up 80 ÷ 85% of the device cost, while the hydraulic transmission is just 15 ÷ 20% of the investment.

4.3. Optimal Devices

Finally, the results of the two optimum devices for Balder according to different objective functions are summarized in Table 5. The AEP optimum is wider than the CoE optimum, intercepting more wavecrests, hence enhancing the capture of incoming energy. The same rationale applies to the flywheel inertia, pump displacement and rated torque, which are driven to the upper limit available to extract as much energy as possible, regardless of the device cost. Conversely, a lower CoE requires a smaller floater and gyroscope units, along with a less powerful pump unit. The optimal control mode I D c is, as expected, the one that gives the higher controllability to the system: I D c = 4, for the AEP-optimum, means that both the clutch-declutch logic and the switch of the tandem units is enabled; I D c = 2, for the CoE-optimum, consists of enabling clutch-declutch logic (here, the pump switch is not possible since a single-unit pump is considered). Overall, dimensions and mass of the AEP-driven optimum are higher compared with the CoE-driven one. This suggests that increasing the device size requires a higher increment in cost than the consequent increase in AEP, hence increasing the resulting CoE. Regarding the performances, the CoE optimum device underperforms the AEP optimum by up to 37.4% considering the annual energy extraction. However, its cost of energy is 14.9% lower due to a reduction in the total device cost almost equal to 52%.

5. Conclusions

In this work, the results of a techno-economic design tool implementing the SDM of the ISWEC equipped with an HPTO are discussed. The main novelty of this new design procedure concerns the introduction of the spectral-domain technique to design a HPTO in the early stage, limited until now to the use of complicated and computationally inefficient time-domain frameworks. Several aspects have to be considered during the design process: the power generation capacity, named here AEP, and the economic efficiency, identified as CoE. Additionally, the initial investment play an important role in the decision process. Originally, the ISWEC device was designed for the Mediterranean Sea or, more generally, for low-medium energetic seas. The main aim of this work is to explore the performances of the ISWEC device in high energetic seas toward the implementation of an HPTO. In this regard, the ISWEC device is designed for the Balder sea site, an oceanic site located in the North Sea.
First, the ISWEC system equipped with HPTO was modelled in the spectral-domain, deriving its equation following the approach proposed in the previous works of the first author. Second, the optimization tool was presented defining the device parametrization along with its key performance indicators. The optimization relies on the SDM targeting a multi-objective function to maximize the annual energy production, named AEP, and to minimize the associated cost of energy, labelled CoE. The two most well-performing devices, one designed to maximize the AEP and one to minimize the CoE, were compared, showing the influence of the design parameters on the selected performance metrics. In particular, the algorithm converges on costly devices if the AEP is to be maximized: large hulls, massive gyroscopic units and powerful hydraulic pumps are preferred to enhance the annual productivity, regardless of the economic efficiency of the system. On the other hand, the CoE minimization is obtained through smaller and lighter devices with medium-size hydraulic units. Concerning the hydraulic control mode, the GA converges to the declutching control, and, if a tandem pump unit is considered, to the implementation of the switching logic, as expected. Synthetic results demonstrate that the AEP optimum outperforms the CoE optimum by almost 37% in the annual energy extracted. In contrast, the performance indicators show a reduction of 14.9% of the CoE passing from the AEP optimum to the CoE optimum, supported by a cost reduction of almost 52%, making the ISWEC more attractive for investors.
The results discussed so far highlights the limitations of a single-objective design or, even worse, of a sequential design process, considering different parts of the power conversion chain independently. In particular, it was demonstrated that high overall cost consistently results in high AEP/high CoE, and vice versa, remarking that the economic ability and the conversion efficiency can be contrasting objectives. The design tool presented aims to offer an all-encompassing optimization tool to cover both technical and economical aspects in order to help the design process of an WEC. Such a design method could be extended to other WEC concepts with the main aim of accelerating the development of the wave energy industry. Further work will be done on the basis of these preliminary design results. The SDM of the HPTO will be expanded to also account for the dynamic behaviour of the accumulator and the hydraulic motor in order to improve its accuracy, reducing the performance gap with the TDM. A further optimization tool will be presented and used to design the whole hydraulic transmission in the time-domain; the final aim will be to compare different PTO technologies designed for the ISWEC to assess the best PTO configuration from a techno-economic point of view. Moreover, a formal uncertainty analysis will be added based on a previous work of the first author [6], applied to the PeWEC device, in order to account for performance prediction variation based on parameter uncertainty in designing the ISWEC system with HPTO.

Author Contributions

Conceptualization, M.B. and G.G.; Data curation, M.B.; Formal analysis, M.B.; Investigation, M.B.; Methodology, M.B.; Project administration, M.B. and G.G.; Resources, M.B.; Software, M.B.; Validation, M.B. and G.G.; Visualization, M.B.; Writing—original draft, M.B. and G.G.; Writing—review and editing, G.G. All authors will be informed about each step of manuscript processing including submission, revision, revision reminder, etc. via emails from our system or assigned Assistant Editor. All authors have read and agreed to the published version of the manuscript.

Funding

This research received no external funding.

Institutional Review Board Statement

Not applicable.

Informed Consent Statement

Not applicable.

Data Availability Statement

Not applicable.

Conflicts of Interest

The authors declare no conflict of interest.

Abbreviations

The following abbreviations are used in this manuscript:
MDPIMultidisciplinary Digital Publishing Institute
DOAJDirectory of open access journals
WECWave Energy Converter
PTOPower Take-Off
GAGenetic Algorithm
NSGA-IINon-dominated Sorting Genetic Algorihm II
HPTOHydraulic PTO
TDMTime-Domain Model
SDMSpectral-Domain Model
AEPAnnual Energy Production
CoECost of Energy
MAMoving Average

Note

1
The accuracy of the spectral-domain modelling technique has been demonstrated against the time-domain technique by the author in [33,34,35] and in several recent studies. The most relevant ones are cited in this paper.

References

  1. Salter, S.H.; Taylor, J.R.; Caldwell, N.J. Power conversion mechanisms for wave energy. Proc. Inst. Mech. Eng. Part J. Eng. Marit. Environ. 2002, 216, 1–27. [Google Scholar] [CrossRef]
  2. Cruz, J. Ocean Wave Energy; Springer: Berlin/Heidelberg, Germany, 2008. [Google Scholar] [CrossRef]
  3. Trueworthy, A.; Dupont, B. The wave energy converter design process: Methods applied in industry and shortcomings of current practices. J. Mar. Sci. Eng. 2020, 8, 932. [Google Scholar] [CrossRef]
  4. Sirigu, S.A.; Foglietta, L.; Giorgi, G.; Bonfanti, M.; Cervelli, G.; Bracco, G.; Mattiazzo, G. Techno-Economic optimisation for a wave energy converter via genetic algorithm. J. Mar. Sci. Eng. 2020, 8, 482. [Google Scholar] [CrossRef]
  5. Carapellese, F.; Sirigu, S.A.; Giorgi, G.; Bonfanti, M.; Mattiazzo, G. Multiobjective optimisation approaches applied to a wave energy converter design. In Proceedings of the European Wave and Tidal Energy Conference, European Wave and Tidal Energy Conference Series, Plymouth, UK, 5–9 September 2021; pp. 2114-1–2114-8. [Google Scholar]
  6. Giorcelli, F.; Sirigu, S.A.; Pasta, E.; Gioia, D.G.; Bonfanti, M.; Mattiazzo, G. Wave Energy Converter Optimal Design Under Parameter Uncertainty. In Proceedings of the ASME 2022 41th International Conference on Ocean, Offshore and Artic Engineering, Hamburg, Germany, 5–10 June 2022. in press. [Google Scholar]
  7. Babarit, A.; Clément, A.H.; Gilloteaux, J.C. Optimization and Time-Domain Simulation of the SEAREV Wave Energy Converter. In Proceedings of the ASME 2005 24th International Conference on Offshore Mechanics and Arctic Engineering, Halkidiki, Greece, 12–17 June 2005. [Google Scholar] [CrossRef]
  8. Babarit, A.; Clement, A.H. Shape optimisation of the SEAREV wave energy converter. In Proceedings of the World Renewable Energy Congress IX, Florence, Italy, 19–25 August 2006. [Google Scholar]
  9. Teixeira-Duarte, F.; Clemente, D.; Giannini, G.; Rosa-Santos, P.; Taveira-Pinto, F. Review on layout optimization strategies of offshore parks for wave energy converters. Renew. Sustain. Energy Rev. 2022, 163, 112513. [Google Scholar] [CrossRef]
  10. Li, L.; Gao, Z.; Yuan, Z.M. On the sensitivity and uncertainty of wave energy conversion with an artificial neural-network-based controller. Ocean. Eng. 2019, 183, 282–293. [Google Scholar] [CrossRef]
  11. Neshat, M.; Mirjalili, S.; Sergiienko, N.Y.; Esmaeilzadeh, S.; Amini, E.; Heydari, A.; Garcia, D.A. Layout optimisation of offshore wave energy converters using a novel multi-swarm cooperative algorithm with backtracking strategy: A case study from coasts of Australia. Energy 2022, 239, 122463. [Google Scholar] [CrossRef]
  12. Zhu, K.; Shi, H.; Han, M.; Cao, F. Layout study of wave energy converter arrays by an artificial neural network and adaptive genetic algorithm. Ocean Eng. 2022, 260, 112072. [Google Scholar] [CrossRef]
  13. Zeng, X.; Wang, Q.; Kang, Y.; Yu, F. Hydrodynamic interactions among wave energy converter array and a hierarchical genetic algorithm for layout optimization. Ocean Eng. 2022, 256, 111521. [Google Scholar] [CrossRef]
  14. He, Z.; Ning, D.; Gou, Y.; Zhou, Z. Wave energy converter optimization based on differential evolution algorithm. Energy 2022, 246, 123433. [Google Scholar] [CrossRef]
  15. Garcia-Teruel, A.; Forehand, D.I. Manufacturability considerations in design optimisation of wave energy converters. Renew. Energy 2022, 187, 857–873. [Google Scholar] [CrossRef]
  16. Garcia-Teruel, A.; DuPont, B.; Forehand, D.I. Hull geometry optimisation of wave energy converters: On the choice of the optimisation algorithm and the geometry definition. Appl. Energy 2020, 280, 115952. [Google Scholar] [CrossRef]
  17. Giannini, G.; Rosa-Santos, P.; Ramos, V.; Taveira-Pinto, F. Wave energy converters design combining hydrodynamic performance and structural assessment. Energy 2022, 249, 123641. [Google Scholar] [CrossRef]
  18. Pedersen, H.C.; Hansen, R.H.; Hansen, A.H.; Andersen, T.O.; Bech, M.M. Design of full scale wave simulator for testing Power Take off systems for wave energy converters. Int. J. Mar. Energy 2016, 13, 130–156. [Google Scholar] [CrossRef]
  19. Hansen, R.H.; Andersen, T.O.; Pedersen, H.C. Model Based Design of Efficient Power Take-Off Systems for Wave Energy Converters. In Proceedings of the 12th Scandinavian International Conference on Fluis Power, Tampere, Finland, 18–20 May 2011; pp. 1–15. [Google Scholar]
  20. Wave Star. Unlimited Clean Energy with the Wavestar Machine. Available online: http://wavestarenergy.com/ (accessed on 30 November 2020).
  21. Liu, C.H.; Yang, Q.J.; Bao, G. Performance investigation of a two-raft-type wave energy converter with hydraulic power take-off unit. Appl. Ocean. Res. 2017, 62, 139–155. [Google Scholar] [CrossRef]
  22. Zheng, S.M.; Zhang, Y.H.; Zhang, Y.L.; Sheng, W.A. Numerical study on the dynamics of a two-raft wave energy conversion device. J. Fluids Struct. 2015, 58, 271–290. [Google Scholar] [CrossRef]
  23. Liu, C.; Yang, Q.; Bao, G. Influence of hydraulic power take-off unit parameters on power capture ability of a two-raft-type wave energy converter. Ocean. Eng. 2018, 150, 69–80. [Google Scholar] [CrossRef]
  24. Gaspar, J.F.; Calvário, M.; Kamarlouei, M.; Soares, C.G. Design tradeoffs of an oil-hydraulic power take-off for wave energy converters. Renew. Energy 2018, 129, 245–259. [Google Scholar] [CrossRef]
  25. Jusoh, M.A.; Ibrahim, M.Z.; Daud, M.Z.; Yusop, Z.M.; Albani, A.; Rahman, S.J.; Mohad, S. Parameters estimation of hydraulic power take-off system for wave energy conversion system using genetic algorithm. IOP Conf. Ser. Earth Environ. Sci. 2020, 463, 012129. [Google Scholar] [CrossRef]
  26. Siemens Digital Industries. Siemens Simcenter Amesim. 2020. Available online: https://www.plm.automation.siemens.com/global/en/products.html (accessed on 5 November 2020).
  27. Calvário, M.; Gaspar, J.F.; Kamarlouei, M.; Hallak, T.S.; Guedes Soares, C. Oil-hydraulic power take-off concept for an oscillating wave surge converter. Renew. Energy 2020, 159, 1297–1309. [Google Scholar] [CrossRef]
  28. Sarkar, D.; Doherty, K.; Dias, F. The modular concept of the Oscillating Wave Surge Converter. Renew. Energy 2016, 85, 484–497. [Google Scholar] [CrossRef]
  29. Sarkar, D.; Contal, E.; Vayatis, N.; Dias, F. Prediction and optimization of wave energy converter arrays using a machine learning approach. Renew. Energy 2016, 97, 504–517. [Google Scholar] [CrossRef]
  30. MOREnergy Lab. ISWEC. 2022. Available online: http://www.morenergylab.polito.it/iswec/ (accessed on 22 August 2022).
  31. Pozzi, N.; Bonetto, A.; Bonfanti, M.; Bracco, G.; Dafnakis, P.; Giorcelli, E.; Passione, B.; Sirigu, S.; Mattiazzo, G. PeWEC: Preliminary design of a full-scale plant for the mediterranean sea. In Proceedings of the NAV International Conference on Ship and Shipping Research, Trieste, Italy, 20–22 June 2018. Number 221499. [Google Scholar] [CrossRef]
  32. Deb, K.; Pratap, A.; Agarwal, S.; Meyarivan, T. A fast and elitist multiobjective genetic algorithm: NSGA-II. IEEE Trans. Evol. Comput. 2002, 6, 182–197. [Google Scholar] [CrossRef] [Green Version]
  33. Sirigu, S.; Bonfanti, M.; Carapellese, F.; Bracco, G. Stochastic modelling via statistical linearization of a wave energy converter. In Proceedings of the European Wave and Tidal Energy Conference, Plymouth, UK, 5–9 September 2021; pp. 2132-1–2132-9. [Google Scholar]
  34. Bonfanti, M.; Sirigu, S.; Mattiazzo, G. ISWEC approaching the spectral-domain: Modelling and numerical experiments. In Proceedings of the International Conference on Electrical, Computer, Communications and Mechatronics Engineering (ICECCME 2021), Flic En Flac, Mauritius, 7–8 October 2021. [Google Scholar] [CrossRef]
  35. Bonfanti, M.; Bracco, G. Non-linear Frequency Domain Modelling of a Wave Energy Harvester. In The International Conference of IFToMM ITALY; Springer: Cham, Switzerland, 2022; Volume 122 MMS, pp. 874–881. [Google Scholar] [CrossRef]
  36. Silva, L.S.; Sergiienko, N.Y.; Pesce, C.P.; Ding, B.; Cazzolato, B.; Morishita, H.M. Stochastic analysis of nonlinear wave energy converters via statistical linearization. Appl. Ocean. Res. 2020, 95, 102023. [Google Scholar] [CrossRef]
  37. Pozzi, N.; Bonfanti, M.; Mattiazzo, G. Mathematical Modeling and Scaling of the Friction Losses of a Mechanical Gyroscope. Int. J. Appl. Mech. 2018, 10, 1850024. [Google Scholar] [CrossRef]
  38. Sirigu, S.A.; Gallizio, F.; Giorgi, G.; Bonfanti, M.; Giovanni, B.; Mattiazzo, G. Numerical and experimental identification of the aerodynamic power losses of the ISWEC. J. Mar. Sci. Eng. 2020, 8, 49. [Google Scholar] [CrossRef]
  39. Sirigu, S.; Bonfanti, M.; Dafnakis, P.; Bracco, G.; Mattiazzo, G.; Brizzolara, S. Pitch Resonance Tuning Tanks: A novel technology for more efficient wave energy harvesting. In Proceedings of the OCEANS 2018 MTS/IEEE, Charleston, SC, USA, 22–25 October 2018. [Google Scholar] [CrossRef]
  40. Sirigu, S.A.; Bracco, G.; Bonfanti, M.; Dafnakis, P.; Mattiazzo, G. On-board sea state estimation method validation based on measured floater motion. IFAC-PapersOnLine 2018, 51, 68–73. [Google Scholar] [CrossRef]
  41. Bonfanti, M.; Hillis, A.; Sirigu, S.A.; Dafnakis, P.; Bracco, G.; Mattiazzo, G.; Plummer, A. Real-time wave excitation forces estimation: An application on the ISWEC device. J. Mar. Sci. Eng. 2020, 8, 825. [Google Scholar] [CrossRef]
  42. Bonfanti, M.; Sirigu, S.A.; Giorgi, G.; Dafnakis, P.; Bracco, G.; Mattiazzo, G. A passive control strategy applied to the iswec device: Numerical modelling and experimental tests. Int. J. Mech. Control. 2020, 21, 143–154. [Google Scholar]
  43. Giorgi, G.; Sirigu, S.; Bonfanti, M.; Bracco, G.; Mattiazzo, G. Fast nonlinear Froude–Krylov force calculation for prismatic floating platforms: A wave energy conversion application case. J. Ocean. Eng. Mar. Energy 2021, 7, 439–457. [Google Scholar] [CrossRef]
  44. Genuardi, L.; Bracco, G.; Sirigu, S.A.; Bonfanti, M.; Paduano, B.; Dafnakis, P.; Mattiazzo, G. An application of model predictive control logic to inertial sea wave energy converter. In IFToMM World Congress on Mechanism and Machine Science; Springer: Cham, Switzerland, 2019; Volume 73, pp. 3561–3571. [Google Scholar] [CrossRef]
  45. Niosi, F.; Parrinello, L.; Paduano, B.; Pasta, E.; Carapellese, F.; Bracco, G. On the Influence of Mooring in Wave Energy Converters Productivity: The PeWEC case. In Proceedings of the 2021 International Conference on Electrical, Computer, Communications and Mechatronics Engineering (ICECCME), Flic En Flac, Mauritius, 7–8 October 2021; pp. 1–6. [Google Scholar] [CrossRef]
  46. Anerdi, C.; Paduano, B.; Casalone, P.; Mattiazzo, G.; Giordano, L. Design of a Reinforced Concrete Wave Energy Converter in Extreme Wave Conditions. In Proceedings of the I4SDG Workshop 2021, Online, 25–26 November 2021; Quaglia, G., Gasparetto, A., Petuya, V., Carbone, G., Eds.; Springer International Publishing: Cham, Switzerland, 2022; pp. 70–77. [Google Scholar]
  47. Hatecke, H. The impulse response fitting and ship motions. Ship Technol. Res. 2015, 62, 97–106. [Google Scholar] [CrossRef]
  48. Temarel, P. Loads on ships and offshore structures. In Proceedings of the 26th International Conference on Offshore Mechanics and Arctic Engineering (OMAE 2007), San Diego, CA, USA, 10–15 June 2007; p. 10. [Google Scholar] [CrossRef]
  49. Peña-Sanchez, Y.; Faedo, N.; Penalba, M.; Giorgi, G.; Merigaud, A.; Windt, C.; Garc, D.; Wang, L.; Ringwood, J.V. Finite-Order hydrodynamic Approximation by Moment-Matching (FOAMM ) toolbox for wave energy applications. In Proceedings of the 13th European Wave and Tidal Energy Conference, Napoli, Italy, 1–6 September 2019. [Google Scholar]
  50. Babarit, A.; Guglielmi, M.; Clément, A.H. Declutching control of a wave energy converter. Ocean. Eng. 2009, 36, 1015–1024. [Google Scholar] [CrossRef] [Green Version]
  51. Wu, J.; Yao, Y.; Zhou, L.; Göteman, M. Latching and declutching control of the solo duck wave-energy converter with different load types. Energies 2017, 10, 70. [Google Scholar] [CrossRef]
  52. Folley, M.; Whittaker, T. Preliminary cross-Validation of wave energy converter array interactions. In Proceedings of the International Conference on Offshore Mechanics and Arctic Engineering-OMAE. American Society of Mechanical Engineers Digital Collection, Nantes, France, 9–14 June 2013; Volume 8. [Google Scholar] [CrossRef]
  53. Babarit, A.; Hals, J.; Kurniawan, A.; Muliawan, M.; Moan, T.; Krokstad, J. The NumWEC Project: Numerical Esitmation of Energy Delivery from a Selection of Wave Energy Converters; Technical Report December; Norwegian University of Science and Technology: Trondheim, Norway, 2011. [Google Scholar] [CrossRef]
  54. Folley, M. Chapter 4 - Spectral-Domain Models. In Numerical Modelling of Wave Energy Converters; Academic Press: Cambridge, MA, USA, 2016; pp. 67–80. ISBN 9780128032107. [Google Scholar] [CrossRef]
  55. Roberts, J.; Spanos, P. Random Vibration and Statistical Linearization by Roberts JB, Spanos PD; John Wiley & Sons: New York, NY, USA, 1990. [Google Scholar]
  56. Da Silva, L.S.; Morishita, H.M.; Pesce, C.P.; Gonçalves, R.T. Nonlinear analysis of a heaving point absorber in frequency domain via statistical linearization. In Proceedings of the International Conference on Offshore Mechanics and Arctic Engineering—OMAE, Glasgow, Scotland, UK, 9–14 June 2019; Volume 9. [Google Scholar] [CrossRef]
  57. Gudmestad, O.T.; Connor, J.J. Linearization methods and the influence of current on the nonlinear hydrodynamic drag force. Appl. Ocean. Res. 1983, 5, 184–194. [Google Scholar] [CrossRef]
  58. Spanos, P.D.; Arena, F.; Richichi, A.; Malara, G. Efficient dynamic analysis of a nonlinear wave energy harvester model. J. Offshore Mech. Arct. Eng. 2016, 138, 1–8. [Google Scholar] [CrossRef]
  59. Spanos, P.D.; Strati, F.M.; Malara, G.; Arena, F. Stochastic dynamic analysis of U-OWC wave energy converters. In Proceedings of the International Conference on Offshore Mechanics and Arctic Engineering—OMAE, Trondheim, Norway, 25–30 June 2017; Volume 10. [Google Scholar] [CrossRef]
  60. Bain, L.J.; Engelhardt, M. Introduction to Probability and Mathematical Statistics; Classic Series; Brooks/Cole Cengage Learning: Boston, MA, USA, 1993; Volume 49, p. 673. [Google Scholar] [CrossRef]
  61. Rexroth, B. Hägglunds Drive Systems and Solutions. 2020. Available online: https://dc-us.resource.bosch.com/media/us (accessed on 22 January 2021).
  62. Hansen, R.H.; Kramer, M.M.; Vidal, E. Discrete displacement hydraulic power take-off system for the wavestar wave energy converter. Energies 2013, 6, 4001–4044. [Google Scholar] [CrossRef]
  63. Hansen, R.H. Aalborg Universitet Design and Control of the PowerTake-Off System for a Wave Energy Converter with Multiple Absorbers Hansen, Rico Hjerm Publication Date. Ph.D. Thesis, Aalborg Universitet, Aalborg, Denmark, 2013. [Google Scholar]
  64. Garcia-Teruel, A.; Forehand, D.I.; Jeffrey, H. Wave Energy Converter hull design for manufacturability and reduced LCOE. In Proceedings of the 7th International Conference on Ocean Energy (ICOE), Cherbourg, Normandy, France, 12–14 June 2018; pp. 1–9. [Google Scholar]
  65. Fontana, M.; Casalone, P.; Sirigu, S.A.; Giorgi, G.; Bracco, G.; Mattiazzo, G. Viscous damping identification for a wave energy converter using CFD-URANS simulations. J. Mar. Sci. Eng. 2020, 8, 355. [Google Scholar] [CrossRef]
  66. Bracco, G.; Giorcelli, E.; Giorgi, G.; Mattiazzo, G.; Passione, B.; Raffero, M.; Vissio, G. Performance assessment of the full scale ISWEC system. In Proceedings of the IEEE International Conference on Industrial Technology, Seville, Spain, 17–19 March 2015; Volume 2015-June, pp. 2499–2505. [Google Scholar] [CrossRef]
  67. SKF. Cuscinetti Super-Precision. 2015. Available online: https://www.skf.com/binaries/pub44/Images/0901d196803e9f7d-13383_1-IT_tcm_44-129877.pdf (accessed on 26 January 2020).
  68. Moog. Electro-Hydrostatic Actuation System. 2020. Available online: https://www.moog.com/content/sites/global/en/products.html (accessed on 5 February 2021).
  69. Rexroth, B. Fixed Motor. 2020. Available online: https://www.boschrexroth.com/it/xc/products/product-groups/industrial-hydraulics/motors/axial-piston-motors/fixed-motors (accessed on 5 February 2021).
  70. SIEMENS. 1PH8 Servomotors (Synchronous). Available online: https://mall.industry.siemens.com/mall/it/it/Catalog/Products/10045151 (accessed on 5 February 2021).
  71. Hasselmann, K.; Barnett, T.P.; Bouws, E.; Carlson, H.; Cartwright, D.E.; Eake, K.; Euring, J.A.; Gicnapp, A.; Hasselmann, D.E.; Kruseman, P.; et al. Measurements of wind-wave growth and swell decay during the joint North Sea wave project (JONSWAP). Deut. Hydrogr. Z. 1973, 8, 1–95. [Google Scholar]
  72. Ruellan, M.; Benahmed, H.; Multon, B.; Josset, C.; Babarit, A.; Clement, A. Design methodology for a SEAREV wave energy converter. IEEE Trans. Energy Convers. 2010, 25, 760–767. [Google Scholar] [CrossRef] [Green Version]
  73. Garcia-Rosa, P.B.; Bacelli, G.; Ringwood, J.V. Control-informed geometric optimization of wave energy converters: The impact of device motion and force constraints. Energies 2015, 8, 13672–13687. [Google Scholar] [CrossRef] [Green Version]
  74. Giorgi, G.; Ringwood, J.V. Parametric motion detection for an oscillating water column spar buoy. In Proceedings of the Advances in Renewable Energies Offshore - Proceedings of the 3rd International Conference on Renewable Energies Offshore, RENEW, Lisbon, Portugal, 8–10 October 2018; pp. 505–512. [Google Scholar]
  75. Lagarias, J.C.; Reeds, J.A.; Wright, M.H.; Wright, P.E. Convergence properties of the Nelder-Mead simplex method in low dimensions. SIAM J. Optim. 1998, 9, 112–147. [Google Scholar] [CrossRef] [Green Version]
  76. Sirigu, S.A.; Vissio, G.; Bracco, G.; Giorcelli, E.; Passione, B.; Raffero, M.; Mattiazzo, G. ISWEC design tool. Int. J. Mar. Energy 2016, 15, 201–213. [Google Scholar] [CrossRef]
  77. Ambühl, S.; Kramer, M.; Sørensen, J.D. Reliability-based structural optimization of wave energy converters. Energies 2014, 7, 8178–8200. [Google Scholar] [CrossRef] [Green Version]
  78. De Andres, A.; Maillet, J.; Todalshaug, J.H.; Möller, P.; Bould, D.; Jeffrey, H. Techno-economic related metrics for a wave energy converters feasibility assessment. Sustainability 2016, 8, 1109. [Google Scholar] [CrossRef] [Green Version]
  79. Driscoll, F.R.; Weber, J.W.; Jenne, D.S. Methodology to Calculate the ACE and HPQ Metrics Used in the Wave Energy Prize; Technical Report; NREL/TP-5000-70592; National Renewable Energy Lab.(NREL): Golden, CO, USA, 2018. [Google Scholar] [CrossRef] [Green Version]
  80. Joines, J.A.; Houck, C.R. On the use of non-stationary penalty functions to solve nonlinear constrained optimization problems with GA’s. In Proceedings of the IEEE Conference on Evolutionary Computation—Proceedings, IEEE, Walt Disney World Dolphin Hotel, Orlando, FL, USA, 27–29 June 1994; Number 2/-. pp. 579–584. [Google Scholar] [CrossRef]
  81. Homaifar, A.; Qi, C.X.; Lai, S.H. Constrained optimization via genetic algorithms. Simulation 1994, 62, 242–254. [Google Scholar] [CrossRef]
  82. Sivanandam, S.N.; Deepa, S.N. Introduction to Genetic Algorithms; Springer: Berlin/Heidelberg, Germany, 2008; pp. 1–442. [Google Scholar] [CrossRef] [Green Version]
  83. Horst, R.; Panos, P. Handbook of Global Optimization Volume 2; Springer: Berlin, Germany, 2002; Volume 53, pp. 1689–1699. [Google Scholar] [CrossRef] [Green Version]
  84. Arora, J. Introduction to Optimum Design; Academic Press: Cambridge, MA, USA, 2012. [Google Scholar] [CrossRef]
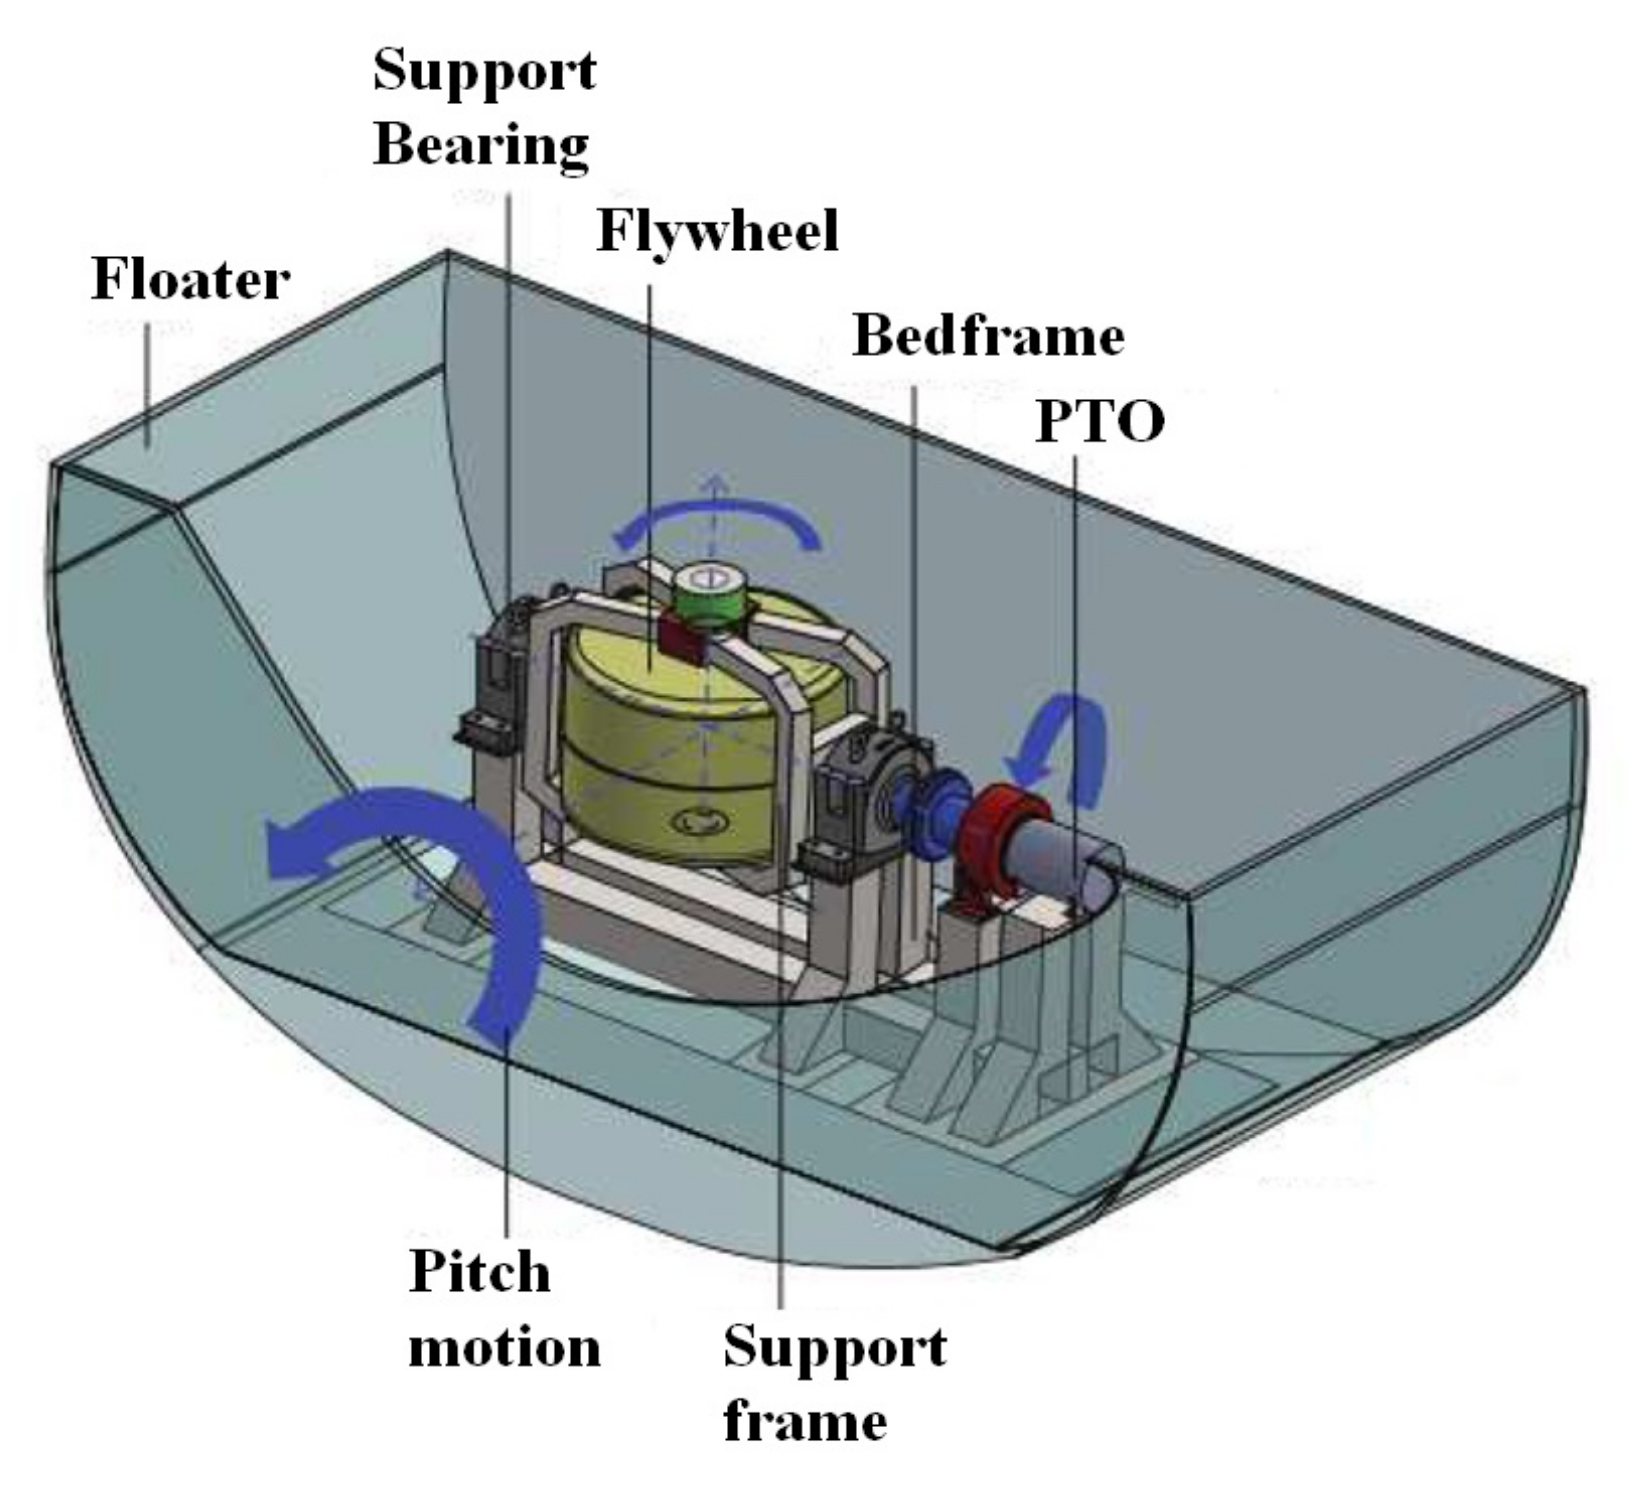
Figure 1. ISWEC architecture and main internal components.
Jmse 10 01468 g001
Figure 2. (a) Geometrical and inertial reference system of the ISWEC device. (b) Detailed design of the gyroscope system and its reference frame.
Jmse 10 01468 g002
Figure 3. Hydraulic PTO components. Adapted from [34], with permission from IEEE, 2021.
Jmse 10 01468 g003
Figure 4. Architecture of the optimization tool. x is the vector of free parameters that define a unique ISWEC device, and J c ( x ) is the fitness function used as a performance indicator of the device x .
Jmse 10 01468 g004
Figure 5. Parametric definition of the cross-sectional of the floater. Adapted from [4], with permission from MDPI, 2020.
Jmse 10 01468 g005
Figure 6. Examples of hull profiles for different values of k and h.
Jmse 10 01468 g006
Figure 7. Examples of ballast mass distribution between the fore/aft and bottom compartments.
Jmse 10 01468 g007
Figure 8. (a) Scheme of the flywheel geometrical parametrization. (b) Scheme of the pendulum fixed at the base of the flywheel support frame.
Jmse 10 01468 g008
Figure 9. Different gyroscopic arrangement solutions: two feasible and one unfeasible disposals.
Jmse 10 01468 g009
Figure 10. Set of selected (a) radial bearings and (b) axial bearings with their inner diameter ( d i , r a d and d i , a x ) and the static load supported ( C 0 , r a d and C 0 , a x ).
Jmse 10 01468 g010
Figure 11. Hydraulic pump solutions offered by Bosch Rexroth in respect to their rated speed ω p u m p and torque T p u m p .
Jmse 10 01468 g011
Figure 12. Cost magnitude of the pump units with respect to the rated torque and the pump type.
Jmse 10 01468 g012
Figure 13. Cost magnitude of the motor-generator units, considering the cost of the associated power electronics and auxiliary components with respect to the rated power of the electric generator.
Jmse 10 01468 g013
Figure 14. Simulation waves (red dots) superposed to the (a) wave occurrences and (b) wave energy for Balder sea site.
Jmse 10 01468 g014
Figure 15. Mortality rate in respect to the generation number.
Jmse 10 01468 g015
Figure 16. (a) AEP and (b) CoE rate of convergence to the best-performing individual with respect to the generation number.
Jmse 10 01468 g016
Figure 17. Productivity (AEP) versus cost of energy (CoE) of the ensemble of the optimisation; each marker (individual) is coloured proportional to the device cost ( C T O T ). (a) Best feasible individuals and (b) a zoom on the Pareto front (red line) concerning the optimal individuals according to the evaluation metrics.
Jmse 10 01468 g017
Figure 18. (a) Hull length L, (b) gyroscope moment of inertia J, (c) pump total displacement D p and (d) hydraulic control mode I D c with respect to the generation number for an AEP-driven optimization. The colour code represents the magnitude of the variable of interest. The dashed line refers to the best individual of each generation.
Jmse 10 01468 g018
Figure 19. (a) Hull length L, (b) gyroscope moment of inertia J, (c) pump total displacement D p and (d) hydraulic control mode I D c with respect to the generation number for a CoE-driven optimization. The colour code represents the magnitude of the variable of interest. The dashed line refers to the best individual of each generation.
Jmse 10 01468 g019
Figure 20. Ten individuals on the Pareto front with respect to their CoE and the associated performance and system parameters. The results refer to a Stage 1a optimization. Bars coloured proportionally to the device cost C T O T . (a) AEP, (b) hull length L, (c) hull mass M h u l l , (d) gyroscope mass m g , (e) gyroscope inertia J, (f) pump displacement D p , (g) pump-rated torque T p u m p and (h) hydraulic control ID I D c . AEP, CoE, cost, and mass data have been hidden for confidentiality.
Jmse 10 01468 g020
Figure 21. Ten individuals on the Pareto front with their CoE and the associated cost: hull, gyroscope and HPTO; (a) absolute cost; and (b) percentage cost.
Jmse 10 01468 g021
Table 1. Design parameters used by the genetic algorithm to define a single ISWEC device. Lower (LB) and upper (UB) bounds are used to constraint the exploration domain.
Hull
Design ParameterSymbolUnitLBUB
Hull lengthLm1045
Hull width factor W f 14
Bow/stern circ. ratio h f 0.51
Height ratio k f 0.51
Maximum pitch angle δ 0 deg1020
Ballast filling ratio B F R 0.351
Gyroscope
Design ParameterSymbolUnitLBUB
Flywheel inertiaJkgm210,00045,000
Gyroscope units n g y r o s 24
Pendulum mass m p kg5008000
Bearings id I D b 115
Hydraulic PTO
Design ParameterSymbolUnitLBUB
Pump id I D p 136
Hydraulic control id I D c 14
Table 2. Pump control combinations considered by the optimization algorithm. *: the pump switching can be enabled only with tandem configurations; if a single pump is used, only the first two control logics are implementable.
ID c Declutching ControlPump Switching *
1nono
2yesno
3noyes
4yesyes
Table 3. Multi objective weights and performance metrices.
Set LabelDescriptionAEP Weight ( w 1 )CoE Weight ( w 2 )
1AEP-driven10
2AEP-weighed-CoE-weighed0.750.25
3AEP-weighed-CoE-weighed0.50.5
4AEP-weighed-CoE-weighed0.250.75
5CoE-driven01
Table 4. Parameters of the genetic algorithm.
NameSymbolValue
Population size P s 75
Maximum generations G m 150
Maximum stall generations G s 50
Convergence threshold Δ 10 6
Elitism percentage e p 5%
Table 5. Key performance differences from the AEP optimum and CoE optimum.
PerformanceSymbolDelta AEP-CoE-Optimum
Delta Annual energy production Δ AEP−37.4%
Delta Cost of energy Δ CoE−14.9%
Delta Device cost Δ C T O T −52.3%
Publisher’s Note: MDPI stays neutral with regard to jurisdictional claims in published maps and institutional affiliations.