

Design and Research of Slope-Pendulum Wave Energy Conversion Device


Abstract
1. Introduction
2. Mathematical
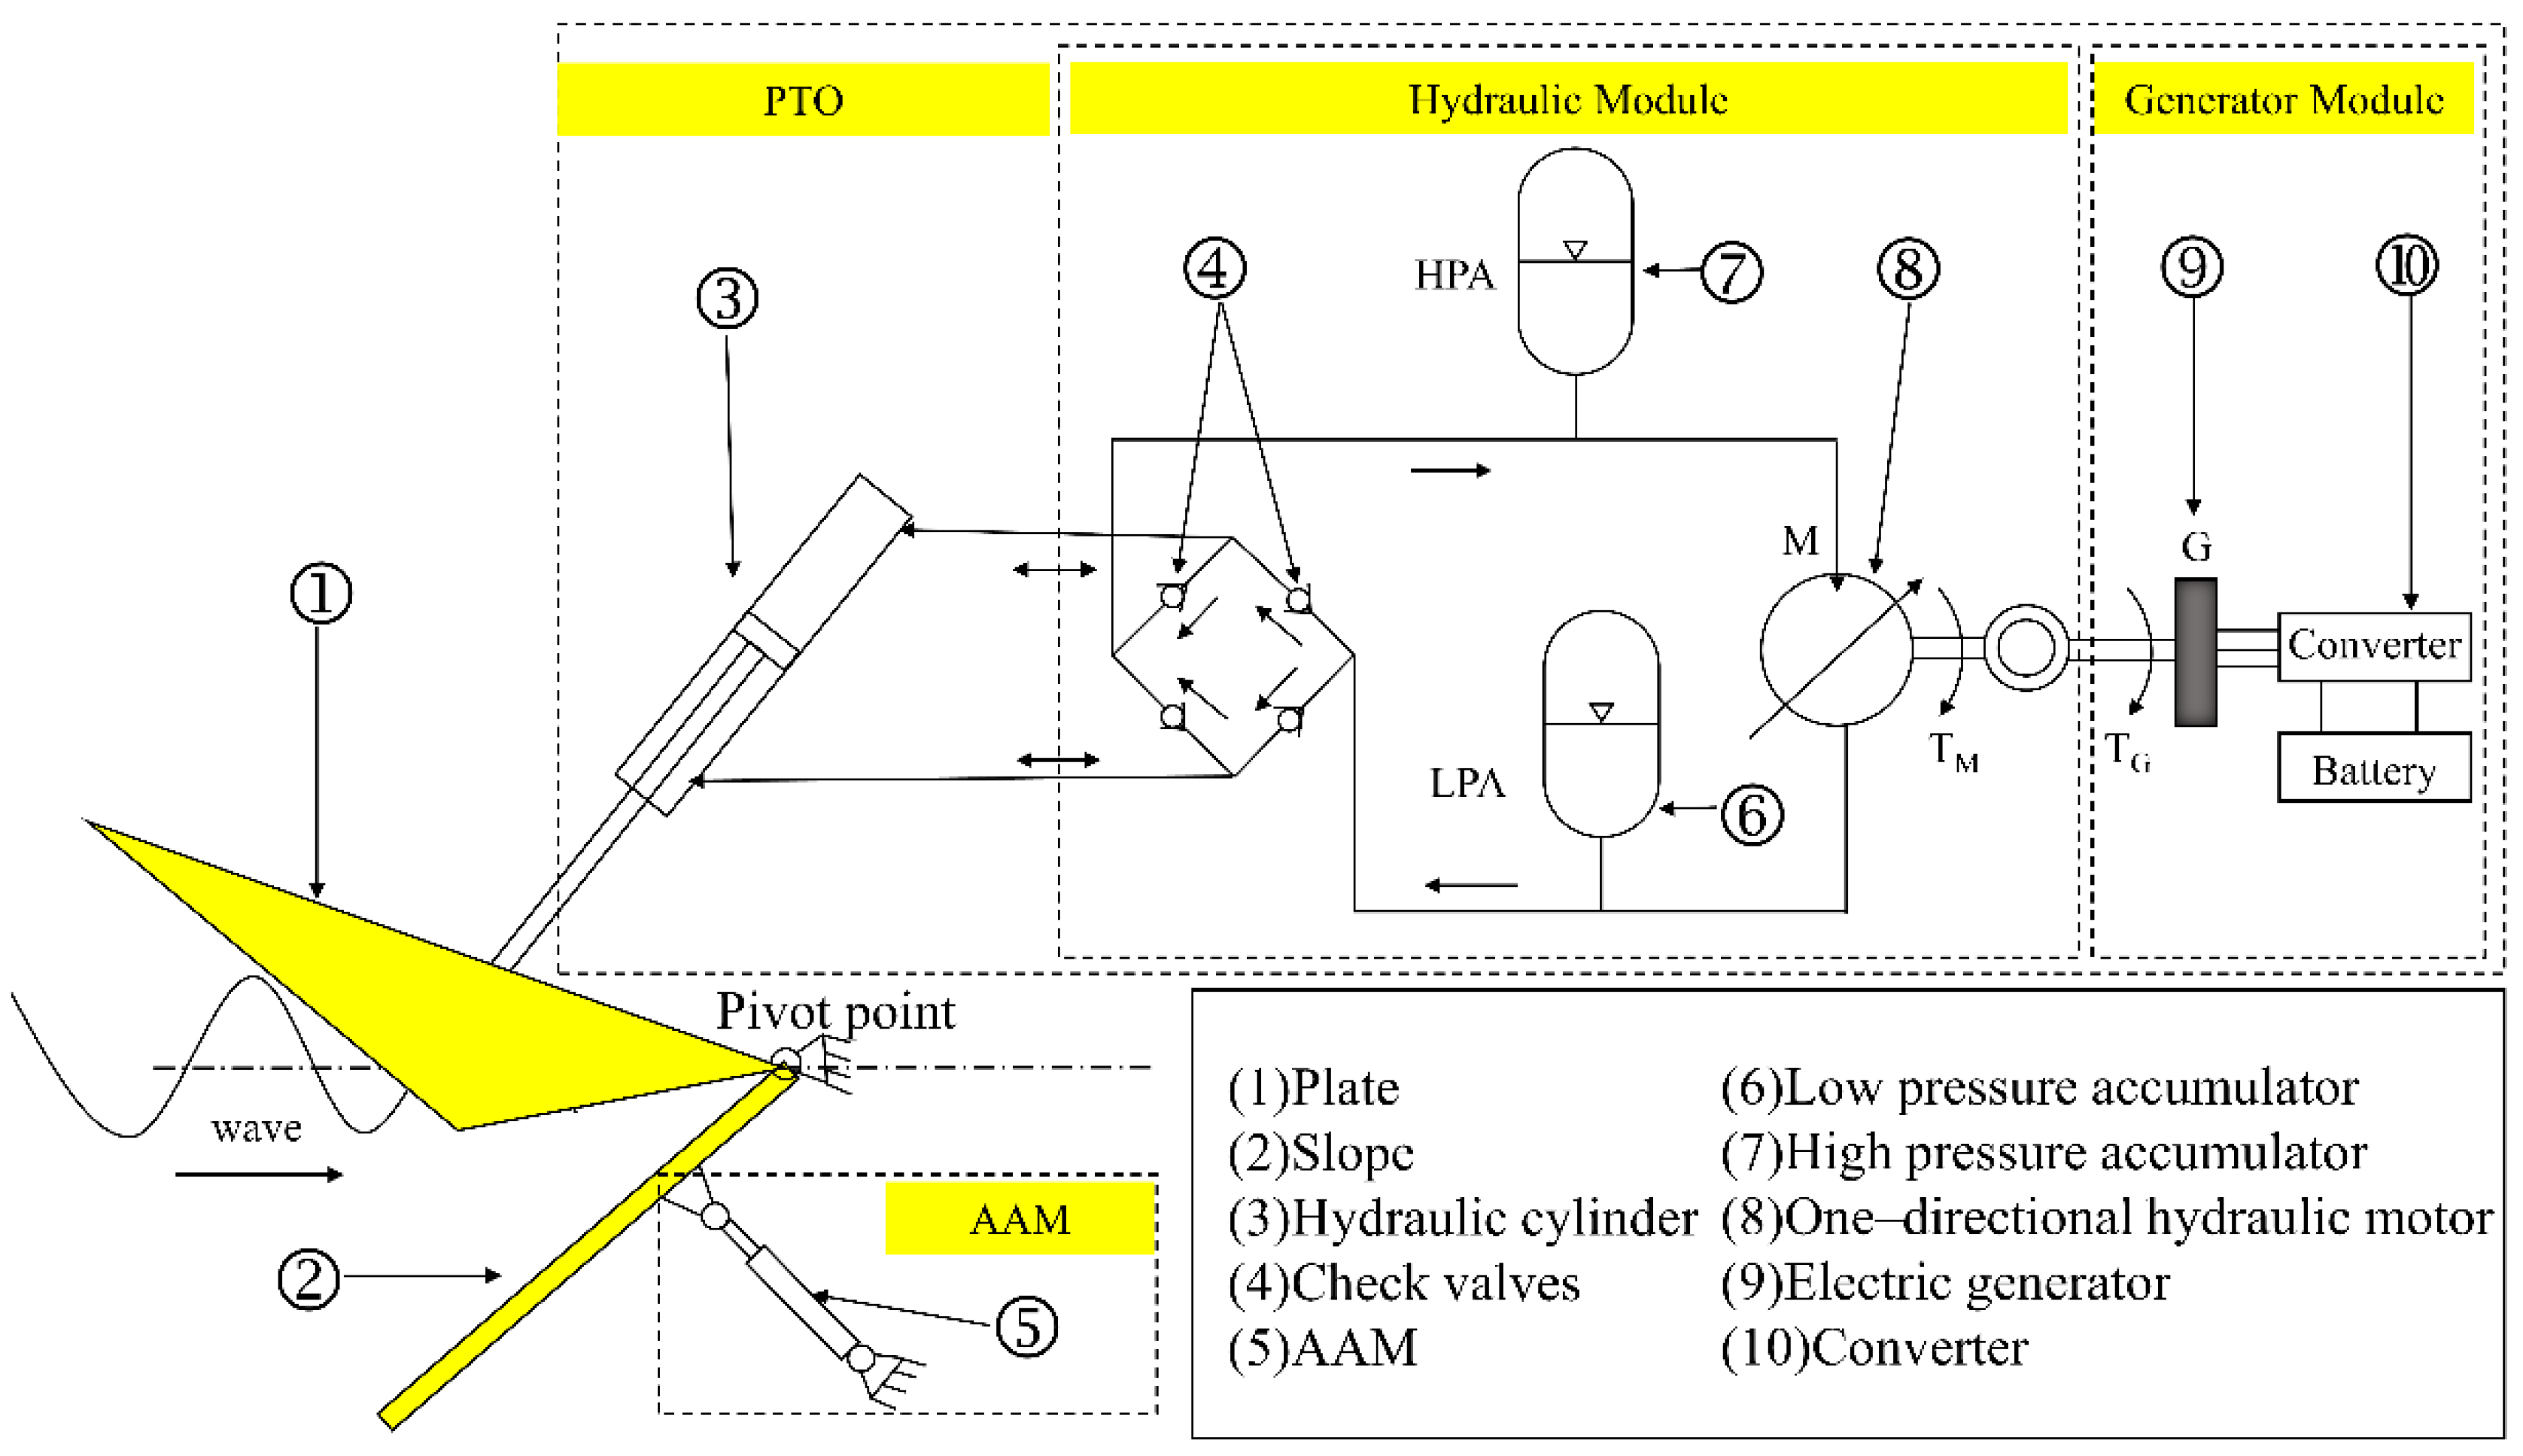
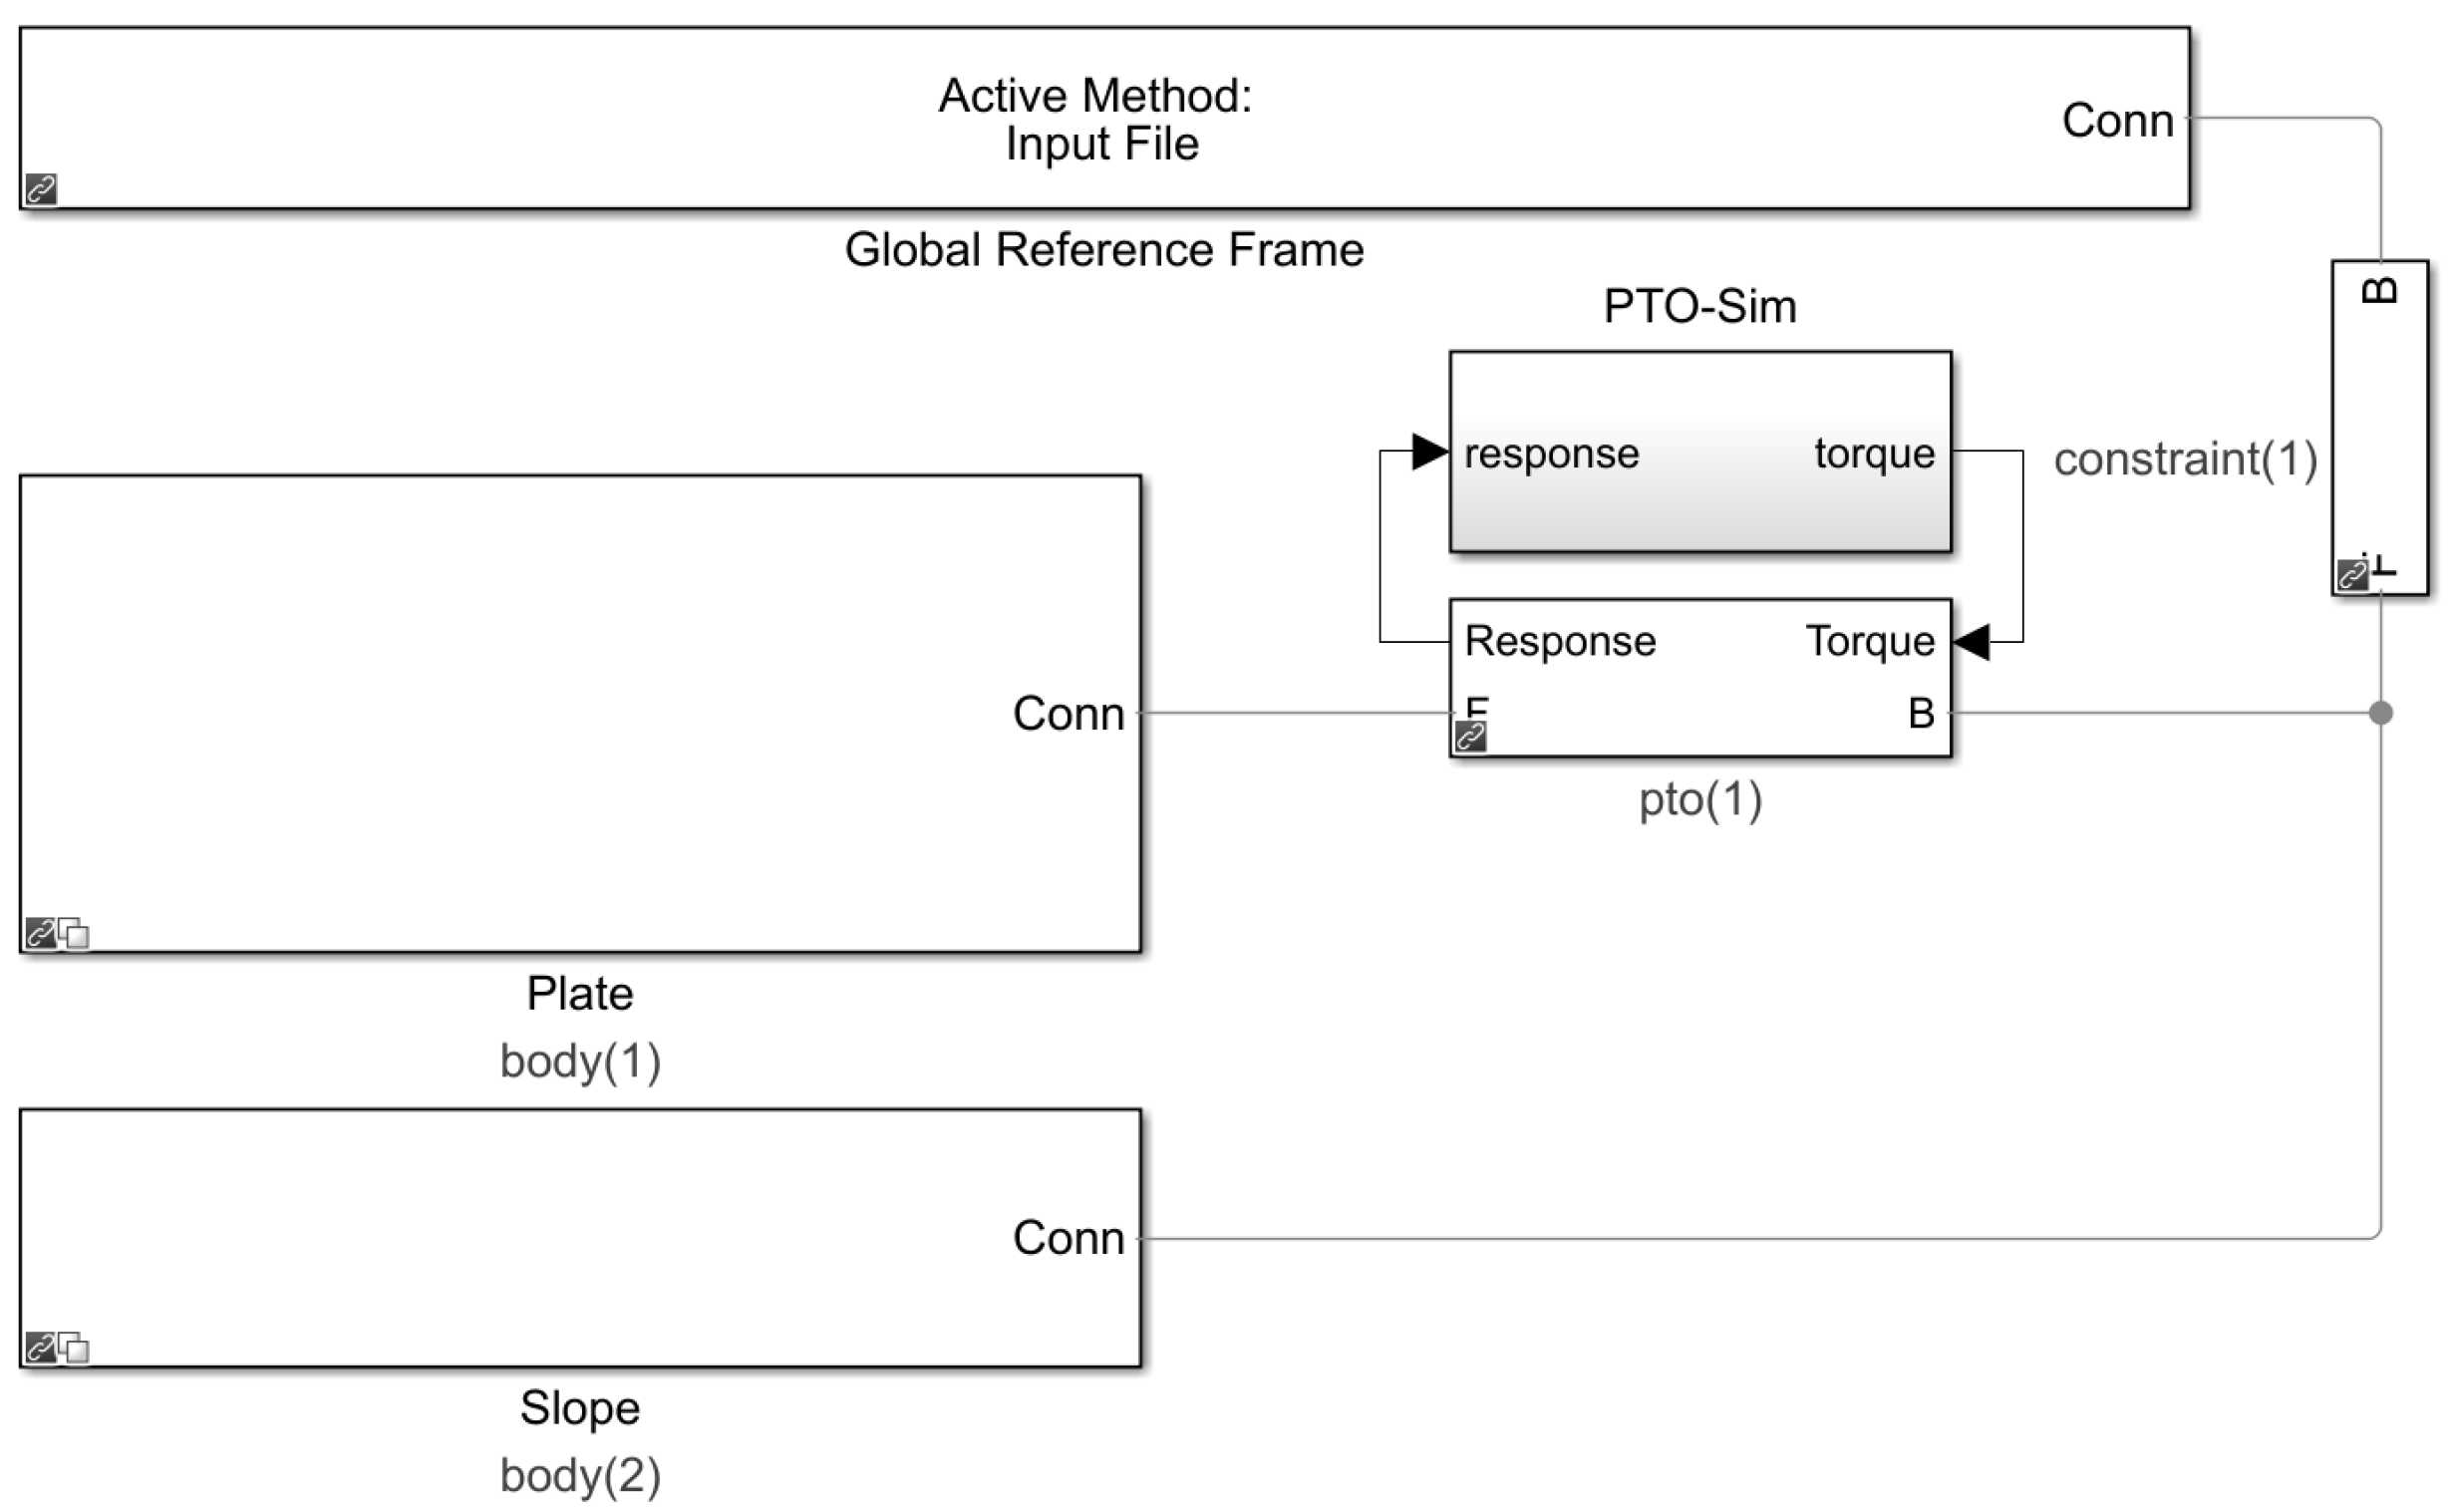
2.1. S-PWEC
2.2. Motion Response
- , , and are the angular displacement, angular velocity, and angular acceleration of the device moving at the pivot point, respectively.
- and are the moment of inertia of the device and the additional moment of inertia at infinite frequency, respectively.
- is the convolution term of the radiation moment, which represents the memory effect of the fluid, where is a small time step.
- and are the buoyancy moment and the gravitational moment, respectively, which constitute the recovery moment of the floating plate, which is .
- is the excitation moment; the excitation moment of the regular wave can be given by the following equation:where denotes taking the real part, denotes the moment per unit wave amplitude of the floating plate at frequency ω, and is used to avoid strong transient flow, which is expressed as:
- is the secondary viscous drag moment; in practice, the wave energy converter device in the process of action with the wave will induce vortex detachment, resulting in a viscous effect [18].where is the coefficient of the secondary damping term in the viscous torque. can be obtained from the relevant literature or hydrodynamic experiments. V is the speed of the floating plate, is the speed of the surrounding fluid, and represents the moment of the viscous force on the pivot point.
- is the damping torque of the hydraulic power take-off.where is the pressure difference in the hydraulic rod, is the cross-sectional area of the hydraulic rod, and is the distance from the intersection of the hydraulic rod and the floating plate to the pivot point. Assuming that the hydraulic rod is always perpendicular to the floating plate, and the nonlinearity of the PTO is not considered, the influence of the nonlinear PTO on the wave energy capture efficiency will be studied in future work.
3. Results and Discussion
3.1. Initial Condition Setting
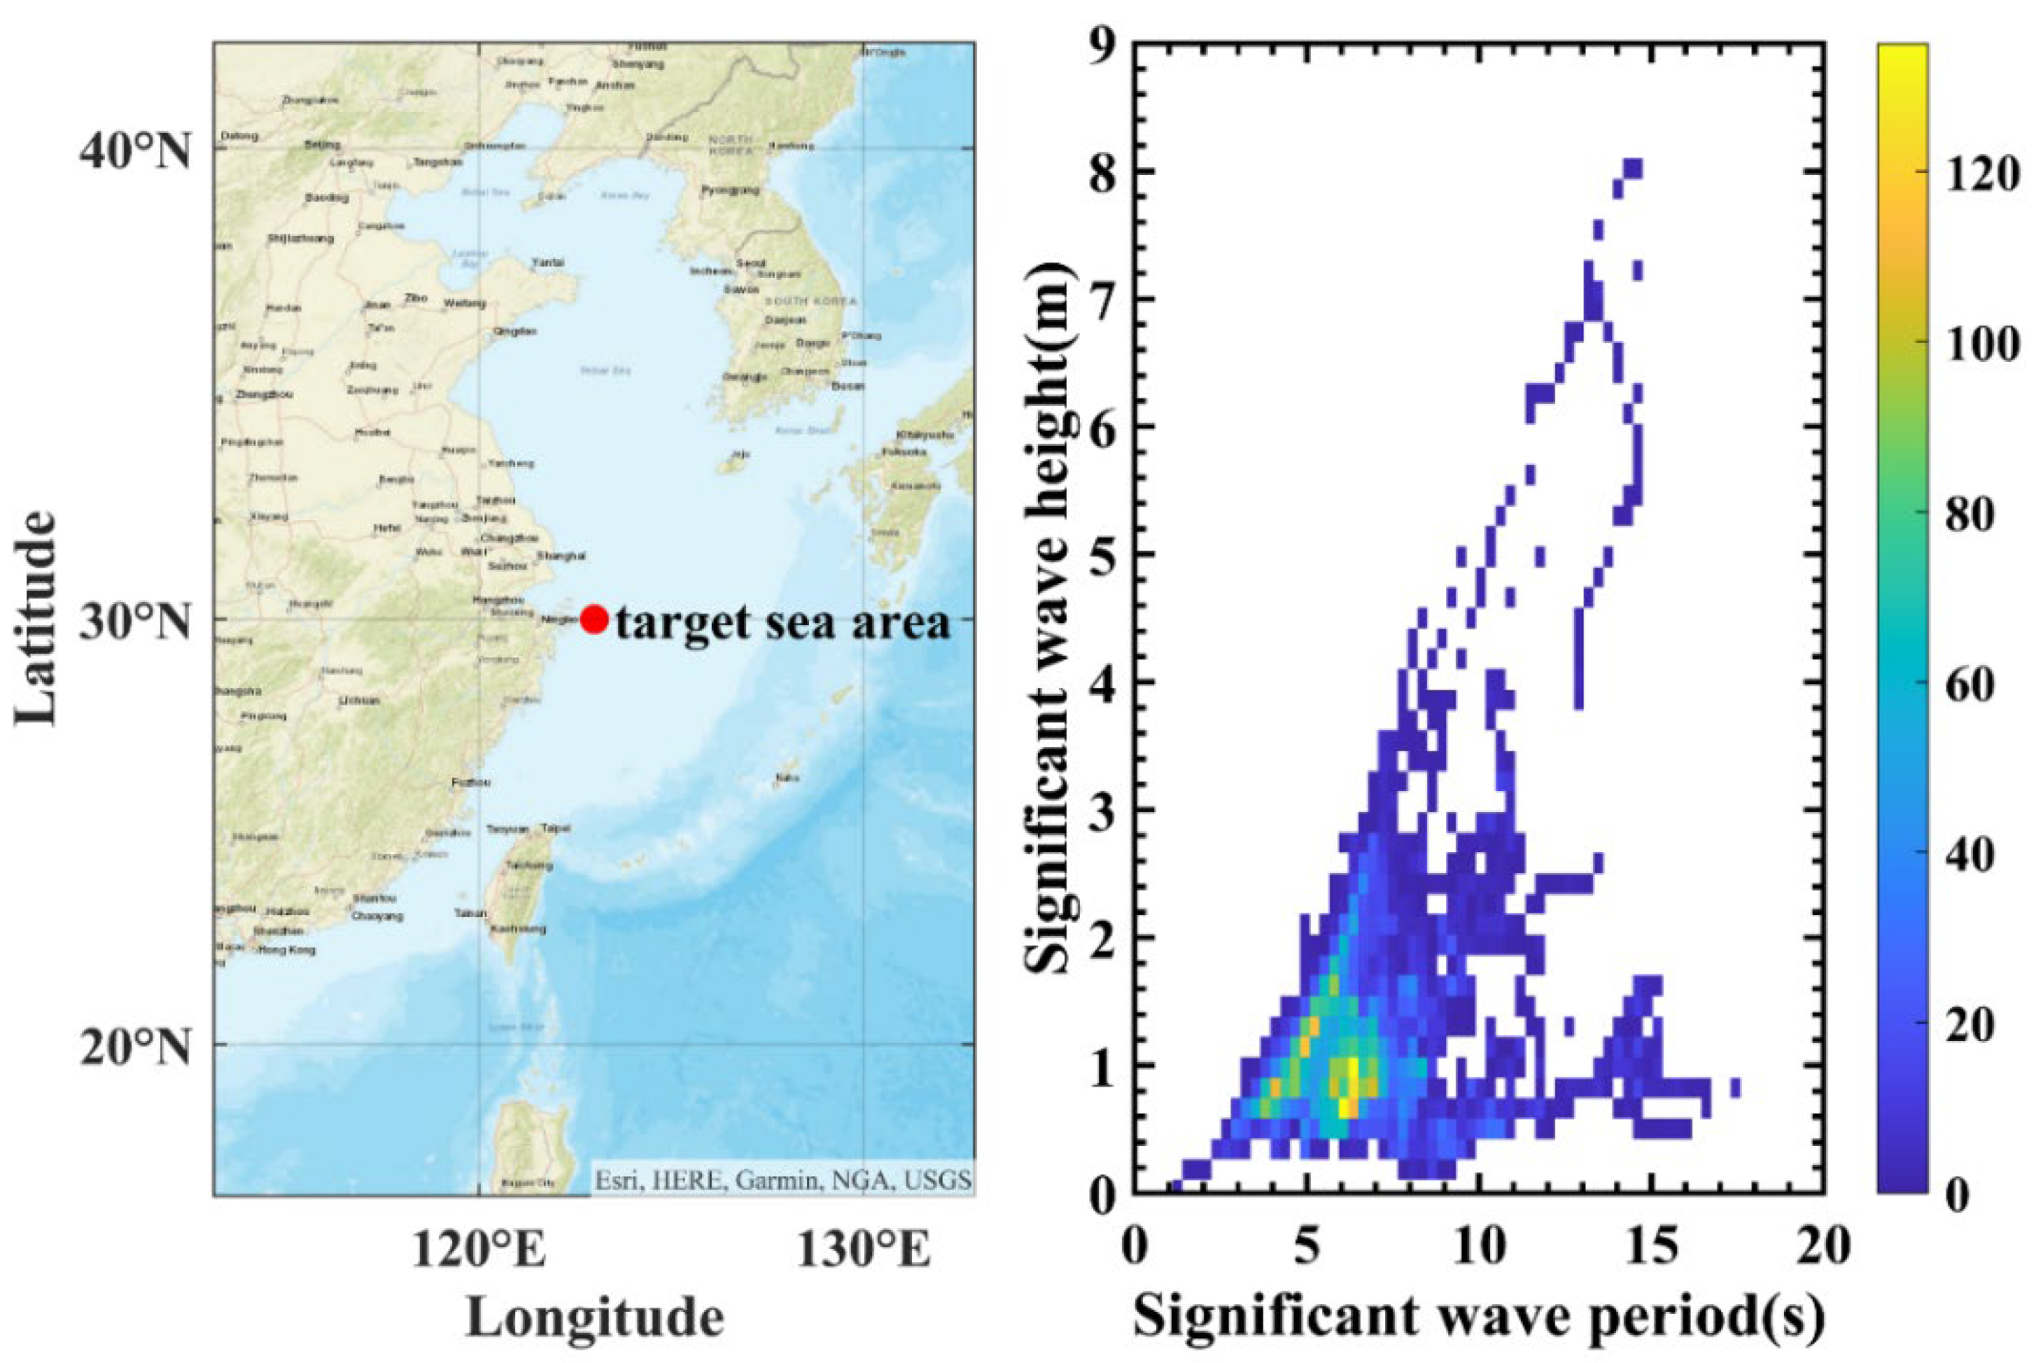
3.1.1. Analysis of Sea State Conditions
3.1.2. Single WEC Model
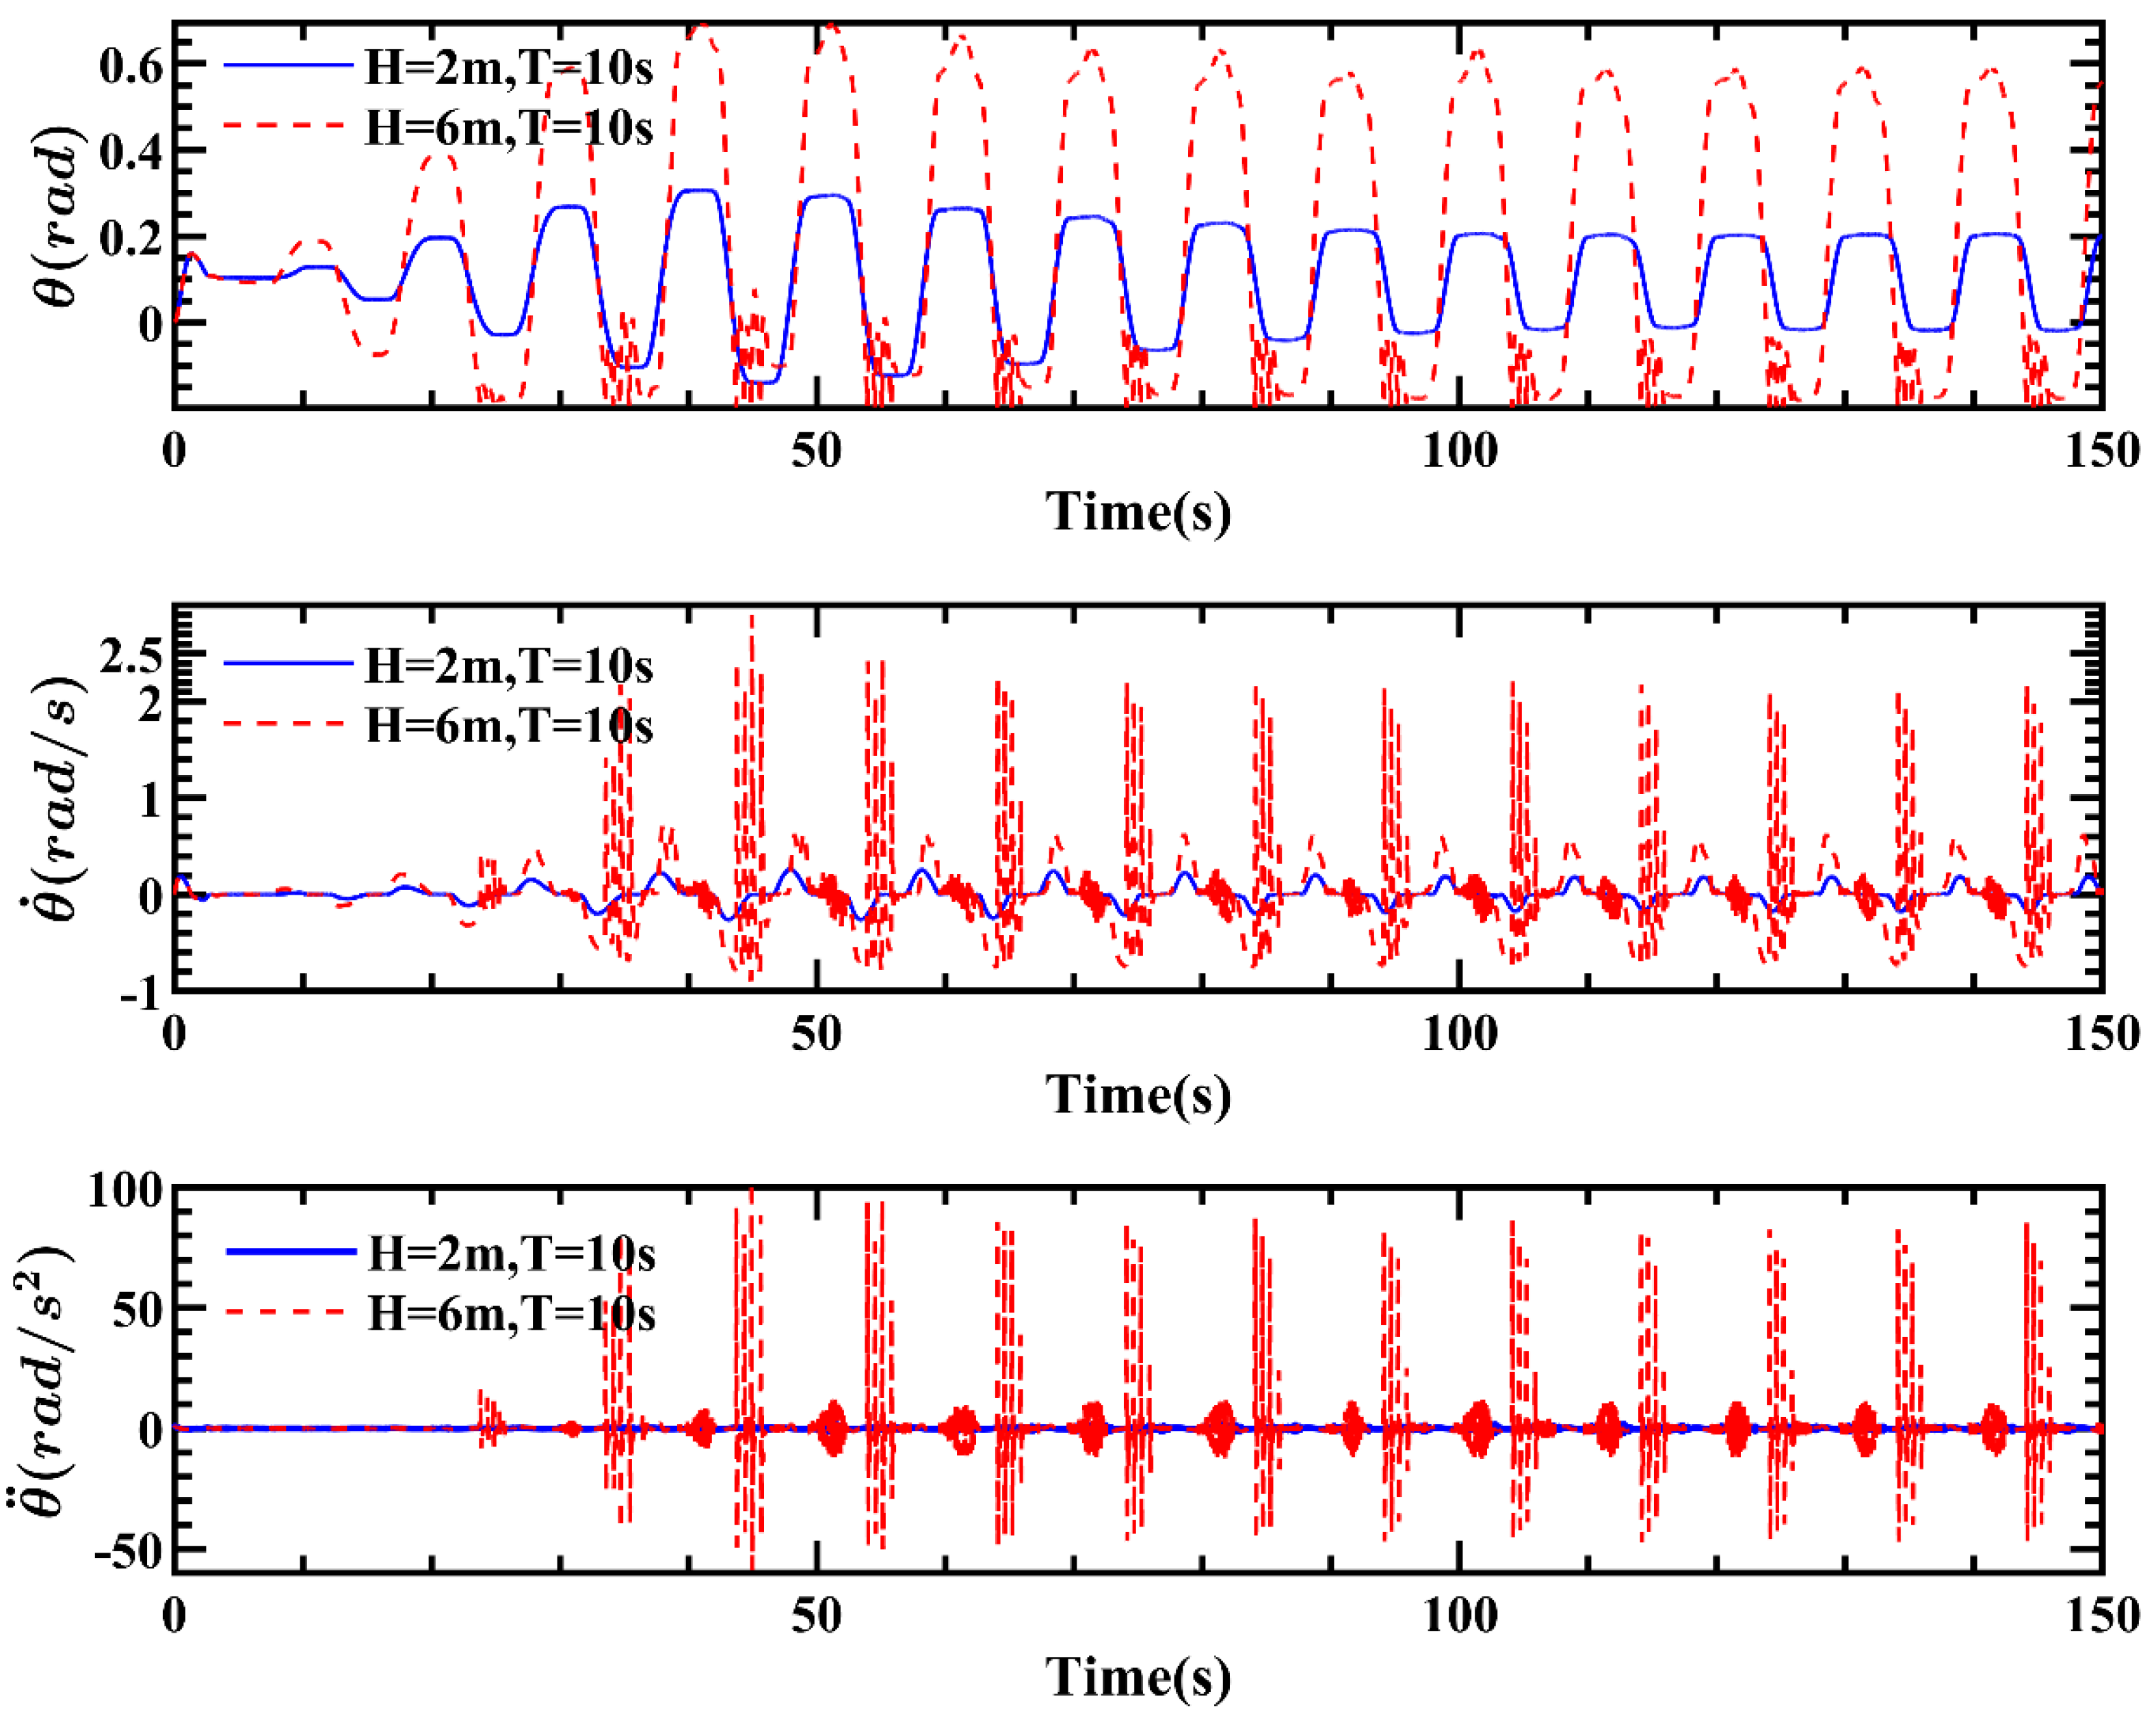
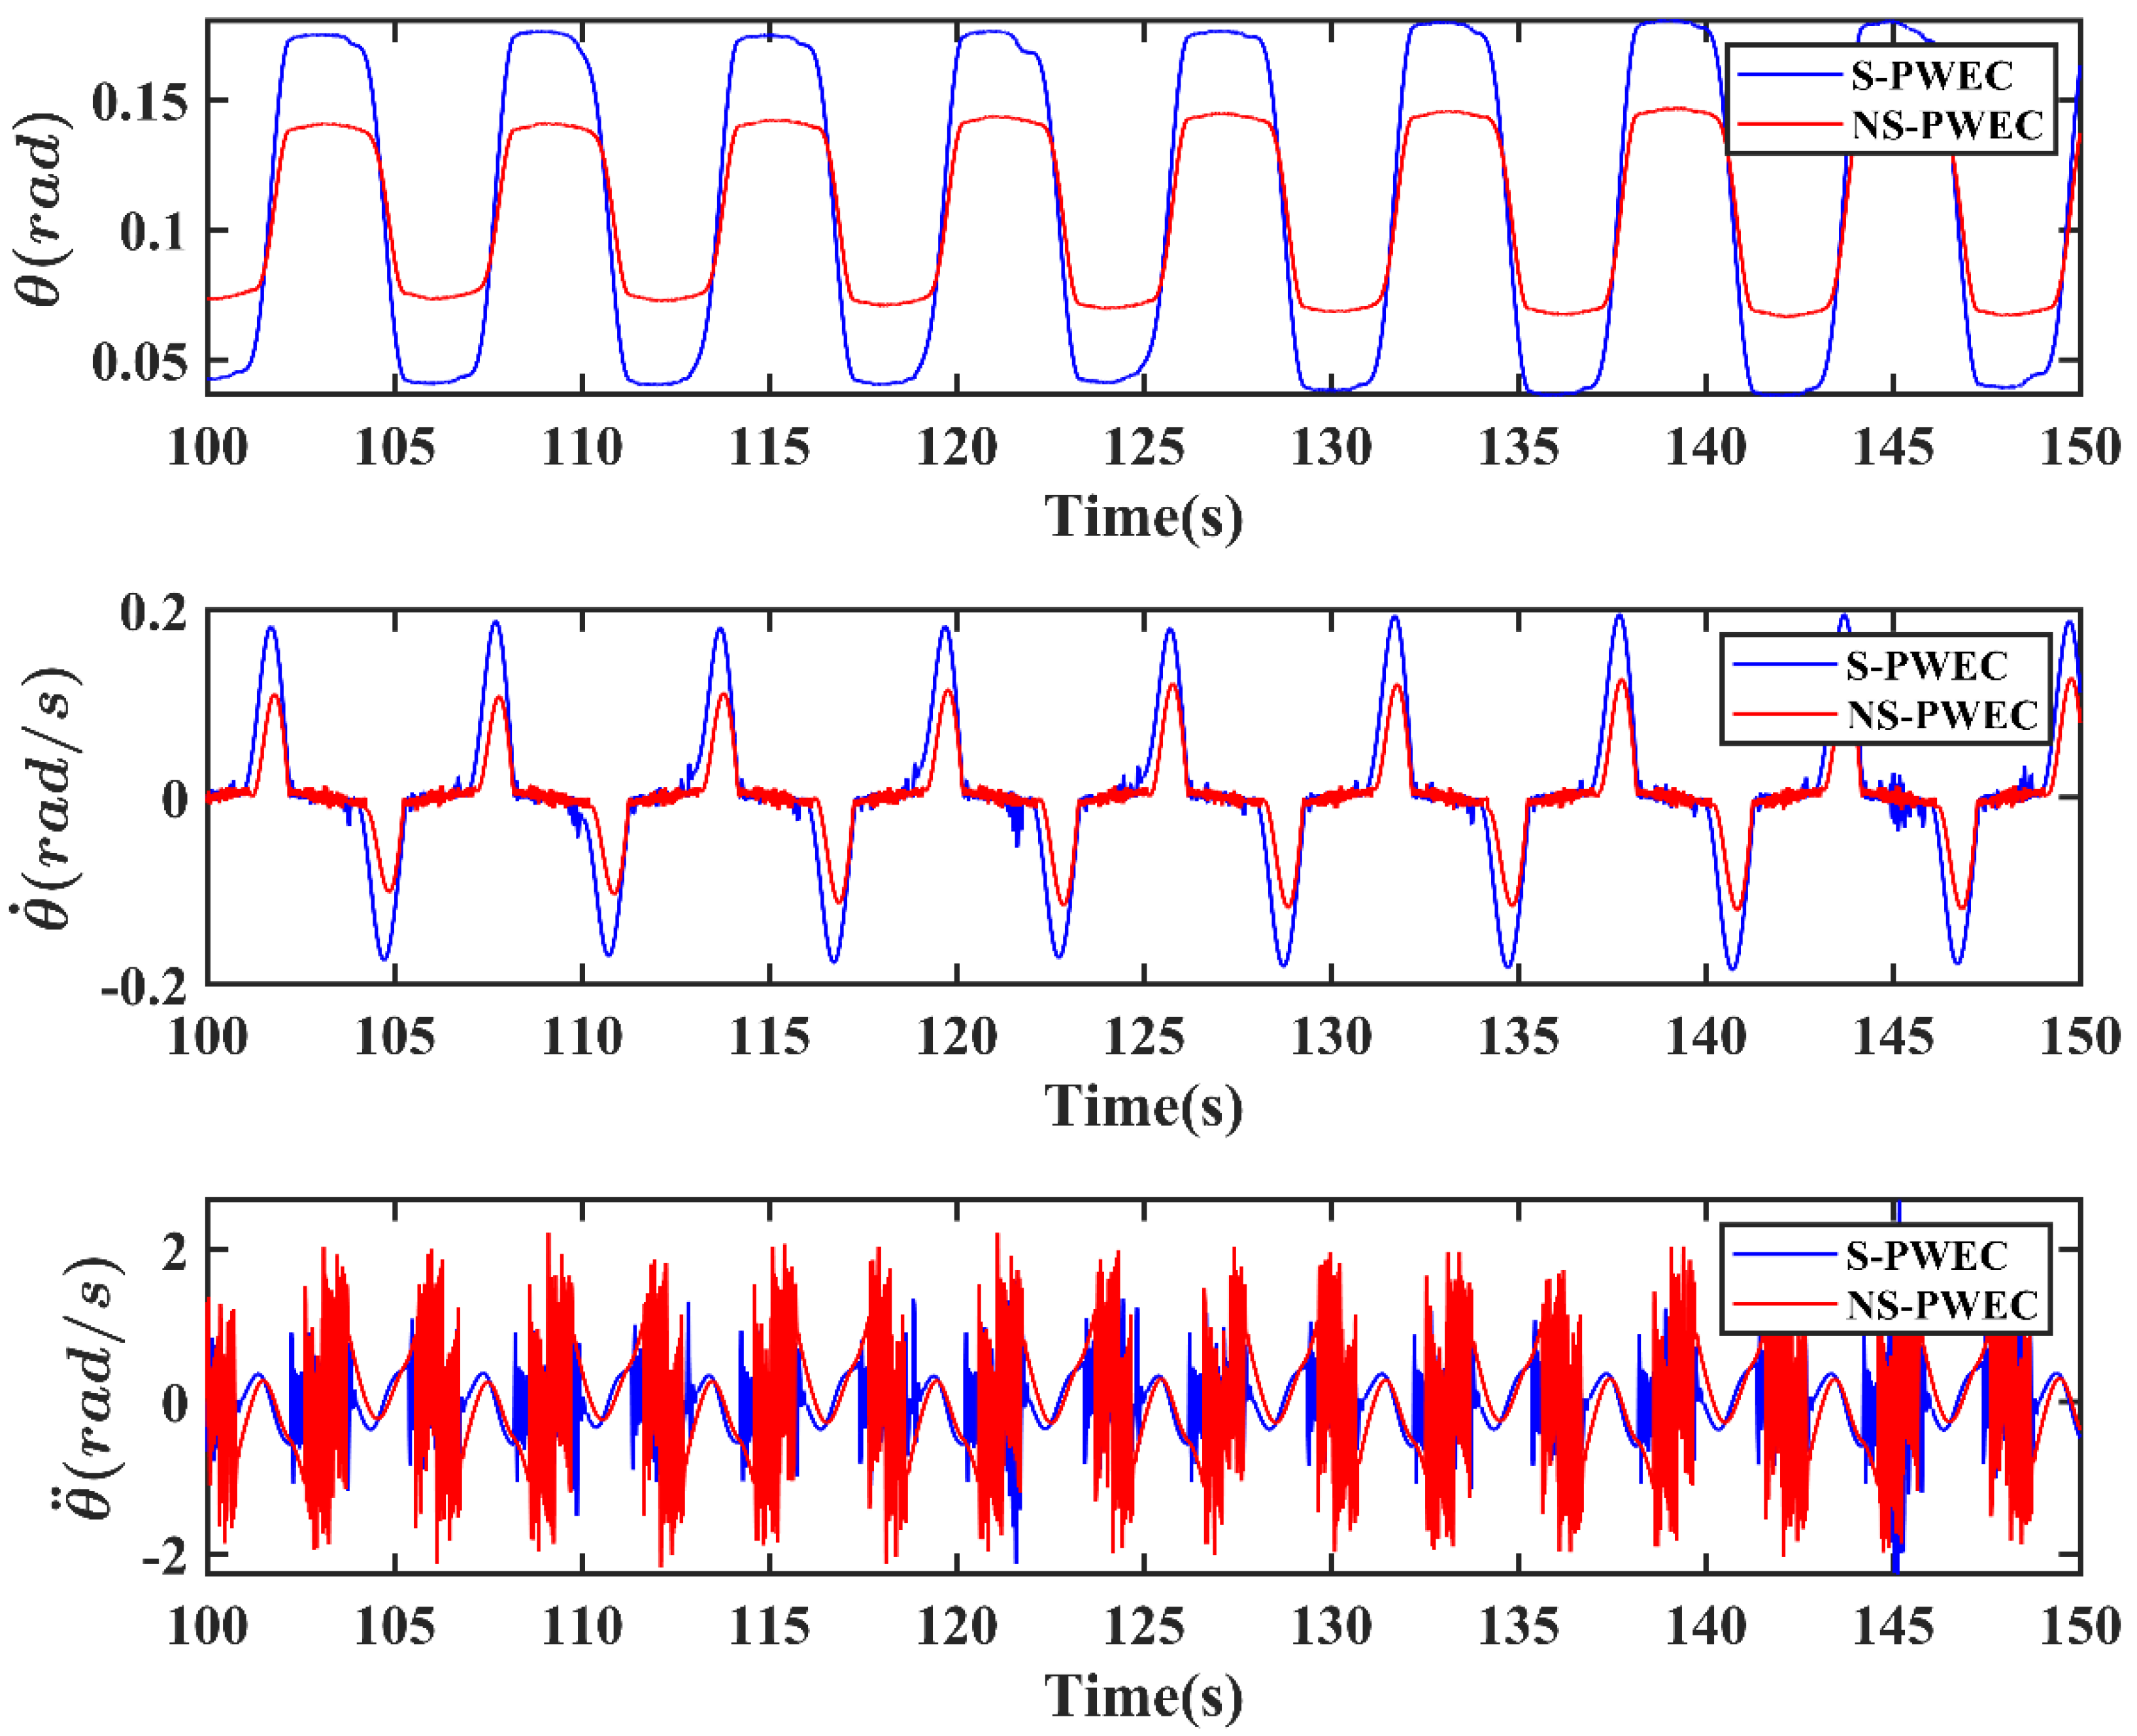
3.2. Motion Response
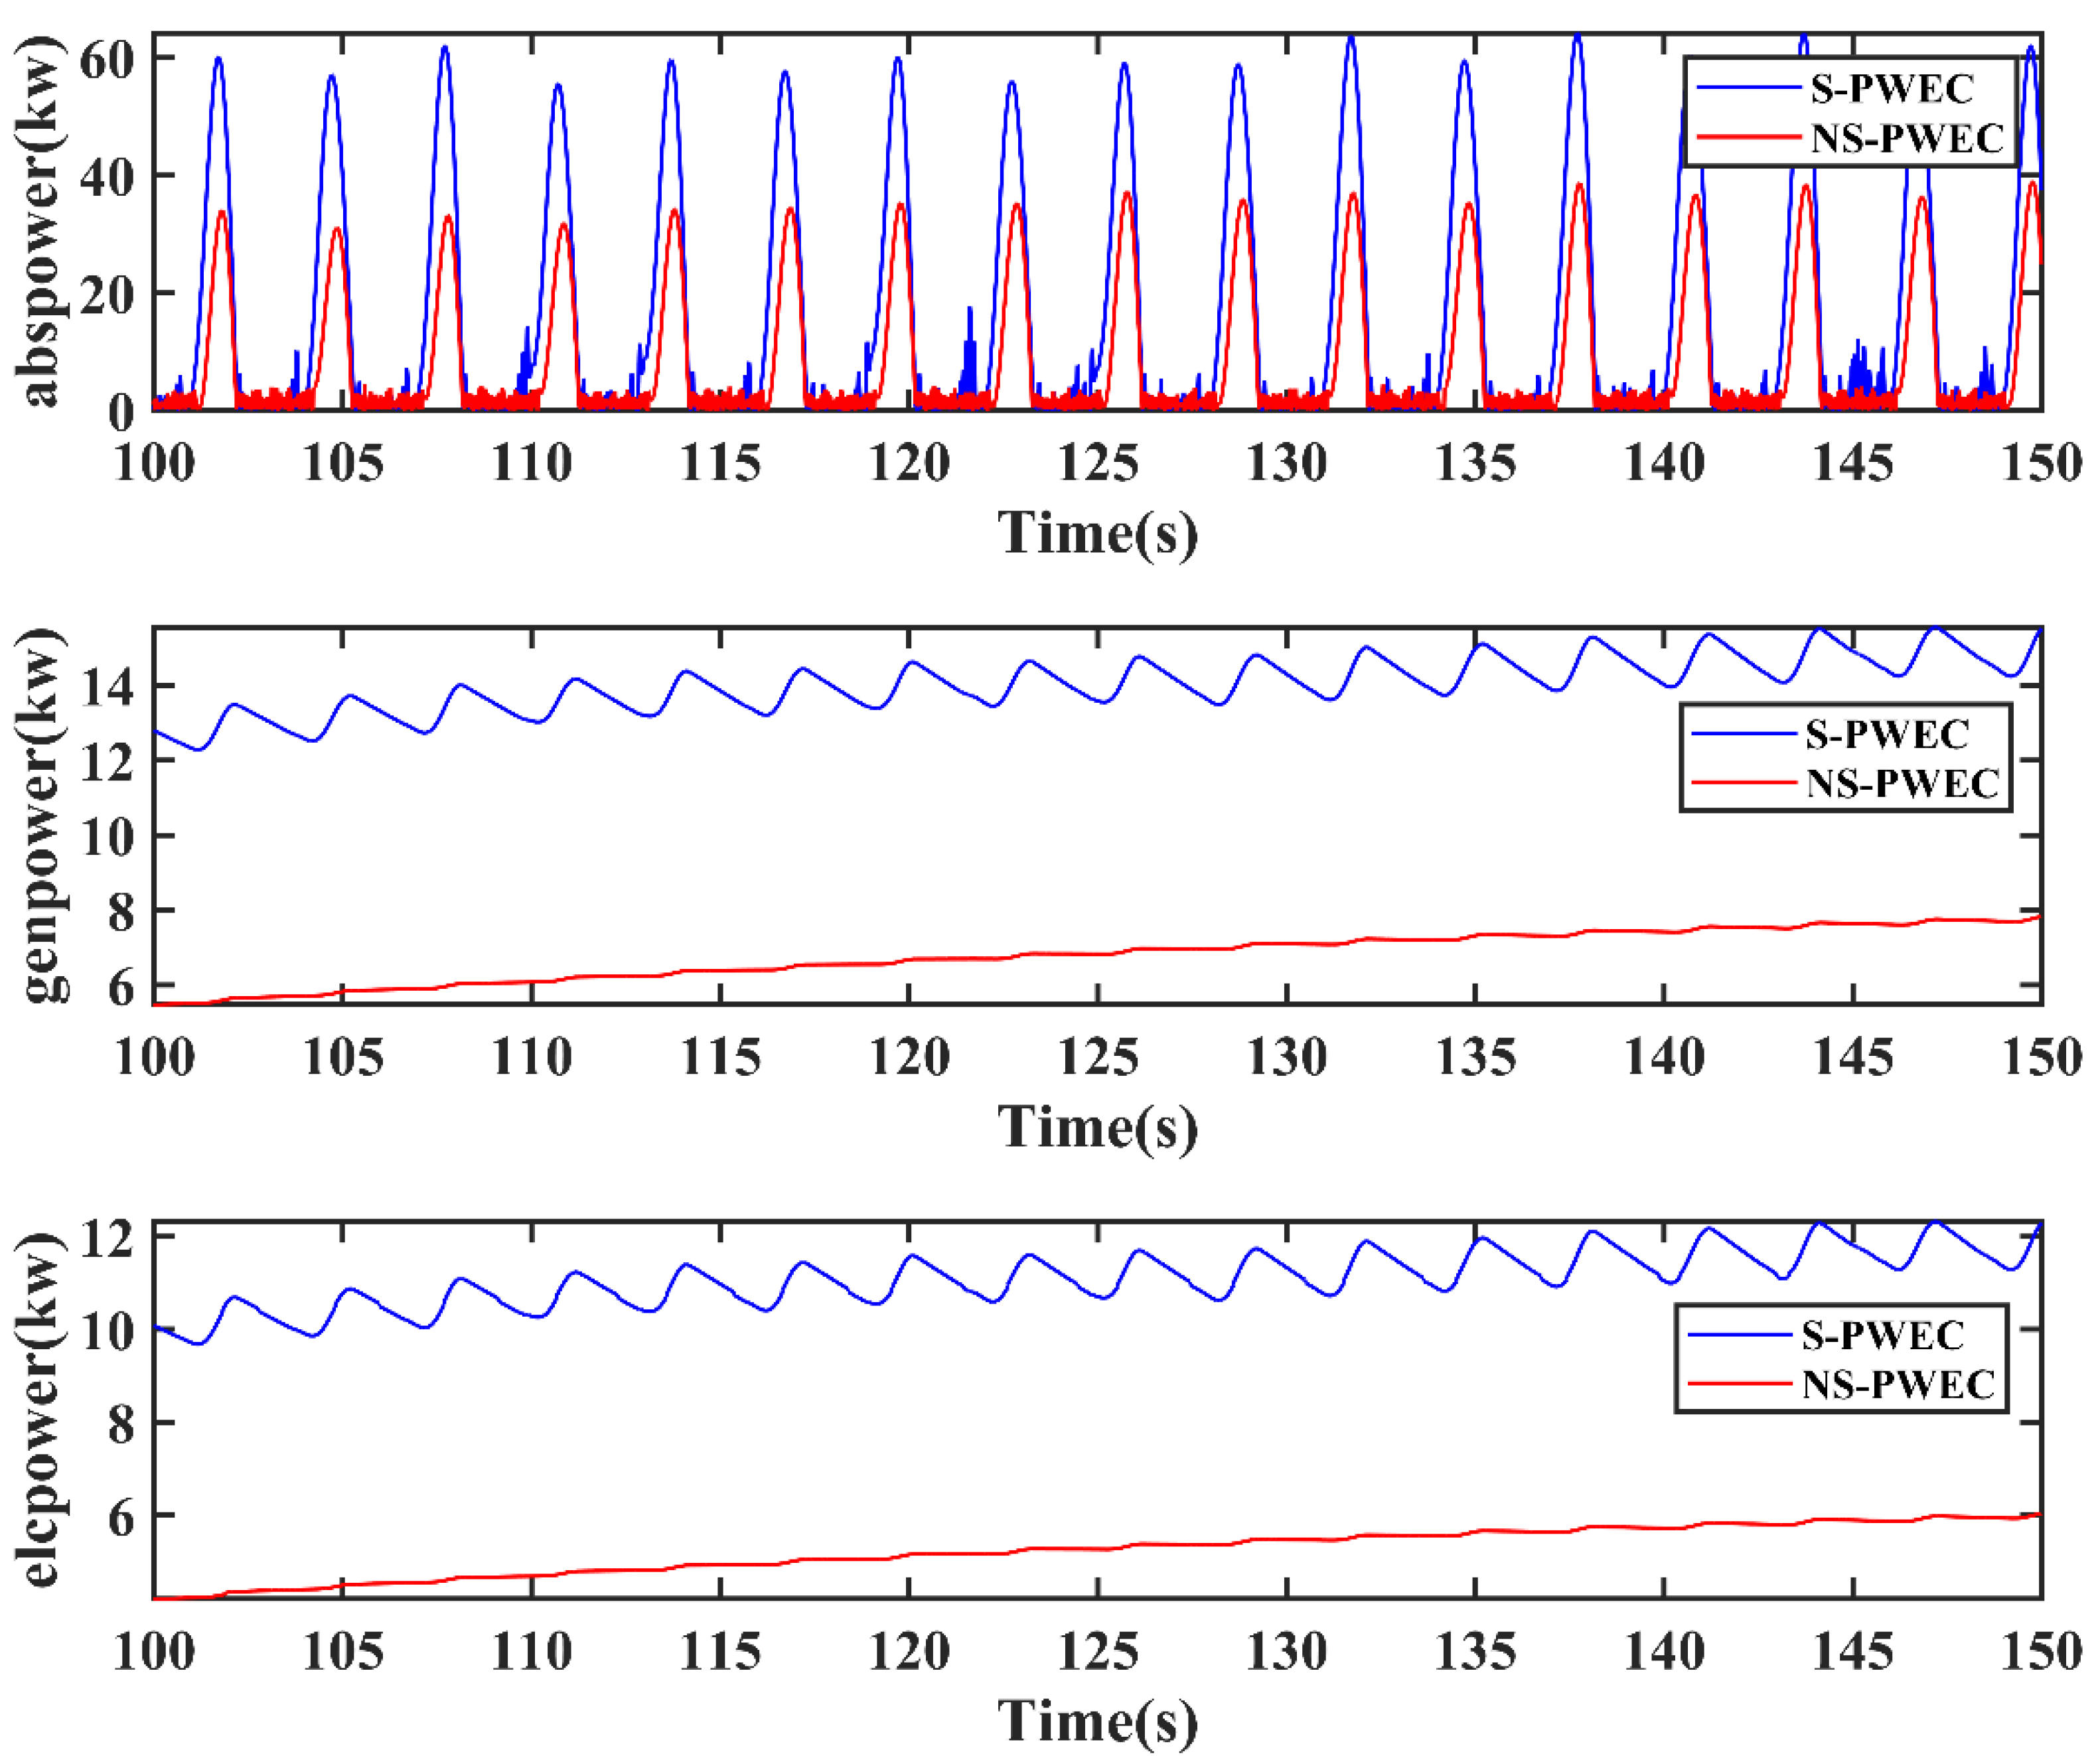
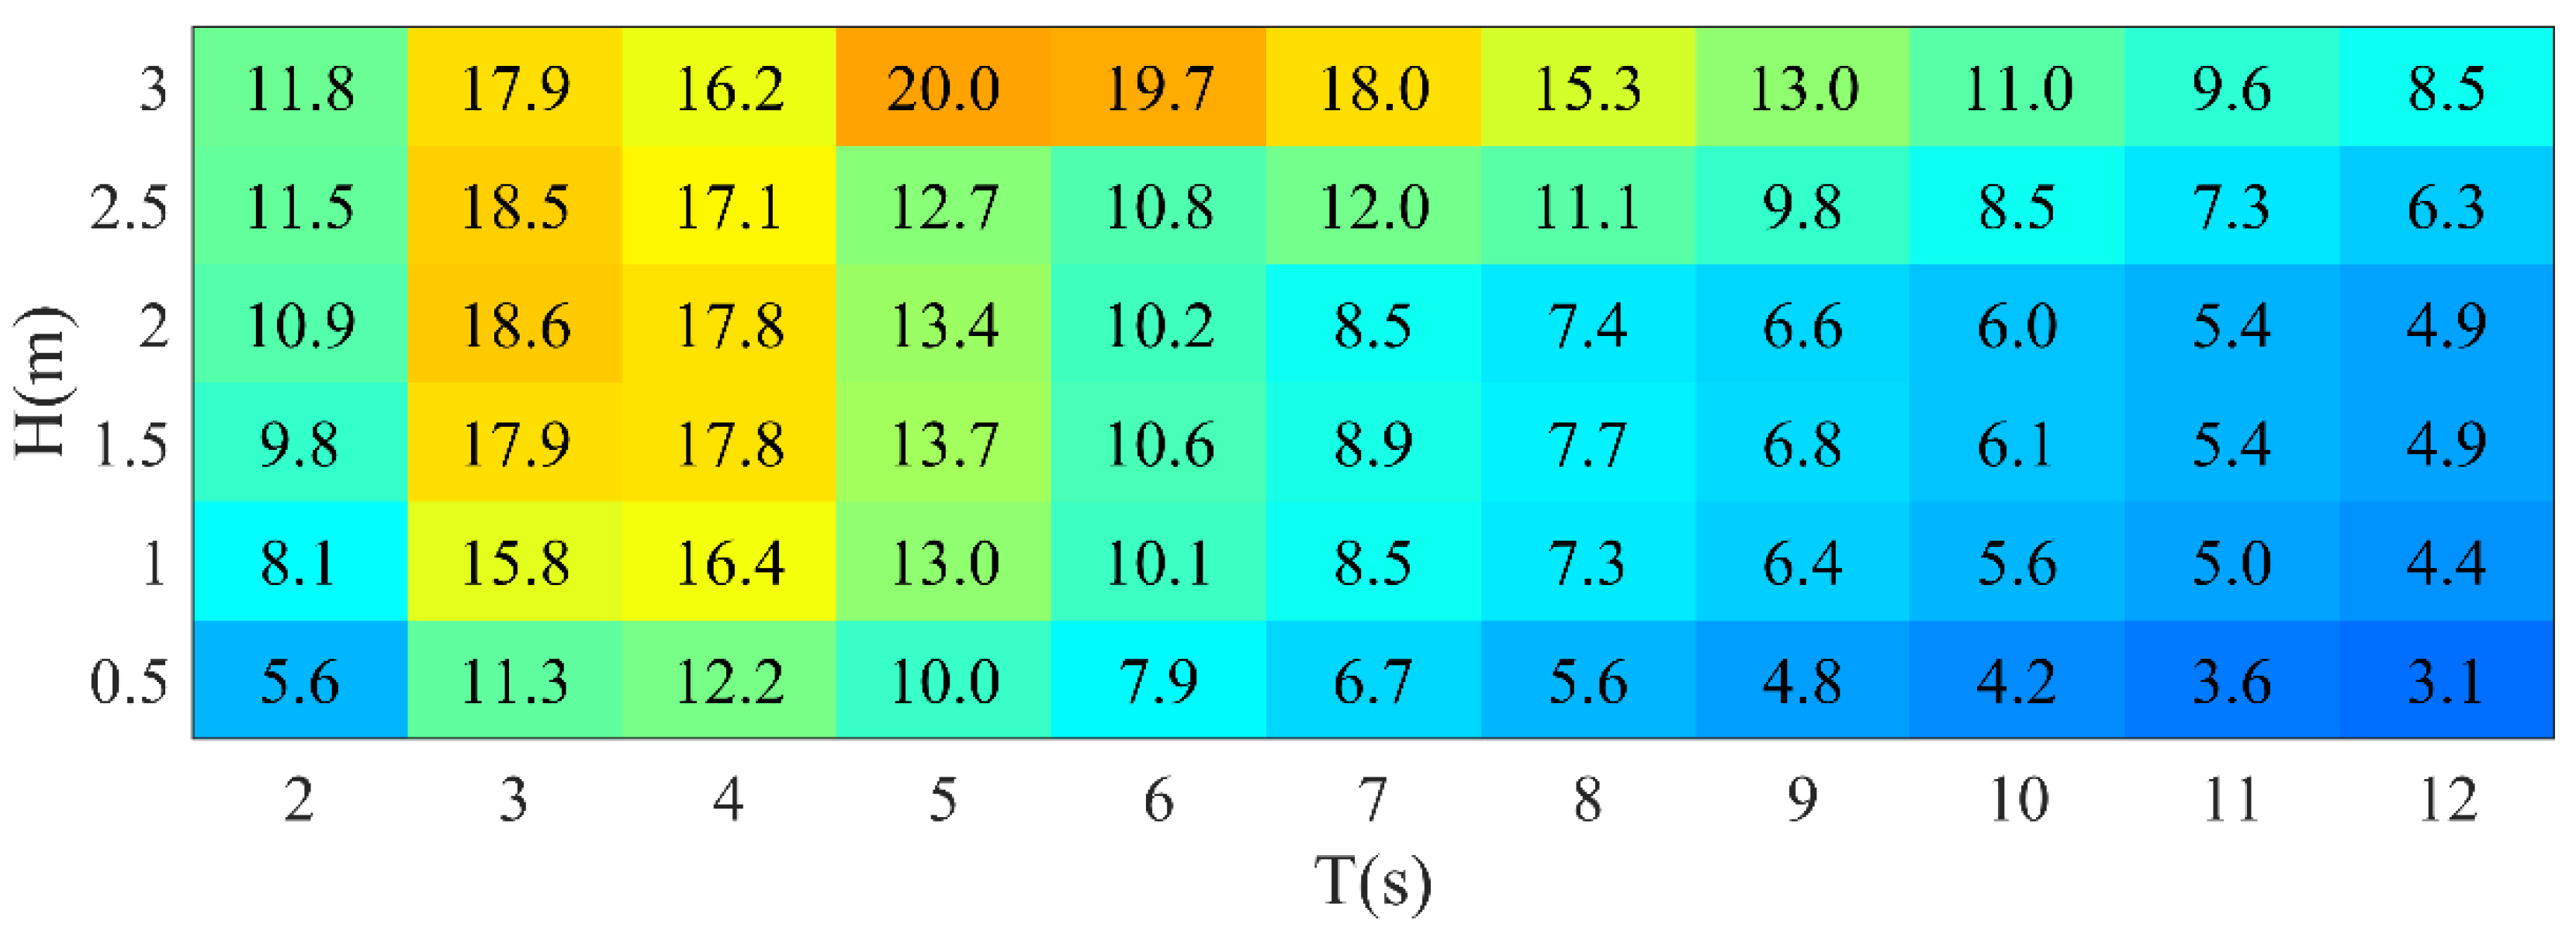
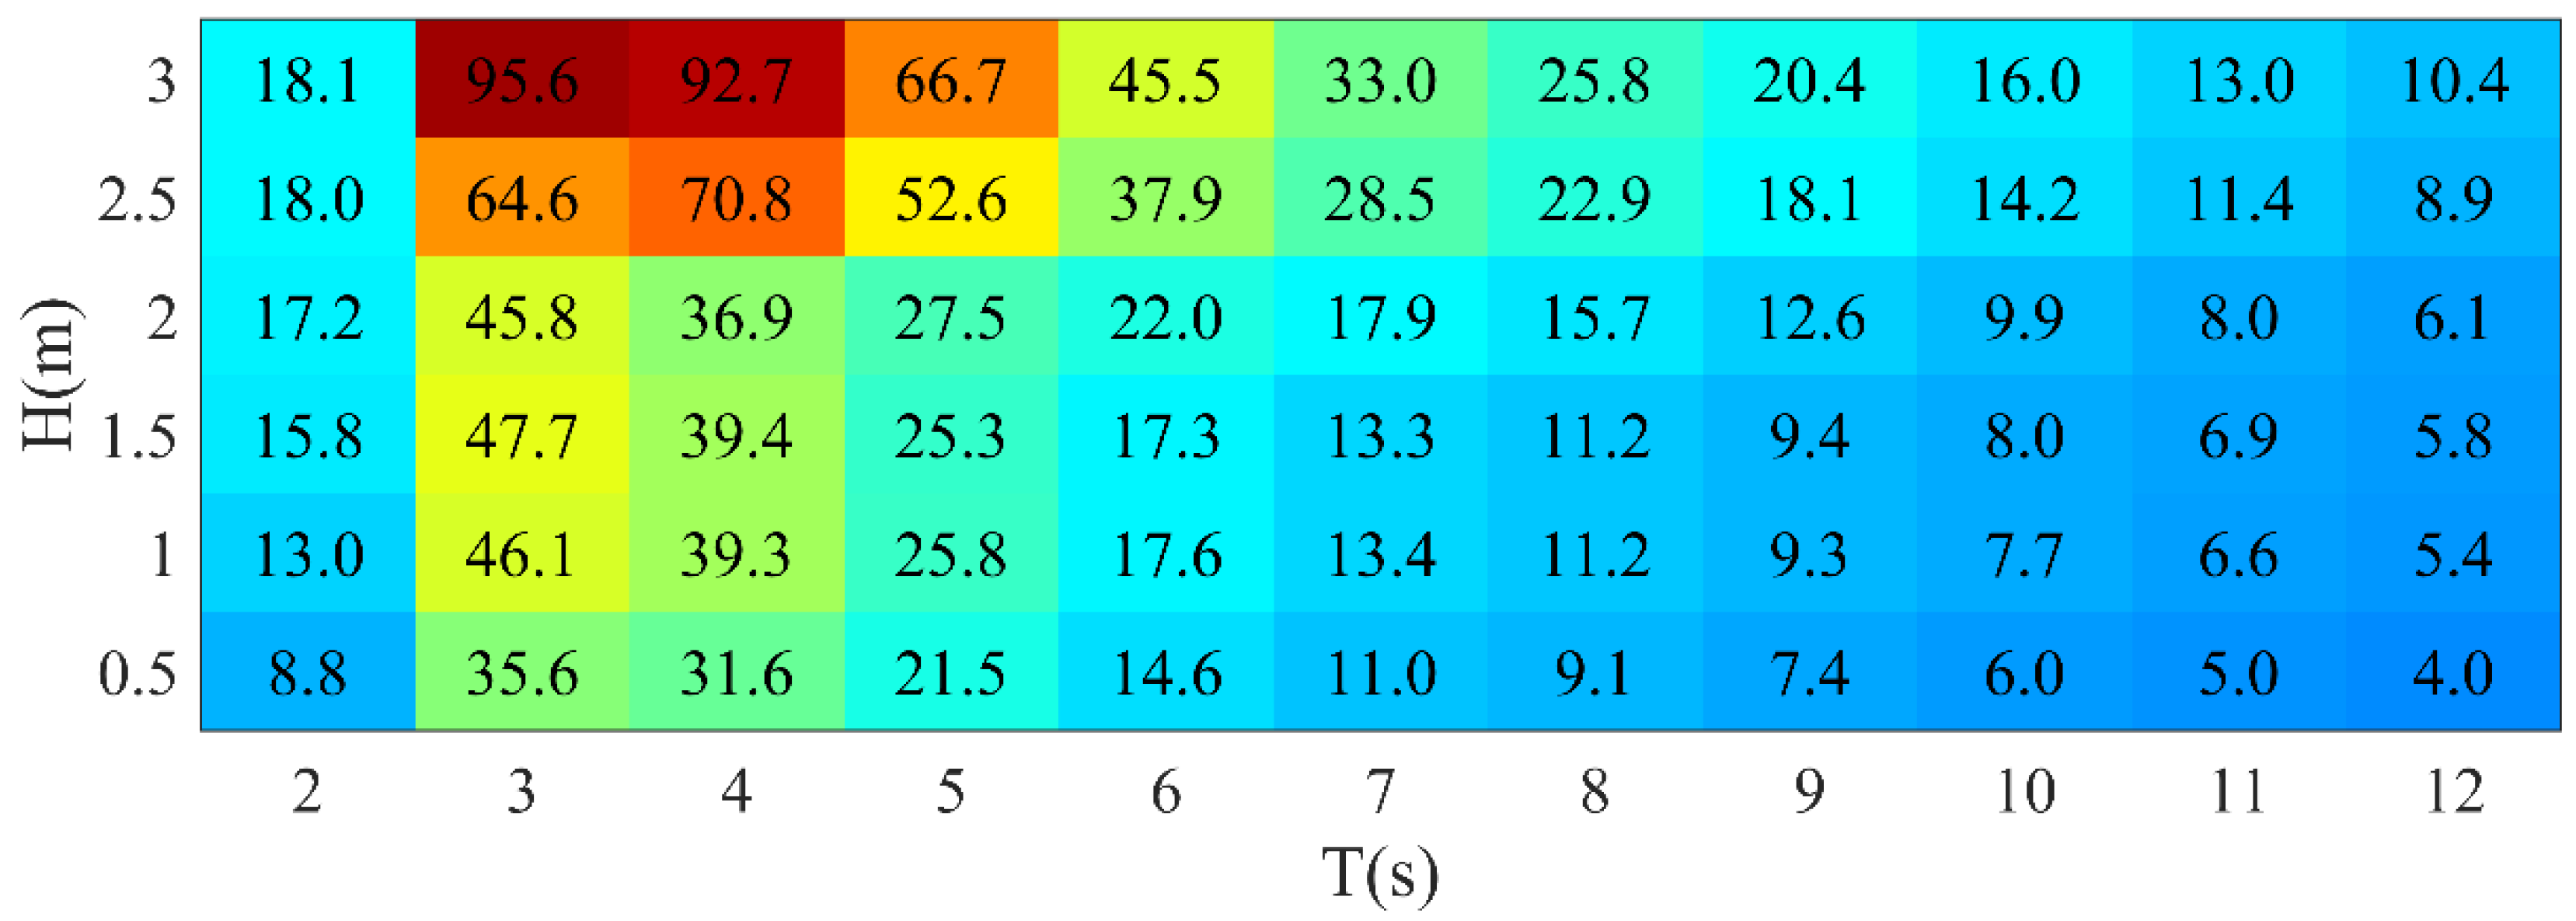
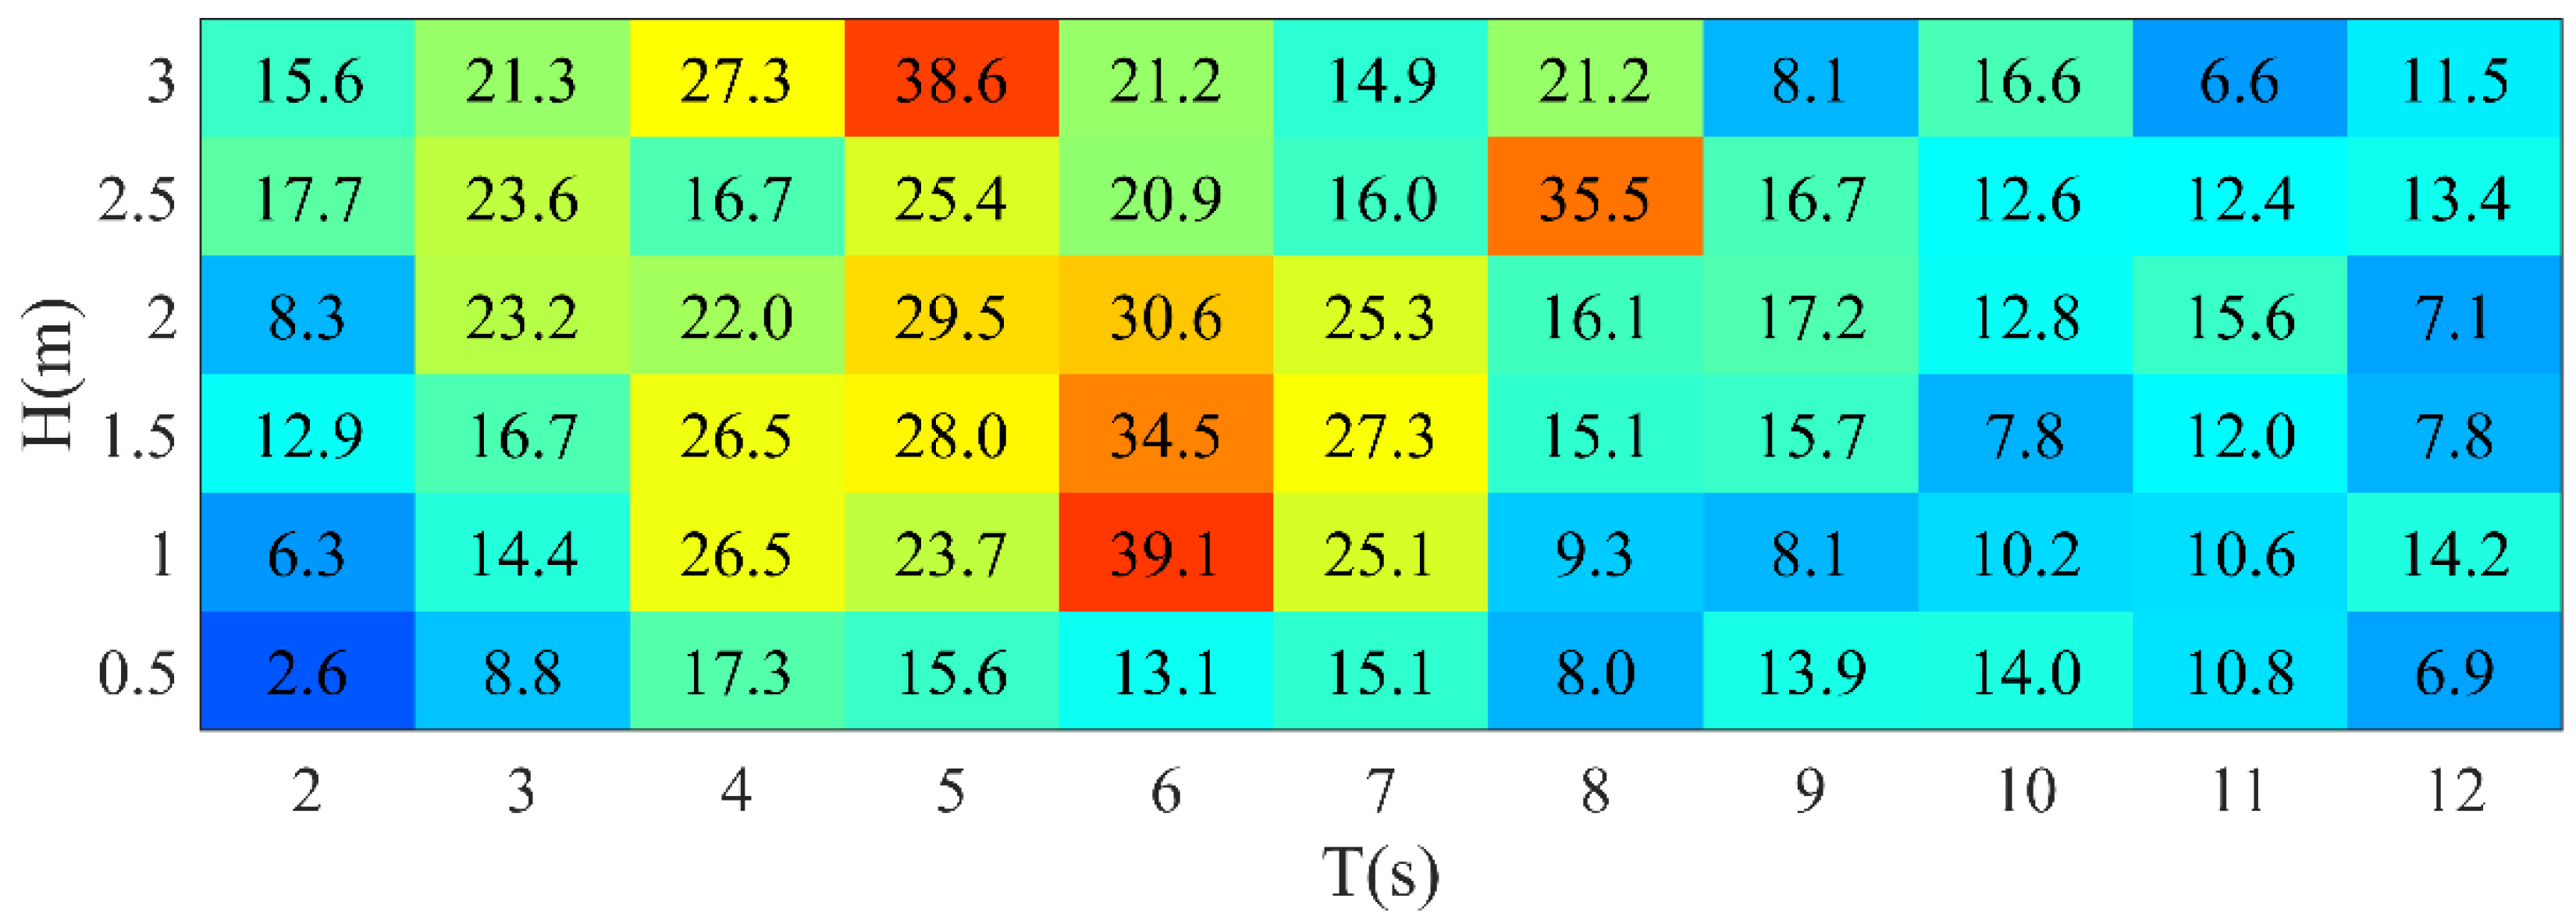
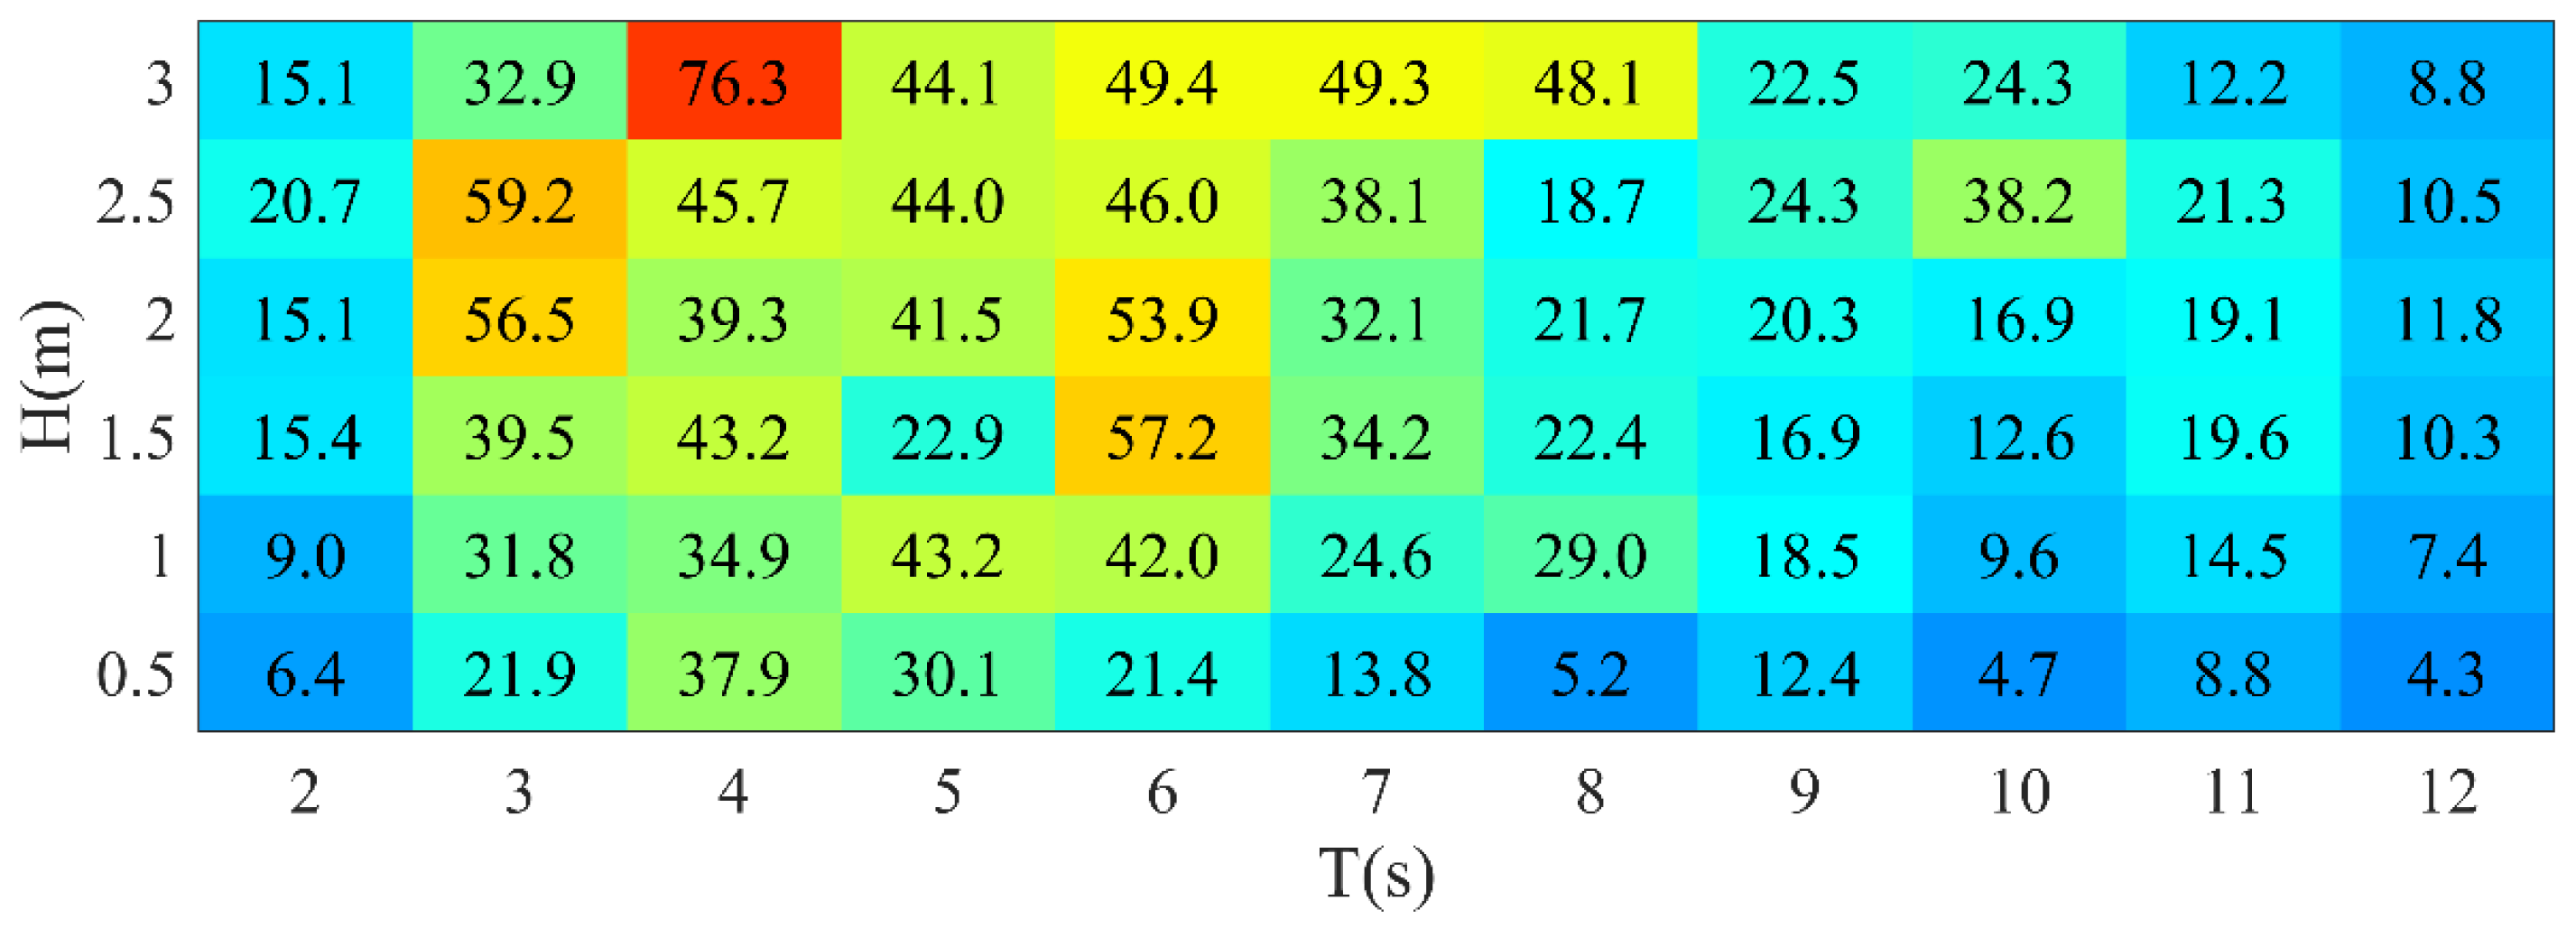
3.3. Power Generation Efficiency of Single WEC
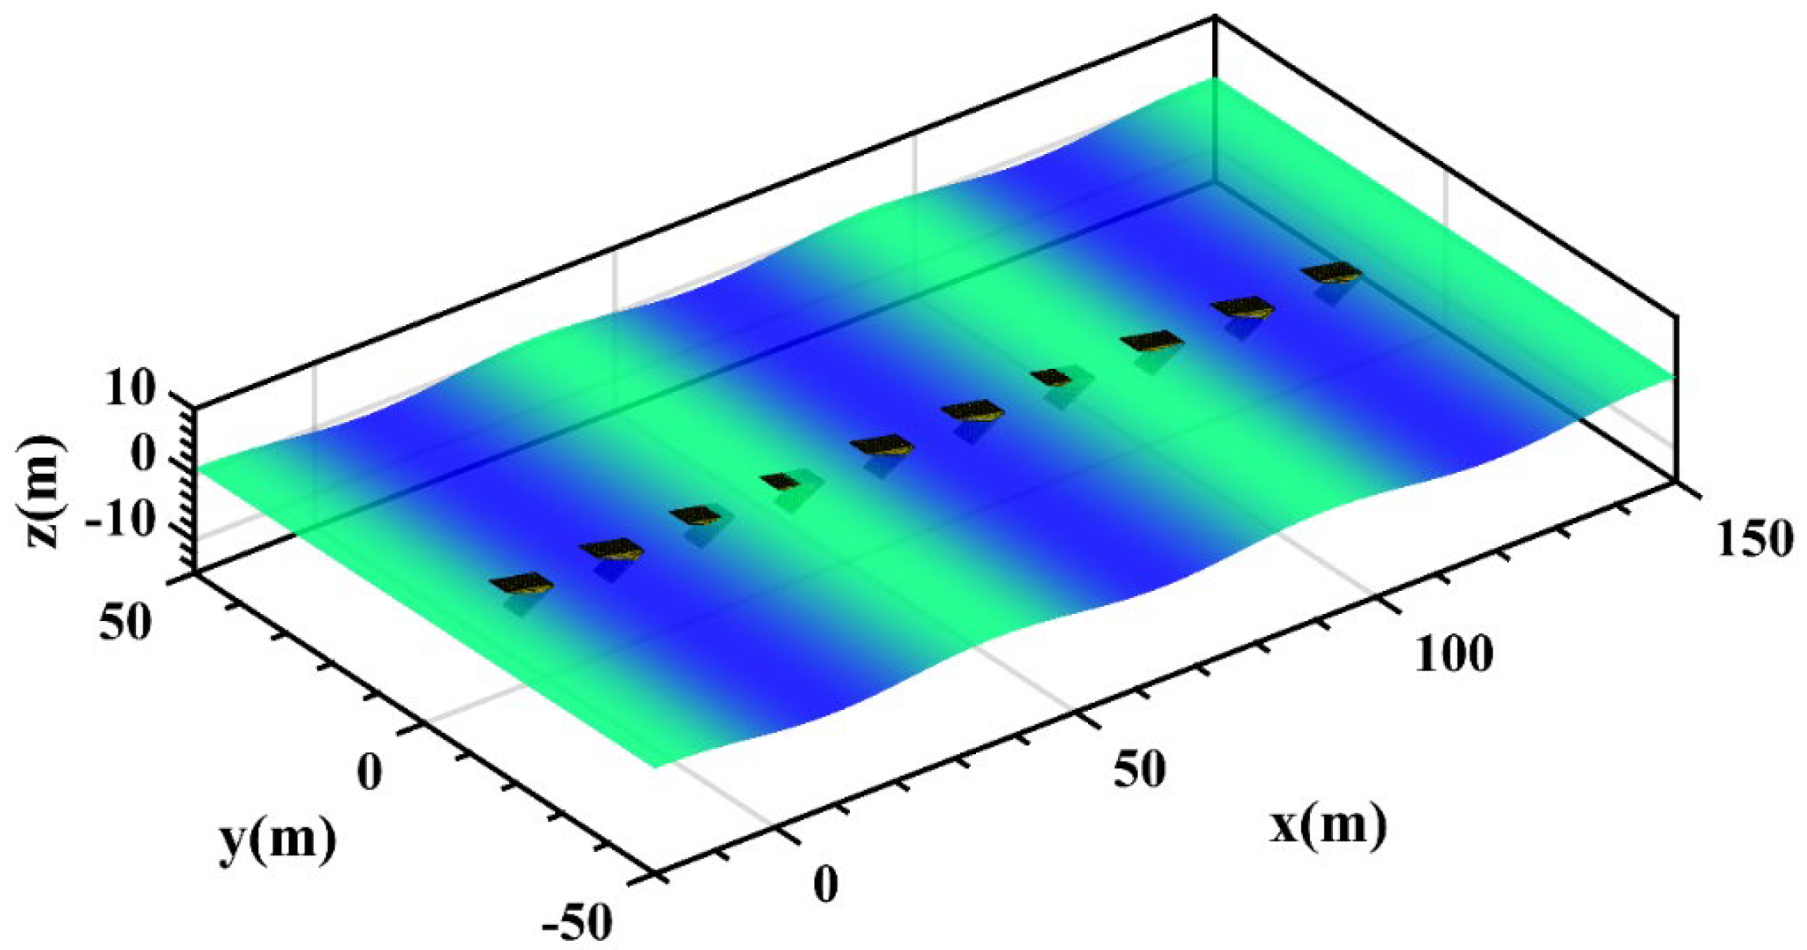
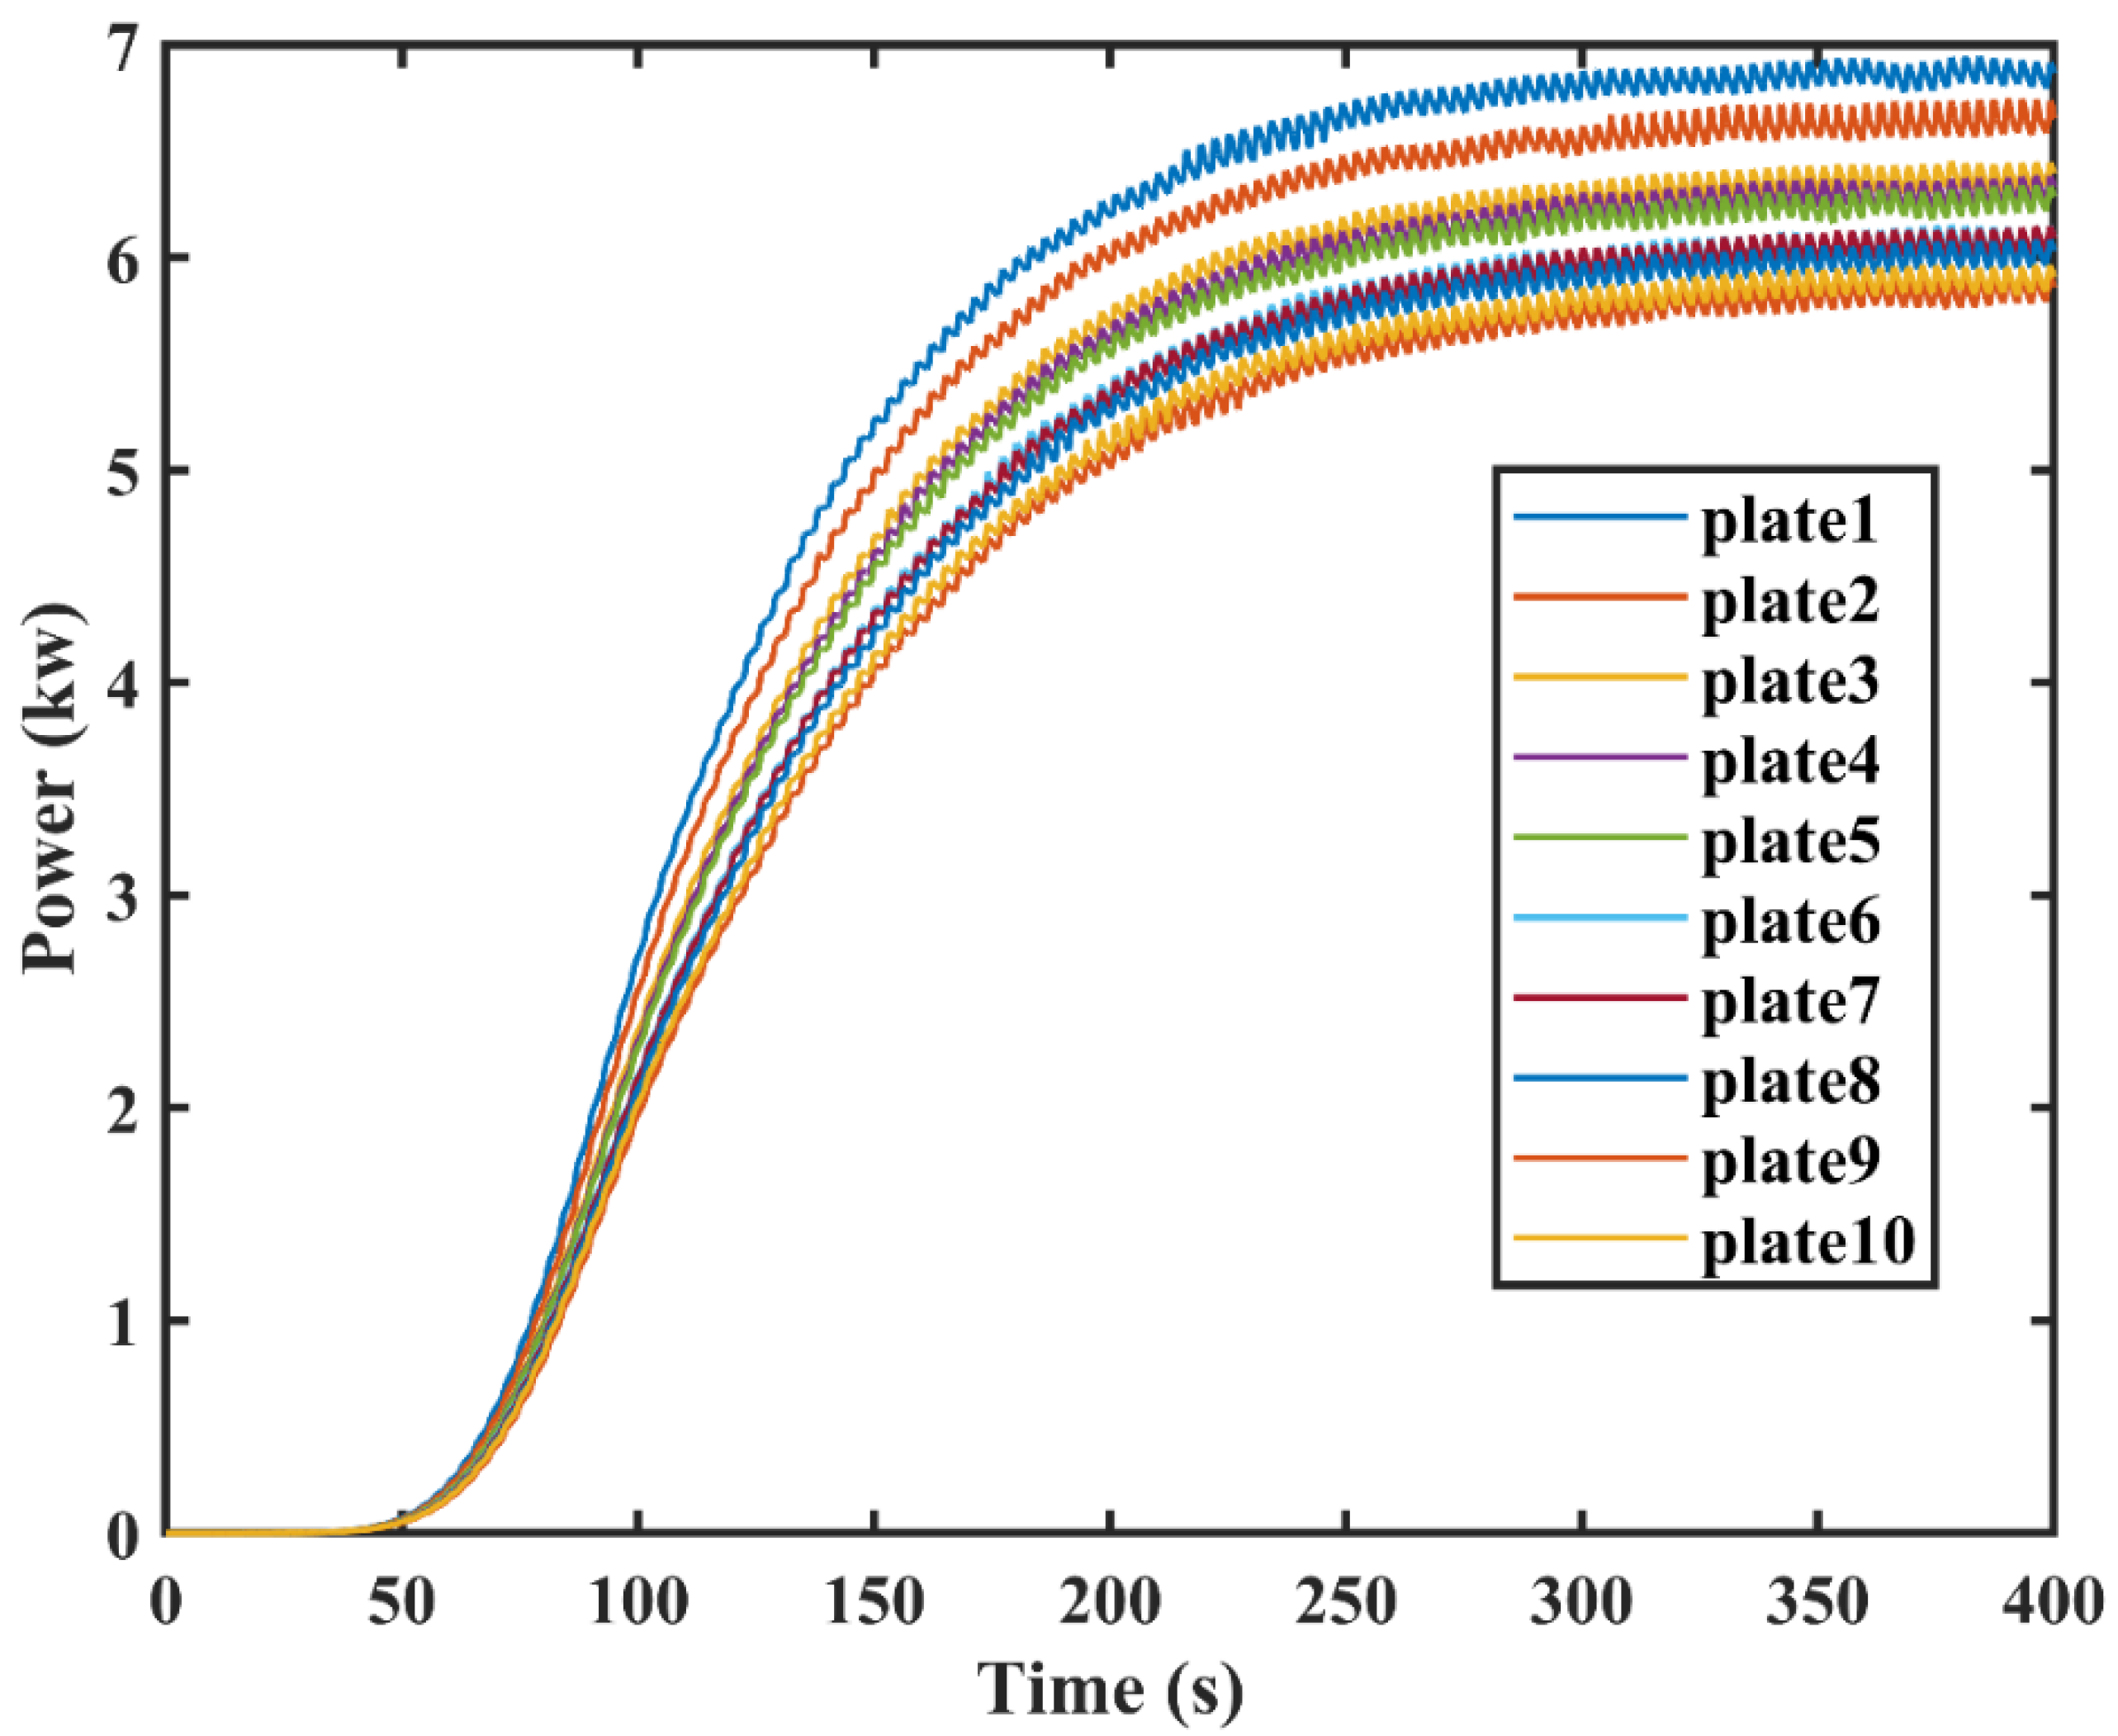
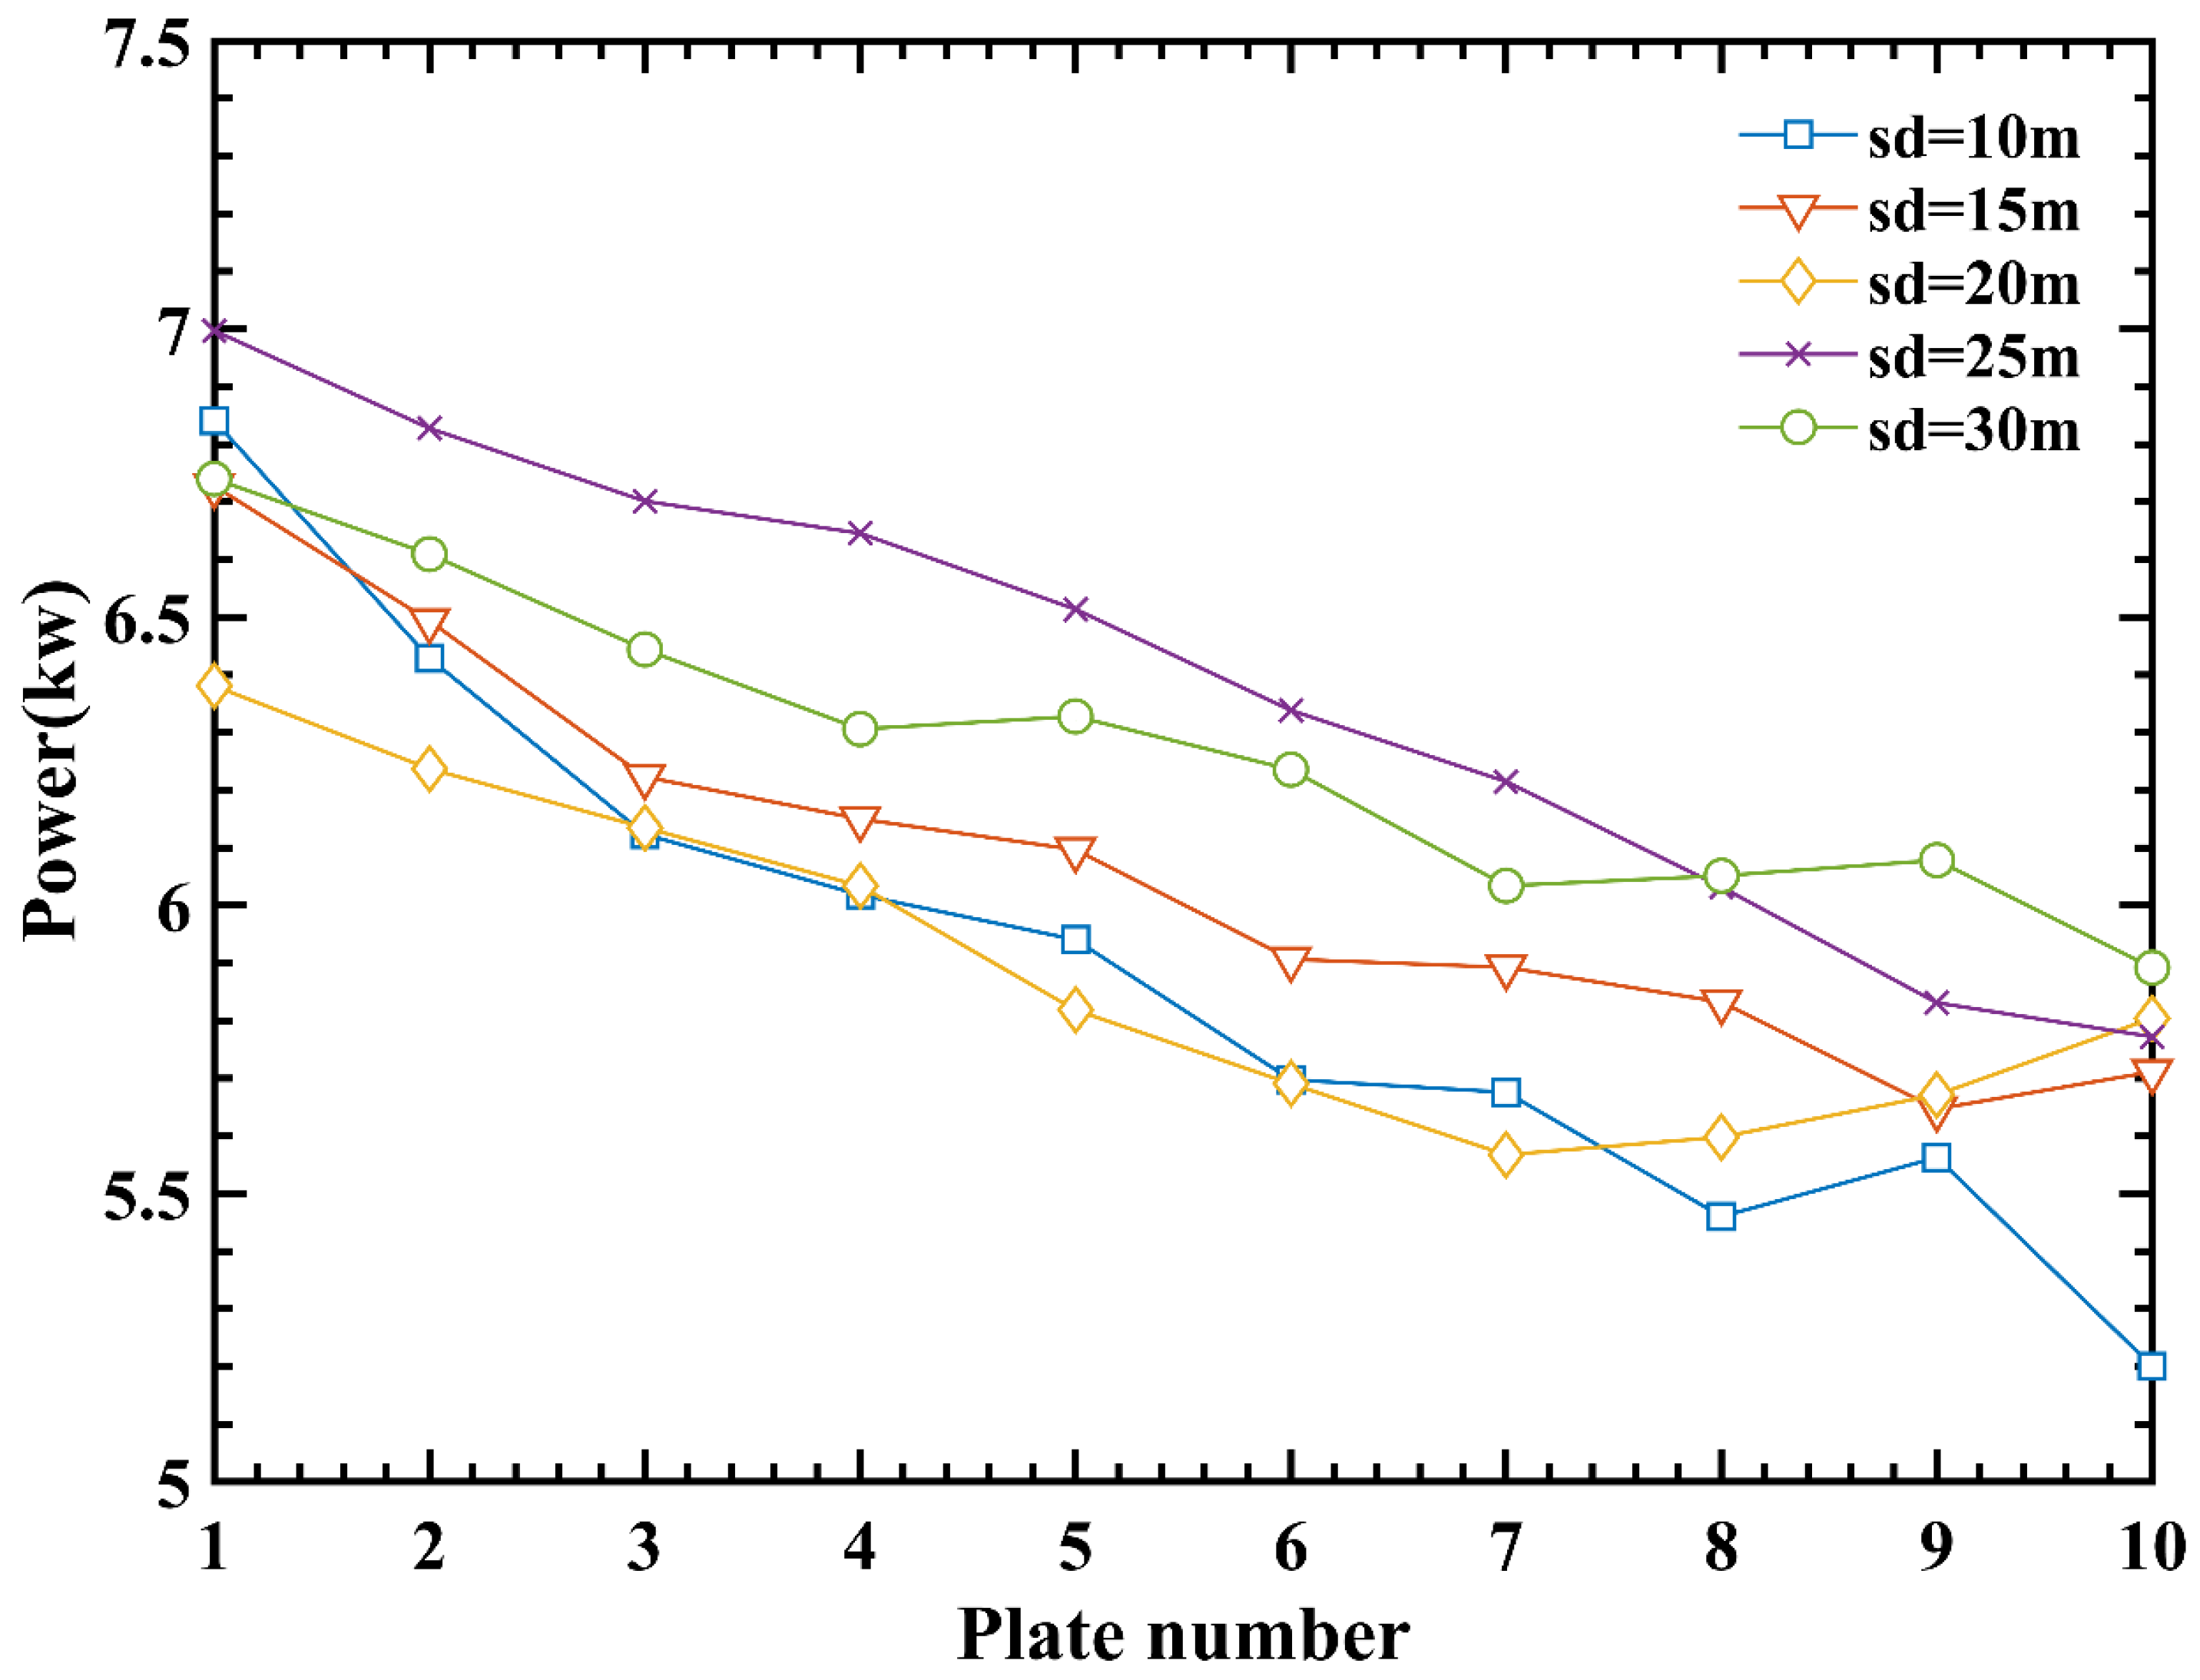
3.4. Power Generation Efficiency of Array WEC
4. Conclusions and Future Work
- The slope-pendulum wave energy conversion device adds a slope structure at the bottom to reflect through waves. The innovation of this structure can effectively enhance the ability of the floating plate to capture wave energy and improve the overall efficiency at a smaller cost.
- It can also cope with extreme sea conditions with large wave heights and has a certain “self-locking” function to keep the floating plate working normally, and the power generation efficiency of the wave energy conversion device is effectively improved under regular and irregular wave sea conditions.
- The array floating plate has a longitudinal optimal arrangement distance, the spacing is too large or too small, and it is not conducive to the array floating plate power generation. By experimental calculation, when the arrangement distance is 25 m, the whole wave energy conversion system electrical energy output power reaches the maximum.
Author Contributions
Funding
Institutional Review Board Statement
Informed Consent Statement
Data Availability Statement
Conflicts of Interest
References
- Ahamed, R.; McKee, K.; Howard, I. Advancements of Wave Energy Converters Based on Power Take off (PTO) Systems: A Review. Ocean Eng. 2020, 204, 107248. [Google Scholar] [CrossRef]
- Guo, B.; Ringwood, J.V. Geometric Optimisation of Wave Energy Conversion Devices: A Survey. Appl. Energy 2021, 297, 117100. [Google Scholar] [CrossRef]
- Rusu, E.; Onea, F. A Review of the Technologies for Wave Energy Extraction. Clean Energy 2018, 2, 10–19. [Google Scholar] [CrossRef]
- Titah-Benbouzid, H.; Benbouzid, M. An Up-to-Date Technologies Review and Evaluation of Wave Energy Converters. Int. Rev. Electr. Eng. IREE 2015, 10, 52–61. [Google Scholar] [CrossRef]
- López, I.; Andreu, J.; Ceballos, S.; Martínez de Alegría, I.; Kortabarria, I. Review of Wave Energy Technologies and the Necessary Power-Equipment. Renew. Sustain. Energy Rev. 2013, 27, 413–434. [Google Scholar] [CrossRef]
- Whittaker, T.; Folley, M. Nearshore Oscillating Wave Surge Converters and the Development of Oyster. Philos. Trans. R. Soc. Math. Phys. Eng. Sci. 2012, 370, 345–364. [Google Scholar] [CrossRef] [PubMed]
- Waveroller. Available online: https://aw-energy.com/waveroller/ (accessed on 7 September 2022).
- Tul Huda Ahmad, N.H.; Zamri Ibrahim, M.; Rahman, S.J.A.; Albani, A.; Mohad, S. The Development of Wave Energy Converter System Using Hydraulic Power Take Off at Terengganu Shoreline. In Proceedings of the 2018 International Conference and Utility Exhibition on Green Energy for Sustainable Development (ICUE), Phuket, Thailand, 24–26 October 2018; IEEE: New York, NY, USA, 2018; pp. 1–7. [Google Scholar]
- Ghafari, H.R.; Ghassemi, H.; Neisi, A. Power Matrix and Dynamic Response of the Hybrid Wavestar-DeepCwind Platform under Different Diameters and Regular Wave Conditions. Ocean Eng. 2022, 247, 110734. [Google Scholar] [CrossRef]
- Ransley, E.J.; Greaves, D.M.; Raby, A.; Simmonds, D.; Jakobsen, M.M.; Kramer, M. RANS-VOF Modelling of the Wavestar Point Absorber. Renew. Energy 2017, 109, 49–65. [Google Scholar] [CrossRef]
- Poguluri, S.K.; Kim, D.; Bae, Y.H. Performance Assessment of Pitch-Type Wave Energy Converter in Irregular Wave Conditions on the Basis of Numerical Investigation. Ocean Syst. Eng. 2022, 12, 23–38. [Google Scholar]
- Ruehl, K.; Forbush, D.D.; Yu, Y.-H.; Tom, N. Experimental and Numerical Comparisons of a Dual-Flap Floating Oscillating Surge Wave Energy Converter in Regular Waves. Ocean Eng. 2020, 196, 106575. [Google Scholar] [CrossRef]
- Wei, Y.; Barradas-Berglind, J.J.; van Rooij, M.; Prins, W.A.; Jayawardhana, B.; Vakis, A.I. Investigating the Adaptability of the Multi-Pump Multi-Piston Power Take-off System for a Novel Wave Energy Converter. Renew. Energy 2017, 111, 598–610. [Google Scholar] [CrossRef]
- Sricharan, V.V.S.; Chandrasekaran, S. Time-Domain Analysis of a Bean-Shaped Multi-Body Floating Wave Energy Converter with a Hydraulic Power Take-off Using WEC-Sim. Energy 2021, 223, 119985. [Google Scholar] [CrossRef]
- Wan, Z.; Zheng, H.; Sun, K.; Zhang, D.; Yao, Z.; Song, T. Simulation of Wave Energy Converter with Designed Pendulor-Slope Combination. Energy Procedia 2019, 158, 733–737. [Google Scholar] [CrossRef]
- Midya, C.; Kanoria, M.; Mandal, B.N. Scattering of Water Waves by Inclined Thin Plate Submerged in Finite-Depth Water. Arch. Appl. Mech. 2001, 71, 827–840. [Google Scholar] [CrossRef]
- Cummins, W.E. The Impulse Response Function and Ship Motions. Schiffstechnik 1962, 47, 101–109. [Google Scholar]
- Giorgi, G.; Ringwood, J.V. Comparing Nonlinear Hydrodynamic Forces in Heaving Point Absorbers and Oscillating Wave Surge Converters. J. Ocean Eng. Mar. Energy 2018, 4, 25–35. [Google Scholar] [CrossRef]
- Babarit, A. A Database of Capture Width Ratio of Wave Energy Converters. Renew. Energy 2015, 80, 610–628. [Google Scholar] [CrossRef]
- Yu, Y.-H.; Jenne, D. Analysis of a Wave-Powered, Reverse-Osmosis System and Its Economic Availability in the United States. In Proceedings of the International Conference on Offshore Mechanics and Arctic Engineering, Trondheim, Norway, 25 June 2017; American Society of Mechanical Engineers: New York, NY, USA; p. V010T09A032. [Google Scholar]
- Wang, L.; Tang, X.; Xia, Y.; Liu, H. Assessment of Wave Energy Resources in Zhoushan Islands. Renew. Energy 2014, 32, 1939–1944. [Google Scholar]
- Simulink Documentation—MathWorks. Available online: https://ww2.mathworks.cn/help/simulink/index.html (accessed on 8 September 2022).
- Retzler, C. Measurements of the Slow Drift Dynamics of a Model Pelamis Wave Energy Converter. Renew. Energy 2006, 31, 257–269. [Google Scholar] [CrossRef]


| Property | Floating Plate | Slope |
|---|---|---|
| Mass (kg) | 802.36 | 5065.41 |
| −2.24 | −2.651 | |
| 0 | 0 | |
| 0.22 | −2.7 | |
| 1379.1 | 60,802 | |
| 4211.8 | 42,574 | |
| 5439.5 | 17,467 |
| Description | Value |
|---|---|
| Wave height (m) | H |
| Wave period (s) | T |
| Simulink solver | ode45 |
| Maximum time step (s) | T/200 |
| Wave ramp time (s) | 5 T |
| Convolution integral time (s) | 25 |
| Simulation end time (s) | 25 T |
| Description | T(s) | H(m) |
|---|---|---|
| Value | 2–12 | 0.5–3 |
| Average Power GenerationEfficiency (%) | WEC | |
|---|---|---|
| NS-PWEC | S-PWEC | |
| Regular wave | 10.32 | 23.56 |
| Irregular wave | 17.26 | 27.32 |
Publisher’s Note: MDPI stays neutral with regard to jurisdictional claims in published maps and institutional affiliations. |
© 2022 by the authors. Licensee MDPI, Basel, Switzerland. This article is an open access article distributed under the terms and conditions of the Creative Commons Attribution (CC BY) license (https://creativecommons.org/licenses/by/4.0/).
Share and Cite
Wan, Z.; Li, Z.; Zhang, D.; Zheng, H. Design and Research of Slope-Pendulum Wave Energy Conversion Device. J. Mar. Sci. Eng. 2022, 10, 1572. https://doi.org/10.3390/jmse10111572
Wan Z, Li Z, Zhang D, Zheng H. Design and Research of Slope-Pendulum Wave Energy Conversion Device. Journal of Marine Science and Engineering. 2022; 10(11):1572. https://doi.org/10.3390/jmse10111572
Chicago/Turabian StyleWan, Zhanhong, Ze Li, Dahai Zhang, and Honghao Zheng. 2022. "Design and Research of Slope-Pendulum Wave Energy Conversion Device" Journal of Marine Science and Engineering 10, no. 11: 1572. https://doi.org/10.3390/jmse10111572
APA StyleWan, Z., Li, Z., Zhang, D., & Zheng, H. (2022). Design and Research of Slope-Pendulum Wave Energy Conversion Device. Journal of Marine Science and Engineering, 10(11), 1572. https://doi.org/10.3390/jmse10111572