Article

Mooring System Transport and Installation Logistics for a Floating Offshore Wind Farm in Lannion, France

1
Vicinay Marine Innovación, Plaza Ibaiondo 1, 1010-106, 48940 Leioa, Spain
2
Core Marine Solutions S.L., Plaza Ibaiondo 1, 107 Mod2, 48940 Leioa, Spain
3
Esteyco, Avda. Burgos, 12B-Bajo, 28036 Madrid, Spain
4
Centre for Marine Technology and Ocean Engineering (CENTEC), Instituto Superior Técnico, Universidade de Lisboa,1049-001 Lisboa, Portugal
*
Authors to whom correspondence should be addressed.
J. Mar. Sci. Eng. 2022, 10(10), 1354; https://doi.org/10.3390/jmse10101354
Submission received: 10 August 2022 / Revised: 8 September 2022 / Accepted: 19 September 2022 / Published: 22 September 2022
(This article belongs to the Special Issue Offshore Wind Energy)

Abstract

:
This study addresses the planning procedures for the installation of the mooring systems that support the floating offshore wind turbines in a wind farm. It considers the logistics of the installation process and discusses the important role of the weather windows in the planning of those operations at a preliminary stage of the project. The case study is based on a wind farm array of 47 Telwind floating wind turbine platforms, to be located in Lannion (France), with a potential of 470 MW. The study includes the transport and logistics requirements of different mooring components, such as chains, connectors and drag anchors; the description of the installation operations considering the typology of vessels that are necessary in these manoeuvres; as well as the planning and costs associated with the transport and installation. Given the diversity of elements and operations involved in the installation procedure, it is demonstrated that the research results of duration and costs of this type of operations are only possible to obtain using a simulation tool.

Graphical Abstract

1. Introduction

Nowadays, renewable energies offshore, such as wind energy, wave energy and tidal energy, have become important due to environmental issues and energy crises [1,2]. Wind energy offshore, in particular, emerges as a promising renewable clean alternative, mainly due to its availability and price competitiveness. The potential of marine renewables and, in particular, floating wind for the future of power generation and the energy transition to sustainable sources is known to the scientific community, technologists, and all energy industry [3,4].
The quality of the wind at greater distances from the coast is higher, and the resource itself increases, as well as the challenges associated with obtaining this energy. The wind resource assessment in [5] showed that the Iberian coast had an average annual energy density reaching up to 971, 549 and 398 W/m2 in the north, centre and southern regions, respectively, values that are representative of what can be found on other areas of the European Atlantic coast. Another study shows typical average values of wave energy of about 40 kW/m in the summer and 10 kW/m in the winter for the corresponding areas [6].
The European Union has directed resources to develop this type of energy so that it becomes reliable, safe, and profitable [1]. The study of Wind Europe indicates that the North Sea will have the highest quantity of offshore wind farms by 2030, with a central value closed to 50 GW, higher than the 10 GW of 2016 [7].
Over recent years, the floating wind industry has suffered an important expansion. Floating wind turbines present an economical and technically feasible approach to access the deeper water sites to obtain the rich resource of wind power. Therefore, they have the potential to be the next generation of wind technology [8]. Moreover, the saturation of maritime space, the energy demand, and the geographical constraints require new offshore installation areas. All these requirements have created the need to identify locations for floating wind farm installation [9].
In the design of offshore wind farms, the first stage is often the choice of sites [10]. Site selection also plays a crucial role in the financial returns of the project, ease of construction, ongoing operations and maintenance, and overall safety. Geographical Information System (GIS)-assisted wind farm location criteria [11] were typically used, such as [9,12,13,14,15]. Díaz and Guedes Soares [9] identified the most suitable locations for floating offshore wind turbines within the European Atlantic Area (Portugal, Spain and France), considering the available wind resource, existing uses of maritime space and environmental constraints, and the operational needs of a floating wind farm. Díaz and Guedes Soares [14] developed a decision tool for planning offshore wind farm locations, combining multi-criteria decision analysis and GIS. Díaz et al. [15] showed that the floating wind farm locations suitability map developed with the AHP and MADA methods integrated into a GIS for the maritime surroundings of the European Atlantic coast is a substantial aid in the land-use management of these waters.
Platforms are an essential element of floating offshore wind turbines. Regarding the offshore wind platforms installed on offshore farms, there are several types of platforms within the main types of bottom-fixed and floating. Uzunoglu et al. [16] reviewed the main floating wind turbine platform concepts and the design standards for floating platforms. The first types of platforms to reach the commercial stage are the spar [17] and the semisubmersible type [18,19].
The connection of the platforms to the grid is another important component, as discussed in [20], and substations are often important components of this system. Two types of floating substation configurations were compared in [21] with respect to technical and cost performance for a 200 MW Wind Farm for the Northeast U.S., showing that the semi-type substation platform cost is lower than the TLP-type cost for the case where each tendon has a dedicated anchor, whereas the cost for the TLP-type with two tendons sharing an anchor is highly comparable to, if not less than, the semi-type platform.
One of the challenges in floating offshore wind turbines continued being the high costs associated [22]. The investment cost per MW in offshore wind is approximately 50% more expensive than in onshore wind, mostly due to the costs of additional components, underwater equipment, construction, and installation processes [4]. One of the most important issues in terms of an offshore wind farm is to be competitive in economic terms. Thus, a fundamental aim is to maximize energy production, minimize capital and operating costs, and stay within the constraints imposed by the site. Economic assessment studies have been made for locations in the Atlantic coast showing the relation of the location to the economic feasibility [23,24].
The other way of reducing production costs is to scale up the turbines, moving to larger turbines than the 5 MW ones that are more commonly used at present. So, recently, the design of a 10 MW floating offshore wind turbine (FOWTs) has been the main focus of research in order to further reduce the levelized cost of electricity (LCOE) of wind turbines to a more competitive level [25]. With regards to this, there are several European Union (EU)-funded research projects. For instance, a semi-submersible platform was developed in the INNWIND project [26]. Two semi-submersible concepts, a barge and a Tension Leg Platform (TLP) were developed in the LIFES50+ project [27]. Within the ARCWIND project, three novel concepts are being developed, a multi-body floating platform, the so-called TELWIND [28], a barge type [29] and a TLP [30]. Other concepts are also being studied, such as those described in [27] and [31].
One of the most important differences between fixed and floating substructures is mooring and anchoring systems. For floating structures, the station-keeping systems based on mooring lines and anchors are crucial to guarantee structure survivability and its components under different met ocean conditions. Traditionally, a successful mooring design considers several limit states (LS) (DNV-OS-E301, 2021 [32]), such as ultimate (ULS), accidental (ALS), fatigue (FLS) and service (SLS) [33]. The structural forces into the offshore wind anchoring and mooring systems are calculated either by using the quasi-static method [34,35] or dynamic analysis [36,37,38,39]. Masciola et al. [36] compared the response of the DeepCwind semisubmersible design in coupled simulations using FAST and the lumped-mass mooring model OrcaFlex, as well as the default quasi-static mooring model, against the 1:50-scale test data. They found that platform motions were influenced by mooring dynamics only in extreme sea states but that mooring dynamics are important to the prediction of mooring line tensions in all load cases. Bae et al. [37] performed numerical simulations on the performance of a Floating Wind Turbine (FWT) with a broken mooring line using an aero-hydro-servo-elastic-mooring coupled dynamic analysis in the time domain considering the OC4 DeepCwind semi-submersible wind turbine. Dynamic coupling analysis in frequency domain (FD) and time domain (TD) using ANSYS AQWA and Orcaflex were presented by [39] for two different mooring configurations on the hull of a Paired Column Semisubmersible (PCSemi). The Chain-Polyester-Chain (CPC) mooring concept performed better in deep waters and is more reliable for the PCSemi.
FOWT has several advantages compared with onshore ones, however, the complex and varied marine environment has brought great challenges to the transportation, installation, and operation of the equipment. It was mentioned in [40] that, currently, installation, operation, and maintenance (IO&M) costs contribute approximately 30% to the LCOE of offshore wind plants. The cost of the mooring and anchoring system is also included. There have been some reported attempts in the literature to minimize the operation and maintenance (O&M) costs of offshore wind farms [41,42,43,44]. The O&M costs are composed of labour costs (technician costs), material costs (component costs), transportation costs (vessels and associated costs), fixed costs (port, insurance, bidding) and potential revenue losses [44]. The LEANWIND project studied how to reduce the costs of farms by analysing their installation, operation and maintenance, and logistics and supply-chain [45].
To have cost-effective installation methods, the relevant numerical simulations of the installation of FOWTs need to be conducted as in [46,47,48]. A novel installation concept using a floating vessel was investigated in Hassan and Guedes Soares [47] and the coupled dynamic system of the installation vessel and the floating spar were performed using Ansys AQWA software. The numerical simulation of a three-body system, including the assembly, the catamaran vessel and the foundation was performed using SIMO and RIFLEX under the SIMA environment in [48]. The WindFloat Atlantic project [19] avoided the use of large offshore heavy-lift vessels by using an onshore crane, also allowing most of the commissioning works to be completed onshore. The offshore activities were greatly simplified, being designed to allow a tow-to-port O&M strategy for large component replacement. A similar strategy is described in [49].
For the installation of offshore platforms, the site has to be accessible for a certain period called a weather window [50,51], in which weather conditions are suitable for the specific work at sea. Deriving detailed information on suitable installation weather windows that will be available for a specific site will be also beneficial for the reduction in installation costs [52]. To determine it, a limiting operational environmental criterion [53] is given by the maximum values of wind speed and wave height for safe working and/or transfer conditions of personnel. In addition, there are some additional restrictions on specific cases. The weather window has been investigated for specific sites, such as, the Irish west coast [54], North Atlantic Ocean [51] and the south west of England [55].
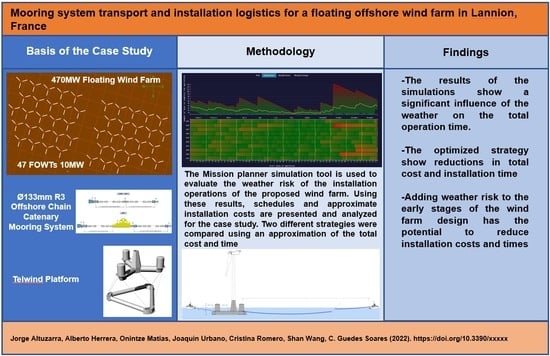
Although the development of floating offshore wind turbine technology has increased greatly and the O&M aspects have been discussed for different projects, the installation logistics and cost of mooring components have been rarely discussed. This work addresses that problem by using a methodology based on simulations to assess the duration, costs and risks associated with the installation of an offshore wind farm in weather windows. This method is applied to a case study based on a wind farm in Lannion, located on the northwest coast of France. The selected technology for this study is the TELWIND platform developed by Esteyco.
Section 2 presents the characteristics of the floater, the installation site, the mooring system and the wind farm array design. Section 3 describes the required installation operations and their limitations and presents the simulation method. Section 4 presents the results and discussions of the simulation results. Two different installation strategies are studied and compared. Section 5 provides a summary and draws some conclusions from the present study.

2. Description of the Platform and Mooring System

2.1. TELWIND Platform

The TELWIND platform is illustrated in Figure 1 and consists of two parts (upper structure and lower tank), which are joined rigidly by tendons. The draft of the structure can be adjusted according to the installation site by modifying the length of the tendons joining its two main sections, making it possible to operate at depths of less than 100 m. The upper structure provides buoyancy in excess while the lower tank provides weight, ensuring the stability of the system and the counteraction of the forces applied in the structure to reduce the wind turbine induced motions.

2.2. Station Keeping System

The TELWIND platform station keeping system designed within the ARCWIND project is a spread mooring system in which the mooring lines are attached to each of the upper structure columns. Figure 2 and Figure 3 show the proposed mooring system based on three catenary mooring lines of Ø133 mm R3 chain, and the assembly drawing of the mooring system including main components and connectors. The connection to the structure columns is performed using a dual-axis rotational connection, which absorbs the platform rotations to avoid out of plane loads in the first links of the mooring line. The mooring line is divided into two sections to facilitate the installation. One section is approximately 414 m of bottom chain with a 15-ton drag anchor connected at one end. The other section is a 60 m top chain segment preinstalled on the structure. These sections of the chain are connected on two of the lines using an H-Link connector, while an in-line tensioner is used for the connection of the third line and tensioning the whole mooring system to the target pre-tension during the hook-up operation.

2.3. Wind Farm Array Design

The total capacity of the Lannion Floating Wind Farm is 470 MW, which is composed of 47 floating offshore wind turbines (FOWTs) of 10 MW, oriented towards N-NE. Figure 4 illustrates the design and dimensions of the wind farm array developed within the ARCWIND project, which is divided into two clusters, one of 24 FOWTs and the other with 23 FOWTs, distributed in 4 rows per cluster with 5 FOWTs per row and an additional row per cluster with 4 and 3 FOWTs, respectively.
The substation is in the central path of the two clusters. The FOWTs of each cluster are connected to each other by inter-array cables. A radial topology is defined for the distribution of the inter-array cables and their connections to the substation as shown in Figure 5. The inter-array cables use a lazy-wave configuration at each end of the cable to be attached to the floating structures.
It is to be noted that this study focuses on the installation of the mooring systems only and it does not include the power cable installation methods and timings, which would be necessary for a complete installation of the floating wind farm. This includes cable transport, deployment through seabed trenching and cable burying, installation of buoyancy modules for lazy waves, array, FOWTs and substation connections.

3. Transport and Installation Strategies

3.1. Mission Planner Simulations Method

Marine operations are planned and designed using classification societies’ standards. These standards require that a contingency time is added to the planned operation time, the sum of both being the operation reference period. The weather limitations of the operation are reduced by a factor to account for uncertainty in the weather forecasts [53]. This approach is not suitable to estimate the risks associated with the weather windows in the early stages of the project when the available data are scarce.
The Mission Planner developed by CoreMarine [56] is adopted for the simulation. This tool takes the sequence of tasks to be performed during an offshore operation, each one with a duration and a set of limitations. Using a weather hindcast data base, the operation is simulated. The first task starts at the specified time; if the weather conditions surpass the allowed ones, the vessel waits until there is a suitable weather window. The result of each individual simulation is the time that was required to perform the operation. All the individual simulations are then analysed, and statistical data are obtained. For this case study, a 10-year hindcast weather data base [57] has been used.
For example, Figure 6 and Figure 7 present part of the output of a simulation. There are different options depending on the nature of the operation. For instance, Figure 6 shows a case where the tasks do not need to be performed immediately one after the other. On the other hand, Figure 7 presents a case where the 1st three tasks must be performed immediately one after the other and, thus, a certain amount of time must pass to have an appropriate weather window. In this last figure, it can also be appreciated that each task can have a different weather limitation.
The overall result, presented in Figure 8, gives a visual representation of the appropriate time frames to perform the operations. Apart from this window, the data are extracted and analysed.

3.2. Location

The Lannion (France) site, located at 49.23° N/3.68° W, is the proposed area for the construction of a floating wind farm of 470 MW. The area, with a water depth of 75 m and being located approximately 33 km off the coast of France, has been selected through an assessment of feasible areas for offshore floating wind farms, considering utilization, economic, technical, and social constraints [14]. Figure 9 shows the proposed installation site and the port selected as the base port for the storage of structures and moorings for the construction of the wind farm; the Cherbourg port is located at 154 km [9]. The general wave conditions in the area are given in [58,59,60].

3.3. Total Mooring Components for the Wind Farm

Considering the proposed station keeping system and the number of FOWTs comprising the Lannion floating wind farm, Table 1, Table 2 and Table 3 show the total number of offshore mooring chain lengths, mooring connectors and drag anchors that the mooring systems of the entire wind farm array consist of.

3.4. Mooring Components Shipping Ports

The different components that constitute the mooring systems are assumed to be shipped out from the closest ports to their respective manufacturing facilities.
  • Mooring chains and connectors are assumed to be manufactured in Spain. The port of shipment for the mooring chain and connectors is the Vicinay Sestao factory, which has a direct loading and unloading area at its facilities (43.3° N/−2.98° W).
  • Drag Anchors are assumed to be manufactured in the Netherlands. The port of shipment for the drag anchors is the port of Rotterdam (51.56° N/4.73° E).
Table 4 shows the distances and transport durations of the shipments to the selected base port of Cherbourg. The speed of the ship during transport considered is 10 knots.

3.5. Mooring Installation Operations

The installation of the mooring systems of the wind farm is composed of three different campaigns: mooring pre-lay, platform towing, and mooring and cable hook-up. The following subsections describe the procedure for carrying out these operations, including the duration and weather limitations for carrying out the operations in terms of maximum Hs. The wind speed limitation for all operations has been set to 20 knots.

3.5.1. Mooring Pre-Lay Campaign

This operation refers to the deployment of the bottom chains and drag anchors, which are pre-installed and wet stored at the seabed. The 141 mooring lines are pre-laid in 7 campaigns, 20 lines in each of the first 6 campaigns, and 21 lines in the last one. This requires the use of two Large Class Anchor Handling Tug Supply (AHTS) vessels, with more than 250 t bollard pull capacity, Dynamic Positioning 2 (DP2) and 2 Work Class Remotely Operated Vehicles (WROVs) working in parallel. More vessels could be used simultaneously, but always in pairs since 2 are needed for proof loading the anchors. The procedure for a pre-lay campaign is presented as follows:
1.
AHTS drag anchor installation (2 AHTS)
a.
Mobilization
i.
AHTS arrival at the mobilization site
ii.
Load chain (10 segments of 414 m)
iii.
Load project equipment (Only on the 1st campaign)
iv.
Load 10 drag anchors (15t) and sea fastening
v.
Depart to the offshore location site
1.
86 nautical miles at 12 knots
vi.
Drag anchor installation (10 times)
1.
As found survey of the lay route
2.
Overboard the drag anchor
3.
Deploy to seabed
4.
Land on the seabed and drag in
5.
Pretension to the vessel maximum bollard pull
6.
Lay chain and wet storage
7.
As left survey and prepare the next anchor on deck
8.
Relocate to the next anchor installation location
2.
Drag anchor proof tensioning (20 times)
a.
AHTS #1 and #2 at mooring line location
b.
AHTS # recovers mooring line
c.
AHTS #2 passes the winch wire to AHTS #1
d.
AHTS #1 connects AHTS#2 wire to tensioning bridle
e.
AHTS #1 and AHTS #2 position on the field ready to tension
f.
Take tension up to calculated BP
g.
Proof tension anchor
h.
Take off tension
i.
AHTS #1 recovers tensioning bridle
j.
AHTS #1 disconnects AHTS #2
k.
AHTS deploys and wet stores the mooring line
l.
AHTS #1 and #2 relocate to the next mooring line
3.
Demobilization
a.
Demobilize vessels
Table 5 shows the duration and weather limitations of the operations to be carried out in this campaign. The drag anchor and mooring line installation operation run in parallel, while the drag anchor tensioning operations need to be performed one after the other using both AHTS. The duration of a single mooring line installation (M) is approximately 22 h per AHTS. The drag anchor tensioning (DAT) operation duration is 12 h. The maximum significant wave considered for safe operation is 2.5 m for both installation and tensioning.

3.5.2. FOWT Towing Campaign

The towing campaign runs parallel to the mooring and power cable hook-up. Two fleets of tugs are needed, each one composed of two tugs. The tugs assist the main AHTS vessel during the hook-up until the floater is storm safe. At that point, they return to the mobilization port. This campaign happens 23 times per fleet plus an additional one for one fleet, a total of 47 times. The procedure steps are presented below.
1.
Mobilization
a.
The tug fleet arrives at the mobilization base
b.
Floater connection
2.
Towing and installation
a.
Transit to the offshore site
i.
86 nautical miles at 3 knots
b.
Arrive at the offshore site
c.
Assist AHTS with FOTW hook-up until it is storm safe
d.
Return to mobilization base
3.
Demobilization
a.
Tug fleet demobilized
Although it has been considered for the cost analysis, the towing operation has not been simulated since it depends on a more restrictive one, the hook-up. This is because, as there are two fleets of tugs per AHTS, in charge of both towing the structures and assisting the AHTS during hook-up operations, this hook-up campaign is assumed to be the most restrictive in terms of operating times. Thus, the standby ratio of the tugs, a parameter that measures the time during which vessels are not operating due to weather constraints, will depend on this hook-up operation.

3.5.3. Mooring and Power Cable Hook-Up Campaign

This campaign includes the hook-up and tensioning operations of the mooring system. For this study, it has been assumed for the Hook-up that the connection of the first two lines of each mooring system is performed on the deck of the AHTS, while the third line is connected utilizing an In-Line Tensioner (ILT), which is used for the final tensioning of the complete system. The floater will be held in position by the holding tugs until the last mooring line is connected and the floater is deemed to be storm safe.
This operation is especially sensitive to weather conditions, so it has been designed to be completed in as little time as possible. Contrary to the rest of the campaigns, which involve transit from the port to the installation site and vice versa, an AHTS vessel will always stay on site, performing the hook-up. It will only return once to resupply ILTs. The floater tank must be ballasted during the operation, which takes between 3 and 4 h. A specific study is needed to determine the best moment to perform this deballasting, but for this study, it is not strictly necessary. The 47 hook-ups are carried out using large class AHTS with more than 250 t bollard pull capacity, DP2 and 2 WROVs. The operation procedure steps are shown below.
1.
Mobilization (two times, 1st and 25th campaign)
a.
AHTS arrival to the mobilization site
b.
Load 23 ILTs and sea fasten them
c.
Load project equipment (Only on the 1st campaign)
d.
Depart to the mobilization site
e.
Transit to the Offshore location
i.
86 nautical miles at 12 knots
2.
FOWT mooring hook-up
a.
FOWT tow arrives at the offshore installation site
b.
AHTS arrives to the offshore installation site (1st and 25th campaign only)
c.
DP trials
d.
SIMOPS RA with FOWT tow master
e.
As found survey
f.
FOWT moved to the hook-up position
g.
Tank deballasting
h.
Mooring line #1 connection
i.
AHTS connects the wet stored mooring #1 to the recovery winch
ii.
The mooring is picked up and re-laid towards the floater
iii.
AHTS recovers to the back deck the chain tail from the FOWT
iv.
AHTS recovers the subsea mooring line to the back deck
v.
The mooring line is connected to the FOWT chain tail
vi.
Overboard and deploy the connected mooring line
vii.
Mooring line #1 connection completed
i.
Mooring line #2 connection
i.
AHTS connects the wet stored mooring #2 to the recovery winch
ii.
The mooring is picked up and re-laid towards the floater
iii.
AHTS recovers to the back deck the chain tail from the FOWT
iv.
AHTS recovers the subsea mooring line to the back deck
v.
The mooring line is connected to the FOWT chain tail
vi.
Overboard and deploy the connected mooring line
vii.
Mooring line #2 connection completed
j.
Mooring line #3 connection and pre-tensioning
i.
AHTS connects the wet stored mooring #3 to the recovery winch
ii.
The mooring is picked up and re-laid towards the floater
iii.
AHTS recovers to the back deck the chain tail from the FOWT
iv.
AHTS recovers the subsea mooring line to the back deck
v.
The mooring line is connected to the FOWT chain tail
vi.
Overboard and deploy the connected mooring line
vii.
Pre-tension the mooring line with the ILT
viii.
Mooring line #3 connection completed and the FOWT is storm safe
k.
Demobilize the tow vessels
3.
Demobilization FOWT power cable hook-up (two times)
a.
Recover the power cable from the seabed
b.
Recover the messenger line from the FOWT
c.
Connect the messenger line and the wet handshake to the FOWT
4.
Hook-up completion
a.
As built survey
b.
AHTS transit to the next installation location
5.
Demobilization (Only in the 47th campaign)
a.
Demobilize project equipment
Table 6 shows the duration and weather limitations of the operations carried out for each FOWT. M1, M2 and M3 + ILT is the hook-up of the mooring lines until the FOWT is storm safe. These tasks must be performed consecutively, and the maximum safe significant wave is 1.5 m. Each task takes 10 h except the last, which takes 20 h. C1 and C2 are the cable hook-up operations, which take approximately 6 h and have a maximum allowable wave height of 2 m.

3.5.4. Dependencies and Contingency Time Frames

Table 7 and Table 8 present the number of campaigns and elements installed or connected per campaign and the time dependencies between operations, which are especially important in combination with the optimal installation seasons. Since it is usually better to concentrate the operations in the summer months, the dependencies between the operations can push the most restrictive campaigns (FWT mooring and cable Hook-up) into months with few weather windows.

3.6. Estimation of Costs of Transport and Installation Vessels

3.6.1. Transport Vessel

The type of vessel considered for the transport of the mooring components is a general cargo vessel with a deadweight of 4500 tons. In the case of drag anchors, the vessel has a capacity for the transportation of 14–15 anchors. Table 9 shows the required time for loading and unloading the mooring components per transport. The cost per vessel is approximately EUR 75,000.00.

3.6.2. Installation Vessels

Table 10, Table 11 and Table 12 present the main vessels used in the installation operations, an approximate day rate for the charter and the approximate costs of the installation equipment and fuel. Port costs are not included in the assessment.
Table 10. Main vessel types and their characteristics.
VesselCharacteristicsOperationDay Rate (EUR)
AHTSBP > 250 t
DP2
2xWROV
Mooring line installation
Hook-up operations
40,000.00
  • Anchor handler supply tug vessel (AHTS)
Table 11. AHTS costs.
ElementCharacteristicsOperationDay Rate (EUR)Lump Sum (EUR)
AHTSBP > 250t
DP2
2xWROV
Mooring line installation
Hook-up operations
40,000.00-
Installation aids -500,000.00
  • Fuel costs
Table 12. Fuel costs.
VesselOperation (EUR/Day)Standby (EUR/Day)
AHTs8000.002000.00
Tug4000.001000.00

4. Results and Discussion

4.1. Installation Weather Windows Analysis Results

In the following subsections, the results of the simulations are presented. The parameter used to analyse the results are:
  • Weather window assessment and associated risk. For each operation, the results of the simulations are represented by the average time to complete the operation and the standard deviation of the values.
  • Duration and vessels are required for each strategy. For mooring and cable hook-up operation, another strategy is studied to reduce the average time for installation, the risk and the cost.
  • Standby ratio. This metric measures the time when the vessels are not operating due to weather constraints. It is calculated by comparing the total hours required to perform an entire operation without considering the weather, and the total time that the vessels need to be chartered. The standby ratio is directly related to installation costs, so the optimization of installation sequences aims to reduce this parameter.
The summary of the results is presented in Table 13. For each operation, the duration in days using the averages of the optimal installation months is presented.

4.1.1. Mooring Pre-Lay

The minimum duration of a single mooring pre-lay campaign, which includes the installation of 20 drag anchors and mooring lines, as well as the tensioning of these 20 anchors, is 19 days (460 h), as specified in Table 5.
Table 14 and Figure 10 show the average, maximum and minimum time needed to complete the same operation in each month of the year. This information is used to obtain the optimal time frames for installation and the risk associated to each month, which is represented by the standard deviation. The most suitable months to perform the drag anchor and mooring installation are the summer months. While it is possible to have good weather windows during the winter and autumn months, the risk is significantly higher.
A total of 7 campaigns are necessary to install the 141 mooring lines Table 15 shows the number of campaigns that could be carried out in each month as well as the percentage completed out of the 7 total campaigns. It is observed that the installation can be performed between April and August with two AHTS vessels. The total duration could be approximately 127 days.

4.1.2. Mooring and Power Cable Hook-up Campaign

The minimum duration of the mooring and power cable hook-up campaign is approximately 2 days (52 h), as specified in Table 6. Each campaign includes the hook-up of the three mooring lines per floating wind turbine, the tensioning of the mooring system utilizing the In-Line tensioner, and the power cable hook-up.
Table 16 and Figure 11 shows the average, maximum and minimum amount of time it takes to complete the same operation in each month of the year. This information is used to obtain the optimal time frames for installation and the risk associated with each month, which is represented by the standard deviation. Same as in mooring pre-lay campaigns, the summer months are optimal to perform the hook-up campaigns. Compared with the previous operation, the average installation time and the standard deviation is larger due to the longer operation duration and additional constraints.
Table 17 shows the number of campaigns that could be carried out each month as well as the percentage completed out of the 47 total campaigns needed for the hook-up of the structures of the wind farm.
In this case, it is observed that the hook-up manoeuvres cannot be performed within a year with a single AHTS vessel. With a single AHTS vessel, it would take approximately 1.25 years to do the hook-up of all the FWTs that comprised the wind farm. Therefore, the use of another AHTS is proposed to optimize the time taken to carry out these campaigns, and with it, its cost.
Two strategies are considered:
  • Option A: One AHTS vessel working all year round for 1 year and 3 months. For the 47 FWTs, it would take approximately 455 days (the first full year and second year until the end of march)
  • Option B: Two AHTS vessels working in the months from April to August for a single year. For the 47 FWT, it would take approximately 153 days of operation and it would end at the end of August.

4.2. Preliminary Schedule and Cost Estimation Results

4.2.1. Installation Preliminary Schedule and Cost Estimation

A preliminary schedule for the installation of the moorings is presented in Table 18 considering the strategies proposed in the previous section. The numbers in each operation represent the number of campaigns performed in that month. There are 7 Mooring pre-lay campaigns and 47 FWT towing and hook-up campaigns.
Two alternatives are studied:
  • Option A: The towing and hook-up operation happens continuously throughout the year using one AHTS and two tugs.
  • Option B: The towing and hook-up operation happens from April to August and use two AHTS and eight tugs. To minimize the cost, these campaigns are scheduled to happen in the most productive months.
The total estimated duration and costs per operation considering both strategies are presented in Table 19. The standby ratio is the time that the ship is chartered but is not operating due to the weather. It can be used as an efficiency indicator. The fuel costs are based on this ratio since they are higher while operating than while on standby.
Table 20 presents the total estimated duration and cost for the installation of the whole wind farm. The strategy labelled as Option B proves to be more economical since it avoids the months with low productivity and has a lower standby ratio. It has a total duration of 6 months.

4.2.2. Transport Preliminary Schedule and Cost Estimation

On the premise that the necessary components will be ready at the commissioning port at the start of each of the scheduled installation phases, Table 21. presents the number of mooring components shipped per month considering the more economical installation option obtained in the previous section (option B).
The transport of the mooring chains and connectors is carried out between February and May using two vessels per month for the first two months and a single vessel for the other two. Considering the large number of anchors in the wind farm, it was decided to ship them from January to June utilizing two vessels per month for the first four months and another vessel per month for the remaining two.
Based on the total amount of each component required for the construction wind farm, the number of ships required to transport each component and their cost are defined in Table 22.

5. Conclusions

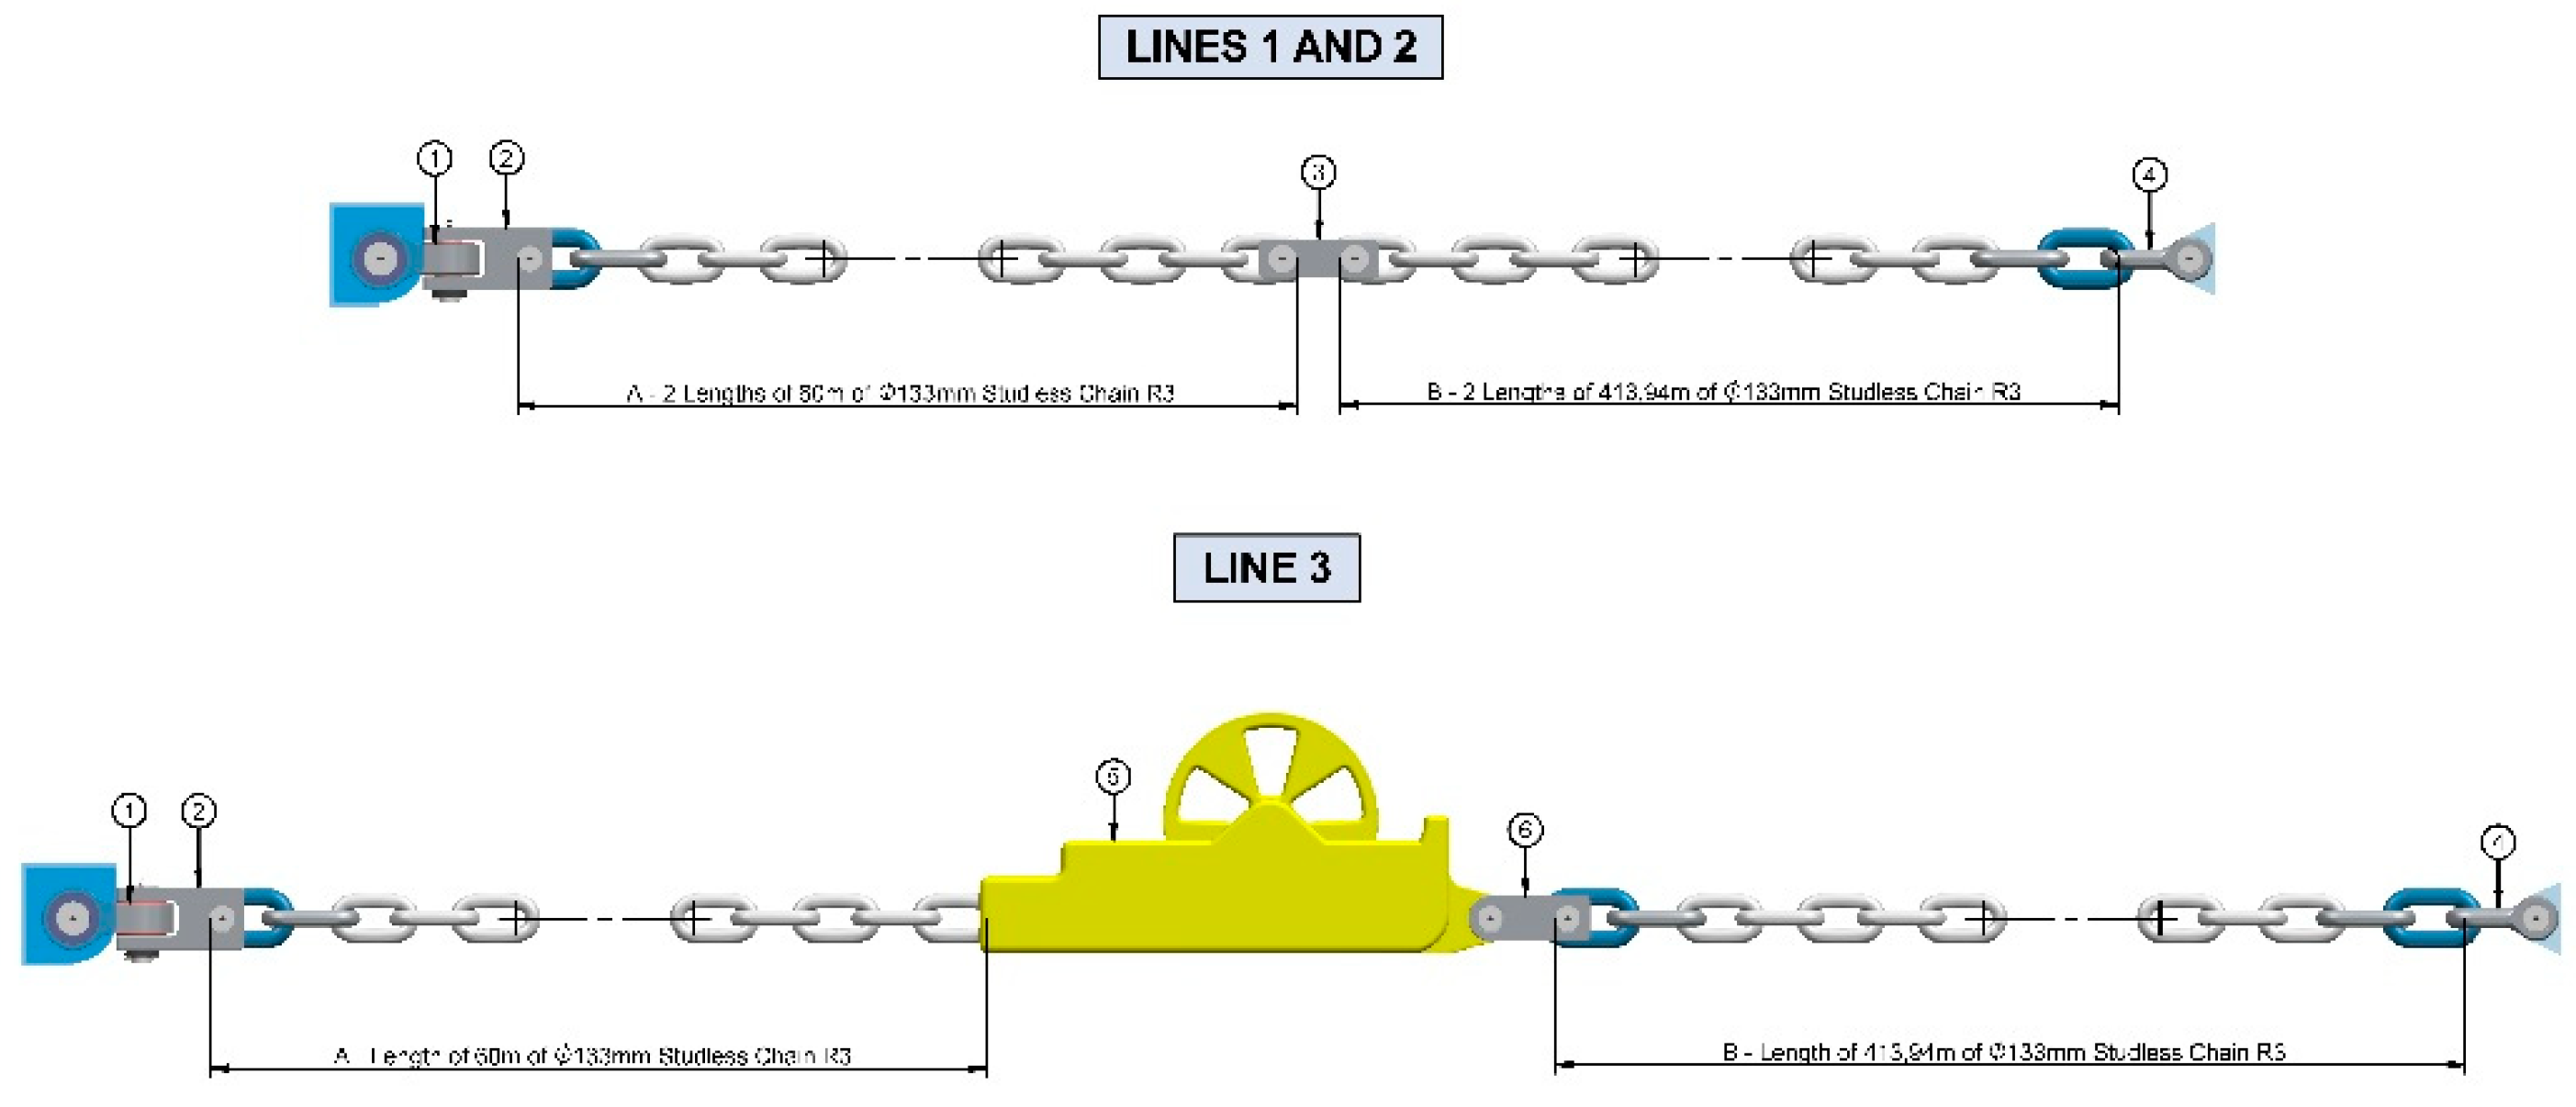
The mooring system transport and installation logistics for a floating offshore wind platform, TELWIND, in Lannion, located on the northwest coast of France, are discussed in this paper. The discussed station keeping system is a spread mooring system designed within the ARCWIND project.
The procedures for carrying out the mooring pre-lay, platform towing, and mooring and cable hook-up campaigns, including the duration and weather limitations for carrying out the operations in terms of maximum Hs, are described and discussed. Based on different transport and installation strategies, the preliminary schedule and cost are estimated.
The most suitable months to perform the drag anchor and mooring installation are the summer months. While it is possible to have good weather windows during the winter and autumn months, the risk is significantly higher. Summer months are also optimal to perform the hook-up campaigns. Compared with the mooring pre-lay, the average installation time and the standard deviation is larger due to the longer operation duration and additional constraints, for the mooring and power cable hook-up campaign.
The cost estimation results for installation show that the strategy with two AHTS vessels working in the months from April to August for a single year proves to be more economical since it avoids the months with low productivity and has a lower standby ratio. For the 47 FWT, it would take approximately 153 days of operation and it would end at the end of August.
Regarding the transports, it was decided to ship them from January to June, employing two vessels per month for the first four months and another vessel per month for the remaining two.
The case study demonstrated that the Mission Planner simulation method is efficient for analysing the marine operations; however, it is suitable for the case when sufficient project data are available. The limitations of this study are related to the scarce data available in the initial stages of the design of a wind farm. For example, the mooring components, location, and the individual tasks are specified for the present study, while the rest of the input data are based on industry knowledge on installation time frames, weather limits and vessel costs. Further optimization can be made when planning the simultaneous offshore operations with dependences between them. The presented costs are highly dependent on the current state of the market.
The simulation study allowed for the assessment of the representative duration for the installation procedure as well as its overall cost, allowing for the conclusion that the use of a simulation tool is the only feasible way to produce these research results that are indispensable for proper costing and planning these operations.
The results of this model could be used on early tenders of Requests For Information (RFIs). The weather risk is significant, and it is recommended that it is considered on the initial stages of the projects through models such as the one presented in this work.

Author Contributions

J.A. designed the mooring systems, performed the hook-up analyses, conducted the investigation, and prepared the draft manuscript. A.H. worked on the methodology concept and the installation methods and contributed actively to the review of the draft. O.M. also helped in the review of the draft and supervised the work. J.U. and C.R. developed the TELWIND platform and contributed to the review of the draft. S.W. and C.G.S. contributed to the writing of the paper. All authors have read and agreed to the published version of the manuscript.

Funding

This research was funded by Interreg Atlantic Area European Regional Development Fund; “Adaptation and Implementation of Floating Wind Energy Conversion Technology for the Atlantic Region”, ARCWIND project—grant number EAPA_344/2016. This work contributes to the Strategic Research Plan of the Centre for Marine Technology and Ocean Engineering (CENTEC), which is financed by the Portuguese Foundation for Science and Technology (Fundação para a Ciência e Tecnologia—FCT) under contract UIDB/UIDP/00134/2020.

Institutional Review Board Statement

Not applicable.

Informed Consent Statement

Not applicable.

Data Availability Statement

All the data presented in this work are based in the ARCWIND project internal deliverables. They are recorded in the project website data base with restricted access.

Acknowledgments

The valuable information provided by Esteyco concerning TELWIND technology is sincerely acknowledged. The information provided by Vicinay Mooring Connectors, Vicinay Sestao and Vicinay Marine regarding the mooring chain and connectors logistics and transport is acknowledged as well. Finally, all the ARCWIND project consortium must be recognized for their intensive work and collaboration.

Conflicts of Interest

The authors declare no conflict of interest.

References

  1. An EU Strategy to Harness the Potential of Offshore Renewable Energy for a Climate Neutral Future; European Commission: Brussel, Belgium, 2020; p. 11.
  2. DNV Energy Transition Outlook 2021. In A Global and Regional Forecast to 2050; DNV: Bærum, Norway, 2021; pp. 88–91.
  3. Diaz, H.; Serna, J.; Nieto, J.; Guedes Soares, C. Market needs, opportunities and barriers for the floating wind industry. J. Mar. Sci. Eng. 2022, 10, 934. [Google Scholar] [CrossRef]
  4. Díaz, H.; Guedes Soares, C. Review of the current status, technology and future trends of offshore wind farms. Ocean. Eng. 2020, 209, 107381. [Google Scholar] [CrossRef]
  5. Salvação, N.; Guedes Soares, C. Wind resource assessment offshore the Atlantic Iberian coast with the WRF model. Energy 2018, 145, 276–287. [Google Scholar]
  6. Silva, D.; Bento, A.R.; Martinho, P.; Guedes Soares, C. High resolution local wave energy modelling in the Iberian Peninsula. Energy 2015, 91, 1099–1112. [Google Scholar] [CrossRef]
  7. Wind Europe. Wind Energy in Europe: Scenarios for 2030; WindEurope: Brussels, Belgium, 2017. [Google Scholar]
  8. Sharma, J.S.; Dinesh, V.; Arul, A. Review on Floating Offshore Wind Turbines. In Offshore Technology Conference Asia; Virtual and Kuala: Lumpur, Malaysia, 2022; Paper OTC-31391-MS. [Google Scholar]
  9. Díaz, H.; Guedes Soares, C. An integrated GIS approach for site selection of floating offshore wind farms in the Atlantic continental European coastline. Renew. Sustain. Energy Rev. 2020, 134, 110328. [Google Scholar]
  10. Giebel, G.; Hasager, C.B. An overview of offshore wind farm design. MARE-WINT 2016, 337–346. [Google Scholar]
  11. Baban, S.M.; Parry, T. Developing and applying a GIS-assisted approach to locating wind farms in the UK. Renew. Energy 2001, 24, 59–71. [Google Scholar] [CrossRef]
  12. Aydin, N.Y.; Kentel, E.; Duzgun, H.S. GIS-based site selection methodology for hybrid renewable energy systems: A case study from western Turkey. Energy Convers. Manag. 2013, 70, 90–106. [Google Scholar] [CrossRef]
  13. Vasileiou, M.; Loukogeorgaki, E.; Vagiona, D.G. GIS-based multi-criteria decision analysis for site selection of hybrid offshore wind and wave energy systems in Greece. Renew. Sustain. Energy Rev. 2017, 73, 745–757. [Google Scholar] [CrossRef]
  14. Díaz, H.; Guedes Soares, C. A novel multi-criteria decision-making model to evaluate floating wind farm locations. Renew. Energy 2022, 185, 431–454. [Google Scholar] [CrossRef]
  15. Díaz, H.; Loughney, S.; Wang, J.; Guedes Soares, C. Comparison of multicriteria analysis techniques for decision making on floating offshore wind farms site selection. Ocean. Eng. 2022, 248, 110751. [Google Scholar]
  16. Uzunoglu, E.; Karmakar, D.; Guedes Soares, C. Floating offshore wind platforms. In Floating Offshore Wind Farms; Castro-Santos, L., Diaz-Casas, V., Eds.; Springer International Publishing: Cham, Switzerland, 2016; pp. 53–76. [Google Scholar]
  17. Skaare, B.; Nielsen, F.G.; Hanson, T.D.; Yttervik, R.; Havmøller, O.; Rekdal, A. Analysis of measurements and simulations from the Hywind Demo floating wind turbine: Dynamic analysis of the Hywind Demo floating wind turbine. Wind Energy 2015, 18, 1105–1122. [Google Scholar] [CrossRef]
  18. Roddier, D.; Cermelli, C.; Aubault, A.; Weinstein, A. WindFloat: A floating foundation for offshore wind turbines. J. Renew. Sustain. Energy 2010, 2, 033104. [Google Scholar] [CrossRef]
  19. Duarte, T.; Price, S.; Peiffer, A.; Pinheiro, J.M. WindFloat Atlantic Project: Technology Development Towards Commercial Wind Farms. In Offshore Technology Conference; OnePetro: Houston, TX, USA, 2022; Paper OTC-32058-MS. [Google Scholar]
  20. Amaro, N.; Egorov, A.; Gloria, G. Fostering Offshore Wind Integration through Grid Connection Impact Assessment. J. Mar. Sci. Eng. 2022, 10, 463. [Google Scholar] [CrossRef]
  21. Shelley, S.A.; Boo, S.Y.; Kim, D.; Luyties, W.H. Concept Design of Floating Substation for a 200 MW Wind Farm for the Northeast US. In Offshore Technology Conference; OnePetro: Houston, TX, USA, 2020; Paper OTC-30543-MS. [Google Scholar]
  22. Castro-Santos, L.; Martins, E.; Guedes Soares, C. Methodology to calculate the costs of a floating offshore renewable energy farm. Energies 2016, 9, 324–350. [Google Scholar] [CrossRef]
  23. Castro-Santos, L.; Silva, D.; Bento, A.R.; Salvacao, N.; Guedes Soares, C. Economic feasibility of floating offshore wind farms in Portugal. Ocean Eng. 2020, 207, 107393. [Google Scholar] [CrossRef]
  24. Castro-Santos, L.; Bento, A.R.; Silva, D.; Salvacao, N.; Guedes Soares, C. Economic feasibility of floating offshore wind farms in the north of Spain. J. Mar. Sci. Eng. 2020, 8, 58–76. [Google Scholar] [CrossRef]
  25. Yang, Y.; Bashir, M.; Michailides, C.; Mei, X.; Wang, J.; Li, C. Coupled analysis of a 10 MW multi-body floating offshore wind turbine subjected to tendon failures. Renew. Energy 2021, 176, 89–105. [Google Scholar] [CrossRef]
  26. Azcona, J.; Vittori, F.; Schmidt, U.; Svanije, F.; Kapogiannis, G.; Karvelas, X.; Manolas, D.; Voutsinas, S.; Amann, F.; Faerron-Guzman, R.; et al. Design Solutions for 10 MW Floating Offshore Wind Turbines. INNWIND. EU Deliv. D 2017, 4, 37. [Google Scholar]
  27. Yu, W.; Müller, K.; Lemmer, F.; Bredmose, H.; Borg, M.; Sanchez, G.; Landbo, T. Public definition of the two LIFES50+ 10MW floater concepts. LIFES50+ Deliv. 2017, 4. [Google Scholar]
  28. Armesto, J.A.; Jurado, A.; Guanche, R.; Couñago, B.; Urbano, J.; Serna, J. Telwind: Numerical analysis of a floating wind turbine supported by a two bodies platform. In International Conference on Offshore Mechanics and Arctic Engineering; American Society of Mechanical Engineers: New York, NY, USA, 2018; Volume 51319, p. V010T09A073. [Google Scholar]
  29. Baita-Saavedra, E.; Cordal-Iglesias, D.; Filgueira-Vizoso, A.; Morató, À.; Lamas-Galdo, I.; Álvarez-Feal, C.; Carral, L.; Castro-Santos, L. An economic analysis of an innovative floating offshore wind platform built with concrete: The SATH® platform. Appl. Sci. 2020, 10, 3678. [Google Scholar] [CrossRef]
  30. Uzunoglu, E.; Guedes Soares, C. Hydrodynamic design of a free-float capable tension leg platform for a 10 MW wind turbine. Ocean Eng. 2020, 197, 106888. [Google Scholar] [CrossRef]
  31. Guo, X.; Zhang, Y.; Yan, J.; Zhou, Y.; Yan, S.; Shi, W.; Li, X. Integrated Dynamics Response Analysis for IEA 10-MW Spar Floating Offshore Wind Turbine. J. Mar. Sci. Eng. 2022, 10, 542. [Google Scholar] [CrossRef]
  32. DNV Group. DNV-OS-E301 Position Mooring; DNV GL: Oslo, Norway, 2015. [Google Scholar]
  33. Xu, S.; Wang, S.; Guedes Soares, C. Review of mooring design for floating wave energy converters. Renew. Sustain. Energy Rev. 2019, 111, 595–621. [Google Scholar] [CrossRef]
  34. Masciola, M.; Jonkman, J.; Robertson, A. Implementation of a multisegmented, quasi-static cable model. In Proceedings of the Twenty-Third International Offshore and Polar Engineering Conference, Anchorage, AK, USA, 30 June–5 July 2013. [Google Scholar]
  35. Depalo, F.; Wang, S.; Xu, S.; Guedes Soares, C. Design and Analysis of a Mooring System for a Wave Energy Converter. J. Mar. Sci. Eng. 2021, 9, 782. [Google Scholar] [CrossRef]
  36. Masciola, M.; Robertson, A.; Jonkman, J.; Coulling, A.; Goupee, A. Assessment of the importance of mooring dynamics on the global response of the DeepCwind floating semisubmersible offshore wind turbine. In Proceedings of the Twenty-Third International Offshore and Polar Engineering Conference, Anchorage, AK, USA, 30 June–5 July 2013. [Google Scholar]
  37. Bae, Y.H.; Kim, M.H.; Kim, H.C. Performance changes of a floating offshore wind turbine with broken mooring line. Renew. Energy 2017, 101, 364–375. [Google Scholar] [CrossRef]
  38. Depalo, F.; Wang, S.; Xu, S.; Guedes Soares, C.; Yang, S.H.; Ringsberg, J.W. Effects of dynamic axial stiffness of elastic moorings for a wave energy converter. Ocean Eng. 2022, 251, 111132. [Google Scholar] [CrossRef]
  39. Amaechi, C.V.; Odijie, A.C.; Wang, F.; Ye, J. Numerical investigation on mooring line configurations of a Paired Column Semisubmersible for its global performance in deep water condition. Ocean Eng. 2022, 250, 110572. [Google Scholar] [CrossRef]
  40. Maples, B.; Saur, G.; Hand, M.; Van De Pietermen, R.; Obdam, T. Installation, Operation, and Maintenance Strategies to Reduce the Cost of Offshore Wind Energy (No. NREL/TP-5000-57403); National Renewable Energy Laboratory (NREL): Golden, CO, USA, 2013.
  41. Sarker, B.R.; Faiz, T.I. Minimizing maintenance cost for offshore wind turbines following multi-level opportunistic preventive strategy. Renew. Energy 2016, 85, 104–113. [Google Scholar] [CrossRef]
  42. Santos, F.P.; Teixeira, A.P.; Guedes Soares, C. Influence of logistic strategies on the availability and maintenance costs of an offshore wind turbine. In Safety, Reliability and Risk Analysis: Beyond the Horizon; Steenbergen, R.D.J.M., van Gelder, P.H.A.J.M., Miraglia, S., Vrouwenvelder, A.C.W.M.T., Eds.; CRC Press: Boca Raton, FL, USA, 2014; pp. 791–799. [Google Scholar]
  43. Santos, F.P.; Teixeira, A.P.; Soares, C.G. Modelling and simulation of the operation and maintenance of offshore wind turbines. J. Risk Reliab. 2015, 229, 385–393. [Google Scholar] [CrossRef]
  44. Dalgic, Y.; Lazakis, I.; Dinwoodie, I.; McMillan, D.; Revie, M. Advanced logistics planning for offshore wind farm operation and maintenance activities. Ocean. Eng. 2015, 101, 211–226. [Google Scholar] [CrossRef]
  45. Akbari, N.; Irawan, C.A.; Jones, D.F.; Menachof, D. A multi-criteria port suitability assessment for developments in the offshore wind industry. Renew. Energy 2017, 102, 118–133. [Google Scholar] [CrossRef]
  46. Hassan, M.A.A.A.; Guedes Soares, C. Analysis of vessel shielding effects during installation of spar floating wind turbine. In Advances in Renewable Energies Offshore; Guedes Soares, C., Ed.; Taylor & Francis Group: London, UK, 2019; pp. 693–702. [Google Scholar]
  47. Hassan, M.A.A.A.; Guedes Soares, C. Installation of pre-assembled offshore floating wind turbine using a floating vessel. In Developments in Renewable Energies Offshore; Guedes Soares, C., Ed.; Taylor and Francis: London, UK, 2021; pp. 461–468. [Google Scholar]
  48. Jin, J.; Jiang, Z.; Vatne, S.R.; Ren, Z.; Zhao, Y.; Gao, Z. Installation of pre-assemsbled offshore wind turbines using a catamaran vessel and an active gripper motion control method. In Grand Renewable Energy proceedings; Japan Council for Renewable Energy: Tokyo, Japan, 2018; p. 156. [Google Scholar]
  49. Mas-Soler, J.; Uzunoglu, E.; Guedes Soares, C.; Bulian, G.; Souto-Iglesias, A. An experimental study on transporting a free-float capable tension leg platform for a 10 MW wind turbine in waves. Renew. Energy 2021, 179, 2158–2173. [Google Scholar] [CrossRef]
  50. Santos, F.P.; Teixeira, A.P.; Guedes Soares, C. Maintenance Planning of an Offshore Wind Tur bine using Stochastic Petri Nets with Predicates. J. Offshore Mech. Arct. Eng. 2018, 140, 021904. [Google Scholar]
  51. Martins, D.; Muraleedharan, G.; Guedes Soares, C. Analysis on weather windows defined by significant wave height and wind speed. In Renewable Energies Offshore; Guedes Soares, C., Ed.; Taylor & Francis Group: London, UK, 2015; pp. 91–98. [Google Scholar]
  52. Walker, R.T.; van Nieuwkoop-McCall, J.; Johanning, L.; Parkinson, R.J. Calculating weather windows: Application to transit, installation and the implications on deployment success. Ocean Eng. 2013, 68, 88–101. [Google Scholar] [CrossRef]
  53. DNV Offshore Standard DNV GL-ST-N001. In Marine Operations and Marine Warranty; DNV: Bærum, Norway, 2018.
  54. O’Connor, M.; Lewis, T.; Dalton, G. Weather window analysis of Irish west coast wave data with relevance to operations & maintenance of marine renewables, Renew. Energy 2013, 52, 57–66. [Google Scholar]
  55. Walker, R.T.; Johanning, L.; Parkinson, R. Weather windows for device deployment at UK test sites: Availability and cost implications. In Proceedings of the 9th European Wave and Tidal Energy Conference, Southampton, UK, 5–9 September 2011. [Google Scholar]
  56. CoreMarine Mission Planner. Available online: https://missionplanner.core-marine.com/ (accessed on 30 March 2021).
  57. NKUA. High Resolution Wave and Wind Hindcast Database. In Europe 2000–2010; NKUA: Athens, Greece.
  58. Guedes Soares, C.; Bento, A.R.; Goncalves, M.; Silva, D.; Martinho, P. Numerical evaluation of the wave energy resource along the Atlantic European coast. Comput. Geosci. 2014, 71, 37–49. [Google Scholar] [CrossRef]
  59. Goncalves, M.; Martinho, P.; Guedes Soares, C. A hindcast study on wave energy variability and trends in Le Croisic, France. In Progress in Renewable Energies Offshore; Guedes Soares, C., Ed.; Taylor & Francis Group: London, UK, 2016; pp. 3–9. [Google Scholar]
  60. Goncalves, M.; Martinho, P.; Guedes Soares, C. A 33-year hindcast on wave energy assessment in the western French coast. Energy 2018, 165, 790–801. [Google Scholar] [CrossRef]
  61. Map data. © 2021 Google, Imagery: © 2021 TerraMetrics, LLC.
Figure 1. TELWIND platform.
Jmse 10 01354 g001
Figure 2. TELWIND station keeping system.
Jmse 10 01354 g002
Figure 3. Station keeping system assembly drawing.
Jmse 10 01354 g003
Figure 4. Wind farm array design and dimensions.
Jmse 10 01354 g004
Figure 5. Wind farm radial topology.
Jmse 10 01354 g005
Figure 6. Mission Planner input example.
Jmse 10 01354 g006
Figure 7. Mission Planner input example.
Jmse 10 01354 g007
Figure 8. Mission Planner output graph.
Jmse 10 01354 g008
Figure 9. Lannion site. Map from © 2021 Google [61].
Jmse 10 01354 g009
Figure 10. Mooring pre-laying campaign duration.
Jmse 10 01354 g010
Figure 11. Hook-up campaign duration.
Jmse 10 01354 g011
Table 1. Floating wind farm offshore mooring chain.
ComponentQuantityWeight (Tons)
Chain Length of 60 m of Ø133 mm Studless Chain1412978
Chain Length of 414 m of Ø133 mm Studless Chain14120545
Table 2. Floating wind farm mooring connectors.
ComponentQuantityWeight (Tons)
Unijoint Connection for Ø133 mm Chain141423
Inverted H-Link for Ø133 mm Chain141183
H-Link for Ø133 mm Chain9499
In-Line Tensioner for Ø133 mm Chain47329
H-Link for Ø133 mm Chain and In-Line Tensioner4749
Anchor Shackle for Ø133 mm Chain141102
Table 3. Floating wind farm drag anchors.
ComponentQuantity
Drag anchor (15 T)141
Table 4. Transport distance and duration.
ComponentDistance (nm)Transport Duration (h)
Mooring chain50450
Mooring connectors
Drag anchors27828
Table 5. Mooring Pre-Laying weather limitations and duration.
TaskMax Hs (m)Duration (h)
M 1 and 22.522
M 3 and 42.522
M 5 and 62.522
M 7 and 82.522
M 9 and 102.522
M 11 and 122.522
M 13 and 142.522
M 15 and 162.522
M 17 and 182.522
M 19 and 202.522
DA T 12.512
DA T 22.512
DA T 32.512
DA T 42.512
DA T 52.512
DA T 62.512
DA T 72.512
DA T 82.512
DA T 92.512
DA T 102.512
DA T 112.512
DA T 122.512
DA T 132.512
DA T 142.512
DA T 152.512
DA T 162.512
DA T 172.512
DA T 182.512
DA T 192.512
DA T 202.512
Table 6. Mooring and power cable hook-up weather limitations and duration.
TaskMax Hs (m)Duration (h)
M 11.510
M 21.510
M 3 + ILT1.520
C 126
C 226
Table 7. Element and campaign summary.
OperationNo. of Elements per CampaignTotal ElementsNumber of Campaigns
Mooring Pre-Lay campaign201417
FTW Mooring and Power Cable Hook-up14747
Table 8. Main operation dependencies.
Campaign NameTime Dependencies
Mooring Pre-Lay campaignNo dependencies on other T and I campaigns
FTW Mooring and Power Cable Hook-upStart after three mooring installation campaigns (21 days approximately)
Table 9. Transport vessel loading and unloading duration.
ComponentLoading Duration (h)Unloading Duration (h)
Mooring chain9696
Mooring connectors
Drag anchors4848
Table 13. Weather window analysis results summary.
OperationOptimal Installation MonthsDuration (Days)Vessel RequiredUnits per Month
Mooring Pre-Lay campaignApril-August1272xAHTS29
FTW Mooring and Power Cable Hook-up. Option AAll year4551xAHTS3
FTW Mooring and Power Cable Hook-up. Option BApril-August1532xAHTS9
Table 14. Mooring pre-laying campaign weather windows.
MonthAverage (Days)Maximum (Days)Minimum (Days)σ (Days)
January41722211.44
February3355209.45
March2846206.08
April2439203.91
May2232203.22
June2126201.37
July2125200.98
August2127201.62
September2438204.23
October3157209.42
November32602010.71
December39692013.01
Table 15. Mooring Pre-Laying campaign completion % per month.
MonthNo. CampaignsCompletion (% of Total)
January0.7510.7%
February0.9413.4%
March1.115.7%
April1.2718.2%
May1.3719.5%
June1.4620.8%
July1.4921.3%
August1.4520.7%
September1.318.6%
October1.0114.4%
November0.9613.7%
December0.7611.2%
TOTAL13.88198.3%
Table 16. Hook-up campaign weather windows.
MonthAverage (Days)Maximum (Days)Minimum (Days)σ (Days)
January2674318.40
February1447312.19
March1447310.36
April93436.35
May93637.12
June52233.69
July62433.96
August52533.76
September73936.40
October1158311.25
November1445311.31
December1789319.30
Table 17. Hook-up campaign completion % per month.
MonthNo. CampaignsCompletion (% of Total)
January1.222.6%
February2.214.7%
March2.264.8%
April3.677.8%
May3.627.7%
June5.8812.5%
July5.4511.6%
August6.1113.0%
September4.569.7%
October2.735.8%
November2.304.9%
December1.833.9%
TOTAL41.8389.0%
Table 18. Installation preliminary schedule.
YearMonthOption AOption B
Mooring PRE-LayFWT TowingHook-UpMooring Pre-LayFWT TowingHook-Up
1January111
February122
March1221
April144177
May144277
June16621111
July15511111
August 66 1111
September 44
October 33
November 22
December 22
2January 11
February 22
March 22
April 11
Table 19. Total installation cost estimation.
OperationVessel RequiredEstimated Duration (Days)Standby (%)Vessel Cost (EUR)Fuel Cost (EUR)Total Cost (EUR)
Option AMooring Pre-lay2xAHTS21271.9%17,960,000 1,562,000 19,522,000
FWT towing1xAHTS48576.2%23,280,000 3,326,500 26,606,500
Hook-up4xtugs (2 fleets)48578.7%19,900,000 1,589,000 21,489,000
Option BMooring Pre-lay2xAHTS15361.1%13,240,000 1,326,000 14,566,000
FWT towing2xAHTS15362.2%14,688,000 2,610,500 17,298,500
Hook-up8xtugs (4 fleets)15366.3%13,240,000 1,231,000 14,471,000
Table 20. Installation cost per FWT and MW.
OptionDuration (Months)From-toEstimated Cost (EUR)
A16January–April67,617,500
B6March–August46,335,500
Table 21. Transport preliminary schedule.
YearMonthOption B
Chain Length of 60 mChain Length of 414 mUnijointInverted H-LinkH-LinkILTH-Link-ILTAnchor ShackleDrag Anchor
1January 29
February14130909060272714128
March 60 28
April 31 28
May 205151342020 14
June 14
Table 22. Transport costs.
ComponentQuantityNumber of VesselsCost (EUR)
Mooring chain23523 tons6450.000
Mooring connectors1185 tons
Drag anchors141 uds10750.000
Publisher’s Note: MDPI stays neutral with regard to jurisdictional claims in published maps and institutional affiliations.

