Temperature Has a Greater Effect on Fruit Growth than Defoliation or Fruit Thinning in Strawberries in the Subtropics

Abstract
1. Introduction
2. Materials and Methods
3. Results
4. Discussion
5. Conclusions
Funding
Conflicts of Interest
References
- Yommi, A.K.; Borquez, A.M.; Quipildor, S.L.; Kirschbaum, D.S. Fruit quality evaluation of strawberry cultivars grown in Argentina. Acta Hortic. 2003, 628, 871–878. [Google Scholar] [CrossRef]
- Agüero, J.J.; Salazar, S.; Kirschbaum, D.S.; Jerez, E.F. Factors affecting fruit quality in strawberries grown in a subtropical environment. Int. J. Fruit Sci. 2015, 15, 223–234. [Google Scholar] [CrossRef]
- Whitaker, V.M.; Chandler, C.K.; Peres, N.; Nunes, M.C.N.; Plotto, A.; Sims, C.A. Sensation™ ‘Florida127’ strawberry. HortScience 2015, 50, 1088–1091. [Google Scholar] [CrossRef]
- Menzel, C.M.; Smith, L.A.; Moisander, J.A. Protected cropping of strawberry plants in subtropical Queensland. Acta Hortic. 2016, 1117, 273–278. [Google Scholar] [CrossRef]
- Faedi, W.; Baruzzi, G. Strawberry breeding. In Strawberry: Growth, Development and Diseases; Husaini, A.M., Neri, D., Eds.; CABI: Wallingford, UK, 2016; pp. 26–40. [Google Scholar]
- Menzel, C.M.; Smith, L. The growth and productivity of ‘Festival’ strawberry plants growing in a subtropical environment. NZ J. Crop Hortic. Sci. 2014, 42, 60–75. [Google Scholar] [CrossRef]
- Webb, R.A.; Terblanche, J.H.; Purves, J.V.; Beech, M.G. Size factors in strawberry fruit. Sci. Hortic. 1978, 9, 347–356. [Google Scholar] [CrossRef]
- Perkins-Veazie, P. Growth and ripening of strawberry fruit. Hortic. Rev. 1995, 17, 267–297. [Google Scholar]
- Ashman, T.-L.; Hitchens, M.S. Dissecting the causes of variation in intra-inflorescence allocation in a sexually polymorphic species, Fragaria virginiana (Rosaceae). Am. J. Bot. 2000, 87, 197–204. [Google Scholar] [CrossRef]
- Darrow, G.M. The Strawberry. History, Breeding and Physiology; Holt, Rinehart and Winston: New York, NY, USA, 1966; p. 447. [Google Scholar]
- Abbott, A.J.; Best, G.R.; Webb, R.A. The relation of achene number to berry weight in strawberry fruit. J. Hortic. Sci. 1970, 45, 215–222. [Google Scholar] [CrossRef]
- Strik, B.C.; Proctor, J.T.A. Relationship between achene number, achene density, and berry fresh weight in strawberry. J. Am. Soc. Hortic. Sci. 1988, 113, 620–623. [Google Scholar]
- Liu, H.; Xie, W.-F.; Zhang, L.; Valpuestra, V.; Ye, Z.-W.; Gao, Q.-H.; Duan, K. Auxin biosynthesis by the YUCCA6 flavin monooxygenase gene in woodland strawberry. J. Integr. Plant Biol. 2014, 56, 350–363. [Google Scholar] [CrossRef] [PubMed]
- Hou, Z.-X.; Huang, W.-D. Immunohistochemical location of IAA and ABP1 in strawberry shoot apexes during floral induction. Planta 2005, 222, 678–687. [Google Scholar] [CrossRef] [PubMed]
- Kang, C.; Darwish, O.; Geretz, A.; Shahan, R.; Alkharouf, N.; Liu, Z. Genome-wide transcriptomic insights into early-stage fruit development in woodland strawberry Fragaria vesca. Plant Cell 2013, 25, 1960–1978. [Google Scholar] [CrossRef] [PubMed]
- Janick, J.; Eggert, D.A. Factors affecting fruit size in the strawberry. Proc. Am. Soc. Hortic. Sci. 1968, 93, 311–316. [Google Scholar]
- Khanizadeh, S.; Lareau, M.; Buszard, D. Effect of flower thinning on strawberry fruit weight and its relationship to achene number. Acta Hortic. 1993, 348, 351–356. [Google Scholar] [CrossRef]
- Lyu, C.-B.; Li, K.-T. Flower thinning effects on annual plasticulture strawberry production in Chinese Taipei. Acta Hortic. 2014, 1049, 557–560. [Google Scholar]
- Lyu, C.-B.; Yang, W.-J.; Li, K.-T. Partial defoliation and runner removal affect runnering, fruiting, leaf photosynthesis and root growth in ‘Toyonoka’ strawberries for subtropical winter production. Hortic. Environ. Biotechnol. 2014, 55, 372–379. [Google Scholar] [CrossRef]
- Miura, H.; Yoshida, M.; Yamasaki, A. Effect of temperature on the size of strawberry fruit. J. Jpn. Soc. Hortic. Sci. 1994, 62, 769–774. [Google Scholar] [CrossRef]
- Kumakura, H.; Shishido, Y. The effect of daytime, nighttime, and mean temperatures on the growth of ‘Morioka-16’ strawberry fruits and plants. J. Jpn. Soc. Hortic. Sci. 1994, 62, 827–832. [Google Scholar] [CrossRef]
- Menzel, C.M.; Gomez, A.; Smith, L.A. Control of grey mould and stem-end rot in strawberry plants growing in a subtropical environment. Australas. Plant Pathol. 2016, 45, 489–498. [Google Scholar] [CrossRef]
- Menzel, C.M. Changes in the concentration of leaf nitrogen over the season affect the diagnosis of deficiency or sufficiency in strawberries in the subtropics. Agriculture 2018, 8, 126. [Google Scholar] [CrossRef]
- Miura, H.; Imada, S.; Yabuuchi, S. Double sigmoid growth curve of strawberry fruit. J. Jpn. Soc. Hortic. Sci. 1990, 59, 527–531. [Google Scholar] [CrossRef][Green Version]
- Chandler, C.K.; MacKenzie, S.J.; Herrington, M. Fruit development period in strawberry differs among cultivars, and is negatively correlated with average post bloom air temperature. Proc. Fla. State Hortic. Soc. 2004, 117, 83–85. [Google Scholar]
- Ariza, M.T.; Soria, C.; Martinez-Ferri, E. Developmental stages of cultivated strawberry flowers in relation to chilling sensitivity. Ann. Bot. Plants 2015, 7. [Google Scholar] [CrossRef] [PubMed]
- Darnell, R.L.; Martin, G.C. Role of assimilate translocation and carbohydrate accumulation in fruit set of strawberry. J. Am. Soc. Hortic. Sci. 1988, 113, 114–118. [Google Scholar]
- Hortyński, J.A.; Żebrowska, J.; Gawroński, J.; Hulewicz, T. Factors influencing fruit size in the strawberry (Fragaria ananassa Duch.). Euphytica 1991, 56, 67–74. [Google Scholar]
- MacKenzie, S.J.; Chandler, C.K.; Hasing, T.; Whitaker, V.M. The role of temperature in the late-season decline in soluble solids content of strawberry fruit in a subtropical production system. HortScience 2011, 46, 1562–1566. [Google Scholar] [CrossRef]
- Campbell, D.E.; Young, R. Short-term CO2 exchange response to temperature, irradiance, and CO2 concentration in strawberry. Photosynth. Res. 1986, 8, 31–40. [Google Scholar] [CrossRef]
- Jun, H.; Jung, H.; Imai, K. Gas exchange characteristics of a leading cultivar of Korean strawberry (Fragaria × ananassa, ‘Sulhyang’). Sci. Hortic. 2017, 221, 10–15. [Google Scholar] [CrossRef]
- Chandler, C.K.; Legard, D.E.; Dunigan, D.D.; Crocker, T.E.; Sims, C.A. ‘Strawberry Festival’ strawberry. HortScience 2000, 35, 1366–1367. [Google Scholar] [CrossRef]
- Le Mière, P.; Hadley, P.; Darby, J.; Battey, N.H. The effect of thermal environment, planting date and crown size on growth, development and yield of Fragaria × ananassa Duch. cv. Elsanta. J. Hortic. Sci. Biotechnol. 1998, 73, 786–795. [Google Scholar] [CrossRef]
- Josuttis, M.; Dietrich, H.; Patz, C.-D.; Kruger, E. Effect of air and soil temperature on the chemical composition of fruit and agronomic performance in strawberry (Fragaria × ananassa Duch.). J. Hortic. Sci. Biotechnol. 2011, 86, 415–421. [Google Scholar] [CrossRef]
- Shaw, D.V.; Larson, K.D. Performance of early-generation and modern strawberry cultivars from the University of California breeding programme in growing systems simulating traditional and modern horticulture. J. Hortic. Sci. Biotechnol. 2008, 83, 648–652. [Google Scholar] [CrossRef]
- Whitaker, V.M.; Hasing, T.; Chandler, C.K.; Plotto, A.; Baldwin, E. Historical trends in strawberry fruit quality revealed by a trial of University of Florida cultivars and advanced selections. HortScience 2011, 46, 553–557. [Google Scholar] [CrossRef]


| Treatment | No. of Leaves/Plant | Leaf Area (cm2/Plant) | Dry Weight (g/Plant) | |||||
|---|---|---|---|---|---|---|---|---|
| Leaves | Crowns | Roots | Flowers & Immature Fruit | Flowers & All Fruit | Plant | |||
| Control | 19.9 ± 1.3 b | 2066 ± 106 c | 16.9 ± 1.3 c | 5.9 ± 0.9 b | 2.4 ± 0.4 b | 8.1 ± 0.7 b | 13.0 ± 0.4 c | 38.3 ± 2.4 c |
| Defoliation | 14.6 ± 1.4 a | 1436 ± 149 a | 10.9 ± 0.9 a | 4.9 ± 0.5 a | 1.7 ± 0.1 a | 6.7 ± 0.7 a | 11.1 ± 0.8 b | 28.6 ± 1.9 a |
| Thinning | 19.9 ± 1.0 b | 2186 ± 200 c | 18.4 ± 1.9 c | 6.9 ± 0.6 c | 2.3 ± 0.2 b | 7.6 ± 1.2 ab | 10.5 ± 1.4 ab | 38.1 ± 2.9 c |
| Defoliation + thinning | 17.6 ± 2.8 ab | 1744 ± 267 b | 14.2 ± 2.2 b | 6.2 ± 0.5 bc | 2.3 ± 0.2 b | 6.9 ± 1.1 a | 9.7 ± 1.2 a | 32.5 ± 3.9 b |
| Treatment | Yield (g/Plant) | Number of Fruit/Plant | ||||
|---|---|---|---|---|---|---|
| MKT | Non-MKT | Total | MKT | Non-MKT | Total | |
| Control | 853 ± 60 c | 138 ± 10 b | 991 ± 61 c | 41.9 ± 2.9 b | 16.8 ± 1.4 b | 58.6 ± 3.4 b |
| Defoliation | 676 ± 53 a | 157 ± 18 c | 834 ± 71 b | 34.7 ± 2.9 a | 19.7 ± 2.1 c | 54.4 ± 4.8 b |
| Thinning | 725 ± 46 b | 118 ± 11 a | 843 ± 52 b | 34.5 ± 1.7 a | 13.4 ± 1.2 a | 47.9 ± 2.6 a |
| Defoliation + thinning | 651 ± 68 a | 130 ± 23 ab | 780 ± 89 a | 33.6 ± 3.3 a | 15.2 ± 2.6 ab | 48.8 ± 5.8 a |
| Treatment | Average Fruit Fresh Weight (g) | Percentage of Fruit That Were Non-Marketable | ||
|---|---|---|---|---|
| MKT | Non-MKT | Total | ||
| Control | 19.0 ± 0.3 b | 8.9 ± 0.1 a | 16.4 ± 0.3 b | 28.6 ± 1.8 a |
| Defoliation | 18.3 ± 0.6 a | 9.1 ± 0.3 a | 15.3 ± 0.8 a | 36.2 ± 0.7 b |
| Thinning | 19.9 ± 0.5 c | 8.8 ± 0.2 a | 17.4 ± 0.3 c | 27.9 ± 1.3 a |
| Defoliation + thinning | 18.6 ± 0.3 a | 8.8 ± 0.3 a | 15.9 ± 0.5 ab | 31.0 ± 2.2 a |
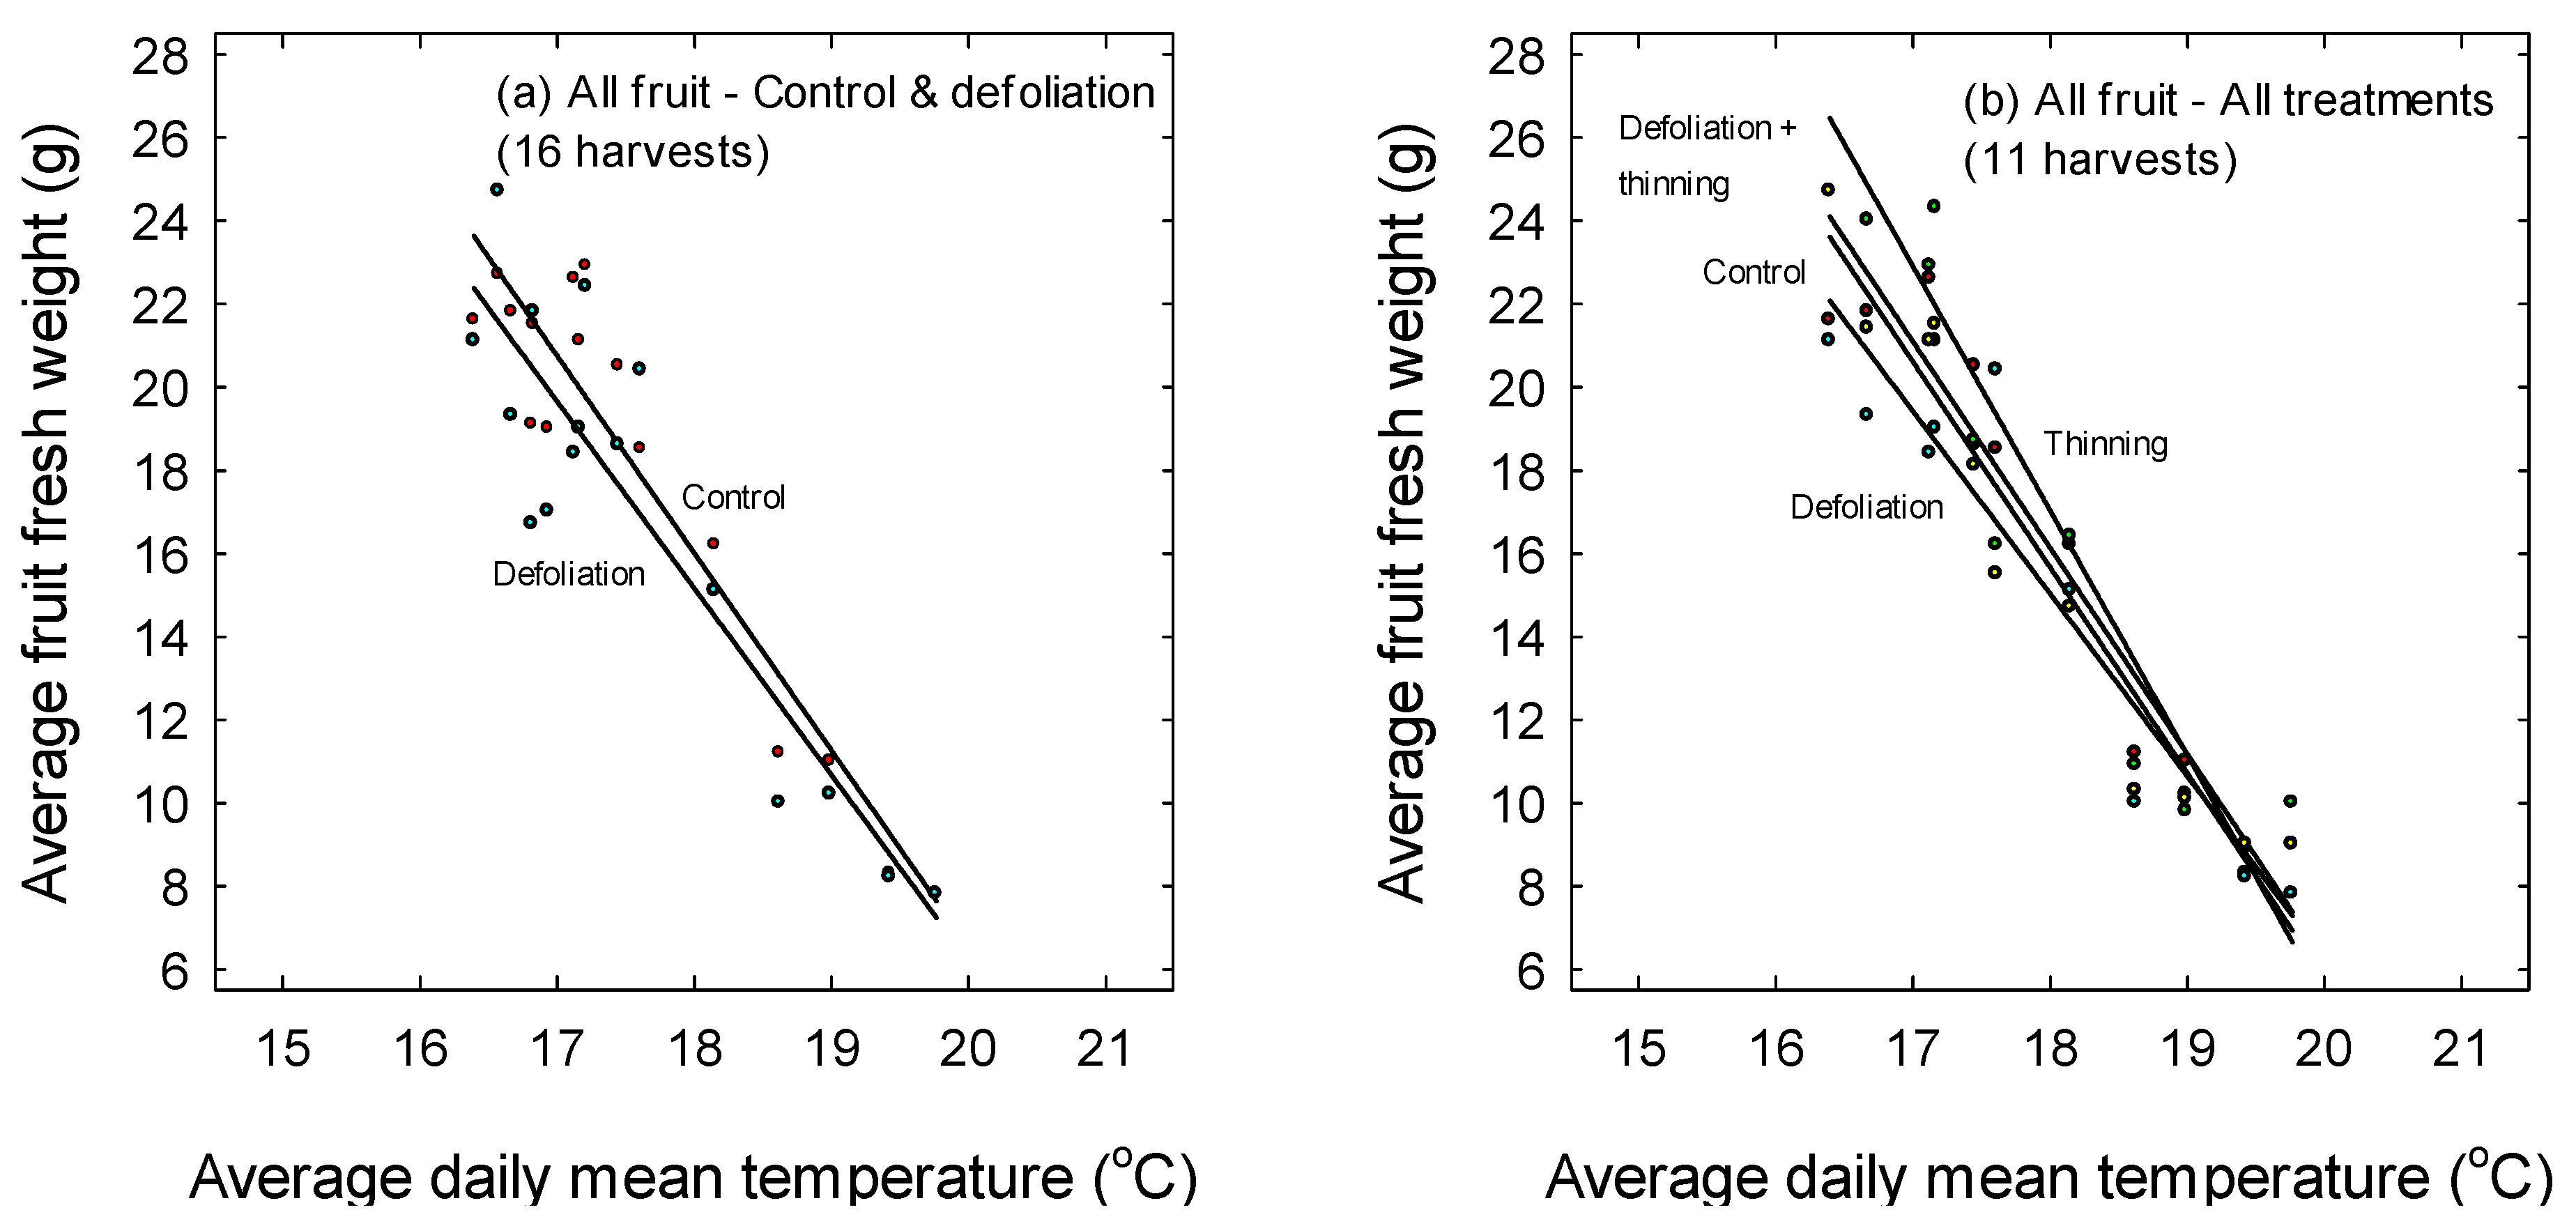
| Treatment | Period | Intercept | Constant | R2 Value |
|---|---|---|---|---|
| Control | Whole season | 101.3 ± 7.4 | −4.7 ± 0.4 | 0.89 |
| Defoliation | Whole season | 96.0 ± 9.9 | −4.5 ± 0.6 | 0.81 |
| All data | Whole season | 98.7 ± 6.1 | −4.6 ± 0.3 | 0.85 |
| Control | Part season | 105.3 ± 7.5 | −5.0 ± 0.4 | 0.93 |
| Defoliation | Part season | 94.0 ± 8.4 | −4.4 ± 0.5 | 0.90 |
| Thinning | Part season | 122.7 ± 11.2 | −5.9 ± 0.6 | 0.90 |
| Defoliation + thinning | Part season | 104.6 ± 7.6 | −4.9 ± 0.4 | 0.93 |
| All data | Part season | 106.7 ± 4.8 | −5.0 ± 0.3 | 0.89 |
© 2019 by the author. Licensee MDPI, Basel, Switzerland. This article is an open access article distributed under the terms and conditions of the Creative Commons Attribution (CC BY) license (http://creativecommons.org/licenses/by/4.0/).
Share and Cite
Menzel, C.M. Temperature Has a Greater Effect on Fruit Growth than Defoliation or Fruit Thinning in Strawberries in the Subtropics. Agriculture 2019, 9, 127. https://doi.org/10.3390/agriculture9060127
Menzel CM. Temperature Has a Greater Effect on Fruit Growth than Defoliation or Fruit Thinning in Strawberries in the Subtropics. Agriculture. 2019; 9(6):127. https://doi.org/10.3390/agriculture9060127
Chicago/Turabian StyleMenzel, Christopher M. 2019. "Temperature Has a Greater Effect on Fruit Growth than Defoliation or Fruit Thinning in Strawberries in the Subtropics" Agriculture 9, no. 6: 127. https://doi.org/10.3390/agriculture9060127
APA StyleMenzel, C. M. (2019). Temperature Has a Greater Effect on Fruit Growth than Defoliation or Fruit Thinning in Strawberries in the Subtropics. Agriculture, 9(6), 127. https://doi.org/10.3390/agriculture9060127