Article

Straw Retention Enables the Yield and Quality Benefits of Reduced Tillage in Winter Wheat and Spring Barley: A Long-Term Study


by
Aušra Sinkevičienė
1,2,*,
Vaclovas Bogužas
1,2,
Vaida Steponavičienė
1,
Alfredas Sinkevičius
2,
Aušra Marcinkevičienė
1,2,
Marta Wyzińska
3,
Adam Kleofas Berbeć
4 and
Rasa Kimbirauskienė
2,*
1
Bioeconomy Research Institute, Agriculture Academy, Vytautas Magnus University, K. Donelaičio Street 58, 44248 Kaunas, Lithuania
2
Department of Agroecosystems and Soil Sciences, Agriculture Academy, Vytautas Magnus University, K. Donelaičio Street 58, 44248 Kaunas, Lithuania
3
Department of Crops and Yield Quality, Institute of Soil Science and Plant Cultivation—State Research Institute, 24-100 Pulawy, Poland
4
Department of Agroecology and Economics, Institute of Soil Science and Plant Cultivation—State Research Institute, 24-100 Pulawy, Poland
*
Authors to whom correspondence should be addressed.
Agriculture 2026, 16(9), 990; https://doi.org/10.3390/agriculture16090990
Submission received: 13 March 2026 / Revised: 3 April 2026 / Accepted: 28 April 2026 / Published: 30 April 2026
(This article belongs to the Section Crop Production)

Abstract

Agronomic practices can modify cereal grain chemical composition and processing performance. Long-term evidence linking agricultural management with functionality-related quality remains limited, especially in terms of combined tillage x crop residue management strategy. We evaluated the effects of long-term tillage simplifications and straw management on productivity and processing-relevant traits of winter wheat and spring barley in a split-plot field experiment (Lithuania). Straw was either removed (S0) or chopped and retained (S1), and six tillage systems were compared (conventional ploughing (CP), shallow ploughing (SP), shallow cultivation (SOW), stubble over winter, no-till with cover crops (NTC), and no-till without cover crops (NT)). The yield and starch content of winter wheat and spring barley groats increased with the addition of straw and the application of SOW, NTC, and NT systems. The hectolitre mass of winter wheat and spring barley grains increased with the addition and removal of straw using SP technology. The protein content and wet gluten content of winter wheat and spring barley grains decreased, while the starch content increased, with the addition and removal of straw using SC technology. In wheat, protein content showed weak separation among treatments, while wet gluten and Zeleny sedimentation displayed mostly directional trends (wet gluten–sedimentation correlation: r = 0.844 under S0 and r = 0.984 under S1). In terms of the tillage systems, it can be stated that in most cases, SP and NT increased grain yield and improved quality indicators, while SC and NTC technologies showed opposite results. Soil-function assessment (CEI, 10–25 cm) indicated substantially higher integrated soil functioning under conservation agriculture (e.g., SOW/NTC/NT: 5.28–5.70) than under conventional systems (CP: 3.23). The results support framing sustainable soil management for cereal functionality as a system package: residue retention enables the productivity benefits of reduced-tillage systems while maintaining key quality proxies.

1. Introduction

Agriculture is the main provider of food worldwide. Cereals are the main crops that provide staple foods worldwide. They are also used as a key raw material for food processing (e.g., flour, groats, breakfast cereals). Their suitability for processing is determined by technological and compositional parameters that affect both final product quality and process efficiency [1,2,3].
The value of wheat and barley is defined by a suite of grain and flour quality traits that dictate their industrial and culinary utility. At the core of this assessment is protein functionality, gluten-related indices and sedimentation values. These, alongside carbohydrate profiles (specifically starch content) and physical grain parameters, form the baseline for quality [4,5,6,7]. While a grain’s potential is fundamentally rooted in its genotype, its final expression is modified by environmental factors. These can include soil properties and fluctuating weather patterns, but also strategic agronomic management, which actively modifies the crop’s habitat. This enables farmers to modify crop quality to meet the needs of consumers and industry [8,9,10,11,12].
The falling number is commonly used as an indicator of sprouting-related amylolytic activity and is one of the standard wheat quality parameters considered in baking chains [13]. Gluten quantity and functionality are influenced by genotype and by environmental conditions during grain development, and heat or water stress can shift the balance between gliadin and glutenin fractions, with consequences for processing performance [14,15].
The adoption of conservation (regenerative) agriculture—characterized by reduced tillage, residue retention, and cover cropping—is increasingly vital for environmental sustainability [16,17]. However, for the milling and baking industries, it is essential that these practices do not compromise key technological parameters such as protein, gluten, sedimentation, or grain hardness [18,19,20,21]. Furthermore, environmentally friendly production is now a significant “added value” for modern consumers [22].
Current studies indicate that the impact of reduced tillage on grain quality is ambiguous, as it is heavily influenced by nitrogen fertilization, location, and weather conditions. A critical research gap remains: there is a lack of long-term data linking entire cropping systems (tillage × residues × rotations) with comprehensive processing quality. Consequently, expanded long-term research is needed to systematically evaluate not only soil and yield indicators but also the specific technological and rheological characteristics required by the industry [23].
Climate variability in Northern Europe increases the year-to-year inconsistency of cereal raw materials, as grain composition and enzyme-related traits respond strongly to weather during grain filling [24]. From a food processing perspective, such variability challenges the standardization of protein functionality and carbohydrate fractions in harvested grain [25]. Sustainable soil management that improves soil organic matter and water retention may buffer crops against stress, potentially stabilizing the protein–gluten–starch balance relevant to cereal functionality [26,27,28].
Beyond basic protein levels, the concentration of bioactive substances—such as phenolic compounds, minerals, and specific amino acids—is increasingly recognized as a key differentiator in the development of functional cereal products. Consumers and food processors are increasingly seeking “soil-to-fork” transparency, where sustainable soil management is directly linked to the nutritional density and safety of the raw food material. Scientists claim that simplified tillage systems reduce the time, energy, labour, and money required to cultivate land [29,30]. Deep tillage has been associated with high energy consumption, which affects not only economic performance but also the ecological footprint. Reduced tillage, which reduces the intensity of resource use and helps in using resources more efficiently, is an attractive alternative for many farmers [26]. It also ensures better crop yields, prevents soil erosion, and reduces soil and nutrient losses.
To increase crop yields and reduce soil erosion, minimum tillage or no-till, covering the soil surface with plant residues, has recently been increasingly used [31]. Fuentes et al. [32] claim that no-till increases winter wheat yields. Shao et al. [31] also found that yields increased in fields where simplified tillage and no-till into unploughed soil and covering the soil surface with plant residues were used, compared to deep ploughing. Soil properties, crop rotation, and environmental factors also influence crop yields and quality indicators. Other scientists claim that no-till into unploughed soil results in winter wheat yields like those obtained in deep-ploughed fields [33]. Cesevičienė et al. [34] state that the yield of spring barley in no-till fields decreased by 8.5% compared to traditional tillage. Känkänen et al. [35] found that no-till reduces crop yields compared to conventional tillage. Both no-till and minimum-tillage methods affect soil properties, so it is necessary to accurately determine which tillage technologies work best under local agronomic conditions [36].
In the context of sustainable food systems, long-term conservation agriculture acts as a strategy for farming system resilience. By improving soil organic matter and water retention, these technologies may buffer the plant against heat stress during the grain-filling stage, thereby stabilizing the bioactive composition and ensuring a more predictable raw material for the milling and brewing industries. Deep tillage has been associated with high energy consumption, which affects not only economic performance but also the ecological footprint. Reduced tillage, which reduces the intensity of resource use and helps in using resources more efficiently, is an attractive alternative for many farmers [26,27]. Post-harvest incorporation of crop residues is a widespread practice that helps improve the soil ecosystem and physicochemical properties [28]. The scientific literature presents contradictory results regarding yields when applying minimal soil cultivation. Long-term (8-year) scientific studies conducted in the United Kingdom show that direct seeding into no-till soil reduced spring barley yields by 15% compared to deep ploughing technology, and there were also poorer quality indicators [37].
The aim of this study was to quantify the long-term impact of tillage intensity, straw management, and their interaction on the yield and processing quality of winter wheat and spring barley. The analysis specifically focuses on the protein–gluten–starch balance, prioritizing key industry proxies: wet gluten and Zeleny sedimentation for wheat, and hectolitre mass and starch content for barley. We hypothesized that long-term reduced tillage, when combined with straw retention, would not compromise key processing-related quality traits compared to conventional ploughing, and that the overall system performance (yield and quality) would be best explained by the integrated tillage × straw management package.

2. Materials and Methods

2.1. Study Sites

A stationary experiment was set up in 1999 at the Experimental Station of Vytautas Magnus University Agriculture Academy (then Lithuanian University of Agriculture, Kaunas) (54°52′50″ N and 23°49′41″ E). The research was conducted in 2020–2021. According to the international classification [38], the soil under experimentation was Epieutric Endocalcaric Endogleyic Planosol (Endoclayic, Aric, Drainic, Humic, Episiltic) [27].
Experimental treatment. The experiment was carried out as a two-factor split-plot design, with 4 replicates (48 plots in total). The single-plot size was approximately 102 m2 (6 × 17 m). The crops in the experiment were cultivated as arable crops in rotation. The rotation consisted of: spring oilseed rape, winter wheat, and barley. The first factor (Factor A) was straw management: in S0, the straw was removed from the field after harvest, and in S1, the straw was chopped and left on the surface of a field after harvest. The second factor (B) was tillage strategy: (1) deep ploughing (control 23–25 cm) (conventional agriculture) (CP); (2) shallow ploughing system in autumn (10–12 cm) (SP); (3) shallow tillage in autumn (cultivation) with disc cultivator (8–10 cm) (SC); (4) stubble over winter–straw incorporated in spring by disc harrow (4–5 cm) (SOW); (5) no-till (4–5 cm) (no-till with cover crops) (NTC); (6) direct sowing (no-till without cover crops) (NT).
After harvesting the pre-crop (except for spring oilseed rape), straw was removed in one part of the experiment (S0) or chopped and spread in the other part (S1). All tested tillage systems were tested in both S0 and S1.
In tillage variants 1, 2, and 3 (CP, SP, and SC), stubble was ploughed with a disc harrow to a depth of 4–5 cm immediately after harvesting, and in the autumn, the fields were tilled according to the experimental scheme. After harvesting the crops, an oil radish for green manure was sown in the NTC fields on uncultivated soil. The SOW and NTC variant fields were tilled only with a disc harrow to a depth of 4–5 cm before sowing the main crops. In the NT variant fields, the soil was not tilled in autumn nor spring, and sowing was done directly into the stubble.

2.2. Meteorological Conditions

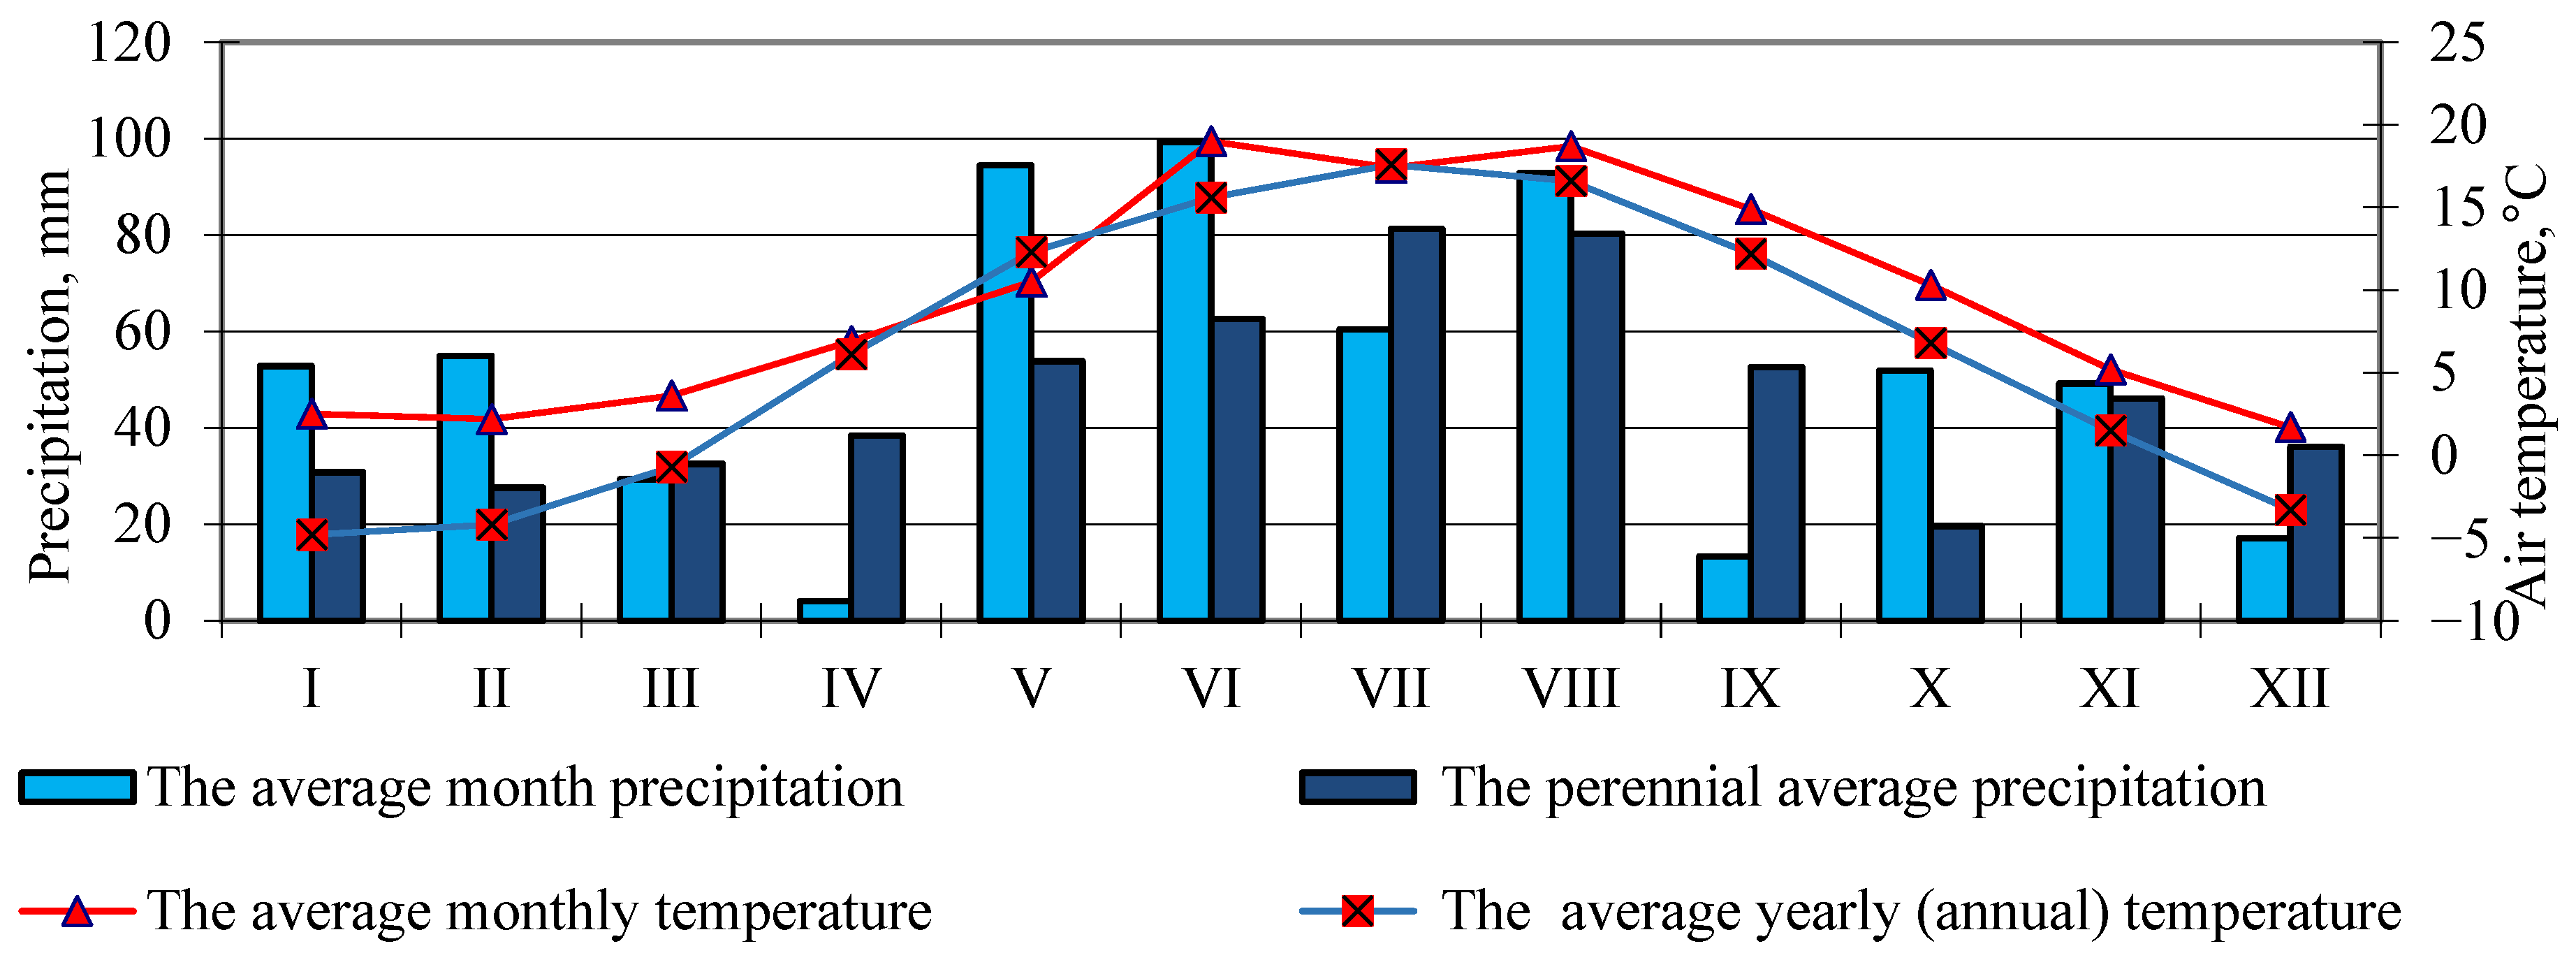
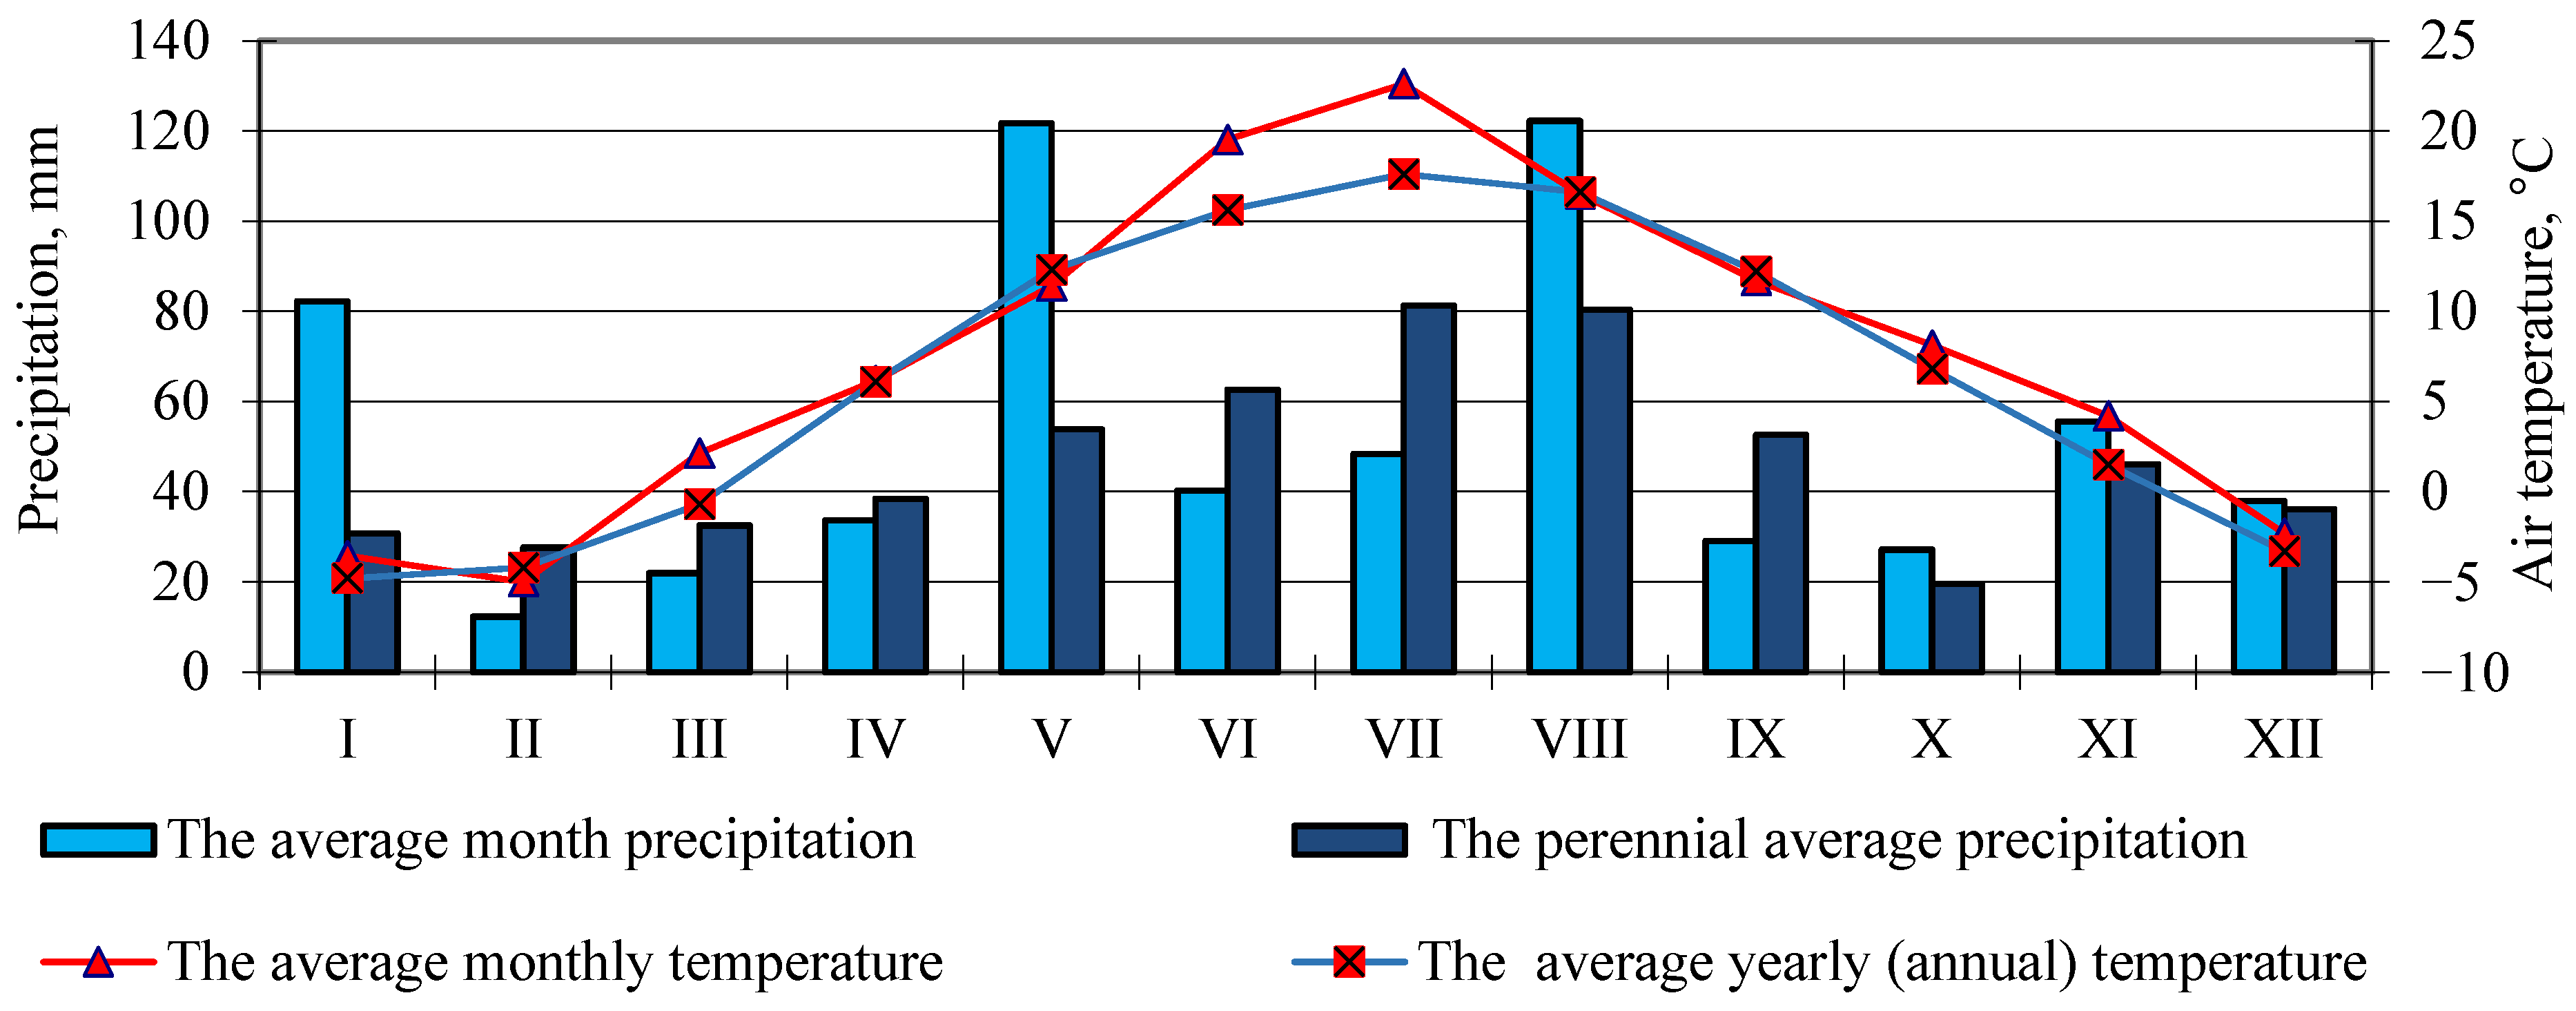
Across the two experimental years, meteorological conditions deviated from the long-term norm in both the thermal and precipitation regimes, but the direction and timing of these anomalies differed between seasons. In 2020, the season was characterized by an anomalously mild and relatively wet winter, followed by an exceptionally dry early spring at the onset of active growth (very low April rainfall), then a warm and precipitation-rich early summer, and finally a shift toward late-season moisture limitation (below-average July rainfall and a pronounced dry period in mid-August). In 2021, early-season conditions were closer to the long-term baseline in April, but rainfall distribution was highly uneven: May was markedly wet (substantial precipitation surplus), whereas the mid-season combined elevated temperatures (notably warm June) with reduced precipitation, implying increased evaporative demand and episodic drought risk during key stages of canopy development and grain formation. Overall, both years exhibited strong intra-seasonal variability in hydrothermal conditions, with periods of favourable moisture supply alternating with phases of precipitation deficit and high temperatures, underscoring the relevance of soil management practices that buffer water availability and stabilize crop performance under variable weather (Figure 1 and Figure 2).

2.3. Productivity and Grain Quality Indicators

Grain yield was determined by combine-harvesting each plot, weighing grain mass, and converting yield to standard moisture (14%) and standard cleanliness (100%). Grain quality indicators were determined in the laboratory of the Bridžiai elevator in Šakiai district. Methods for determining quality indicators: The method for determining protein content is given in standard LST EN ISO 12099 (Lithuanian Standardization Department, Lithuania, Vilnius, 2025 (http://www.lsd.lt)) “Determination of protein content of whole barley by near-infrared spectroscopy”, “INFRATEC 1241” from FOSS Lithuanian Standardization Department, Lithuania, Vilnius, 2025 (http://www.lsd.lt). Gluten content was determined according to the standard LST EN ISO 21415-2:2016 “Wheat and wheat flour. Gluten content. Part 1. Determination of wet gluten by manual methods” (Lithuanian Standardization Department, Lithuania, Vilnius, 2025) in winter wheat grains. Sedimentation (mL) was determined by the Zeleny method (LST ISO 5529:2007) (Lithuanian Standardization Department, Lithuania, Vilnius, 2025) in absolutely dry matter. Sedimentation values were determined using “IN FRATEC 1241” from FOSS, in standard LST EN ISO 7971-3 (Lithuanian Standardization Department, Lithuania, Vilnius, 2025), in winter wheat grains. Hectolitre mass (kg hL−1) was determined using the infrared spectroscopy method, “INFRATEC 1241” from FOSS, in standard LST EN ISO 7971-3 (Lithuanian Standardization Department, Lithuania, Vilnius, 2025). Starch content (%) was determined by the Ewers polarimetric method, using the “INFRATEC 1241” device from FOSS, in standard LST 1797:2024 (Lithuanian Standardization Department, Lithuania, Vilnius, 2025). Grain moisture content (%) was determined using the infrared spectroscopy method, “INFRATEC 1241” from FOSS, in standard LST EN ISO 712 (Lithuanian Standardization Department, Lithuania, Vilnius, 2025).
The complex evaluation index (CEI) is a synthetic, multi-indicator metric used to summarize overall soil functioning under different management systems by combining several soil properties into a single score. Individual soil indicators were first converted to evaluation points (EP) on a common 1–9 scale (1 = lowest; 9 = highest) using min–max normalization:
E P i = X i X m i n X m a x X m i n 8 + 1
where Xi is the observed value for a treatment, and Xmin and Xmax are the minimum and maximum values of that indicator across the evaluated dataset. A threshold of EP = 5 was used to distinguish low vs high scores, and EP profiles were visualized using radar plots (a larger polygon area indicates a stronger integrated effect). CEI was then computed from: (i) the mean EP across all indicators, (ii) the standard deviation of EP values, and (iii) the standard deviation of the mean EP calculated only from indicators below the threshold (EP < 5). The CEI integrated six indicators: total N, organic C, organic C stock, aggregate stability, urease activity, and saccharase activity. Certain soil properties (chemical, physical and biological) were chosen because they have a very high impact on grain yield and quality indicators. A broader methodology (agrochemical, physical and biological properties of soils) is presented in the dissertation of A. Sinkevičius [27].

2.4. Statistical Analysis

The study data were evaluated by two-factor analysis of variance (ANOVA) with the F-test using the SPSS software package, 2010 [39,40]. The significance of differences between all variants was assessed by the LSD test at 95.00, 99.00, and 99.99% probability levels. The relationships between the traits were assessed by the correlation analysis method by calculating the correlation coefficient r and assessing its reliability at 95.00 and 99.00% probability levels, and by calculating regression equations using the STAT software from the SELEKCIJA software package [41].
Asterisks indicate significant differences between the means of the variants compared to deep ploughing.
*, when p ≤ 0.05 > 0.01 (differences are significant at a 95% probability level);
**, when p ≤ 0.01 > 0.001 (differences are significant at a 99% probability level);
***, when p ≤ 0.001 (differences are significant at a 99.99% probability level).
p > 0.05—There are no significant differences (differences are significant at a lower than 95% probability level).
In most cases, significant interactions between years were identified during statistical analysis of the research data; therefore, the research data for each year are presented separately.
Normality and homoscedasticity of residuals were checked (e.g., Shapiro–Wilk and Levene tests), and data met ANOVA assumptions.
Vertical bars indicate standard deviation.

3. Results

Because the direction of responses differed between straw backgrounds, post hoc comparisons are reported within S0 and S1, using CP as the control treatment.

3.1. Effects of Straw Management (A), Tillage System (B) and Their Interaction on Winter Wheat and Barley Yield Potential

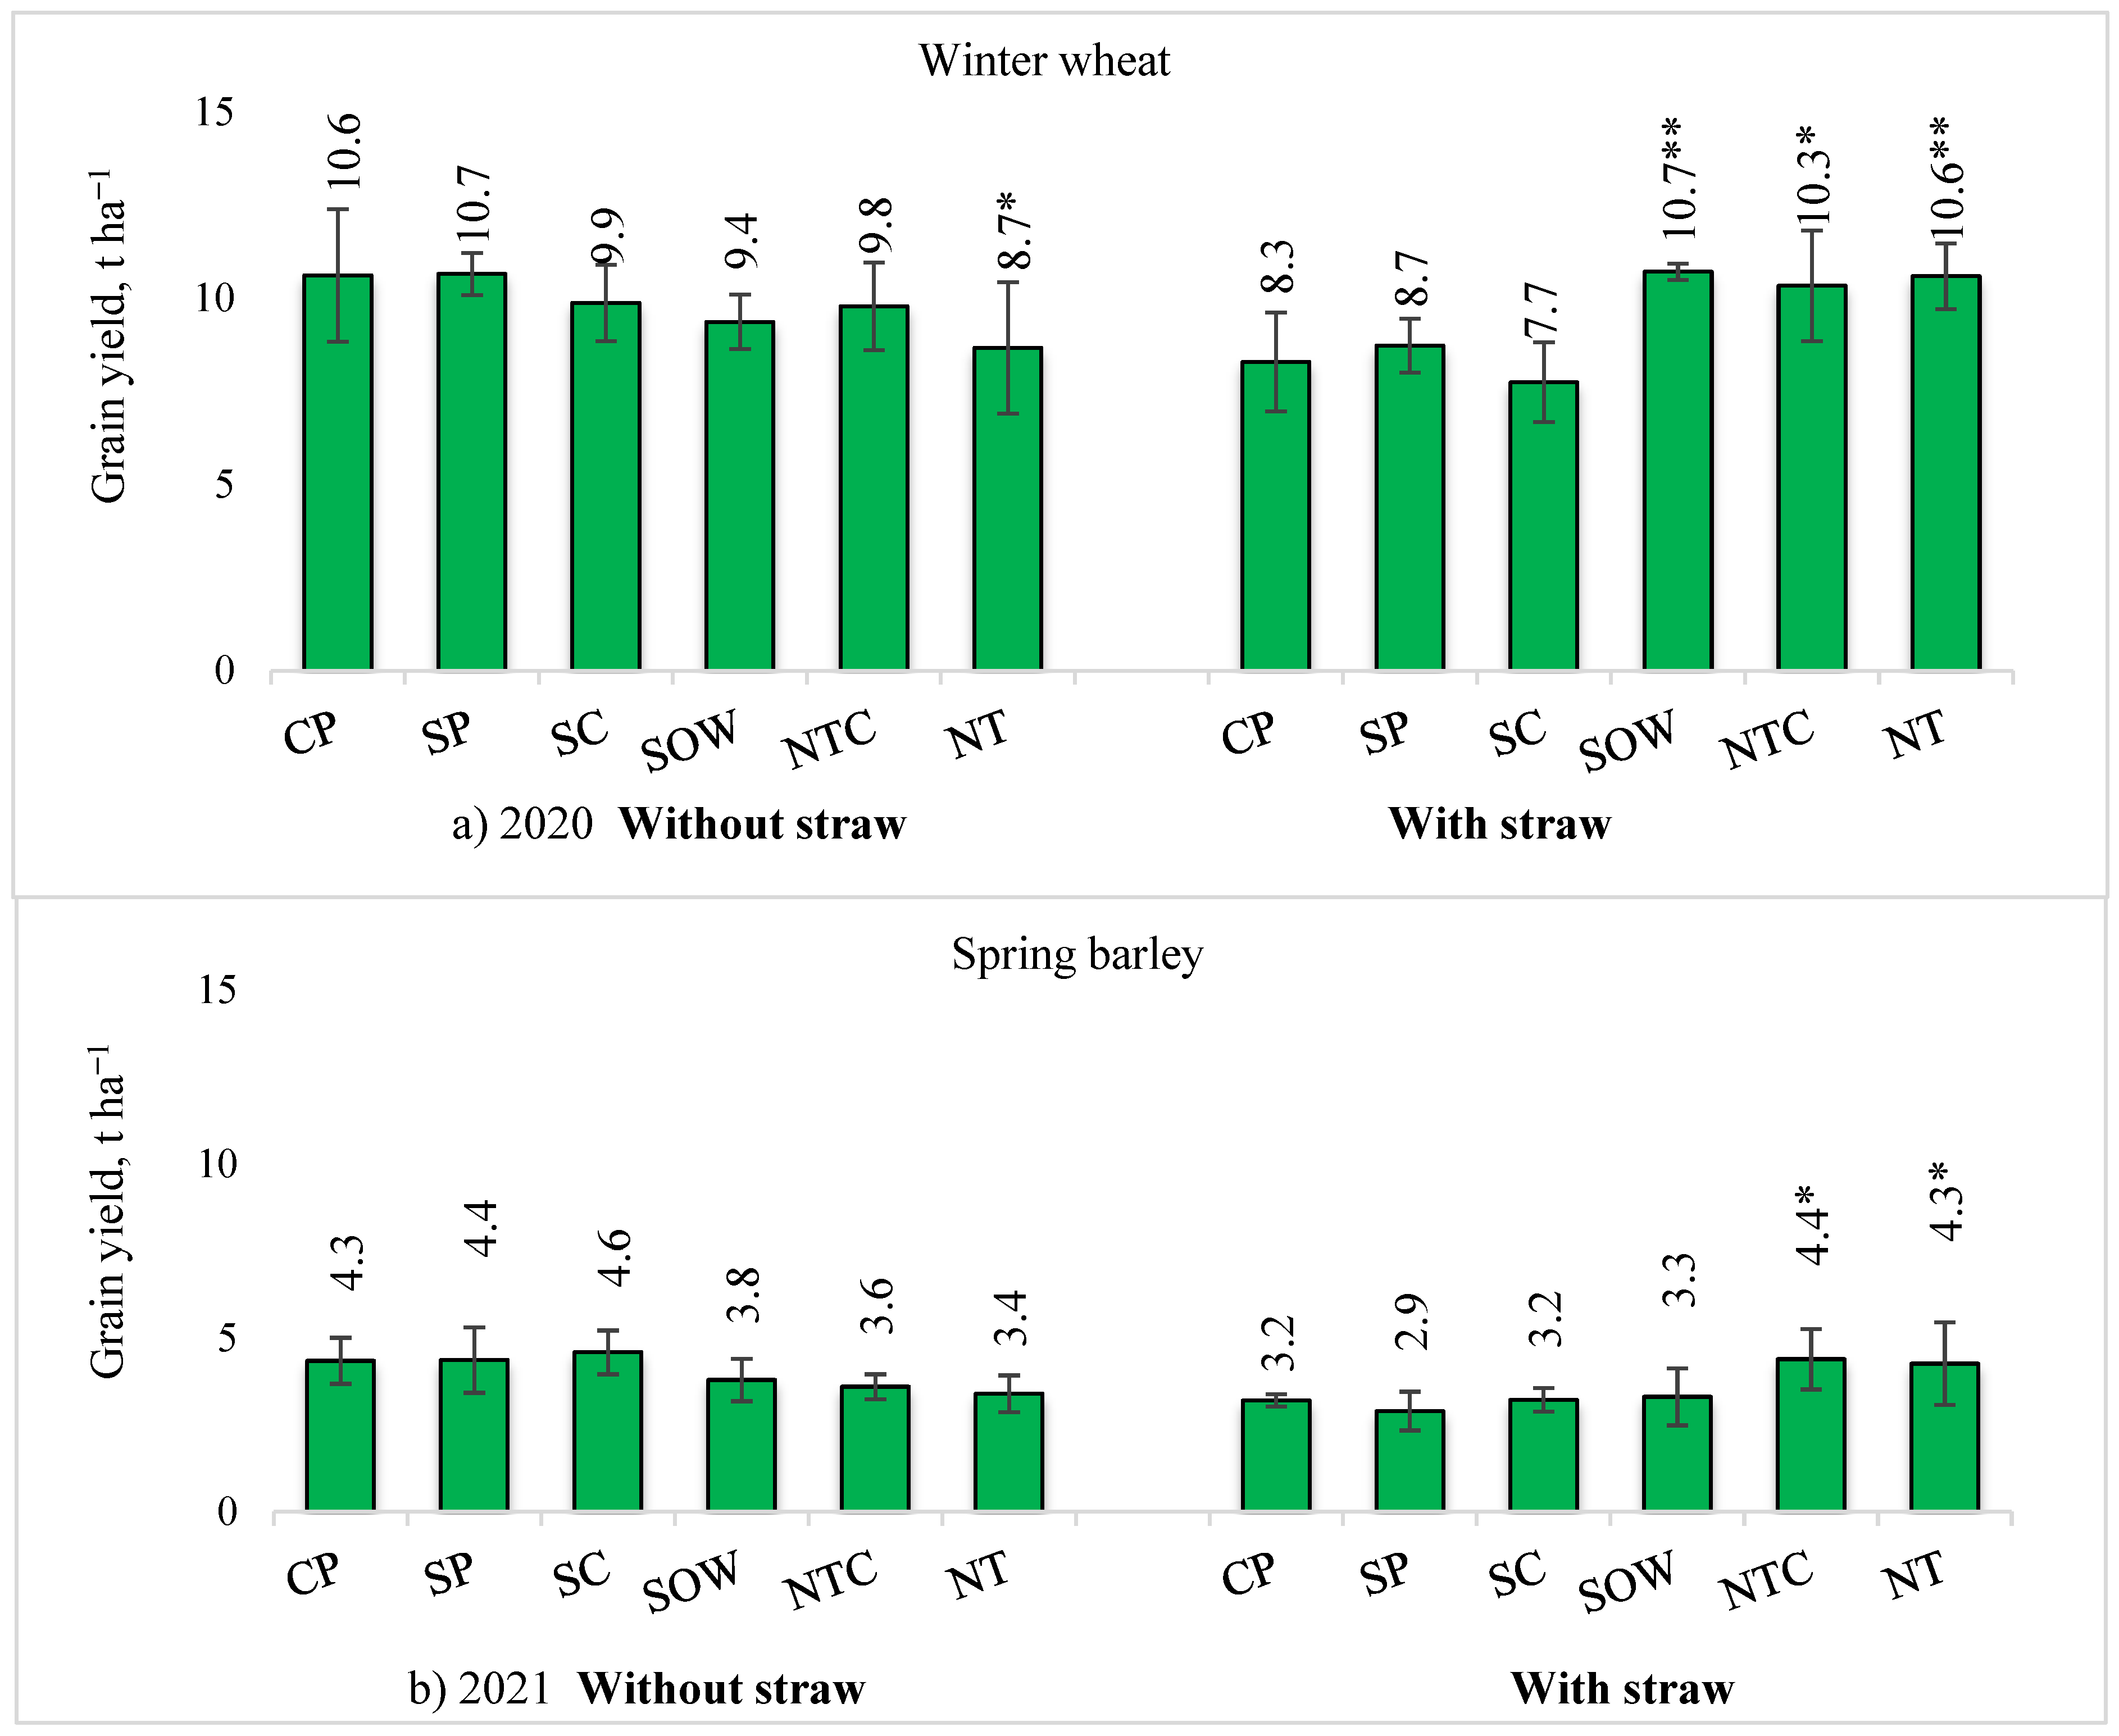
Winter wheat and barley grain yield. Grain yield showed a pronounced A×B interaction, indicating that the performance of conservation-oriented technologies depended strongly on straw management (Figure 3). Under straw retention (S1), no-till into uncultivated soil increased yields of both tested cereals (winter wheat and spring barley). Reported yield increase was in the range of ~24.1–37.5% for no-till treatments (with and without cover crops), and winter wheat yield was also increased under stubble left over winter (SOW). In contrast, under straw removal (S0), the same no-till treatments tended to reduce grain yield of both crops, indicating that residue removal weakened the productivity potential of reduced-disturbance systems at this site.
In no-till (NT) fields from which straw was removed (S0), the yield of winter wheat grain decreased significantly (1.2 times), but in fields in which straw was chopped and spread, it increased significantly (1.3 times) compared to deep ploughing (CP). Applying the technology of no-till with cover crops (NTC) and leaving stubble over winter in fields with straw (S1) significantly increased the yield of winter wheat grains (from 1.2 to 1.3 times) (Figure 3). After crushing and spreading straw (S1) and applying no-till with cover crops (NTC) and without cover crops (NT), the grain yield of spring barley in the fields increased significantly (1.3 times).

3.2. Winter Wheat: Processing-Related Quality Traits (Protein Functionality and Carbohydrate Fraction)

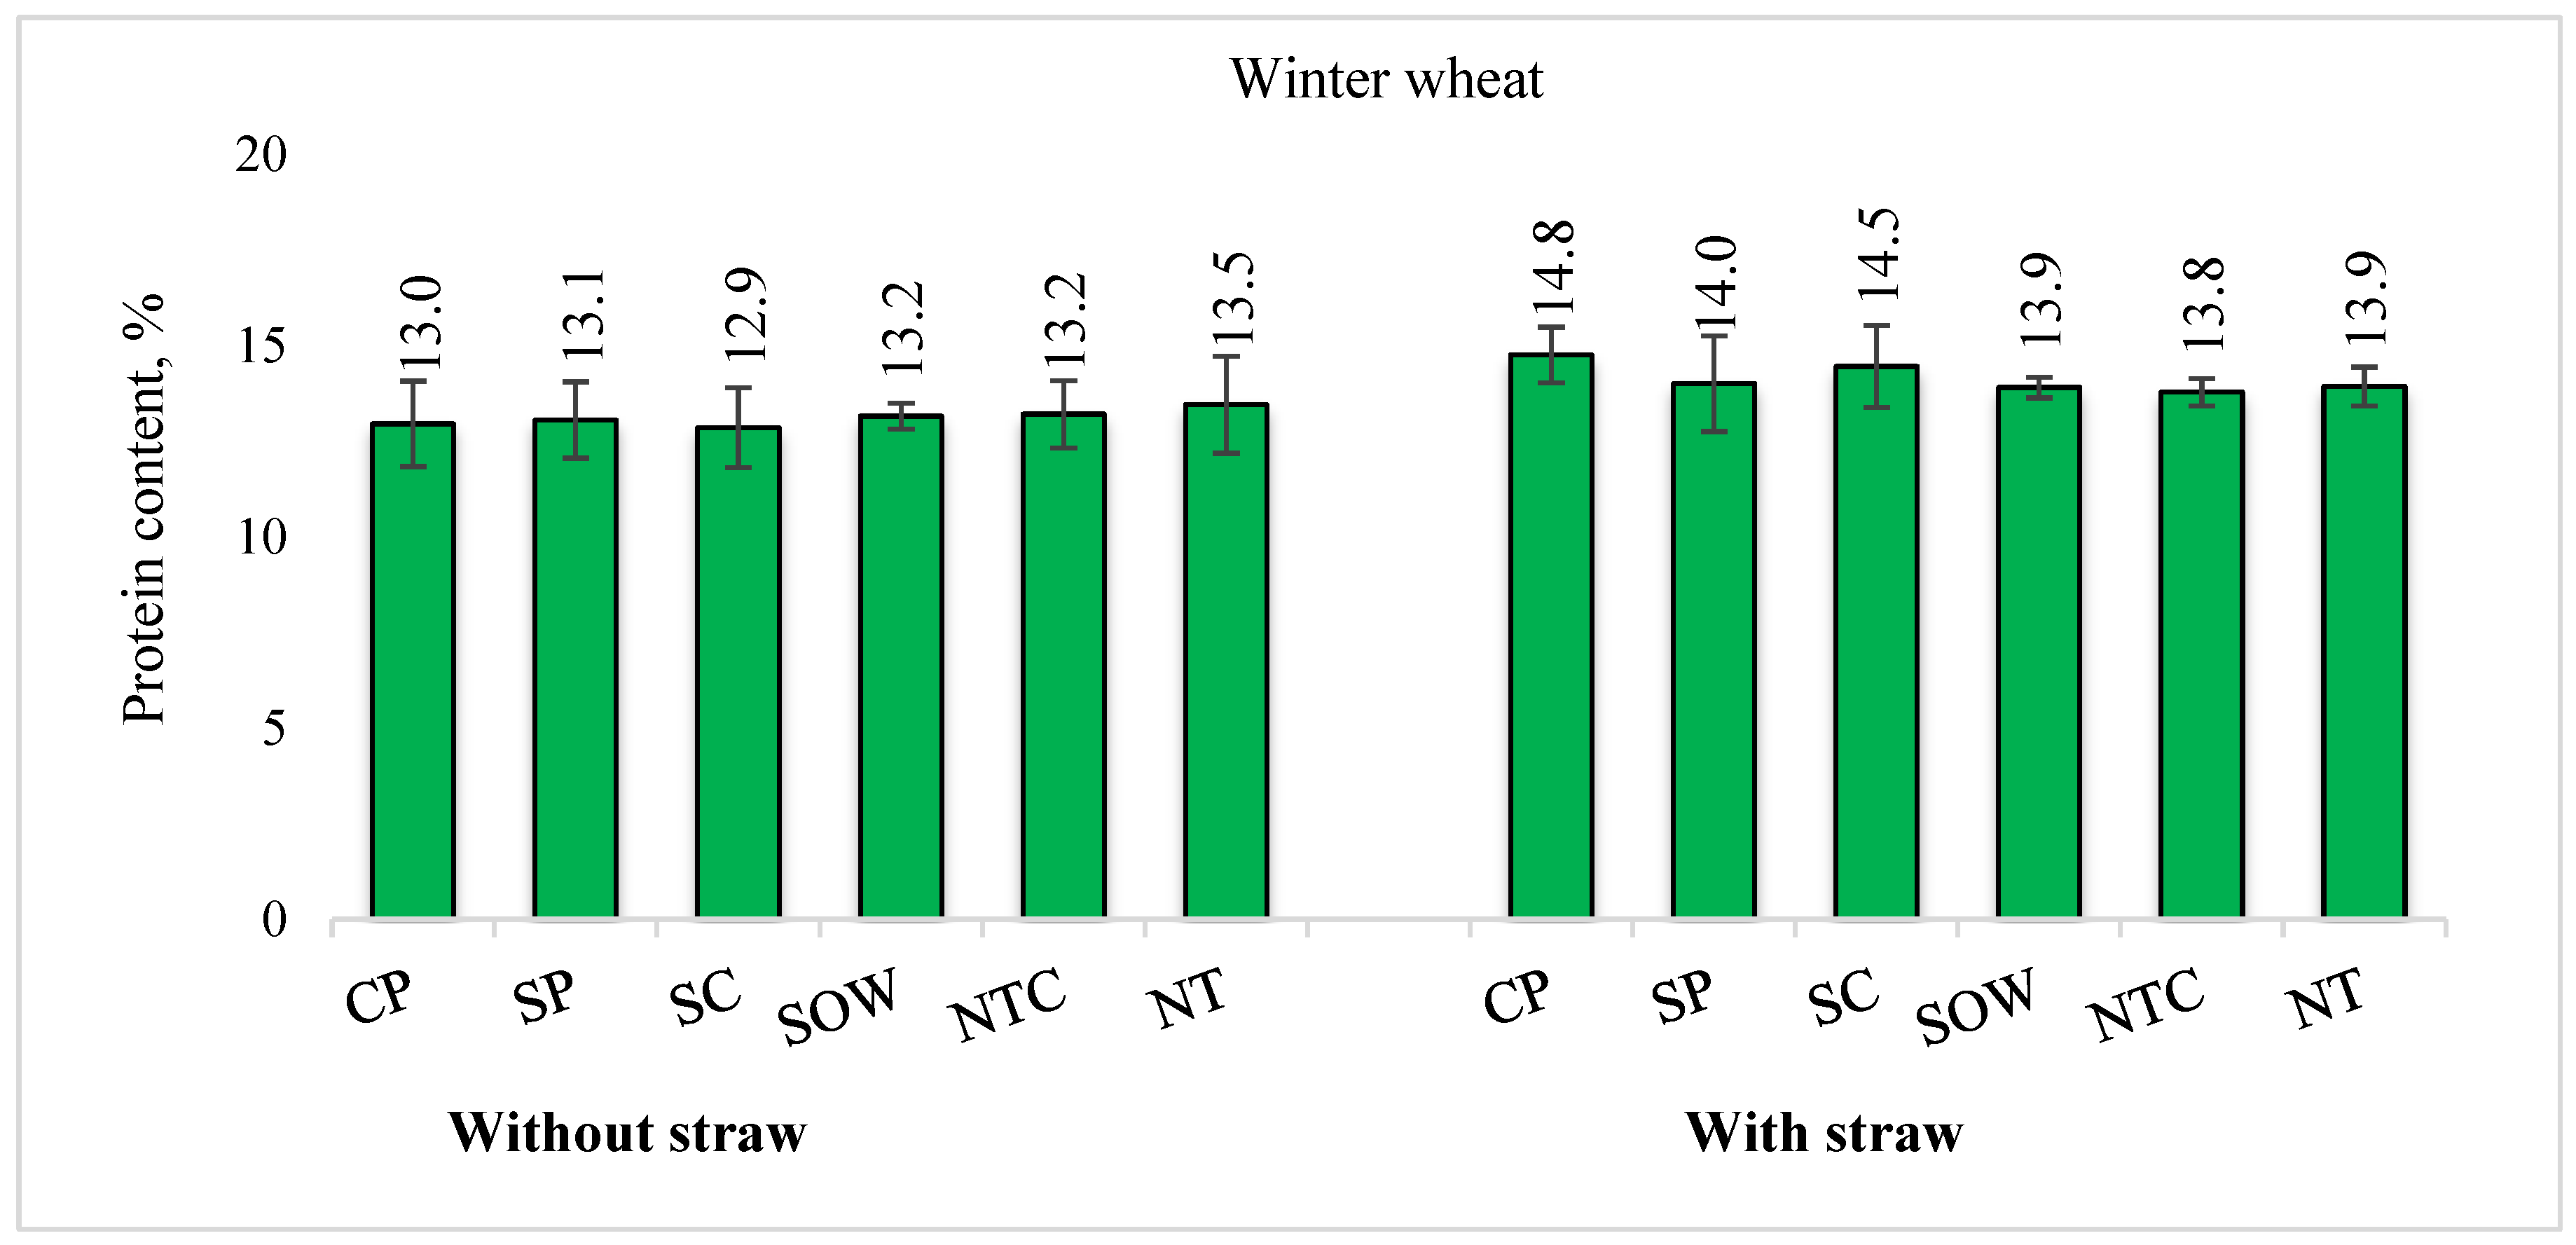
Winter wheat protein content. Winter wheat grain protein displayed relatively small changes across technologies (Figure 4). Under S0 (straw removed from field), simplified systems increased wheat protein by +0.1 to +0.5 percentage points relative to CP (control treatment), whereas under S1, wheat protein was lower across technologies by 0.3 to 1.0 pp.
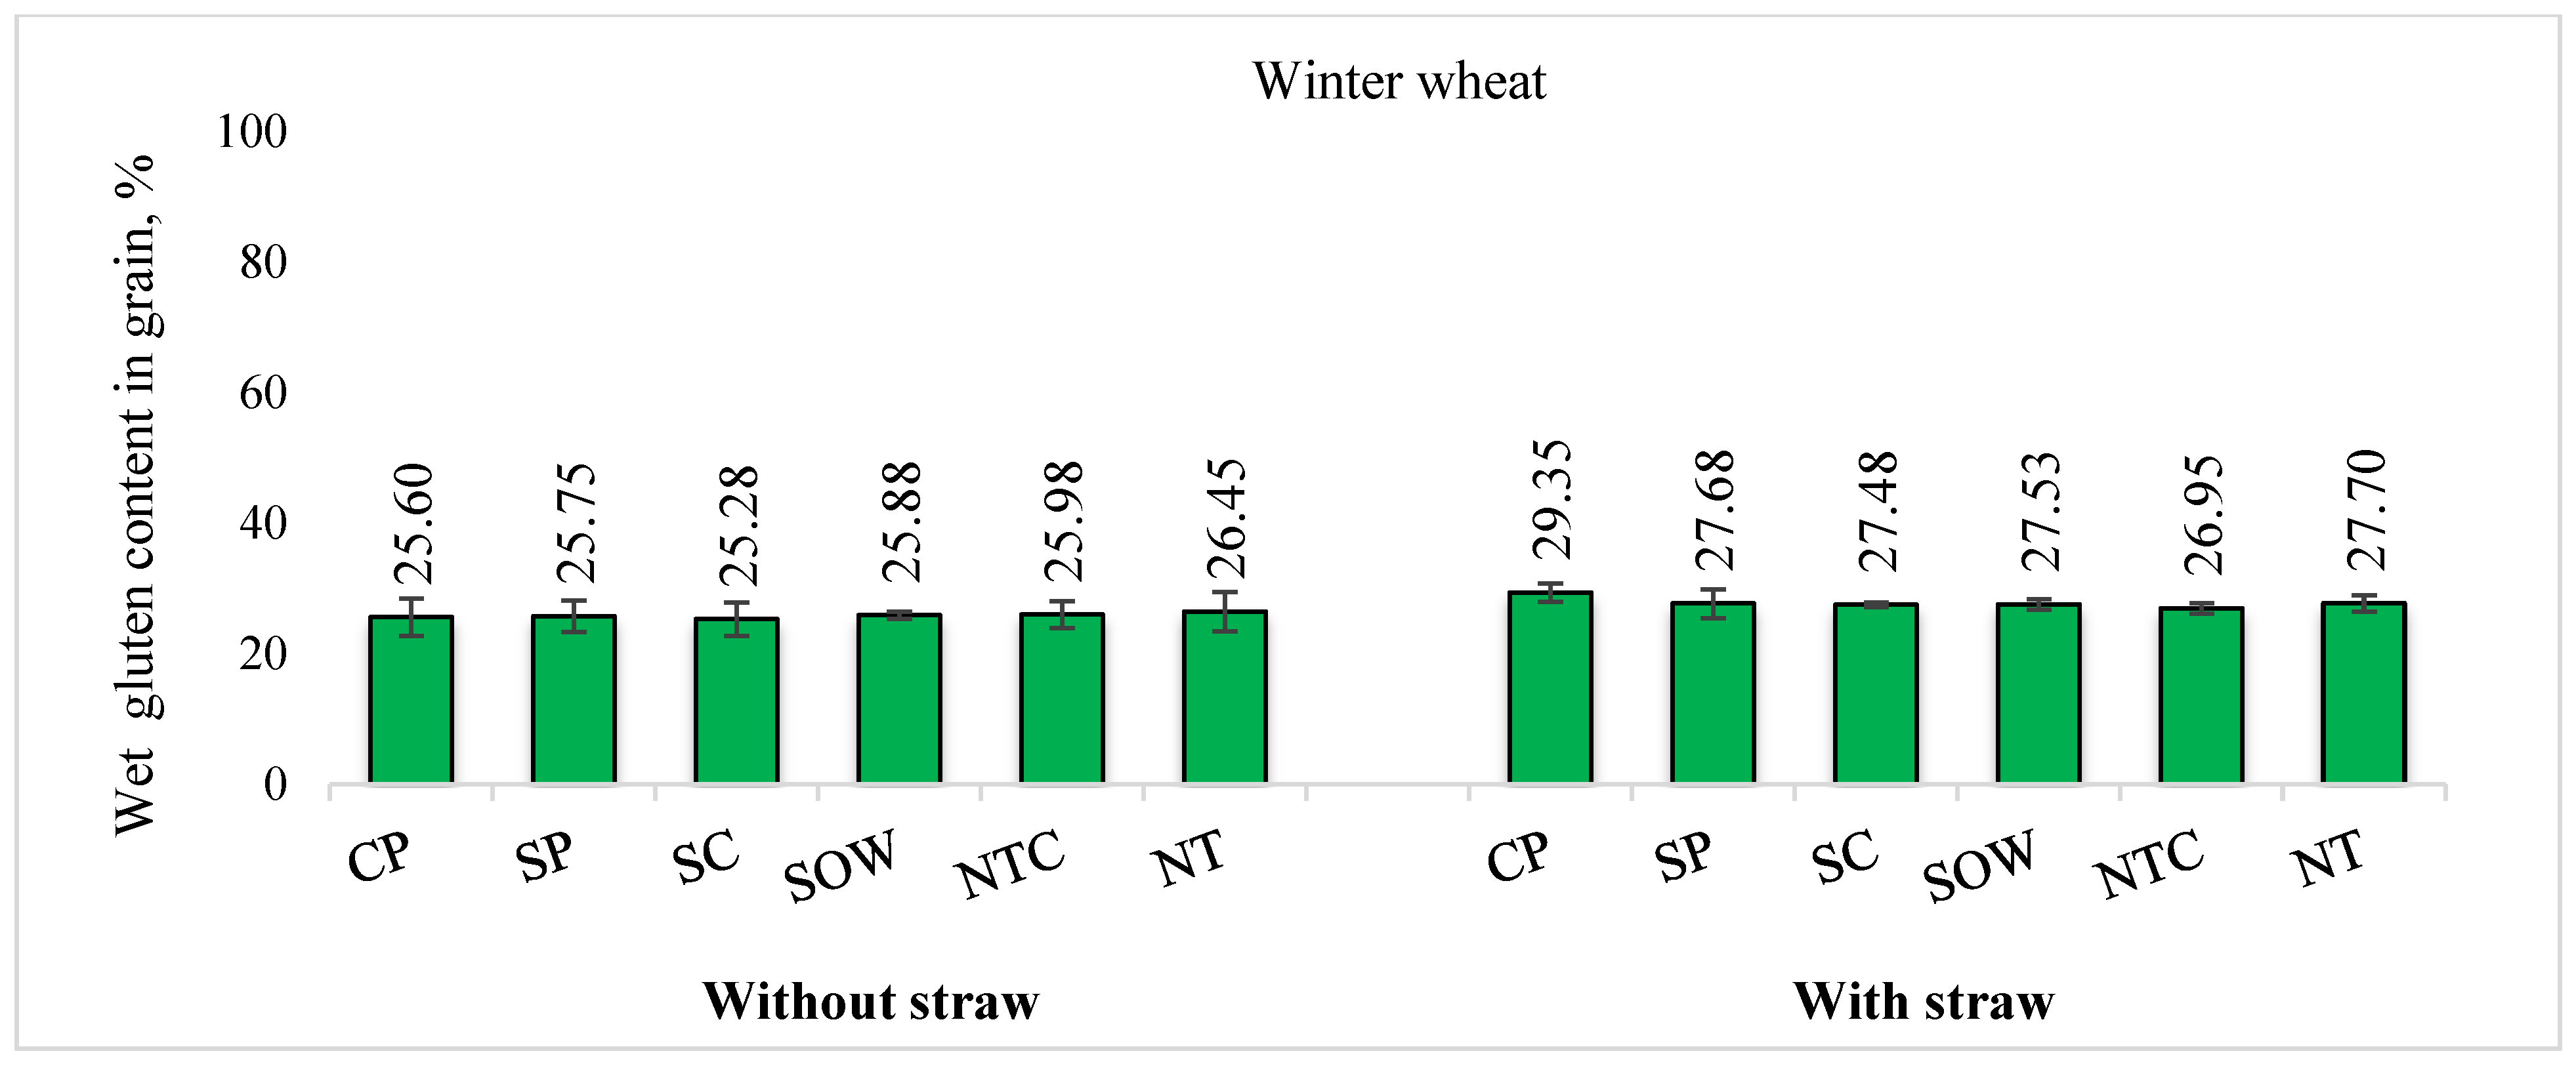
Winter wheat wet gluten content. Wet gluten showed no statistically significant differences vs CP across tillage systems within either straw background (Figure 5). Nevertheless, directional signals were observed: shallow autumn cultivation (SC) reduced wet gluten vs CP by 0.32–1.87 pp across S0 and S1, and under S1, all simplified systems tended to show lower wet gluten than CP by 1.82–2.40 pp. These outcomes should be treated as tendencies rather than treatment separation, given the absence of significant vs-control contrasts.
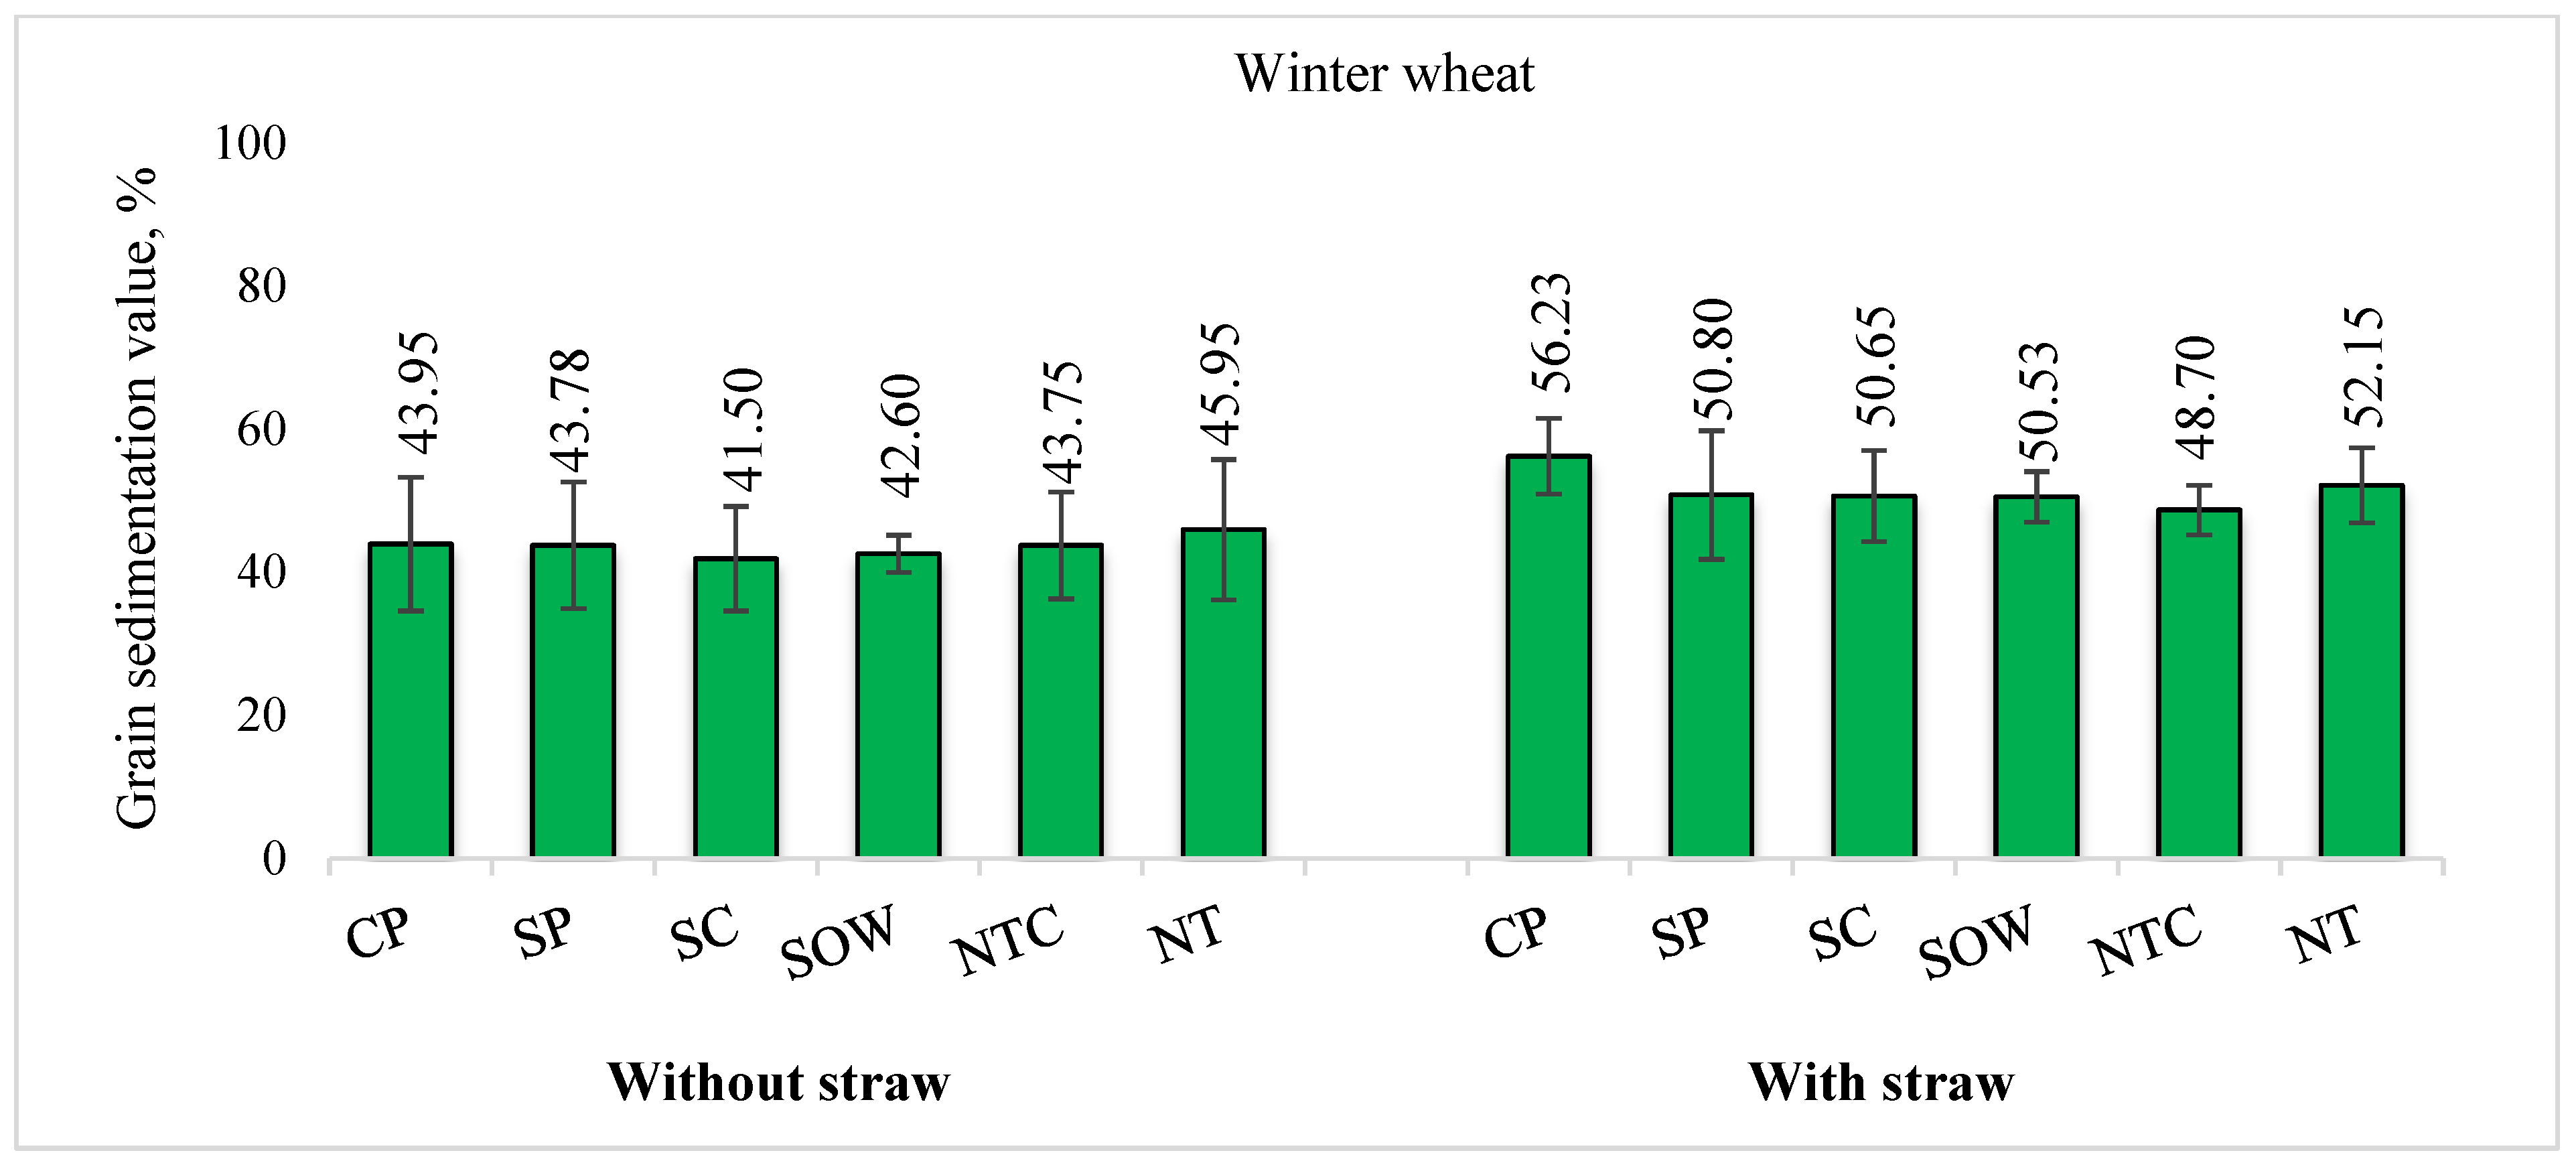
Winter wheat sedimentation value (Zeleny). Sedimentation values generally showed no statistically significant differences vs CP across technologies within straw backgrounds, although directional decreases versus CP were reported for several simplified technologies (0.17–7.53 units, depending on treatment) (Figure 6). Importantly, the functional consistency of wheat processing proxies was supported by trait relationships: Gluten correlated positively with sedimentation (S0: r = 0.8436, p < 0.05; S1: r = 0.984, p < 0.01). In S0, moisture correlated negatively with sedimentation (r = −0.877, p < 0.05), indicating that even small moisture shifts can align with functional proxy changes.
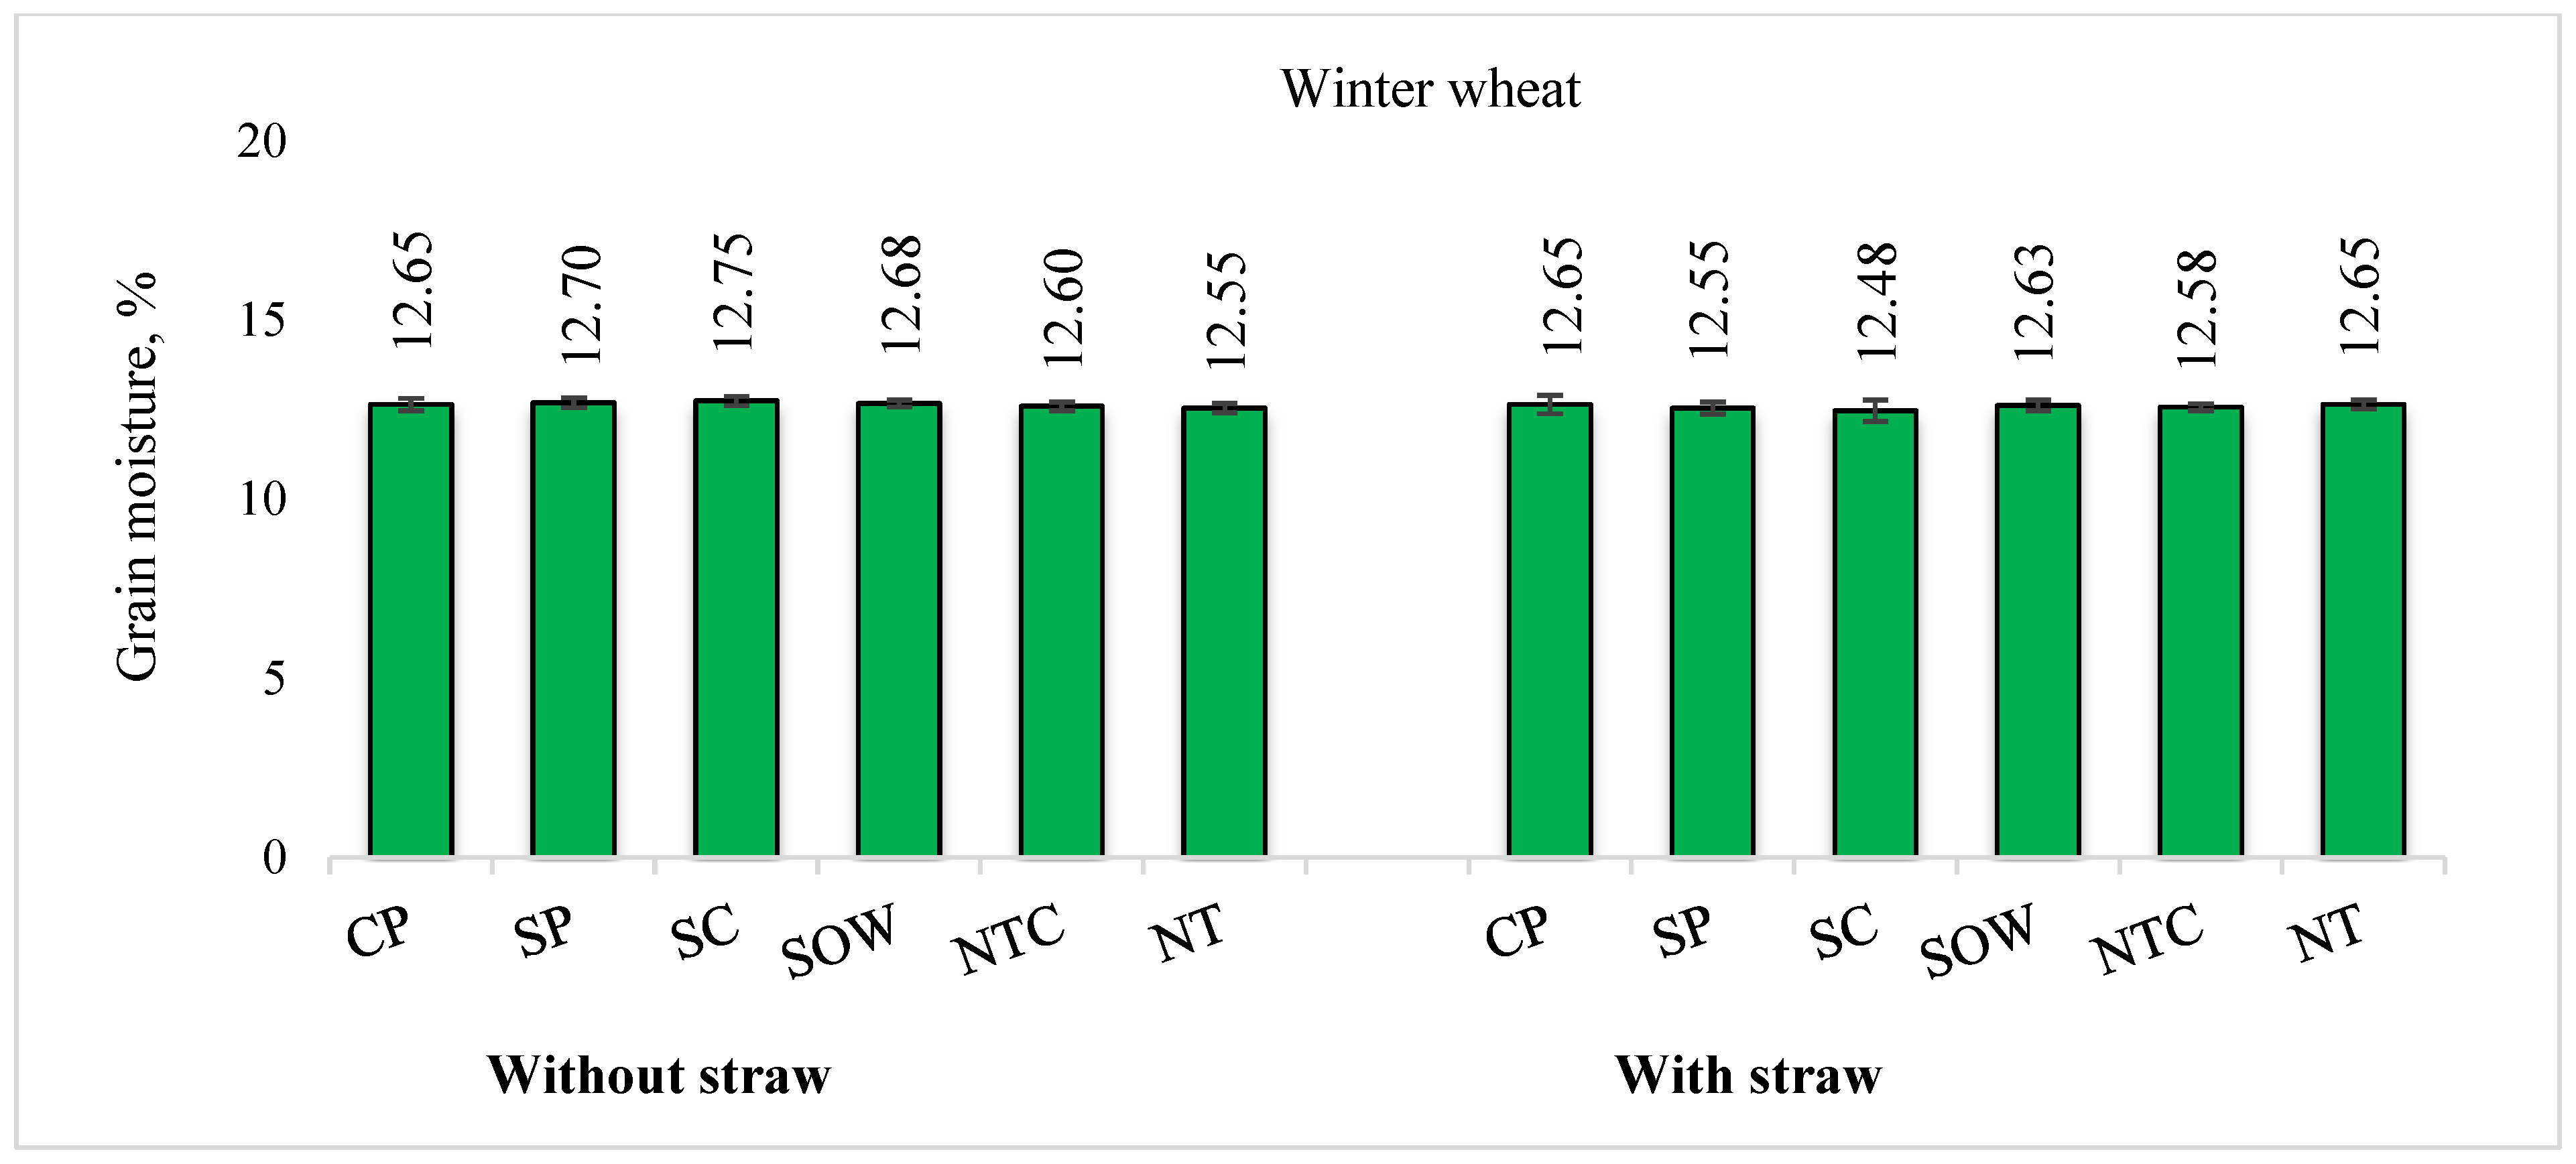
Winter wheat grain moisture. Wheat grain moisture varied within a narrow range (e.g., 12.48–12.75% in 2020) and did not provide strong separation among technologies. In the vs-control framework, reported differences were small (e.g., under NTC, moisture decreased by ~0.05–0.07 pp vs CP) (Figure 7). However, moisture showed meaningful associations with quality proxies under S0: protein vs moisture (r = −0.853, p < 0.05) and moisture vs gluten (r = −0.90, p < 0.01).
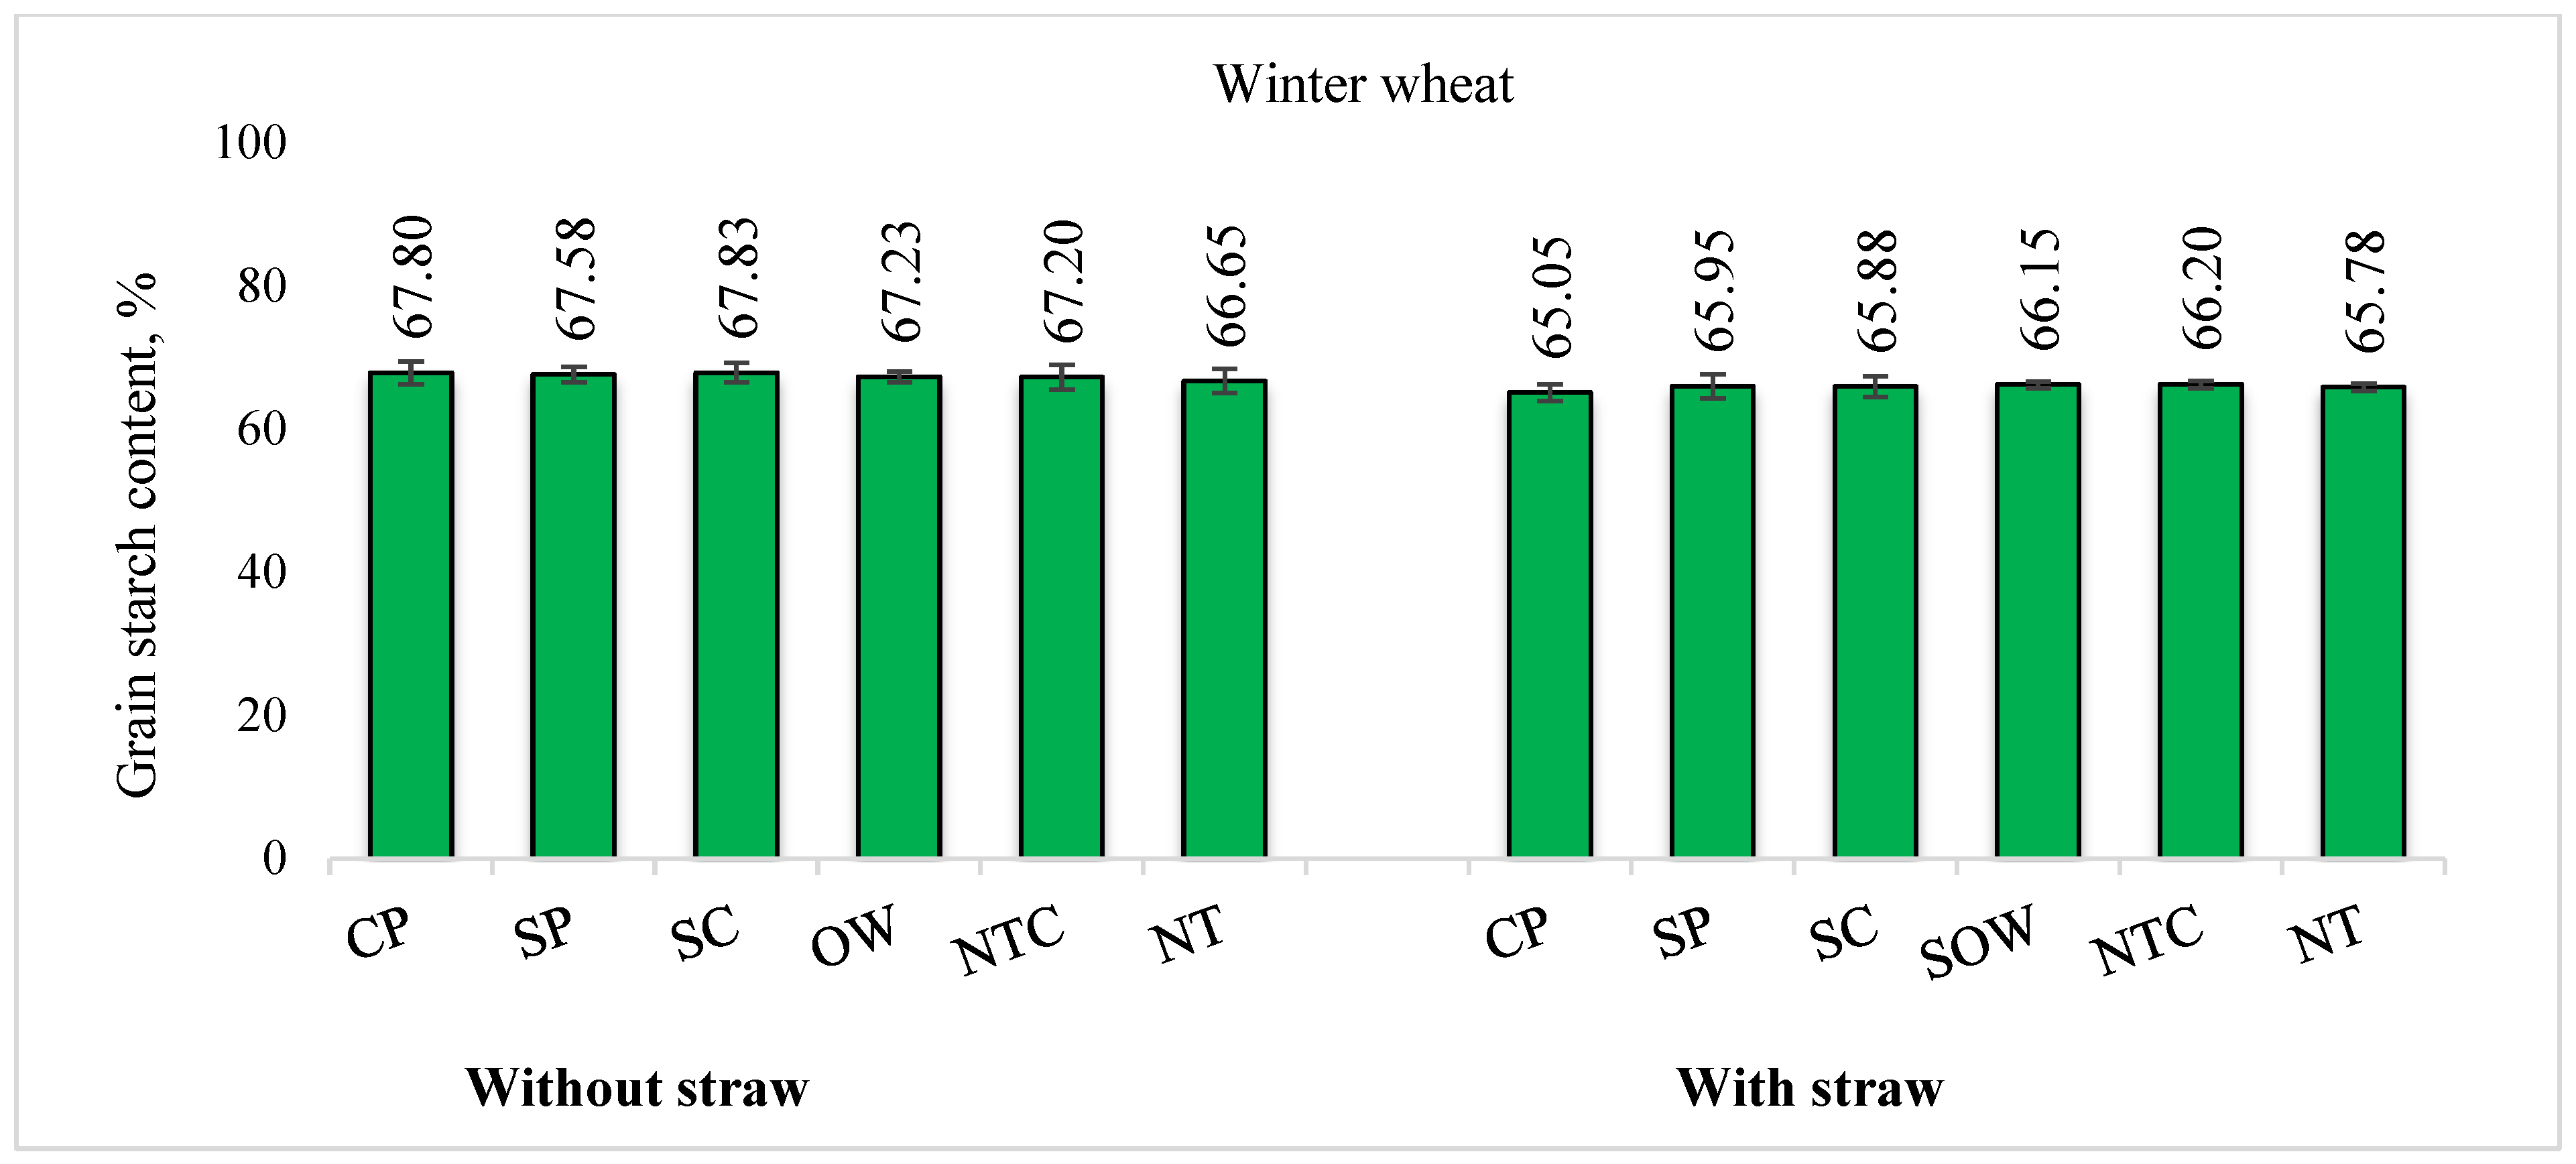
Winter wheat starch content. Wheat starch ranged from 65.78 to 67.83% (2020). Within the vs-control comparison framework, starch tended to increase under SC vs CP (+0.03 to +0.83 pp) across straw backgrounds (Figure 8). Under S1, simplified systems tended to show higher starch vs CP by +0.73 to +1.15 pp, indicating a consistent directional shift toward the carbohydrate fraction under straw retention.

3.3. Spring Barley: Processing-Relevant Traits

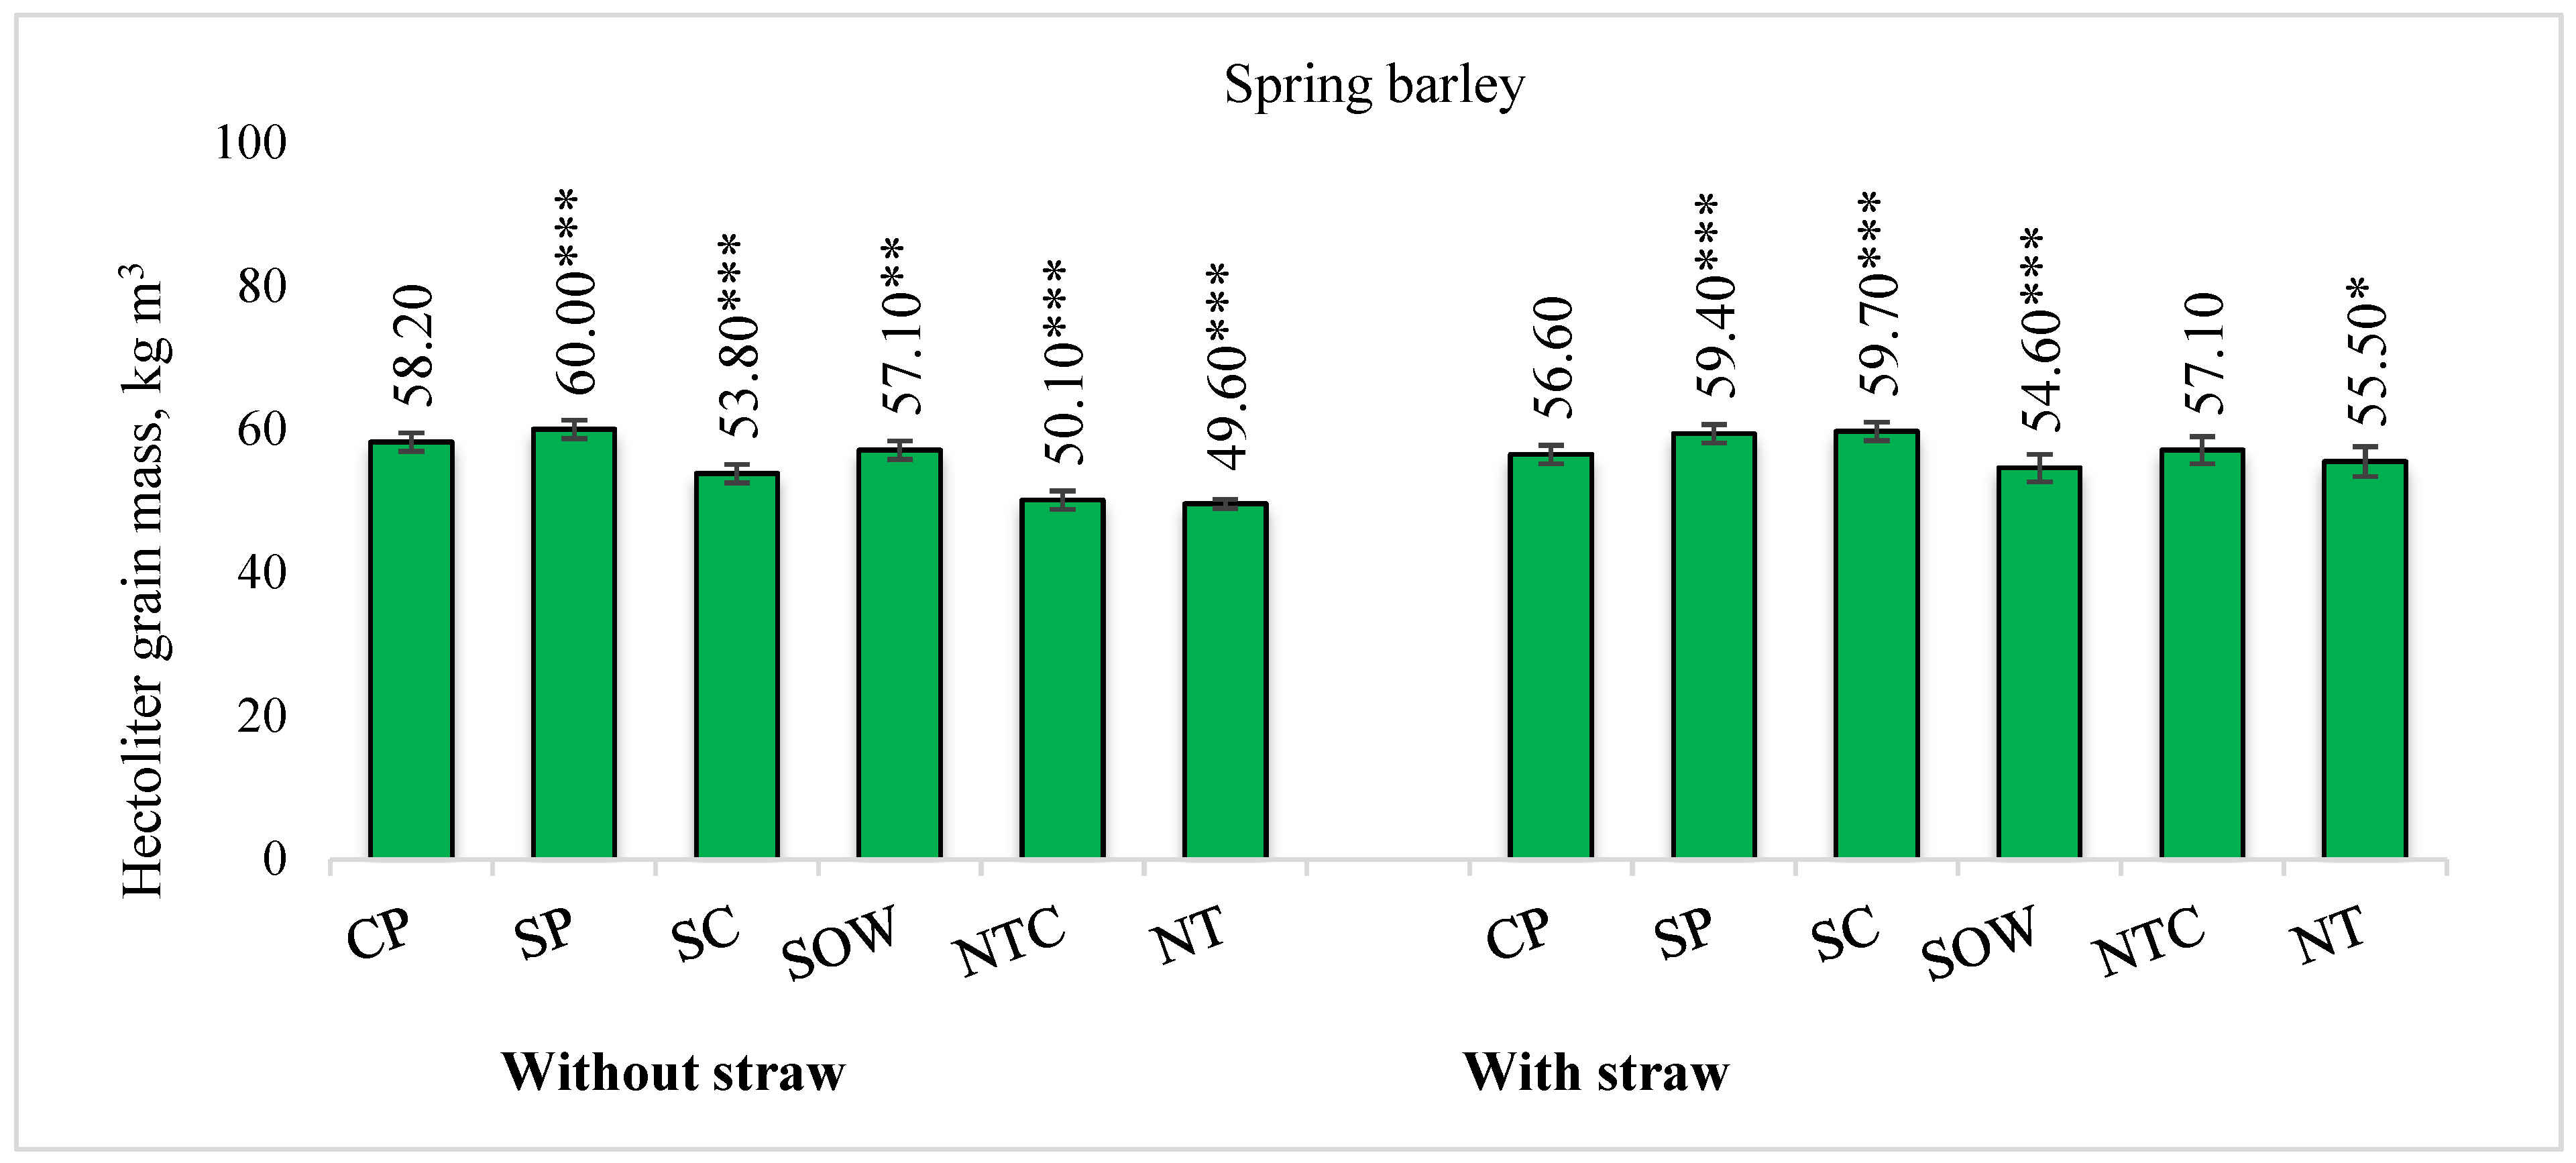
Barley hectolitre mass. This trait provided the clearest statistically supported discrimination between technologies using the vs-control logic. In 2021, SP was significantly higher than CP, increasing hectolitre mass by +3.1 to +5.1% (within S0/S1 as indicated by the figure symbols) (Figure 9). Conversely, selected variants (notably SOW and NT) were significantly lower than CP in some contexts, with decreases reported in the range −1.8 to −14.8% (depending on straw background and variant). SP showed the most consistent increases in hectolitre mass relative to CP in 2021.
In 2021, in the fields with straw removed (S0) and in others with straw chopped and spread (S1), the hectolitre mass of spring barley grain increased significantly (from 3.1 to 5.1%) compared to deep ploughing fields (CP) (Figure 9). In fields where stubble was left over winter (SOW) and where no-till without cover crops technology was applied, the hectolitre mass of spring barley grain decreased significantly (from 1.8 to 14.8%).
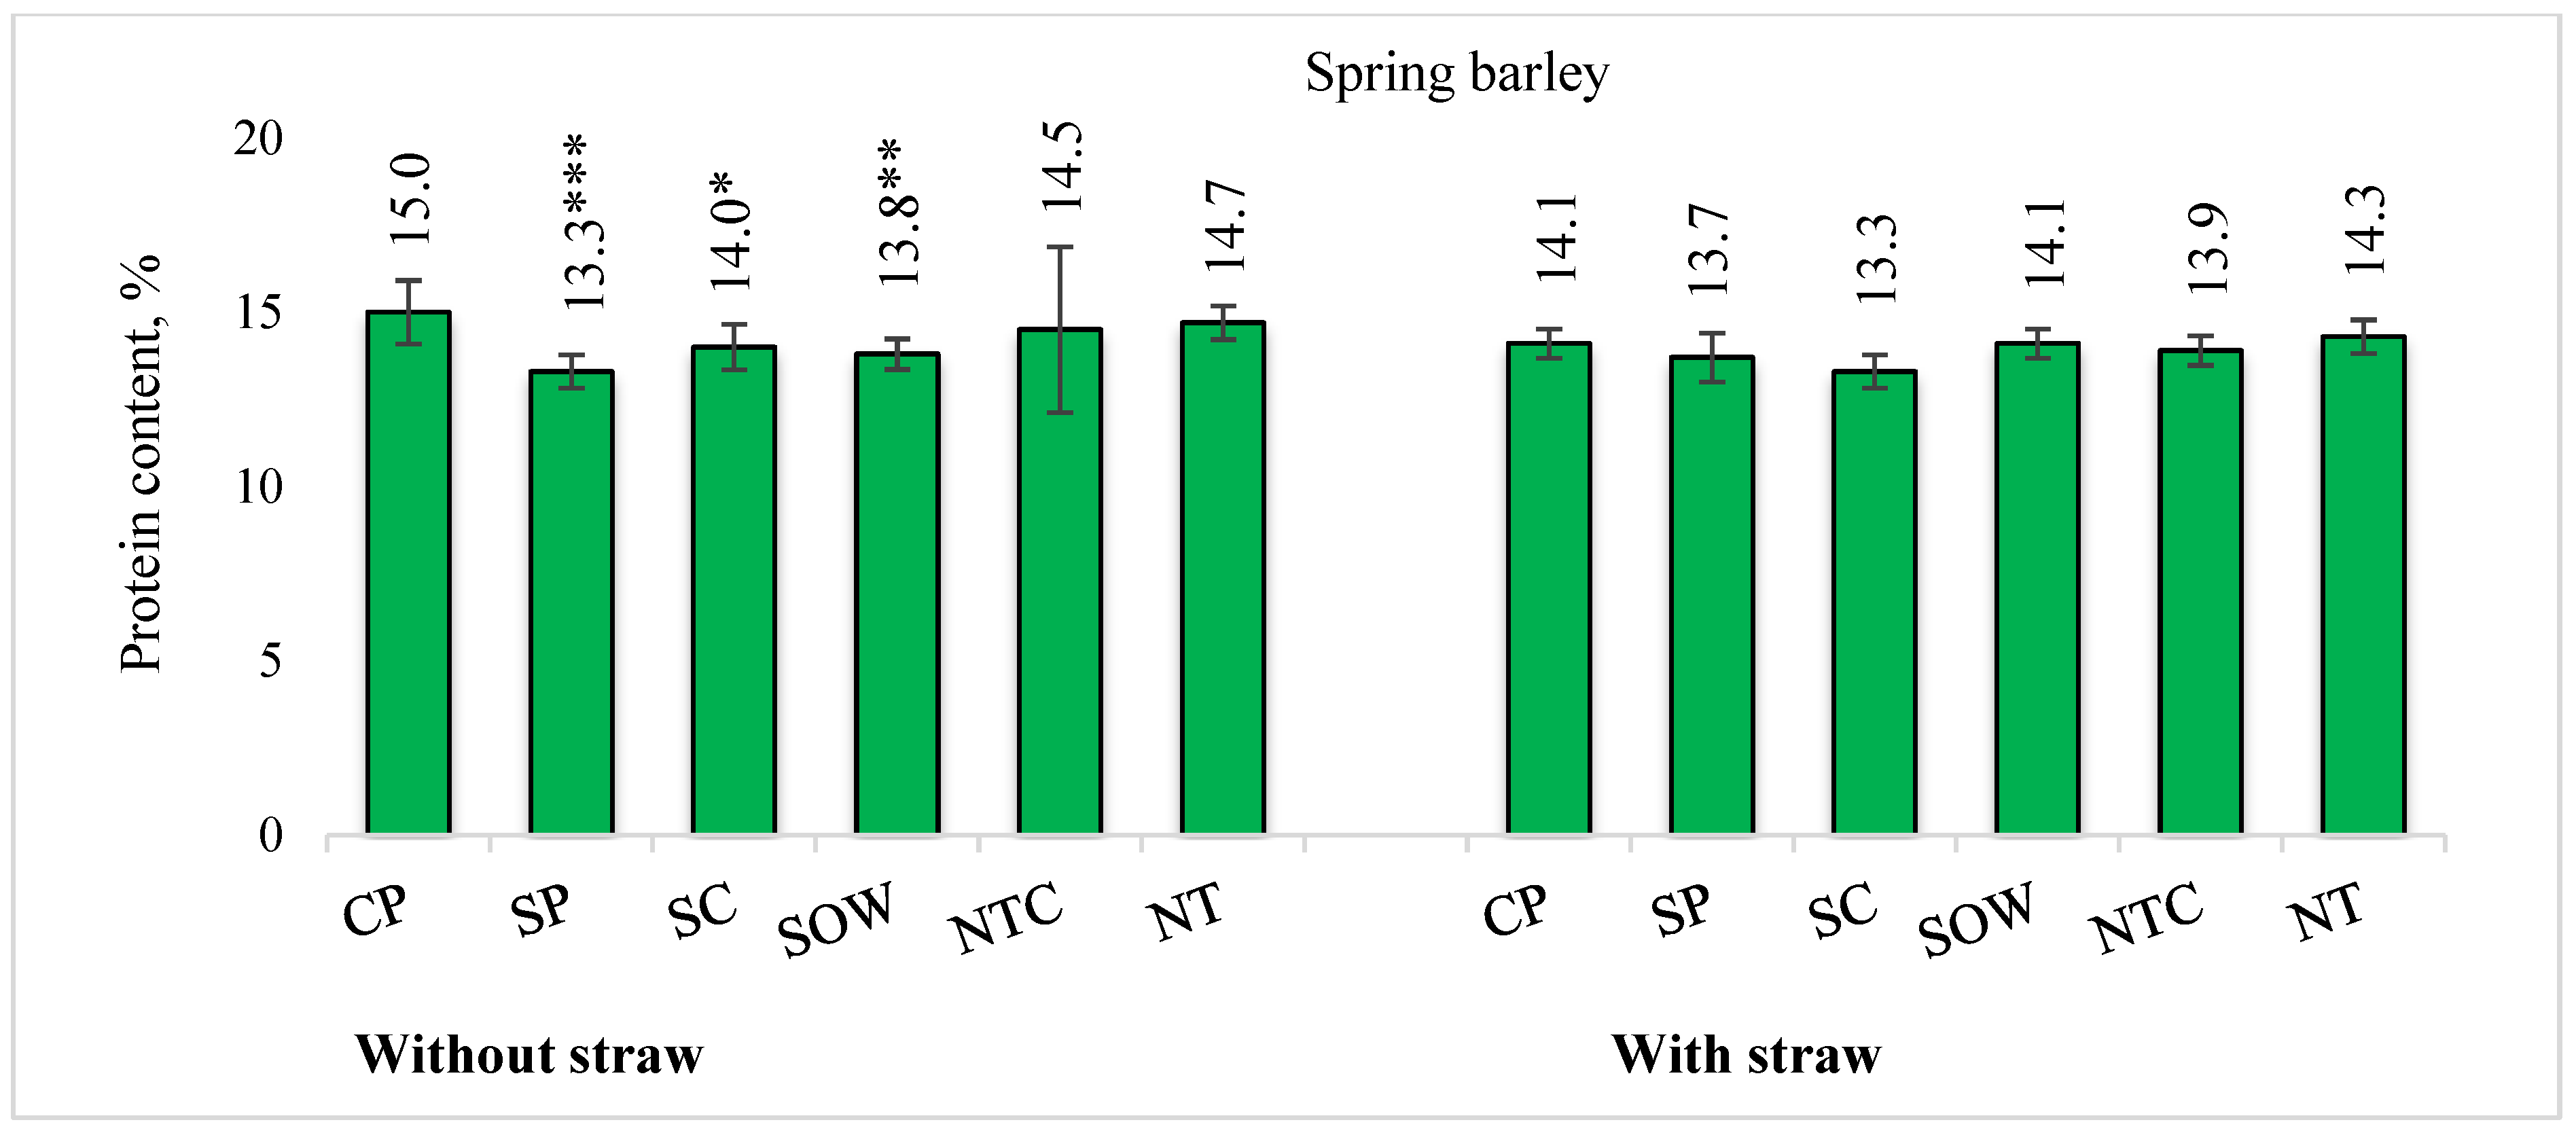
Barley protein content. In 2021 under S0, barley protein was significantly lower than CP under SP/SC/SOW by −1.0 to −1.7 pp (vs-control contrasts) (Figure 10). Under S1, barley protein showed a small increase under NT (+0.2 pp), while no significant differences vs CP were reported among other technologies (*—p ≤ 0.05 > 0.01, **—p ≤ 0.01 > 0.001 and ***—p ≤ 0.001). Overall, statistically supported differences in barley protein were concentrated under S0, while S1 largely reduced between-technology separation.
In 2021, in spring barley crop fields from which straw was removed (S0), shallow ploughing (SP), shallow cultivation (SC) and leaving stubble over winter (SOW) were applied; the protein content of spring barley grains decreased significantly (from 1.0 to 1.7 pp) compared to deep ploughing (CP).
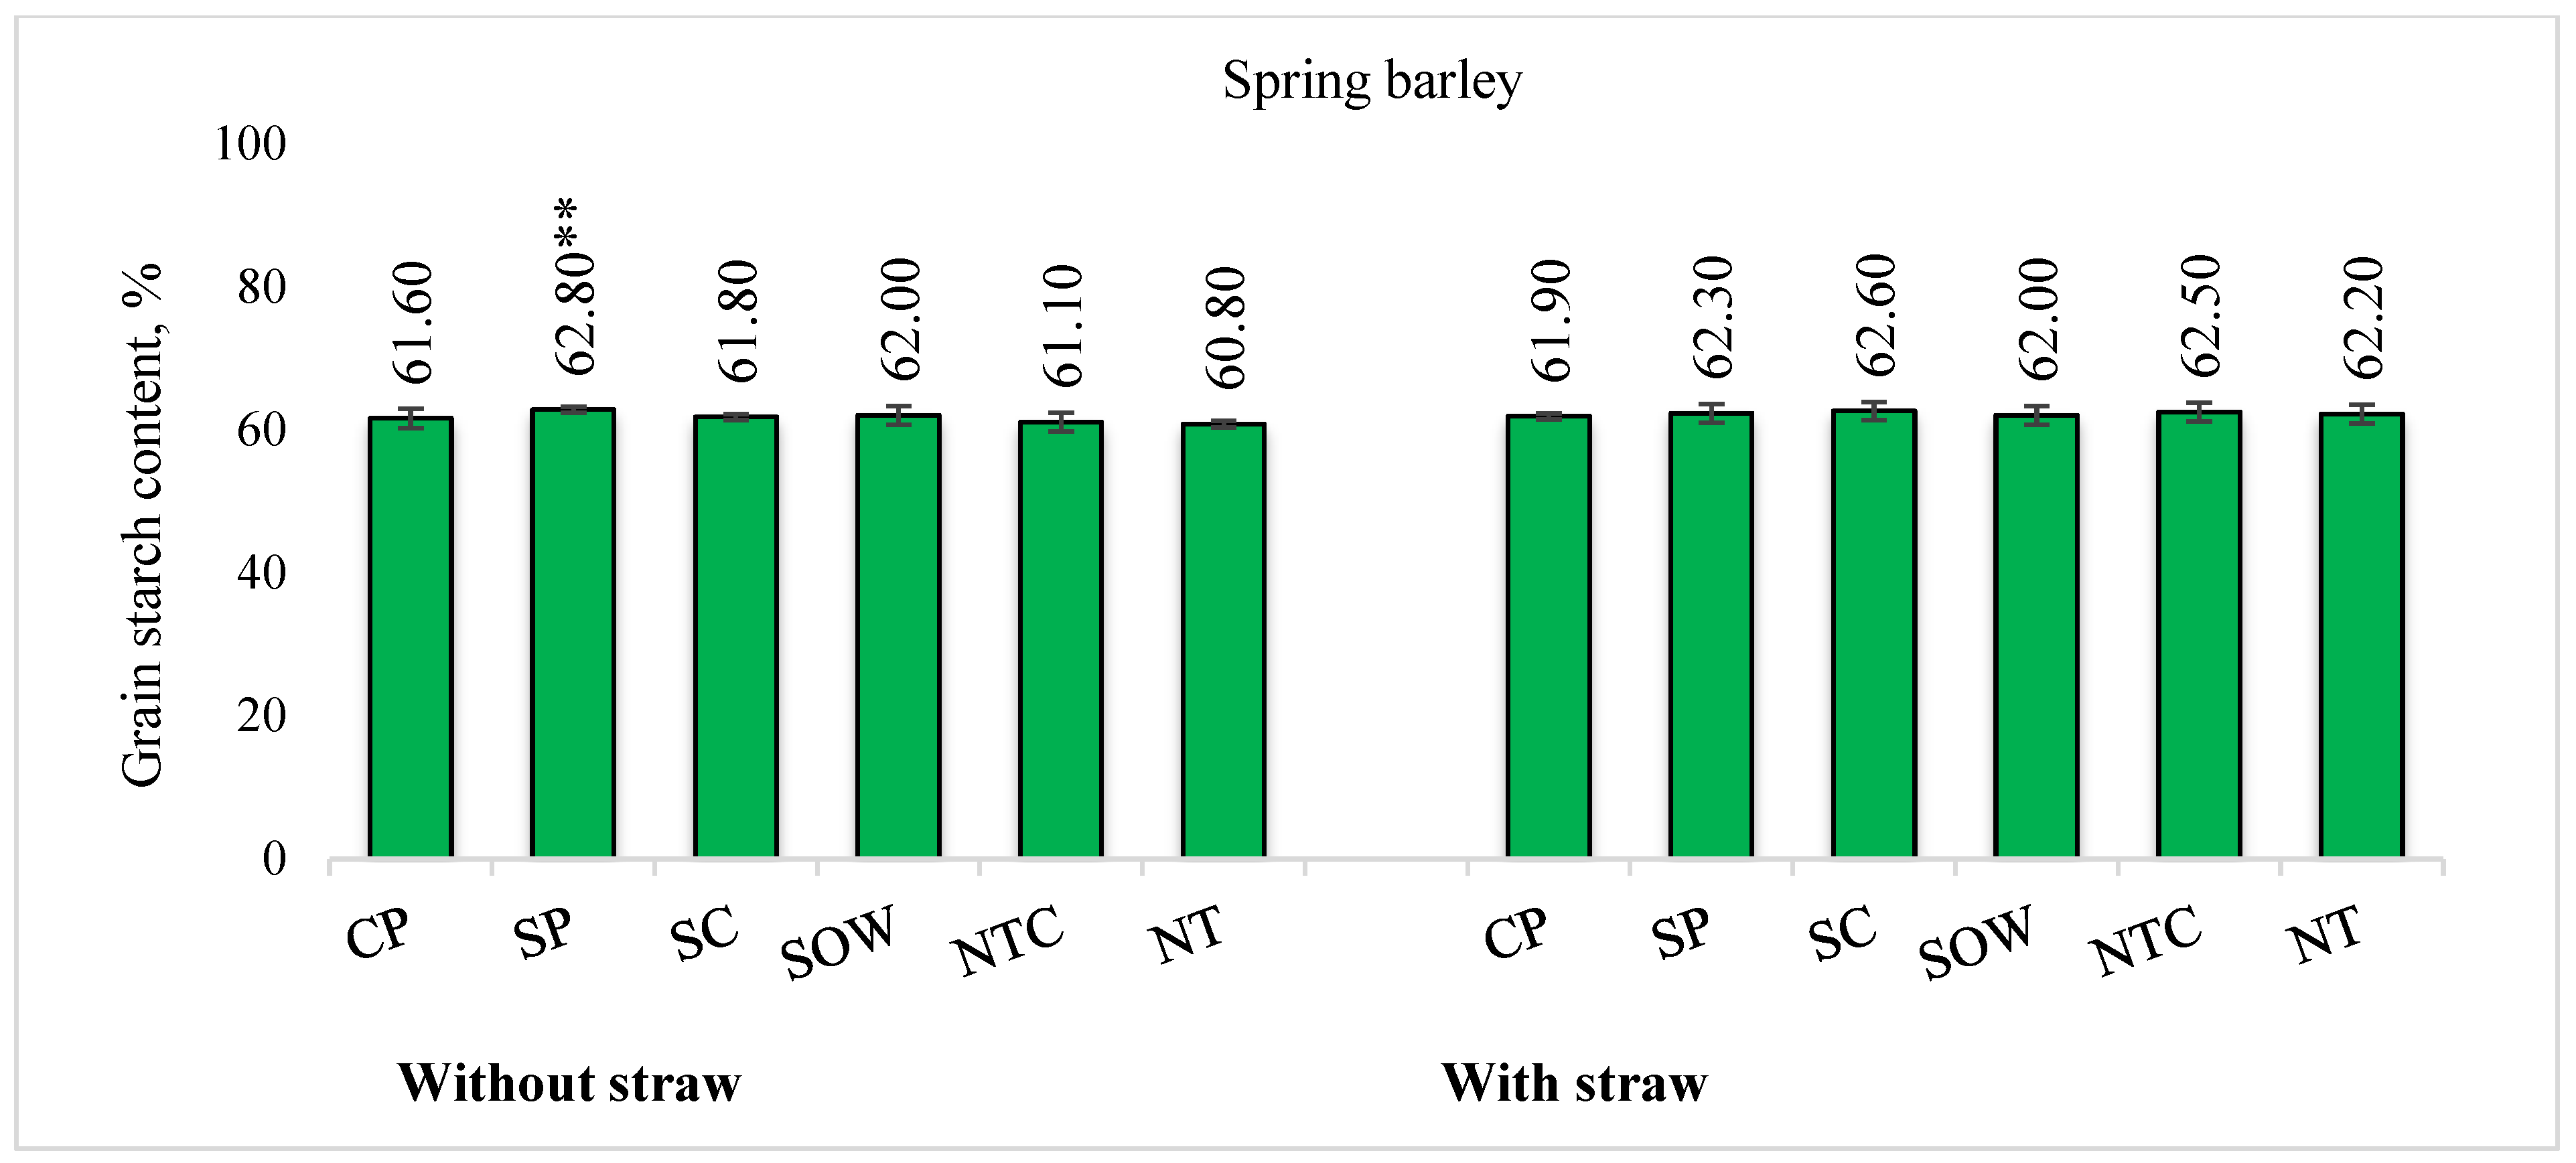
Barley starch content. Barley starch increased directionally under SP/SC/SOW vs CP by +0.1 to +1.2 pp across straw backgrounds (Figure 11). A robust, reported, significant contrast is that under S0, SP increased starch by +1.2 pp vs CP. This suggests that under some conditions (e.g., straw removal), shallow ploughing has the potential to improve both physical density and starch content, warranting further investigation.
It was found that in fields from which straw was removed (S0), under shallow ploughing (SP), the starch content of spring barley significantly increased (1.2 pp).
It was found that in 2021, spring barley starch content correlated r = 0.99 p ≤ 0.05 with total nitrogen activity in the 10–25 cm layer when straw was added.
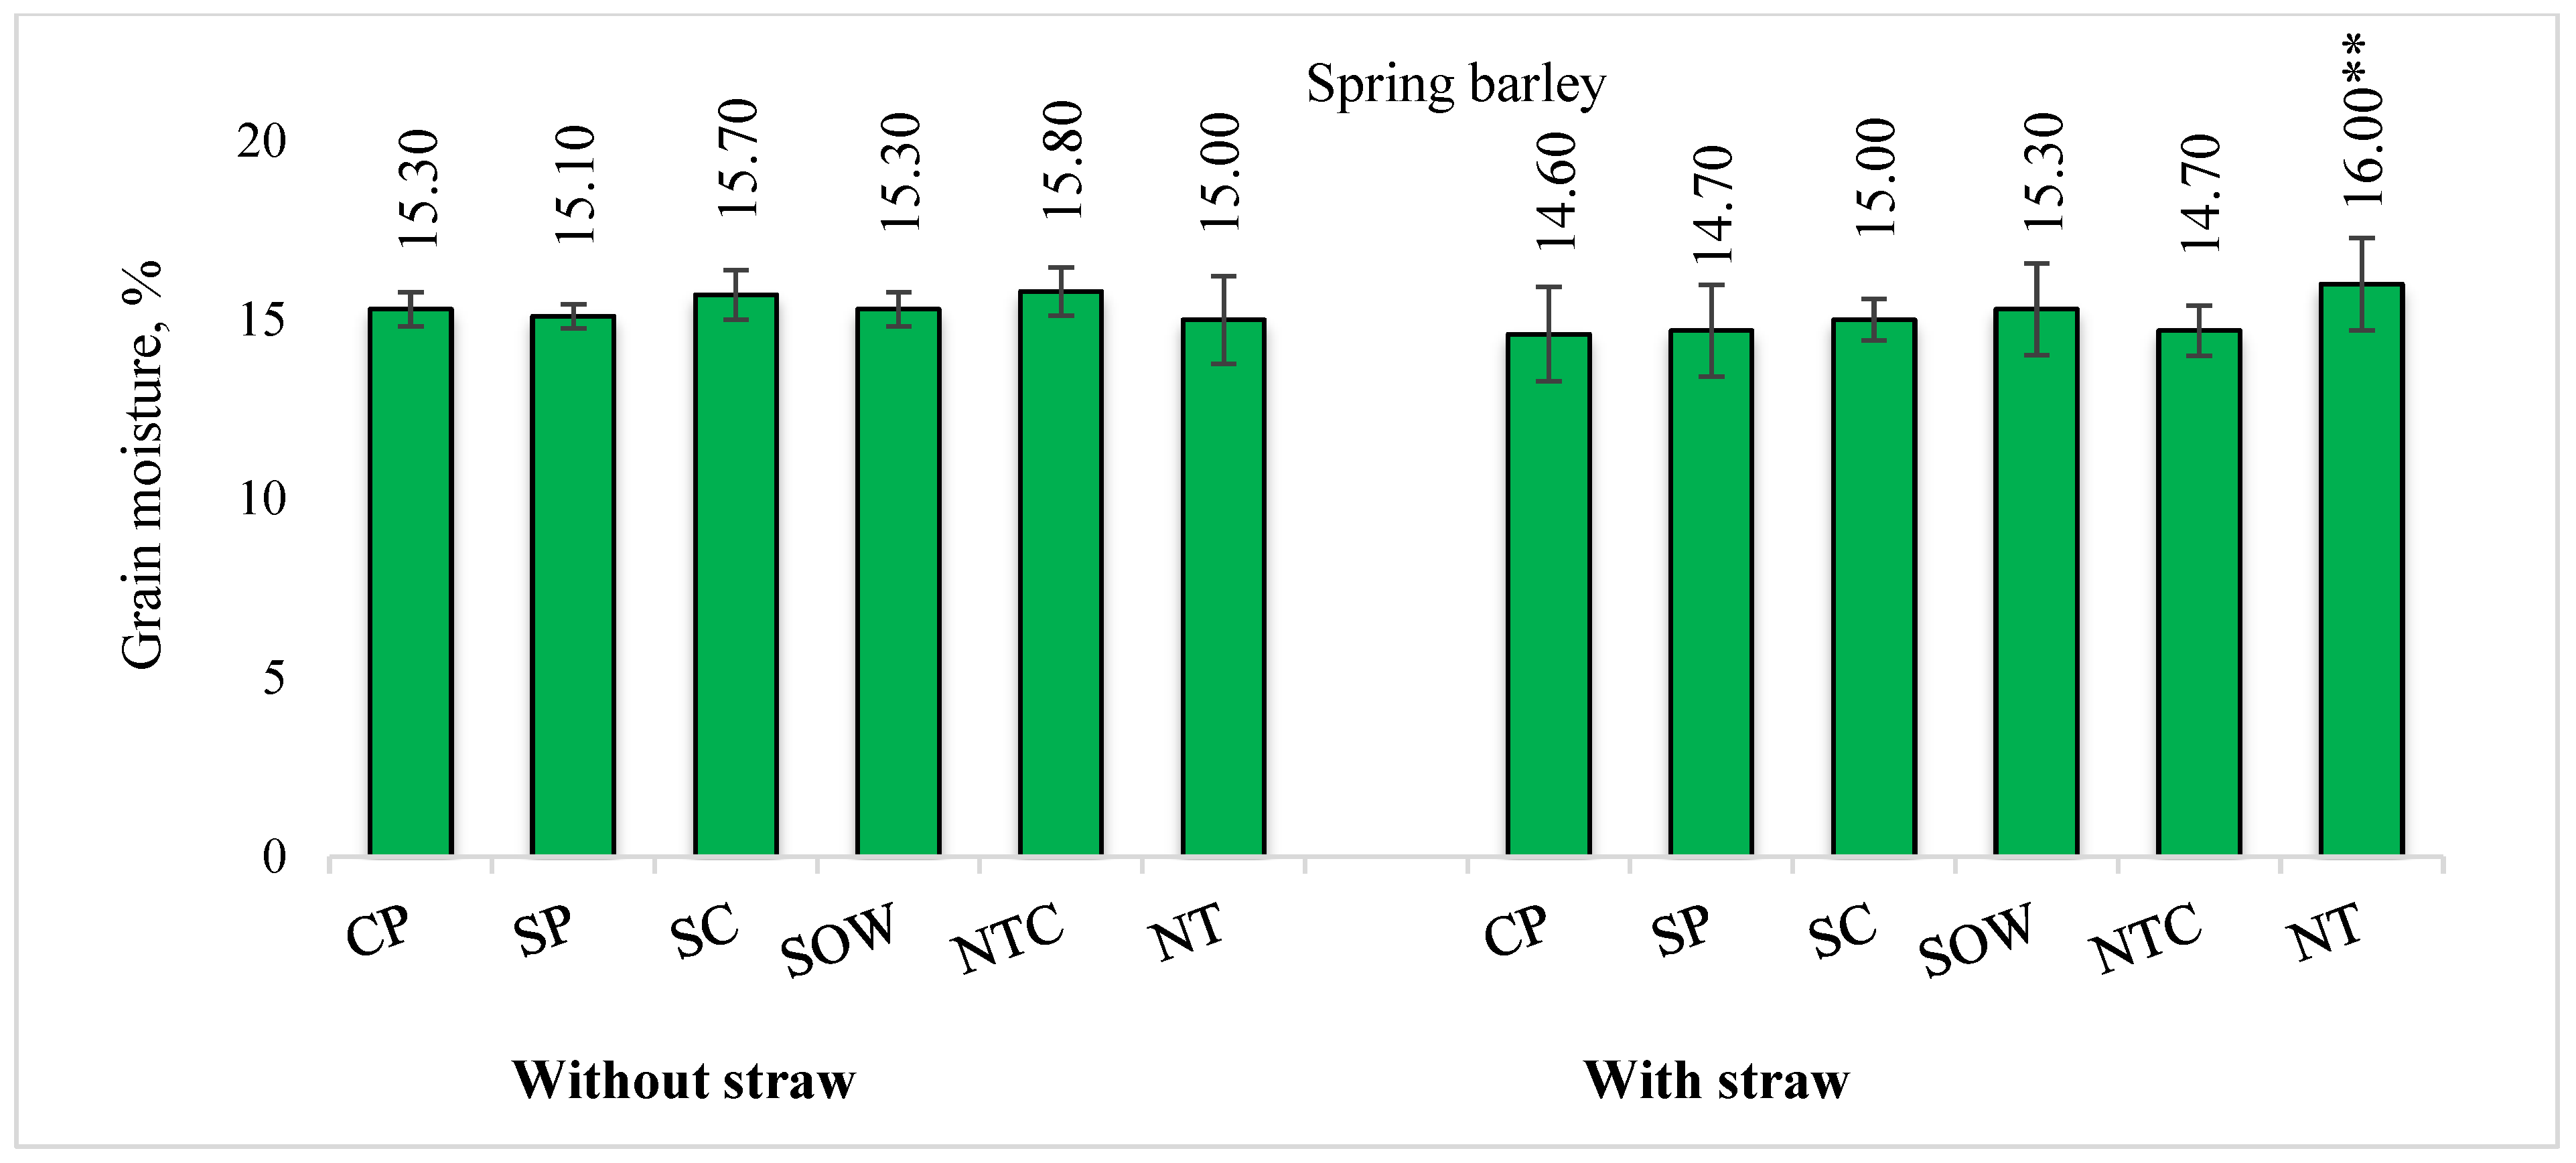
Barley grain moisture. Barley moisture showed a clear straw effect and straw-conditioned patterns (Figure 12). In 2021, moisture under S1 was reported to be significantly higher than CP by +1.40 pp. Within S0, moisture tended to be lower than CP under SP/NT (−0.20 to −0.30 pp) and higher under SC/NTC (+0.40 to +0.50 pp), but these should be framed as directional unless marked as significant vs CP by asterisks.
In fields where straw was chopped and spread (S1) and direct seeding into uncultivated soil (NT) was applied, compared to deeply ploughed fields (CP), the moisture content of spring barley grains increased significantly (1.40 p.p.).

3.4. Trait Relationships Supporting Cereal Functionality

Yield–starch relationship. Under straw removal (S0) in winter wheat, yield correlated positively with starch content (r = 0.846, p < 0.05), indicating that higher grain output coincided with a higher carbohydrate fraction in grains.
Moisture–functionality relationships. Under S0 in winter wheat, grain moisture was negatively associated with the gluten content (r = −0.90, p < 0.01) and sedimentation index (r = −0.877, p < 0.05), indicating that moisture should be treated as an interpretive covariate for wheat functionality proxies rather than only a storage trait.

3.5. Soil-Function Co-Benefits Across Systems (CEI)

Complex evaluation index (CEI). The previously discussed results regarding grain yield and quality proxies—such as protein functionality and starch accumulation—demonstrate that agronomic performance is inextricably linked to the underlying soil condition. To move beyond isolated indicators, the following section introduces the complex evaluation index (CEI), which integrates agrochemical, agrophysical, and biological soil properties into a unified framework. This holistic assessment reveals how conservation-oriented technologies support stable crop output by regenerating the soil’s structural integrity, ultimately providing a comprehensive view of agroecosystem resilience.
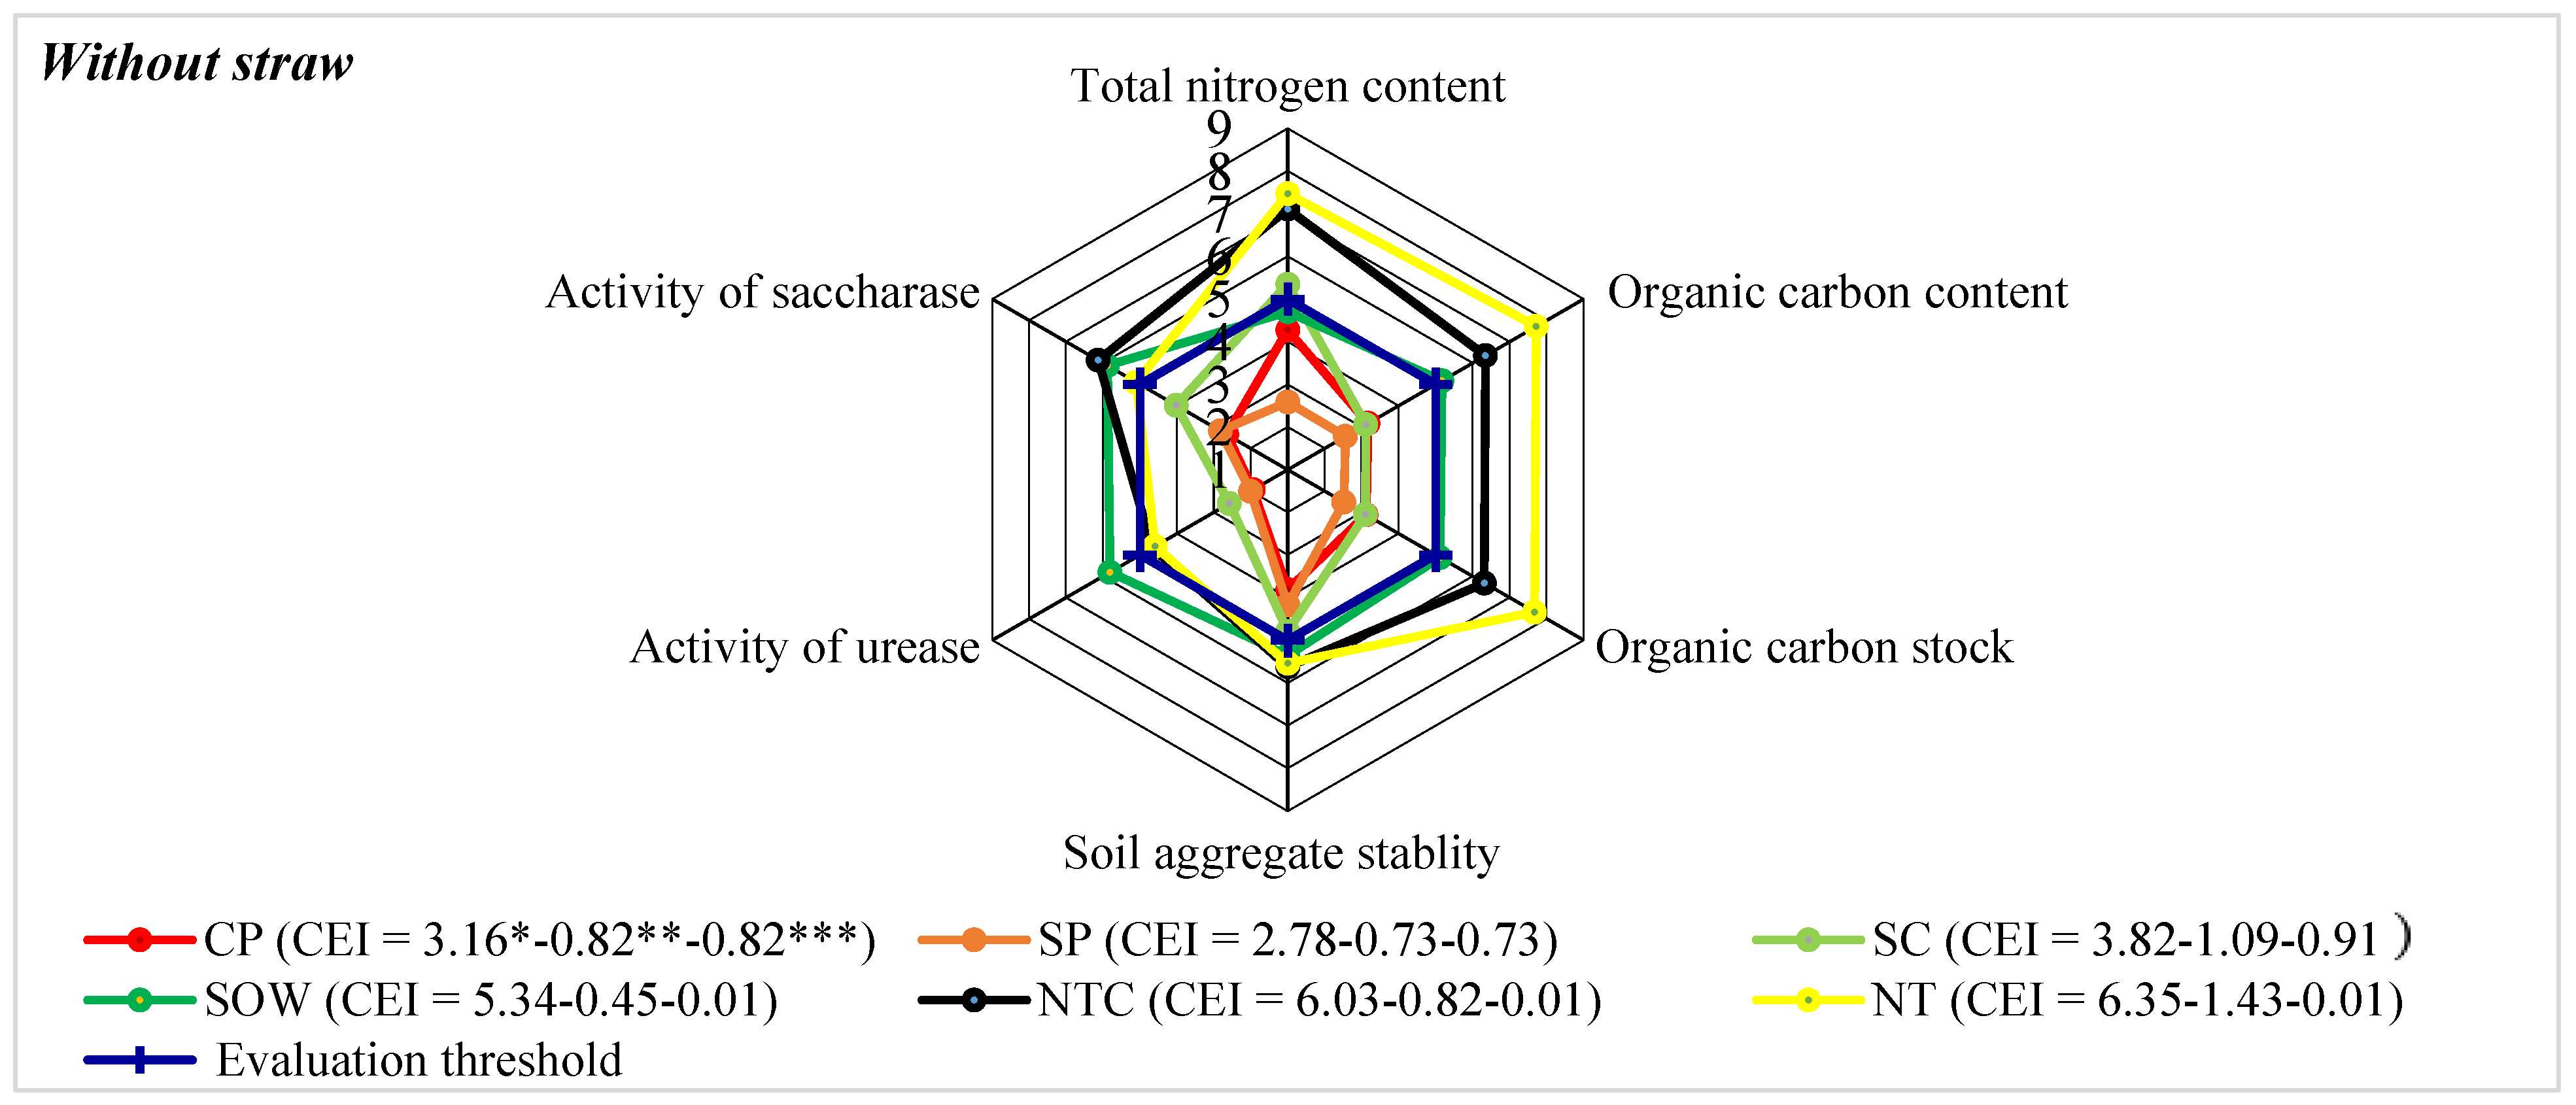
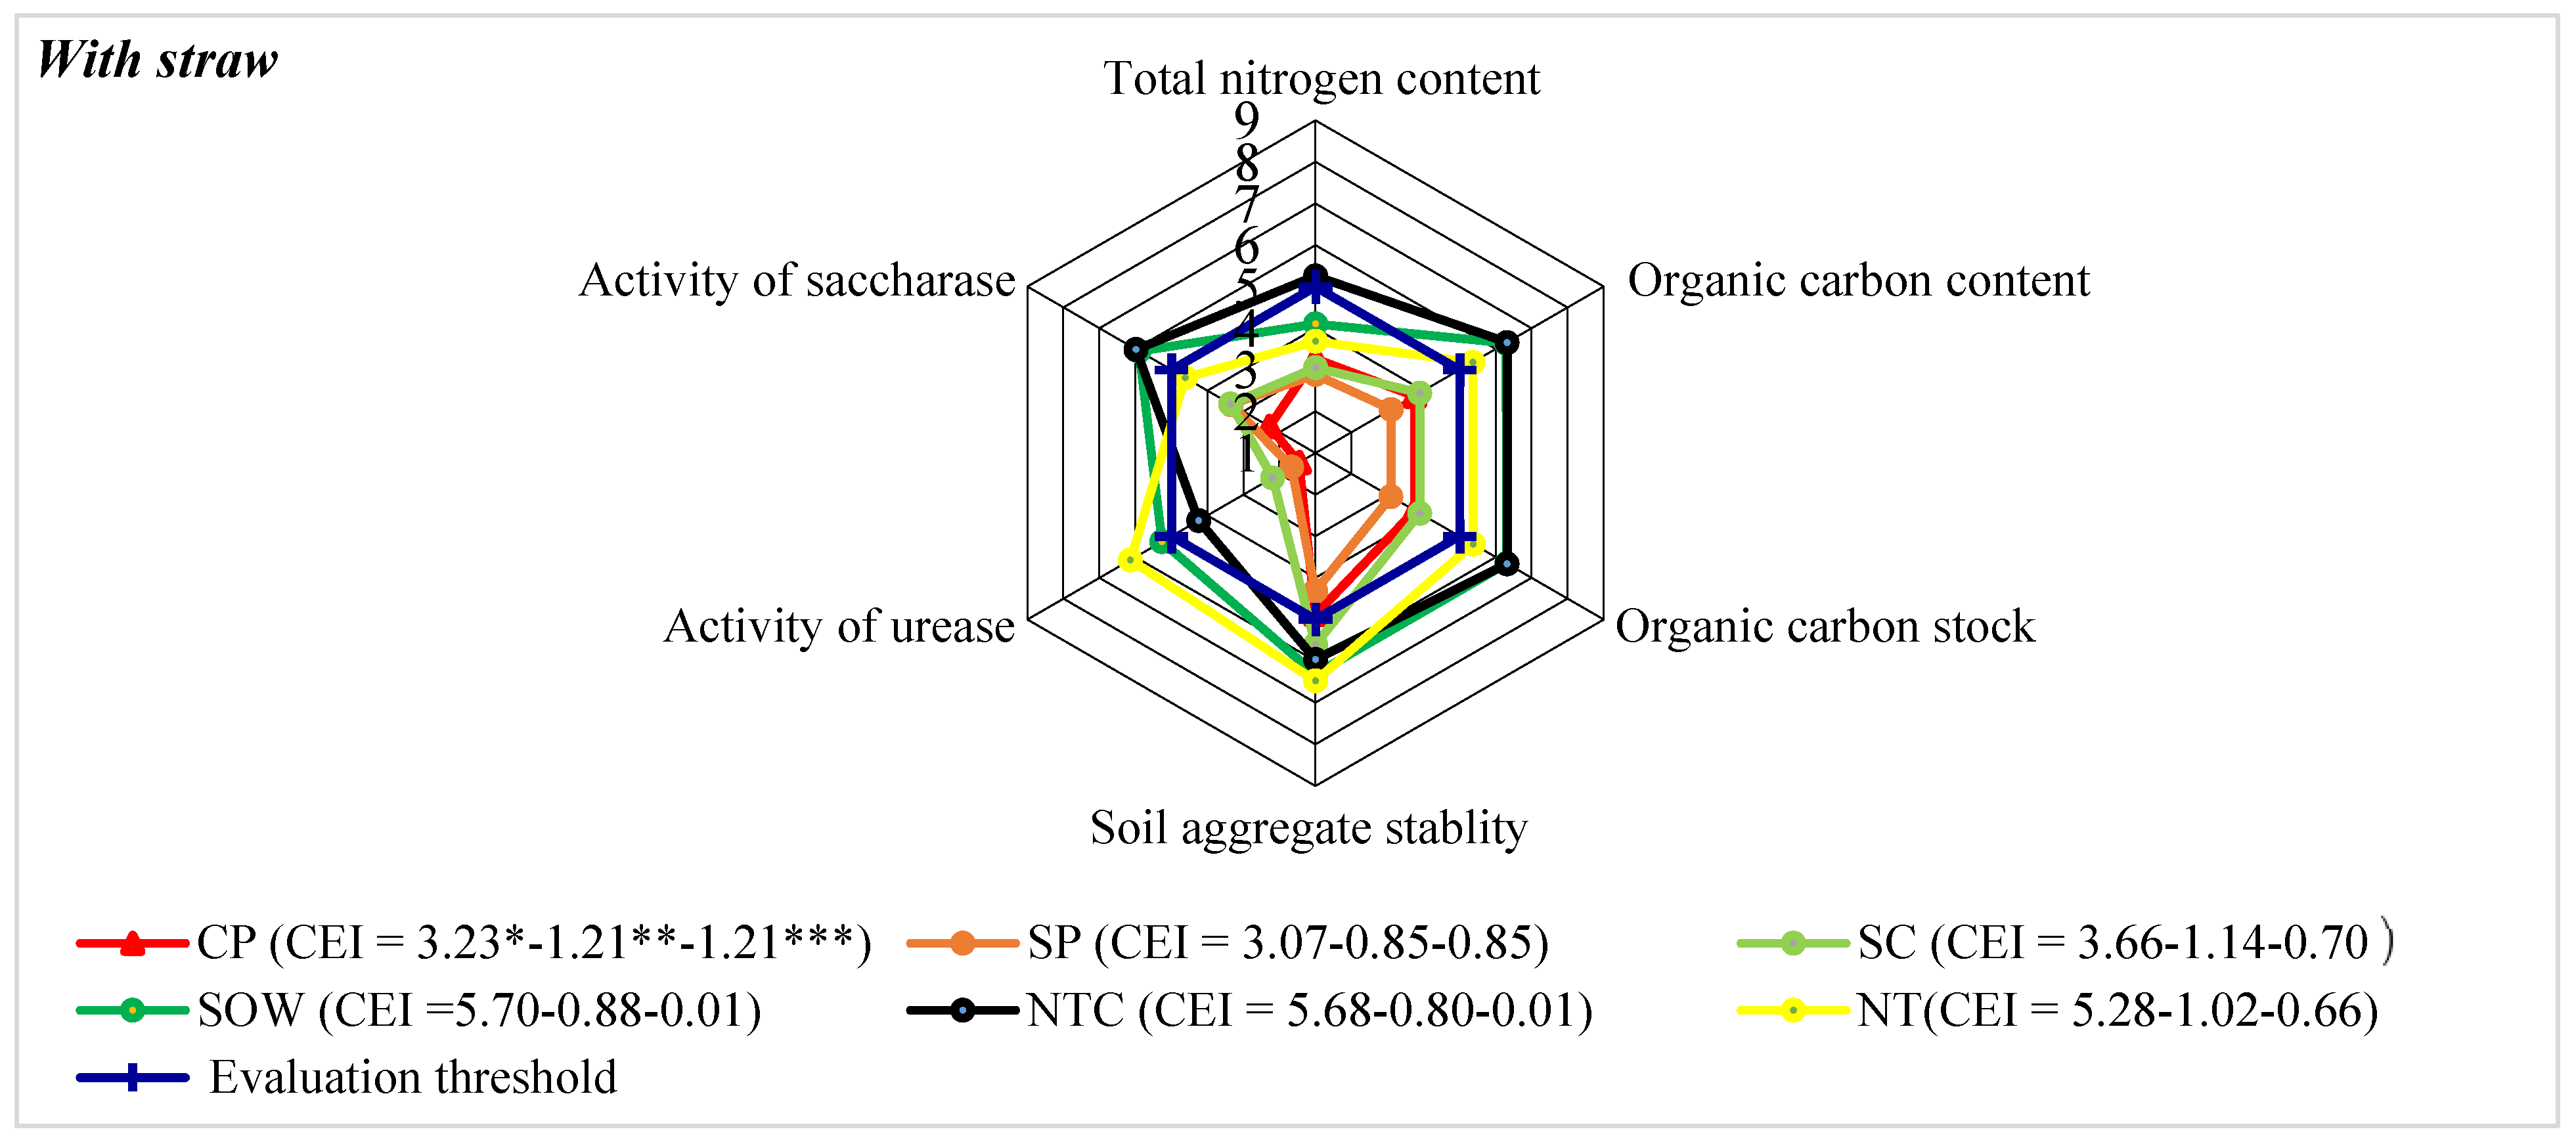
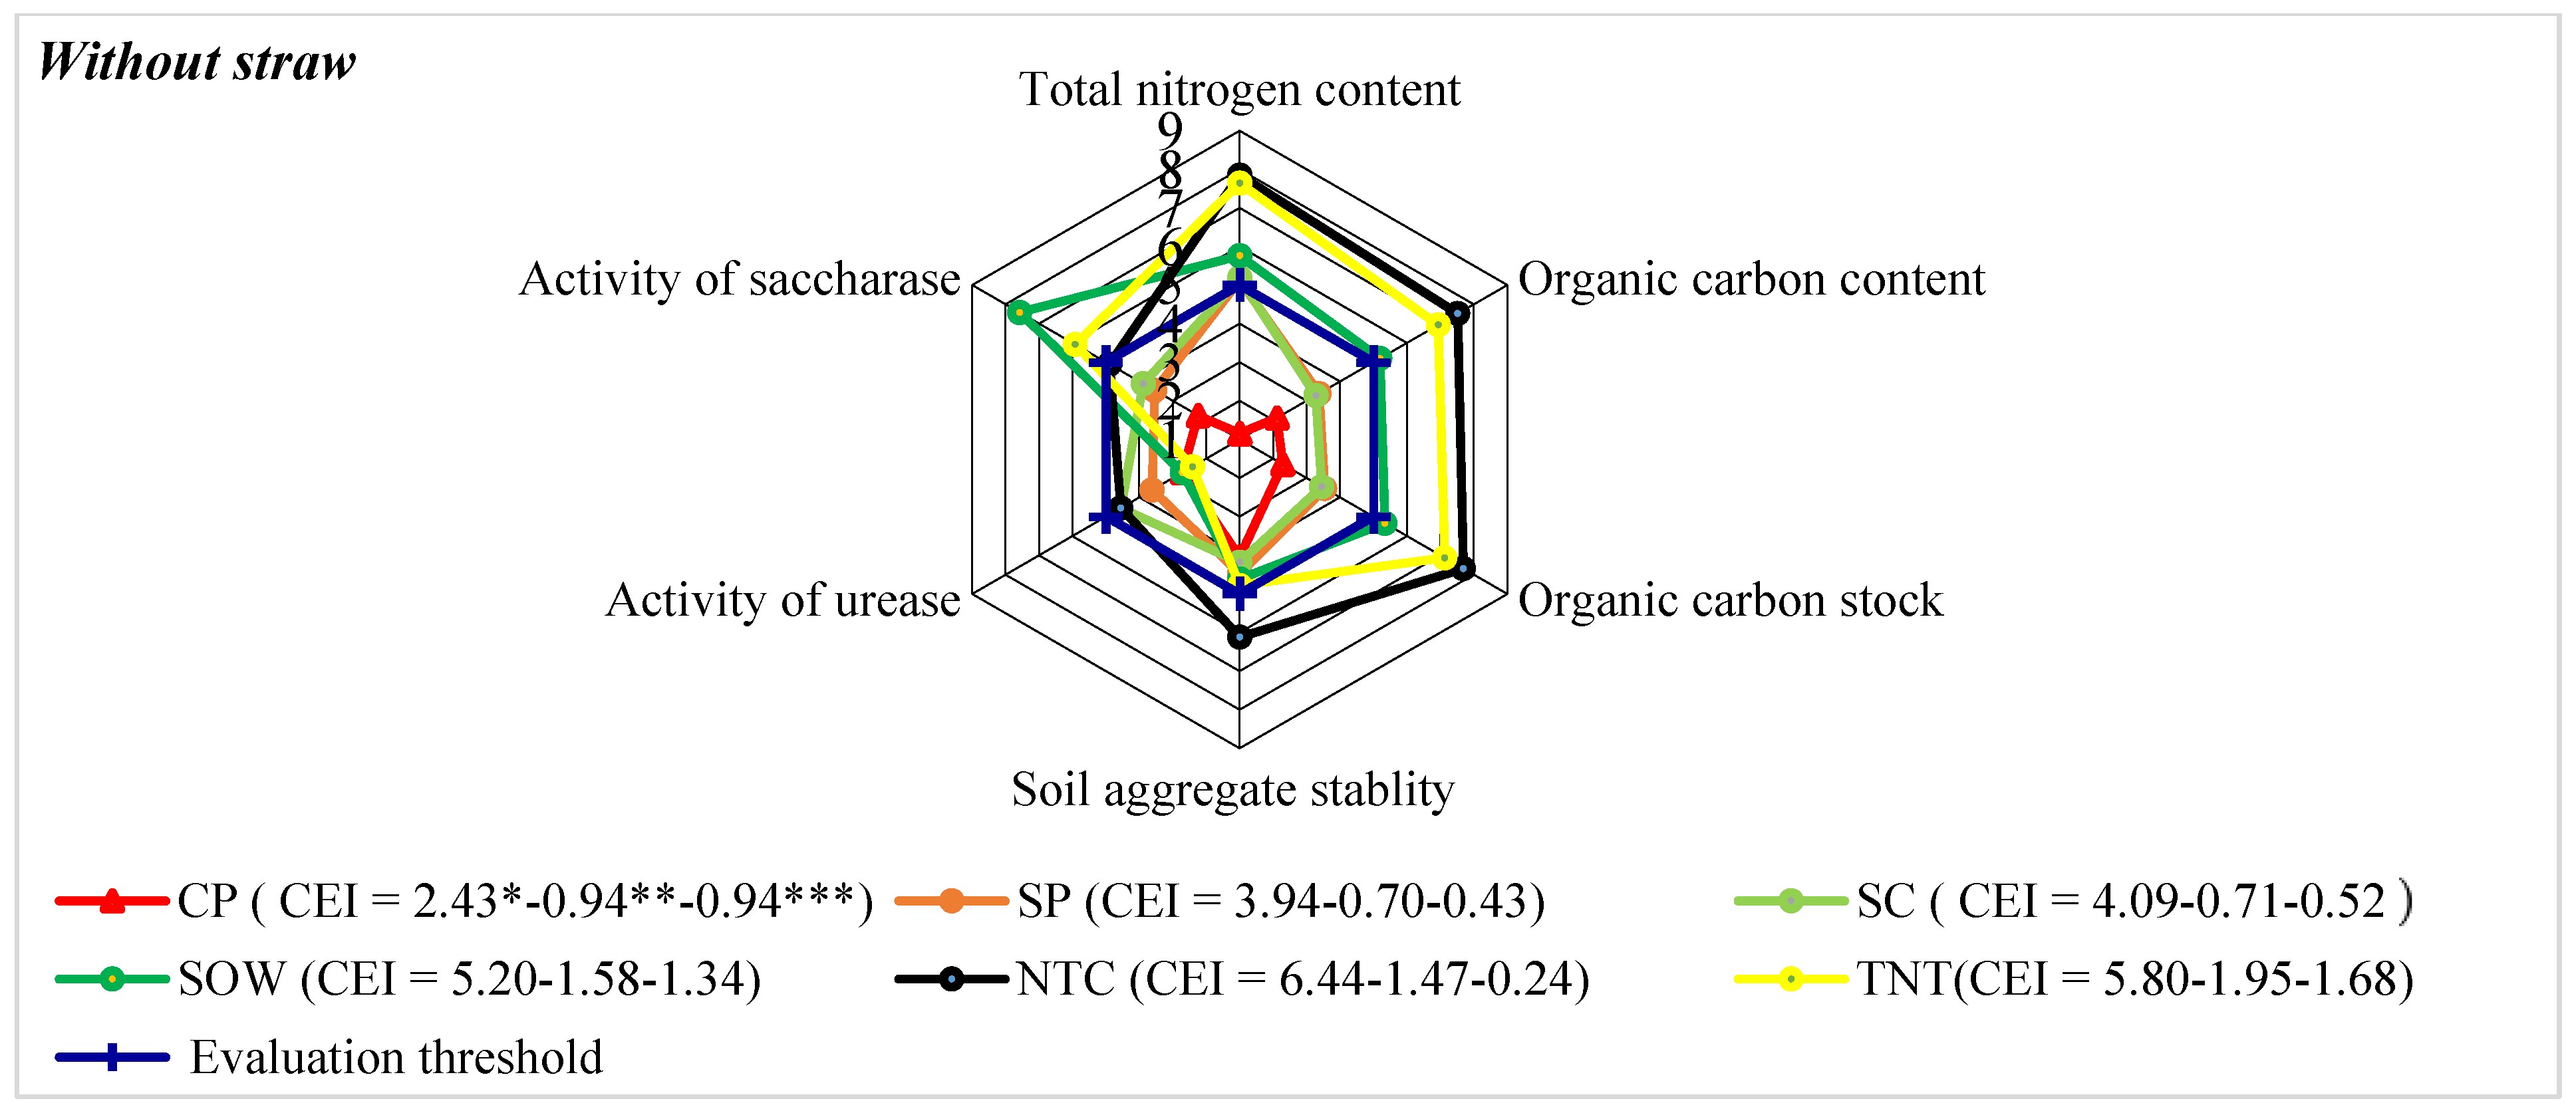
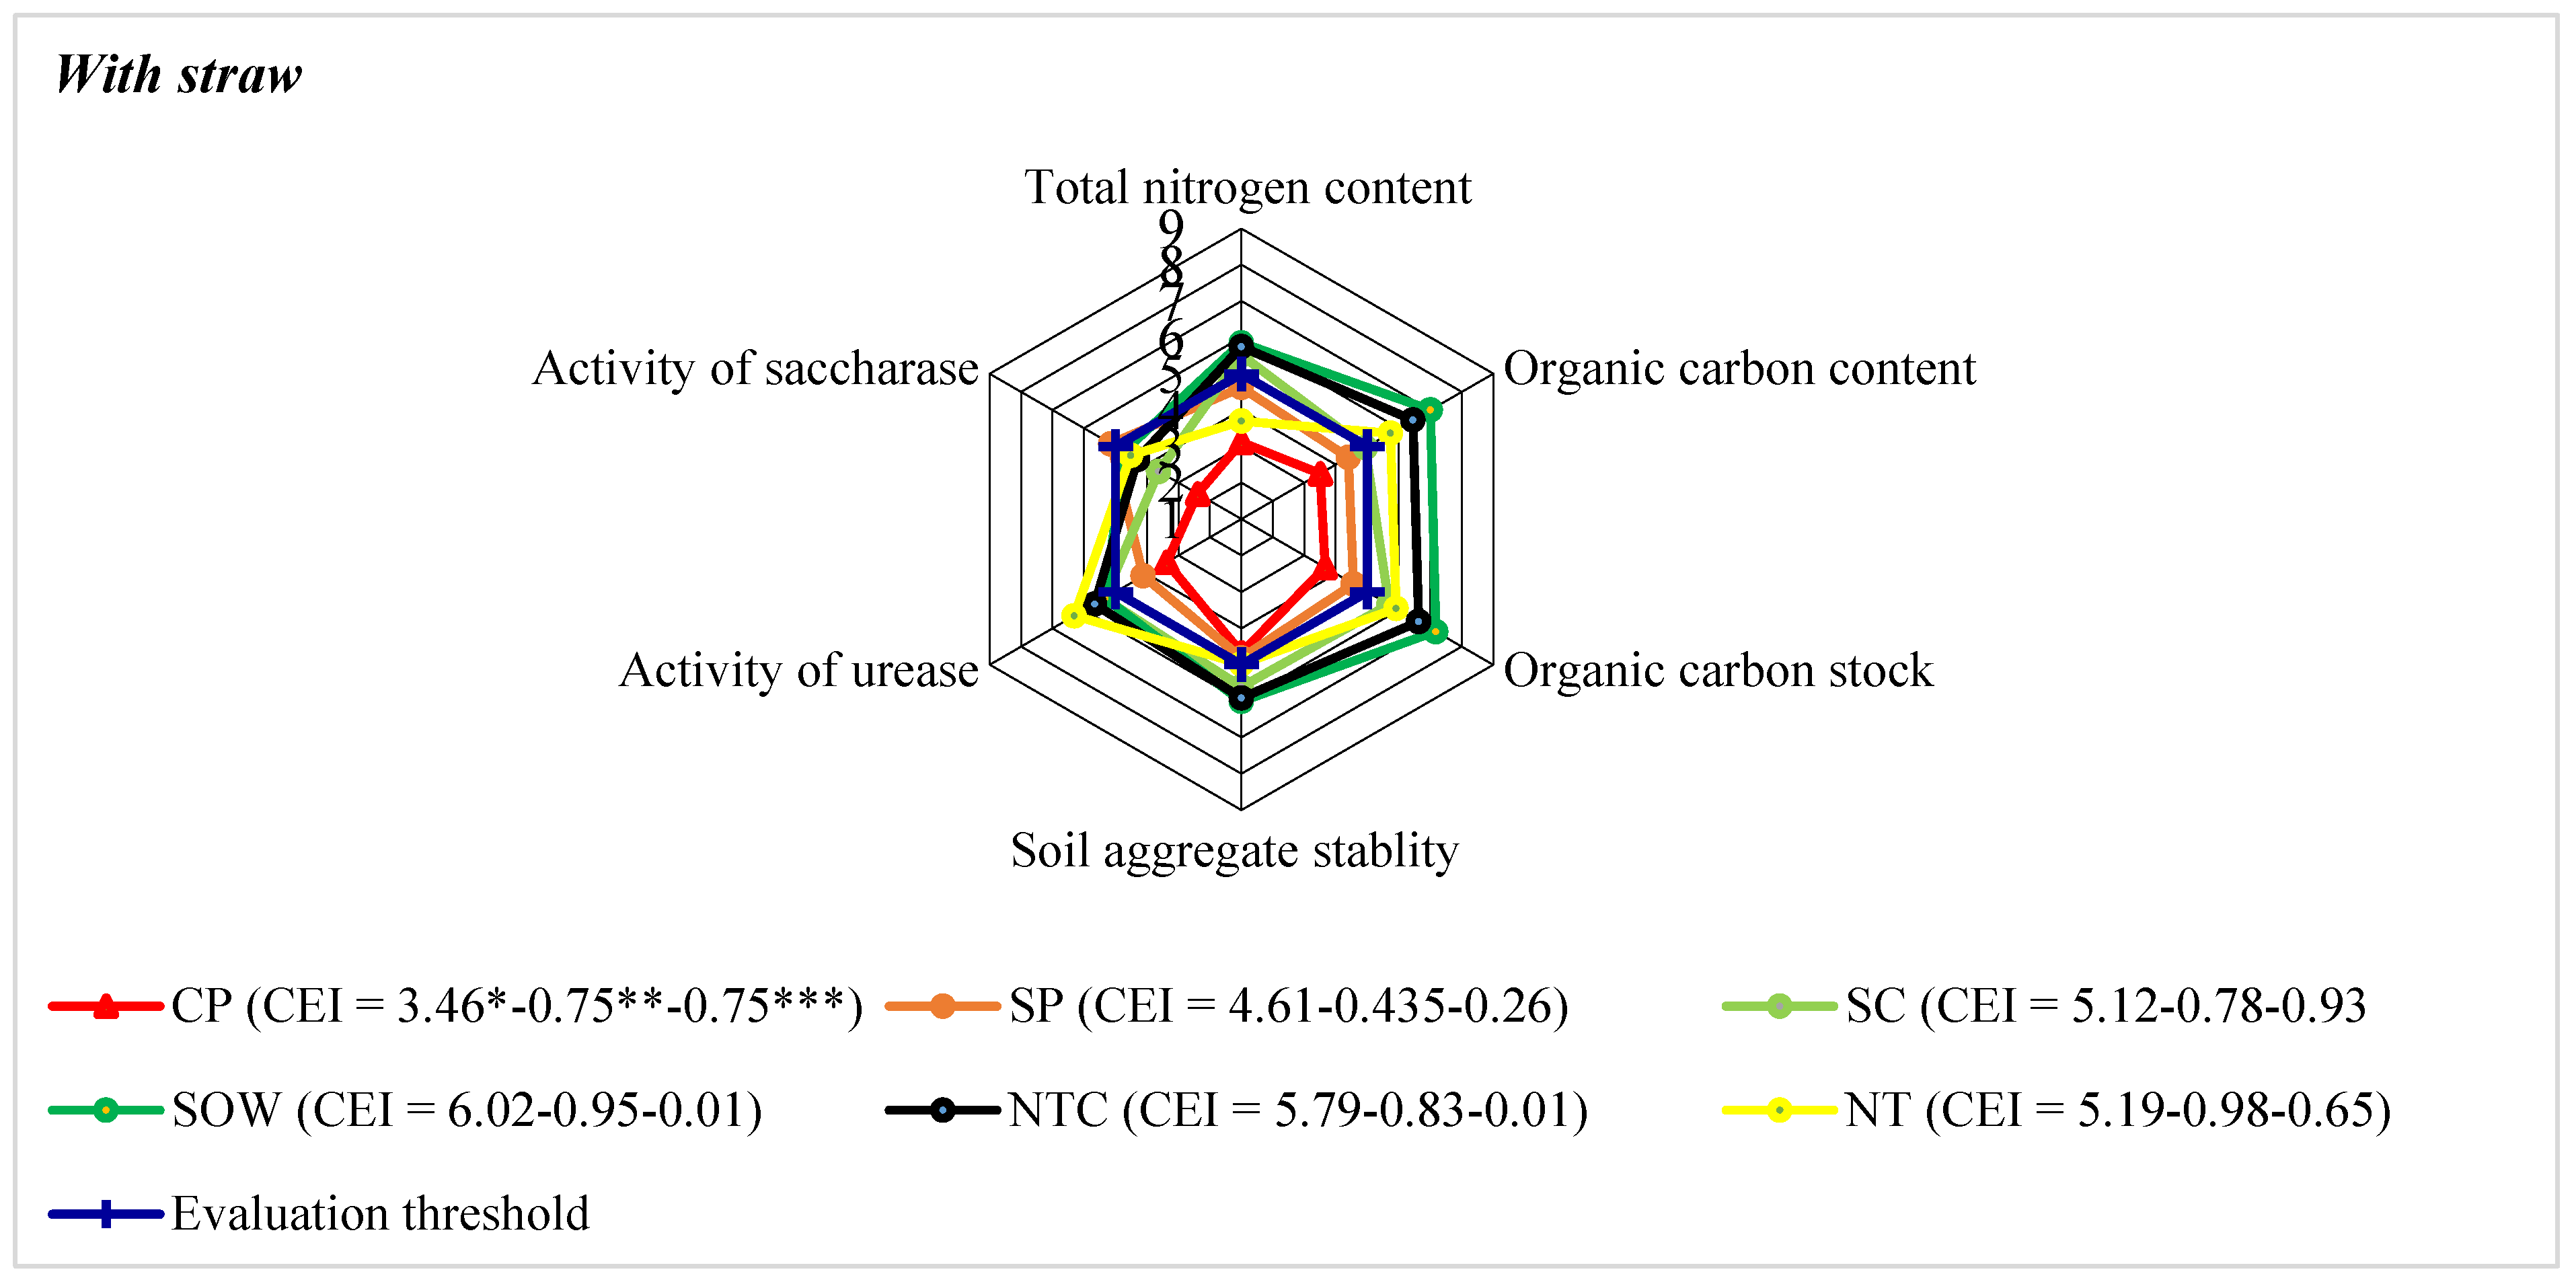
The results of the comprehensive evaluation of the long-term effects of tillage technologies on the agroecosystem, considering six indicators, are presented in the figures below (Figure 13, Figure 14, Figure 15 and Figure 16).
In 2019–2021, when assessing the soil agrochemical properties (0–10 cm), in the fields where the straw was removed (S0), no-till technologies with cover crops (NTC) and without cover crops (NT) were superior to other applied technologies. No-till technologies with cover crops (NTC) and without cover crops (NT) had an impact on the rise in total nitrogen scores above the evaluation threshold (5 points). The highest evaluation scores were obtained using the no-till technology without cover crops (NT). The scores of organic carbon and organic carbon stocks above the evaluation threshold rose the highest in using the no-till technology without cover crops (NT) (Figure 13).
When evaluating the soil agrophysical properties (0–10 cm), in the fields where the straw was removed (S0), the evaluation scores were evenly distributed, and similar trends were observed as when evaluating the soil agrochemical properties. The highest score of soil aggregate stability was found in no-till technology with cover crops (NTC) (Figure 13).
When evaluating crops where different technologies were applied (0–10 cm), in fields where straw was removed (S0), the stubble left over winter (SOW) had the greatest influence on soil biological properties. The activity of saccharase was most affected by the technology in which the stubble was left over winter (SOW), but the evaluation points slightly exceeded the evaluation threshold (Figure 13). Deep ploughing technology (CP) had the least influence on the activity of saccharase and urease; the determined point did not exceed the evaluation threshold. The highest evaluation points of the activity of urease were determined using no-till technology with cover crops (NTC).
In terms of soil agrochemical properties (0–10 cm), in fields where straw was chopped and spread (S1), using no-till technology with cover crops (NTC) was superior to other applied technologies (Figure 14). Under the no-till technology with cover crops (NTC), only the points of total nitrogen rose above the evaluation threshold (5 points). Organic carbon and organic carbon stock points rose above the evaluation threshold the highest in the no-till technology with cover crops (NTC). In the technologies that used deep ploughing (CP) and shallow ploughing (SP) as well as shallow cultivation in autumn (SC), the evaluation points did not reach the evaluation threshold when evaluating the soil agrochemical properties.
When evaluating the soil agrophysical properties (0–10 cm), in the fields where the straw was chopped and spread (S1), the evaluation points did not reach the threshold only when using the technologies of deep ploughing (CP), shallow ploughing (SP) and shallow cultivation in autumn (SC). The highest score of soil aggregate stability was found in the no-till technology without cover crops (NT) (Figure 14).
When evaluating the soil biological properties in the fields where straw was chopped and spread (S1) with different tillage technologies (0–10 cm), it can be stated that leaving the stubble over winter (SOW) had a positive effect on the activity of enzymes (Figure 14).
The calculated indicators of the complex assessment and the areas limited by the assessment points showed that the effects on the agroecosystem were greater when applying no-till technologies with (NTC) and without cover crops (NT) and leaving stubble during winter (SOW) than other comparative technologies.
In 2019–2021, when assessing the soil agrochemical properties (15–25 cm), in the fields without straw (S0), applying the no-till technologies with cover crops (NTC) and without cover crops (NT) and leaving stubble over winter (SOW) were superior to other applied technologies (Figure 13 and Figure 15). No-till technology with cover crops (NTC) influenced the increase in total nitrogen points above the evaluation threshold (5 points). Scores of organic carbon and organic carbon stocks above the assessment threshold were determined using no-till technologies with cover crops (NTC) and no-till without cover crops (NT) as well as leaving stubble over winter (SOW).
When evaluating the soil agrophysical properties (10–25 cm), in the fields without straw (S0), the evaluation points were evenly distributed, and similar trends were observed as when evaluating the soil agrochemical properties. The highest point of aggregate stability was found in no-till technology with cover crops (NTC) (Figure 15).
The evaluation points of the activity of soil enzyme saccharase did not rise above the assessment threshold when different tillage technologies, in which the straw was removed, were applied in the deeper soil layer (10–25 cm) (Figure 15). The evaluation points of the activity of soil enzyme urease rose above the evaluation threshold only in the no-till with cover crops (NTC) and no-till without cover crops (NT) technologies in which straw was removed in the deeper soil layer (10–25 cm).
When evaluating the agrochemical and agrophysical soil properties (10–25 cm), in the fields where the straw was chopped and spread (S1), application of no-till technology with cover crops (NTC) was superior to other applied technologies (Figure 16). The sustainability points of total nitrogen, organic carbon, organic carbon stocks, and soil aggregate stability of no-till with cover crops (NTC) rose above the evaluation threshold (5 points). When evaluating the agrophysical properties of the soil, the evaluation scores were unevenly distributed.
When evaluating the activity of soil saccharase (10–25 cm), in fields where straw was chopped and spread (S1), the evaluation points did not reach the threshold only using the technologies of deep ploughing (CP) and shallow ploughing (SP) (Figure 16). The evaluation points of the activity of soil enzyme urease rose above the evaluation threshold only in the fields of shallow ploughing (SP) technology.
Considering the indicators of the complex evaluation and the areas limited by the evaluation points, it can be said that the effects of applying the technology of no-till with cover crops (NTC) on the agroecosystem were higher than those of other comparative technologies.
The integrated soil-function assessment provides strong quantitative separation among systems. In the 10–25 cm layer (2019–2021; S0), CEI values were CP = 3.23, SP = 3.07, and SC = 3.66, while conservation agriculture values were clearly higher: SOW = 5.70, NTC = 5.68, and NT = 5.28.

4. Discussion

From the perspective of cereal functionality, the key question is not only whether soil management changes grain composition, but whether it shifts the traits that determine processing performance. In our long-term study, the dominant signal was the straw × tillage interaction (A × B): under straw retention (S1), no-till/direct seeding improved yields, while under straw removal (S0), simplified tillage systems tended to reduce yields. Therefore, processing-related quality of grains should be interpreted within an agronomically feasible “management package”, not as isolated mechanical operations. Across both cereals, the grain quality dataset mainly indicates stability of key processing proxies under conservation agriculture rather than universal improvement. Shallow cultivation (SC) showed trait-specific trade-off signals, most visible as reduced gluten/sedimentation proxies and higher starch content. Several of the evaluated traits can be interpreted as “functionality proxies” rather than only agronomic descriptors. In wheat, wet gluten and sedimentation are more directly connected to dough strength and baking suitability than protein concentration alone, because they reflect not only the amount but also the functional performance of storage proteins [42,43,44,45,46].

4.1. Yield Potential and the Straw X Tillage Effect

The magnitude and direction of yield responses to residue management and tillage system strategies indicate interactions between the two. Tested technologies should be considered as management packages rather than isolated mechanical operations. In practical terms, straw retention appears to act as an enabling practice for the productivity of no-till systems, whereas straw removal shifts the balance towards neutral or negative yield outcomes, especially for no-till variants. High, stable yields of agricultural systems support resilient food chains. Processing-related grain quality traits are relevant only when the system can reliably deliver grain output. Therefore, all grain quality comparisons are interpreted alongside the straw-conditioned feasibility of producing adequate quantities of grain under a given technology, emphasizing A×B as a key result in itself (i.e., quality outcomes must be judged within an agronomically feasible production package).
Kinderienė points out that the application of no-till sowing technologies significantly reduces soil erosion and improves moisture retention, therefore positively affecting the yield of cereals (both barley and wheat) [47]. Our results confirm these findings: no-till sowing and no-till with cover crops in fields where straw was chopped and spread significantly (at *—p ≤ 0.05 > 0.01, **—p ≤ 0.01 > 0.001) increased the yield of spring barley and winter wheat compared to deep ploughing technology. It was found that in 2020, winter wheat yield correlated r = 0.95 p ≤ 0.01 with soil sucrase activity in the 0–10 cm layer when straw was added. The same trend was observed in 2021: spring barley yield correlated r = 0.86 p ≤ 0.05 with soil sucrase activity in the 0–10 cm layer when straw was added.
In barley, hectolitre mass is commonly used as a physical quality indicator relevant to grading and milling performance, while starch concentration relates to end-use pathways where the carbohydrate fraction dominates (e.g., malting or starch-based processing) [48]. This interaction provides the agronomic context for interpreting processing-related traits, because functionality matters only when yield delivery is feasible within a given management package. Direct seeding is known for its impact on soil moisture retention. Kinderienė [39] notes that during direct seeding, the soil is better protected from erosion and moisture loss compared to traditional tillage methods. As a result, cereals can develop leaf assimilation area faster and more effectively, which is directly related to photosynthesis processes and overall plant productivity [49].
Meteorological conditions may have had a negative impact on establishment in 2021. After spring barley was sown (21 April 2021), very little precipitation fell, which negatively affected germination and subsequently yield. According to Gutterman, seed germination depends on environmental factors, since these factors regulate germination time and the duration of the plant’s life cycle [50].

4.2. Qualitative Indicators of Cereal Grains

For the food industry, these crop responses are key because they govern how the plant grows and fills the grain, which ultimately decides between starch deposition and protein formation. Therefore, below, the productivity discussion is intentionally linked to processing-relevant grain traits (test weight/hectolitre mass, starch, and wheat functionality proxies such as wet gluten and sedimentation). Among the proteins found in wheat grain, gluten proteins are probably of the greatest technological importance [51]. At the molecular level, gluten forms a spatial network of polypeptide chains, linked together by cross-links between molecules [52]. Gluten forms viscoelastic membranes that maintain the proper consistency and structure of the dough, and also contributes to the spongy texture of bread crumbs [15]. Achremowicz et al. [53] state that a gluten index above 95 characterizes gluten that is too hard, a gluten index with a value range of 65–95 is suitable for baking purposes, and below 50, gluten is considered too soft and weak. Cacak–Pietrzak [54] states that wheat flours with a wet gluten content of less than 25% should not be used in baking. Therefore, in order to ensure this level of gluten in flour, the minimum amount of gluten in grain should be approximately 27%. Cacak–Pietrzak et al. [4] believe that one of the main criteria for assessing the technological suitability of wheat grain is the assessment of protein and gluten content. According to Borkowska et al. [55] and Małecka and Blecharczyk [56], changes in the wet gluten content of spring and winter wheat grains depend on the weather conditions during the years of research. Sunny weather with moderate rainfall and high temperatures is most favourable for the formation of large amounts of gluten proteins [57]. The mechanical strength of gluten is weakened by thermal stress, when the synthesis of gliadin proteins proceeds faster than that of glutenin proteins [58].

4.3. Wheat Functionality Proxies: Protein vs Wet Gluten vs Sedimentation vs Starch

The Zeleny sedimentation test is closely linked to quality and quantity of gluten. A higher sedimentation index indicates a higher proportion of gluten proteins in the flour, especially high-molecular-weight glutenin, which has exceptional swelling properties and determines good baking quality [59]. Our research found that in 2020, winter wheat sedimentation correlated r = 0.84 p ≤ 0.05 with gluten removal from straw. As the wet gluten content increases, the sedimentation rate also increases. In most cases, there is a positive correlation between these indicators: the higher the gluten content, the higher the sedimentation rate. Studies by other scientists show that the sedimentation index value is a varietal characteristic, which is confirmed by the results of studies by Cacak–Pietrzak et al. [51]. The Zeleny sedimentation test has long been used to estimate bread-baking and gluten quality, and it has been shown to relate to bread quality outcomes such as loaf volume and crumb characteristics [60], while wet gluten is widely applied as an indicator of the functional gluten fraction relevant for wheat processing performance [61]. For grain, specific weight/hectolitre mass is a standard physical quality attribute and has been linked to malting and processing performance (e.g., extract/yield-related traits) [3,62]. Finally, because environmental conditions during grain development influence protein synthesis and starch deposition, soil management practices that buffer water and nutrient dynamics can affect the protein–gluten–starch balance through grain-filling pathways, thereby shaping functionality-relevant trait profiles [63].
Our research showed that the protein content of winter wheat grains was not significantly affected by the selected tillage system. Similar results were obtained by Kraska et al. [64], who did not show that tillage systems (CT and NT) affected wheat grain quality parameters. However, other researchers obtained opposite results. Ali et al. [65] and Amato et al. [23] found significantly lower protein content in wheat grains under NT compared to conventional tillage (CT) and reduced-tillage (RT) systems. Grigoras et al. [66] obtained different results. According to the authors’ study, the average gluten content in grains obtained using the NT system was 0.15% and 0.67% higher, respectively, compared to CT. In our dataset, under S0 (straw removed), wet gluten tended to be higher under direct seeding than under CP. Woźniak and Rachoń indicate that hectolitre weight is higher under conventional tillage compared to zero tillage, indicating that tillage technologies alter soil structure, moisture, and nutrient availability, which together affect grain quality [46].

4.4. Barley: Hectolitre Mass as the Clearest Discriminator + Starch

Our research shows that the hectolitre mass of spring barley grains can be significantly (*—p ≤ 0.05 > 0.01, **—p ≤ 0.01 > 0.001 and ***—p ≤ 0.001) lower than in deeply ploughed fields under some simplified treatments. Furthermore, Faměra et al. suggest that intensive tillage can lead to lower starch content in grains; at the same time, zero or reduced tillage can help increase starch content [48]. Our study results show that simplified tillage systems with chopped and spread straw increased the starch content of spring barley grains. Consistent with the results, hectolitre mass was the most discriminating barley proxy: in 2021, SP increased hectolitre mass by about 3.1–5.1% relative to CP, while some variants (notably SOW and NT) showed decreases (up to ~14.8%), depending on straw background. Barley hectorite weight is one of the most important indicators in assessing the quality of malting barley for malt production. The higher the hectorite weight, the larger the grains, which determines the higher malt yield per ton of barley. To achieve a high hectorite weight, sub-balanced nitrogen fertilization, disease protection and sowing time are important so that the grains mature properly [27].

4.5. Soil-Function Co-Benefits (CEI) + Practical Implication for Food Supply Chains

Across both cereals, the long-term system context (since 1999) is likely to amplify “management legacies” that are not captured in short trials—particularly where straw retention is combined with reduced/no tillage. Grain traits often respond to the integrated soil–plant continuum (water status, N cycling, stand establishment), rather than to a single input. In practice, the key message supported by the present results is that yield benefits under straw retention and simplified/no-till strategies can be achieved without consistent penalties in the main grain quality indicators (protein, starch, wheat gluten proxies), although some trait- and year-specific shifts can occur and should be interpreted in the context of weather variability and establishment conditions.
Taken together, higher CEI under NTC/NT/SOW indicates soil-function gains that can support resilient cereal raw material supply, while the grain quality dataset suggests that these gains can be achieved without systematic penalties in key processing proxies—especially when straw is retained.
Scientists claim that grain quality indicators also depend on soil cultivation [45]. Selecting a variety with favourable characteristics does not necessarily guarantee the desired quality and yield, as the yield potential of crops can be fully exploited when they are provided with optimal growth conditions [46]. This goal can be achieved by selecting the right crop rotation and applying appropriate agronomic techniques. This is very important for yield and reliability, which indirectly affects grain quality and commercial value [67]. Tillage has a significant impact on grain yield and quality, as it changes the physical, chemical, and biological properties of the soil, which directly affect plant growth and development [68]. When choosing tillage technology, efforts are made to create optimal conditions for obtaining a higher grain yield with higher quality parameters [69]. When choosing tillage technology, it is necessary to take into account the economic aspect and the impact of tillage on soil properties. Growing wheat in a conventional system increases production costs and soil density; for these reasons, it is not sufficiently aerated [70]. The destruction of the upper soil layer and reduced soil biodiversity are also reasons for abandoning deep-tillage technology [71].
A resilience-oriented soil management package (reduced disturbance combined with residue retention and/or cover crops) can affect cereal functionality through two main pathways: (i) buffering water stress and (ii) modifying N availability and the protein–starch balance during grain filling. Increasing soil organic matter is widely associated with improved soil water retention, which can enhance crop performance under drought-prone conditions [72]. Because drought and heat stress are known to alter wheat grain quality traits (including protein-related and other end-use-relevant properties), practices that improve soil water status can indirectly stabilize grain “functionality” even when mean trait differences between tillage systems are small in individual years [73]. The importance of soil-conserving practices is not necessarily linked with universal increase in protein/gluten indicators, but rather reduced production risk and more consistent delivery of cereal raw material for processing chains across variable seasons.
Long-term soil management also influences environmental outcomes such as erosion protection and soil carbon dynamics, which underpin resilient production systems. Evidence from winter wheat systems indicates that tillage regimes can affect both yield and classical processing proxies (protein, wet gluten, Zeleny sedimentation), and these quality responses often depend on management intensity and site/season conditions rather than showing one universal direction [19]. At the same time, environmental impacts are not always unidirectional: residue retention and reduced tillage may increase soil health benefits but can also increase greenhouse gas emissions (e.g., N2O) under some conditions, which is relevant when discussing sustainability of resilient cereal supply chains [74].
Beyond agronomic feasibility, reduced tillage combined with straw retention is increasingly relevant from a food-system and market perspective, because it links primary production with resilience and value creation along supply chains [75]. Residue retention and reduced soil disturbance are widely framed as environmentally friendly practices that support soil protection and system resilience to climate change’s negative effects. Reduced tillage and crop residue incorporation support soil organic matter and related water-retention functions. This in turn allows agricultural systems to maintain productive capacity under water and climate stress [72]. In our long-term system, this “package effect” is clearly visible: yield benefits of no-till/direct seeding were expressed mainly under straw retention, whereas straw removal tended to weaken the productivity of reduced-disturbance variants. This pattern is consistent with global evidence that no-till outcomes depend strongly on accompanying practices (including residue management), and that residue retention can be an important modifier of yield responses [76]. The main processing-related proxies were broadly stable across systems, suggesting that environmentally beneficial management can be pursued without systematic penalties in cereal functionality indicators. Many consumers incorporate environmental motives into their food choices, and environmentally friendly production practices can be perceived as an added value of food products [22]. Consumers are often willing to pay a premium for sustainability attributes, providing an additional rationale for supply chains that can document soil-conserving management without compromising processing suitability [77].
Our calculated complex assessment indicators (CEI), consisting of the mean, standard deviation (EP), and area of all assessment scores (EP) not exceeding the assessment threshold, standard deviation, and assessment score bounds, show that the positive impact of no-till technologies with catch crops (NTC) is greater than that of systems with other technology levels.

5. Conclusions

Long-term soil management affected cereal performance primarily through a tillage × straw retention interaction. Yield benefits of reduced-disturbance systems were expressed mainly under straw retention (S1): no-till variants increased winter wheat and spring barley yield by ~24.1–37.5% relative to deep ploughing, and winter wheat yield also increased when stubble was left over winter (SOW). Under straw removal (S0), the same conservation-oriented systems tended to reduce yield, indicating that residue retention is a key enabling component of sustainable reduced-tillage packages. With respect to cereal functionality, the main processing-related indicators were broadly stable across the long-term tillage systems. Winter wheat protein showed weak and inconsistent separation among technologies, while wheat functionality proxies (wet gluten and sedimentation) displayed mostly directional trends rather than consistent significant differences versus the control within straw backgrounds. At the same time, the strong coherence between wheat functionality proxies (wet gluten–sedimentation correlation) supports their use as an integrated indicator set when interpreting management effects on end-use potential. The most responsive grain quality trait in the dataset was spring barley hectolitre mass, which differentiated tillage systems more clearly than compositional traits. Shallow ploughing increased hectolitre mass by ~3.1–5.1% relative to deep ploughing, whereas selected conservation variants (notably SOW and NT) reduced hectolitre mass in some contexts (reported decreases up to ~14.8%). This highlights that sustainable soil management can involve trait-specific trade-offs, and that “best” practice depends on whether the priority is physical grain quality, composition, or yield stability. The results support framing sustainable soil management for cereal functionality as a system package: residue retention combined with reduced disturbance can maintain grain quality proxies while improving productivity, thereby strengthening the reliability of cereal raw material supply for processing chains. When translating these findings into recommendations, straw retention should be treated as a core practice for no-till/direct-seeding strategies, while quality targets (e.g., wheat protein functionality vs barley physical density) should guide the choice among reduced-tillage options. In order to obtain more targeted results, this study needs to be extended, because it depends not only on the type of soil cultivation and the incorporation of straw, but also on meteorological conditions.
The study’s primary conclusion is that the success of no-till seeding systems is inseparable from straw retention: when direct drilling is combined with leaving straw on the field, wheat and barley yields increase by 24.1–37.5%, whereas removing straw tends to reduce yields under the same technologies. Although sustainable farming has no significant negative impact on the technological properties of wheat (such as protein or gluten content), it involves specific trade-offs, such as a reduction in barley hectolitre mass compared to shallow ploughing. Ultimately, sustainable soil management practices must be implemented as a comprehensive system package (reduced tillage combined with residue retention) to ensure long-term productivity, soil health, and the stability of the raw material supply chain.

Author Contributions

A.S. (Aušra Sinkevičienė): writing—review and editing, writing—original draft, validation, methodology, investigation, data curation. V.B.: writing—review and editing, methodology, investigation. V.S.: methodology, investigation, data curation. A.S. (Alfredas Sinkevičius): investigation, writing—original draft. A.M.: methodology, writing—review and editing. M.W.: supervision, writing—review and editing. A.K.B.: resources, conceptualization, writing—review and editing, supervision, funding acquisition. R.K.: writing—review and editing, writing—original draft, validation, methodology, investigation, data curation. All authors have read and agreed to the published version of the manuscript.

Funding

This research received no external funding.

Institutional Review Board Statement

Not applicable.

Informed Consent Statement

Not applicable.

Data Availability Statement

The original contributions presented in this study are included in the article. Further inquiries can be directed to the corresponding authors.

Conflicts of Interest

The authors declare no conflicts of interest in this study.

References

  1. Sobczyk, A.; Kaszuba, J. Technologia Zbóż. Część 1: Ocena Wartości Technologicznej Ziarna, Przygotowanie do Przemiału i Przemiał Ziarna; Wydawnictwo Uniwersytetu Rzeszowskiego: Rzeszów, Poland, 2015. [Google Scholar]
  2. Yazar, G.; Kokini, J.L. Recent Advances in the Assessment of Cereal and Cereal-Based Product Quality. Foods 2025, 14, 1220. [Google Scholar] [CrossRef]
  3. Rani, H.; Bhardwaj, R.D. Quality attributes for barley malt: “The backbone of beer”. J. Food Sci. 2021, 86, 3322–3340. [Google Scholar] [CrossRef] [PubMed]
  4. Cacak-Pietrzak, G.; Ceglinska, A.; Haber, T. Wartosc technologiczna wybranych odmian pszenicy ozimej w zaleznosci od zroznicowanego nawozenia azotowego. Pamiętnik Puławski 1999, 118, 45–56. [Google Scholar]
  5. Podolska, G.; Grabiński, J. Możliwość Pogodzenia Kryteriów Jakościowych Ziarna Zbóż z Zasadami Dobrej Praktyki Rolniczej. Mat. Szkol. 84/02 „Wdrażanie Nowych Proekologicznych Technologii w Zakresie Produkcji Roślin Uprawnych”; IUNG: Puławy, Poland, 2002; pp. 167–182. [Google Scholar]
  6. Podolska, G.; Sulek, A. Glowne elementy technologii produkcji decydujace o wysokiej jakosci ziarna pszenicy. Pamiętnik Puławski 2002, 130, 597–605. [Google Scholar]
  7. Ralcewicz, M.; Knapowski, T. Wplyw zroznicowanego nawozenia azotem na wysokosc plonu i wartosc technologiczna pszenicy jarej. Ann. Univ. Mariae Curie-Skłodowska. Sect. E. Agric. 2004, 59, 969–978. [Google Scholar]
  8. Woźniak, A.; Staniszewski, M. Wpływ warunków pogodowych na jakość technologiczną ziarna pszenicy jarej cv. Opatka i pszenicy ozimej cv. Korweta. Acta Agrophysica 2007, 9, 525–540. [Google Scholar]
  9. Knapowski, T.; Ralcewicz, M.; Spychaj–Fabisiak, E.; Ložek, O. Ocena jakości ziarna pszenicy ozimej uprawianej w warunkach zróżnicowanego nawożenia azotem. Fragm. Agron. 2010, 27, 73–80. [Google Scholar]
  10. Muste, S.; Modoran, C.; Man, S.; Muresan, V.; Birou, A. The influence of wheat genotype on its quality. J. Agroaliment. Process. Technol. 2010, 16, 99–103. [Google Scholar]
  11. Hrušková, M.; Švec, I.; Kocourková, Z. Interaction between wheat variety and harvest year analysed by statistical methods. Cereal Technol. 2011, 4, 152–159. [Google Scholar]
  12. Najewski, A. Wartość technologiczna odmian pszenicy. Przegląd Zbożowo-Młynarski 2011, 55, 2–15. [Google Scholar]
  13. Węgrzyn, S.; Gut, M.; Cygankiewicz, A.; Ptak, B. Odporność rodów i odmian pszenicy (Triticum aestivum L.) na porastanie. Część I. Pszen. Ozima. Biul. IHAR 1991, 180, 121–129. [Google Scholar]
  14. Cacak-Pietrzak, G. Studia nad wpływem ekologicznego i konwencjonalnego systemu produkcji roślinnej na wartość technologiczną wybranych odmian pszenicy ozimej. Rozpr. Nauk. I Monogr. Szkoła Główna Gospod. Wiej. W Warszawie 2011, 380, 1–83. [Google Scholar]
  15. Wesołowska–Trojanowska, M.; Tomczyńska–Mleko, M.; Mazurkiewicz, J.; Kowalczyk, K.; Leśniowska–Nowak, J.; Szafranek, M.; Róg, S.; Mleko, S. Wybrane właściwości fizykochemiczne glutenu otrzymanego z nowych rodów pszenicy. Ann. Univ. Mariae Curie-Skłodowska. Sect. E. Agric. 2014, 69, 15–30. [Google Scholar] [CrossRef]
  16. Pokharel, D.; Jha, R.K.; Tiwari, T.P.; Gathala, M.K.; Shrestha, H.K.; Panday, D. Is conservation agriculture a potential option for cereal-based sustainable farming system in the Eastern Indo-Gangetic Plains of Nepal? Cogent Food Agric. 2018, 4, 1557582. [Google Scholar] [CrossRef]
  17. Pagnani, G.; Galieni, A.; D’Egidio, S.; Visioli, G.; Stagnari, F.; Pisante, M. Effect of soil tillage and crop sequence on grain yield and quality of durum wheat in Mediterranean areas. Agronomy 2019, 9, 488. [Google Scholar] [CrossRef]
  18. Ahmadi, H.; Mirseyed-Hosseini, H.; Moshiri, F.; Alikhani, H.A.; Etesami, H. Impact of varied tillage practices and phosphorus fertilization regimes on wheat yield and grain quality parameters in a five-year corn-wheat rotation system. Sci. Rep. 2024, 14, 14717. [Google Scholar] [CrossRef] [PubMed]
  19. Šíp, V.; Vavera, R.; Chrpová, J.; Kusá, H.; Růžek, P. Winter wheat yield and quality related to tillage practice, input level and environmental conditions. Soil Tillage Res. 2013, 132, 77–85. [Google Scholar] [CrossRef]
  20. Woźniak, A. Effect of crop rotation and cereal monoculture on the yield and quality of winter wheat grain and on crop infestation with weeds and soil properties. Int. J. Plant Prod. 2019, 13, 177–182. [Google Scholar] [CrossRef]
  21. Gawęda, D.; Haliniarz, M. Grain yield and quality of winter wheat depending on previous crop and tillage system. Agriculture 2021, 11, 133. [Google Scholar] [CrossRef]
  22. Vermeir, I.; Weijters, B.; De Houwer, J.; Geuens, M.; Slabbinck, H.; Spruyt, A.; Van Kerckhove, A.; Van Lippevelde, W.; De Steur, H.; Verbeke, W. Environmentally sustainable food consumption: A review and research agenda from a goal-directed perspective. Front. Psychol. 2020, 11, 1603, Correction in Front. Psychol. 2020, 11, 585387. https://doi.org/10.3389/fpsyg.2020.585387. [Google Scholar] [CrossRef] [PubMed]
  23. Amato, G.; Ruisi, P.; Frenda, A.S.; Di Miceli, G.; Saia, S.; Plaia, A.; Giambalvo, D. Long-term tillage and crop sequence effects on wheat grain yield and quality. Agron. J. 2013, 105, 1317–1327. [Google Scholar] [CrossRef]
  24. Kanapickas, A.; Vagusevičienė, I.; Juknys, R.; Jusetovienė, G. Effects of climatic and cultivar changes on winter wheat phenology in central Lithuania. Biometeorology 2022, 66, 2009–2020. [Google Scholar]
  25. Medda, S.; Fadda, A.; Mulas, M. Influence of climate change on metabolism and biological characteristics in perennial woody fruit crops in the Mediterranean environment. Horticulturae 2022, 8, 273. [Google Scholar] [CrossRef]
  26. Saab, M.T.; Houssemeddine Sellami, M.; Giorio, P.; Basile, A.; Bonfante, A.; Rouphael, Y.; Albrizio, R. Assessing the potential of cereal production systems to adapt to contrasting weather conditions in the Mediterranean region. Agronomy 2019, 9, 380–393. [Google Scholar] [CrossRef]
  27. Sinkevičius, A. Žemės Dirbimo Technologijų Ilgalaikis Poveikis Agroekosistemų Tvarumui. Ph.D. Thesis, Vytauto Didžiojo Universitetas, Žemės Ūkio Akademija, Kaunas, Lithuania, 2023; p. 275. [Google Scholar]
  28. Sarkar, S.; Skalicky, M.; Hossain, A.; Brestic, M.; Saha, S.; Garai, S.; Brahmachari, K. Management of crop residues for improving input use efficiency and agricultural sustainability. Sustainability 2020, 12, 9808. [Google Scholar] [CrossRef]
  29. Lal, R.; Reicosky, D.C.; Hanson, J.D. Evolution of the plow over 10,000 years and the rationale for no-till farming. Soil Tillage Res. 2007, 93, 1–12. [Google Scholar] [CrossRef]
  30. Šarauskis, E.; Romaneckas, K.; Jasinskas, A.; Kimbirauskienė, R.; Naujokienė, V. Improving energy efficiency and environmental mitigation through tillage management in faba bean production. Energy 2020, 209, 118453. [Google Scholar] [CrossRef]
  31. Shao, Y.; Xie, Y.; Wang, C.; Yue, J.; Yao, Y. Effects of different soil conservation tillage approaches on soil nutrients, water use and wheat-maize yield in rainfed dry-land regions of North China. Eur. J. Agron. 2016, 81, 37–45. [Google Scholar] [CrossRef]
  32. Fuentes, J.P.; Flury, M.; Huggins, D.R.; Bezdicek, D.F. Soil water and nitrogen dynamics in dryland cropping systems of Washington State. Soil Tillage Res. 2003, 71, 33–47. [Google Scholar] [CrossRef]
  33. Šimanskaitė, D. Arimo ir beplūgio žemės dirbimo įtaka dirvožemio fizikinėms savybėms ir augalų produktyvumui. Žemės Ūkio Moksl. 2007, 14, 9–19. [Google Scholar]
  34. Cesevičienė, J.; Mašauskienė, A. Žieminių kviečių grūdų technologinių savybių kitimas sandėliavimo metu. Žemdirbystė 2009, 96, 154–169. [Google Scholar]
  35. Känkänen, H.; Alakukku, L.; Salo, Y.; Pitkänen, T. Growth and yield of spring cereals during transition to zero tillage on clay soils. Eur. J. Agron. 2011, 34, 35–45. [Google Scholar] [CrossRef]
  36. Sainju, U.M.; Lenssen, A.W.; Caesar-TonThat, T.; Evans, R.G. Dryland crop yields and soil organic matter as influenced by long-term tillage and cropping sequence. Agron. J. 2009, 101, 243–251. [Google Scholar] [CrossRef]
  37. Miller, G.A.; Rees, R.M.; Griffiths, B.S.; Ball, B.C.; Cloy, J.M. The sensitivity of soil organic carbon pools to land management varies depending on former tillage practices. Soil Tillage Res. 2019, 194, 104299. [Google Scholar]
  38. IUSSWorking Group, World Reference Base. World Reference Base for Soil Resources 2023. In International Soil Classification System for Naming Soils and Creating Legends for Soil Maps; World Soil Resources Report; FAO: Rome, Italy, 2023; Volume 186, pp. 151–163. [Google Scholar]
  39. Instat 10. Statistics I, SPSS. 2000; IBM: Chicago, IL, USA, 2000.
  40. Leonavičienė, T. SPSS Programų Paketo Taikymas Statistiniuose Tyrimuose; Vilniaus Pedagoginio Universiteto Leidykla: Vilnius, Lithuania, 2007; p. 126. [Google Scholar]
  41. Raudonius, S. Application of statistics in plant and crop research: Important issues. Zemdirbystė-Agric. 2017, 104, 377–382. [Google Scholar]
  42. Pasha, I.; Anjum, F.M.; Morris, C.F. Grain hardness: A major determinant of wheat quality. Food Sci. Technol. Int. 2010, 16, 511–522. [Google Scholar] [CrossRef] [PubMed]
  43. Zhygunov, D.; Sots, S.; Barkovska, Y.; Liu, J.; Wang, F.; Liu, X.; Li, X. Influence of grain quality indicators on the flour quality indicators at the laboratory milling. Grain Prod. Mix. Fodder’s 2022, 22, 17–27. [Google Scholar] [CrossRef]
  44. Barros, J.; Franco, C. Efeito da adição inulina sobre as características reológicas e térmicas da farinha de trigo. Blucher Chem. Eng. Proc. 2015, 1, 3607–3614. [Google Scholar]
  45. Guo, X.; Wang, H.; Ahmad, N.; Wang, R.; Wang, X.; Li, J. Effects of 12-year cropping systems and tillage practices on crop yield and carbon trade-off in dryland Loess Plateau. Field Crops Res. 2024, 318, 109598. [Google Scholar] [CrossRef]
  46. Hellemans, T.; Landschoot, S.; Dewitte, K.; Van Bockstaele, F.; Vermeir, P.; Eeckhout, M.; Haesaert, G. Impact of crop husbandry practices and environmental conditions on wheat composition and quality: A Review. Agric. Food Chem. 2018, 66, 2491–2509. [Google Scholar]
  47. Kinderienė, I. Neariminio žemės dirbimo ir tiesioginės sėjos poveikis dirvožemio erozijos intensyvumui, struktūringumui, drėgniui ir javų derlingumui. Žemės Ūkio Moksl. 2015, 22, 133–144. [Google Scholar] [CrossRef]
  48. Faměra, O.; Mayerová, M.; Burešová, I.; Kouřimská, L.; Prášilová, M. Influence of selected factors on the content and properties of starch in the grain of non-food wheat. Plant Soil Environ. 2015, 61, 241–246. [Google Scholar] [CrossRef]
  49. Juchnevičienė, A.; Raudonius, S.; Avižienytė, D.; Romaneckas, K.; Bogužas, V. Ilgalaikio supaprastinto žemės dirbimo ir tiesioginės sėjos įtaka žieminių kviečių pasėliui. Žemės Ūkio Moksl. 2012, 19, 139–150. [Google Scholar] [CrossRef]
  50. Gutterman, Y. Drought tolerance of the dehydrated root of Schismus arabicus seedlings and regrowth after rehydration, affected by caryopsis size and duration of dehydration. Isr. J. Plant Sci. 2001, 49, 123–128. [Google Scholar] [CrossRef]
  51. Cacak-Pietrzak, G.; Sulek, A.; Gondek, E. Plonowanie oraz cechy jakościowe ziarna nowych odmian pszenicy jarej w zależności od poziomu nawożenia azotem. Zesz. Probl. Postępów Nauk Rol. 2010, 553, 11–19. [Google Scholar]
  52. Marek, K.; Mrówczyński, M. Integrowana produkcja pszenicy ozimej i jarej. Poznań IOR-PIB 2009, 1, 166. [Google Scholar]
  53. Achremowicz, B.; Borkowska, H.; Styk, B.; Grundas, S. Wplyw nawozenia azotowego na jakosc glutenu pszenicy jarej. Biul. Inst. Hod. I Aklim. Roślin 1995, 193, 29–34. [Google Scholar]
  54. Cacak-Pietrzak, G. Wykorzystanie pszenicy w roznych galeziach przemyslu spozywczego-wymagania technologiczne. Przegląd Zbożowo-Młynarski 2008, 52, 11–13. [Google Scholar]
  55. Borkowska, H.; Grundas, S.; Styk, B. Wysokosc i jakosc plonow niektorych odmian pszenicy w zaleznosci od nawozenia azotowego. Ann. Univ. Mariae Curie-Skłodowska. Sect. E. Agric. 2002, 57, 99–103. [Google Scholar]
  56. Malecka, I.; Blecharczyk, A. Wplyw systemow uprawy roli na jakosc ziarna pszenicy ozimej. Pamiętnik Puławski 2004, 135, 181–187. [Google Scholar]
  57. Stankowski, S.; Rutkowska, A. Kształtowanie się cech jakościowych ziarna i mąki pszenicy ozimej w zależności od dawki i terminu nawożenia azotem. Acta Sci. Polonorum. Agric. 2006, 5, 53–61. [Google Scholar]
  58. Daniel, C.; Triboi, E. Effects of temperature and nitrogen nutrition on the grain composition of winter wheat: Effects on gliadin content and composition. J. Cereal Sci. 2000, 32, 45–56. [Google Scholar] [CrossRef]
  59. Jurga, R. Wartosc technologiczna ziarna pszenicy. Przegląd Zbożowo-Młynarski 1994, 38, 19–21. [Google Scholar]
  60. Rózylo, R.; Laskowski, J. Predicting bread quality (bread loaf volume and crumb texture). Pol. J. Food Nutr. Sci. 2011, 61, 61–67. [Google Scholar] [CrossRef]
  61. Kaushik, R.; Kumar, N.; Sihag, M.K.; Ray, A. Isolation, characterization of wheat gluten and its regeneration properties. J. Food Sci. Technol. 2015, 52, 5930–5937. [Google Scholar] [CrossRef]
  62. Hoyle, A.; Brennan, M.; Pitts, N.; Jackson, G.E.; Hoad, S. Relationship between specific weight of spring barley and malt quality. J. Cereal Sci. 2020, 95, 103006. [Google Scholar] [CrossRef]
  63. DuPont, F.M.; Altenbach, S.B. Molecular and biochemical impacts of environmental factors on wheat grain development and protein synthesis. J. Cereal Sci. 2003, 38, 133–146. [Google Scholar] [CrossRef]
  64. Kraska, P.; Andruszczak, S.; Kwieci ´nska-Poppe, E.; Pałys, E. The effect of tillage systems and catch crops on the yield, grain quality and health of spring wheat. Acta Sci. Pol. Agric. 2014, 13, 21–38. [Google Scholar]
  65. Ali, S.A.; Tedone, L.; Verdini, L.; Cazzato, E.; De Mastro, G. Wheat response to no-tillage and nitrogen fertilization in a long-term faba bean-based rotation. Agron. 2019, 9, 2–18. [Google Scholar] [CrossRef]
  66. Grigoras, M.A.; Popescu, A.; Pamfil, D.C.; Has, I.; Gidea, M. Influence of no-tillage agriculture system and fertilization on wheat yield and grain protein and gluten contents. J. Food Agric. Environ. 2012, 10, 532–539. [Google Scholar]
  67. Wozniak, A.; Racho, N.L. Effect of tillage systems on the yield and quality of winter wheat grain and soil properties. Agriculture 2020, 10, 405. [Google Scholar] [CrossRef]
  68. Giannitsopoulos, M.L.; Burgess, P.J.; Rickson, R.J. Effects of conservation tillage systems on soil physical changes and crop yields in a wheat-oilseed rape rotation. J. Soil Water Conserv. 2019, 74, 247–258. [Google Scholar] [CrossRef]
  69. Gaweda, D.; Nowak, A.; Haliniarz, M.; Wozniak, A. Yield and economic effectiveness of soybean grown under different cropping systems. J. Plant Prod. 2020, 14, 475–485. [Google Scholar] [CrossRef]
  70. Shahzad, M.; Hussain, M.; Farooq, M.; Farooq, S.; Jabran, K.; Nawaz, A. Economic assessment of conventional and conservation tillage practices in different wheat-based cropping systems of Punjab, Pakistan. Environ. Sci. Pollut. Res. 2017, 24, 24634–24643. [Google Scholar] [CrossRef] [PubMed]
  71. Chokor, J.U.; Ikuenobe, C.E.; Akaelu, I.A. The effect of tillage and herbicides (rimsulfuron and codal gold) on weed regeneration. Int. J. Soil Sci. 2008, 3, 164–168. [Google Scholar] [CrossRef]
  72. Lal, R. Soil organic matter and water retention. Agron. J. 2020, 112, 3265–3277. [Google Scholar] [CrossRef]
  73. Mutanda, M.; Figlan, S. Analysis of Phenotypic and Grain Quality Traits of Wheat Genotypes Under Drought-Stressed and Non-Stressed Conditions. Int. J. Plant Biol. 2025, 16, 119. [Google Scholar] [CrossRef]
  74. Jahangir, M.M.R.; Begum, R.; Jahiruddin, M.; Dawar, K.; Zaman, M.; Bell, R.W.; Richards, K.G.; Müller, C. Reduced tillage with residue retention and nitrogen application rate increase N2O fluxes from irrigated wheat in a subtropical floodplain soil. Agric. Ecosyst. Environ. 2021, 306, 107194. [Google Scholar] [CrossRef]
  75. Berbeć, A.K.; Wyzińska, M. From nutrition to energy: Evaluating the role of rye (Secale cereale L.) grain in sustainable food systems and biofuel applications. Foods 2025, 14, 1971. [Google Scholar] [CrossRef]
  76. Pittelkow, C.M.; Liang, X.; Linquist, B.A.; Van Groenigen, K.J.; Lee, J.; Lundy, M.E.; Van Kessel, C. Productivity limits and potentials of the principles of conservation agriculture. Nature 2015, 517, 365–368. [Google Scholar] [CrossRef]
  77. Li, S.; Kallas, Z. Meta-analysis of consumers’ willingness to pay for sustainable food products. Appetite 2021, 163, 105239. [Google Scholar] [CrossRef]
Figure 1. Meteorological conditions during cultivation at the Kaunas Weather Meteorological Station in 2020.
Agriculture 16 00990 g001
Figure 2. Meteorological conditions during cultivation at the Kaunas Weather Meteorological Station in 2021.
Agriculture 16 00990 g002
Figure 3. Long-term impact of technology on the winter wheat and spring barley yield, 2020–2021. Note: Factor A: S0—without straw; S1—with straw. Factor B: CP—conventional ploughing; SP—shallow ploughing; SC—shallow cultivation; SOW—stubble over winter; NTC—no-till with cover crops; NT—no-till without cover crops. Differences significant at *—p ≤ 0.05 > 0.01, **—p ≤ 0.01 > 0.001. Vertical bars indicate standard deviation.
Agriculture 16 00990 g003
Figure 4. Protein content in winter wheat under different residue (straw) management and different tillage systems, 2020. Note: Factor A: S0—without straw; S1—with straw. Factor B: CP—conventional ploughing; SP—shallow ploughing; SC—shallow cultivation; SOW—stubble over winter; NTC—no-till with cover crops; NT—no-till without cover crops. Vertical bars indicate standard deviation.
Agriculture 16 00990 g004
Figure 5. Long-term effects of technology on wet gluten content in grain of winter wheat, 2020. Note: Factor A: S0—without straw; S1—with straw. Factor B: CP—conventional ploughing; SP—shallow ploughing; SC—shallow cultivation; SOW—stubble over winter; NTC—no-till with cover crops; NT—no-till without cover crops. No significant differences at p > 0.05; Fisher LSD test vs control. Vertical bars indicate standard deviation.
Agriculture 16 00990 g005
Figure 6. Long-term effects of technology on grain sedimentation value of winter wheat, 2020. Note: Factor A: S0—without straw; S1—with straw. Factor B: CP—conventional ploughing; SP—shallow ploughing; SC—shallow cultivation; SOW—stubble over winter; NTC—no-till with cover crops; NT—no-till without cover crops. No significant differences at p > 0.05; Fisher LSD test vs. control. Vertical bars indicate standard deviation.
Agriculture 16 00990 g006
Figure 7. Long-term effects of technology on grain moisture of winter wheat, 2020. Note: Factor A: S0—without straw; S1—with straw. Factor B: CP—conventional ploughing; SP—shallow ploughing; SC—shallow cultivation; SOW—stubble over winter; NTC—no-till with cover crops; NT—no-till without cover crops. No significant differences at p > 0.05; Fisher LSD test vs. control. Vertical bars indicate standard deviation.
Agriculture 16 00990 g007
Figure 8. Long-term effects of technology on the starch content of winter wheat grains, 2020. Note: Factor A: S0—without straw; S1—with straw. Factor B: CP—conventional ploughing; SP—shallow ploughing; SC—shallow cultivation; SOW—stubble over winter; NTC—no-till with cover crops; NT—no-till without cover crops. No significant differences at p > 0.05; Fisher LSD test vs. control. Vertical bars indicate standard deviation.
Agriculture 16 00990 g008
Figure 9. Long-term effects of technology on hectolitre grain mass of spring barley, 2021. Note: Factor A: S0—without straw; S1—with straw. Factor B: CP—conventional ploughing; SP—shallow ploughing; SC—shallow cultivation; SOW—stubble over winter; NTC—no-till with cover crops; NT—no-till without cover crops. Differences significant at *—p ≤ 0.05 > 0.01; **—p ≤ 0.01 > 0.001; and ***—p ≤ 0.001. Vertical bars indicate standard deviation.
Agriculture 16 00990 g009
Figure 10. Long-term impact of technology on the protein content of spring barley grains, 2021. Note: Factor A: S0—without straw; S1—with straw. Factor B: CP—conventional ploughing; SP—shallow ploughing; SC—shallow cultivation; SOW—stubble over winter; NTC—no-till with cover crops; NT—no-till without cover crops. Differences significant at *—p ≤ 0.05 > 0.01; **—p ≤ 0.01 > 0.001; and ***—p ≤ 0.001. Vertical bars indicate standard deviation.
Agriculture 16 00990 g010
Figure 11. Long-term effects of technology on the starch content of spring barley grains, 2021. Note: Factor A: S0—without straw; S1—with straw. Factor B: CP—conventional ploughing; SP—shallow ploughing; SC—shallow cultivation; SOW—stubble over winter; NTC—no-till with cover crops; NT—no-till without cover crops. Differences significant at **—p ≤ 0.01 > 0.001. Vertical bars indicate standard deviation.
Agriculture 16 00990 g011
Figure 12. Long-term effects of technology on grain moisture of spring barley, 2021. Note: Factor A: S0—without straw; S1—with straw. Factor B: CP—conventional ploughing; SP—shallow ploughing; SC—shallow cultivation; SOW—stubble over winter; NTC—no-till with cover crops; NT—no-till without cover crops. Differences significant at **—p ≤ 0.01 > 0.001. Vertical bars indicate standard deviation.
Agriculture 16 00990 g012
Figure 13. Complex assessment of long-term effects of tillage technologies in soil without straw in the 0–10 cm layer, 2019–2021. Note: Factor A: S0—without straw; S1—with straw. Factor B: CP—conventional ploughing; SP—shallow ploughing; SC—shallow cultivation; SOW—stubble over winter; NTC—no-till with cover crops; NT—no-till without cover crops. CEI—complex evaluation indices; *—the average of evaluation points (EP); **—standard deviation of EP; ***—standard deviation of the average of the evaluation points below the evaluation threshold.
Agriculture 16 00990 g013
Figure 14. Complex assessment of long-term effects of tillage technologies in soil with straw in the 0–10 cm layer, 2019–2021. Note: Factor A: S0—without straw; S1—with straw. Factor B: CP—conventional ploughing; SP—shallow ploughing; SC—shallow cultivation; SOW—stubble over winter; NTC—no-till with cover crops; NT—no-till without cover crops. CEI—complex evaluation indices; *—the average of evaluation points (EP); **—standard deviation of EP; ***—standard deviation of the average of the evaluation points below the evaluation threshold.
Agriculture 16 00990 g014
Figure 15. Complex assessment of long-term effects of tillage technologies in soil without straw in the 10–25 cm layer, 2019–2021. Note: Factor A: S0—without straw; S1—with straw. Factor B: CP—conventional ploughing; SP—shallow ploughing; SC—shallow cultivation; SOW—stubble over winter; NTC—no-till with cover crops; NT—no-till without cover crops. CEI—complex evaluation indices; *—the average of evaluation points (EP); **—standard deviation of EP; ***—standard deviation of the average of the evaluation points below the evaluation threshold.
Agriculture 16 00990 g015
Figure 16. Complex assessment of long-term effects of tillage technologies in soil with straw in the 10–25 cm layer, 2019–2021. Note: Factor A: S0—without straw; S1—with straw. Factor B: CP—conventional ploughing; SP—shallow ploughing; SC—shallow cultivation; SOW—stubble over winter; NTC—no-till with cover crops; NT—no-till without cover crops. CEI—complex evaluation indices; *—the average of evaluation points (EP); **—standard deviation of EP; ***—standard deviation of the average of the evaluation points below the evaluation threshold.
Agriculture 16 00990 g016
Disclaimer/Publisher’s Note: The statements, opinions and data contained in all publications are solely those of the individual author(s) and contributor(s) and not of MDPI and/or the editor(s). MDPI and/or the editor(s) disclaim responsibility for any injury to people or property resulting from any ideas, methods, instructions or products referred to in the content.