Article

Efficiency of Factor Analysis-Based Selection Indices Under Varying Heritability and Trait-Environment Correlations


by
Wanessa Alves Lima Paiva
1,
Brenda Vieira de Oliveira
1,
Camila Ferreira Azevedo
1,
Ana Carolina Campana Nascimento
1,
Diego Jarquin
2 and
Moyses Nascimento
1,*
1
Department of Statistics, Federal University of Viçosa, Viçosa 36570-900, MG, Brazil
2
Department of Agronomy, University of Florida, Gainesville, FL 32611, USA
*
Author to whom correspondence should be addressed.
Agriculture 2026, 16(9), 1001; https://doi.org/10.3390/agriculture16091001
Submission received: 5 March 2026 / Revised: 13 April 2026 / Accepted: 30 April 2026 / Published: 2 May 2026

Abstract

The main approach for improving multiple traits simultaneously is the selection index. The most widely used selection indices are those based on factor analysis, which overcome statistical limitations such as multicollinearity and the reliance on arbitrary weights of the classical Smith–Hazel approach and support multi-environment trials. Nevertheless, the efficiency indices are affected by factors such as genotype number, environment and trait correlation, and heritability. In this study, we simulated different scenarios varying the mentioned factors to evaluate the performance of the Factor-Analysis and Ideotype-Design-Based Index (FAI-BLUP), Multi-trait Genotype–Ideotype Distance Index (MGIDI), and Multi-Trait Stability Index (MTSI). All correlations were positive and constant within each scenario, while the ideotype sought genetic gains for traits in opposite directions. Simulations were conducted using AlphaSimR and FieldSimR, and indices were implemented via the metan package. Results showed that index efficiency was higher in scenarios with larger numbers of genotypes, low-to-moderate trait correlations, and moderate-to-high inter-environment correlations. However, strong correlations among traits, particularly when combined with high heritability, compromise selection index efficiency in scenarios with antagonistic trait objectives. Despite that, the MGIDI consistently outperformed the other indices across most scenarios. Therefore, we emphasize accounting for trait genetic architectures, genotype–trait correlations, and target environment correlations.

1. Introduction

In plant breeding programs, the ideotype refers to an ideal plant type obtained through the strategic combination of morphological, physiological, and agronomic attributes aimed at maximizing productivity, stability, and adaptation within a specific target environment [1,2]. The ideotype of each crop is dynamic and continuously refined, particularly in response to climate change and shifting economic demands [3,4]. By defining breeding objectives dictated by market demands, which are achieved through measurable selection criteria, and establishing desirable values for multiple traits, the ideotype provides breeders with a clear and strategic target for selection, typically guided by a primary criterion alongside complementary secondary criteria [5].
However, to achieve the ideotype, the correlation among critical traits is a crucial factor, as genetic associations between characteristics can either facilitate or constrain simultaneous improvement. Therefore, among other aspects, it is essential to evaluate how to identify an optimal trade-off under different trait correlation scenarios. In this context, the selection indices are an efficient biometric tool for the simultaneous selection of multiple traits [6].
By combining different attributes into a single measure, the selection indices identify genotypes closest to the defined ideotype, assigning different weights to the evaluated traits and emphasizing those considered most important by the breeder. Still, it is crucial to select individuals that exhibit broad adaptability and stability across a wide range of growing environments. In this context, multi-environment trials (METs) play a key role, as they enable the evaluation of genotype performance across diverse environments, typically differing in location and year effects, to understand the genotype-by-environment interaction (GEI). Traditionally, GEI has been managed through three main strategic approaches: ignoring the interaction by selecting based solely on mean performance across environments; exploiting stability by selecting genotypes with consistent performance; or regional stratification, which involves subdividing the target region into mega-environments to select specifically adapted genotypes for each area. However, modern breeding demands more integrated methods that can handle multiple traits and GEI simultaneously.
Nevertheless, the classic index of Smith (1936) and Hazel (1943) (SH), widely applied in the animal and plant breeding context [7,8,9,10], does not support METs directly. Furthermore, SH index faces challenges regarding its reliability in the presence of multicollinearity, since the weight estimation requires the inversion of covariance matrices, which can result in unstable and unreliable weights [6]. Another limitation of using the traditional SH index is the subjectivity and market volatility involved in the assignment of weights [7,8,9,10].
In recent years, selection indices based on factor analysis, such as the Factor-Analysis and Ideotype-Design-Based Index (FAI-BLUP) [11], the Multi-trait Genotype–Ideotype Distance Index (MGIDI) [12], and the Multi-Trait Stability Index (MTSI) [5], have been used because they do not require predefined weights for traits, reduce dimensionality and minimize multicollinearity among traits, and support METs. FAI-BLUP, MGIDI and MTSI have distinct statistical criteria for genotype ranking. The FAI-BLUP differs by ranking genotypes according to spatial probability, considering the covariance or dispersion structure of the data, aiming to preserve the biological relationships among traits [11]. In contrast, the MGIDI ranks genotypes based on their Euclidean distance from the ideotype in the factor space, prioritizing mean performance while ignoring stability [12]. Finally, the MTSI explicitly incorporates GEI by including the Weighted Average Scores based on BLUPs (WAASB), thereby penalizing instability in the computation of the ideotype distance, which shifts selection toward broadly adapted and stable genotypes rather than those with high but inconsistent performance [5].
To support the selection of the most appropriate index in a breeding program, simulation constitutes a powerful and strategic approach, as it enables the controlled manipulation of key parameters such as the genetic architecture of traits, the magnitude and direction of correlations among traits of interest, and population size, thereby allowing a rigorous, systematic, and comprehensive evaluation of index robustness and effectiveness under realistic breeding conditions [13]. In this context, a Monte Carlo simulation compared the performance of the Smith-Hazel, FAI-BLUP, and MGIDI indices under different scenarios, varying the number of genotypes (20 and 200) and traits (5, 10, 15, and 20) [12]. For this purpose, the authors considered two predefined correlation structures among traits, characterized by low and high magnitudes. Thus, when the individual data values were randomly generated conditional on this structure, the resulting correlation coefficients among traits ranged from −1 to 1. A selection intensity of 15% was applied, and the ideotype was defined in a balanced manner. However, the study did not provide detailed information regarding the choice of traits according to the desired gain in the ideotype and did not report the heritability values adopted in the simulation, which may affect the reproducibility of the scenarios. Additionally, the analyses were performed in a single environment and therefore did not consider GEI, which can alter selection rankings.
Given these aspects, the present study aims to evaluate the performance of multivariate selection indices under simulated scenarios that combine varying levels of genotype-by-environment correlation (as a proxy for GEI) and genetic correlation structures among traits, as well as different heritabilities.

2. Materials and Methods

2.1. Data Simulation

Phenotypic data were simulated for 100 and 500 genotypes, evaluated in three locations (considered such environments), and for four quantitative traits. The experimental design was a randomized complete block design with three blocks and three replicates per environment.
Genetic values were simulated with the AlphaSimR package [13], assuming 2n = 2x = 20 chromosomes, each containing 200 Quantitative Trait Loci (QTLs) and 200 Single Nucleotide Polymorphisms (SNPs), to represent a polygenic architecture. The use of equal numbers of SNPs and QTLs reflects an idealized scenario in which markers are closely associated with causal loci, facilitating the accurate representation of genetic variance. In this context, this assumption was adopted to ensure that the simulated data achieved the target genetic parameters required for the study. For each QTL, one additive effect was assigned to the phenotype, drawn from a normal distribution with zero mean and a variance chosen to achieve the desired broad-sense heritability level. Genetic covariance structures were defined to reflect different levels of inter-trait correlations (0.2, 0.5, 0.8), inter-environment correlations (0.2, 0.5, 0.8), and trait broad-sense heritabilities (H2) (0.2, 0.5, 0.8), resulting in 54 simulated scenarios (Table S1). In all cases, values of 0.2, 0.5, and 0.8 were classified as low, moderate, and high, respectively. All correlations were positive and remained constant among traits within each simulated scenario.
Plot errors for a column-based grid layout with within-block randomization were simulated using FieldSimR [14], assuming a bivariate spatial model. The residual variance for each trait was computed from the specified H2 for each trait according to: σ E 2 = (1 − H2) σ P 2 , where σ P 2 is the phenotypic variance. Finally, phenotypes were obtained by adding the simulated genetic values to the plot errors, producing the phenotypic observation matrix for each environment.

2.2. Ideotype Design

The ideotype was defined in a balanced framework, with half of the traits targeted for increase (traits 1 and 2) and the remaining half targeted for decrease (traits 3 and 4). The selection intensity was set to 20%, a commonly used standard in simulation studies and practical breeding scenarios [15], ensuring that only the top-performing 20% of genotypes, as ranked by each index, were selected.

2.3. Selection Indices

Data were analyzed using the metan package [16]. For the FAI-BLUP and MGIDI indices, Best Linear Unbiased Predictors (BLUPs) were first extracted for each genotype and environment combination using the gamem_met function, with genotypes treated as random effects. For MTSI, the weighted average of WAASB and the response variable (WAASBY) was computed for each genotype.
The BLUPs were calculated using the statistical model:
yijk = μ + Ej + Bk(j) + gi + (gE)ij + εijk,
where yijk is the observation of genotype i in the j-th environment and the k-th block, μ is the overall mean, Ej is the fixed effect of the j-th environment, Bk(j) is the fixed effect of the k-th block within the j-th environment, gi is the random effect of the i-th genotype, (gE)ij is the random effect of the GEI, and εijk is the experimental error. The assumptions are that gi ~ N(0, σ g e 2 ), (gE)ij ~ N(0, σ g e 2 ), and εijk ~ N(0, σ e 2 ).
The estimator of the stability index, called the weighted mean of the absolute scores estimated with the GEI BLUP matrix, is given by:
WAASB i   =   ( k   =   1 k | P C k   ×   E P k | ) / k   =   1 k E P k ,
where WAASBi is the weighted average of the absolute scores of the i-th genotype, PCik is the score of the i-th genotype in the k-th PC, and EPk is the percentage of variance explained by the k-th PC, for k = 1, 2, …, k.
The WAASBY index integrates stability (WAASB) and mean performance (Y), weighting both components as described below:
WAASBY i   =   ( r Y i   x   θ Y )   +   ( r W i   x   θ S ) θ Y   +   θ S ,
where WAASBYi is the simultaneous selection index for the i-th genotype, weights mean performance (Y) and stability (WAASBi) [5]. The parameters θ Y and θ S represent the weights assigned to the response variable and to WAASB, respectively, whose default values are θ Y = 0.50 and θ S = 0.50. The components of the index, r Y i and r W i , correspond to the rescaled (0–100) values of Y and WAASB, obtained through a linear adjustment between the original values and the new maximum and minimum limits, defined according to each variable.
The FAI-BLUP was obtained using the following expression:
P i j =   1 d i j / i   =   1 ;   j   =   1 i   =   n ;   j   =   m   1 d i j ,
where P i j is the probability that the i-th genotype (i = 1, 2, …, n) is similar to the j-th ideotype (j = 1, 2, …, m) and d i j is the genotype–ideotype distance between them, calculated as standardized mean Euclidean distance [11].
The MGIDI was calculated according to the following formula:
MGIDI i   =   j   =   1 f ( Y i j     Y j ) 2 ,
where MGIDIi represents the multi-trait distance index for the i-th genotype; Y i j is the score of the i-th genotype in the j-th factor (i = 1, 2, …, g; j = 1, 2, …, f), with g and f denoting, respectively, the number of genotypes and the number of retained factors; Y is the corresponding score of the ideotype [12].
The MTSI was determined based on the following equation:
MTSI i   =   j   =   1 f ( F i j     F j ) 2 ,
where MTSIi represents the multi-trait stability index for the i-th genotype, Fij is the j-th score of the i-th genotype, and Fj is the j-th score of the ideotype [5].
While the MGIDI is based on BLUPs, such that the resulting factor structure reflects only overall performance, the MTSI incorporates both performance and stability by including WAASB-derived stability measures, meaning that the factors capture not only mean performance but also GEI (stability).

2.4. Indices Comparison

FAI-BLUP and MGIDI provide selection differentials for each trait within each environment, resulting in 12 trait–environment objectives (e.g., 4 traits × 3 environments). In contrast, MTSI provides 4 overall trait differentials across environments, corresponding to four objectives. Thus, for each selection index and simulation scenario, the selection efficiency was defined as the proportion of the desired genetic gains that were effectively achieved relative to the ideotype-defined targets, i.e., the number of achieved goals divided by the total number of objectives considered. Moreover, overlap among the three indices was assessed to evaluate the consistency of genotype selection across methodologies.

3. Results

3.1. Data Simulation

The phenotypic values of genotypes for each trait in the simulated scenarios are presented in Figures S1–S3. The simulation procedure proved efficient in achieving the predefined correlation structures among traits and across environments, as well as the targeted heritability levels (Figures S4–S6). Moreover, the effectiveness of the simulated correlation between environments was supported by the coefficient of determination for the GEI effects ( R G E I 2 ), used as an indicator of the relative importance to the total phenotypic variation, as presented in Table S2.

3.2. Selection Efficiency

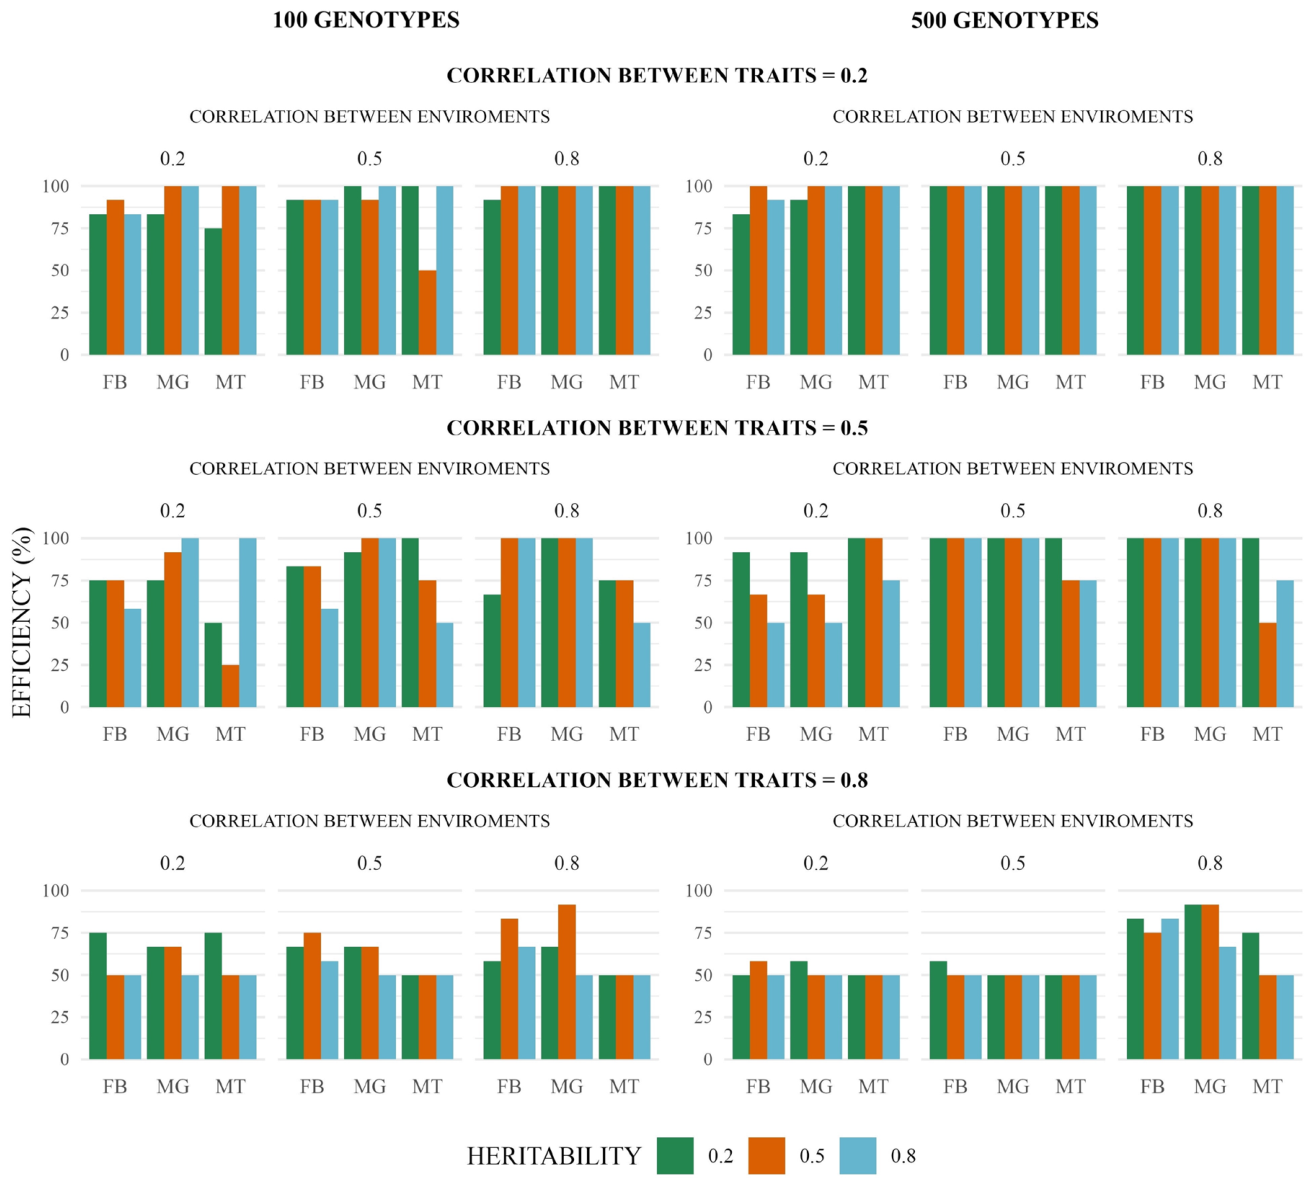
The selection differentials realized (Figures S7–S12) and the resulting goal efficiency (Figure 1) of the selection indices were significantly influenced by the simulated factors, namely the number of genotypes, trait correlations, environment correlations, and trait heritability.
Datasets comprising 500 genotypes, under low and moderate correlation (0.2 and 0.5) between traits, showed higher efficiency values compared with those containing 100 genotypes (Figure 1). Moreover, environment correlation exhibited a positive influence on efficiency, indicating that greater similarity among environments improves the ability of the indices to classify genotypes according to the ideotype (Figure 1). Conversely, trait correlation exerted a consistently negative effect on indices efficiency; increasing the correlation between traits from 0.2 to 0.8 led to a systematic reduction in efficiency across all indices, independent of the remaining factors (Figure 1). Furthermore, a high heritability level (0.8) produced greater efficiencies in scenarios characterized by low trait correlations (Figure 1). However, under scenarios with strong trait correlations, lower heritability values were associated with comparatively higher efficiencies. Finally, regarding the selection indices, MGIDI followed by FAI-BLUP exhibited higher efficiencies than MTSI in scenarios with moderate-to-high trait correlation and high environment correlation (Figure 1). On the other hand, MTSI outperformed in scenarios with low environment correlations with low-to-moderate trait correlations in the large population (500 genotypes).

3.3. Indices Coincidence

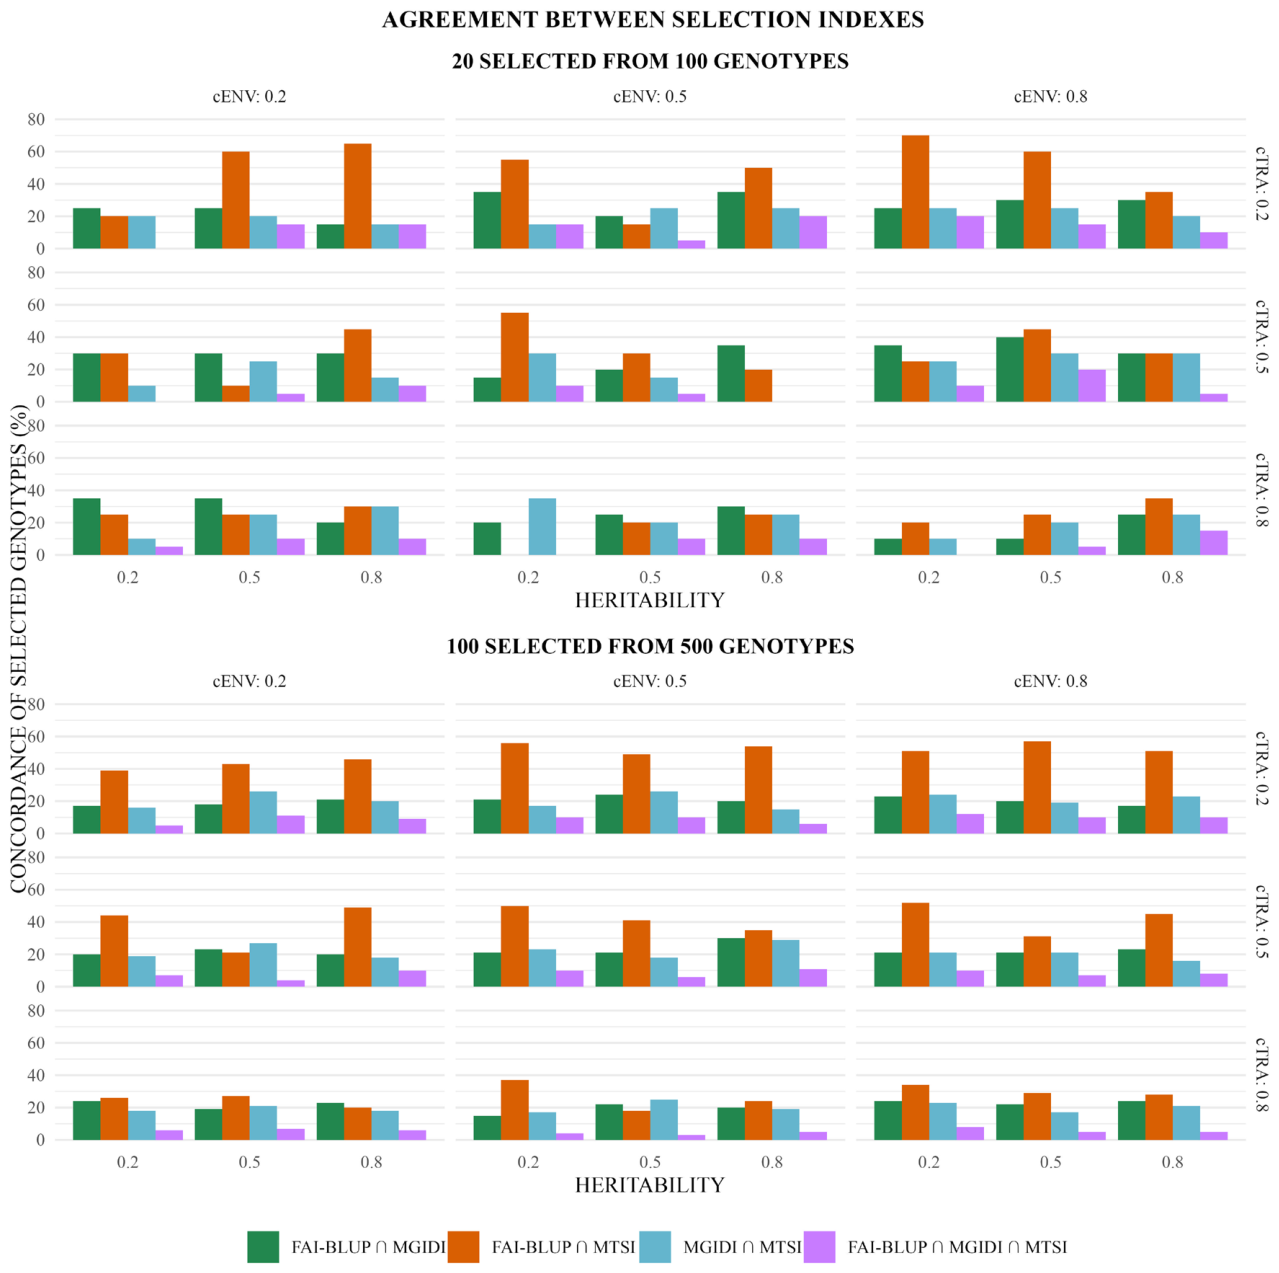
The genotypes selected by each index (Figures S13–S15), as well as the concordance among selection indices (Figure 2), varied markedly across the simulated scenarios.
Overall, agreement was higher when selecting 100 individuals from 500 genotypes compared with selecting 20 from 100. In both sets of scenarios, the highest genotype overlap occurred between FAI-BLUP and MTSI. The pairs FAI-BLUP∩MGIDI and MGIDI∩MTSI showed intermediate concordance (Figure 2), indicating that MGIDI selected partially distinct subsets of genotypes compared with the other two indices. The joint intersection among all three indices was consistently the lowest (Figure 2), reflecting limited global agreement.
Scenario analysis further revealed that concordance tended to increase under high environment correlations and low trait correlation. In contrast, scenarios with high trait correlations consistently reduced concordance among indices, independently of population size (Figure 2).

4. Discussion

Indices Performance

Our study provides an analysis of the performance of multivariate selection indices under simulated scenarios that combine varying inter-environment and inter-trait correlations, as well as contrasting trait heritabilities. Under low-to-moderate trait correlation, we achieved a higher efficiency in the biggest populations, as found in many studies [17]. Increasing the number of genotypes reduces sampling error when estimating variance–covariance matrices, as it broadens the representation of genetic variability and minimizes the influence of random fluctuations and extreme values.
Antagonistic correlations between traits of equal importance consistently reduce index efficiency, as the ideotype requires genetic gains in directions opposite to the population’s natural genetic structure, forcing a trade-off in total progress. Trade-offs such as growth versus defense (activation of resistance pathways reducing growth and yield), productivity versus stress tolerance, source–sink relationships affecting harvest index and carbon allocation, seed number versus seed size, protein concentration versus yield, and grain filling versus spikelet number, are present in many crops [18]. These unfavorable correlations generally arise from linkage disequilibrium, genetic linkage, and/or pleiotropy. Correlations resulting from genetic linkage or linkage disequilibrium tend to be transitory and can be gradually reduced or broken by recombination over successive selection cycles [18,19,20], particularly when lower selection intensity is applied. In contrast, selection for traits that share pleiotropic and antagonistic genetic bases is inherently constrained, since the same genes simultaneously influence multiple traits in opposing directions, limiting the potential for independent improvement. In some cases, these constraints may be alleviated through gene editing or by modulating gene expression to decouple or attenuate the antagonistic effects [18]. When such approaches are not feasible, breeding objectives should be redefined to reflect realistic trade-offs, and multi-trait selection indices should be employed to maximize overall genetic gain while balancing antagonistic responses. Therefore, it is important to consider the pattern of genetic variances and inter-trait correlations before designing the ideotype, as this determines the potential for simultaneous trait selection and the expected improvement in genetic gain [21].
Anyway, MGIDI outperformed in our research, corroborating findings in the literature, which reported the superiority of MGIDI over Smith–Hazel and FAI-BLUP, particularly when the number of traits and the number of selected genotypes increased, under conditions of low correlation among traits [12], indicating the index’s intrinsic responsiveness to the underlying variance–covariance architectures. In addition, restricted indices, such as those of Kempthorne and Nordskog (1959) [22], can be adopted to limit conflicting responses and maintain balanced genetic gain. Still, the multi-objective optimization can choose the best trade-off from the Pareto Frontier (set of non-dominated solutions), balancing the negative correlation between features [23].
Furthermore, it is important to note that when traits are highly correlated and heritability is high, selection tends to generate redundant responses across traits, limiting the ability of selection indices to discriminate genotypes under antagonistic breeding objectives. Conversely, under lower heritability, environmental variation partially disrupts this redundancy, increasing differentiation among genotypes and making index-based selection particularly effective even in the presence of strong correlations, provided sufficient population diversity exists [24].
Additionally, high environmental correlations indicate reduced GEI, which simplifies genotype selection using indices and cultivar recommendations [25]. Conversely, low correlations among environments lead to changes in genotype ranking and reduce the potential for maximizing genetic gain [26], thereby becoming a critical point of attention when defining and selecting the target set of environments for evaluation and recommendation [27]. Likewise, complementary tools can be combined with FAI-BLUP, MGIDI, and MTSI, and to enhance accuracy and balance, such as BLUP and WAASB demonstrated in pearl millet [28], Weighted Rank Aggregation and Genotype by Yield × Trait biplot analysis validated in mustard [29], GGE biplot and AMMI showed in rice [30].
Finally, the agreement between the indices tested increased under a large population, due to better representation of genetic variability, and stabilizes the multivariate structure. With more candidates, truly superior genotypes become more evident and are consistently identified across different methods. In addition, the concordance of the selection indices increased in the presence of high environment correlations, as genotype rankings stabilized across locations and genetic signals became clearer. Conversely, high correlations between traits reduced agreement due to pronounced differences, leading the indices to prioritize genotypes differently and produce divergent rankings. The greatest overlap was observed between FAI-BLUP and MTSI, possibly due to their stronger penalization of genotypes with unbalanced performance across traits, which favors the selection of more harmoniously performing individuals.
In practice, frequently the genotypes that converge across indices are selected [29,30,31], as coincidence among methods increases confidence in selection decisions, reflects stability across different environments, and reduces the risk of choosing genotypes favored by a single methodological approach. However, when the agreement among selection indices is low, genotype recommendation should be guided by the index exhibiting the highest efficiency under the specific structural conditions of the dataset. In addition, we can use any of the tools mentioned above.

5. Conclusions

The efficiency of factor analysis-based selection indices is strongly context-dependent, shaped by the interplay among genetic architecture, environmental structure, and correlations among traits. We demonstrated that generally the selection index efficiency improves with increasing numbers of genotypes, and that the high positive correlation between traits is the main complicating factor for the efficiency of selection indices in scenarios of antagonistic objectives for traits. To find the best trade-off in these scenarios is more challenging, particularly when traits show high heritability, as selection tends to be more effective for individual traits. In this case, when one trait is clearly more important, direct selection on that trait may be more appropriate; however, when traits are of equal importance, it becomes necessary to use a selection index to achieve the best possible balance among them.
On the other hand, a high correlation between environments is advantageous, as it reflects low GEI and, consequently, little or no change in the ranking of genotypes between them, supporting the definition of a uniform mega-environment. Nevertheless, assessing GEI remains essential to confirm whether this assumption holds for the target conditions.
Regarding the performance of the indices tested, although no single index is universally optimal, MGIDI delivered the most robust and efficient selection across a wide range of scenarios, followed by FAI-BLUP, whereas MTSI showed lower global efficiency. Consequently, the agreement in genotype selection was greater between FAI-BLUP and MGIDI.
These findings reinforce the importance of understanding the genetic architectures of traits and their correlations, beyond the correlation between the target environments, before choosing a given index selection. However, highlight the robustness of the MGIDI selection index above different scenarios.

Supplementary Materials

The following supporting information can be downloaded at: https://www.mdpi.com/article/10.3390/agriculture16091001/s1, Table S1: Design of 54 simulated scenarios; Table S2: Coefficient of determination for the genotype-by-environment interaction (GEI) effects ( R G E I 2 ) for each scenario and trait, expressed as a percentage, used as an indicator of the relative importance of GEI in the phenotypic variation. Figure S1: The phenotypic values of 100 genotypes for each trait in scenarios C1–C18 are presented as boxplots; Figure S2: The phenotypic values of 100 genotypes for each trait in scenarios C19–C27, and of 500 genotypes for each trait in scenarios C28–C36, are presented as boxplots; Figure S3: The phenotypic values of 500 genotypes for each trait in scenarios C37–C54 are presented as boxplots; Figure S4: The correlations between traits for each of the 54 scenarios (C1–C54) are based on the mean performance of genotypes across replications and environments; Figure S5: The correlations between environments (Env) for each of the 54 scenarios (C1–C54) are based on the mean performance of genotypes across replications and traits; Figure S6: The heritability of traits for each of the 54 scenarios (C1–C54) is based on the mean performance of genotypes across replications and environments; Figure S7: Selection differentials (%) obtained via the FAI-BLUP, MGIDI, and MTSI indexes, selecting 20 of 100 genotypes in the C1–C9 scenarios; Figure S8: Selection differentials (%) obtained via the FAI-BLUP, MGIDI, and MTSI indexes, selecting 20 of 100 genotypes in the C10–C18 scenarios; Figure S9: Selection differentials (%) obtained via the FAI-BLUP, MGIDI, and MTSI indexes, selecting 20 of 100 genotypes in the C19–C27 scenarios; Figure S10: Selection differentials (%) obtained via the FAI-BLUP, MGIDI, and MTSI indexes, selecting 100 of 500 genotypes in the C28–C36 scenarios; Figure S11: Selection differentials (%) obtained via the FAI-BLUP, MGIDI, and MTSI indexes, selecting 100 of 500 genotypes in the C37–C45 scenarios; Figure S12: Selection differentials (%) obtained via the FAI-BLUP, MGIDI, and MTSI indexes, selecting 100 of 500 genotypes in the C46–C54 scenarios; Figure S13: Coincidence between 20 genotypes selected (out of 100) by each index among the scenarios C1–C18; Figure S14: Coincidence between 20 genotypes selected (out of 100) and 100 genotypes (out of 500) by each index among the scenarios C19–C27 and C28–C36, respectively; Figure S15: Coincidence between 100 genotypes selected (out of 500) by each index among the scenarios C37–C54.

Author Contributions

Conceptualization, W.A.L.P. and M.N.; methodology, W.A.L.P., A.C.C.N. and M.N.; software, W.A.L.P.; validation, W.A.L.P.; data curation, W.A.L.P.; writing—original draft preparation, W.A.L.P.; writing—review and editing, B.V.d.O., C.F.A., A.C.C.N., D.J. and M.N. All authors have read and agreed to the published version of the manuscript.

Funding

This research was funded by Conselho Nacional de Desenvolvimento Científico e Tecnológico (CNPq/Brazil), Coordenação de Aperfeiçoamento de Pessoal de Nível Superior (CAPES/Brazil), and Fundação de Amparo à Pesquisa do Estado de Minas Gerais (FAPEMIG/Brazil).

Institutional Review Board Statement

Not applicable.

Data Availability Statement

The datasets simulated are available at https://github.com/wwanessa13/Selection-index-comparison/. This link was accessed on 4 March 2026. Further inquiries can be directed to the corresponding author.

Acknowledgments

We would like to thank the Federal University of Viçosa and the University of Florida for providing the necessary knowledge to develop this work.

Conflicts of Interest

The authors declare no conflicts of interest.

References

  1. Rasmusson, D.C. An Evaluation of Ideotype Breeding. Crop Sci. 1987, 27, 1140–1146. [Google Scholar] [CrossRef] [Scilit]
  2. Ahn, E.; Botkin, J.; Curtin, S.J.; Zsögön, A. Ideotype breeding and genome engineering for legume crop improvement. Curr. Opin. Biotechnol. 2023, 82, 102961. [Google Scholar] [CrossRef] [Scilit]
  3. Rasmusson, D.C. Ideotype Research and Plant Breeding. In Gene Manipulation in Plant Improvement: 16th Stadler Genetics Symposium; Gustafson, J.P., Ed.; Springer: New York, NY, USA, 1984; pp. 95–119. [Google Scholar] [CrossRef] [Scilit]
  4. Hamblin, J. The Ideotype Concept: Useful or Outdated? In International Crop Science I; John Wiley & Sons, Ltd.: Hoboken, NJ, USA, 1993; pp. 589–597. [Google Scholar] [CrossRef] [Scilit]
  5. Olivoto, T.; Lúcio, A.D.C.; Da Silva, J.A.G.; Sari, B.G.; Diel, M.I. Mean Performance and Stability in Multi-Environment Trials II: Selection Based on Multiple Traits. Agron. J. 2019, 111, 2961–2969. [Google Scholar] [CrossRef] [Scilit]
  6. Cruz, C.D.; Carneiro, P.C.S. Modelos Biométricos Aplicados ao Melhoramento de Plantas; Universidade Federal de Viçosa (UFV): Viçosa, Brazil, 2003; Volume 2. [Google Scholar]
  7. Ferreira, A.; Cecon, P.R.; Cruz, C.D.; Ferrão, R.G.; da Silva, M.F.; da Fonseca, A.F.A.; Ferrão, M.A.G. Seleção simultânea de Coffea canephora por meio da combinação de análise de fatores e índices de seleção. Pesqui. Agropecu. Bras. 2005, 40, 1189–1195. [Google Scholar] [CrossRef] [Scilit]
  8. Mendes, F.F.; Ramalho, M.A.P.; de Fátima Barbosa Abreu, Â. Índice de seleção para escolha de populações segregantes de feijoeiro-comum. Pesqui. Agropecu. Bras. 2009, 44, 1312–1318. [Google Scholar] [CrossRef] [Scilit]
  9. Bizari, E.H.; Val, B.H.P.; Pereira, E.d.M.; Mauro, A.O.D.; Unêda-Trevisoli, S.H. Selection indices for agronomic traits in segregating populations of soybean. Rev. Ciênc. Agron. 2017, 48, 110–117. [Google Scholar] [CrossRef] [Scilit]
  10. Cole, J.B.; VanRaden, P.M. Possibilities in an age of genomics: The future of selection indices. J. Dairy Sci. 2017, 101, 1–16. [Google Scholar] [CrossRef] [Scilit]
  11. Rocha, J.R.D.A.S.D.C.; Machado, J.C.; Carneiro, P.C.S. Multitrait index based on factor analysis and ideotype-design: Proposal and application on elephant grass breeding for bioenergy. GCB Bioenergy 2018, 10, 52–60. [Google Scholar] [CrossRef] [Scilit]
  12. Olivoto, T.; Nardino, M. MGIDI: Toward an effective multivariate selection in biological experiments. Bioinformatics 2021, 37, 1383–1389. [Google Scholar] [CrossRef] [Scilit] [PubMed]
  13. Gaynor, R.C.; Gorjanc, G.; Hickey, J.M. AlphaSimR: An R package for breeding program simulations. G3 Genes Genomes Genet. 2021, 11, jkaa017. [Google Scholar] [CrossRef] [Scilit]
  14. Werner, C.R.; Gemenet, D.C.; Tolhurst, D.J. FieldSimR: An R package for simulating plot data in multi-environment field trials. Front. Plant Sci. 2024, 15, 1330574. [Google Scholar] [CrossRef] [Scilit]
  15. Casagrande, C.R.; Mezzomo, H.C.; Silva, C.M.; Lima, G.W.; Souza, D.J.P.; Borém, A.; Nardino, M. Selection indexes based on genotypic values applied to Brazilian tropical wheat breeding. Agron. Sci. Biotechnol. 2022, 8, 1–16. [Google Scholar] [CrossRef] [Scilit]
  16. Olivoto, T.; Lúcio, A.D. metan: An R package for multi-environment trial analysis. Methods Ecol. Evol. 2020, 11, 783–789. [Google Scholar] [CrossRef] [Scilit]
  17. Vieira, R.A.; Nogueira, A.P.O.; Fritsche-Neto, R. Optimizing the selection of quantitative traits in plant breeding using simulation. Front. Plant Sci. 2025, 16, 1495662. [Google Scholar] [CrossRef] [Scilit] [PubMed]
  18. Dwivedi, S.L.; Reynolds, M.P.; Ortiz, R. Mitigating tradeoffs in plant breeding. iScience 2021, 24, 102965. [Google Scholar] [CrossRef] [Scilit] [PubMed]
  19. Falconer, D.S.; Mackay, T.F.C. Introduction to Quantitative Genetics, 4th ed.; Addison Wesley Longman: White Plains, NY, USA, 1996. [Google Scholar]
  20. Lynch, M.; Walsh, B. Genetics and Analysis of Quantitative Traits; Sinauer Associates, Inc.: Sunderland, MA, USA, 1998. [Google Scholar]
  21. Picheny, V.; Casadebaig, P.; Trépos, R.; Faivre, R.; Da Silva, D.; Vincourt, P.; Costes, E. Using numerical plant models and phenotypic correlation space to design achievable ideotypes. Plant Cell Environ. 2017, 40, 1926–1939. [Google Scholar] [CrossRef] [Scilit]
  22. Kempthorne, O.; Nordskog, A.W. Restricted Selection Indices. Biometrics 1959, 15, 10–19. [Google Scholar] [CrossRef] [Scilit] [PubMed]
  23. Akdemir, D.; Beavis, W.; Fritsche-Neto, R.; Singh, A.K.; Isidro-Sánchez, J. Multi-objective optimized genomic breeding strategies for sustainable food improvement. Heredity 2019, 122, 672–683. [Google Scholar] [CrossRef] [Scilit]
  24. Haberland, A.M.; Pimentel, E.C.G.; Ytournel, F.; Erbe, M.; Simianer, H. Interplay between heritability, genetic correlation and economic weighting in a selection index with and without genomic information. J. Anim. Breed. Genet. 2013, 130, 456–467. [Google Scholar] [CrossRef] [Scilit]
  25. Van Eeuwijk, F.A.; Bustos-Korts, D.V.; Malosetti, M. What Should Students in Plant Breeding Know About the Statistical Aspects of Genotype × Environment Interactions? Crop Sci. 2016, 56, 2119–2140. [Google Scholar] [CrossRef] [Scilit]
  26. Sampaio Filho, J.S.; Olivoto, T.; Campos, M.D.S.; Oliveira, E.J.D. Multi-trait selection in multi-environments for performance and stability in cassava genotypes. Front. Plant Sci. 2023, 14, 1282221. [Google Scholar] [CrossRef] [Scilit] [PubMed]
  27. Begna, T. The Role of Genotype by Environmental Interaction in Plant Breeding. J. Nat. Sci. Res. 2020, 11, 9–18. [Google Scholar] [CrossRef] [Scilit]
  28. Naveen, A.; Singh, S.P.; Singhal, T.; Reddy, S.; Bhargavi, H.A.; Yadav, S.; S, H.; Kapoor, C.; Supriya, P.; Singh, N.; et al. Delineation of selection efficiency and coincidence of multi-trait-based models in a global germplasm collection of pearl millet for a comprehensive assessment of stability and high performing genotypes. Genet. Resour. Crop Evol. 2025, 72, 4843–4859. [Google Scholar] [CrossRef] [Scilit]
  29. Kumar, R.; Kumar, M.; Gangwar, L.K.; Kumar, V.; Singh, S.; Edhigalla, P.; Rahimi, M. Association and reliability analysis of multi-trait selection methods and selection of superior genotypes across the traits in Indian mustard. Sci. Rep. 2025, 15, 23405. [Google Scholar] [CrossRef] [Scilit] [PubMed]
  30. Singh, A.; Singh, D.K.; Singh, S.K.; Singh, V.K.; Kumar, A. Multivariate stability analysis to select elite rice (Oryza sativa L.) genotypes for grain yield, zinc and Iron. Sci. Rep. 2025, 15, 39586. [Google Scholar] [CrossRef] [Scilit]
  31. Ambrósio, M.; Daher, R.F.; Santos, R.M.; Santana, J.G.S.; Vidal, A.K.F.; Nascimento, M.R.; Leite, C.L.; De Souza, A.G.; Freitas, R.S.; Stida, W.F.; et al. Multi-trait index: Selection and recommendation of superior black bean genotypes as new improved varieties. BMC Plant Biol. 2024, 24, 525. [Google Scholar] [CrossRef] [Scilit]
Figure 1. Efficiency (%) of FAI-BLUP (FB), MGIDI (MG), and MTSI (MT) indices across 54 simulated scenarios, considering different combinations of trait correlations (0.2, 0.5, and 0.8), environmental correlations (0.2, 0.5, and 0.8), and heritability levels. The panels are organized by trait correlation (rows) and number of genotypes (columns). Within each panel, the x-axis represents the selection indices (FB, MG, and MT), while bars correspond to different heritability levels (0.2, 0.5, and 0.8), as indicated by the color legend. Each subgroup within panels represents a specific level of correlation between environments (0.2, 0.5, and 0.8).
Agriculture 16 01001 g001
Figure 2. Concordance (%) among genotypes selected by the FAI-BLUP, MGIDI, and MTSI indices under different simulation scenarios. Panels are organized according to the number of selected genotypes (20 out of 100 and 100 out of 500), trait correlations (cTRA: 0.2, 0.5, and 0.8), environmental correlations (cENV: 0.2, 0.5, and 0.8), and trait heritability levels (0.2, 0.5, and 0.8). The x-axis represents heritability levels, and bars indicate pairwise and joint agreement among indices, as shown in the legend.
Agriculture 16 01001 g002
Disclaimer/Publisher’s Note: The statements, opinions and data contained in all publications are solely those of the individual author(s) and contributor(s) and not of MDPI and/or the editor(s). MDPI and/or the editor(s) disclaim responsibility for any injury to people or property resulting from any ideas, methods, instructions or products referred to in the content.