Article

Microsatellite Analysis Reveals a Distinct Genetic Cluster of Galician and Northern Portuguese Rye Used in Traditional Rye Breads


by
Ana María Ramos-Cabrer
1,2,*,†,
Luis Urquijo-Zamora
3,†,
Cristina Isabel Fernández-Otero
3,*,
Isaura Castro
4,
Ana Isabel Carvalho
4,
Valdemar Carnide
4,
Ángeles Romero-Rodríguez
2,5,
M Pilar España-Fariñas
5,
Matilde Lombardero-Fernández
2,6 and
Santiago Pereira-Lorenzo
1,2
1
Department of Plant Production and Engineering Projects, Higher Polytechnic School of Engineering, Campus Terra, University of Santiago de Compostela, Galicia, 27002 Lugo, Spain
2
Instituto de Biodiversidade Agraria e Desenvolvemento Rural(IBADER), Campus Terra, University of Santiago de Compostela, 27002 Lugo, Spain
3
Department of Crop Production, Agricultural Research Center of Mabegondo, AGACAL, Xunta de Galicia, 15318 A Coruña, Spain
4
Centre for the Research and Technology of Agro-Environmental and Biological Sciences (CITAB), Inov4Agro, University of Trás-os-Montes e Alto Douro (UTAD), 5000-801 Vila Real, Portugal
5
Area of Nutrition and Food Science and Food Technology, Department of Analytical Chemistry, Nutrition and Food Science, Faculty of Sciences, Campus Terra, University of Santiago de Compostela, 27002 Lugo, Spain
6
Agronomy and Animal Science Group, Department of Anatomy, Animal Production and Veterinary Clinical Sciences, Campus Terra, University of Santiago de Compostela, 27002 Lugo, Spain
*
Authors to whom correspondence should be addressed.
These authors contributed equally to this work.
Agriculture 2026, 16(14), 1513; https://doi.org/10.3390/agriculture16141513
Submission received: 26 May 2026 / Revised: 8 July 2026 / Accepted: 10 July 2026 / Published: 13 July 2026

Abstract

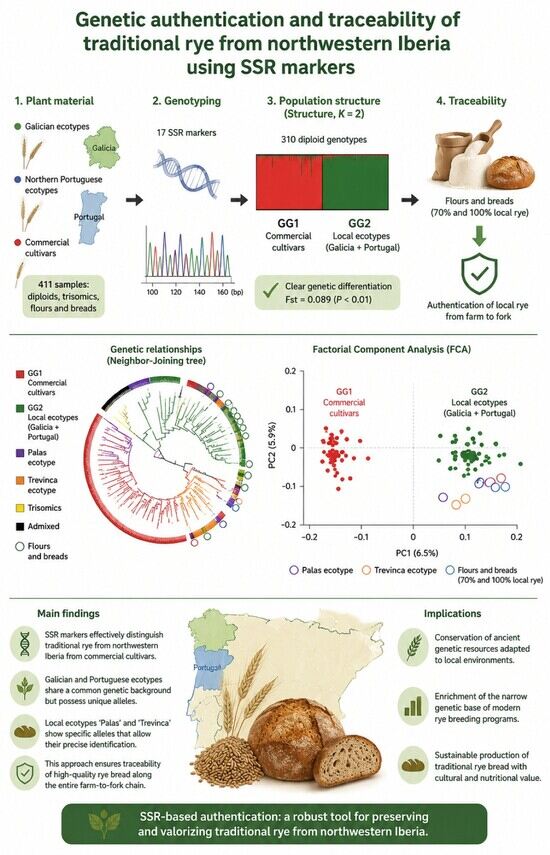
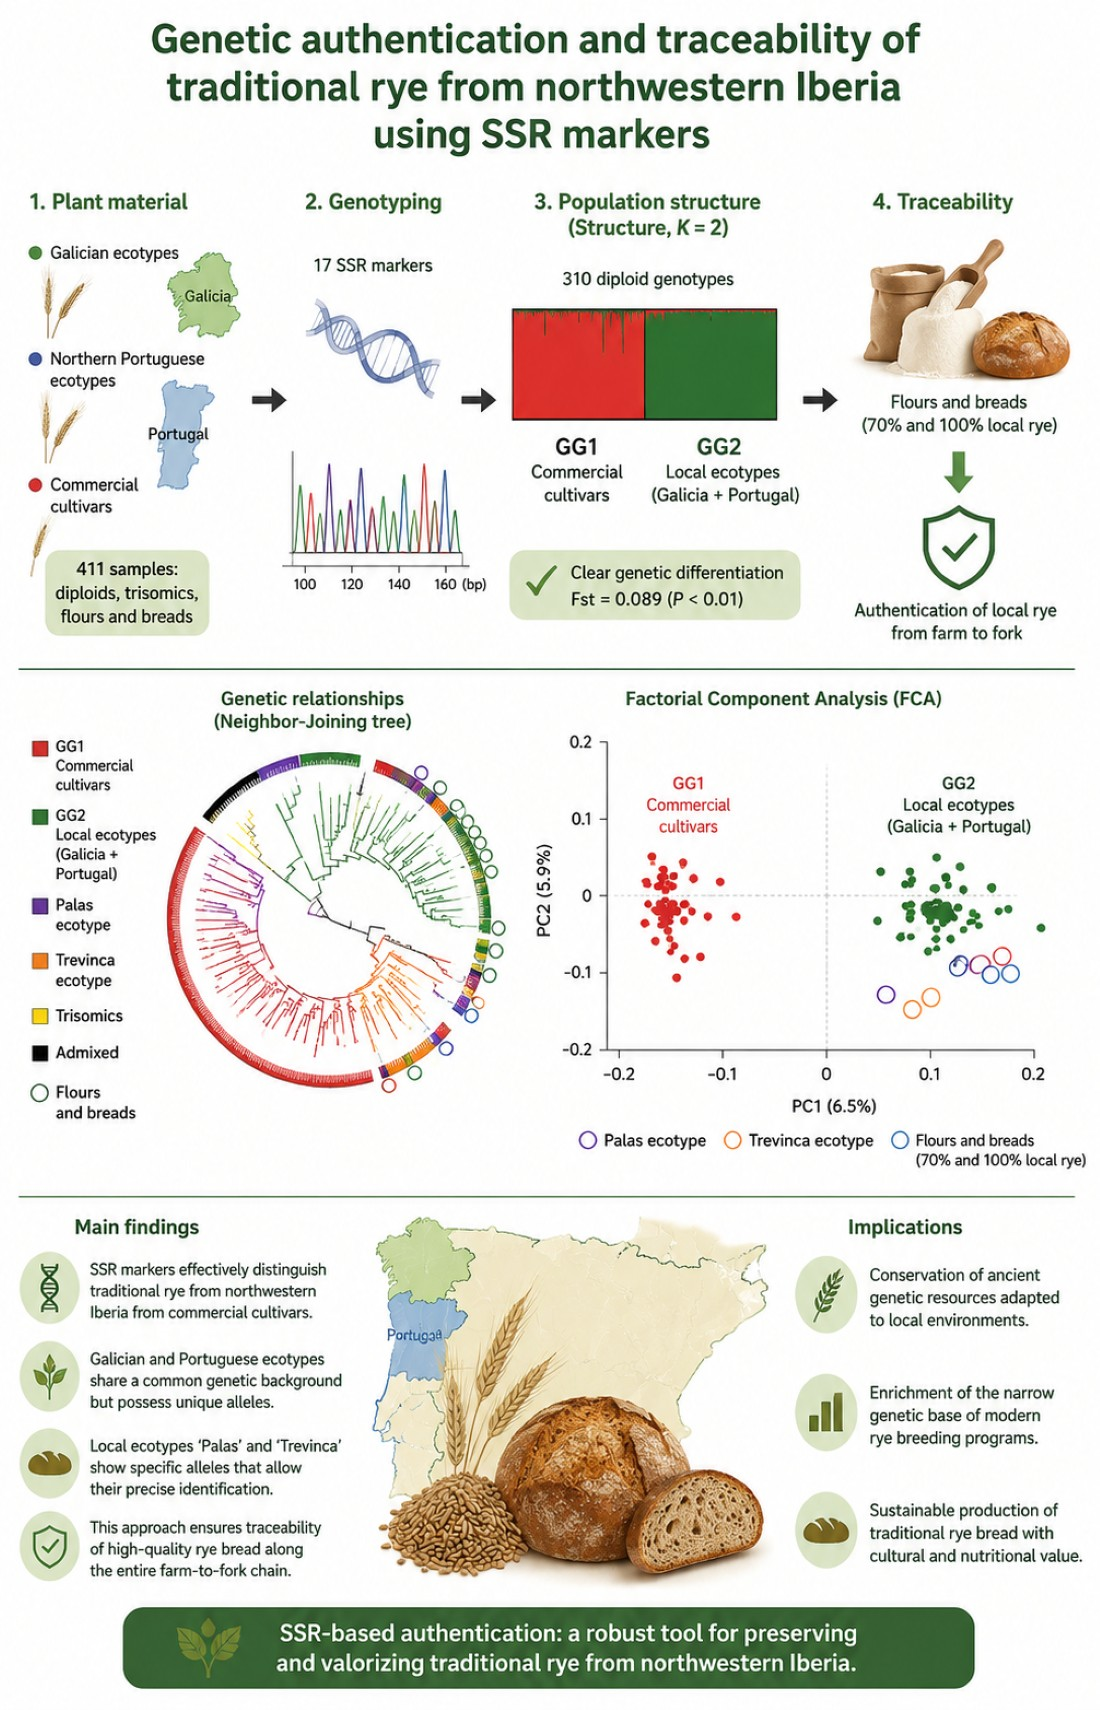
Galician and Northern Portuguese rye varieties constitute the basis for traditional bread in the northwestern Iberian Peninsula. This study evaluated the genetic diversity and structure of Galician and Portuguese ecotypes, primarily conserved at the Agricultural Research Centre of Mabegondo (CIAM) and the Universidade de Trás-os-Montes e Alto Douro (UTAD), in order to determine their origins and to differentiate them from commercial cultivars for traceability in flours and breads. A total of 411 samples, including 378 rye samples, 14 flours, and 19 breads, were evaluated using 17 simple sequence repeat (SSR) markers. Fifteen Galician ecotypes (163 samples), 22 Portuguese ecotypes (109 samples), and 9 commercial cultivars (106 samples) were analyzed. The analysis identified 310 diploid genotypes and 68 putative trisomics, which, according to the literature, are associated with meiotic disturbances and environmental adaptation. The SSR loci revealed 147 alleles, with 139 detected in diploids, 6 in putative trisomics, and 2 unique to Galician flours. Galician and northern Portuguese ryes constitute a unique and distinct genetic group, moderately differentiated from commercial cultivars (Fst = 0.089). A total of 72 alleles were unique to ecotypes, Galician flours, or bread samples. Moreover, the number of alleles was significantly higher in diploid ecotypes compared to commercial cultivars (134 vs. 67, respectively). This trend remained consistent when putative trisomics were included in the analysis (142 vs. 75, respectively). Portuguese ryes showed a higher number of putative trisomics (37) than Galician ones (25), whereas Galician ecotypes showed a slightly higher number of alleles (127 vs. 118). Neighbor-joining and principal component analyses (PCA) support the separation between Galician and Portuguese ecotypes and commercial cultivars, highlighting the singularity of these Galician and Portuguese ryes. Flour and bread derivatives produced from Galician ecotypes and cultivars were clearly differentiated from commercial cultivars, even when blends were included in the analyses. These findings underscore the potential for genetic traceability in quality bread production and emphasize the importance of this distinct genetic pool for breeding programs.

Graphical Abstract

1. Introduction

Rye (Secale cereale L.) is classified within the family Poaceae (alt. Gramineae), subfamily Pooideae, and tribe Triticeae [1].
It is a remarkably hardy, outbreeding diploid species characterized by high tolerance to acidic, nutrient-poor soils, aluminum toxicity, and cold climates [2]. These resilient traits have established rye as a cornerstone crop throughout the mountainous landscapes of the northwestern Iberian Peninsula.
In the northwestern Iberian Peninsula, rye cultivation is inextricably linked to the production of traditional breads, which utilize both Galician and Portuguese ecotypes and, more recently, commercial cultivars. As the second most widely used cereal for breadmaking, rye is gaining renewed interest due to its high concentrations of antioxidants and fiber, particularly in whole-grain applications [3].
Archaeobotanical evidence suggests a long-standing presence in the area. The earliest microremains were discovered in Lugo (Chan do Lamoso), dating between the Late Neolithic/Chalcolithic and the Early Bronze Age, although these may potentially correspond to Lygeum spartum. Rye became more prevalent across the Iberian Peninsula during Late Antiquity and the Medieval period [4]. Specifically, grain and chaff remains have been identified in Northern Portugal at Crastoeiro (Vila Real) dating to the 1st century BCE, at Monte Mozinho (Porto) from the 3rd–4th centuries CE, and subsequently in Galicia from the 13th–15th centuries CE.
Molecular markers have previously been employed to evaluate genetic diversity among Secale species [5] and rye accessions [6], including the molecular variation of Portuguese ecotypes [7]. The genetic structure of Portuguese rye ecotypes has been established, differentiating them from commercial cultivars [7]. In addition, most modern cultivars are derived from two primary heterotic pools: the paternal ‘Carsten’ and maternal ‘Petkus’ genetic pools [6,8].
Trisomics (2n + 1) are specific aneuploids first described in rye by Takagi in 1935 as spontaneous plants derived from local populations [9]. These were frequently found in the progeny of triploids (3n × 2n crosses) due to the elevated frequency of unbalanced (n + 1) gametes. Monteiro et al. [7] found no trisomic plants in their study of Northern Portuguese rye using SSRs. A comprehensive review of rye chromosomes and trisomics was recently provided by Schlegel [10]. In a study by Tenhola-Roininen [11], the heterozygosity found in a few doubled haploids (DHs) on rye at some microsatellite loci was related to unreduced gametes (produced by second division restitution), aneuploid trisomic gametes, or transposition events. Extra alleles indicating the presence of triploids were detected by using SSRs on apple in a broad study in Spain involving 1453 samples of the Spanish collections, accounting for 21% of triploids [12]. Previously, some of those SSR markers were validated for some of the triploid samples by using cytometry [13]. Current research focuses on the differentiation of local varieties traditionally used for breadmaking. Previous studies in wheat demonstrated the use of SSRs on the traceability of the local wheats in the production of flours and breads, first identifying local wheats from the commercial cultivars through Bayesian analysis, later confirmed by FCA, and tracing specific alleles of the local ecotypes in transformed products, flours and breads [14,15]. Moreover, some SSRs showing specific alleles have been useful for Droplet Digital PCR (ddPCR), which offers advantages in determining the percentage of the local flour used in mixed blends, although at a higher analytical cost [14].
The rye collection at the Agricultural Research Centre of Mabegondo (CIAM) began in 2002 and currently comprises 100 accessions. Two ecotypes, ‘Palas’ and ‘Trevinca’, were selected for productive studies to facilitate commercial seed selection. Previous studies on rye in the western Iberian Peninsula were limited to Portuguese germplasm collections and did not include the collection conserved at CIAM, which had not been evaluated before, despite both bordering geographical areas being historically documented as regions of rye cultivation. The hypothesis of this study was that Galician rye ecotypes, as with Portuguese ecotypes, were different from commercial cultivars and, therefore, distinguishable in their use for the production of traditional bread. To our knowledge, this is the first study evaluating the genetic resources of rye from Galicia (northwestern Spain) and northern Portugal using SSR markers in comparison to commercial cultivars. The primary objective of this research was to evaluate the genetic diversity of Galician and Portuguese ecotypes from the northwestern Iberian Peninsula and to assess their traceability in the production of traditional Galician bread by identifying the local ecotypes and confirming genotypes in the transformed products, flours and breads.

2. Materials and Methods

A total of 411 rye samples were analyzed, including 272 from the northwestern Iberian Peninsula: 163 samples (one of which was partially amplified) from 15 Galician ecotypes at CIAM and 109 samples from 22 northern Portuguese ecotypes (Table S1). Additionally, 106 samples from 9 commercial cultivars were studied (up to 10 accessions per cultivar), including ‘Bono’, ‘Brandie’, ‘Dolaro’, ‘Gatano’, ‘Livado’, ‘Petkus’, ‘Performer’/‘Superformer’ (samples analyzed independently due to their origin from different brands), ‘Sandie’, and ‘Serafino’. All commercial cultivars are hybrids except for ‘Petkus’.
A total of 33 samples, comprising 14 flours and 19 breads, were evaluated. The 14 flour samples included the Galician ecotypes ‘Palas’ (BG-1742) and ‘Trevinca’ (BG-2031), obtained from CIAM trials (COLECOPAN project), characterized by 100% and 25% rye content under both conventional and organic management systems. Additionally, one organic flour sample of ‘Trevinca’ from Viana do Bolo was included. These flours were used to prepare 18 experimental breads representing the various combinations, while one commercial Galician bread was also analyzed.
Nineteen experimental breads were prepared by Da Cunha bakery (Carral, A Coruña, Spain) using a standardized traditional breadmaking protocol. Wholegrain rye flours obtained from the Galician rye ecotypes ‘Palas’ and ‘Trevinca’, cultivated under conventional and organic systems at the Mabegondo Agricultural Research Centre (CIAM, A Coruña, Spain), were used.
Two formulations were produced: breads containing 100% wholegrain rye flour and breads containing a blend of 25% wholegrain rye flour and 75% wheat flour. All doughs were prepared using the same formulation. For each 7 kg of flour, 3.7 L of water, 2.5 L of sourdough, 70 g of commercial baker’s yeast (Saccharomyces cerevisiae) and 140 g of sodium chloride were added. Doughs were mixed for 1.5 h, followed by bulk fermentation of 2 h. After dividing and rounding, dough pieces rested for 20 min, were molded and subjected to a final proofing of 2 h. Baking was carried out at 220 °C for 1 h and breads were cooled for 1 h at room temperature before analysis. All breads were manufactured under identical processing conditions to minimize variability among samples.
Genomic DNA was extracted from 0.5 to 0.75 g of young leaf tissue and flour using the E.Z.N.A.® Plant DNA Kit (OMEGA Bio-Tek Inc., Norcross, GA, USA) and the DNeasy® Plant Mini Kit (Qiagen, Hilden, Germany). Bread samples were processed using the Speedtools food DNA Extraction Kit (Biotools B&M Labs S.A., Madrid, Spain). The extracted DNA was quantified with a NanoDrop™ ND-1000 Spectrophotometer (Thermo Scientific, Wilmington, DE, USA) and subsequently diluted to a working concentration of 30 ng/μL.
Genetic analysis was performed using 17 simple sequence repeat (SSR) markers selected from previously published studies in the literature (Table 1) [16,17], aiming to achieve comprehensive genome coverage across the seven chromosomes. These markers were amplified in four multiplex PCR assays (Multiplex1: SCM109, SCM86, SCM9, SCM120 and SCM304; Multiplex 2: SCM43, SCM75, SCM180, and SCM104; Multiplex 3: SCM139, SCM168, and SCM50; Multiplex 4: SCM41, SCM171, SCM47 and SCM63) using primers labeled with FAM, NED, PET, or VIC fluorophores (PE Applied Biosystems, Warrington, UK).
PCR amplifications were carried out using the GoTaq® G2 Hot Start Colorless Master Mix (Promega, Madison, WI, USA), following the manufacturer’s recommendations. Each PCR reaction was performed in a final volume of 15 μL, containing 1 μL of genomic DNA (30 ng/μL), 1.5 μL of 10× buffer, 1.2 mM MgCl2, 0.1 mM dNTPs, 0.7 μM of each primer, and 0.5 U Taq DNA polymerase, with Milli-Q water added to reach the final volume.
The thermal cycling profile consisted of an initial denaturation at 94 °C for 5 min, followed by 35 cycles of denaturation at 95 °C for 30 s, annealing at set-specific temperatures for 90 s, and extension at 72 °C for 1 min, with a final extension phase at 60 °C for 30 min.
Two touchdown PCR programs were used to improve amplification specificity. Touchdown program 1 (Multiplex 1 and 2) started with an annealing temperature of 69 °C, which was decreased by 1 °C per cycle over 10 cycles until reaching 58 °C. Touchdown program 2 (Multiplex 3 and 4) started at 68 °C, with the annealing temperature reduced by 2 °C per cycle over 10 cycles until reaching 47 °C.
Following amplification, PCR products were diluted with water; 2 µL of the resulting dilution was combined with 0.12 µL of the 600LIZ size standard (Applied Biosystems, Foster City, CA, USA) and 9.88 µL of formamide. Allele sizes were subsequently characterized using Peak Scanner™ 2.0 software (Applied Biosystems, Foster City, CA, USA).
Alleles were recorded for each individual sample, distinguishing diploid genotypes from those presenting an additional allele, indicative of putative trisomics (Figure S1), which were described on rye in association with meiotic disturbances [7].

Data Analyses

Genetic diversity parameters (number of effective alleles, information index, observed heterozygosity, expected and unbiased expected heterozygosity, and fixation index and allele frequency) were estimated using GenAlEx 6.5 [18] for the unique diploid genotypes. Rare alleles were those with an allele frequency lower than 0.05.
When an extra allele was identified (Figure S1), the genotype was considered putative trisomic. These were excluded from the diversity analyses but included in allele counting; therefore, the total number of alleles was calculated for the unique genotypes (diploid and putative trisomic) identified in ecotypes, flours and breads. Bayesian analysis was performed on the unique diploid genotypes using Structure software 2.3.4 [19,20]. The admixture model was applied with unlinked loci and correlated allele frequencies, following the methodologies of Pereira-Lorenzo et al. [21] and Porras-Hurtado et al. [22].
To ensure robust estimation of ancestry membership proportions, 30 iterations were conducted, exceeding the recommended minimum of 20 iterations, each consisting of a burning period length of 30,000 steps followed by 1,000,000 MCMC (Monte Carlo Markov Chain) replicates.
K (unknown) reconstructed panmictic populations (RPPs) were computed by testing K values from 1 to 15, assuming that the sampled cultivars originated from anonymous populations of unknown origin (options usepopinfo = 0, popflag = 0).
The optimal K value was determined using the ∆K method implemented in the Structure Harvester ver. 0.6.1 application. Genotypes were probabilistically assigned to RPPs based on a membership probability (qI) threshold of 80% [21], while individuals with lower probabilities were classified as admixed. The CLUMPAK platform [23] was used to align and summarize replicate runs, ensuring consistency in cluster assignments.
Analysis of Molecular Variance (AMOVA) was conducted using GenAlEx 6.5 [18] to evaluate genetic differentiation both among and within groups [24,25] based on the RPPs identified using Structure 2.3.4 software.
For each unique genotype, allelic frequency was treated as a binary variable, where a value of 1 indicated the presence and 0 the absence of a specific allele, in order to analyze diploid, putative trisomic and multiallelic genotypes of flours and breads [15]. DARwin software (version 6.0.010) was used to construct a dissimilarity tree, employing the “Dissimilarity for Allelic Data” option and Jaccard’s binary similarity coefficient as the dissimilarity measure. Subsequently, the unweighted neighbor-joining method was applied to generate a comprehensive phylogenetic tree including all analyzed genotypes [15,26,27].
Factorial component analysis (FCA) was performed using the principal component (PC) method (IBM SPSS Statistics version 29.0.0.2) [28] on SSR marker data from the 411 unique rye genotypes. Based on a covariance matrix, this analysis was conducted to identify the main components contributing to genetic variation [15].

3. Results

3.1. Genetic Diversity

Among the 411 samples analyzed, all exhibited unique genotypes. Of these, 310 plant genotypes were diploid and 67 (one additional sample partially amplified and was not included in this count) were identified as putative trisomics (16.3%) (Table S1). Regarding the distribution of putative trisomics, 25 were identified in Galician ecotypes, 37 in Portuguese ecotypes, and five within the commercial cultivar ‘Performer’. On average, putative trisomics accounted for 15.3% of the Galician samples and 33.9% of the Portuguese samples, compared to 4.7% in commercial cultivars. Notably, the ecotypes BG-1722, BG-1726, BG-1728, BG-1732, ‘Palas’, and ‘Trevinca’, all of Galician origin, did not contain any trisomic individuals. Eight alleles were identified exclusively in putative trisomics. These included two alleles found in Portuguese ecotypes (SCM109-141 and SCM304-272) and four in Galician ecotypes (SCM86-128, SCM120-134, SCM180-149, and SCM180-100, the latter detected in ‘Trevinca’ flour from Viana do Bolo). Additionally, one allele (SCM104-189) was shared between a Galician and a Portuguese ecotype, while another (SCM47-167) was detected in a Galician ecotype and in Galician breads produced with ‘Palas’ and ‘Trevinca’.
In total (including plants and processed derivatives), 147 alleles were identified (Table 1); this number decreased to 139 when the analysis was restricted to diploids, while 8 were found in putative trisomics. Of the 147 total alleles, 142 were present in Galician and Portuguese ecotypes (118 from Portugal and 127 from Galicia).
In contrast, commercial cultivars exhibited 75 alleles; consequently, 72 alleles were unique to ecotypes, Galician flours, or bread samples (Table 1).
Two alleles present in commercial cultivars but absent from the sampled ecotypes were observed in Galician flour or bread samples: SCM120-125 (allele frequency < 0.05) and SCM120-129. Additionally, two rare alleles were identified exclusively in Galician flours: SCM180-100 and SCM47-167.
Of the 75 alleles identified in commercial cultivars, only one, the rare allele SCM304-266, was exclusive to commercial cultivars and absent from ecotypes, flours, and breads.
The ecotypes ‘Palas’ and ‘Trevinca’ exhibited 82 and 88 alleles, respectively. Twenty-four alleles found in ‘Trevinca’ were absent in ‘Palas’, while 18 alleles were unique to ‘Palas’ relative to ‘Trevinca’. Furthermore, ‘Trevinca’ possessed the exclusive and rare (p < 0.05) alleles SCM75-200, SCM104-187, SCM75-204, and SCM9-228. In contrast, ‘Palas’ exhibited only one exclusive and rare (allele frequency < 0.05) allele, SCM180-136.
The most polymorphic markers were SCM304 and SCM86, which stood out as the most informative, exhibiting the highest number of alleles and heterozygosity levels (Table 1). Conversely, SCM9 was the least diverse marker, consistently recording the lowest values for effective alleles, information index, and both types of expected heterozygosity. The high positive fixation index observed for SCM120 (F = 0.804) suggests a significant deficiency of heterozygotes compared to expectations, while the negative value for SCM104 (F = −0.183) indicates an excess of heterozygotes.

3.2. Genetic Structure, Dissimilarity of Allelic Data and Factorial Component Analysis

3.2.1. Genetic Structure

Only diploid genotypes (310) were included in the Bayesian analysis conducted using 2.3.4 software [19,20] based on allelic profiles from the 17 SSR markers to determine genetic structure.
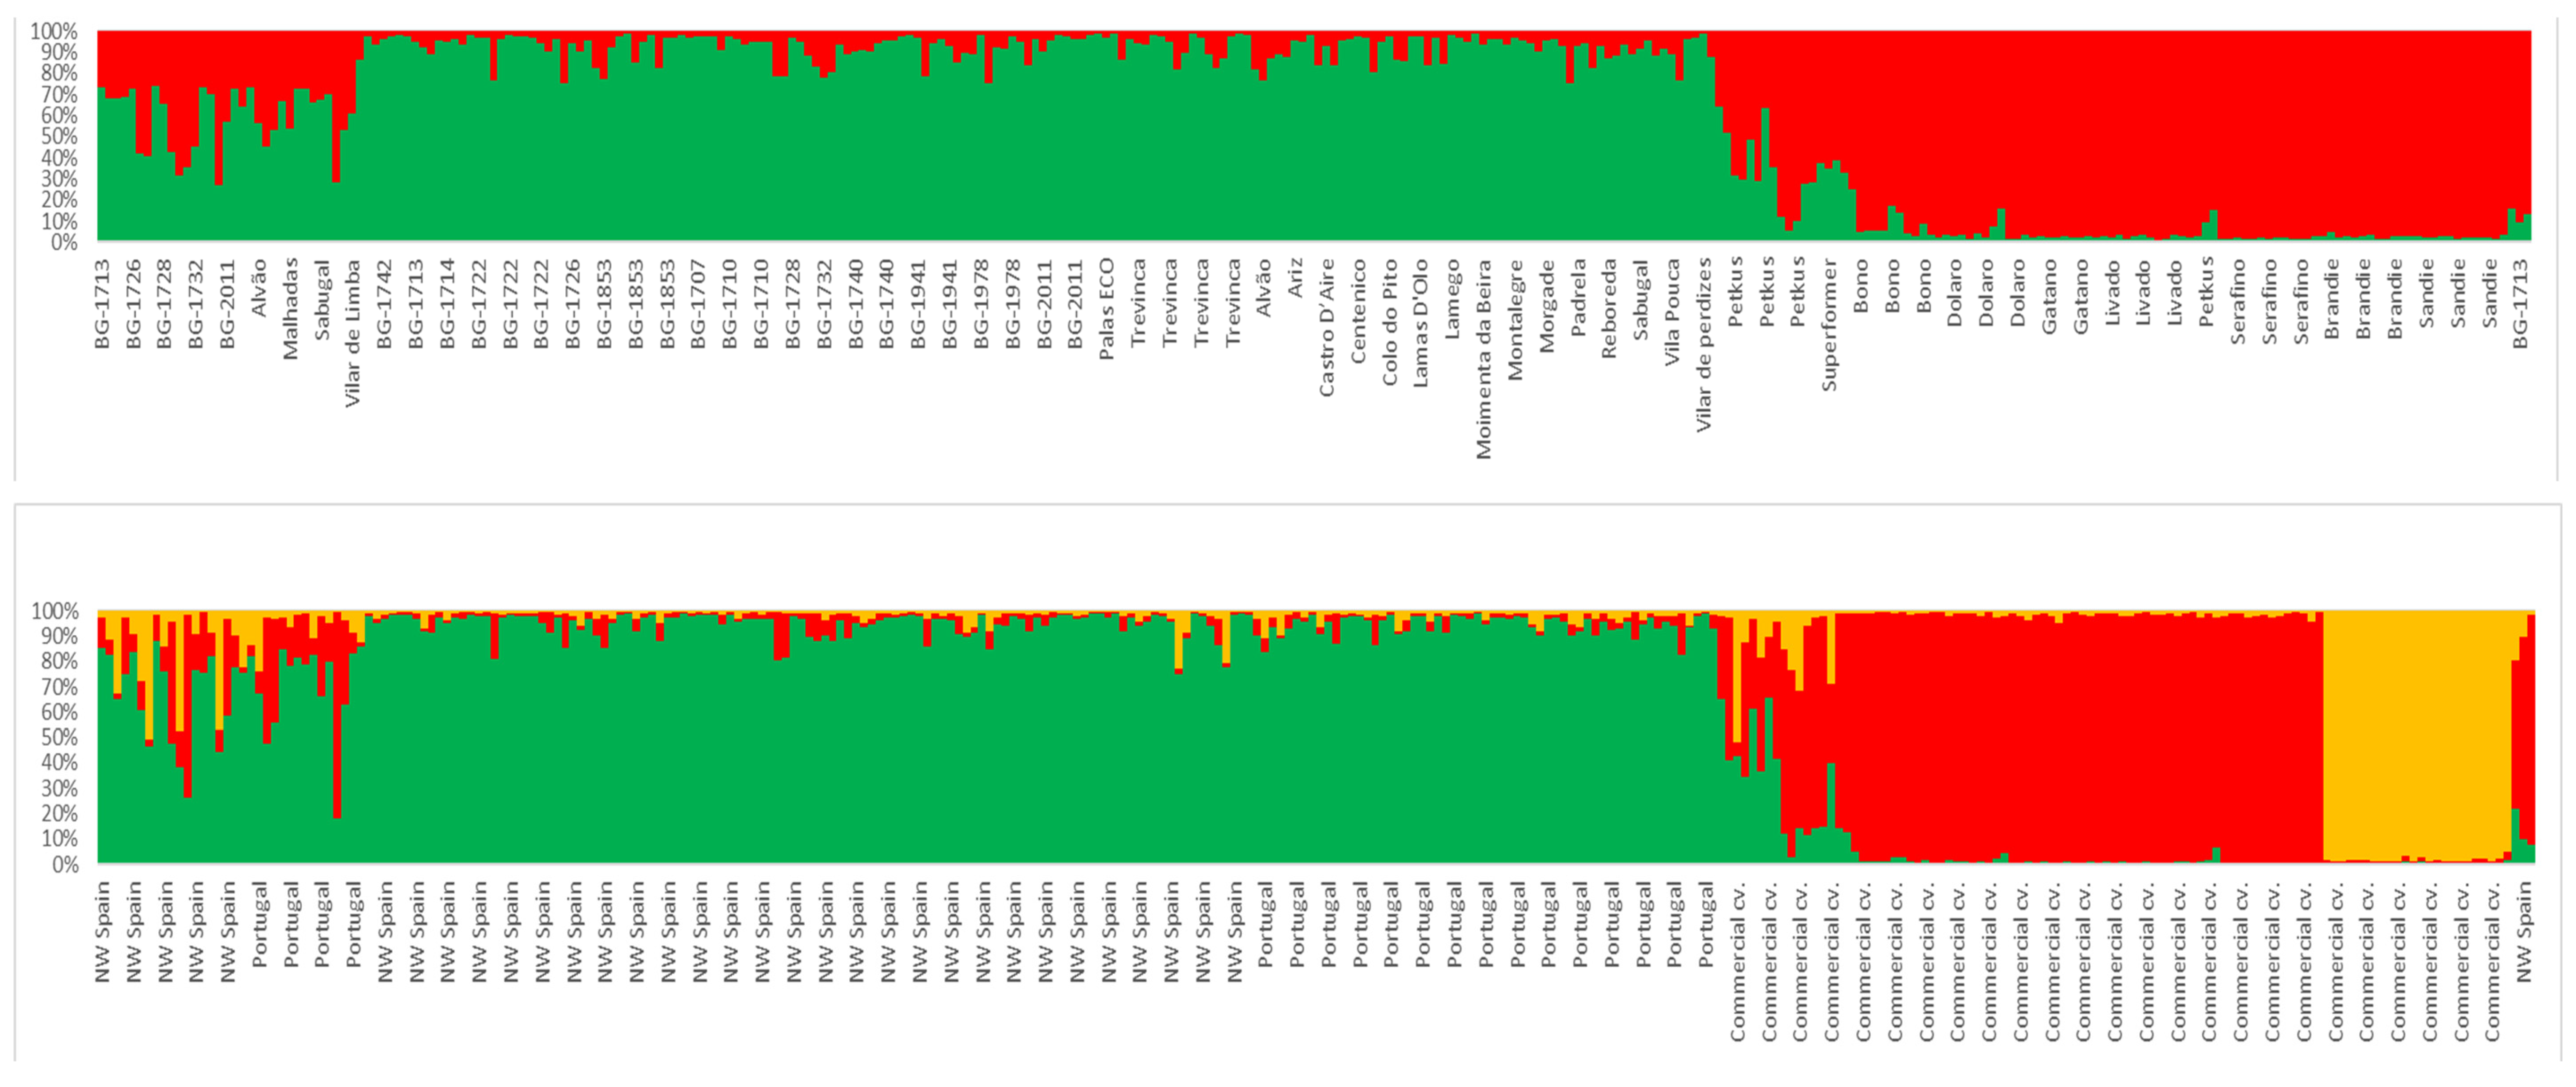
The genetic structure analysis of the 310 unique diploid genotypes identified two primary genetic groups according to the Delta K criterion (K = 2, Figure 1 and Figure S2). Of the total genotypes, 262 (84.5%) exhibited a membership probability qI > 80%, while 48 genotypes were classified as admixed. Within the 262 genotypes, two main groups were identified: one comprising the commercial cultivars and a few Galician genotypes (GG1), including 89 genotypes, and another consisting of ecotypes from Galicia and Portugal (GG2), including 173 genotypes. At K = 3, corresponding to the second peak of the Delta K criterion (Figure 1 and Figure S2), the commercial cultivars within GG1 split into two subgroups: one containing ‘Petkus’ and related cultivars, and another including ‘Brandie’ and ‘Sandie’. Notably, no genetic differentiation was observed between germplasm originating from Portugal and Galicia (Table S2).
GG1 primarily grouped the commercial cultivars. Most Galician and Portuguese ecotypes clustered within GG2, with the exception of one sample out of 10 from the Galician ecotype BG-1728 and one sample out of 10 from the Galician ecotype BG-1732 (Table S2). Genetic differentiation between GG1 (commercial cultivars) and GG2 (Galician and Portuguese ecotypes) was moderate, with an Fst value of 0.089 (p < 0.01) (Table S3) based on AMOVA performed on the 310 unique diploid genotypes. The analysis also showed that most of the variation was found within individuals (71%), followed by the variation among individuals.
The differentiation between the two genetic groups was driven by specific alleles found in the Galician and Portuguese ecotypes (GG2). These alleles were significantly more numerous in the diploid ecotypes than in the commercial cultivars (134 vs. 67, respectively), as reflected in the higher number of effective alleles (56.3 vs. 41.3, respectively). This trend remained consistent when putative trisomics were included in the analysis (142 vs. 75, respectively).
Expected heterozygosity (He) was higher in the Galician and Portuguese ecotypes than in the commercial cultivars (0.598 for GG2 and 0.488 for GG1). Furthermore, in both groups, He values exceeded observed heterozygosity (Ho), which was 0.473 for GG2 and 0.435 for GG1 (Table S4).

3.2.2. Dissimilarity of Allelic Data

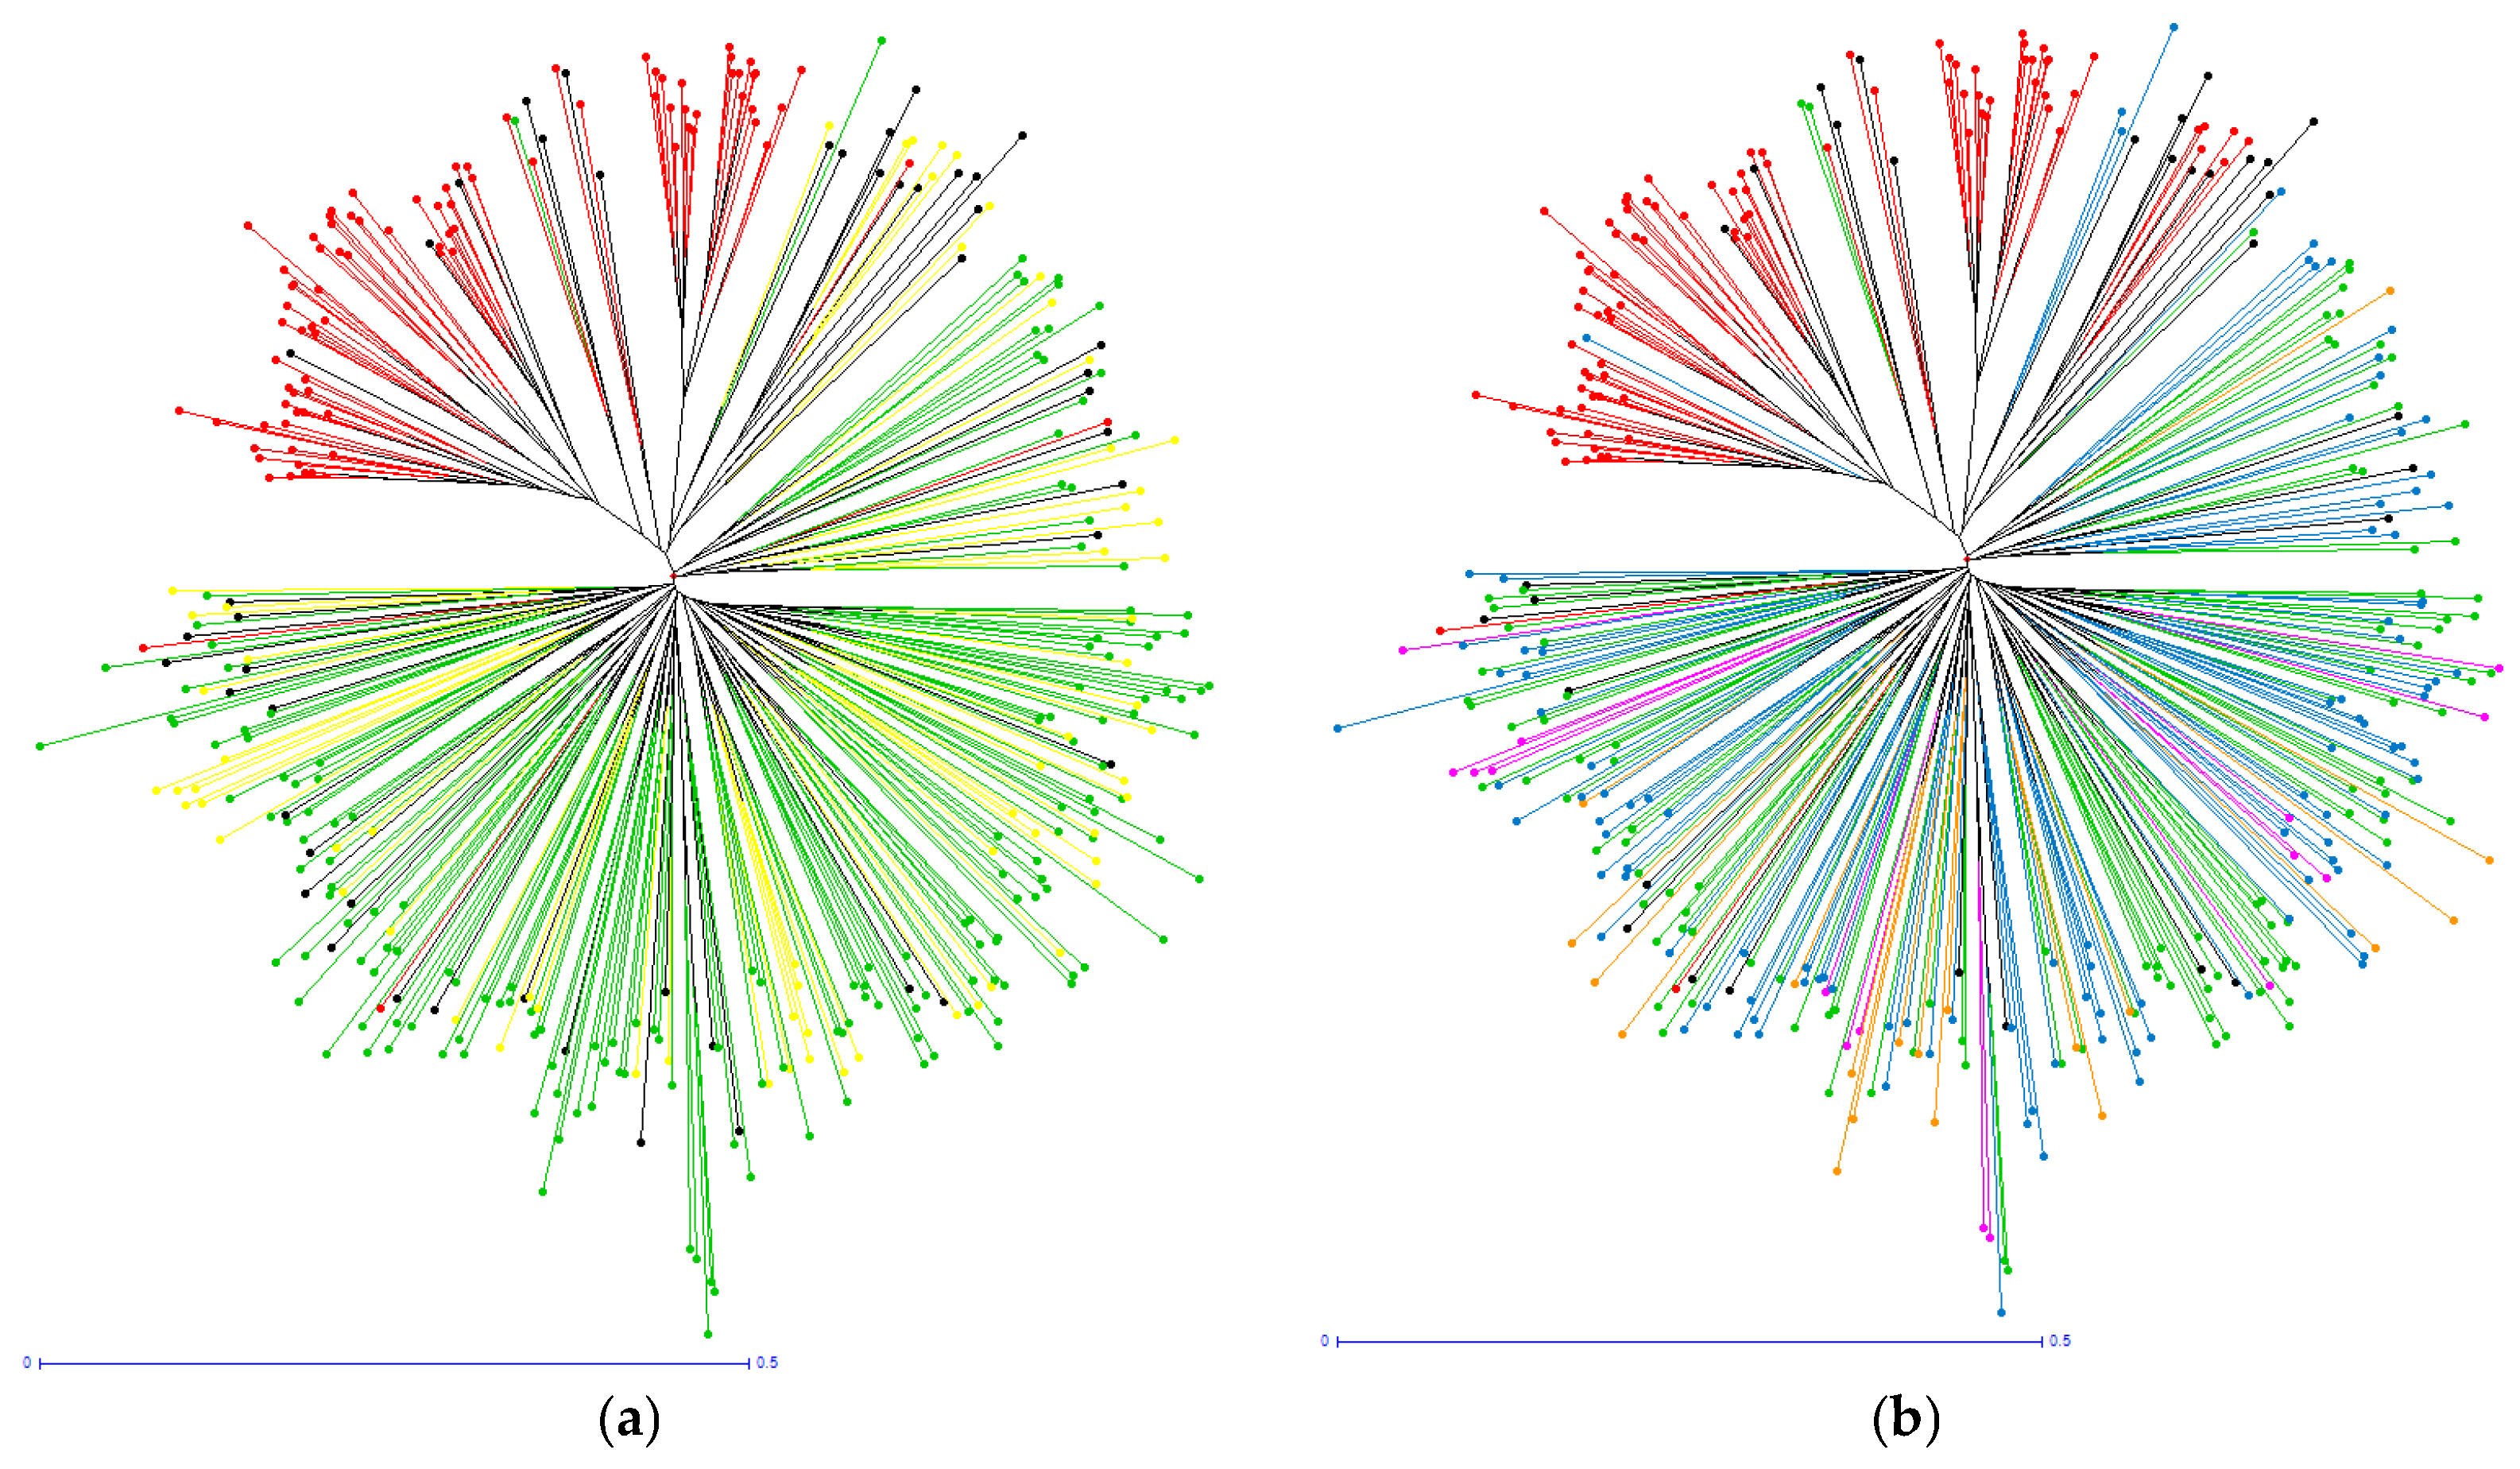
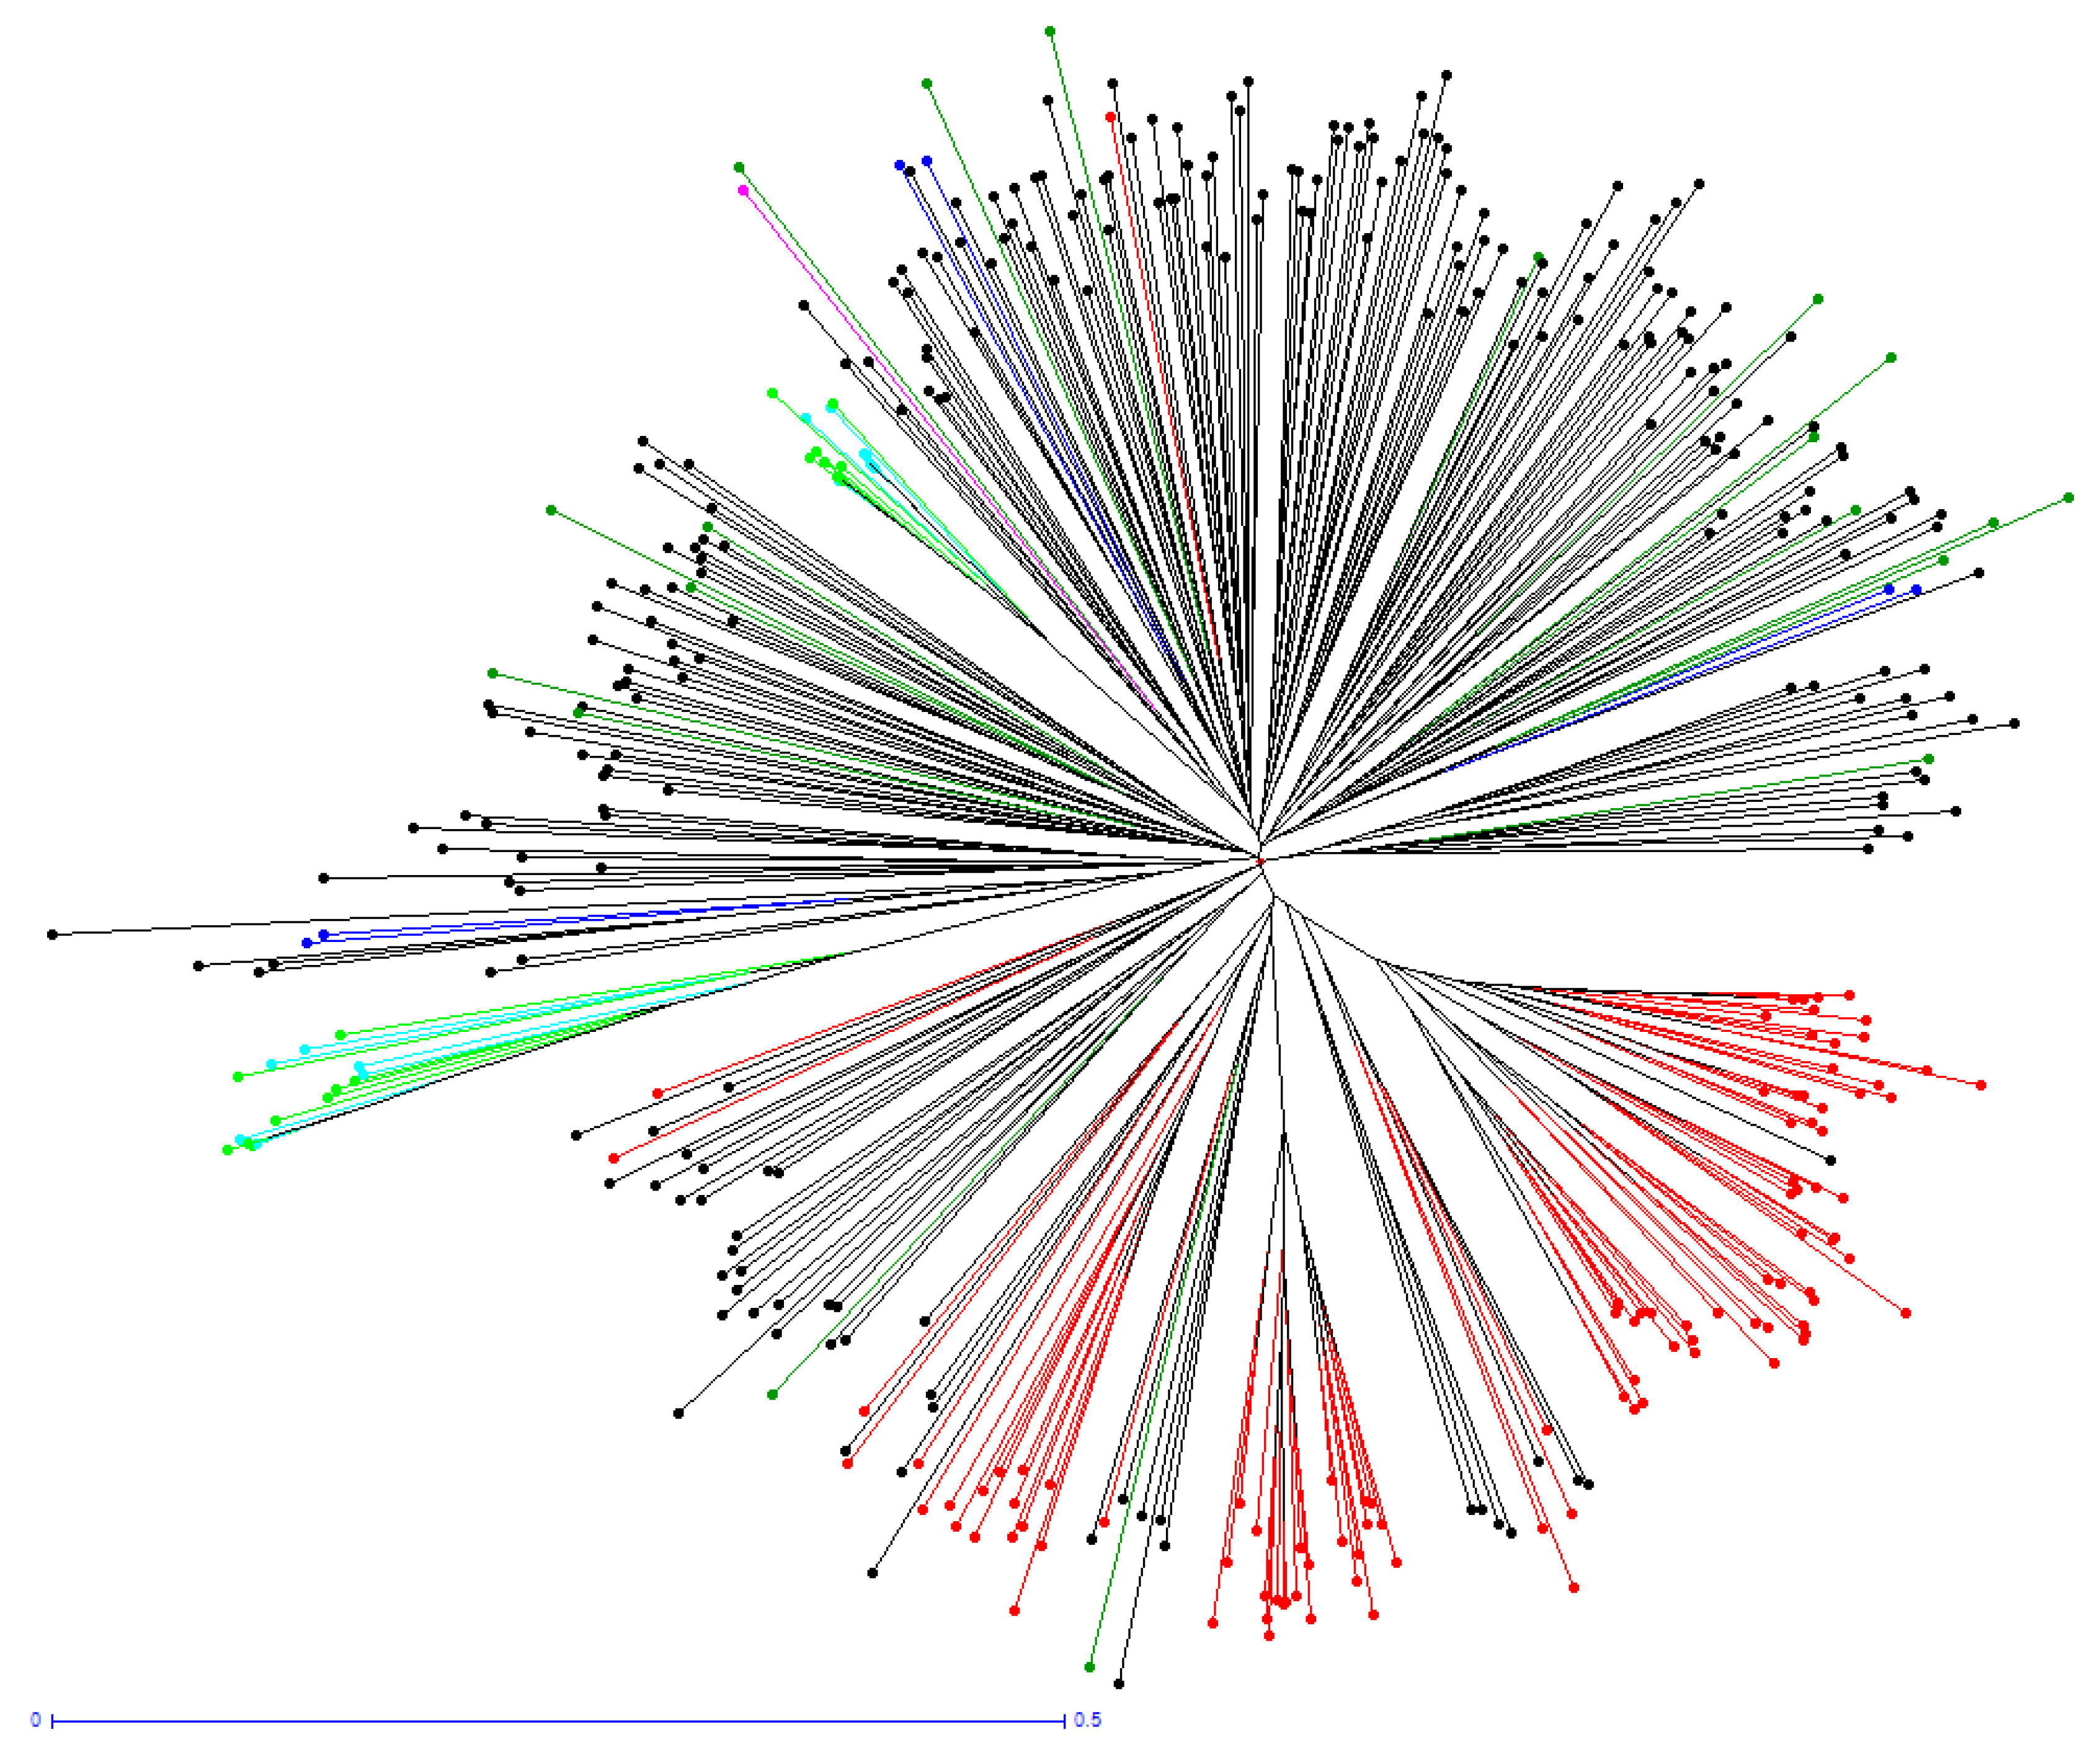
The neighbor-joining (NJ) tree, based on 17 SSR markers across 377 unique rye genotypes (including diploids and putative trisomics), clustered the genotypes in accordance with the population structure observed at K = 2 (Figure 2a).
Genetic Group 1 (GG1) comprised the commercial cultivars, while Genetic Group 2 (GG2) encompassed all Galician and Portuguese genotypes. Consistent with previous observations, Galician and Portuguese ecotypes Portugal and Galicia exhibited no significant differentiation (Figure 2b); a similar lack of divergence was observed between the Galician ecotypes ‘Palas’ and ‘Trevinca’.
Upon incorporating flour and bread samples (Figure 3), the neighbor-joining tree clustered all these derivatives with the Galician ecotypes. Although two distinct branches were observed, they showed no clear differentiation between the Galician ecotypes ‘Palas’ and ‘Trevinca’, nor between the conventional and organic management systems evaluated.

3.2.3. Factorial Component Analysis (FCA)

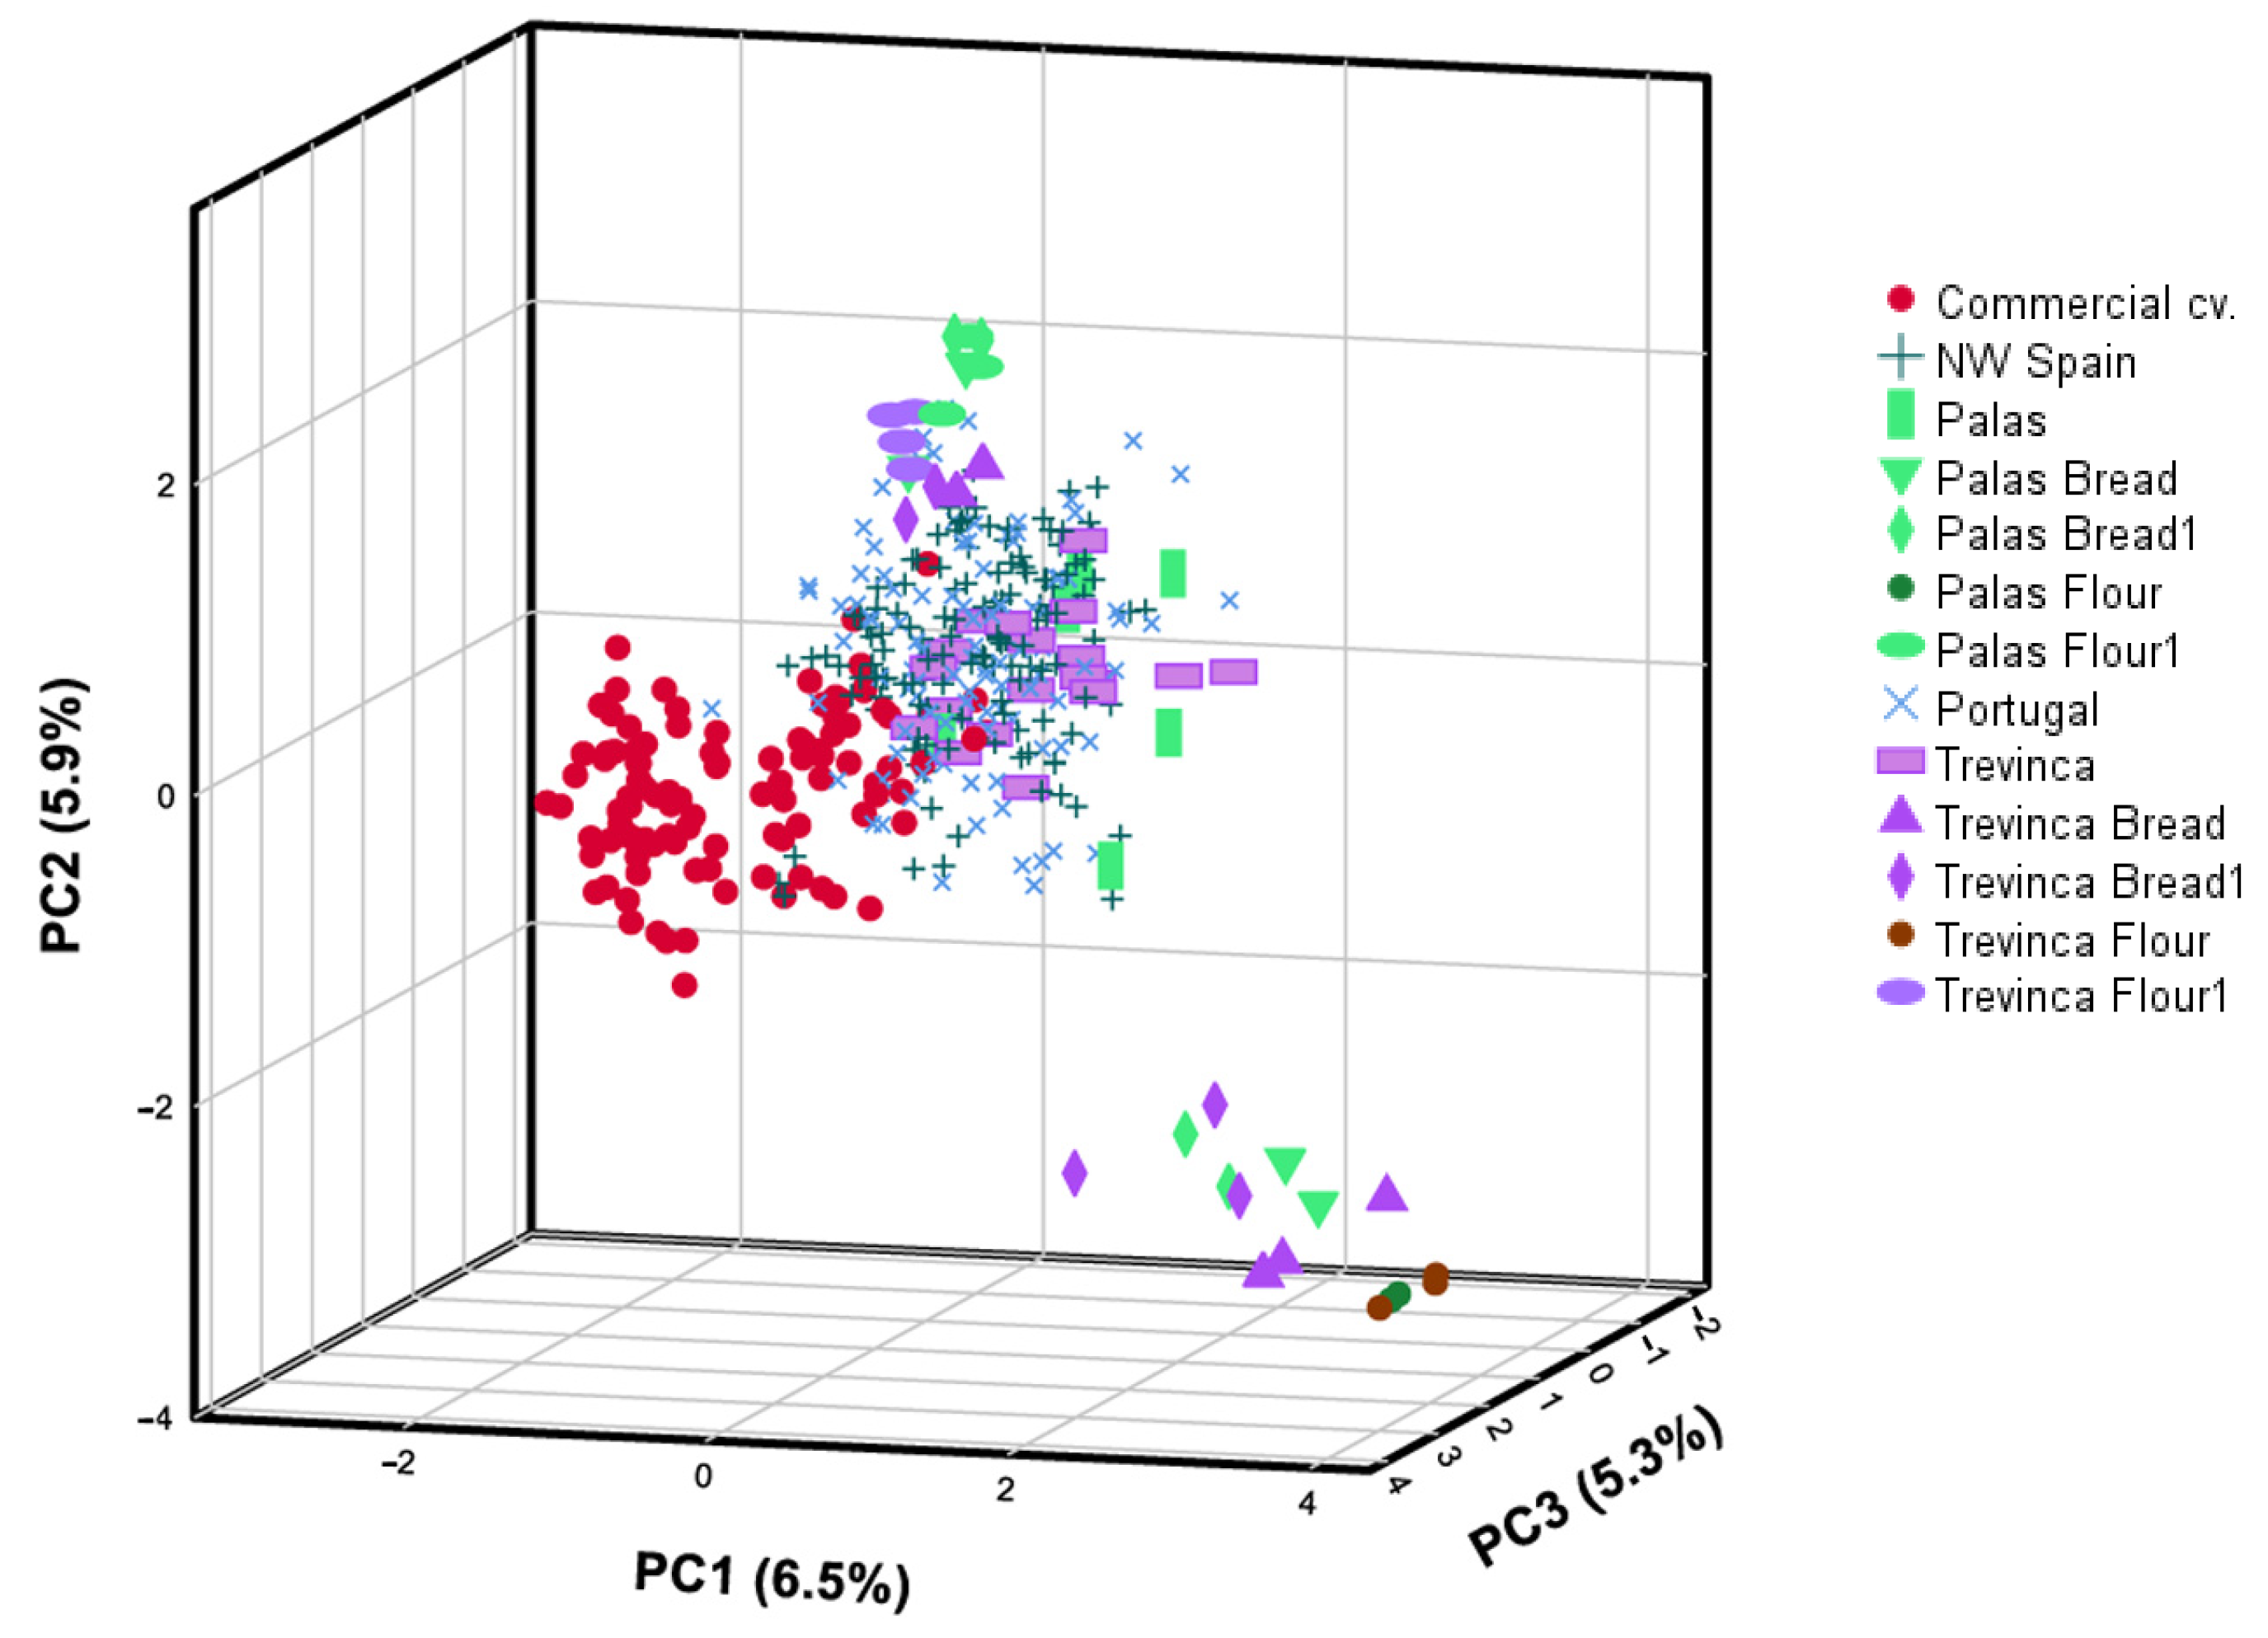
Factor Component Analysis (FCA), conducted using the principal components (PC) method, yielded results consistent with the Bayesian analysis; the two genetic groups were differentiated along the first axis, with GG1 positioned on the negative PC1 and GG2 on the positive PC1 (Figure 4).
All Galician rye derivatives were differentiated from commercial cultivars; while all flour samples clustered clearly with the Galician and Portuguese ecotypes and were distinct from commercial cultivars, breads produced from Galician ecotypes under the two management systems (organic vs. conventional) were scattered among the mixed flours.
The first three principal components (PCs) accounted for 17.7% of the cumulative variance, with PC1, PC2, and PC3 explaining 6.5%, 5.9%, and 5.3%, respectively, involving 41 out of 147 alleles (29%). The most influential alleles were as follows: SCM63-249 for PC1+ (predominantly found in Galician and Portuguese ecotypes and certain commercial putative trisomics, but absent in diploids); SCM75-184 for PC1− (frequent in commercial cultivars but rare in Galician and Portuguese diploid ecotypes, 3.6%); SCM180-140 and SCM47-172 for PC2+ (both significantly more frequent in Galician and Portuguese genotypes, with the latter being rare in commercial diploids, 3.4%); and SCM63-240 and SCM86-95 for PC3+ (more frequent in commercial cultivars) (Table S5).
Most of the rye samples and their derivatives were located in the PC1+ region, whereas the commercial cultivars were positioned in the PC1− region. Galician and Portuguese ecotypes were intermixed in the PC1+ region, as observed in the neighbor-joining tree (Figure 2). The Galician ecotypes ‘Palas’ and ‘Trevinca’ were also indistinguishable within the PC1+ region. A distinct group located in the PC1+ and PC2− quadrant included mainly breads produced from the ‘Palas’ or ‘Trevinca’ ecotypes.

4. Discussion

The average number of alleles observed in this study (8.2) was similar to the value reported by Monteiro et al. [7] (8.6), who analyzed 285 individuals from 28 accessions, including 11 on-farm accessions from the ‘Serra da Estrela’ region in Portugal. This similarity is noteworthy because only five SSR markers were shared between the two studies, and the present analysis also included Galician samples.
However, the observed and expected heterozygosity (Ho = 0.465; He = 0.588) were lower than those reported in the previous study (Ho = 0.68; He = 0.71), likely due to the specific SSRs evaluated and the presence of trisomic individuals in the dataset, which could not be included in the estimation of the heterozygosity. Notably, Ho was lower than He in both studies. We identified a higher total number of alleles, 139 in diploids and 147 including putative trisomics, compared to 122 by Monteiro et al. [7], potentially reflecting the slightly higher diversity present in the Galician germplasm. Furthermore, we identified a greater number of private alleles in Galician and Portuguese ecotypes relative to commercial cultivars than did Monteiro et al. [7], likely due to the different SSR sets utilized and the inclusion of Galician ecotypes.

4.1. Trisomics

Putative trisomic frequencies were notably higher in Portugal (33.9%) and Galicia (15.3%) compared to commercial cultivars (4.7%). According to Pilch [9], aneuploidy in rye arises from meiotic disturbances; trisomics have been reported at frequencies up to 38% in selfed triploids and backcrosses (3n × 2n). In local rye populations, the presence of trisomics has been associated with adaptation to environmental stress, particularly the harsh conditions that have promoted specific tolerances, such as aluminum tolerance in acidic soils [2].

4.2. Genetic Structure

This study successfully differentiated northwestern Iberian rye ecotypes from commercial cultivars, confirming the uniqueness of this genetic pool as previously identified by Seabra et al. [4].
Given that most modern cultivars derive from only two heterotic pools, ‘Carsten’ and ‘Petkus’ [29], the narrow genetic base of commercial rye remains a significant concern for breeders [7]. Incorporating local ecotypes is therefore essential for expanding genetic diversity in long-term breeding programs.
The similar genetic backgrounds observed in Portuguese and Spanish germplasm suggest a common historical origin [4], notwithstanding the higher frequency of putative trisomics in Portuguese accessions. This continuity aligns with the earliest archeological evidence of rye in the northwestern Iberian Peninsula, documented at Chan do Lamoso (Lugo, Galicia) between the Late Neolithic/Chalcolithic and the Early Bronze Age [30], with increasing prevalence across the peninsula during Late Antiquity and the Medieval period.
Genetic differentiation between local ecotypes and commercial cultivars was significant but moderate, with an Fst value of 0.089 (p < 0.01). This value is approximately double that reported by Monteiro et al. [7] for cultivars versus landraces (ex situ and in situ accessions), where AMOVA results indicated that variance among groups accounted for only 4.30% of the total genetic variability.
The higher, albeit moderate, differentiation observed in the present study may be attributed to the increased diversity introduced by the Galician ecotypes, which possessed nine alleles not present in the Portuguese samples.
The Fst value of 0.089 obtained in this study using SSRs was higher than the 0.01 reported between S. cereale and S. vavilovii by Schreiber et al. [31] using SNPs, yet substantially lower than the 0.5 differentiation between S. cereale and S. sylvestris.
The moderate genetic differentiation between local and commercial cultivars mirrors the relationship between wild and domesticated rye. This likely results from consistent gene flow between the two groups, facilitated by rye’s status as a “secondary domesticate” that evolved from a common weed in European wheat and barley fields. Furthermore, its outcrossing breeding system, together with the presence of trisomics as a mechanism for environmental adaptation, contributes to this genetic structure [2].
Although northern Portuguese and Galician ecotypes possess group-specific alleles and varying percentages of putative trisomics, there was no evidence of genetic differentiation in diploids based on AMOVA (Table S3). This suggests a common origin, consistent with historical evidence [4].
While the ‘Palas’ and ‘Trevinca’ ecotypes exhibit specific alleles that distinguish them from the broader genetic pool, this differentiation is less pronounced than that observed in other species, such as local wheat cultivars from the same region [14,15]. This reduced divergence is likely a consequence of rye’s allogamous nature and a historically less intensive selection process.
Flour and bread derivatives produced from local ecotypes and cultivars were clearly differentiated from commercial cultivars, even when blends were included in the analyses. Similar results have been observed for local wheats from the same region [14,15] and in Italy [32]. Cases where certain flour and bread samples were not directly assigned to their respective local genotypes, yet remained distinct from commercial cultivars, may be attributed to potential contamination during preparation, reduced DNA amplification efficiency, or the inclusion of commercial flour in the sourdough starter. These preliminary findings underscore the potential of this methodology for the traceability of traditional high-quality bread production throughout the “farm-to-fork” chain.
Finally, compared with studies on local wheat from the northwestern Iberian Peninsula used for traditional bread production [14,15], which employed a larger number of markers (24 in wheat versus 17 in the present study), and similarly to the rye study of Monteiro et al. [7], several limitations should be acknowledged, including the absence of cytological confirmation of trisomics (evidence in our study is based on the presence of a third allele in up to 33.9% of the Portuguese samples), the limited number of flour and bread samples analyzed (14 flours and 19 breads in this study, compared with 38 flours and 18 breads in wheat), and the lack of independent validation datasets for traceability analyses.
Nevertheless, this study was able to differentiate local rye ecotypes and their derivatives from commercial cultivars, despite their genetic proximity to commercial germplasm. Similar results were reported in a previous study on local wheat populations from northwestern Spain; however, specific differences may be attributed to the contrasting mating systems of the two species (allogamous in rye versus autogamous in wheat) and to rye’s status as a “secondary domesticate”, which is associated with lower genetic differentiation from commercial cultivars. Despite these limitations, the selected markers were able to trace local ecotypes from farm to fork [15].

5. Conclusions

SSR markers successfully differentiated rye ecotypes from Galicia and northern Portugal from commercial cultivars, despite the moderate genetic differentiation, confirming a shared genetic background across the northwestern Iberian Peninsula. These findings demonstrate the potential of SSR markers to support the authentication and traceability of local rye ecotypes in bakery products. However, further validation under real production conditions and with independent datasets is required before this approach can be considered a reliable traceability tool.
Furthermore, the ‘Palas’ and ‘Trevinca’ ecotypes can be distinguished by specific alleles, enhancing the precision of their identification. The genetic origin of these local ecotypes remains unknown, but the evidence obtained in this study aligns with the literature, which indicates that rye was cultivated in northern Portugal and Galicia from Roman times or even earlier. Their unique genetic fingerprints have likely been preserved through local environmental adaptation and the continued regional appreciation for traditional rye bread.
Long-term rye breeding programs must address the high diversity of local ecotypes relative to the narrow genetic base of commercial cultivars. Moreover, the unique genetic pool preserved in germplasm banks, which is already being used in local bread production—such as those at CIAM and UTAD—represents an extraordinary resource for maintaining and enhancing the quality of rye bread in the northwestern Iberian Peninsula and beyond.

Supplementary Materials

The following supporting information can be downloaded at: https://www.mdpi.com/article/10.3390/agriculture16141513/s1, Table S1: Samples included in the study with origin, type of material, number of samples, number of diploid/trisomic genotypes, and percentage of missing data; Table S2. Samples of rye evaluated classified by the genetic groups obtained by Structure software 2.3.4 [19,20] when K = 2 and K = 3; Table S3. Analysis of molecular variance (AMOVA) obtained with GenAlEx 6.5 [18] considering the RPPs obtained by the Structure software 2.3.4 [19,20] for K = 2; Table S4. Diversity parameters estimated using GenAlEx 6.5 [18] for the unique diploid genotypes; Table S5: Eigenvectors (PCA); Figure S1: Diploid and putative triploid images; Figure S2. Delta K obtained for diploid genotypes with Structure 2.3.4 [19,20] software.

Author Contributions

Conceptualization, A.M.R.-C., L.U.-Z., C.I.F.-O., I.C., A.I.C., V.C., Á.R.-R., M.P.E.-F., M.L.-F. and S.P.-L.; methodology, A.M.R.-C., C.I.F.-O., Á.R.-R. and S.P.-L.; software, A.M.R.-C., Á.R.-R., S.P.-L.; validation, A.M.R.-C., L.U.-Z., C.I.F.-O., Á.R.-R. and S.P.-L.; data curation, A.M.R.-C., L.U.-Z., C.I.F.-O., I.C., A.I.C., M.P.E.-F., M.L.-F. and S.P.-L.; writing—original draft preparation, A.M.R.-C., L.U.-Z. and S.P.-L.; writing—review and editing, A.M.R.-C., L.U.-Z., C.I.F.-O., I.C., A.I.C., V.C., Á.R.-R., M.P.E.-F., M.L.-F. and S.P.-L. All authors have read and agreed to the published version of the manuscript.

Funding

This work was supported by the Spanish Ministry of Science and Innovation (PID2021-123905OB-I00). by the Consolidation and structuring GPC GI-1649 (ED431B 2020/022. ED431B 2024/04), and also supported by national funds by FCT—Portuguese Foundation for Science and Technology (UID/04033/2025 and LA/P/0126/2020). Authors also thank the project ReFOOD4North (NORTE2030-FEDER-02654300), funded by the European Regional Development Fund (ERDF). This research was also supported in part by SubMeasure M10.22 (12/15/11/220321/13), FEADER-Xunta de Galicia. C.I.F-O was the beneficiary of a DOC-INIA-CCAA contract co-financed by the European Social Fund (CONV. 2015) and nowadays is hired through PTA-2022-021440-I, contract co-financed by MCIN/AEI/10.13039/501100011033 and FSE + in AGACAL (Xunta de Galicia).

Institutional Review Board Statement

Not applicable.

Data Availability Statement

The datasets generated during and/or analyzed during the current study are available from the corresponding author on reasonable request.

Conflicts of Interest

The authors declare no conflicts of interest.

References

  1. U.S. Department of Agriculture Agricultural Research Service. GRIN-Global Taxonomy: Taxonomy Detail. 2026. Available online: https://npgsweb.ars-grin.gov/gringlobal/taxon/taxonomydetail?id=33443 (accessed on 13 March 2026).
  2. Pinto-Carnide, O.; Guedes-Pinto, H. Aluminum Tolerance Variability in Rye and Wheat Portuguese Germplasm. Genet. Resour. Crop Evol. 1999, 46, 81–85. [Google Scholar] [CrossRef] [Scilit]
  3. Zadeike, D.; Copperstone, C.; Aleksandrova, O.; Ünal, D.Ö.; Šavikin, K.; Živković, J.; Güzel, M.; Kalkan Yildirim, H.; Künili, I.E.; Ivanova, T.; et al. Rye (Secale cereale L.) Revisited—Nutritional Composition, Functional Benefits, and Role in Sustainable Diets. Front. Nutr. 2025, 12, 1666455. [Google Scholar] [CrossRef] [Scilit] [PubMed]
  4. Seabra, L.; Teira-Brión, A.; López-Dóriga, I.; Martín-Seijo, M.; Almeida, R.; Tereso, J.P. The Introduction and Spread of Rye (Secale cereale) in the Iberian Peninsula. PLoS ONE 2023, 18, e0284222. [Google Scholar] [CrossRef] [Scilit] [PubMed]
  5. Santos, E.; Matos, M.; Silva, P.; Figueiras, A.M.; Benito, C.; Pinto-Carnide, O. Molecular Diversity and Genetic Relationships in Secale. J. Genet. 2016, 95, 273–281. [Google Scholar] [CrossRef] [Scilit] [PubMed]
  6. Targonska-Karasek, M.; Boczkowska, M.; Podyma, W.; Pasnik, M.; Niedzielski, M.; Rucinska, A.; Nowak-Zyczynska, Z.; Rakoczy-Trojanowska, M. Investigation of Obsolete Diversity of Rye (Secale cereale L.) Using Multiplexed SSR Fingerprinting and Evaluation of Agronomic Traits. J. Appl. Genet. 2020, 61, 513–529. [Google Scholar] [CrossRef] [Scilit] [PubMed]
  7. Monteiro, F.; Vidigal, P.; Barros, A.B.; Monteiro, A.; Oliveira, H.R.; Viegas, W. Genetic Distinctiveness of Rye In Situ Accessions from Portugal Unveils a New Hotspot of Unexplored Genetic Resources. Front. Plant Sci. 2016, 7, 1334. [Google Scholar] [CrossRef] [Scilit] [PubMed]
  8. Niedziela, A.; Bednarek, P.T. Population Structure and Genetic Diversity of a Germplasm for Hybrid Breeding in Rye (Secale cereale L.) Using High-Density DArTseq-Based SilicoDArT and SNP Markers. J. Appl. Genet. 2023, 64, 217–229. [Google Scholar] [CrossRef] [Scilit] [PubMed]
  9. Pilch, J. Originating of Rye Triploids (Secale cereale L.) as Initial Material for Obtaining Primary Trisomics. Genet. Pol. 1978, 19, 123–136. [Google Scholar]
  10. Schlegel, R. 100 Years of Chromosome Research in Rye, Secale L. Plants 2022, 11, 1753. [Google Scholar] [CrossRef] [Scilit] [PubMed]
  11. Tenhola-Roininen, T. Rye Doubled Haploids: Production and Use in Mapping Studies; University of Jyväskylä: Jyväskylä, Finland, 2009. [Google Scholar]
  12. Ramos-Cabrer, A.M.; Dìaz-Hernàndez, M.B.; Pereira-Lorenzo, S. Morphology and Microsatellites in Spanish Apple Collections. J. Hortic. Sci. Biotechnol. 2007, 82, 11512227. [Google Scholar] [CrossRef] [Scilit]
  13. Pereira-Lorenzo, S.; Urrestarazu, J.; Ramos-Cabrer, A.M.; Miranda, C.; Pina, A.; Dapena, E.; Moreno, M.A.; Errea, P.; Llamero, N.; Díaz-Hernández, M.B.; et al. Analysis of the Genetic Diversity and Structure of the Spanish Apple Genetic Resources Suggests the Existence of an Iberian Genepool. Ann. Appl. Biol. 2017, 171, 12385. [Google Scholar] [CrossRef] [Scilit]
  14. Ramos-Cabrer, A.M.; Fernández-Canto, N.; Almeida-García, F.; Gorostidi, A.; Lombardero-Fernández, M.; Romero-Rodríguez, M.Á.; Pereira-Lorenzo, S. Traceability of the Local Cultivar ‘Caaveiro’ in Flour Mixtures Used to Produce Galician Bread by Simple Sequence Repeats and Droplet Digital Polymerase Chain Reaction Technology. Int. J. Food Sci. Technol. 2022, 57, 7085–7098. [Google Scholar] [CrossRef] [Scilit]
  15. Urquijo-Zamora, L.; Pereira-Lorenzo, S.; Romero-Rodríguez, Á.; Lombardero-Fernández, M.; Ramos-Cabrer, A.M.; Fernández-Otero, C.I. Genetic Diversity of Local Wheat (Triticum aestivum L.) and Traceability in the Production of Galician Bread (Protected Geographical Indication) by Microsatellites. Agriculture 2025, 15, 51. [Google Scholar] [CrossRef] [Scilit]
  16. Saal, B.; Wricke, G. Development of Simple Sequence Repeat Markers in Rye (Secale cereale L.). Genome 1999, 42, 964–972. [Google Scholar] [CrossRef] [Scilit] [PubMed]
  17. Hackauf, B.; Wehling, P. Identification of Microsatellite Polymorphisms in an Expressed Portion of the Rye Genome. Plant Breed. 2002, 121, 17–25. [Google Scholar] [CrossRef] [Scilit]
  18. Peakall, R.; Smouse, P.E. GenAlEx 6.5: Genetic Analysis in Excel. Population Genetic Software for Teaching and Research—An Update. Bioinformatics 2012, 28, 2537–2539. [Google Scholar] [CrossRef] [Scilit] [PubMed]
  19. Pritchard, J.K.; Stephens, M.; Donnelly, P. Inference of Population Structure Using Multilocus Genotype Data. Genetics 2000, 155, 945–959. [Google Scholar] [CrossRef] [Scilit] [PubMed]
  20. Pritchard, J.K.; Stephens, M.; Rosenberg, N.A.; Donnelly, P. Association Mapping in Structured Populations. Am. J. Hum. Genet. 2000, 67, 170–181. [Google Scholar] [CrossRef] [Scilit] [PubMed]
  21. Pereira-Lorenzo, S.; Costa, R.M.L.; Ramos-Cabrer, A.M.; Ribeiro, C.A.M.; da Silva, M.F.S.; Manzano, G.; Barreneche, T. Variation in Grafted European Chestnut and Hybrids by Microsatellites Reveals Two Main Origins in the Iberian Peninsula. Tree Genet. Genomes 2010, 6, 701–715. [Google Scholar] [CrossRef] [Scilit]
  22. Porras-Hurtado, L.; Ruiz, Y.; Santos, C.; Phillips, C.; Carracedo, Á.; Lareu, M.V. An Overview of STRUCTURE: Applications, Parameter Settings, and Supporting Software. Front. Genet. 2013, 4, 98. [Google Scholar] [CrossRef] [Scilit] [PubMed]
  23. Kopelman, N.M.; Mayzel, J.; Jakobsson, M.; Rosenberg, N.A.; Mayrose, I. Clumpak: A Program for Identifying Clustering Modes and Packaging Population Structure Inferences across K. Mol. Ecol. Resour. 2015, 15, 1179–1191. [Google Scholar] [CrossRef] [Scilit] [PubMed]
  24. Michalakis, Y.; Excoffier, L. A Generic Estimation of Population Subdivision Using Distances Between Alleles with Special Reference for Microsatellite Loci. Genetics 1996, 142, 1061–1064. [Google Scholar] [CrossRef] [Scilit] [PubMed]
  25. Excoffier, L.; Smouse, P.E.; Quattro, J.M. Analysis of Molecular Variance Inferred from Metric Distances among DNA Haplotypes: Application to Human Mitochondrial DNA Restriction Data. Genetics 1992, 131, 479–491. [Google Scholar] [CrossRef] [Scilit] [PubMed]
  26. Perrier, X.; Flori, A.; Bonnot, F. Data Analysis Methods. In Genetic Diversity of Cultivated Tropical Plants; Hamon, P., Seguin, M., Perrier, X., Glaszmann, J.C., Eds.; Enfield, Science Publishers: Montpellier, France, 2003; pp. 43–76. [Google Scholar]
  27. Perrier, X.; Jacquemoud-Collet, J. DARwin Software; CIRAD: Montpellier, France, 2006.
  28. IBM Corp. IBM SPSS Statistics for Windows, 29.0.0.2; IBM Corp.: Armonk, NY, USA, 2022.
  29. Targońska, M.; Bolibok-Brągoszewska, H.; Rakoczy-Trojanowska, M. Assessment of Genetic Diversity in Secale Cereale Based on SSR Markers. Plant Mol. Biol. Report. 2016, 34, 37–51. [Google Scholar] [CrossRef] [Scilit] [PubMed]
  30. Stefanini, B.S. A Comparison of Climate and Vegetation Dynamics in Central Ireland and NW Spain Since the Mid-Holocene; Trinity College: Dublin, Ireland, 2008. [Google Scholar]
  31. Schreiber, M.; Himmelbach, A.; Börner, A.; Mascher, M. Genetic Diversity and Relationship between Domesticated Rye and Its Wild Relatives as Revealed through Genotyping-by-Sequencing. Evol. Appl. 2019, 12, 66–77. [Google Scholar] [CrossRef] [Scilit] [PubMed]
  32. Morcia, C.; Ghizzoni, R.; Bergami, R.; Scaramagli, S.; Delogu, C.; Andreani, L.; Terzi, V.; Carrara, I.; Della, D. Digital PCR for the Authentication of KAMUT® Brand Wheat in Grain and Flour Mixtures. Foods 2026, 15, 910. [Google Scholar] [CrossRef] [Scilit] [PubMed]
Figure 1. Bayesian analysis conducted on 17 microsatellite (SSR) loci for 310 unique diploid rye genotypes using Structure 2.3.4 software. The analysis illustrates genetic clustering assuming K = 2 (upper plot) and K = 3 (lower plot) with a membership probability (qI) threshold of 80%. Galician and Portuguese ecotypes are represented in green, while commercial cultivars are indicated in red (K = 2) and partitioned into red and orange at K = 3.
Agriculture 16 01513 g001
Figure 2. Neighbor-joining trees based on 17 SSR markers across 377 unique rye genotypes (2n and putative trisomics). (a) Genotypes color-coded by Structure analysis (K = 2). Red: GG1 (commercial cultivars, qI > 80%); green: GG2 (Galician and Portuguese ecotypes, qI > 80%); black: admixed; yellow: putative trisomics. (b) Detailed distribution of GG2. Red: GG1 (commercial cultivars, qI > 80%); blue: Portuguese ecotypes (GG2, qI > 80%); green: Galician ecotypes (GG2, qI > 80%); black: admixed. The Galician ecotypes ‘Palas’ and ‘Trevinca’ are highlighted in violet and orange, respectively.
Agriculture 16 01513 g002
Figure 3. Neighbor-joining tree based on 17 SSR markers for 411 unique rye genotypes (2n, putative trisomics, and derivative flours and breads). Color coding is as follows: red: GG1 (commercial cultivars); black: Galician and Portuguese ecotypes; dark blue: ecotype ‘Palas’; light blue: derivatives with ‘Palas’; dark green: ecotype ‘Trevinca’; light green: derivatives with ‘Trevinca’; violet: commercial bread made with Galician flour.
Agriculture 16 01513 g003
Figure 4. Factorial Component Analysis (FCA) performed via the Principal Components method in SPSS V.29.0.0.2, illustrating allelic variation across 17 SSRs for 411 rye genotypes. The dataset includes commercial cultivars and ecotypes from Galicia and Portugal, categorized into two genetic groups (K = 2) as determined by Structure software. Distinct markers identify the Galician ecotypes ‘Palas’ and ‘Trevinca’, as well as derivative flour and bread samples containing 25% (‘Bread’ and ‘Flour’) and 100% (‘Bread1’ and ‘Flour1’) of these respective Galician cultivars.
Agriculture 16 01513 g004
Table 1. Number of effective alleles (Ne), information index (I), observed heterozygosity (Ho), expected and unbiased expected heterozygosity (He and uHe), and fixation index (F) for 310 unique diploid genotypes of rye. Number of alleles (Na) and allele sizes (bp) are provided for both diploids and putative trisomics. Values in bold denote exclusive alleles of putative trisomics; underlined values indicate alleles found only in Galician flours; and values in italics represent alleles absent from commercial cultivars.
NaNeIHoHeUHeFAlleles (bp)
SCM109 a155.92.10.3310.8320.8330.60292, 94, 96, 98, 101, 103, 109, 112, 114, 127, 129, 131, 133, 135, 137, 141
SCM86 a176.72.10.8010.8500.8510.05795, 98, 100, 102, 104, 106, 108, 114, 116, 118, 120, 122, 124, 126, 128, 130, 142, 144
SCM9 a61.30.50.1090.2270.2270.521208, 210, 220, 222, 224, 228
SCM120 a92.41.20.1130.5770.5780.804111, 114, 116, 118, 121, 125, 127, 129, 131, 134
SCM304 a195.82.10.8360.8290.830−0.009231, 233, 235, 237, 239, 241, 242, 244, 246, 249, 252, 254, 256, 258, 260, 262, 264, 266, 268, 272
SCM43 a136.52.10.7480.8460.8470.11689, 91, 93, 95, 97, 100, 102, 104, 106, 108, 110, 112, 114
SCM75 a133.91.70.7040.7470.7480.057176, 178, 180, 182, 184, 186, 188, 190, 192, 194, 196, 200, 204
SCM104 a51.50.60.3840.3250.325−0.183170, 181, 183, 185, 187, 189
SCM180 a73.51.40.4530.7150.7160.366100, 128, 136, 138, 140, 142, 145, 147, 149
SCM29 b73.21.30.5840.6840.6850.14596, 98, 100, 102, 105, 108, 111
SCM139 b43.51.30.5740.7130.7140.194128, 132, 134, 138
SCM168 b32.41.00.5340.5780.5790.076114, 120, 123
SCM50 b22.00.70.4980.5000.5010.003119, 122
SCM41 b81.70.80.2930.4270.4280.314130, 136, 140, 146, 150, 154, 157, 164
SCM171 b41.50.60.1660.3310.3320.500213, 215, 217, 219
SCM47 b31.50.50.2800.3330.3330.158156, 167, 172, 175
SCM63 b41.90.90.4970.4830.484−0.028240, 242, 249, 251
Means8.23.21.20.4650.5880.5890.217Total number of alleles: 147 (6 in putative trisomics, 2 in Galician flours)
a [16]; b [17].
Disclaimer/Publisher’s Note: The statements, opinions and data contained in all publications are solely those of the individual author(s) and contributor(s) and not of MDPI and/or the editor(s). MDPI and/or the editor(s) disclaim responsibility for any injury to people or property resulting from any ideas, methods, instructions or products referred to in the content.