Article

Mapping Quantitative Trait Loci for Pre-Harvest Sprouting Resistance in Wheat Using Berkut × Worrakatta Recombinant Inbred Lines

1
Xinjiang Engineering Research Center of High-Quality Special Wheat Crops, College of Agronomy, Xinjiang Agricultural University, Urumqi 830052, China
2
Key Laboratory of Crop Genetic Improvement and Germplasm Enhancement, Xinjiang Agricultural University, Urumqi 830052, China
3
International Joint Laboratory for Crop Biotechnology Along the Silk Road Economic Belt, Urumqi 830052, China
*
Author to whom correspondence should be addressed.
These authors contributed equally to this work.
Agriculture 2026, 16(9), 926; https://doi.org/10.3390/agriculture16090926
Submission received: 1 March 2026 / Revised: 15 April 2026 / Accepted: 17 April 2026 / Published: 23 April 2026

Abstract

Pre-harvest sprouting (PHS) in wheat is a significant global challenge influenced by climate. This study aimed to decipher the genetic underpinnings of PHS and identify resistance genes using 309 recombinant inbred lines (RILs) derived from the “Berkut” × “Worrakatta” cross. Methods: Phenotypic assessment of PHS traits was performed using the whole-spike sprouting method across various environments, complemented by quantitative trait loci (QTL) analysis employing a wheat 50 K SNP chip. Results showed high PHS rates in both parental lines across multiple environments. Progeny exhibited substantial variation in PHS rates, with coefficients of variation ranging from 0.16 to 0.19 and phenotypic variation ranging from 23.92% to 100%, suggesting pronounced transgressive segregation. Nine QTLs associated with PHS were identified on chromosomes 1AL, 1DL, 2AL, 2AS, 2BS, 3DS, 4BL, and 7BL. These loci accounted for 2.67% to 6.39% of the phenotypic variation. Notably, the enhancer alleles at four loci—1DL, 2BS, 4BL, and 7BL—originated from “Worrakatta”, and “Berkut” contributed the enhancer alleles at the remaining five loci. Two QTLs, QPHS.xjau-1AL.1 and QPHS.xjau-1AL.2, were stable across multiple environments. Specifically, QPHS.xjau-1AL.1 was present in three environments and explained 3.86% to 6.39% of the phenotypic variation, while QPHS.xjau-1AL.2 appeared in one environment under average conditions, explaining 2.67% to 4.87% of the variation. Our study also identified eight candidate genes associated with wheat PHS, including those encoding Myb transcription factors that influence flavonoid biosynthesis and grain color, as well as genes involved in stress response and gibberellin biosynthesis, which are crucial for plant growth and development. These genes represent vital targets for enhancing wheat PHS resistance.

1. Introduction

Pre-harvest sprouting (PHS) in wheat is a significant global climatic challenge caused by climatic conditions, occurring during ripening following sustained rainfall or high humidity [1,2]. In China, PHS frequently affects major wheat-growing regions including the Huang-Huai Valley, the southwestern winter wheat zone, and the middle and lower reaches of the Yangtze River, which collectively account for approximately 83% of the nation’s total wheat cultivation area. Severe PHS events in 2016, 2018, and 2023 significantly reduced yields and degraded grain quality in provinces including Jiangsu, Anhui, Sichuan, Hubei, and Henan. PHS onset is influenced by multiple factors, including intrinsic wheat variety characteristics (such as the water-holding capacity of spikes, glume traits, grain moisture content, endogenous hormones in seeds, and seed dormancy levels), as well as environmental conditions. However, breeding for PHS resistance is difficult because it is a quantitatively inherited trait affected by both genetic and environmental factors [3]. Therefore, understanding the PHS characteristics of existing wheat germplasm and the functional genes controlling these traits is crucial for strategically utilizing these resistance resources to breed new, high-quality, and high-yield varieties with PHS resistance.
Substantial research indicates that wheat PHS is a quantitative trait influenced by multiple QTLs or genes. For example, Munkvold identified a significant QTL, QPhs.cnl-2B.1, on chromosome 2B using a doubled haploid (DH) population, which accounted for 5–31% of the phenotypic variation [4]. Torada identified mitogen-activated protein kinase kinase 3 (MKK3), designated TaMKK3-A, as the candidate gene for the seed dormancy locus Phs1 on chromosome 4A in bread wheat [5]. Additionally, Liu and Bai located another significant PHS-resistant QTL tightly linked to the marker Xbarc57 on chromosome 3AS and successfully cloned Triticum aestivum Pre-Harvest Sprouting 1 (TaPHS1) from the white-grained, PHS-resistant wheat Rio Blanco [6]. Osa used an RIL population from a Zenkoujikomugi (Zen) and Chinese Spring (CS) to identify a major resistance locus, QPhs.ocs-3A.1, located near the molecular marker Xfbb370 on chromosome 3AS [7]. Zhou performed a genome-wide association study on 717 Chinese wheat landraces and detected a major QTL for PHS resistance on chromosome 3D, which co-localizes with the grain color transcription factor TaMyb10 [8]. Yang identified another major QTL for PHS resistance, QPHS.sicau-3D, on chromosome 3D in the synthetic wheat SHW-1, which was derived from the highly dormant tetraploid AS60 and moderately PHS-resistant diploid AS2255, and this QTL accounted for 42.47% of the phenotypic variation in PHS resistance across various environments [9]. Furthermore, Zhang discovered TaSdr-B1, a homolog of the rice seed dormancy gene Oryza sativa Seed Dormancy 4 (OsSdr4), located on chromosome 2BS, and also developed a functional marker Sdr2B [10]. TaSdr-B1 is considered a candidate gene for a previously reported major PHS-resistant QTL on chromosome 2B.
Despite significant advances in QTL mapping and wheat PHS research [2,4,7,11,12,13,14], the efficacy of PHS resistance in wheat varies significantly under different environmental conditions. Aggregating multiple PHS-resistant genes can effectively enhance the resistance levels of wheat varieties. Currently, the primary method for improving PHS resistance is the aggregation of effective PHS-resistant genes through marker-assisted selection (MAS) breeding [15]. To identify stable PHS resistance loci and key genes, this study focused on a recombinant inbred line (RIL) population consisting of 309 families derived from the cross between the “Berkut” and “Worrakatta” wheat varieties. Although both parental lines are phenotypically susceptible to PHS—with “Worrakatta” exhibiting extreme susceptibility (~95–99% germination) and “Berkut” showing moderate susceptibility (~84–89%)—their derived RIL population displays profound transgressive segregation. Notably, numerous offspring exhibit robust PHS resistance with germination rates as low as ~24%, suggesting that “Berkut” and “Worrakatta” possess distinct hidden beneficial alleles that recombine in the progeny. QTL mapping analysis for PHS was conducted using a wheat 50K SNP chip in this population under various environmental conditions. Our goal is to uncover these cryptic alleles to facilitate MAS breeding and the aggregation of multiple resistance genes to develop new wheat varieties with enhanced PHS resistance.

2. Materials and Methods

2.1. Plant Materials

The parental lines and the RIL population were generously provided by the Wheat Research Institute of the Chinese Academy of Agricultural Sciences. The experimental materials consisted of 309 RILs (F6 generation) derived from the wheat varieties “Berkut” and “Worrakatta”. These varieties were originally sourced from the International Maize and Wheat Improvement Center (CIMMYT) and donated by the Wheat Research Institute. The experimental materials were cultivated over three consecutive years (2018 to 2020) at the Manas Experimental Station of the Xinjiang Academy of Agricultural Sciences, referred to as 2018M, 2019M, and 2020M, respectively. Additionally, in 2019, a trial was also conducted at the Sanping Farm Experimental Base of Xinjiang Agricultural University, denoted as 2019S. For all field trials, seeds were sown in Spring and harvested in July. The field trials were laid out in a randomized complete block design (RCBD) with two replications in each environment. The average data from these three consecutive years, covering a total of four environments, was used to represent the mean environment (abbreviated as A). The experimental materials were systematically planted in single rows, each measuring 2 m in length with a spacing of 25 cm between rows. The management practices, including fertilization, drip irrigation, pest control, and weed management, conformed to the standard local field protocols.

2.2. Method

Phenotypic identification of pre-harvest sprouting (PHS) was conducted on the RIL population across four environments from 2018 to 2020. At the late dough stage of wheat development, 10 main stem spikes, including the peduncle, were harvested from each line. These spikes were air-dried indoors for one day and subsequently stored at −20 °C to preserve dormancy. After harvesting all materials, a unified PHS assessment was carried out using a completely randomized design for the laboratory evaluation. The process began with soaking the whole spikes in distilled water for 10–12 h. Subsequently, they were disinfected using a 0.1% sodium hypochlorite solution for 15 min, rinsed thoroughly with sterile water, wrapped in germination paper, and placed in ventilated plastic bags (with 3–5 micropunctures of 0.5 mm diameter) to maintain humidity while allowing gas exchange. These preparations were then incubated in a controlled environment chamber set at 20 °C for seven days, with a photoperiod of 16 h of light and 8 h of darkness and relative humidity of 80%. Following this incubation period, the spikes were quickly dried in an electric constant temperature oven set at 150 °C to halt further germination. The grains were then manually threshed, using embryo rupture as the criterion for successful germination [16]. The 10 harvested spikes per line were divided into two replicates (five spikes per replicate). The PHS percentage for each line was calculated using the average results from these two replicates. The whole-spike germination percentage (GP) was determined by dividing the number of germinated grains in five spikes by the total number of grains and then multiplying by 100%.

2.3. Statistical Analysis of Phenotypic Data

Basic statistical analyses were performed using Microsoft Excel 2016 and SPSS software version 21.0. Descriptive statistics and analysis of variance were conducted using QTL IciMapping V4.1 software [17]. Broad-sense heritability (H2) was calculated using the formula H2 = σ2g/[(σ2g + σ2gt)/r + σ2e/r], where σ2g is the genotypic variance, σ2e is the error variance, σ2gt is the genotype-by-environment interaction variance, and r is the number of replicates. Variance components (σ2g, σ2gt, and σ2e) were estimated from ANOVA using the equations σ2g = (MSG − MSGxE)/(rE), σ2gt = (MSGxE − MSe)/r, and σ2e = MSe, where MSG is the mean square for genotypes, MSGxE is the mean square for genotype × environment interaction, MSe is the mean square for residual error, r is the number of replicates, E is the number of environments, and rE is the product of the number of replicates (r) and the number of environments (E) [18].

2.4. Linkage Map Construction and QTL Analysis

The wheat 50 K SNP chip used in the study was processed and genotyped by Beijing CapitalBio Technology Co., Ltd. (Beijing, China). After the screening of polymorphic markers, genotype data of the 309 RILs (the 309 F6 RILs described in Section 2.2) were imported into QTL IciMapping version 4.1 software. Redundant markers were removed using the “BIN” module (a specific tool for binning markers), and the genetic linkage map for the population was constructed using the “MAP” module (a specific tool for map construction). A total of 28 linkage groups were established, covering all 21 chromosomes of common wheat. The inclusive composite interval mapping (ICIM-ADD) method was employed to identify major QTLs. Considering that PHS resistance is a complex quantitative trait governed by multiple loci, an empirical LOD threshold was set to 2.0 to ensure the capture of both major loci and critical minor-effect QTLs, a strategy consistent with previous wheat mapping studies. Default settings were used for other parameters. QTLs detected on the same chromosome and sharing overlapping genetic positions of peak values were classified as the same locus, and QTLs identified in two or more environmental conditions were considered to be stably inherited. QTLs were named according to the format “Q” followed by the trait abbreviation, the institution abbreviation (xjau), and the chromosome where the QTL was located.

2.5. Prediction of Candidate Genes

For QTLs identified as stably inherited or having significant phenotypic contributions, candidate genes were predicted. First, to define the target QTL regions, the physical positions of the flanking SNP markers corresponding to the genetic confidence intervals of these stable QTLs were anchored to the Chinese Spring wheat reference genome [IWGSC RefSeq v1.1] using BLASTN (http://www.ncbi.nlm.nih.gov, accessed on 15 May 2025). The physical genomic regions bounded by these flanking markers were then delineated. Within these specific physical intervals, high-confidence (HC) gene models were extracted based on the official IWGSC genome annotation file.
Subsequently, functional annotations of these extracted genes were conducted to delineate their potential roles. This was achieved by retrieving their protein functions and Gene Ontology (GO) terms using the UniProt database (https://www.uniprot.org/), the National Center for Biotechnology Information (NCBI) database (http://www.ncbi.nlm.nih.gov/), and the Triticeae Multi-omics Center (http://202.194.139.32/, accessed on 20 June 2025). During the screening process, genes whose functional annotations were associated with seed dormancy, plant hormone signal transduction (e.g., abscisic acid and gibberellin pathways) or seed development, or those previously reported as homologous with known PHS resistance genes, were prioritized as high-confidence candidate genes.

2.6. QTL Meta-Analysis

The collected QTL data, including QTL name, QTL position, LOD score, phenotypic variation rate, closely linked markers, confidence interval, and population size, were analyzed using BioMercator V4.2.3 [19]. Among these parameters, the QTL position (confidence interval and peak position) and the genetic contribution rate are critical for effectively conducting QTL meta-analysis.

3. Results

3.1. Phenotypic Analysis of PHS in Parents and RIL Population

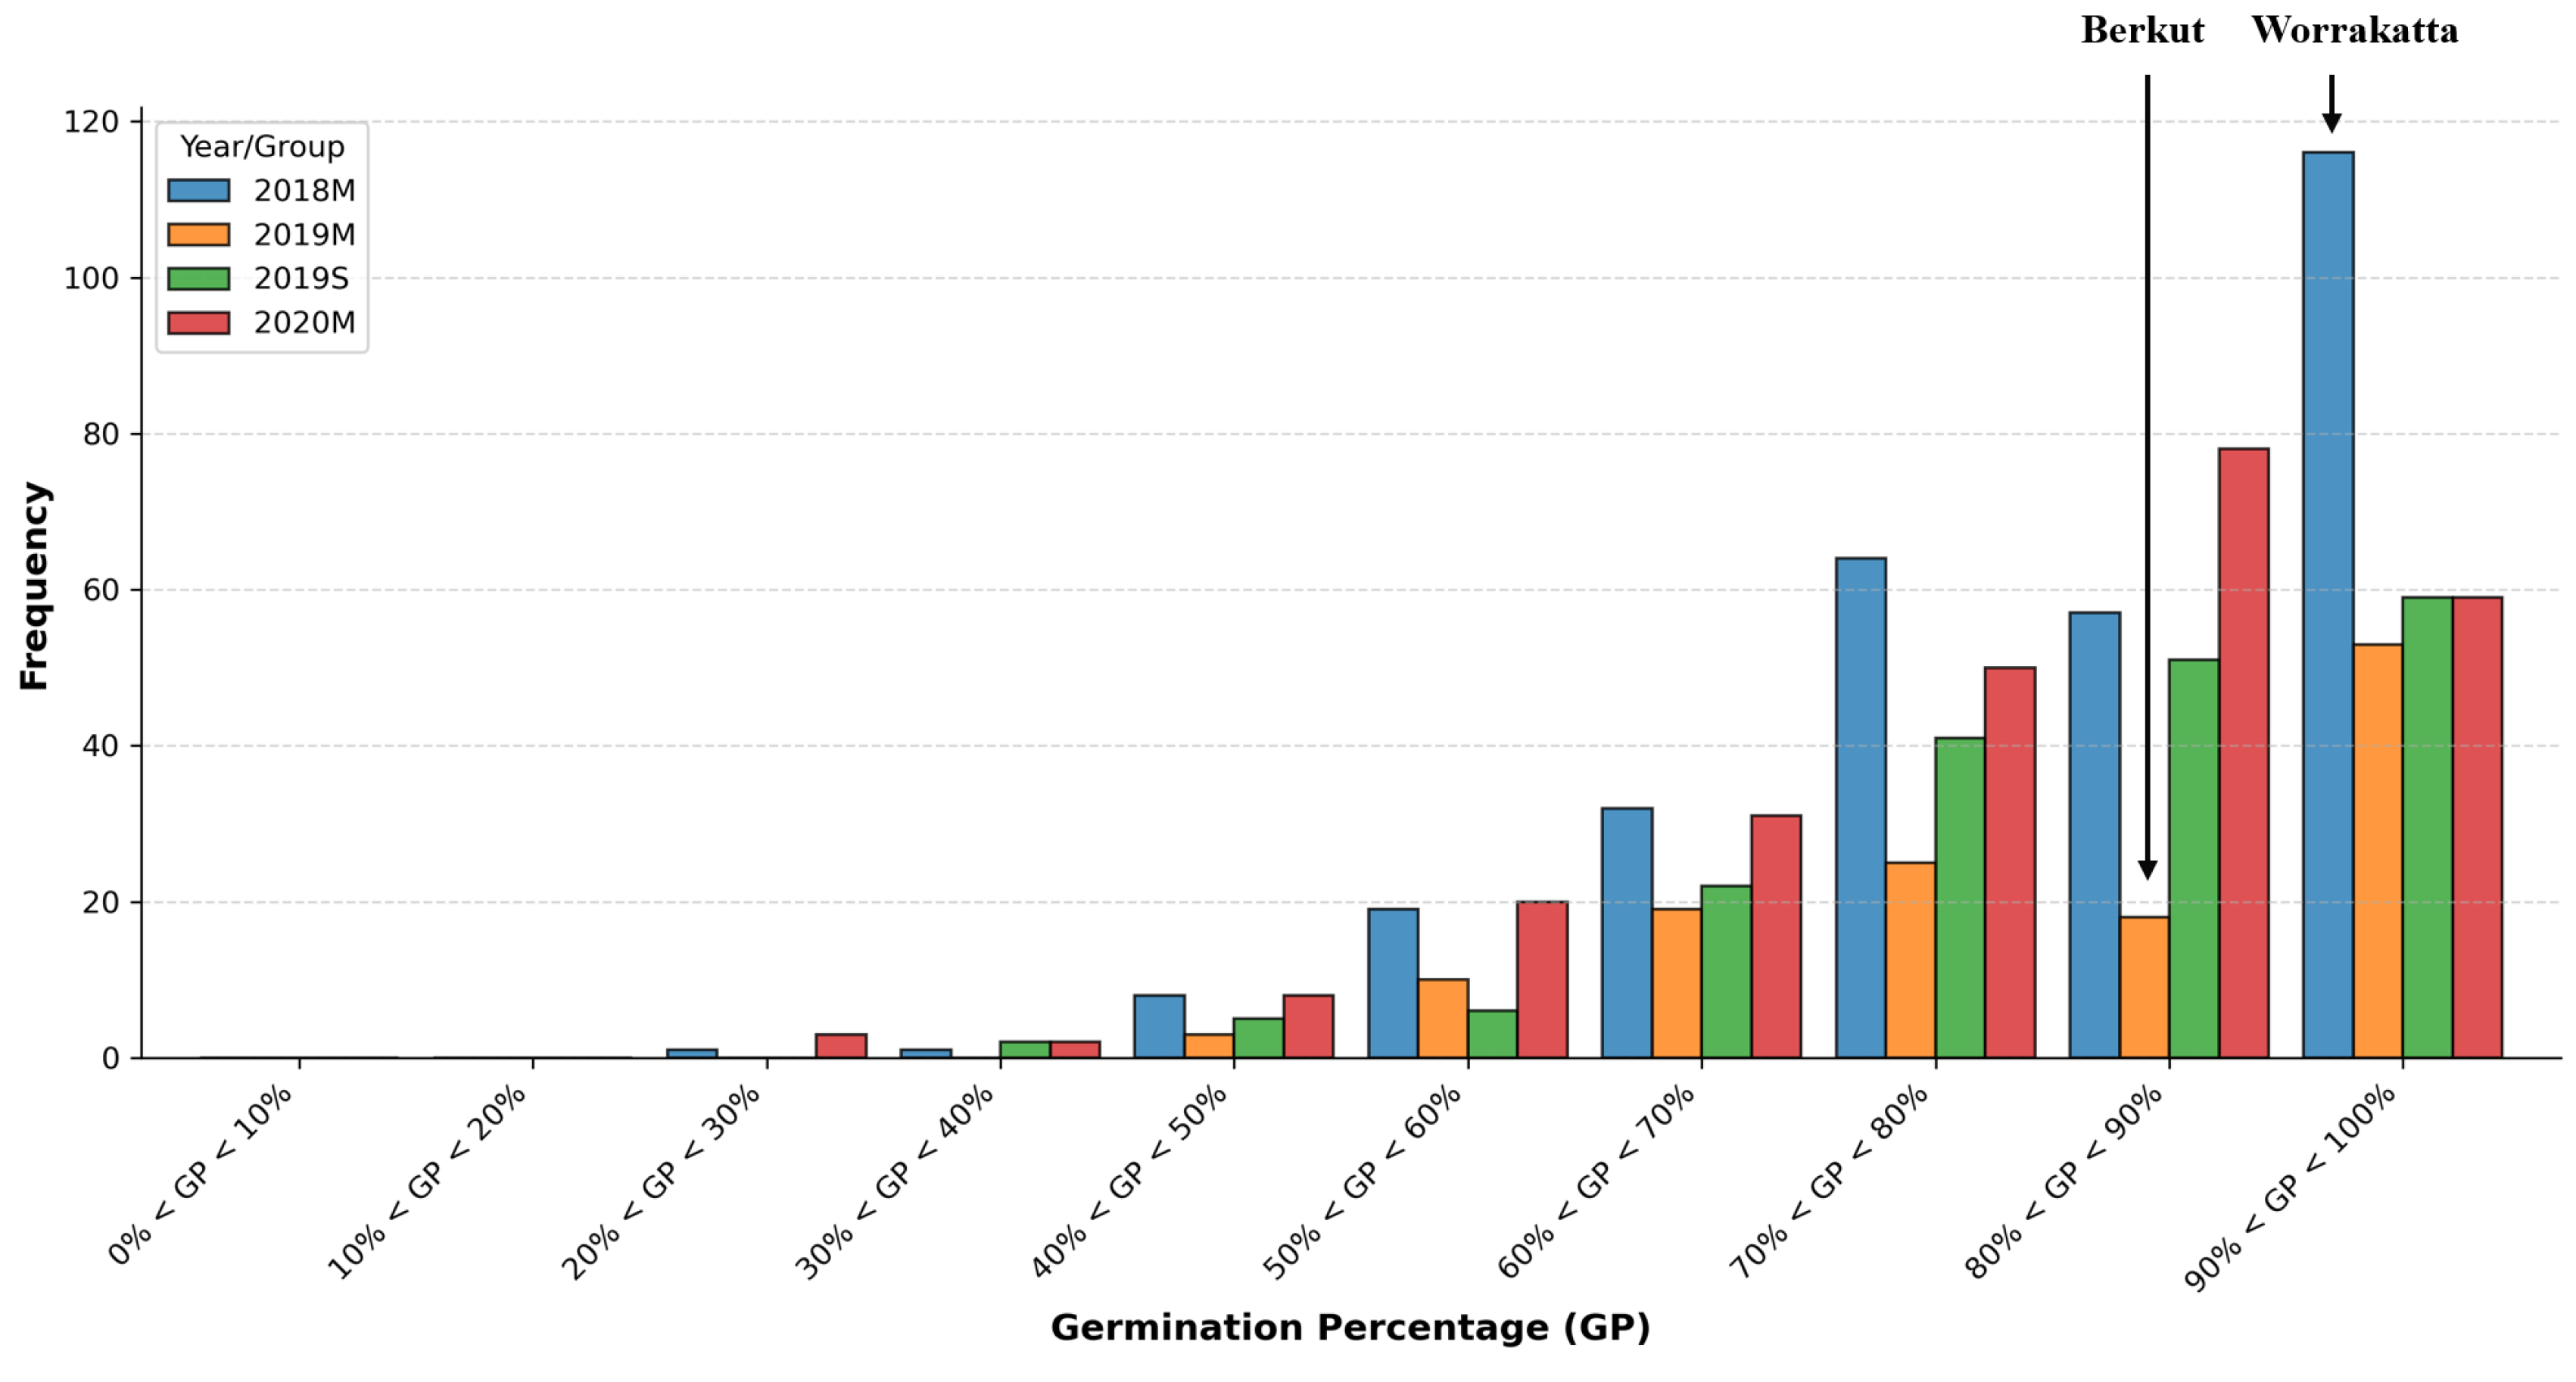
Across four distinct environments, whole-spike pre-harvest sprouting (WSPS) rates showed generally consistent trends within the RIL population. Both parental lines exhibited high WSPS rates, and the RIL population correspondingly displayed a high average rate, indicating weak overall PHS resistance (Table 1 and Figure 1). Within the RIL population, the coefficient of variation (CV) for WSPS rates ranged from 0.16 to 0.19 across the four environments. Importantly, the actual phenotypic WSPS rates (i.e., the raw germination percentages) exhibited a remarkably wide range, varying from an absolute minimum of 23.92% to a maximum of 100.00% (Table 1). This substantial phenotypic variation, particularly the emergence of highly resistant RILs (germination rates as low as ~24%) from susceptible parents, provides strong evidence of transgressive segregation. Correlation analysis revealed strong positive relationships between WSPS rates measured across the four environments, ranging from 0.51 to 0.84 (p < 0.01) (Table 1). Variance analysis identified extremely significant differences in WSPS rates among RILs across environments (p = 1.0 × 10⁻⁵) (Table 2), suggesting that genotype, environment, and their interaction all significantly influence PHS resistance. The broad-sense heritability for PHS traits across environments was 0.86. This value explicitly demonstrates that 86% of the observed phenotypic variation is attributable to genetic variance rather than environmental noise. Because the phenotype strongly reflects the true underlying genotype with minimal environmental confounding effects, breeders can reliably identify and select genuinely resistant plants in early segregating generations. Therefore, early-generation phenotypic selection serves as a highly effective and robust strategy for PHS resistance breeding.

3.2. QTLs for PHS Traits

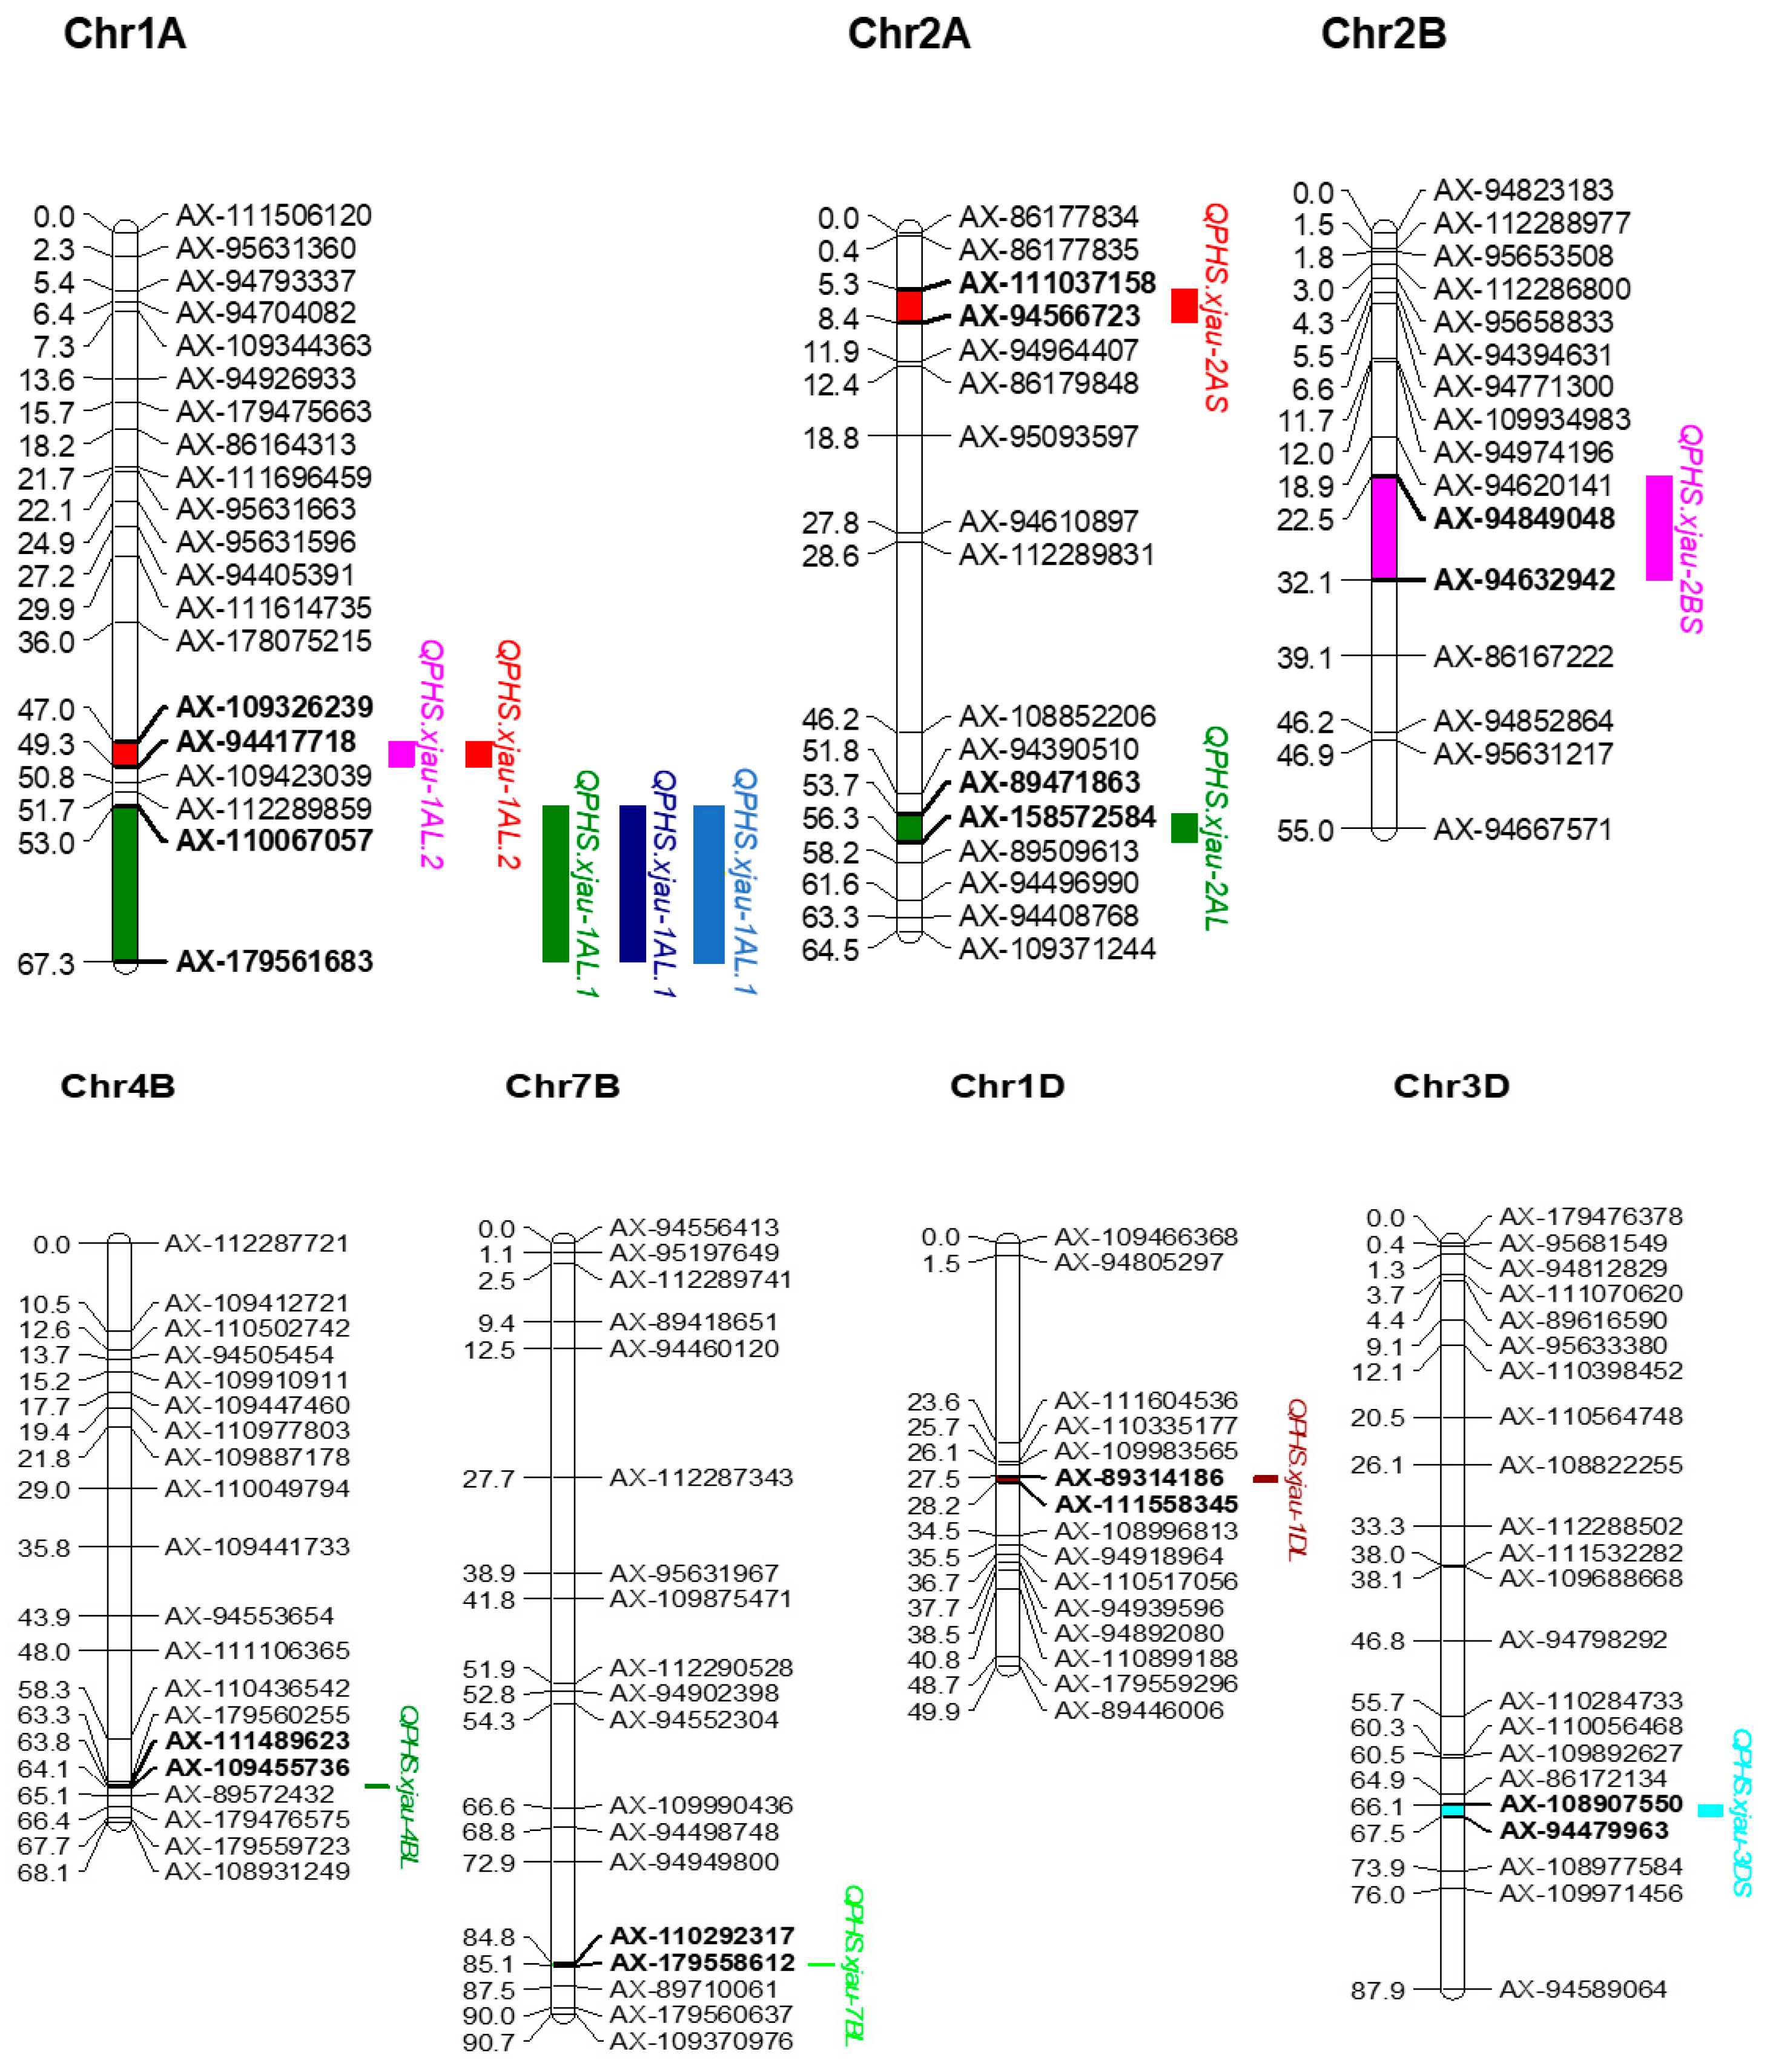
By integrating PHS rate data from 309 RIL families with genotype data from the wheat 50 K SNP chip, additive effect QTL mapping was performed using the inclusive composite interval mapping (ICIM -ADD) method. This analysis identified nine QTLs associated with PHS traits, distributed across seven chromosomes (Table 3). Five QTLs exhibited positive additive effects, while four displayed negative additive effects. Individual QTLs accounted for 2.67–6.39% of the observed phenotypic variation, depending on the environmental conditions. Alleles associated with increasing effects located on chromosomes 1A, 2A, and 3D originated from the “Berkut” parent, while those on chromosomes 1D, 2B, 4B, and 7B were derived from the “Worrakatta” parent. QPHS.xjau-1AL.1, detected under three different environmental conditions (2018M, 2019M, and 2019S), was mapped within the interval AX-110067057–AX-179561683 at a physical position of 549.08–552.85 Mb. This QTL explains 3.86–6.39% of the phenotypic variation. Another QTL, QPHS.xjau-1AL.2, was identified in the 2019S environment and under average environmental conditions; it was located within the interval AX-109326239–AX-94417718 at a physical position of 535.72–545.65 Mb and accounted for 2.67–4.87% of the phenotypic variation. Upon comparison with previously reported results, three of the detected QTLs were found to be proximal to markers or QTL intervals identified in previous studies (Table 3 and Figure 2).
In 2018M, 2020M, and the average environment (A), one PHS-related QTL was detected per environment: QPHS.xjau-1AL.1, QPHS.xjau-2BS, and QPHS.xjau-1AL.2. These QTLs exhibited LOD scores between 2.4 and 3.1 and collectively explained 4.20–4.87% of the phenotypic variation. The alleles contributing to increased effects for QPHS.xjau-1AL.1 and QPHS.xjau-1AL.2 are derived from Berkut, while the allele contributing to increased effects for QPHS.xjau-2BS is derived from Worrakatta.
In the 2019M environment, two PHS-related QTLs were identified: QPHS.xjau-1AL.1 and QPHS.xjau-3DS, located on chromosomes 1AL and 3DS, respectively. QPHS.xjau-1AL.1 is situated within the interval AX-110067057–AX-179561683 and has an LOD value of 2.6, explaining 6.39% of the phenotypic variation. QPHS.xjau-3DS is located within the interval AX-108907550–AX-94479963 and has an LOD value of 2.2, explaining 4.03% of the phenotypic variation. The alleles contributing to increased effects for both QTLs originate from the parent Berkut.
In the 2019S environment, seven PHS-related QTLs were identified on chromosomes 1AL (two loci), 2AL, 2AS, 4BL, 7BL, and 1DL. Specifically, the two QTLs on chromosome 1AL, QPHS.xjau-1AL.1 and QPHS.xjau-1AL.2, are located within the intervals AX-110067057–AX-179561683 and AX-109326239–AX-94417718, respectively, with LOD values of 2.2 and 2.1, explaining 3.86% and 2.67% of the phenotypic variation. The alleles with increasing effects for both QTLs originate from the parent Berkut. Additionally, two QTLs detected on chromosome 2A, QPHS.xjau-2AL and QPHS.xjau-2AS, are located within the intervals AX-89471863–AX-158572584 and AX-111037158–AX-94566723, respectively, with LOD values of 3.6 and 2.2, explaining 4.75% and 4.02% of the phenotypic variation. The alleles with increasing effects for these QTLs also originate from the parent Berkut. One QTL each was detected on chromosomes 4BL, 7BL, and 1DL, namely, QPHS.xjau-4BL, QPHS.xjau-7BL, and QPHS.xjau-1DL, respectively. These QTLs have LOD values ranging from 2.6 to 3.1, collectively explaining 3.42–4.00% of the phenotypic variation. Unlike other QTLs detected, the alleles with increasing effects for these QTLs all originate from the parent Worrakatta.

3.3. Prediction of Candidate Genes Related to Wheat PHS

Based on the International Wheat Genome Sequencing Consortium (IWGSC) -RefSeq Annotations database, gene mining was conducted for QTLs identified as stably inherited or having significant phenotypic contributions, leading to the identification of eight candidate genes potentially linked with PHS (Table 4). These candidate genes are primarily involved in pathways related to seed dormancy, plant hormone biosynthesis, and signal transduction. The annotated candidate genes include the following: TraesCS1A01G378100 encodes a protein belonging to the zinc finger family; TraesCS2A01G407800 and TraesCS7B01G701400LC encode F-box proteins; TraesCS1A01G365900 and TraesCS2B01G082400 are identified as encoding Myb transcription factors; TraesCS2A01G075000 and TraesCS2B01G083400 encode germin-like proteins; and TraesCS3D01G124500 is annotated as a gibberellin 3-β-hydroxylase, a key enzyme in gibberellin biosynthesis.

3.4. Analysis of Relative Expression Levels of Candidate Genes

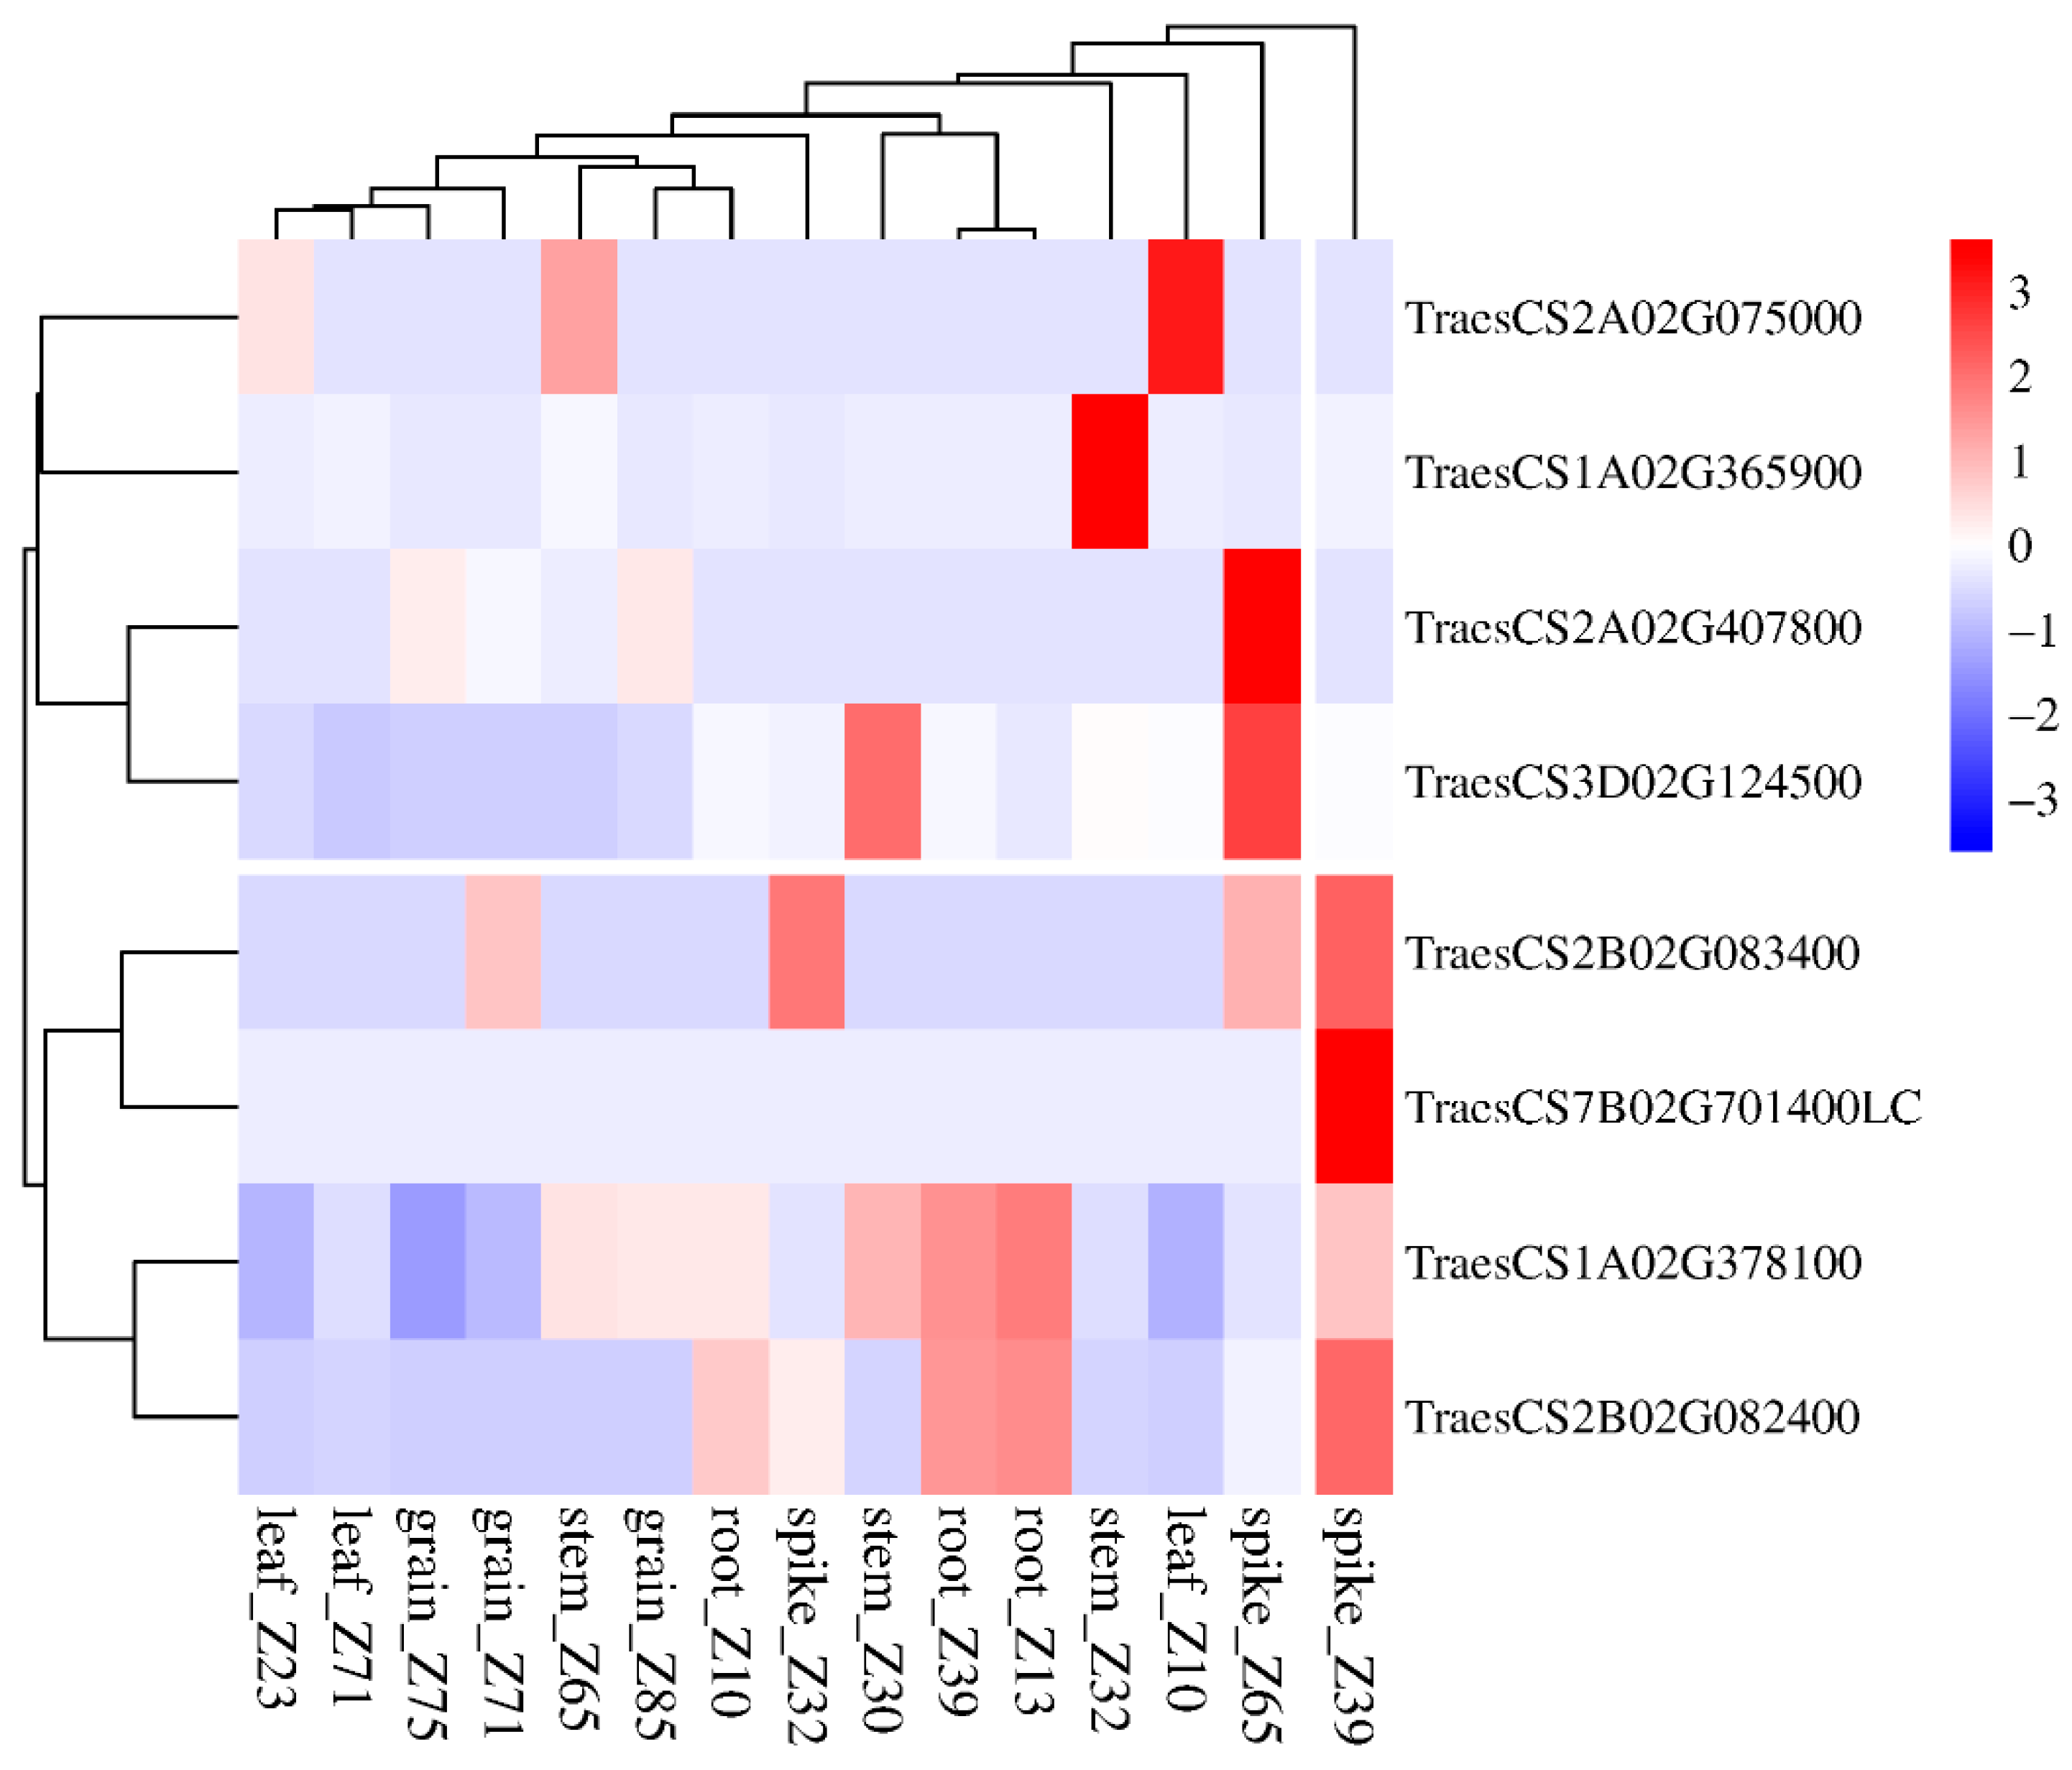
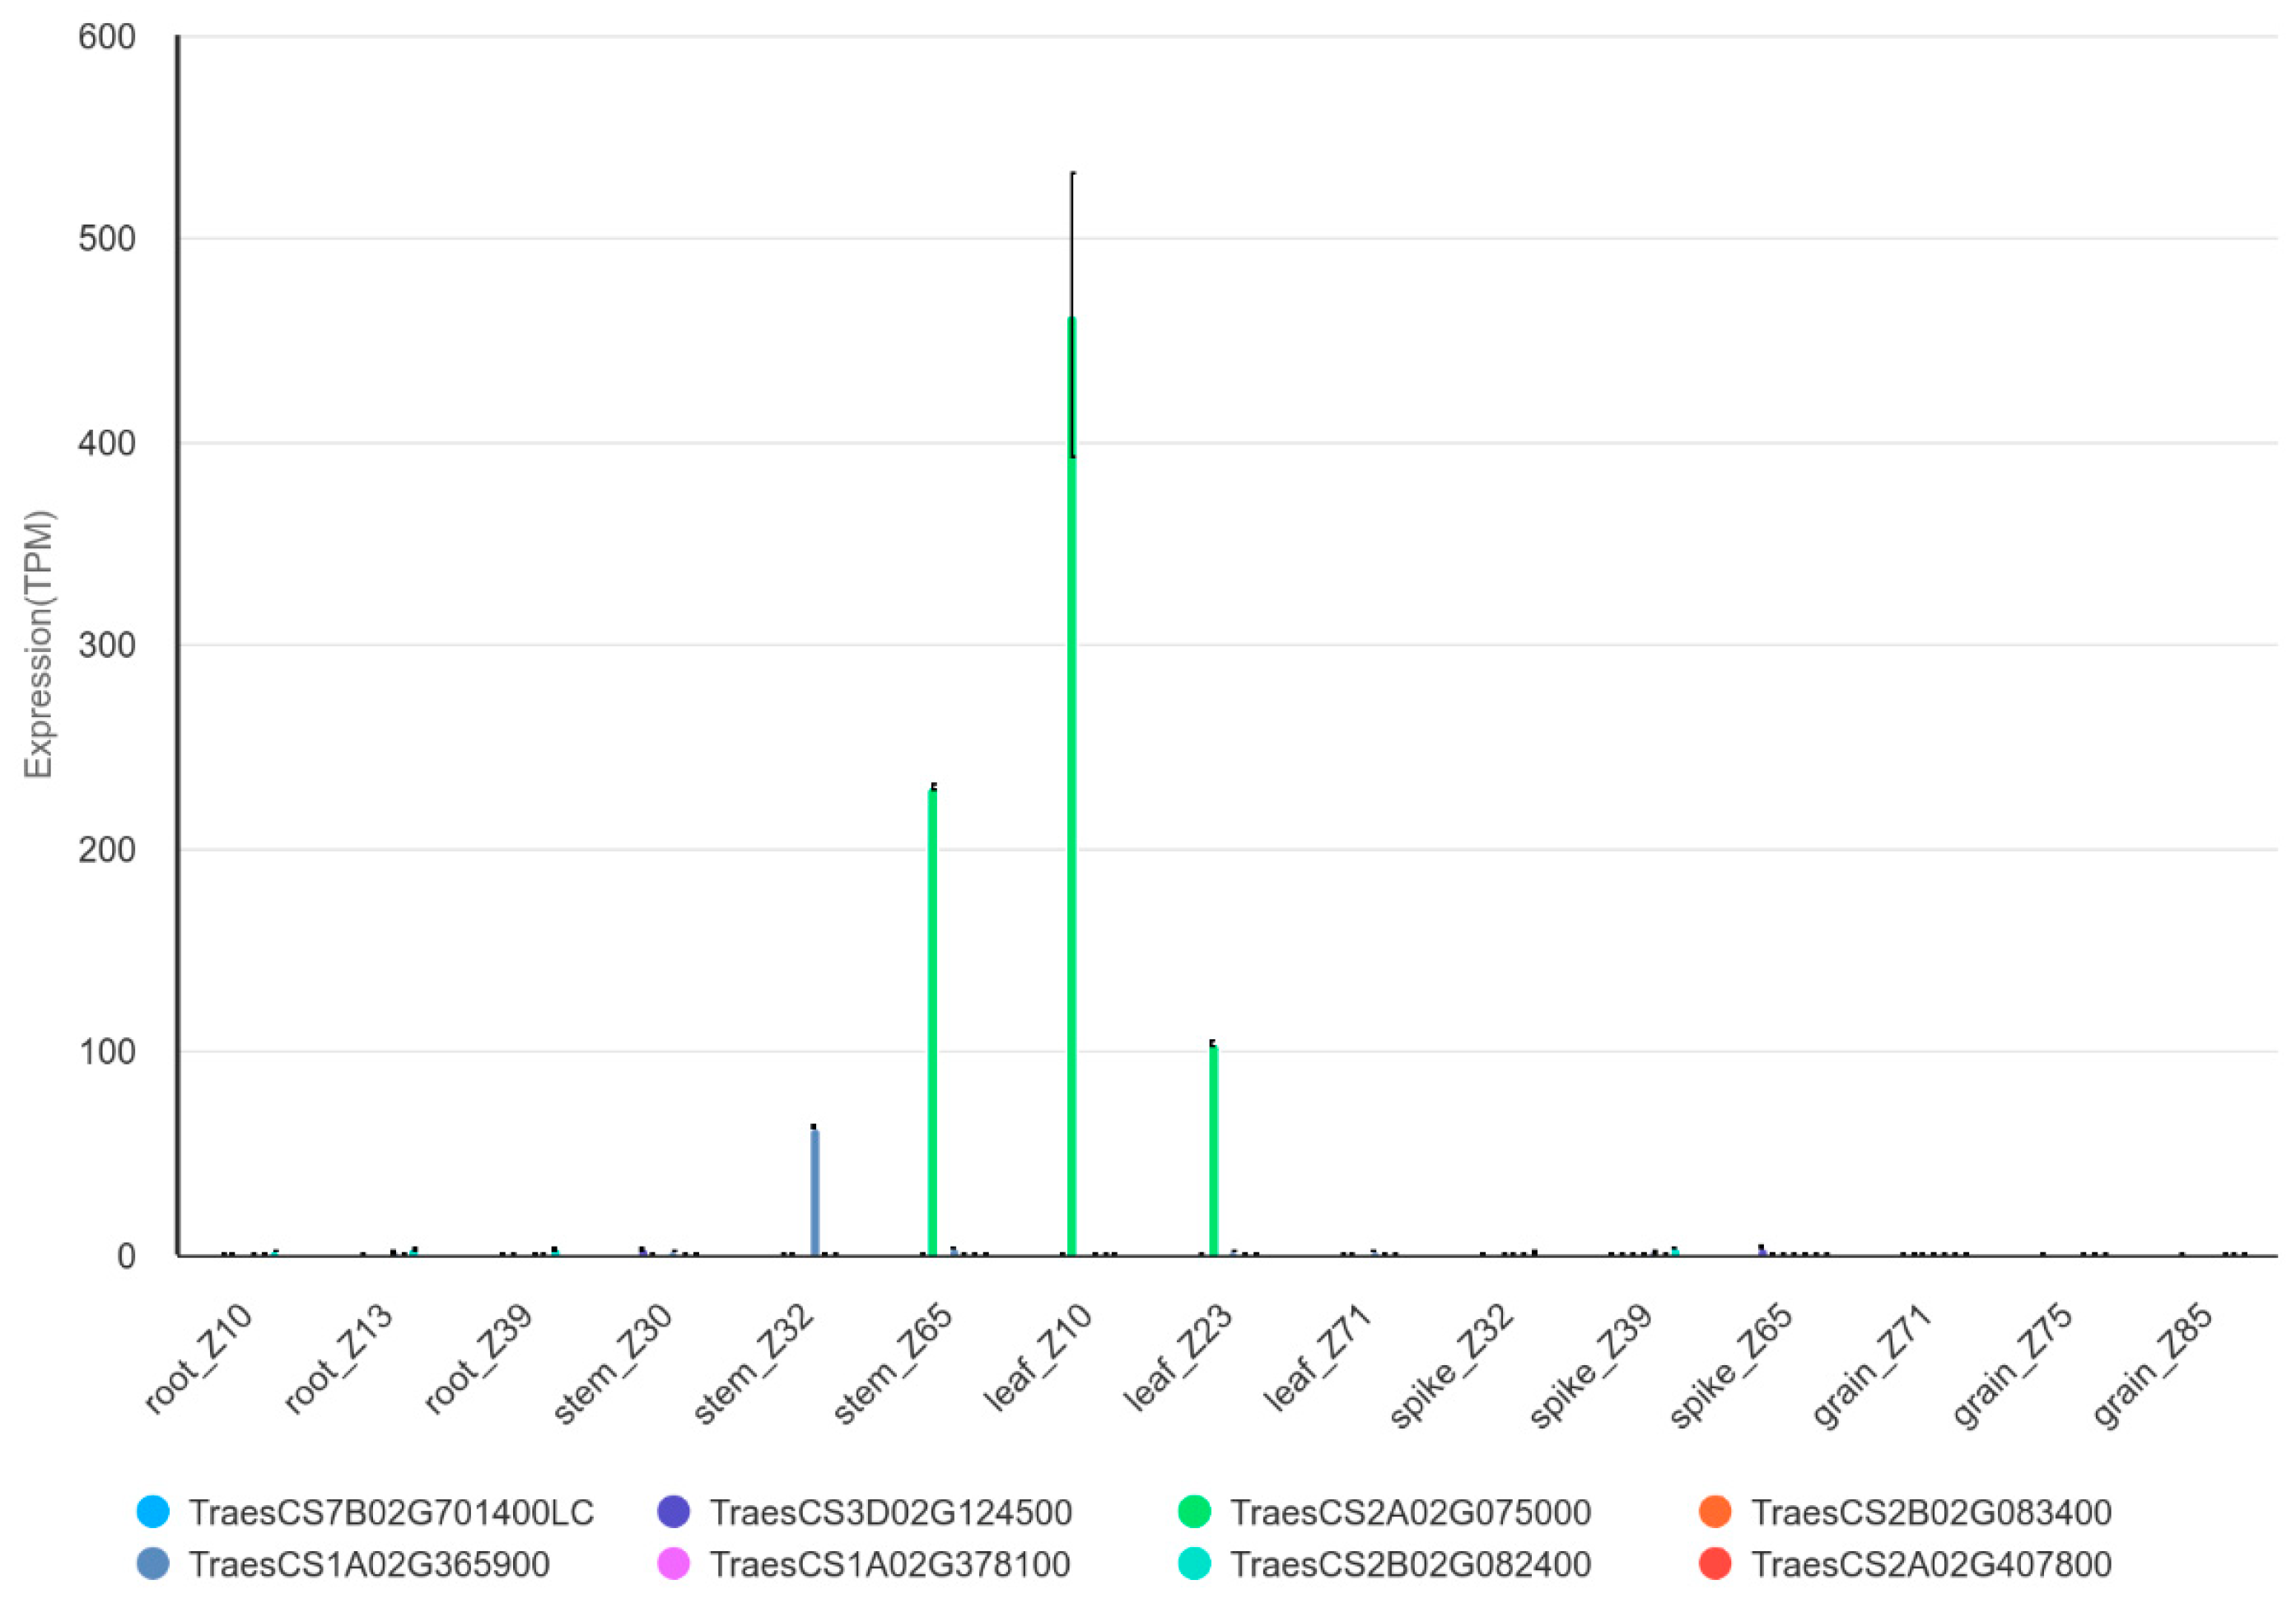
Utilizing gene annotation data from the wheat genome database, we analyzed the expression levels of these eight candidate genes across various wheat tissues and generated a heatmap (Figure 3). The results indicated that two genes consistently show high expression in both stem and leaf tissues (Figure 4). TraesCS7B02G701400LC exhibits negligible expression, with faint activity observed only in the spike tissue (spike_Z39). TraesCS3D02G124500 demonstrates relatively high expression levels in stem tissues (stem_Z30, stem_Z32) and spike tissues (spike_Z39, spike_Z65), moderate expression in roots (root_Z10, root_Z13, root_Z39), and lower expression in leaves (leaf_Z23, leaf_Z71) and grains (grain_Z71, grain_Z75). TraesCS2A02G075000 shows extremely high expression in the stem (stem_Z65) and leaves (leaf_Z10, leaf_Z23), especially during leaf development stages, while exhibiting lower expression levels in other tissues such as roots, spikes, and grains. TraesCS2B02G083400 displays elevated expression in the spike (spike_Z32, spike_Z39, spike_Z65) and grain (grain_Z71), with minimal expression detected in tissues like roots, stems, and leaves. TraesCS1A02G365900 is notably expressed during early root development phases (root_Z10, root_Z13) and also shows high expression in leaves (leaf_Z23, leaf_Z71) and stems (stem_Z30, stem_Z32, stem_Z65) but displays lower levels in spike and grain tissues. TraesCS1A02G378100 exhibits relatively high expression levels in roots (root_Z13, root_Z39) and stems (stem_Z30, stem_Z65), with moderate expression observed in spikes (spike_Z32, spike_Z39, spike_Z65). Its expression in grains and leaves remains comparatively low. TraesCS2B02G082400 shows significant expression in roots (root_Z10, root_Z13, root_Z39) and spikes (spike_Z32, spike_Z39), while its activity in other tissues is minimal. TraesCS2A02G407800 displays elevated expression during the late stage of spike development (spike_Z65), with negligible expression detected in roots, stems, and leaves.

3.5. Analysis of QTL Meta-Analysis

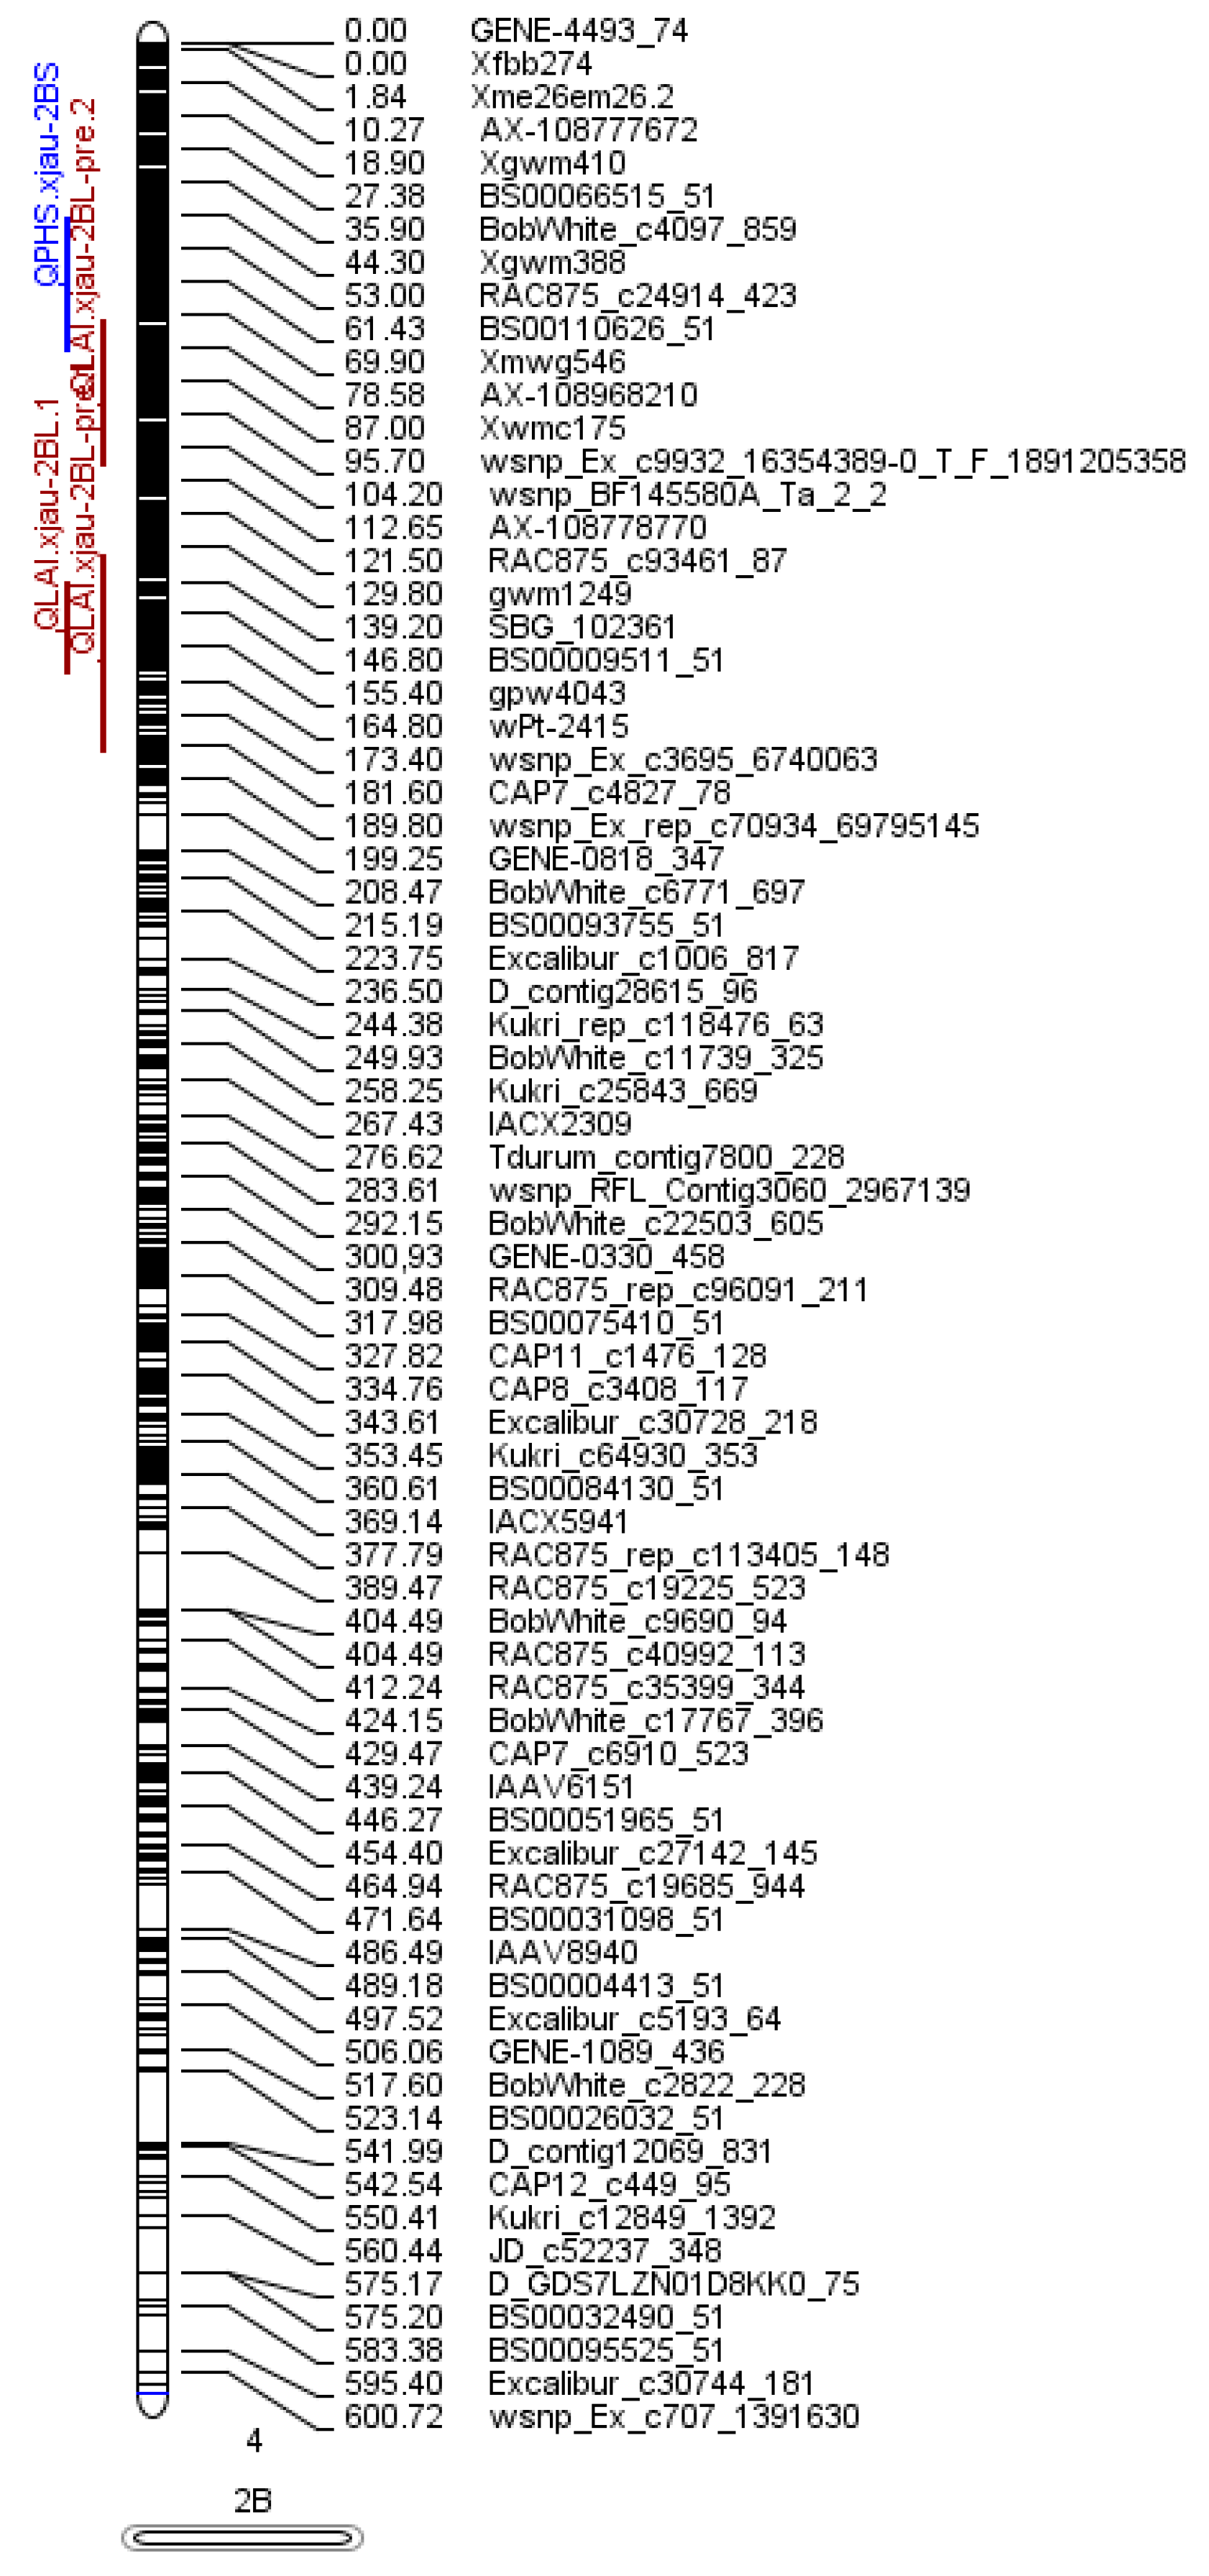
This study integrates data from four research articles published for plant height, leaf area, drought stress, and superoxide dismutase, along with QTL information extracted from this research (Table 3). Using BioMercator V4.2.3 software for QTL comparative analysis, we identified four QTLs on chromosome 2B (Figure 5). Specifically, overlapping regions within the Xmwg546~AX-108968210 marker interval on chromosome 2B encompass two QTLs (QLAI.xjau-2BL-pre.2 for leaf area and QPHS.xjau-2BS for seed dormancy).

4. Discussion

4.1. Phenotypic Analysis of PHS in RIL Population of Wheat

Wheat resistance to PHS is an extremely complex, influenced by both genotype and environmental factors [3,13,16,23,24,25]. Wang highlighted that the dormancy characteristics of seeds are a major genetic determinant of PHS resistance [25]. Zhou identified temperature and moisture as the predominant environmental factors affecting PHS, with higher risks associated with conditions of elevated temperature and humidity [8]. Additionally, Pu emphasized that the coefficient of variation (CV) for population quantitative traits serves as a critical measure of trait variability, while heritability is indicative of the differences in trait expression and development within a population [26]. In this study, both parental lines exhibited high PHS rates across four different environments. Similarly, most RIL families displayed high average PHS rates, indicating generally weak PHS resistance within the population. This suggests a generally weak PHS resistance within the RIL population. Specifically, PHS rates within the RIL population ranged from 23.92% to 100%, with coefficients of variation (CVs) between 0.16 and 0.19. This wide range indicates substantial segregation of alleles contributing to PHS resistance from the parents to their offspring, resulting in pronounced transgressive segregation within the RIL population. Comparing 2019S and 2019M, PHS rates of both the parents and the RIL population decreased, albeit with a widened range. The correlation coefficient between these two environments was the lowest at 0.51. This discrepancy may be attributed to the frequent precipitation and temperature drops experienced in the Sanping area in 2019, which led to two cold waves and a delayed wheat growth period compared to typical years. The RIL population exhibited some resistance to the cold wave conditions, contributing to an overall enhancement of PHS resistance. However, compared to 2018 and 2020, the RIL population exhibited increased PHS rates and a narrower range of variation in 2019 (including 2019S and 2019M), indicating a weakened overall PHS resistance. According to the “2019 Climate Bulletin and Impact Assessment of Xinjiang Uyghur Autonomous Region” released by the Xinjiang Meteorological Bureau, the average temperature in northern Xinjiang during midsummer (July to August) of 2019 was 24.4 °C, which is 1.6 °C higher than usual, marking it as the hottest midsummer on record in northern Xinjiang. This increase in temperature likely contributed to the observed decrease in overall PHS resistance in the RIL population for that year.
Correlation analysis revealed significantly higher coefficients among the 2018M, 2019M, and 2020M environments compared to 2019S. This indicates a relatively stable PHS resistance performance of the RIL population under different environmental conditions at the same location. Collectively, our findings suggest that the PHS resistance in the RIL population, while influenced by environmental factors, is predominantly determined by genetic makeup. This is supported by the high broad-sense heritability (0.86) observed across four environments, indicating that genetic factors are the primary drivers of phenotypic variation. RIL families exhibiting lower germination rates represent promising candidates for resistant varieties within breeding programs. Furthermore, although some families displayed elevated PHS rates after seven days of germination, they initially showed lower germination rates during the early days of the whole-spike sprouting test. This suggests an ability to withstand short-term high-temperature and high-humidity conditions, making them suitable candidates for developing resistant varieties.

4.2. QTL Analysis of PHS Characteristics of Wheat

Advancements in molecular biology techniques have significantly enhanced the identification of QTLs and candidate genes associated with PHS. Previous linkage studies by Osa, Lin, and Singh using different wheat populations combined with gene chip technology have identified major QTLs on chromosomes 2AL, 2BS, 3AS, 3AL, 4AL, 5D, 6B, and 7D [7,17,20]. Notably, the loci on 2AL and 2BS identified in these studies align with those found in our study, further validating the reliability of these QTLs.
By comparing the physical positions of our mapped QTLs with previously reported results, we found that three of the detected QTLs co-localize with markers or QTL intervals identified in prior studies, while the remaining six QTLs are located in chromosomal regions not previously associated with PHS resistance, suggesting they represent novel genetic loci. For example, QPHS.xjau-1AL.2 (535.72–545.65 Mb), located on the long arm of chromosome 1A in our study, is approximately 6 Mb away from the major QTL Qphs.ahau-1A (530.2 Mb) reported by Singh on the same chromosome [20]. In addition, both QPHS.xjau-1AL.1 (549.08–552.85 Mb) and QPHS.xjau-1AL.2 (535.72–545.65 Mb), also located on the long arm of chromosome 1A, were between the QTLs MQTL.PHS-1A.3 (517.48 Mb) and MQTL.PHS-1A.4 (581.87 Mb) reported by Li [27]. The location of the two QTLs identified in this research suggest that they may represent new QTLs for PHS.
QPHS.xjau-2AS, located on the short arm of chromosome 2A between 31.83 and 33.78 Mb, is approximately 1 Mb from the marker IWA1152 (33.3 Mb) identified on chromosome 2A by Mohan [21]. These QTLs could potentially be the same, though variations in their phenotypic contribution rates are observed across different studies. For example, in this study, the QTLs on chromosomes 1A and 2A contributed 2.67–4.87% and 4.02% to their respective phenotypic effects, whereas the corresponding QTLs identified by Singh and Mohan contributed significantly higher rates of 8.7–13.7% and 6.3–13.6%, respectively [20,21]. The discrepancies in phenotypic contribution observed could be attributed to several factors including differences in experimental methods, the genetic makeup of the mapping populations, environmental conditions where the mapping populations were planted, and variations in gene chip throughput.
Six QTLs we detected are notably distanced—ranging from 20 Mb to 40 Mb—away from previously reported loci on the same chromosomes. For instance, QPHS.xjau-2AL located at 651.60–679.54 Mb on chromosome 2A and QPHS.xjau-7BL at 684.86–685.78 Mb on chromosome 7B are approximately 30 Mb and 25 Mb away from the Qphs.ahau-2A.2 (709.0–712.7 Mb) and barc340 (727.1 Mb) identified by Zhu and Kumar, respectively [13,22]. These are likely new QTLs associated with PHS, contributing novel insights into the genetic basis of PHS resistance.
Additionally, QPHS.xjau-1AL.1 was consistently detected across three environments (2018M, 2019M, and 2019S); it is located at 549.08–552.85 Mb and explains 3.86% to 6.39% of the phenotypic variation. This suggests that this locus is a critical site influencing wheat PHS resistance.
Candidate gene mining within this interval identified TraesCS1A01G378100, a gene encoding a zinc finger family protein. This protein regulates seed dormancy by modulating the sensitivity of the plant to the endogenous hormone ABA [28], highlighting its significance in PHS resistance mechanisms. Moving forward, we plan to conduct map-based cloning and functional validation on this and other candidate genes that show large effect sizes and stable inheritance to further elucidate the genetic mechanisms underpinning wheat PHS.

4.3. Functional Analysis of Wheat PHS Candidate Genes

Candidate gene mining was performed for QTLs exhibiting stable inheritance or significant contributions to phenotypic variance. Using the Chinese Spring wheat genome database, relevant QTL sequences were obtained. Based on gene function annotation information, eight candidate genes potentially related to wheat pre-harvest sprouting traits were identified. Notably, the genes TraesCS1A01G365900 and TraesCS2B01G082400, located on chromosomes 1AL and 2BS of wheat, respectively, encode proteins belonging to the Myb transcription factor family. These proteins are known to regulate the biosynthesis of flavonoids in seeds, significantly impacting grain color [29]. Himi and Noda have shown that an R gene enhances the transcription of flavonoid biosynthesis genes [24]. However, this gene is not expressed in white-grained wheat varieties. Red-grained wheat exhibits enhanced resistance to PHS, which is primarily attributed to the regulatory effects of three R genes that control seed coat color [24]. Additionally, R genes are closely associated with dormancy loci, and Myb family transcription factors have been identified within this interval, with corresponding genetic markers developed successfully [24]. Furthermore, the genes TraesCS2A01G407800 and TraesCS7B01G701400LC, located on chromosomes 2AL and 7BL, respectively, encode proteins from the F-box protein family. These proteins are crucial for several physiological processes, including plant hormone signal transduction, light signal transduction, and floral organ development [30]. Additionally, the genes TraesCS2A01G075000 and TraesCS2B01G083400, situated on chromosomes 2AS and 2BS, respectively, encode germin-like proteins. These proteins are regulated by external environmental signals and play crucial roles throughout the entire growth and development of the plant, particularly in responding to various stress conditions [31]. The gene TraesCS1A01G378100, found on chromosome 1AL, encodes a zinc finger protein that regulates seed dormancy by modulating the sensitivity to ABA [29]. Another gene, TraesCS3D01G124500, located on chromosome 3DS, is annotated as encoding gibberellin 3-β-hydroxylase. This enzyme is pivotal in the biosynthesis pathway of GAs. GAs are essential for breaking seed dormancy, controlling internode elongation, and managing leaf growth, as well as influencing flowering and fruiting, and gibberellin 3-β-hydroxylase specifically catalyzes the conversion to active gibberellins, thus significantly impacting plant growth and development [32].

4.4. QTL Meta-Analysis of PHS

The “Berkut” × “Worrakatta”-derived population exhibits significant variation in plant height [33], leaf area [34], drought resistance [35], and superoxide dismutase [36], with findings robustly supported by multi-environment data and statistical analysis. Notably, plant height [37] and drought resistance [38] have been identified as factors closely associated with seed dormancy in wheat, highlighting the complexity of PHS as a trait influenced by multiple factors. These suggest that these hotspot regions may harbor a single gene influencing multiple agronomic traits.

5. Conclusions

In this study, we conducted QTL mapping for wheat PHS using whole-spike germination rate data from 309 RILs. This analysis identified nine PHS-associated QTLs distributed across chromosomes 1AL, 1DL, 2AL, 2AS, 2BS, 3DS, 4BL, and 7BL. Each QTL explained 2.67% to 6.39% of the phenotypic variation. Notably, the QTL QPHS.xjau-1AL.1, detected across three environments, explained 3.86% to 6.39% of the phenotypic variation. From a practical breeding perspective, evaluating PHS resistance in the field is highly challenging as it is heavily dependent on unpredictable weather conditions at harvest. Therefore, marker-assisted selection (MAS) provides a more reliable and efficient alternative. The tightly linked SNP markers flanking the stable loci, particularly QPHS.xjau-1AL.1, can be readily converted into breeder-friendly, high-throughput markers such as KASP (Kompetitive Allele-Specific PCR) assays. By utilizing these precise markers, breeders can implement MAS in early generations to accurately trace favorable alleles independent of environmental constraints. Furthermore, these newly identified loci can be pyramided with other known major PHS resistance genes via MAS, ultimately facilitating the rapid development of elite wheat varieties with robust and stable resistance to pre-harvest sprouting.

Author Contributions

Y.C. and Y.X. drafted the manuscript. L.X. and W.H. assisted in writing the manuscript. H.Z. and X.L. assisted in surveying data. J.D. participated in supervision work. H.G. initiated the project and revised and finalized the manuscript. All authors have read and agreed to the published version of the manuscript.

Funding

This work was supported by Xinjiang Key Research and Development Program (2022B02001-3), Xinjiang Young Science and Technology Top Talent Project (2022TSYCCX0079) and the earmarked fund for Basic Scientific Research Business Expenses of Autonomous Region Higher Education Institutions (XIEDU20241042).

Data Availability Statement

Data will be made available on request.

Conflicts of Interest

The authors declare that they have no known competing financial interests or personal relationships that could have appeared to influence the work reported in this paper.

References

  1. Derera, N.F.; Bhatt, G.M.; McMaster, G.J. On the problem of pre-harvest sprouting of wheat. Euphytica 1977, 26, 299–308. [Google Scholar] [CrossRef] [Scilit]
  2. Ogbonnaya, F.C.; Imtiaz, M.; Ye, G.; Hearnden, P.R.; Hernandez, E.; Eastwood, R.F.; Van Ginkel, M.; Shorter, S.C.; Winchester, J.M. Genetic and QTL analyses of seed dormancy and preharvest sprouting resistance in the wheat germplasm CN10955. Theor. Appl. Genet. 2008, 116, 891–902. [Google Scholar] [CrossRef] [Scilit] [PubMed]
  3. Zhou, S.H.; Fu, L.; Wu, Q.H.; Chen, J.J.; Chen, Y.X.; Xie, J.Z.; Wang, Z.Z.; Wang, G.X.; Zhang, D.Y.; Liang, Y.; et al. QTL mapping revealed TaVp-1A conferred pre-harvest sprouting resistance in wheat population Yanda 1817 × Beinong 6. J. Integr. Agric. 2017, 16, 435–444. [Google Scholar] [CrossRef] [Scilit]
  4. Munkvold, J.D.; Tanaka, J.; Benscher, D.; Sorrells, M.E. Mapping quantitative trait loci for preharvest sprouting resistance in white wheat. Theor. Appl. Genet. 2009, 119, 1223–1235. [Google Scholar] [CrossRef] [Scilit]
  5. Torada, A.; Koike, M.; Ogawa, T.; Takenouchi, Y.; Tadamura, K.; Wu, J.; Ogihara, Y. A causal gene for seed dormancy on wheat chromosome 4A encodes a MAP kinase kinase. Curr. Biol. 2016, 26, 782–787. [Google Scholar] [CrossRef] [Scilit] [PubMed]
  6. Liu, S.B.; Bai, G.H. Dissection and fine mapping of a major QTL for preharvest sprouting resistance in white wheat Rio Blanco. Theor. Appl. Genet. 2010, 121, 1395–1404. [Google Scholar] [CrossRef] [Scilit]
  7. Osa, M.; Kato, K.; Mori, M.; Shindo, C.; Torada, A.; Miura, H. Mapping QTLs for seed dormancy and the Vp1 homologue on chromosome 3A in wheat. Theor. Appl. Genet. 2003, 106, 1491–1496. [Google Scholar] [CrossRef] [Scilit]
  8. Zhou, Y.; Bai, S.; Li, H.; Sun, G.; Song, C.P. Genome-wide association study for pre-harvest sprouting resistance in a large germplasm collection of Chinese wheat landraces. Front. Plant Sci. 2017, 8, 401. [Google Scholar] [CrossRef] [Scilit]
  9. Yang, J.; Tan, C.; Lang, J.; Tang, H.; Hao, M.; Tan, Z.; Yu, H.; Zhou, Y.; Liu, Z.H.; Li, M.L. Identification of qPHS.sicau-1B and qPHS.sicau-3D from synthetic wheat for pre-harvest sprouting resistance wheat improvement. Mol. Breed. 2019, 39, 132. [Google Scholar] [CrossRef] [Scilit]
  10. Zhang, Y.; Miao, X.; Xia, X.; He, Z. Cloning of seed dormancy genes (TaSdr) associated with tolerance to pre-harvest sprouting in common wheat and development of a functional marker. Theor. Appl. Genet. 2014, 127, 855–866. [Google Scholar] [CrossRef] [Scilit]
  11. Rasul, G.; Humphreys, D.G.; Brûlé-Babel, A.; McCartney, C.A.; Knox, R.E.; DePauw, R.M.; Somers, D.J. Mapping QTLs for pre-harvest sprouting traits in the spring wheat cross ‘RL4452/AC Domain’. Euphytica 2009, 168, 363–378. [Google Scholar] [CrossRef] [Scilit]
  12. Tyagi, S.; Gupta, P.K. Meta-analysis of QTLs involved in pre-harvest sprouting tolerance and dormancy in bread wheat. Triticeae Genom. Genet. 2012, 3, 9–24. [Google Scholar] [CrossRef] [Scilit]
  13. Zhu, Y.L.; Wang, S.X.; Zhao, L.X.; Zhang, D.X.; Hu, J.B.; Cao, X.L.; Yang, Y.J.; Chang, C.; Ma, C.X.; Zhang, H.P.; et al. Wheat intact spikes by association analysis exploring molecular markers of preharvest sprouting resistance gene. Acta Agron. Sin. 2014, 40, 1725–1732. [Google Scholar] [CrossRef] [Scilit]
  14. Zuo, J.; Lin, C.T.; Cao, H.; Chen, F.; Liu, Y.; Liu, J. Genome-wide association study and quantitative trait loci mapping of seed dormancy in common wheat (Triticum aestivum L.). Planta 2019, 250, 187–198. [Google Scholar] [CrossRef] [Scilit]
  15. Chang, C.; Wang, X.Y.; Yu, Z.Y.; Zhang, H.P.; Lu, J.; Si, H.Q.; Chen, C.; Ma, C.X.; Xu, Y.W.; Zhao, Y.Y.; et al. Excavation and creation of pre-harvest sprouting resistant germplasm resources in Chinese wheats. J. Anhui Agric. Univ. 2023, 50, 745–750. [Google Scholar]
  16. Groos, C.; Gay, G.; Perretant, M.R.; Gervais, L.; Bernard, M.; Dedryver, F.; Charmet, G. Study of the relationship between pre-harvest sprouting and grain color by quantitative trait loci analysis in a white × red grain bread-wheat cross. Theor. Appl. Genet. 2002, 104, 39–47. [Google Scholar] [CrossRef] [Scilit] [PubMed]
  17. Lin, M.; Cai, S.; Wang, S.; Liu, S.; Zhang, G.; Bai, G. Genotyping-by-sequencing (GBS) identified SNP tightly linked to QTL for pre-harvest sprouting resistance. Theor. Appl. Genet. 2015, 128, 1385–1395. [Google Scholar] [CrossRef] [Scilit]
  18. Lynch, M.; Walsh, B. Genetics and Analysis of Quantitative Traits; Sinauer: Sunderland, MA, USA, 1998. [Google Scholar]
  19. Cheng, Y.K.; He, W.L.; Ren, Y.; Geng, H.W. Meta-analysis of QTLs for salt tolerance in wheat. J. Triticeae Crops 2023, 10, 1319–1325. [Google Scholar]
  20. Singh, R.; Matus-Cádiz, M.; Bga, M.; Hucl, P.; Chibbar, R.N. Identification of genomic regions associated with seed dormancy in white-grained wheat. Euphytica 2010, 174, 391–408. [Google Scholar] [CrossRef] [Scilit]
  21. Mohan, A.; Kulwal, P.; Singh, R.; Kumar, V.; Mir, R.R.; Kumar, J.; Prasad, M.; Balyan, H.S.; Gupta, P.K. Genome-wide QTL analysis for pre-harvest sprouting tolerance in bread wheat. Euphytica 2009, 168, 319–329. [Google Scholar] [CrossRef] [Scilit]
  22. Kumar, S.; Knox, R.E.; Clarke, F.R.; Pozniak, C.J.; DePauw, R.M.; Cuthbert, R.D.; Fox, S. Maximizing the identification of QTL for pre-harvest sprouting resistance using seed dormancy measures in a white-grained hexaploid wheat population. Euphytica 2015, 205, 287–300. [Google Scholar] [CrossRef] [Scilit]
  23. Detje, H. Effects of varying nitrogen rates on pre-harvest sprouting and α-amylase activity in cereals. J. Agron. Crop Sci. 1992, 169, 38–45. [Google Scholar] [CrossRef] [Scilit]
  24. Himi, E.; Noda, K. Red grain colour gene (R) of wheat is a Myb-type transcription factor. Euphytica 2005, 143, 239–242. [Google Scholar] [CrossRef] [Scilit]
  25. Wang, Z.L.; Yu, Y.X.; Wang, Z.W.; Cheng, J.S.; Qiao, X.M.; Yang, J.H.; Ya, X.Y.; Zhi, W.W.; Jia, S.C.; Xiang, M.Q.; et al. Resistance and mechanism of pre-harvest sprouting in wheat. Southwest China J. Agric. Sci. 2016, 29, 7–12. [Google Scholar]
  26. Pu, G.L.; Xiao, Q.W.; Cai, L.J.; Luo, Y.F.; Zou, X.M. Variation and probability grading of main quantitative traits of walnut (Juglans regia L.) germplasm resources. J. Hunan Agric. Univ. Nat. Sci. 2015, 41, 647–650. [Google Scholar]
  27. Li, T.; Wang, H.J.; Xu, X.J.; Sun, W.H.; Ju, L.; Liu, W.T.; Li, W.Q.; Sun, J.; Chen, K.M. Pre-harvest sprouting in cereals: Genetic and biochemical mechanisms. J. Exp. Bot. 2021, 72, 2857–2876. [Google Scholar] [CrossRef] [Scilit]
  28. Lee, S.J.; Jung, H.J.; Kang, H.; Kim, S.Y. Arabidopsis zinc finger proteins AtC3H49/AtTZF3 and AtC3H20/AtTZF2 are involved in ABA and JA responses. Plant Cell Physiol. 2012, 53, 673–686. [Google Scholar] [CrossRef] [Scilit]
  29. Zhang, H.P.; Chang, C.; Xiao, S.H. Proteome analysis of ABA signaling in wheat germ dormancy. Acta Agron. Sin. 2006, 32, 690–697. [Google Scholar]
  30. Wu, D.; Tang, D.Y.; Li, X.M.; Li, L.; Zhao, X.Y.; Liu, X.M.; Dong, Y.T.; Xin, M.L.; Li, L.; Xiao, Y.Z.; et al. Progresses on F-box protein function in plant growth and development. Life Sci. Res. 2015, 19, 6–12. [Google Scholar]
  31. Li, Y.; Liu, S.K. Research advances in plant germin-like proteins. Chin. Agric. Sci. Bull. 2014, 30, 246–254. [Google Scholar]
  32. Yin, X.L.; Zhang, C.; Wang, Y.C.; Yuan, D.Y.; Tan, Y.N.; Duan, M.J. Bioinformatics analysis of homologous genes of rice gibberellin 3β-hydroxylase gene (OsGA3ox1). Mol. Plant Breed. 2019, 17, 1054–1060. [Google Scholar]
  33. Yan, A.; Ning, S.; Geng, H.W.; Guo, T.; Xiao, S. Quantitative trait locus (QTL) mapping for common wheat plant heights based on unmanned aerial vehicle images. Agronomy 2023, 13, 2088. [Google Scholar] [CrossRef] [Scilit]
  34. Wang, W.; Gao, X.; Cheng, Y.K.; Ren, Y.; Zhang, Z.H.; Wang, R.; Cao, J.M.; Geng, H.W. QTL mapping of leaf area index and chlorophyll content based on UAV remote sensing in wheat. Agriculture 2022, 12, 595. [Google Scholar] [CrossRef] [Scilit]
  35. Ren, Y.; Liu, J.D.; Zhang, J.X.; Dreisigacker, S.; Xia, X.C.; Geng, H.W. QTL mapping of drought tolerance at germination stage in wheat using the 50K SNP array. Plant Genet. Resour. Charact. Util. 2021, 19, 453–460. [Google Scholar] [CrossRef] [Scilit]
  36. Qu, K.J.; Wang, J.Q.; Cheng, Y.K.; Xia, X.C.; Geng, H.W. Identification of quantitative trait loci and candidate genes for grain superoxide dismutase activity in wheat. BMC Plant Biol. 2024, 24, 716. [Google Scholar] [CrossRef] [Scilit] [PubMed]
  37. Ayık, B.; Güleç, T.; Aydın, N.; Türkoğlu, A.; Bocianowski, J. Pre-harvest sprouting resistance in bread wheat: A speed breeding approach to assess dormancy QTL in backcross lines. Plants 2024, 13, 3437. [Google Scholar] [CrossRef] [Scilit]
  38. Biddulph, T.B.; Mares, D.J.; Plummer, J.A.; Setter, T.L. Drought and high temperature increases preharvest sprouting tolerance in a genotype without grain dormancy. Euphytica 2005, 143, 277–283. [Google Scholar] [CrossRef] [Scilit]
Figure 1. Distribution of germination rates.
Agriculture 16 00926 g001
Figure 2. Locations of QTLs for wheat sprouting trait. Note: the right side of each chromosome is the molecular marker and the QTL mapped, and the left side is the genetic location corresponding to the QTL. The red is 2018M, green is 2019M, blue is 2019S, yellow is 2020M and black is A. “The colored blocks represent the confidence intervals of the mapped QTLs, and the adjacent text indicates the corresponding QTL names. [Different colors indicate the QTLs detected in different environments].
Agriculture 16 00926 g002
Figure 3. Analysis of the Expression Profiles of Candidate Genes Across Various Wheat Tissues.
Agriculture 16 00926 g003
Figure 4. Expression Analysis of Eight Candidate Genes Across Diverse Wheat Tissues.
Agriculture 16 00926 g004
Figure 5. Consensus map of QTLs for wheat sprouting trait.
Agriculture 16 00926 g005
Table 1. RIL population wheat sprouting trait statistical analysis.
EnvironmentBWMin (%)Max (%)MeanSD (%)CV2018M2019M2019S2020M
2018M84.6599.0728.04100.0082.2414.320.171
2019M89.4498.7846.7599.5982.9115.050.180.84 **1
2019S83.7295.6133.9398.5481.4913.280.160.63 **0.51 **1
2020M84.2896.8223.9298.7178.4414.960.190.77 **0.67 **0.76 **1
Note: 2018M, 2019M and 2020M: the experimental materials were cultivated over three consecutive years (2018 to 2020) at the Manas Experimental Station of the Xinjiang Academy of Agricultural Sciences, referred to as 2018M, 2019M, and 2020M; 2019S: in 2019, a trial was also conducted at the Sanping Farm Experimental Base of Xinjiang Agricultural University, denoted as 2019S. ** indicates significance at p < 0.01.
Table 2. ANOVA and broad-sense heritability of wheat sprouting in RIL population.
Source of VariancedfSSMSF-Valuep-ValueH2
Genotype308274,475.97894.0652.151.0 × 10−50.86
Environment34529.441509.8188.071.0 × 10−5
G × E55177,467.71140.598.201.0 × 10−5
Error858.0014,709.2517.14
Total variation1720371,351.47
Table 3. QTL locus information for wheat sprouting.
QTLEnvironmentMarker IntervalPhysical Position
(Mb)
Genetic Position
(cM)
LOD PeakR2 (%)Add EffectKnown Loci
QPHS.xjau-1AL.12018MAX-110067057–AX-179561683549.08–552.85553.14.623.44
2019M2.66.394.19
2019S2.23.862.88
QPHS.xjau-1AL.22019SAX-109326239–AX-94417718535.72–545.65492.12.672.40[20]
A2.64.872.55
QPHS.xjau-2AS2019SAX-111037158–AX-9456672331.83–33.7862.24.023.38[21]
QPHS.xjau-2AL2019SAX-89471863–AX-158572584651.60–679.54563.64.753.22
QPHS.xjau-2BS2020MAX-94849048–AX-9463294238.44–50.99322.44.20−3.11[22]
QPHS.xjau-4BL2019SAX-111489623–AX-109455736602.90–605.79642.93.76−2.84
QPHS.xjau-7BL2019SAX-110292317–AX-179558612684.86–685.78853.14.00−2.96
QPHS.xjau-1DL2019SAX-89314186–AX-111558345365.35–368.07282.63.42−2.71
QPHS.xjau-3DS2019MAX-108907550–AX-9447996377.01–99.98672.24.033.33
Note: 2018M, 2019M, 2020M and A: the experimental materials were cultivated over three consecutive years (2018 to 2020) at the Manas Experimental Station of the Xinjiang Academy of Agricultural Sciences, referred to as 2018M, 2019M, 2020M and average environment; 2019S: in 2019, a trial was also conducted at the Sanping Farm Experimental Base of Xinjiang Agricultural University, denoted as 2019S.
Table 4. Screening for candidate gene information.
ChrQTLMarker IntervalPosition (Mb)GeneGene Annotation or Coding Protein
1ALQPHS.xjau-1AL.1AX-110067057–AX-179561683550.04TraesCS1A01G378100Zinc finger superfamily protein
QPHS.xjau-1AL.2AX-109326239–AX-94417718544.74TraesCS1A01G365900Myb transcription factor
2ALQPHS.xjau-2ALAX-89471863–AX-158572584664.47TraesCS2A01G407800F-box family protein
2ASQPHS.xjau-2ASAX-111037158–AX-9456672333.27TraesCS2A01G075000Germin-like protein
2BSQPHS.xjau-2BSAX-94849048–AX-9463294245.73TraesCS2B01G082400Myb-related transcription factor
46.59TraesCS2B01G083400Germin-like protein
7BLQPHS.xjau-7BLAX-110292317–AX-179558612685.38TraesCS7B01G701400LCF-box family protein
3DSQPHS.xjau-3DSAX-108907550–AX-9447996377.35TraesCS3D01G124500Gibberellin 3-beta-hydroxylase
Disclaimer/Publisher’s Note: The statements, opinions and data contained in all publications are solely those of the individual author(s) and contributor(s) and not of MDPI and/or the editor(s). MDPI and/or the editor(s) disclaim responsibility for any injury to people or property resulting from any ideas, methods, instructions or products referred to in the content.