Article

Bio-Efficiency of Blue Diode Laser Treatment on Weed Seedlings and Seeds Under Controlled Conditions


1
Weed Science Unit, Department of Plants and Crops, Faculty of Bioscience Engineering, Ghent University (UGent), 9000 Ghent, Belgium
2
Technology and Food Science Unit, Flanders Research Institute for Agriculture, Fisheries and Food (ILVO), 9820 Merelbeke-Melle, Belgium
3
Research and Advice Centre for Agriculture and Horticulture (Inagro), Ieperseweg 87, 8800 Rumbeke-Beitem, Belgium
*
Author to whom correspondence should be addressed.
Agriculture 2026, 16(4), 474; https://doi.org/10.3390/agriculture16040474
Submission received: 15 January 2026 / Revised: 9 February 2026 / Accepted: 17 February 2026 / Published: 19 February 2026
(This article belongs to the Section Crop Protection, Diseases, Pests and Weeds)

Abstract

Laser radiation constitutes a promising technological advancement within the integrated weed management toolbox but is hindered by low energy use efficiency. This study investigated the efficiency of a pulsed blue diode laser for controlling small weed seedlings and seeds under controlled conditions. Dose–response experiments were conducted on three grasses (Poa annua, Echinochloa crus-galli, Digitaria sanguinalis) and three dicotyledonous species (Solanum nigrum, Chenopodium album, Senecio vulgaris). For seedlings, the effects of species, growth stage (cotyledon, 2-leaf), and leaf wetness (dry, wet) were tested. For seeds, burial depth (0 mm, 2 mm) and imbibition status (non-imbibed, imbibed) were examined. Biological efficiency was assessed through plant survival, aboveground dry biomass, leaf area, and seed viability. Laser application caused significant, dose-dependent reductions in biomass accumulation and plant survival, with up to 100% mortality. Seedlings were most sensitive at the cotyledon stage and when foliage was dry, requiring up to 68 and 52% lower energy doses compared to older or wet targets, respectively. Species-specific responses were observed, with dicotyledonous species generally requiring 80 to 99% lower energy doses than grasses. Laser exposure was also effective in reducing the viability of non-imbibed, surface-exposed seeds, requiring up to 64 and 99% lower energy doses than imbibed or buried seeds, respectively. These results confirm that laser efficiency is strongly influenced by species traits, developmental stage, surface moisture, and seed water status. Optimising and tailoring laser parameters to these factors enhances weed control efficacy while maximising energy efficiency, improving the performance and sustainability of laser-based weeding.

1. Introduction

Laser-based weed control is emerging as a promising technological advancement in agricultural practices. This method provides high precision and selectivity in targeting weeds and minimises soil disturbance [1]. It represents a promising supplementary tool for managing weed species that are difficult to control, including those resistant to herbicides.
Several types of lasers have been investigated for their potential in weed control, including CO2 lasers, diode lasers, and fibre lasers [1]. In recent years, multiple laser-based weeding systems have been developed and introduced to the market. The Robot One (Pixelfarming Robotics, The Netherlands) uses a CO2 laser and operates autonomously. In contrast, the Lumina (Weedbot, Riga, Latvia) and LaserWeeder G2 (Carbon Robotics, Seattle, WA, USA) both use diode lasers and are designed as tractor-mounted modules. The TOR (Trabotyx, ’s Hertogenbosch, The Netherlands) uses a diode laser that operates autonomously. Generally, these commercial systems target weeds at the cotyledon and 2-leaf growth stages, where laser treatment is most effective in achieving plant mortality. Among these technologies, diode lasers have gained particular attention due to their favourable characteristics. A diode laser generates a focused beam of light through the excitation and recombination of electrons and holes within a semiconductor material, typically by passing an electric current through it. An advantage of a diode laser is that it is compact, readily available and cheaper than fibre and CO2 lasers [2,3]. While CO2 lasers typically achieve electro-optical efficiencies of 10–20% [4,5], diode lasers can reach significantly higher efficiencies, commonly 50–70% and in some cases up to 80% [6,7,8]. Consequently, this study focuses on the use of diode lasers for weed control. Specifically, blue light is strongly absorbed by chlorophyll, flavonoids and carotenoids [9]. Moreover, water absorbs less blue light than red light, reducing energy losses due to water [10,11,12,13]. For example, the TOR system developed by Trabotyx and the Lumina by Weedbot are commercially available and utilise a blue diode laser [14,15].
The use of laser-based weed control technology could reduce reliance on herbicides and slow down the development of herbicide resistance [16]. Additionally, it may decrease labour requirements for weed management. Reducing this labour burden is especially critical in organic farming, where chemical weed control is not allowed. For example, manual weeding in conventional bean (Phaseolus vulgaris L.) cultivation requires 5 to 15 h per hectare [17], while organic onion (Allium cepa L.) cultivation necessitates a higher labour input, ranging between 272 and 756 h per hectare [18].
Laser technology can intervene at multiple stages of the weed life cycle. Specifically, lasers can target both seedlings and seeds, offering opportunities for both preventive and curative control. Before sowing a crop, laser weeding can be applied as a false seedbed treatment to reduce the soil seed bank, while early in the growing season, it can target emerging seedlings to prevent weed establishment.
Several factors influence the efficacy of laser-based weed control, including plant species, growth stage, and laser dosage. Andreasen et al. [19] investigated the effects of a thulium-doped 50 W fibre laser on the apical meristem of various plant species at different growth stages. In dicotyledonous weeds at the cotyledon stage, exposure to the highest laser dose (12.7 J mm−2) completely inhibited regrowth. Sensitivity to laser treatment varied significantly among species. For example, the effective dose required to inhibit 90% of growth (ED90) for the highly sensitive weed, Viola arvensis Murray (field pansy) was 0.24 J mm−2, which was 12.8 times lower than that of the least sensitive species, Lamium purpureum L. (red dead-nettle) and Veronica persica Poir. (common field speedwell) (both 3.07 J mm−2) [19]. Younger plants are generally more sensitive to leaser treatment. For example, in Lolium perenne L. (perennial ryegrass), the ED50 at the 3-leaf stage was 2.60 J mm−2, compared to 6.13 J mm−2 at the 7-leaf stage [20]. Similarly, Andreasen, Vlassi and Salehan [19] found that the early stages (BBCH11) of Alopecurus myosuroides Huds. (black twitch) were completely killed with lower doses, while later growth stages required higher doses. These findings underscore the critical role of biotic parameters in optimising the success of laser-based weed control strategies.
The effect of laser treatment on seeds has been quantified for several species by Andreasen et al. [21]. Seeds from several weed species and crops were exposed to increasing doses of a thulium-doped 50 W fibre laser by placing the seeds approx. 40 cm directly below a laser head in a steel box. Small-seeded species such as Silene noctiflora L. (night-flowering catchfly) and Centaurea cyanus L. (bluebottle) exhibited reduced germination at low laser doses (0.4–0.8 J mm−2) and complete destruction at higher doses (8.0–15.9 J mm−2). Large-seeded species, including cereals, were far more tolerant, requiring energy doses exceeding 15.9 J mm−2 for 90% control. No clear correlation was found between seed size and laser sensitivity. Seeds covered by 2.5 to 5 mm of soil were mostly unaffected, except for C. cyanus. It should be noted that dry seeds were used in these experiments, which may influence laser susceptibility and represent a limitation of this study.
Experimental studies specifically investigating the effects of abiotic factors on laser-based weed control are currently lacking. While several publications [19,22,23,24] acknowledge the potential influence of environmental conditions in their discussions, no quantitative data or dose–response adjustments for varying abiotic parameters have been reported to date.
A major limitation to the practical deployment of laser-based weed control is its inherently low energy-use efficiency [22]. Laser efficiency depends not only on technical design, such as electro-optical efficiency and precision targeting of meristems [23], but also on biological and environmental factors. Identifying conditions under which weeds are most susceptible is therefore critical. For example, the wetting status of the targets (as influenced by rain, dew, irrigation), temperature and soil moisture status may reduce efficacy [22]. As laser irradiation raises the plant tissue temperature [24], factors that change leaf temperature such as evaporative cooling, humidity, wind and plant water content can also affect laser efficiency.
This research investigates the potential of laser technology to control weeds at multiple stages of their lifecycle, both preventively, by targeting seeds and the soil seed bank, and curatively, by controlling early-stage seedlings. The primary aim is to identify the most susceptible seeds and seedlings for effective control using a blue diode laser and to provide recommendations for its optimal application. Weed susceptibility is likely influenced by species-specific responses, seedling growth stage, leaf wetness, seed imbibition, and seed burial depth, all of which may affect laser absorption, heat transfer, and accessibility. By systematically evaluating these factors, this study seeks to establish a comprehensive understanding of conditions that maximise the efficiency of laser-based weed management.

2. Materials and Methods

2.1. Laser

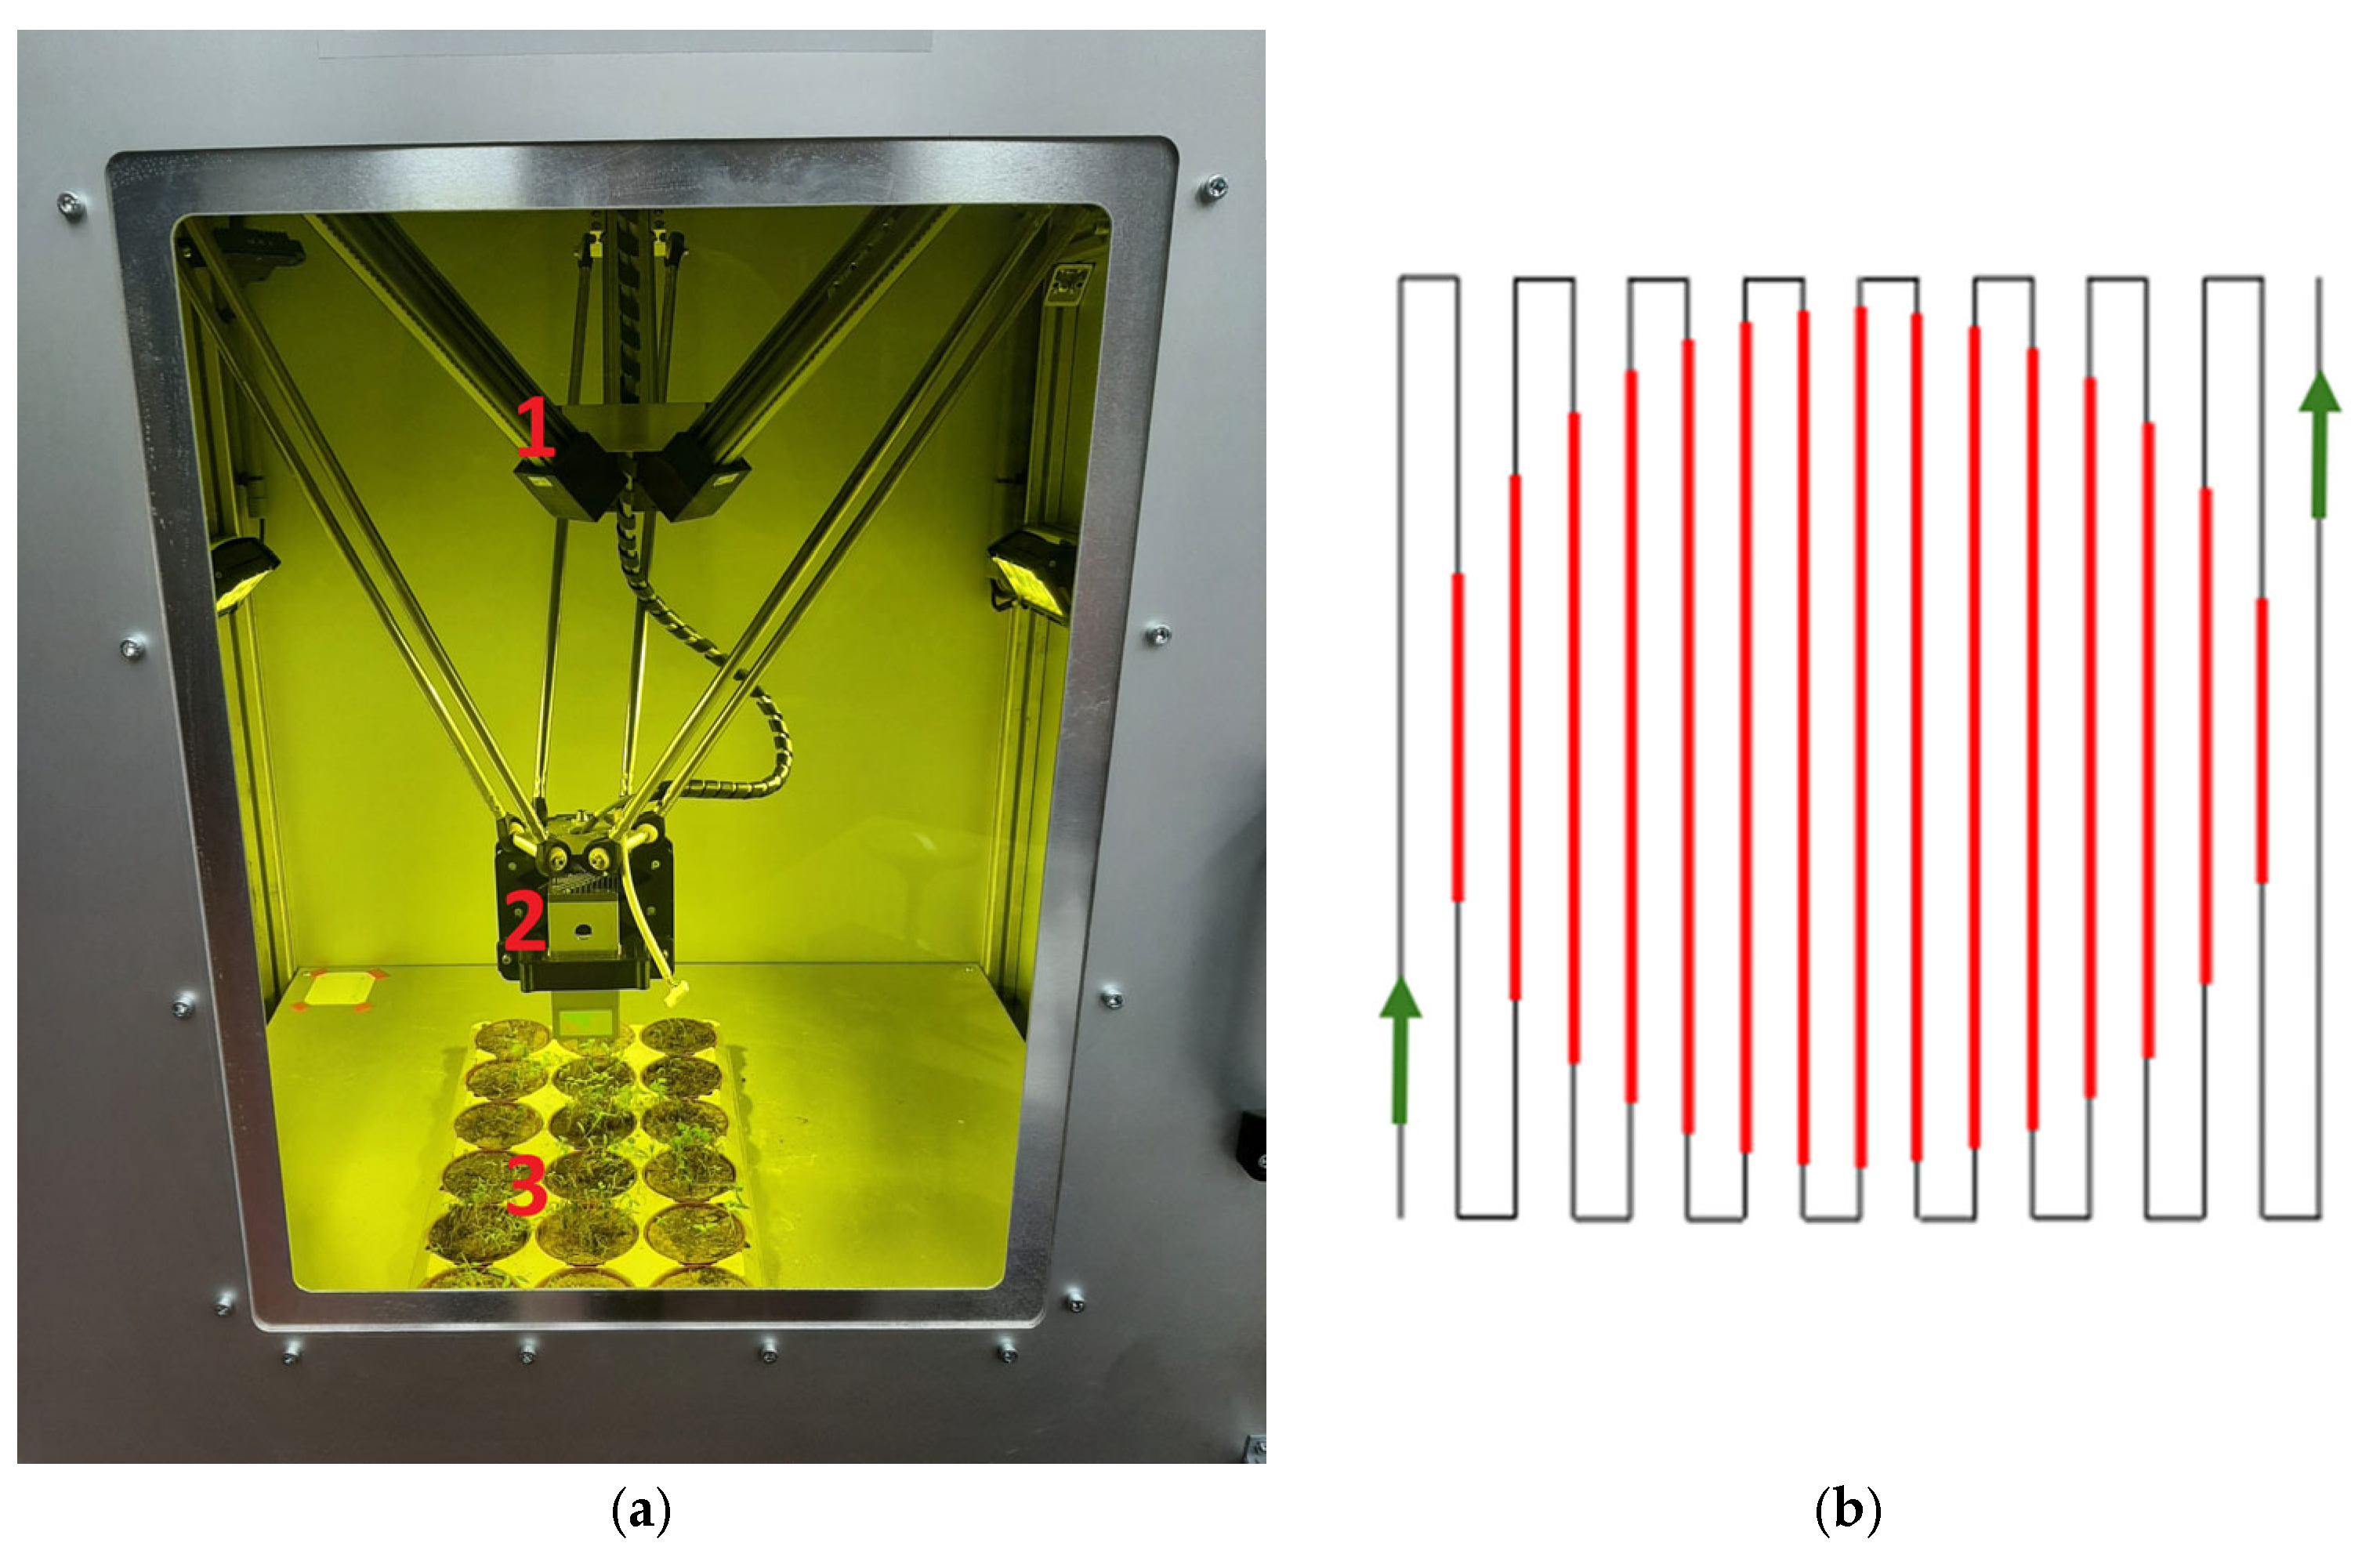
All laser treatments were performed using a prototype laser robot (Figure 1a). The laser head is mounted on a parallel robot arm operating within a closed cabin equipped with a viewing window composed of wavelength-specific safety glass that selectively attenuates laser radiation to ensure operator safety. A plant tray accommodating 18 pots (each with a diameter of 9 cm) is positioned in the cabin, seated in the designed recess on the base plate. The laser head contains the “AtomStack M100” (Shenzhen AtomStack Technologies, Shenzhen, China) (Table 1). This laser is a pulsed blue diode laser, emitting radiation at a wavelength of 455 nm. It is equipped with a converging lens and is originally designed for cutting and engraving wood and metal.
The laser treatment was controlled by a Programmable Logic Controller (PLC) (Siemens, München, Germany), driving the stepper motors of the robot arm (Igus, Cologne, Germany), utilising predetermined coordinates to target specific pots. The laser head was positioned at a height of 1 cm above the species-specific target height (seedling or seed) to maintain a consistent focal distance. In this experimental setup, we quantified the dose delivered across the entire surface of the treated pot, rather than targeting specific apical meristem points for which the laser system was not designed. This approach enabled optimisation of the laser parameters to identify the most practical and time-efficient method, while remaining within the operational constraints of the available laser system. Following this rationale, we elected to maintain a constant speed for all dose levels and to modulate the duty cycle to achieve the required doses, rather than varying the speed. Treatment parameters included a movement speed of 50 mm s−1 and a pulsed emission with a period of 1000 µs. Predefined duty cycles were applied according to the desired energy dose. For instance, at a 10% duty cycle, the laser was activated for 100 µs and deactivated for 900 µs within each period. Each experimental unit (a circular pot in case of seedlings, a circular metal plate in case of seeds) was uniformly treated across its surface using a laser head that moved back and forth, with a line spacing of 1 mm (Figure 1b). To reduce the risk of fire and ensure the effective treatment of seedlings extending beyond the pot edges, a donut-shaped metal plate was placed around the pot. This plate expanded the laser’s working area.

2.2. Dose–Response Experiments

Dose–response experiments were conducted to examine the influence of weed species, growth stage, leaf wetness, seed imbibition, and seed burial depth on sensitivity of seedlings and seeds to laser treatment. All seeds were collected in Flanders (Belgium) in the two years preceding the experiment and stored in a refrigerator at a 5 °C. Seedlings were treated with seven different doses, while seeds were exposed to six doses (Table 2), both covering the same overall energy range. The applied dose was calculated as follows:
d o s e   J   mm − 2 = r a d i a n t   p o w e r   W × s p e e d   mm s − 1     × l i n e   s p a c i n g   mm − 1   × d u t y   c y c l e   % w h e r e   r a d i a n t   p o w e r = 20   W ,   s p e e d = 50 mm s   a n d   l i n e   s p a c i n g = 1   mm

2.2.1. Seedling Experiments

Three sub-experiments were conducted to investigate the effects of common weed species [25,26] (exp. 1.1), growth stage (exp. 1.2), and leaf wetness (exp. 1.3) on seedling sensitivity to laser treatment. The experimental levels were: six weed species, two growth stages (BBCH10: cotyledons completely unfolded or first true leaf emerged from coleoptile, and BBCH12: 2 true leaves, leaf pairs or whorls unfolded), and two leaf wetness levels (wet and dry). Each experiment followed a completely randomised design with four replicates. The experimental unit consisted of a single plastic pot (9 cm diameter, 0.28 L volume), filled with a 1:1 mixture of commercial potting soil and steamed sandy loam soil. The steamed sandy loam contained 1.1% organic matter, 8.6% clay, 51.6% silt, and 39.9% sand, with a pH-KCl of 5.65.
An overview of the sub-experiments, including the experimental factors and their respective levels, as well as sowing, treatment, and harvest dates, is presented in Table 3. Seeds were sown at a depth of 2 mm. After emergence, seedlings were thinned to seven uniform individuals per pot, except for S. nigrum, which was thinned to six seedlings per pot in the weed species experiment (exp. 1.1). Laser treatment was generally applied at the BBCH 10 growth stage, except in the growth stage experiment (exp. 1.2), where plants were treated at both BBCH 10 and BBCH 12. Prior to treatment of the wet leaf targets (exp. 1.3), the plants were moistened for 10 s using a hand-held garden sprayer to ensure uniform surface wetting.
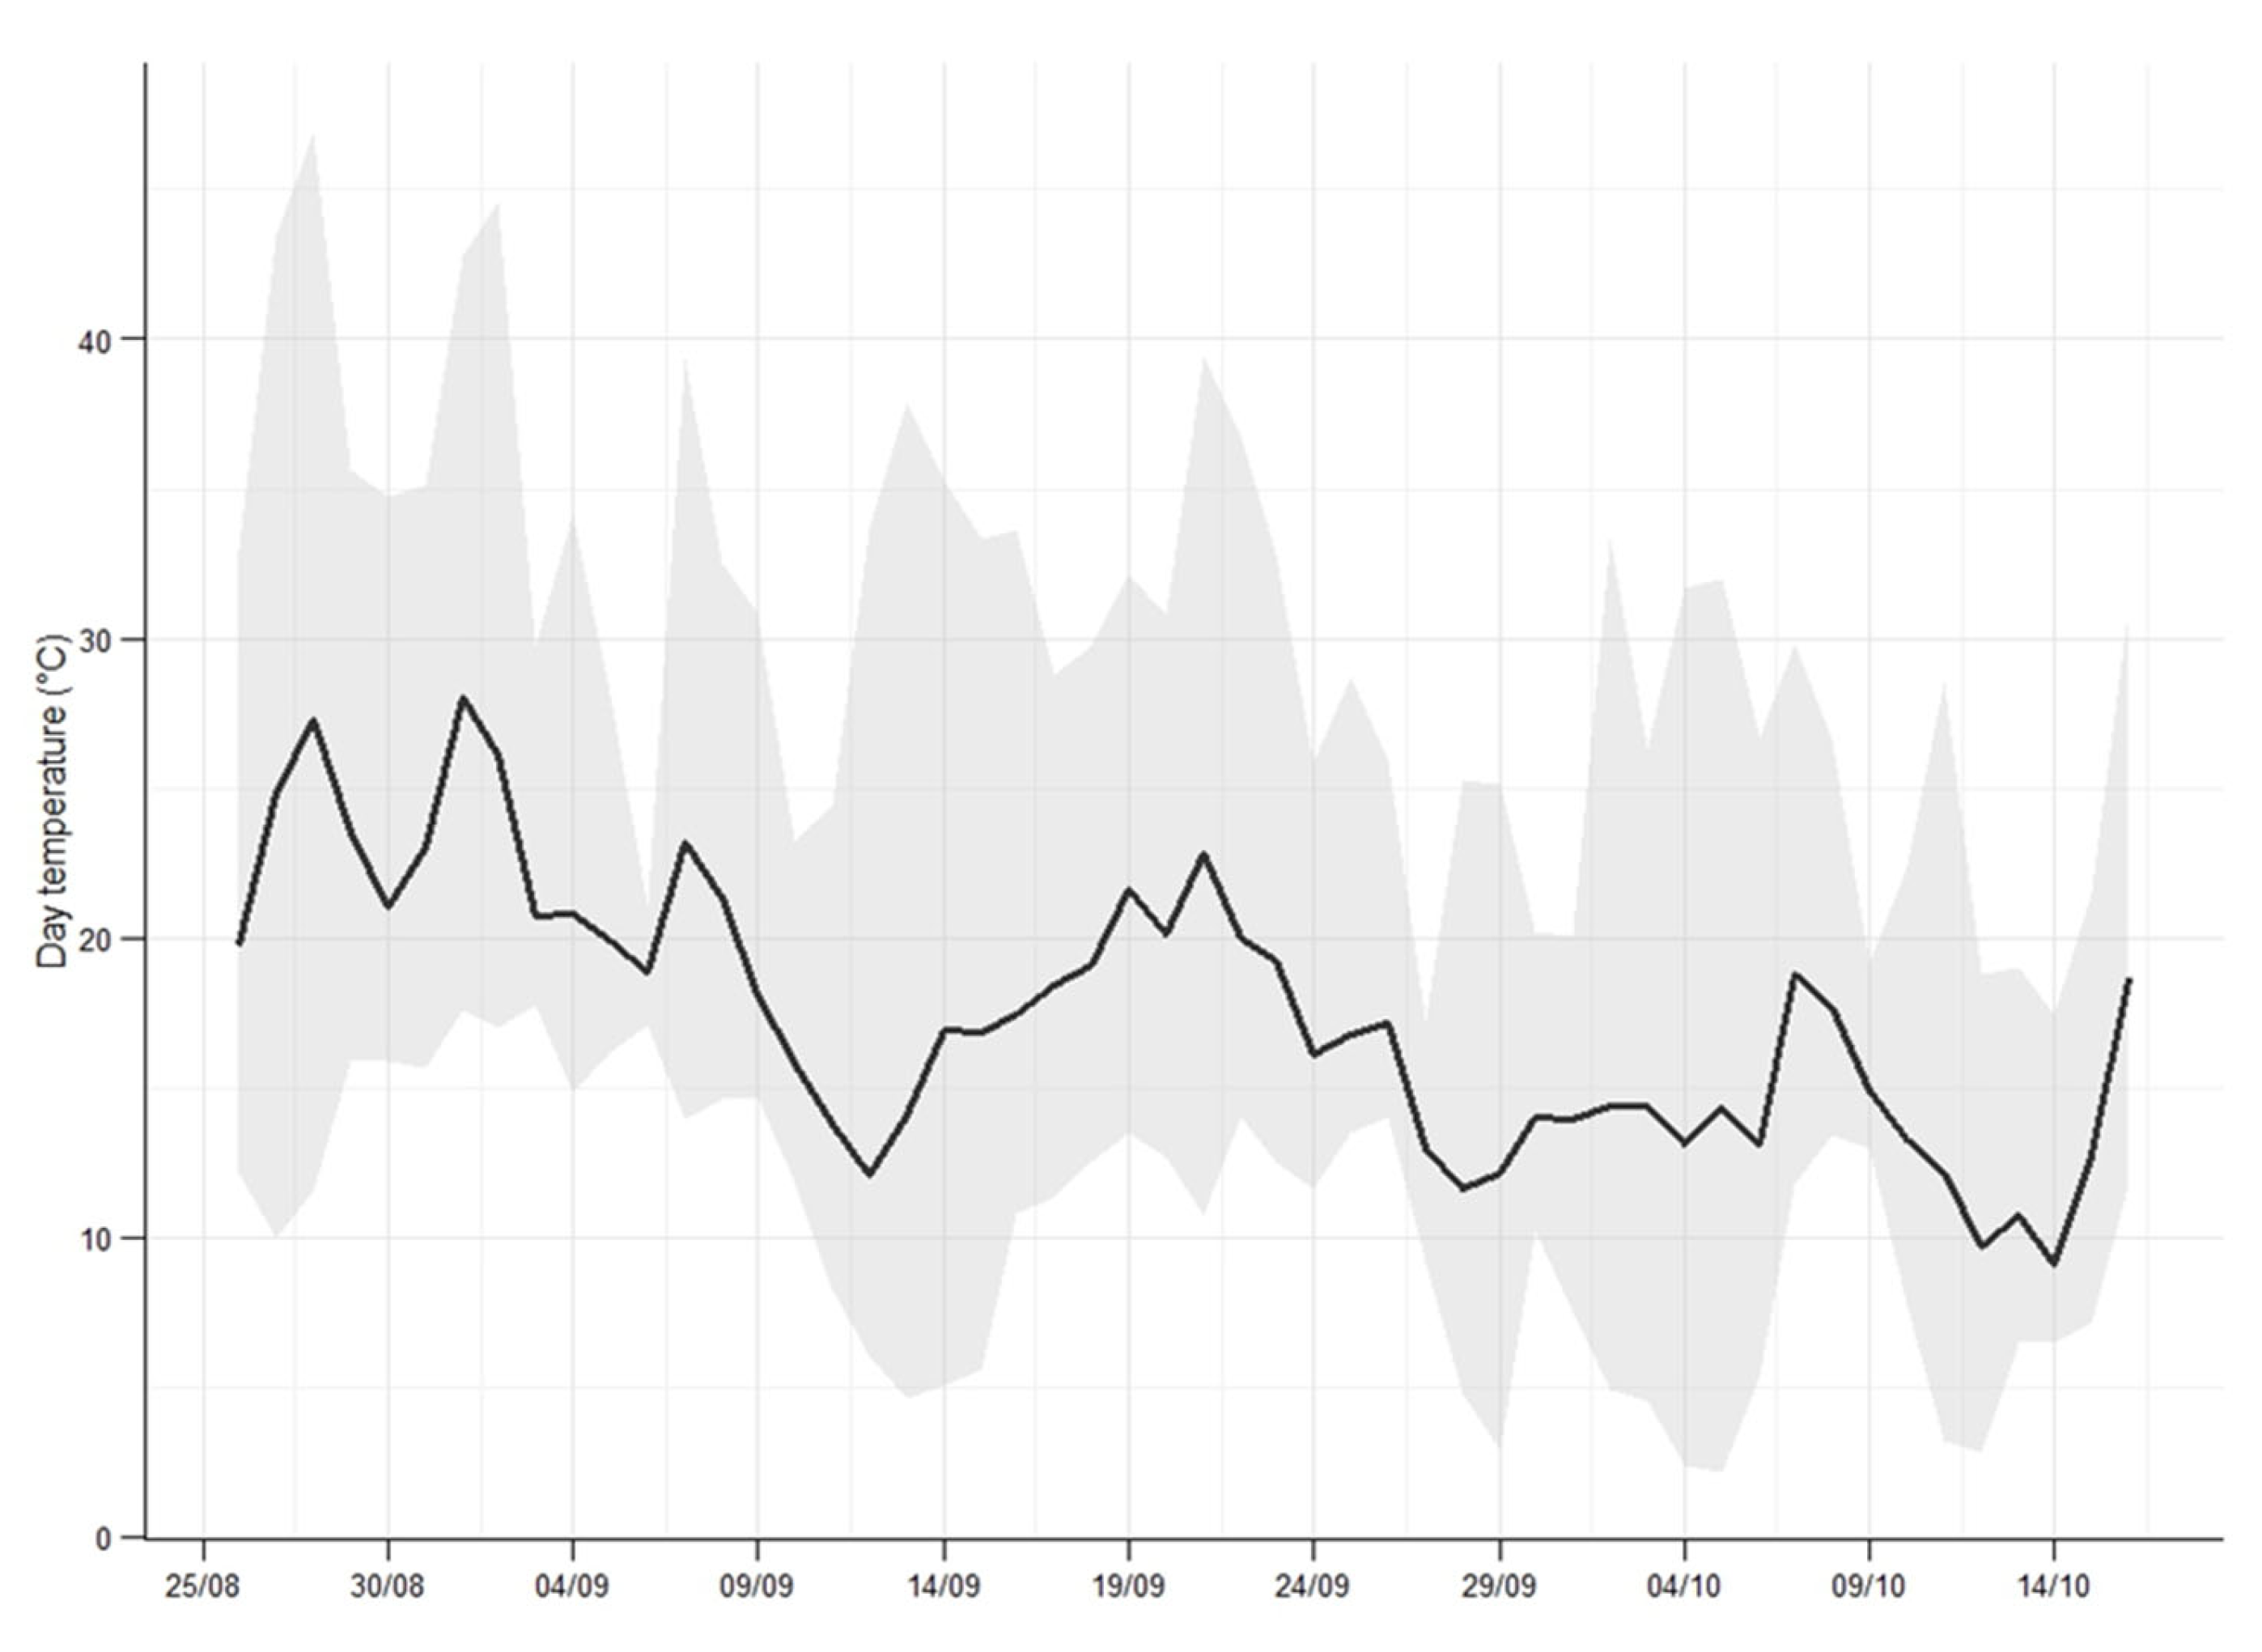
The air temperatures in the greenhouse in the periods before, during and after treatments are shown in Figure 2. Temperatures were recorded using a data logger (EasyLog EL-USB-1, Lascar Electronics, Whiteparish, UK). The pots were irrigated three times daily for one minute (0.53 L m−2 min−1) using sprinklers.

2.2.2. Seed Experiments

Two sub-experiments were conducted to investigate the relevance of seed burial depth (exp. 2.1) and seed imbibition (exp. 2.2) on the sensitivity of weed seeds to laser treatment. Each experiment followed a completely randomised design with four replicates. The experimental unit consisted of a plastic 9 cm pot (exp. 2.1) or a metal plate (exp. 2.2) with 50 seeds.
To assess the effect of seed burial depth on sensitivity to laser treatment (exp. 2.1), seeds were either placed on the soil surface (0 mm) or covered with 2 mm of topsoil. Both the soil substrate and topsoil were composed of the same steamed sandy loam used in the seedling experiments. This setup was prepared two days prior to laser treatment to allow for seed imbibition under moist conditions.
To assess the effect of seed imbibition on the sensitivity of seeds to laser treatment (exp. 2.2), half of the seeds were used in a dry (non-imbibed) state, while the other half were soaked in water for 24 h prior to laser treatment. For treatment, all seeds were placed on an aluminium plate, which was chosen based on preliminary tests indicating minimal local heating during laser exposure, thereby ensuring that seed responses were not influenced by the substrate.

2.3. Measurements

2.3.1. Seedling Experiments

Plant response to laser treatment was evaluated using three parameters: plant survival and live aboveground dry biomass, and green leaf area. Survival (plants per pot) was assessed on the harvest date by counting the number of surviving seedlings per pot. To determine live aboveground dry biomass (g per pot), all surviving seedlings were clipped just above the soil surface. The harvested biomass was oven-dried at 75 °C for 16 h and subsequently weighed using an analytical balance (Kern ALJ 120-4) with an accuracy of 0.0001 g.
To quantify green leaf area, each pot was photographed at two and ten days after laser treatment (DAT) using an RGB camera mounted perpendicular to the pot surface. Image analysis was performed using MATLAB (version R2024a, Update 6) (MathWorks, Natick, MA, USA). Plant tissue was isolated using the “Color Thresholder” application by selecting the most suitable colour space (RGB, HSV, YCbCr, or L*a*b*), depending on species and image conditions. Batches of images taken at the same time point and for the same species were then processed using the “Image Batch Processor” tool. All processed images underwent visual verification to ensure segmentation accuracy. For each pot, the number of green pixels was calculated and converted to green surface area (mm2), based on the pot’s known total surface area. From this parameter two additional parameters were derived: (i) absolute regrowth, defined as the mean daily increase in green surface area (mm2 day−1), obtained by dividing the difference in green surface area between 10 DAT and 3 DAT (a period encompassing one week and spanning from the stage when necrosis is generally most pronounced to later recovery) by the number of elapsed days; and (ii) necrosis percentage at 3 DAT, defined as the reduction in green surface area at the second-lowest dose (0.008 J mm−2) relative to the untreated control. The focus for the necrosis percentage lies on the second-lowest dose, as this gives the widest range of responses. The calculations were conducted with RStudio (version 2025.05.0+496) [27]. The second-lowest dose was selected as a marked reduction in green surface area was already evident in most species at this level.

2.3.2. Seed Experiments

Seed response to laser treatment was assessed by quantifying seed viability. Following treatment, seeds were carefully recovered from the soil by rinsing and sieving. Retrieved seeds were then transferred to a Copenhagen germination table for post-treatment viability assessment using the top-of-paper method. Germination conditions were set to a 16/8 h light/dark regime with a temperature cycle of 25 °C during the light period and 18 °C during the dark period. Illumination was provided by two Sylvania Gro-Lux F58W/GRO fluorescent lamps, delivering a total light intensity of 5000 lumens. Germinated seeds were counted weekly and removed from the germination table. Seeds that failed to germinate by the final assessment (39 and 19 DAT in experiments 2.1 and 2.2, respectively) were subjected to a tetrazolium viability test. Seeds were cut longitudinally with a razor blade, and one half was placed cut-side down on filter paper moistened with 2.5 mL of a 1% 2,3,5-triphenyltetrazolium chloride solution. The Petri dishes were incubated in darkness for 24 h in a climate chamber, after which viability was assessed under an Olympus SZX7 stereomicroscope (Olympus, Tokyo, Japan). Seeds were considered viable if the entire embryo stained red, indicating the reduction of 2,3,5-triphenyltetrazolium chloride to red triphenylformazan by active dehydrogenase enzymes in living cells [28].

2.4. Statistical Analysis

All data were analysed in RStudio (version 2025.05.0+496) [27] at the 5% significance level.
Normality and homogeneity of variance of the residuals for necrosis percentages, number of surviving plants, aboveground dry biomass, and seed survival (%) were evaluated using QQ plots and a Levene’s test. Where assumptions were violated, a Box–Cox transformation was applied prior to statistical analysis.
Absolute regrowth rate and necrosis percentages, derived from green leaf area data, were analysed using a one-way ANOVA, followed by a Tukey HSD test to assess the effects of plant species (experiment 1.1) and growth stage (experiment 1.2), respectively. The obtained data from the dose–response experiments were analysed with the ‘drc’ package [29]. The factors of plant survival, live aboveground dry biomass, and seed survival were the dependent variables, and the variable laser energy dose was the independent variable. The most suitable regression model from the ‘drc’ package was then selected based on the information coefficient (IC) and the ‘lack of fit’. The models used are a Weibull type 1 and type 2 and a log-logistic three-parameter model [30,31]. Based on the chosen model’s ED50 values, ED90 values and selectivity indices were determined using the delta method (van der Vaart, 2009). The ED90, for example, is the laser energy dose necessary to obtain a 90% reduction in factors such as plant survival, live aboveground dry biomass, or seed survival compared to the control. The selectivity index, defined as the ratio of ED90 values between two dose–response curves, was used to evaluate the influence of plant species, growth stage, leaf wetness, seed burial depth, and seed imbibition on laser treatment efficiency.

3. Results

3.1. Seedling Experiments

3.1.1. Effect of Plant Species

All species were treated at the BBCH 10 growth stage. At this stage, dicotyledonous species have a well-exposed shoot apical meristem located at the shoot apex between the cotyledons, whereas in monocotyledonous species, the shoot apical meristem is well-protected being enclosed within the coleoptile and the surrounding leaf sheath [19,32,33]. Poa annua, E. crus-galli, and D. sanguinalis are classified within the family Poaceae, while S. nigrum, C. album, and S. vulgaris belong to the families Solanaceae, Amaranthaceae, and Asteraceae, respectively [34]. The species also differ in leaf pubescence and the structural characteristics of the plant cuticle. Chenopodium album, S. vulgaris, E. crus-galli, and P. annua have glabrous to nearly glabrous leaf surfaces [34,35]. In contrast, S. nigrum exhibits sparse leaf surface trichomes, whereas D. sanguinalis displays dense pubescence [36,37]. Mature leaves of C. album are highly hydrophobic relative to the other dicotyledonous species, especially S. nigrum which has highly hydrophilic leaves [38]. Echinochloa crus-galli and D. sanguinalis are also characterised by a strong epicuticular wax layer composed of nanostructured crystalline formations, which are highly effective at scattering and reflecting blue light [39] and contribute to pronounced hydrophobic leaf surface properties [38,40]. Among the monocotyledons, P. annua possesses a smaller leaf surface area compared to the other species examined.
Based on the ED90 values for both plant survival and live aboveground dry biomass, dicotyledonous species were generally more susceptible to the treatment (Table 4). In contrast, monocotyledonous species exhibited higher tolerance, particularly E. crus-galli, which maintained substantial live aboveground dry biomass even at very high doses. The difference in sensitivity between C. album, the most sensitive species, and E. crus-galli, the least sensitive species, is a factor of 6.6. Unlike dicotyledons, grasses did not show significant interspecific differences in ED90 value for plant survival. Moreover, sensitivity patterns differed between survival and biomass responses, suggesting that in some species (e.g., S. nigrum), the treatment may be more effective at suppressing biomass accumulation than at reducing plant survival.
In addition, data on absolute regrowth show that dicotyledonous species are significantly inhibited even at the lowest energy dose (0.008 J mm−2), while the grasses E. crus-galli and P. annua require higher doses to exhibit a significant reduction in regrowth (Table 5).

3.1.2. Effect of Growth Stage

In S. nigrum, a significant difference in sensitivity was detected at the ED50 level for plant survival, with the BBCH10 stage being 5.8 times more sensitive than BBCH12 (Table 6). In contrast, E. crus-galli showed no significant differences in sensitivity between BBCH10 and BBCH12, irrespective of the ED level. Furthermore, for both S. nigrum and E. crus-galli, no significant differences between growth stages were found when sensitivity was evaluated based on ED50 or ED90 values for live dry biomass.
In S. nigrum, necrosis levels did not differ significantly between growth stages (Table 7). In contrast, E. crus-galli showed a 23.7 percentage point reduction in necrosis at BBCH12 compared to BBCH10.

3.1.3. Effect of Leaf Wetness

For C. album and E. crus-galli, the ED50 values based on plant survival were significantly higher under wet leaf conditions than under dry conditions, increasing by factors of 1.3 and 1.6, respectively (Table 8). In contrast, the ED90 values for plant survival did not differ significantly between dry and wet leaves. For C. album, both ED50 and ED90 based on live dry biomass were significantly higher for wet leaves, with factors of 3.5 and 2.1, respectively, indicating reduced treatment efficacy. In E. crus-galli, only the ED50 for dry biomass was significantly affected by lead wetting (factor 2.2), while the ED90 remained unchanged.

3.2. Seed Experiments

3.2.1. Effect of Burial Depth

A consistent effect of sowing depth on ED90 values was observed across species, except for E. crus-galli, where large standard errors, particularly at 2 mm depth, obscured clear interpretation (Table 9). In contrast, ED50 values showed a more pronounced pattern: burial at 2 mm increased ED50 values by factors of 9.6, 592.0, and 16.5 for C. album, S. nigrum, and E. crus-galli, respectively, compared to fully exposed. These findings indicate a general reduction in treatment sensitivity with increasing sowing depth.

3.2.2. Effect of Seed Imbibition

For S. nigrum and E. crus-galli, the ED90 values were significantly higher for seeds imbibed for 48 h than for the non-imbibed seeds, increasing by factors of 2.7 and 2.8, respectively. In contrast, no significant difference was observed between imbibed and non-imbibed seeds of C. album (Table 10).

4. Discussion

4.1. Plant Species

Clear interspecific differences in sensitivity to laser radiation were observed at BBCH10, with dicotyledons species generally more sensitive than grasses. Chenopodium album was the most sensitive species, showing ED90 values for plant survival 6.6 times lower than those of E. crus-galli, the least sensitive species. Biomass-based ED90 values supported this trend, with C. album being significantly more sensitive than all grass species, by factors ranging from 5.0 (D. sanguinalis) to 65.6 (E. crus-galli). No significant differences in ED90 were found among dicotyledonous species, while among grasses, only D. sanguinalis and E. crus-galli differed. Regrowth was also more strongly suppressed in dicotyledonous species, even at the lowest dose (0.008 J mm−2), whereas in P. annua and E. crus-galli significant reductions occurred only at higher doses (0.03824 J mm−2 and 0.01748 J mm−2, respectively). The observed interspecific differences in sensitivity to laser radiation treatment can largely be attributed to morphological differences in meristem location and protection. In annual dicotyledonous species, the shoot apical meristems are typically exposed and therefore directly affected by the laser beam [33]. In contrast, in young grasses, meristems are located at or below the soil surface and are protected by surrounding leaf sheaths [19]. From a practical perspective, these species-specific differences indicate that field laser-weeding systems should employ differentiated energy settings. Adaptive power control based on weed identification would therefore improve energy efficiency and control performance in species-diverse fields.

4.2. Growth Stage

Our findings confirm that plant sensitivity to laser radiation generally decreases with advancing growth stage, in line with previous research, though with nuances depending on the response parameter considered. Dose–response experiments showed that younger growth stages (BBCH10) of both S. nigrum and E crus-galli were generally more susceptible to laser radiation than more developed stages. This aligns with earlier studies: Coleman, Betters, Squires, Leon-Saval and Walsh [20] found that in Lolium perenne, the energy dose required to achieve a 50% reduction in dry biomass (ED50) was 140% higher at the 7-leaf stage than at the 3-leaf stage. Similarly, Andreasen, Vlassi and Salehan [19] reported that the ED90 for fresh biomass in Alopecurus myosuroides at the 2-leaf stage was 2.6 times lower than at the 3-leaf stage. Our results reflect this trend but also reveal response-specific variability. In S. nigrum, a significant difference between stages was observed only for the ED50 based on plant survival, with BBCH10 plants being 5.8 times more sensitive than those at BBCH12. No significant differences were detected in dry biomass or necrosis percentage, although higher ED90 values and necrosis levels at BBCH12 suggest a tendency toward reduced sensitivity. In E. crus-galli, sensitivity did not differ significantly between BBCH10 and BBCH12 for either ED50 or ED90 based on survival or dry biomass. However, the necrosis percentage was significantly lower at BBCH12 (−23.7 percentage points), suggesting a slight decline in sensitivity at the later growth stage. Arable fields would benefit from frequent scouting to target weeds at the BBCH10 stage. For later growth stages, laser applicators may need to increase doses to maintain control efficacy. Hence, laser systems should optimally be applied within a narrow time window (e.g., five days for rapidly emerging species), as delays allow weeds to reach stages that are less susceptible to treatment.

4.3. Leaf Wetness

Leaf wetness significantly reduced the efficacy of laser treatments on young seedlings (BBCH10), with species-specific responses linked to differences in leaf morphology and surface wettability. In S. nigrum, wet leaves had no significant effect on survival or dry biomass, likely due to trichomes that limit surface wetting [41,42]. In contrast, C. album showed a marked reduction in treatment efficiency under wet conditions: ED50 and ED90 for dry biomass increased by 3.5 and 2.1 times, respectively, and ED50 for survival increased 1.3-fold. This may be explained by the high wettability of its cotyledons despite the hydrophobic nature of mature leaf surfaces [38]. Echinochloa crus-galli exhibited an intermediate response, with ED50 values for dry biomass and survival increasing by 2.2 and 1.6 times, respectively, while ED90 remained unchanged. Its waxy leaf surfaces and erect architecture reduce wetting, but water accumulation between leaf sheaths may locally diminish laser absorption. Overall, these results highlight the importance of leaf surface properties in modulating laser treatment outcomes under wet conditions. The reduced sensitivity of wetted plants, as observed in C. album and, to a lesser extent, E. crus-galli, suggests that field conditions involving dew, rainfall, or irrigation can substantially decrease treatment efficiency. To optimise energy use and maximise weed control, laser applications should therefore target dry plants free of surface moisture. In our experiments, a blue diode laser (455 nm) was used; however, the influence of leaf wetness is expected to be even more pronounced at higher wavelengths, due to stronger laser-water interactions. The optical properties of water vary significantly with wavelength: at 450 nm, only 2.08% of incident light is reflected and a mere 0.005% is absorbed through a 0.5 cm water layer at normal incidence [10,11,12,13]. In contrast, at 2000 nm, reflection drops slightly to 1.76%, while absorption increases dramatically to 98.24%. These results highlight a key operational rule: laser weeding should be performed only when plants are dry. Incorporating leaf-wetness sensors or weather-adaptive scheduling into autonomous systems may help avoid dew or irrigation periods.

4.4. Seed Burial Depth and Imbibition

Laser treatment efficiency is markedly affected by seed burial depth. The substantially higher ED50 values for buried seeds of C. album, S. nigrum, and E. crus-galli—ranging from approximately 10-fold to nearly 600-fold increases compared to surface seeds—indicate that energy requirements escalate sharply with burial depth. A similar trend is observed for ED90 values, except for E. crus-galli. In S. nigrum and E. crus-galli, standard errors at 2 mm depth are large due to limited reduction in survival at the highest tested dose, complicating data interpretation. Previous trends highlight the physical barrier that soil imposes, likely reducing laser light penetration and energy transfer to the seed. Indeed, light penetration in dry soil at 455 nm typically ranges from 45 to 100 µm, depending on soil texture [43]. The presence of water alters light transmission in a soil-dependent manner: wetting increases transmission in sandy soils but reduces it in clay soils due to greater absorption by suspended particles [44,45]. This effect is also wavelength-dependent: light at 455 nm is absorbed by water approximately a million times less than light at 2000 nm [13]. Although blue light at 455 nm is minimally absorbed by water, energy absorbed by soil particles can still be transferred conductively, leading to localised heating of moisture in the topsoil. In general, seed sensitivity to laser radiation was influenced by seed imbibition status. Prior imbibition reduced the effectiveness of laser treatments in S. nigrum and E. crus-galli, with ED90 values 2.7 and 2.8 times higher, respectively, compared to dry seeds. This effect is likely due to the high specific heat capacity of water, which buffers embryo heating during irradiation [46]. In contrast, no significant difference was observed in C. album, likely because the seeds were not sufficiently imbibed due to their hard, water-impermeable seed coat [47]. Beyond imbibition, embryo position, protective seed structures and seed/fruit shape may also influence sensitivity to laser treatment. In E. crus-galli, the dorsally located embryo, combined with random caryopsis orientation during laser treatment, likely contributed to both the higher ED90 value and its relatively large standard error, compared to species with more centrally or symmetrically positioned embryos, such as C. album or S. nigrum. This may partially explain the greater variability observed in ED90 estimates for E. crus-galli. In addition, husk structures typical of grasses provide further physical protection against laser exposure [48]. Seed shape also influences sensitivity: the spherical seeds of E. crus-galli have a lower surface-area-to-volume ratio, which limits energy absorption per unit mass and results in greater tolerance to irradiation. This pattern is consistent with previous findings on heat resistance, where round seeds showed higher resilience to elevated temperatures than flat or elongated seeds [49,50]. These results show that lasers are ineffective for pre-emergence seedbank control. Practical applications should therefore target visible seeds (e.g., in the post-harvest stubble period) rather than buried seeds. To prevent newly produced weed seeds from entering the soil seedbank, laser treatments should be applied before any soil disturbance and under dry soil conditions, as imbibed seeds are less sensitive to laser exposure. Non-imbibed, surface-exposed seeds are therefore most vulnerable to laser treatment, suggesting potential applications such as targeting fallen seeds in stubble or removing co-harvested weed seeds in threshing machines. However, no commercial systems currently exist for these applications, and their practical feasibility remains untested. Given the difficulty of precisely detecting and identifying small seeds on the soil surface [51], co-harvested seeds may be the most feasible initial target for development.

5. Conclusions

Optimised laser weed management relies on species- and growth-stage-specific treatments that are precisely timed. Seedlings are most susceptible at the cotyledon stage under dry foliage conditions. To further enhance the energy efficiency of laser applications, treatments should target only the critical zones responsible for regrowth rather than the entire plant surface. For seeds, non-imbibed, surface-exposed, and co-harvested seeds represent the most promising initial targets.
These findings underscore the importance of tailoring laser treatments to the target’s biological and physiological state, thereby improving both efficacy and energy efficiency—key factors for field application and environmental sustainability.

Author Contributions

Conceptualisation, B.D.C. and M.D.M.; methodology, B.D.C., M.D.M., S.C. and D.N.; software, S.C.; formal analysis, M.D.M. and T.d.T.; investigation, M.D.M., B.D.C. and T.d.T.; resources, S.C. and D.N.; data curation, M.D.M.; writing—original draft preparation, M.D.M.; writing—review and editing, B.D.C., M.D.M. and L.D.; supervision, B.D.C. All authors have read and agreed to the published version of the manuscript.

Funding

This research received no external funding.

Data Availability Statement

The data presented in this study are available upon request from the corresponding author.

Acknowledgments

We thank Sebastien Temmerman and Stan Martens, both affiliated with ILVO, for their essential technical support and contributions to this research. We also extend our gratitude to Pieter De Wagter of Ghent University (experimental farm, Melle) for his practical assistance during the experiments.

Conflicts of Interest

The authors declare no conflicts of interest.

References

  1. Andreasen, C.; Scholle, K.; Saberi, M. Laser weeding with small autonomous vehicles: Friends or foes? Front. Agron. 2022, 4, 841086. [Google Scholar] [CrossRef] [Scilit]
  2. Nasim, H.; Jamil, Y. Diode lasers: From laboratory to industry. Opt. Laser Technol. 2014, 56, 211–222. [Google Scholar] [CrossRef] [Scilit]
  3. Rodrigues, G.C.; Vanhove, H.; Duflou, J. Direct diode lasers for industrial laser cutting: A performance comparison with conventional fiber and CO2 technologies. Phys. Procedia 2014, 56, 901–908. [Google Scholar] [CrossRef] [Scilit]
  4. Manshina, A.A.; Tumkin, I.I.; Khairullina, E.M.; Mizoshiri, M.; Ostendorf, A.; Kulinich, S.A.; Makarov, S.; Kuchmizhak, A.A.; Gurevich, E.L. The second laser revolution in chemistry: Emerging laser technologies for precise fabrication of multifunctional nanomaterials and nanostructures. Adv. Funct. Mater. 2024, 34, 2405457. [Google Scholar] [CrossRef] [Scilit]
  5. Kellens, K.; Rodrigues, G.C.; Dewulf, W.; Duflou, J.R. Energy and resource efficiency of laser cutting processes. Phys. Procedia 2014, 56, 854–864. [Google Scholar] [CrossRef] [Scilit]
  6. Kanskar, M.; Earles, T.; Goodnough, T.; Stiers, E.; Botez, D.; Mawst, L. 73% CW power conversion efficiency at 50 W from 970 nm diode laser bars. Electron. Lett. 2005, 41, 245–247. [Google Scholar] [CrossRef] [Scilit]
  7. Wang, L.; Qu, H.; Qi, A.; Zhou, X.; Zheng, W. High-power laser diode at 9xx nm with 81.10% efficiency. Opt. Lett. 2022, 47, 3231–3234. [Google Scholar] [CrossRef] [Scilit]
  8. Zhao, S.; Qi, A.; Wang, M.; Qu, H.; Lin, Y.; Dong, F.; Zheng, W. High-power high-brightness 980 nm lasers with >50% wall-plug efficiency based on asymmetric super large optical cavity. Opt. Express 2018, 26, 3518–3526. [Google Scholar] [CrossRef] [Scilit]
  9. Liu, J.; Van Iersel, M.W. Photosynthetic physiology of blue, green, and red light: Light intensity effects and underlying mechanisms. Front. Plant Sci. 2021, 12, 619987. [Google Scholar] [CrossRef] [Scilit]
  10. Hale, G.M.; Querry, M.R. Optical constants of water in the 200-nm to 200-μ m wavelength region. Appl. Opt. 1973, 12, 555–563. [Google Scholar] [CrossRef] [Scilit]
  11. Paschotta, R. Fresnel Equations. Available online: https://www.rp-photonics.com/fresnel_equations.html (accessed on 18 March 2025).
  12. Button, V. Principles of Measurement and Transduction of Biomedical Variables; Academic Press: Cambridge, MA, USA, 2015. [Google Scholar]
  13. Vasiliev, M.; Alameh, K. Photonic Nano-Structures for Water Quality Monitoring. In Proceedings of the 19th International Conference on Optical Fibre Sensors; SPIE: Perth, Australia, 2008; pp. 753–756. [Google Scholar]
  14. Finan, A. ESA BIC Alumnus Interview: Trabotyx Launches First Dutch Laser Weeding Robot for Precision Farming. Available online: https://www.sbicnoordwijk.nl/trabotyx-laser-weeding-robot-dutch-first-for-precision-farming-graduate-interview-esabic/ (accessed on 6 February 2026).
  15. WeedBot. Some Reasons Why We Use Blue Lasers in Our Laser Weeder Lumina. Available online: https://www.linkedin.com/posts/weedbot_bluelaser-laser-lumina-activity-7086391738474405888-ZMpG?utm_source=share&utm_medium=member_desktop&rcm=ACoAAD5FwzsBHblEJAz9lYHx_8UNr-h0I8kt2Lo (accessed on 6 February 2026).
  16. Tran, D.; Schouteten, J.J.; Degieter, M.; Krupanek, J.; Jarosz, W.; Areta, A.; Emmi, L.; De Steur, H.; Gellynck, X. European stakeholders’ perspectives on implementation potential of precision weed control: The case of autonomous vehicles with laser treatment. Precis. Agric. 2023, 24, 2200–2222. [Google Scholar] [CrossRef] [Scilit]
  17. Zaragoza, C. Weed Management in Vegetables; Food and Agriculture Organization of the United Nations (FAO): Rome, Italy, 2003. [Google Scholar]
  18. Koller, M.; Vieweger, A. Weed Management in Organic Onion Production: Optimizing Cultivation Technique and Mechanical Weed Control to Reduce Hand Labour. In Proceedings of the XXVIII International Horticultural Congress on Science and Horticulture for People (IHC2010): International Symposium on 933, Lisbon, Portugal, 22–27 August 2010; pp. 391–397. [Google Scholar]
  19. Andreasen, C.; Vlassi, E.; Salehan, N. Laser weeding of common weed species. Front. Plant Sci. 2024, 15, 1375164. [Google Scholar] [CrossRef] [Scilit] [PubMed]
  20. Coleman, G.; Betters, C.; Squires, C.; Leon-Saval, S.; Walsh, M. Low energy laser treatments control annual ryegrass (Lolium rigidum). Front. Agron. 2021, 2, 601542. [Google Scholar] [CrossRef] [Scilit]
  21. Andreasen, C.; Vlassi, E.; Salehan, N.; Johannsen, K.S.; Jensen, S.M. Laser weed seed control: Challenges and opportunities. Front. Agron. 2024, 6, 1342372. [Google Scholar] [CrossRef] [Scilit]
  22. Yaseen, M.U.; Long, J.M. Laser weeding technology in cropping systems: A comprehensive review. Agronomy 2024, 14, 2253. [Google Scholar] [CrossRef] [Scilit]
  23. Mathiassen, S.K.; Bak, T.; Christensen, S.; Kudsk, P. The effect of laser treatment as a weed control method. Biosyst. Eng. 2006, 95, 497–505. [Google Scholar] [CrossRef] [Scilit]
  24. Mwitta, C.; Rains, G.C.; Prostko, E. Evaluation of diode laser treatments to manage weeds in row crops. Agronomy 2022, 12, 2681. [Google Scholar] [CrossRef] [Scilit]
  25. Fried, G.; Chauvel, B.; Munoz, F.; Reboud, X. Which traits make weeds more successful in maize crops? Insights from a three-decade monitoring in France. Plants 2019, 9, 40. [Google Scholar] [CrossRef] [Scilit]
  26. EPPO Global Database. Available online: https://gd.eppo.int/ (accessed on 5 February 2026).
  27. R Core Team. R: A Language and Environment for Statistical Computing; R Foundation for Statistical Computing: Vienna, Austria, 2025. [Google Scholar]
  28. França-Neto, J.d.B.; Krzyzanowski, F.C. Tetrazólio: Um teste de importância para a avaliação da qualidade fisiológica das sementes. J. Seed Sci. 2019, 41, 359–366. [Google Scholar] [CrossRef] [Scilit]
  29. Ritz, C.; Streibig, J.C. Bioassay analysis using R. J. Stat. Softw. 2005, 12, 1–22. [Google Scholar] [CrossRef] [Scilit]
  30. Knezevic, S.Z.; Streibig, J.C.; Ritz, C. Utilizing R software package for dose-response studies: The concept and data analysis. Weed Technol. 2007, 21, 840–848. [Google Scholar] [CrossRef] [Scilit]
  31. Ritz, C.; Strebig, J.C. Analysis of Dose-Response Curves; Reference Manual for the drc R Package, Version 3.0-1; CRAN: Vienna, Austria, 2016; Available online: https://cran.r-project.org/web/packages/drc/drc.pdf (accessed on 5 February 2026).
  32. Julius Kühn-Institut (JKI). Growth Stages of Mono- and Dicotyledonous Plants: BBCH Monograph; Meier, U., Ed.; Julius Kühn-Institut (JKI): Quedlinburg, Germany, 2018. [Google Scholar]
  33. Marx, C.; Pastrana Pérez, J.C.; Hustedt, M.; Barcikowski, S.; Haferkamp, H.; Rath, T. Investigations on the absorption and the application of laser radiation for weed control. Landtechnik 2012, 67, 95–101. [Google Scholar]
  34. Flora of North America. Available online: https://floranorthamerica.org/ (accessed on 6 February 2026).
  35. Chamkhi, I.; Charfi, S.; El Hachlafi, N.; Mechchate, H.; Guaouguaou, F.-E.; El Omari, N.; Bakrim, S.; Balahbib, A.; Zengin, G.; Bouyahya, A. Genetic diversity, antimicrobial, nutritional, and phytochemical properties of Chenopodium album: A comprehensive review. Food Res. Int. 2022, 154, 110979. [Google Scholar] [CrossRef] [Scilit]
  36. De Cauwer, B.; Dendauw, E.; Claerhout, S.; Biesemans, N.; Reheul, D. Sensitivity of recently naturalised Digitaria spp. populations to 4-hydroxyphenyl pyruvate dioxygenase-and acetolactate synthase-inhibiting herbicides in maize. Weed Res. 2017, 57, 101–111. [Google Scholar] [CrossRef] [Scilit]
  37. Jagtap, C.; Prajapati, P.; Harisha, C.; Shukla, V. Micrometric study and physicochemical evaluation of Solanum nigrum Linn. leaves. J. Phytopharm. 2016, 5, 117–121. [Google Scholar] [CrossRef] [Scilit]
  38. De Ryck, S.; Van Hecke, E.; Zwertvaegher, I.; Nuyttens, D.; Vanwijnsberghe, J.; Zewdie, T.A.; Verboven, P.; De Meester, M.; De Cauwer, B. Bio-Efficiency of Foliar Herbicides Applied with Drift-Reducing Nozzles. Agriculture 2025, 15, 2115. [Google Scholar] [CrossRef] [Scilit]
  39. Nobusawa, T.; Okamoto, T.; Nakano, M.; Kusaba, M. Structural coloration and epicuticular wax properties of the distinctive glaucous leaves of Encephalartos horridus. J. Exp. Bot. 2025, 76, 3577–3592. [Google Scholar] [CrossRef] [Scilit]
  40. Wang, F.; Zhang, P.; Qiang, S.; Xu, L.-L. Interaction of plant epicuticular waxes and extracellular esterases of Curvularia eragrostidis during infection of Digitaria sanguinalis and Festuca arundinacea by the fungus. Int. J. Mol. Sci. 2006, 7, 346–357. [Google Scholar] [CrossRef] [Scilit]
  41. Nairn, J.; Forster, W. Influence of spray formulation surface tension on spray droplet adhesion and shatter on hairy leaves. N. Z. Plant Prot. 2014, 67, 278–283. [Google Scholar] [CrossRef] [Scilit]
  42. Spanoghe, P. Effect van Additieven en Adjuvantia op de Efficiëntie van de Spuittoepassing van Gewasbeschermingsmiddelen; Ghent University: Ghent, Belgium, 2005. [Google Scholar]
  43. Ciani, A.; Goss, K.U.; Schwarzenbach, R.P. Light penetration in soil and particulate minerals. Eur. J. Soil Sci. 2005, 56, 561–574. [Google Scholar] [CrossRef] [Scilit]
  44. Woolley, J.T.; Stoller, E.W. Light penetration and light-induced seed germination in soil. Plant Physiol. 1978, 61, 597–600. [Google Scholar] [CrossRef] [Scilit]
  45. Norouzi, S.; Sadeghi, M.; Tuller, M.; Ebrahimian, H.; Liaghat, A.; Jones, S.B.; de Jonge, L.W. A novel laboratory method for the retrieval of the soil water retention curve from shortwave infrared reflectance. J. Hydrol. 2023, 626, 130284. [Google Scholar] [CrossRef] [Scilit]
  46. Hansson, D.; Mattsson, J.E. Effect of air temperature, rain and drought on hot water weed control. Weed Res. 2003, 43, 245–251. [Google Scholar] [CrossRef] [Scilit]
  47. Loades, E.; Pérez, M.; Turečková, V.; Tarkowská, D.; Strnad, M.; Seville, A.; Nakabayashi, K.; Leubner-Metzger, G. Distinct hormonal and morphological control of dormancy and germination in Chenopodium album dimorphic seeds. Front. Plant Sci. 2023, 14, 1156794. [Google Scholar] [CrossRef] [Scilit]
  48. Grant, K.R.; Brennan, M.; Hoad, S.P. The structure of the barley husk influences its resistance to mechanical stress. Front. Plant Sci. 2021, 11, 614334. [Google Scholar] [CrossRef] [Scilit]
  49. Gómez-González, S.; Ojeda, F.; Torres-Morales, P.; Palma, J.E. Seed pubescence and shape modulate adaptive responses to fire cues. PLoS ONE 2016, 11, e0159655. [Google Scholar] [CrossRef] [Scilit] [PubMed]
  50. Ruprecht, E.; Fenesi, A.; Fodor, E.I.; Kuhn, T.; Toekoelyi, J. Shape determines fire tolerance of seeds in temperate grasslands that are not prone to fire. Perspect. Plant Ecol. Evol. Syst. 2015, 17, 397–404. [Google Scholar] [CrossRef] [Scilit]
  51. Ahmed, S.; Revolinski, S.R.; Maughan, P.W.; Savic, M.; Kalin, J.; Burke, I.C. Deep learning–based detection and quantification of weed seed mixtures. Weed Sci. 2024, 72, 655–663. [Google Scholar] [CrossRef] [Scilit]
Figure 1. (a) Parallel robot arm (1) with the attached laser head (2), positioned above a plant tray (3) seated in a designated recess within the base plate; (b) Schematic representation of the laser head’s movement over an individual pot. The laser head moves back and forth along defined paths (black lines), targeting only a pre-defined circular treatment area (red). The green arrows indicate the direction of motion. The line spacing is 1 mm.
Agriculture 16 00474 g001
Figure 2. Average, minimum and maximum daily temperatures recorded in the greenhouse throughout the duration of the experiments. The solid black line represents the average temperature. The grey shaded area indicates the range between the minimum and maximum temperatures.
Agriculture 16 00474 g002
Table 1. Technical specifications of the Atomstack M100.
Wavelength455 ± 5 nm
Radiant power 20 W
Electrical power130 W
Spot size at focal point0.08 × 0.10 mm
Focal length40 mm
Pulse period1000 µs
Table 2. Applied energy doses calculated based on the laser switch-on time (duty cycle) within each pulse period of 1000 µs.
TargetDuty Cycle * (%)Dose (J mm−2)
Seedling0.000.000
2.000.008
4.340.017
9.560.038
20.910.084
45.730.183
100.000.400
Seed0.000.000
1.000.004
5.320.021
14.140.057
37.610.150
100.000.400
* A duty cycle of 2% means that the laser is on for 2% of the time and off for 98% of each cycle.
Table 3. Overview of the weed species included in the seedling experiments, indicating the number of plants per pot, sowing date, targeted growth stage at treatment, laser treatment date, and the harvest date for each species.
Sub-
Experiment
Experimental
Factor
Experimental
Levels
SpeciesNumber of
Plants per Pot
Sowing DateTreatment Stage **Treatment DateHarvest Date
1.1Weed speciesSix speciesChenopodium album L. (white goosefoot)726 August 2024BBCH103 September 202418 September 2024
Senecio vulgaris L. (common groundsel)726 August 2024BBCH103 September 202418 September 2024
Solanum nigrum L. (black nightshade)626 August 2024BBCH103 September 202418 September 2024
Digitaria sanguinalis (L.) Scop. (hairy crabgrass)730 August 2024BBCH103 September 202418 September 2024
Echinochloa crus-galli (L.) P. Beauv. (barnyard grass)730 August 2024BBCH103 September 202418 September 2024
Poa annua L. (annual meadow-grass)726 August 2024BBCH103 September 202418 September 2024
1.2Growth stageTwo growth stages
(BBCH10 vs. BBCH12)
Solanum nigrum L. (black nightshade)710 September 2024 *BBCH1026 September 202411 October 2024
5 September 2024 *BBCH1226 September 202411 October 2024
Echinochloa crus-galli (L.) P. Beauv. (barnyard grass)710 September 2024 *BBCH1026 September 202411 October 2024
5 September 2024 * BBCH1226 September 202411 October 2024
1.3Leaf wetnessTwo leaf wetness levels
(wet vs. dry)
Chenopodium album L. (white goosefoot)79 September 2024BBCH1023 September 202416 October 2024
Solanum nigrum L. (black nightshade)79 September 2024BBCH1023 September 202416 October 2024
Echinochloa crus-galli (L.) P. Beauv. (barnyard grass)79 September 2024BBCH1023 September 202416 October 2024
* Differential sowing dates were used to ensure that plants reached the targeted growth stage at the time of laser treatment, as exp. 1.2 aimed to evaluate sensitivity to laser treatment between the two growth stages. ** BBCH10, cotyledons completely unfolded or the first true leaf emerged from the coleoptile; BBCH12, two true leaves, leaf pairs or whorls unfolded.
Table 4. ED90 values ± SE (J mm−2) for plant survival and live aboveground dry biomass, 15 DAT, for three dicotyledonous and three monocotyledonous species. Estimates are based on a three-parameter log-logistic model. Values not sharing a common letter differ significantly (p < 0.05); comparisons are valid only within the same response parameter.
Plant SurvivalLive Aboveground Dry Biomass
Dicotyledonous species
C. album0.23 ± 0.050a0.0334 ± 0.00493a
S. vulgaris0.37 ± 0.048bc0.0270 ± 0.01117abc
S. nigrum0.54 ± 0.131c0.0047 ± 0.00283abc
Monocotyledonous species
D. sanguinalis0.60 ± 0.170bc0.1659 ± 0.29692b
E. crus-galli1.54 ± 1.869bc2188.8096 ± 14,708.85036c
P. annua0.34 ± 0.034ab0.2199 ± 0.05504bc
Table 5. Absolute regrowth rate (mm2 day−1) as a function of energy dose for each plant species. Values represent means ± SE. Means not sharing a common letter differ significantly (Tukey’s HSD test, p < 0.05; comparisons are valid only within the same plant species.
Dose
(J mm−2)
Absolute Regrowth (mm2 day −1)
C. albumS. vulgarisS. nigrumD. sanguinalisE. crus-galliP. annua
0.000119.5 ± 15.45a160.2 ± 11.16a166.8 ± 23.60a56.4 ± 7.58a63.7 ± 8.56a36.7 ± 3.85a
0.00852.0 ± 10.02b6.5 ± 0.90b5.4 ± 2.40b0.7 ± 1.82b40.2 ± 7.22ab34.3 ± 2.30ab
0.01732.4 ± 7.57bc12.0 ± 1.55b1.9 ± 0.69b−1.8 ± 3.11b27.2 ± 3.95b36.2 ± 2.44a
0.0381.4 ± 1.01c8.4 ± 1.12b0.7 ± 0.62b9.0 ± 2.18b25.1 ± 4.63b24.8 ± 3.79bc
0.0840.2 ± 0.17c4.7 ± 0.99b2.9 ± 0.72b4.4 ± 1.60b24.9 ± 2.00b16.6 ± 1.53c
0.183−0.1 ± 0.08c0.7 ± 0.17b1.0 ± 0.63b0.7 ± 1.07b14.1 ± 1.96b1.3 ± 1.01d
0.400−0.1 ± 0.09c−0.1 ± 0.10b0.6 ± 0.57b−0.3 ± 0.99b16.7 ± 11.28b−0.9 ± 0.25d
Table 6. ED50 and ED90 values ± SE (J mm−2) for plant survival and live aboveground dry biomass, 15 DAT, for two different growth stages of S. nigrum and E. crus-galli. Estimates are based on the Weibull type 2 three-parameter model (plant survival), the three-parameter log-logistic model (dry biomass: S. nigrum), and the Weibull type 1 three-parameter model (dry biomass: E. crus-galli). Values not sharing a common letter differ significantly (p < 0.05); comparisons are valid only within the same response parameter and plant species.
SpeciesGrowth Stage *ED50 (J mm−2)ED90 (J mm−2)
Plant survival
S. nigrumBBCH100.06 ± 0.030a0.50 ± 0.227a
BBCH120.36 ± 0.087b1.04 ± 0.922a
E. crus-galliBBCH101.02 ± 0.518a46.36 ± 73.658a
BBCH121.09 ± 4.146a4.82 ± 45.827a
Live aboveground dry biomass
S. nigrumBBCH100.0014 ± 0.00458a0.0825 ± 0.13346a
BBCH120.0029 ± 0.00080a0.2561 ± 0.07699a
E. crus-galliBBCH100.0080 ± 0.01388a1.3293 ± 2.99022a
BBCH120.0300 ± 0.01032a1.8900 ± 1.10286a
* BBCH10, cotyledons completely unfolded or first true leaf emerged from coleoptile; BBCH12, two true leaves, leaf pairs or whorls unfolded.
Table 7. Percentage of necrosis (%), calculated as the reduction in green surface area at dose 2 (0.008 J mm−2) relative to the control (dose 1), following treatment at two different growth stages. Values represent means ± SE. Means not sharing a common letter differ significantly (Tukey’s HSD test, p < 0.05). Comparisons are valid only within individual species.
SpeciesGrowth Stage *Necrosis (%)
S. nigrumBBCH1090.9 ± 2.62a
BBCH1277.8 ± 5.35a
E. crus-galliBBCH1072.9 ± 2.82a
BBCH1249.2 ± 5.26b
* BBCH10, cotyledons completely unfolded or first true leaf emerged from coleoptile; BBCH12, two true leaves, leaf pairs or whorls unfolded.
Table 8. ED50 and ED90 values (J mm−2) with SE for plant survival and live dry biomass, 23 DAT for wetted and non-wetted seedlings of C. album, S. nigrum, and E. crus-galli. Estimates are based on the Weibull type 2 three-parameter model (plant survival), the three-parameter log-logistic model (dry biomass for C. album and S. nigrum), and the Weibull type 1 three-parameter model (dry biomass for E. crus-galli). Values not sharing a common letter differ significantly (p < 0.05). Comparisons are valid only within the same combination of species, response parameter, and ED value.
SpeciesLeaf WetnessED50 (J mm−2)ED90 (J mm−2)
Plant survival
C. albumDry0.06 ± 0.006a0.20 ± 0.049a
Wet0.08 ± 0.007b0.21 ± 0.050a
S. nigrumDry0.07 ± 0.010a0.34 ± 0.119a
Wet0.08 ± 0.015a0.68 ± 0.306a
E. crus-galliDry0.15 ± 0.026a0.33 ± 0.062a
Wet0.29 ± 0.036b0.33 ± 0.037a
Live aboveground dry biomass
C. albumDry0.0085 ± 0.00458a0.0279 ± 0.01037a
Wet0.2979 ± 0.00676b0.0586 ± 0.00884b
S. nigrumDry0.00009 ± 0.00019a0.0060 ± 0.00341a
Wet0.00007 ± 0.00014a0.0057 ± 0.00327a
E. crus-galliDry0.0050 ± 0.00197a0.2642 ± 0.08807a
Wet0.0108 ± 0.00377b0.2952 ± 0.10868a
Table 9. ED50 and ED90 values (J mm−2) with standard error (mean ± SE) of survival (%) after treatment of non-buried (0 mm) and buried (2 mm) seeds of C. album, S. nigrum and E. crus-galli. Estimates are based on the Weibull type 2 three-parameter model (S. nigrum and E. crus-galli) and the Weibull type 1 three-parameter model (C. album). Values not sharing a common letter differ significantly (p < 0.05). Comparisons are valid only within the same species and ED value.
SpeciesBurial Depth (mm)ED50 (J mm−2)ED90 (J mm−2)
Survival (%)
C. album00.17 ± 0.029a0.42 ± 0.107a
21.65 ± 2.458b7.28 ± 20.114b
S. nigrum00.13 ± 0.014a0.53 ± 0.155a
275.18 ± 163.846b8,395,275.03 ± 63,703,931.763b
E. crus-galli00.34 ± 0.089a25.51 ± 23.144a
25.63 ± 16.960b342.47 ± 2678.738a
Table 10. ED50 and ED90 values (J mm−2) with standard error (mean ± SE) of survival (%) after treatment of imbibed (48 h) and non-imbibed seeds of C. album, S. nigrum and E. crus-galli. Estimates are based on the Weibull type 2 three-parameter model (S. nigrum and E. crus-galli) or Weibull type 1 three-parameter model (C. album). Values not sharing a common letter differ significantly (p < 0.05). Comparisons are valid only within the same species and ED value.
SpeciesImbibition StatusED50 (J mm−2)ED90 (J mm−2)
Survival (%)
C. albumNo0.30 ± 0.026a0.50 ± 0.036a
Yes0.25 ± 0.021a0.42 ± 0.018a
S. nigrumNo0.09 ± 0.005a0.23 ± 0.031a
Yes0.31 ± 0.035b0.63 ± 0.122b
E. crus-galliNo0.27 ± 0.032a2.83 ± 1.014a
Yes0.53 ± 0.100b7.88 ± 4.979b
Disclaimer/Publisher’s Note: The statements, opinions and data contained in all publications are solely those of the individual author(s) and contributor(s) and not of MDPI and/or the editor(s). MDPI and/or the editor(s) disclaim responsibility for any injury to people or property resulting from any ideas, methods, instructions or products referred to in the content.