1. Introduction
Rice is one of the world’s three major staple crops, accounting for approximately 15% of global arable land [
1,
2]. It plays a vital role in addressing the global food security challenge and achieving the “zero hunger” target outlined in Sustainable Development Goal 2 (SDG 2) of the United Nations Sustainable Development Goals [
3]. As the world’s largest agricultural producer, China sustains approximately 20% of the global population while utilizing merely 7% of the planet’s arable land resources [
4]. In 2020, China accounted for 37.3% of global rice output and approximately 18% of global rice cultivation area—ranking first in both categories [
5,
6]. Among them, the middle and lower Plain of the Yangtze River contributed to the core production capacity [
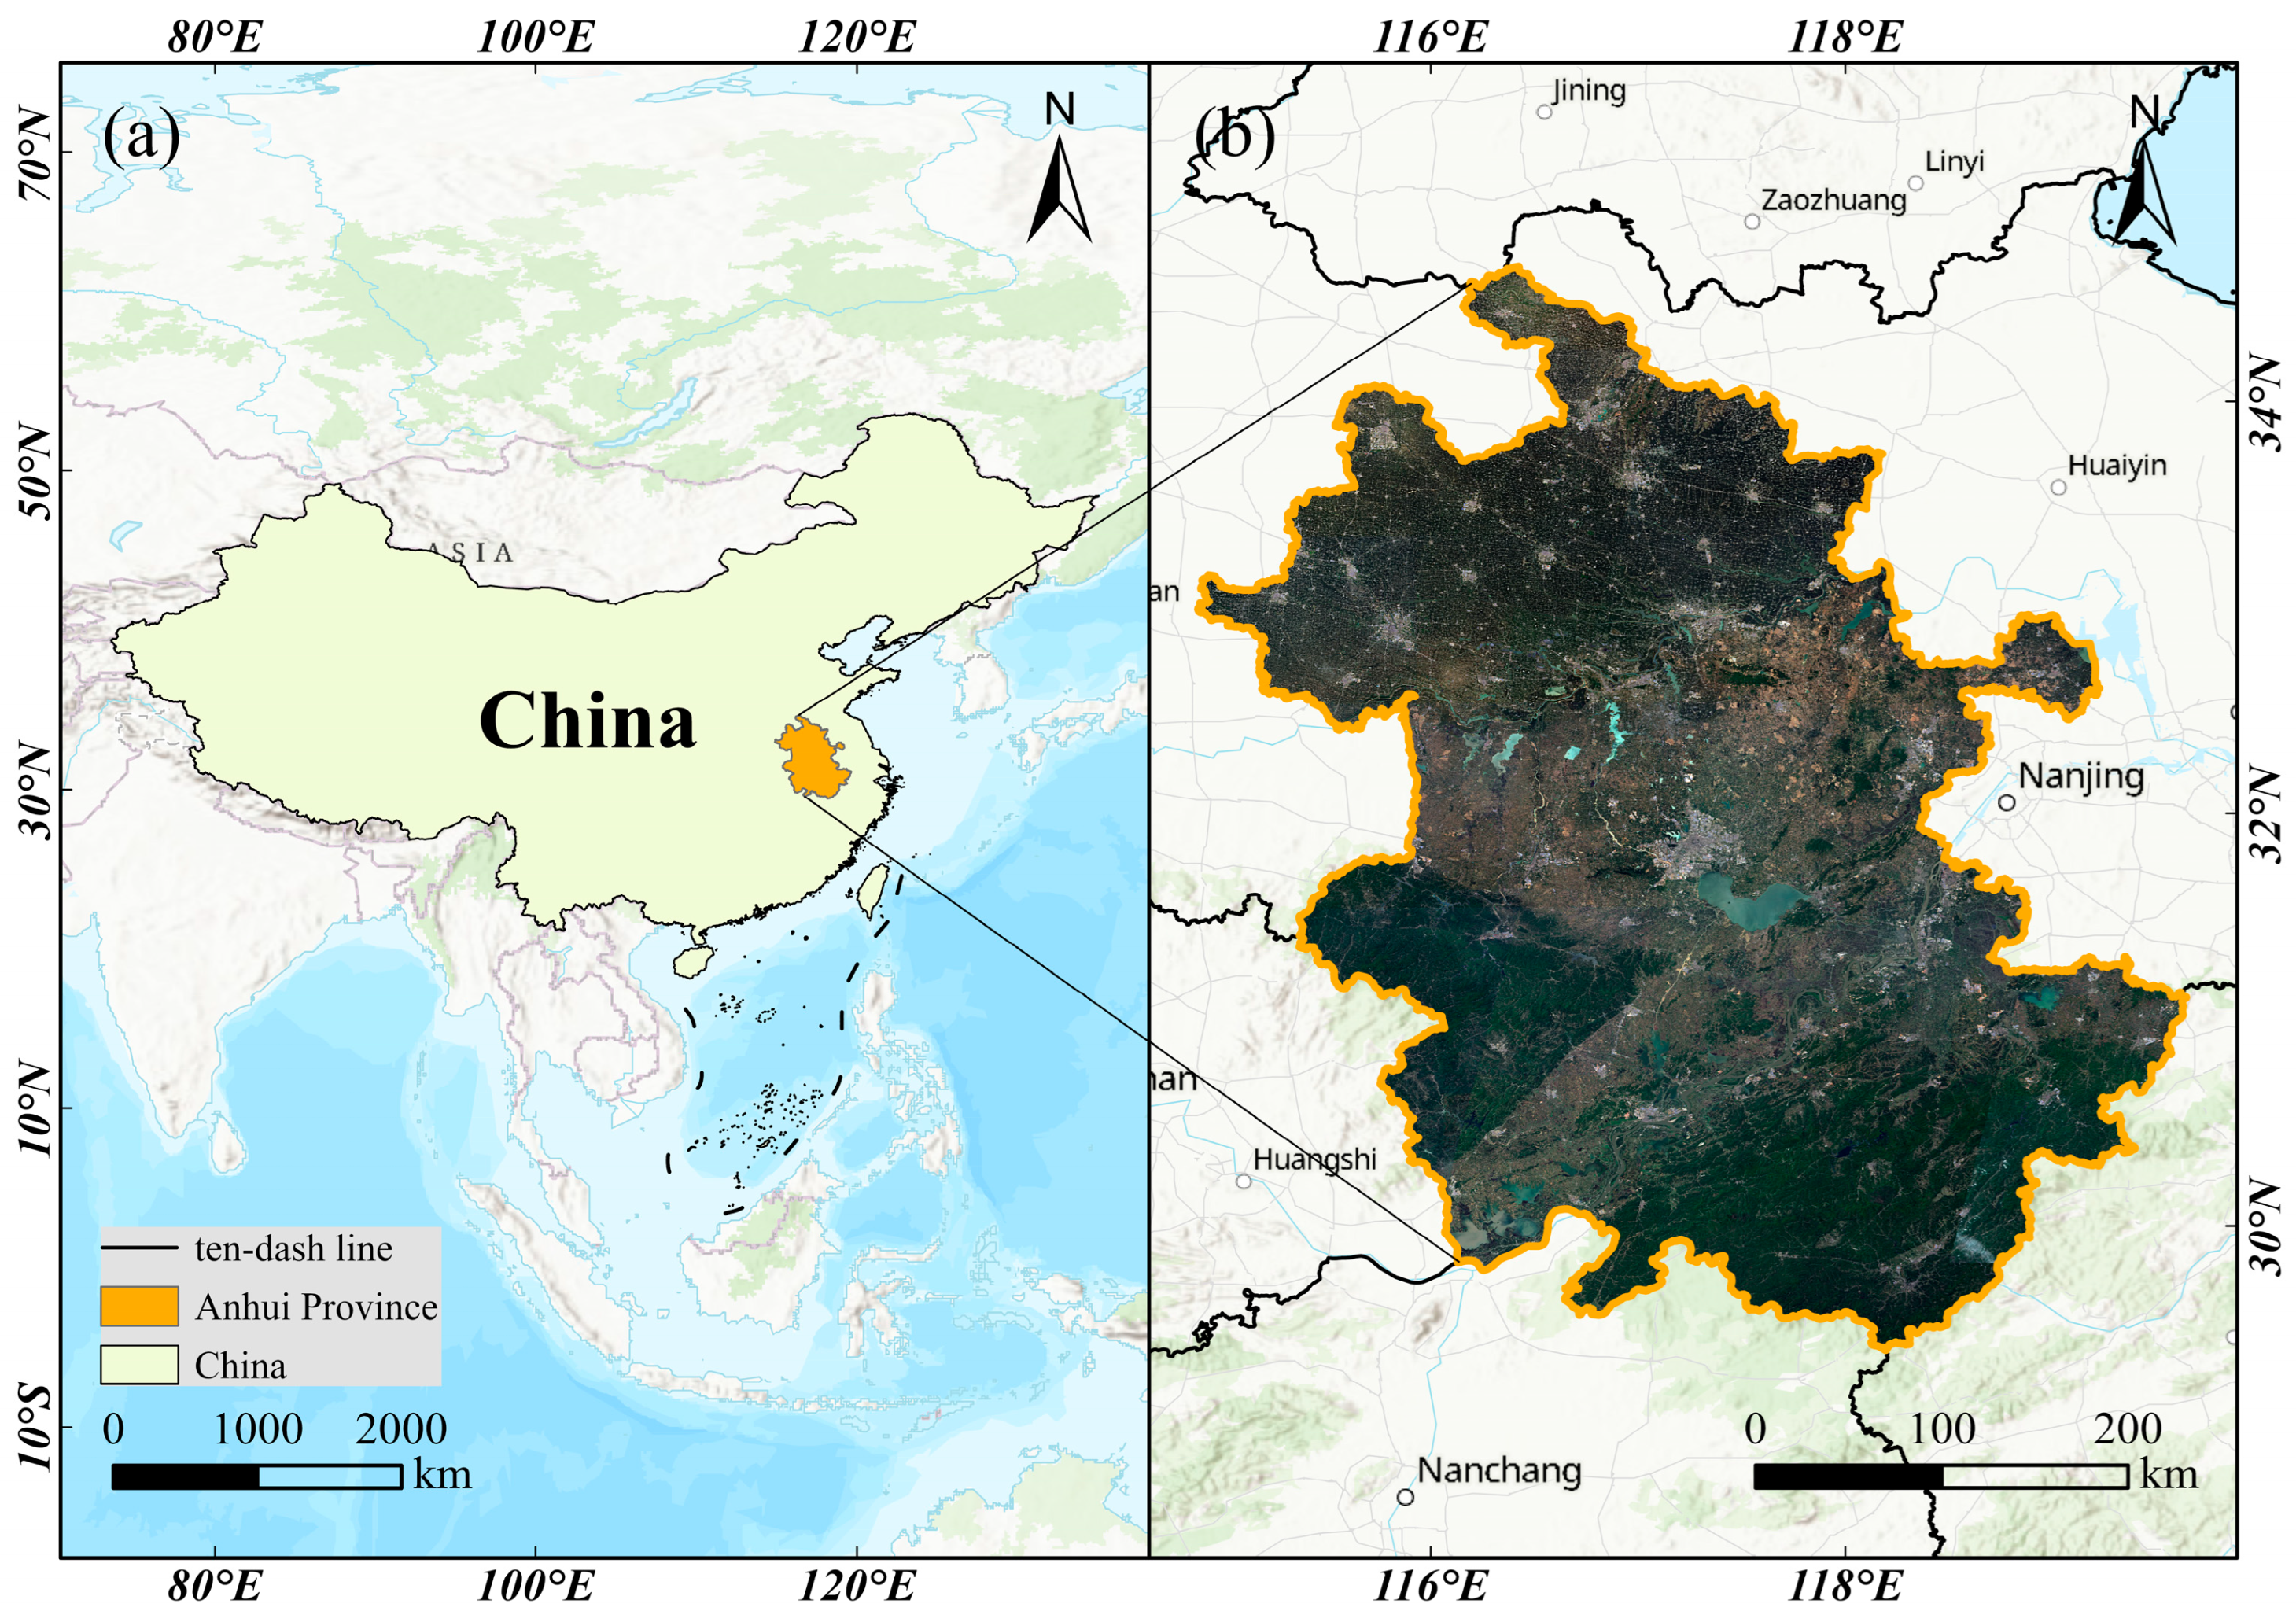
7]. Anhui Province in eastern China is a major rice-producing region. In 2023, its rice cultivation covered 2.5 million hectares, yielding 16.098 million tons—accounting for over 34% of the province’s total grain area and contributing more than 39% of its total grain output [
8]. In recent years, rapid population growth and rising food demand have made stabilizing rice cultivation areas a crucial element of the national food security strategy. Moreover, rice cultivation is closely linked to environmental concerns such as methane emissions, water resource consumption, and ecological sustainability [
9,
10]. Accurate monitoring is crucial for optimizing farm management and harmonizing food production with ecological conservation. Hence, precise extraction of rice cultivation data and close tracking of its spatiotemporal dynamics are vital to improving agricultural structure, ensuring food security, and promoting efficient water use and environmental protection [
11]. At the same time, accurately mapping rice-planting areas has important guiding significance for ensuring food security, promoting sustainable agricultural development, strengthening crop yield strategies, and improving resource management efficiency [
12].
Traditional paddy rice monitoring methods are mostly based on artificial collection and statistical analysis of ground data, which often requires field investigations and hierarchical summarization to obtain data [
13]. But these data suffer from poor timeliness, low spatial resolution, significant subjective bias, and an inability to provide a precise spatial distribution of paddy rice fields. As a result, these approaches will be severely limited in practical application [
14]. However, the rapid advancement of remote sensing technology has enabled large-scale and timely monitoring of paddy rice. Modern sensors now offer hyperspectral, high-resolution, and long-term observation capabilities, providing spatially continuous data essential for tracking rice growth dynamics. The growth of rice involves multiple phenological stages, and it is difficult to accurately monitor single remote sensing data. However, with the continuous updating of multi-source remote sensing data, the time nodes of rapid changes in rice growth status can be accurately captured [
15]. Currently, techniques for mapping paddy rice over large areas and long time spans using time-series data have matured significantly. In remote sensing analysis, existing rice mapping methods primarily utilize optical imagery and synthetic aperture radar (SAR) data. Optical remote sensing offers favorable spatial and temporal resolution and has been widely validated for rice identification. For example, during key growth stages, paddy rice can be distinguished by extracting vegetation indices (NDVI, EVI) and water-related indices (NDWI, LSWI) [
16]. However, the nature of passive imaging means it is easily interfered with by atmospheric factors such as clouds and rainfall, especially in the tropical and subtropical monsoon region. Prolonged cloud coverage during the monsoon season hinders the reconstruction of time-series data [
17], increasing the difficulty of obtaining reliable high-resolution optical time-series data [
18]. In contrast, SAR can penetrate cloud layers and achieve all-weather monitoring tasks. In addition, SAR can also reflect the electromagnetic and structural characteristics of ground targets, and its time series can capture signals at key stages of rice growth, providing strong support for paddy rice mapping in cloudy areas [
19]. Regarding classification methodologies, previous studies have developed and applied diverse approaches for crop mapping, such as spatial statistical methods, traditional machine learning algorithms, phenology-based techniques, and deep learning models [
20,
21].
In recent years, significant progress has been achieved on the remote sensing extraction of paddy rice cultivation information; the researchers have focused on image data sources and classification algorithms. For instance, the GEE and improved PPPM algorithm can effectively support annual mapping of rice in Northeast Asia, analyzing the geographical characteristics of rice distribution from the perspectives of country, altitude, latitude, and climate [
22]. Based on multi-temporal Sentinel-2 images, the effectiveness of machine learning algorithms was evaluated to determine the most effective method for predicting rice varieties. The classifier maintained excellent accuracy with 0.93 during the initial tillering phase [
23]. Dense Landsat time-series and object-based classification were used to map rice extent and cropping frequency in the Mekong Delta, finding that triple-season rice areas nearly doubled from 2000 to 2010, with over 90% accuracy [
24]. While optical imagery is widely used for rice mapping, it is highly susceptible to cloud cover and rainfall, which often limit real-time data acquisition in frequently overcast regions. In contrast, radar data can penetrate clouds and soil, enabling reliable, all-weather observation. These advantages make it a primary data source for rice mapping in tropical and subtropical areas. For instance, in Chongqing, paddy rice was mapped using Sentinel-1A SAR VH backscatter time-series and DEM data with a decision tree model. The result showed that the correlation coefficient between the mapping area and the official data reached 0.96 [
25]. A model for TFBS (temporal feature-based segmentation) was developed, which uses Sentinel-1 SAR imagery time series for accurate paddy rice mapping, performing better than LSTM, U-Net, and a convolutional LSTM model [
26]. Although SAR data has been successfully applied to paddy rice growth monitoring and classification, its backscatter signals are susceptible to noise, often resulting in salt-and-pepper effects that reduce classification accuracy [
26]. To address these constraints, researchers have employed a synergistic approach combining optical spectral characteristics with SAR polarization features for rice classification, enabling large-scale mapping of rice phenological dynamics [
27]. In addition, researchers developed an efficient phenology-based algorithm for paddy rice detection to address the high computational costs of machine learning methods. This approach utilizes near-infrared band and red band reflectance of Sentinel-2 during harvest periods, combined with time-series NDVI analysis and threshold classification, to accurately identify rice fields across different growth stages and harvest periods [
28].
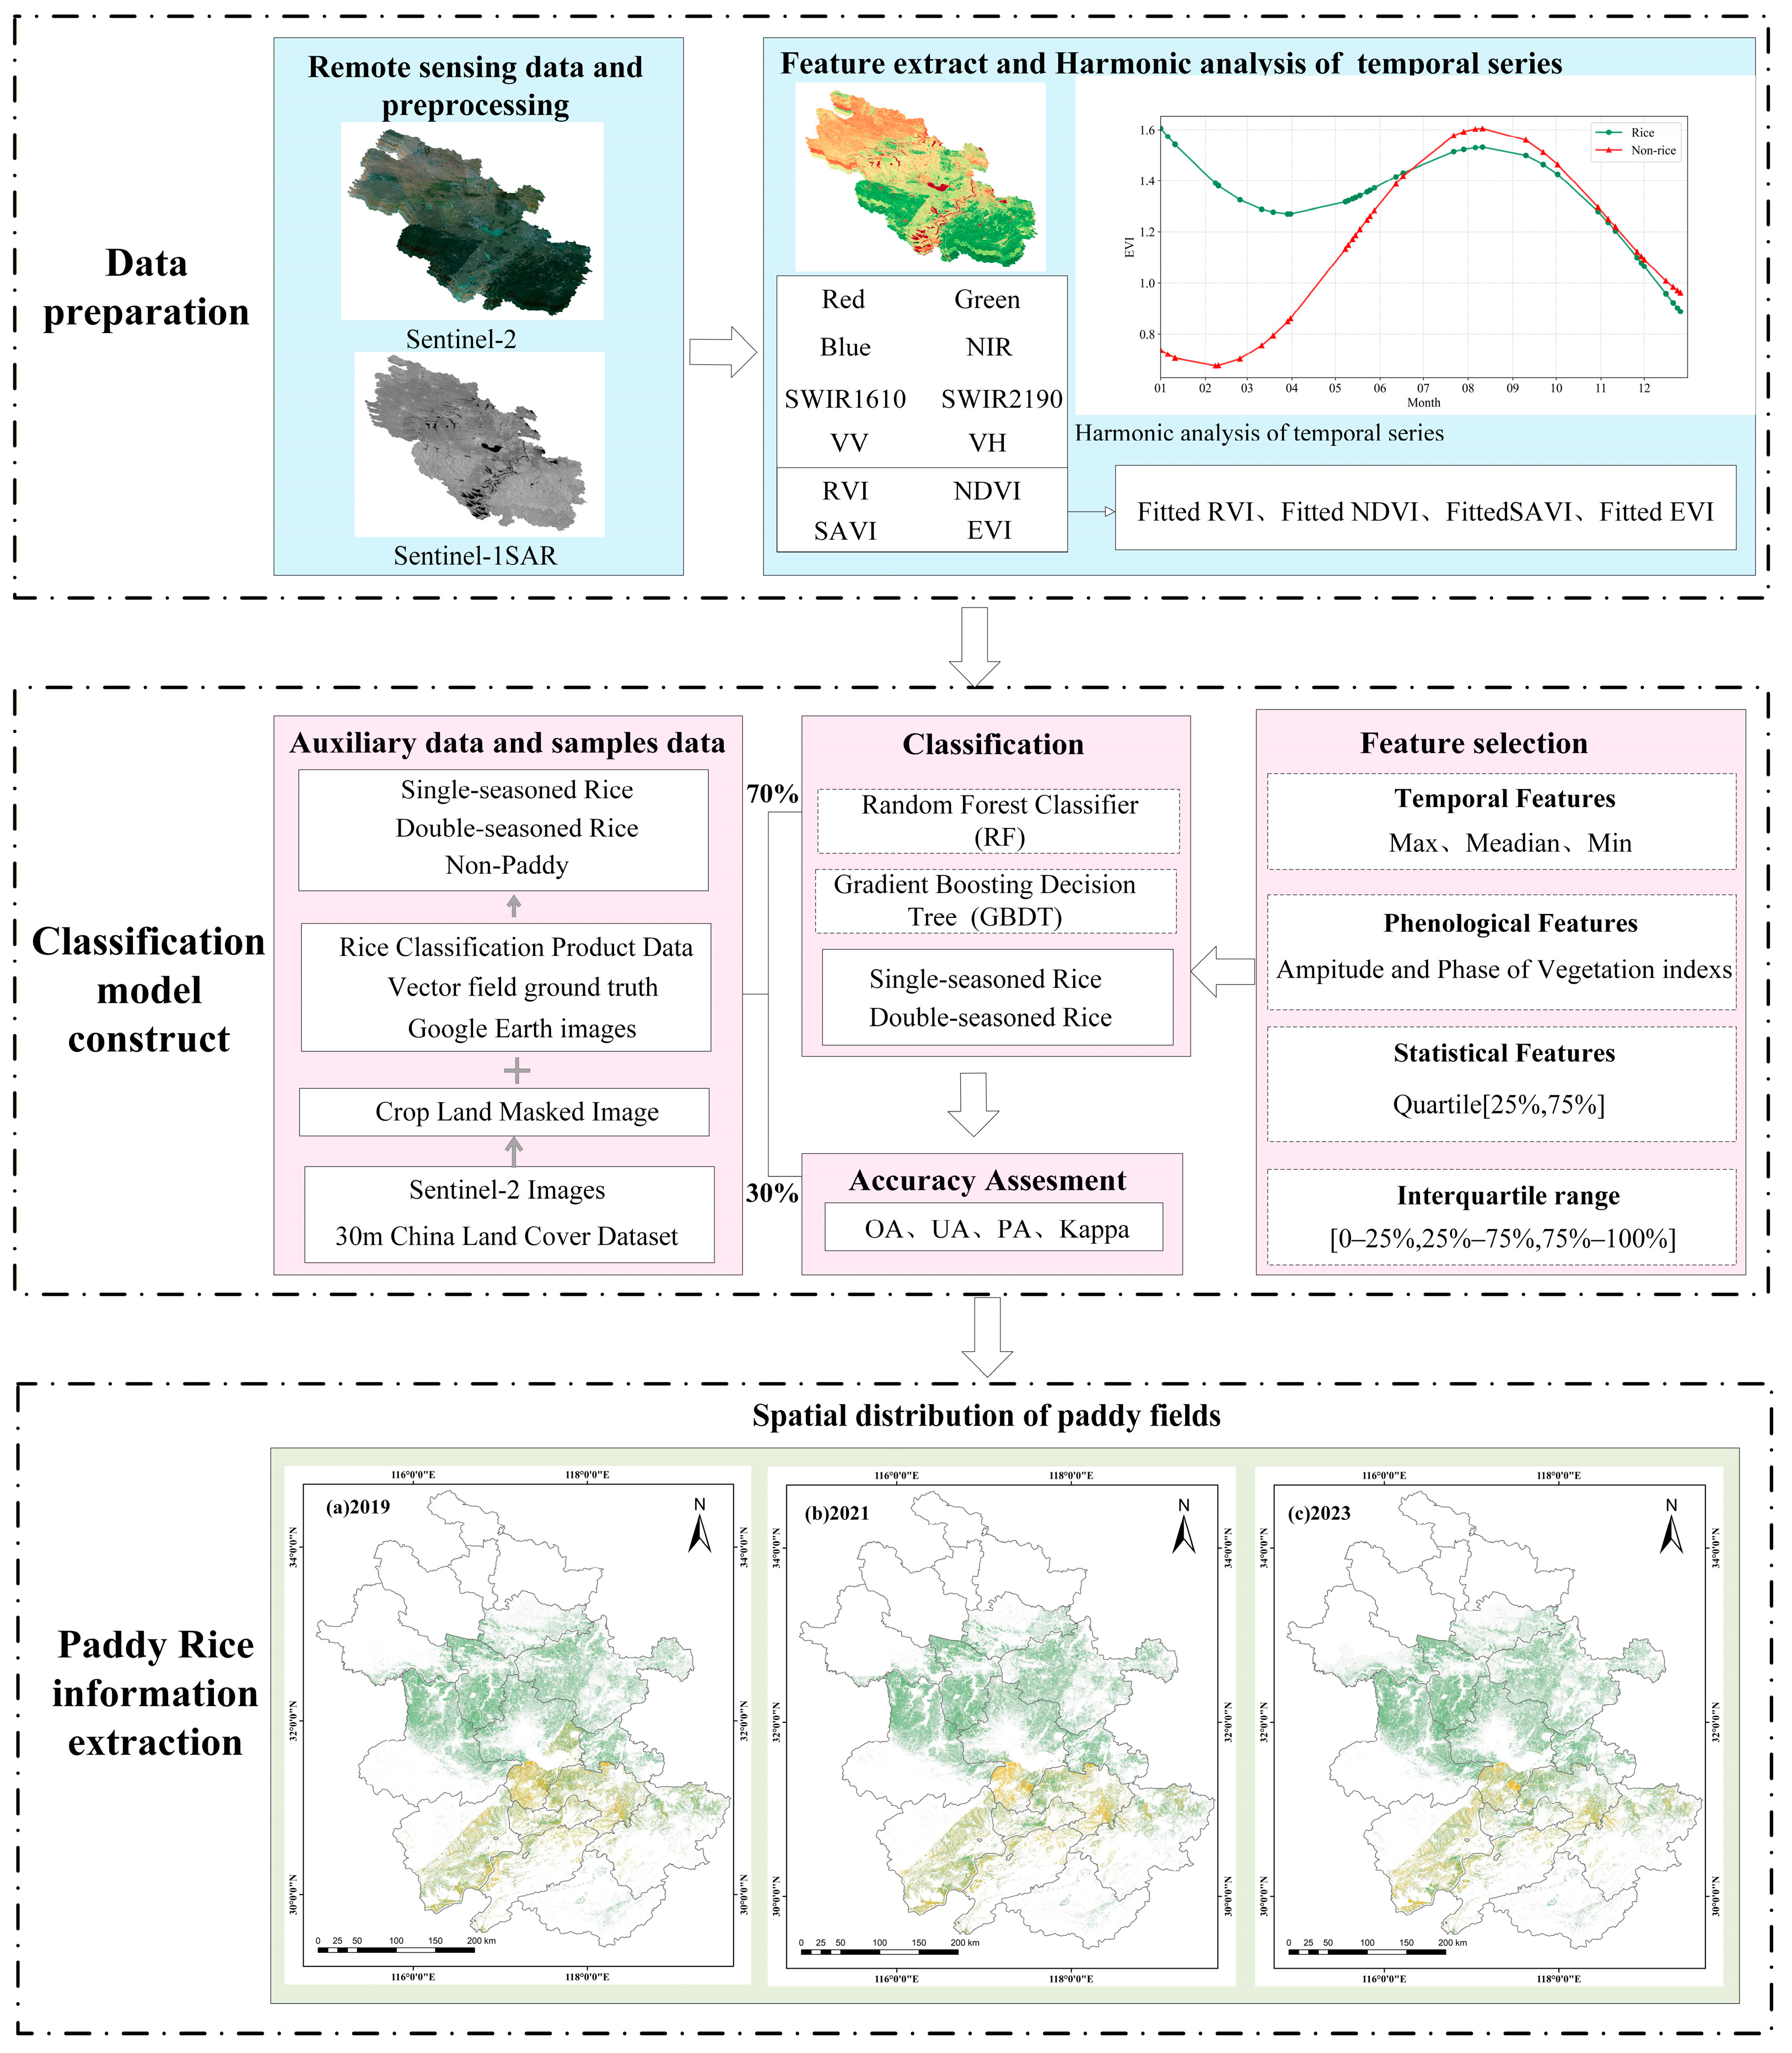
In summary, critical analysis of current research methodologies reveals that while significant progress has been achieved in paddy rice information extraction, persistent challenges and methodological limitations remain to be addressed. These include: (1) insufficient data fusion, where single-source data often fail to simultaneously capture spectral–phenological characteristics and cloud-penetration capabilities; (2) although integration of optical and SAR data has been attempted, fusion remains primarily at the feature level, without fully exploiting harmonic models’ potential for interpreting phenological patterns; and (3) inadequate feature optimization, where existing methods predominantly rely on empirical feature selection while lacking systematic evaluation of complementarity among temporal, statistical, phenological, and polarization features, ultimately limiting classification efficiency and accuracy. Additionally, existing methods exhibit restricted applicability in regions with complex terrain. Current rice classification methods often show limited regional adaptability, leading to notably reduced accuracy in topographically complex areas at the national scale. The lack of tailored classification frameworks for heterogeneous environments further challenges accurate rice mapping, especially in the mountainous and hilly regions of southern Anhui, where cultivation patterns vary widely. It is therefore imperative to develop advanced remote sensing algorithms with high spatial resolution, temporal sensitivity, and classification precision to effectively capture the distinct characteristics of rice cultivation in Anhui Province. Regarding the technical difficulties and scientific issues in remote sensing extraction of rice cultivation, the study intended to develop an innovative multi-source classification framework for paddy rice mapping in Anhui Province. The framework integrates Sentinel-2 optical imagery with Sentinel-1 SAR data to extract phenological periodic features using Harmonic Analysis of Time Series (HANTS). In addition, a comprehensive multi-dimensional feature set incorporating temporal reflectance, polarized backscattering, and phenological parameters was constructed, while employing recursive feature elimination (RFE) for optimal feature selection. In this study, both random forest (RF) and gradient boosting decision tree (GBDT) algorithms were used to generate single- and double-season rice distributions (10 m) from 2019 to 2024 year by year. This study also worked on distinguishing between natural and human factors, exploring the spatial heterogeneity of driving factors for rice cultivation in different regions, and analyzing their driving mechanisms. Beyond establishing a theoretical basis for high-precision extraction in spatially heterogeneous rice-planting regions, these research results provide essential spatial datasets for farmland protection and agricultural policy optimization in Anhui Province.
3. Results
3.1. Extraction of HANTS Phenological Characteristics
Different crop species exhibit distinctive phenological characteristics throughout their growth cycles, and phenological parameters can serve as crucial complementary discriminators to enhance classification accuracy. In the study, HANTS was innovatively applied to analyze the phenological characteristics of paddy rice, effectively addressing the limitations of spectral–spatial confusion among spectrally similar crops.
Table 3 presents the phenological characteristics of rice and non-rice, and the results revealed significant differences in both amplitude and phase between the two classes. Among them, the VIs of rice phase values exhibited negative values, whereas non-rice areas consistently showed positive values. Additionally, the harmonic curves of rice have smaller amplitudes, lower periodic variations, and a more stable annual pattern compared with non-rice.
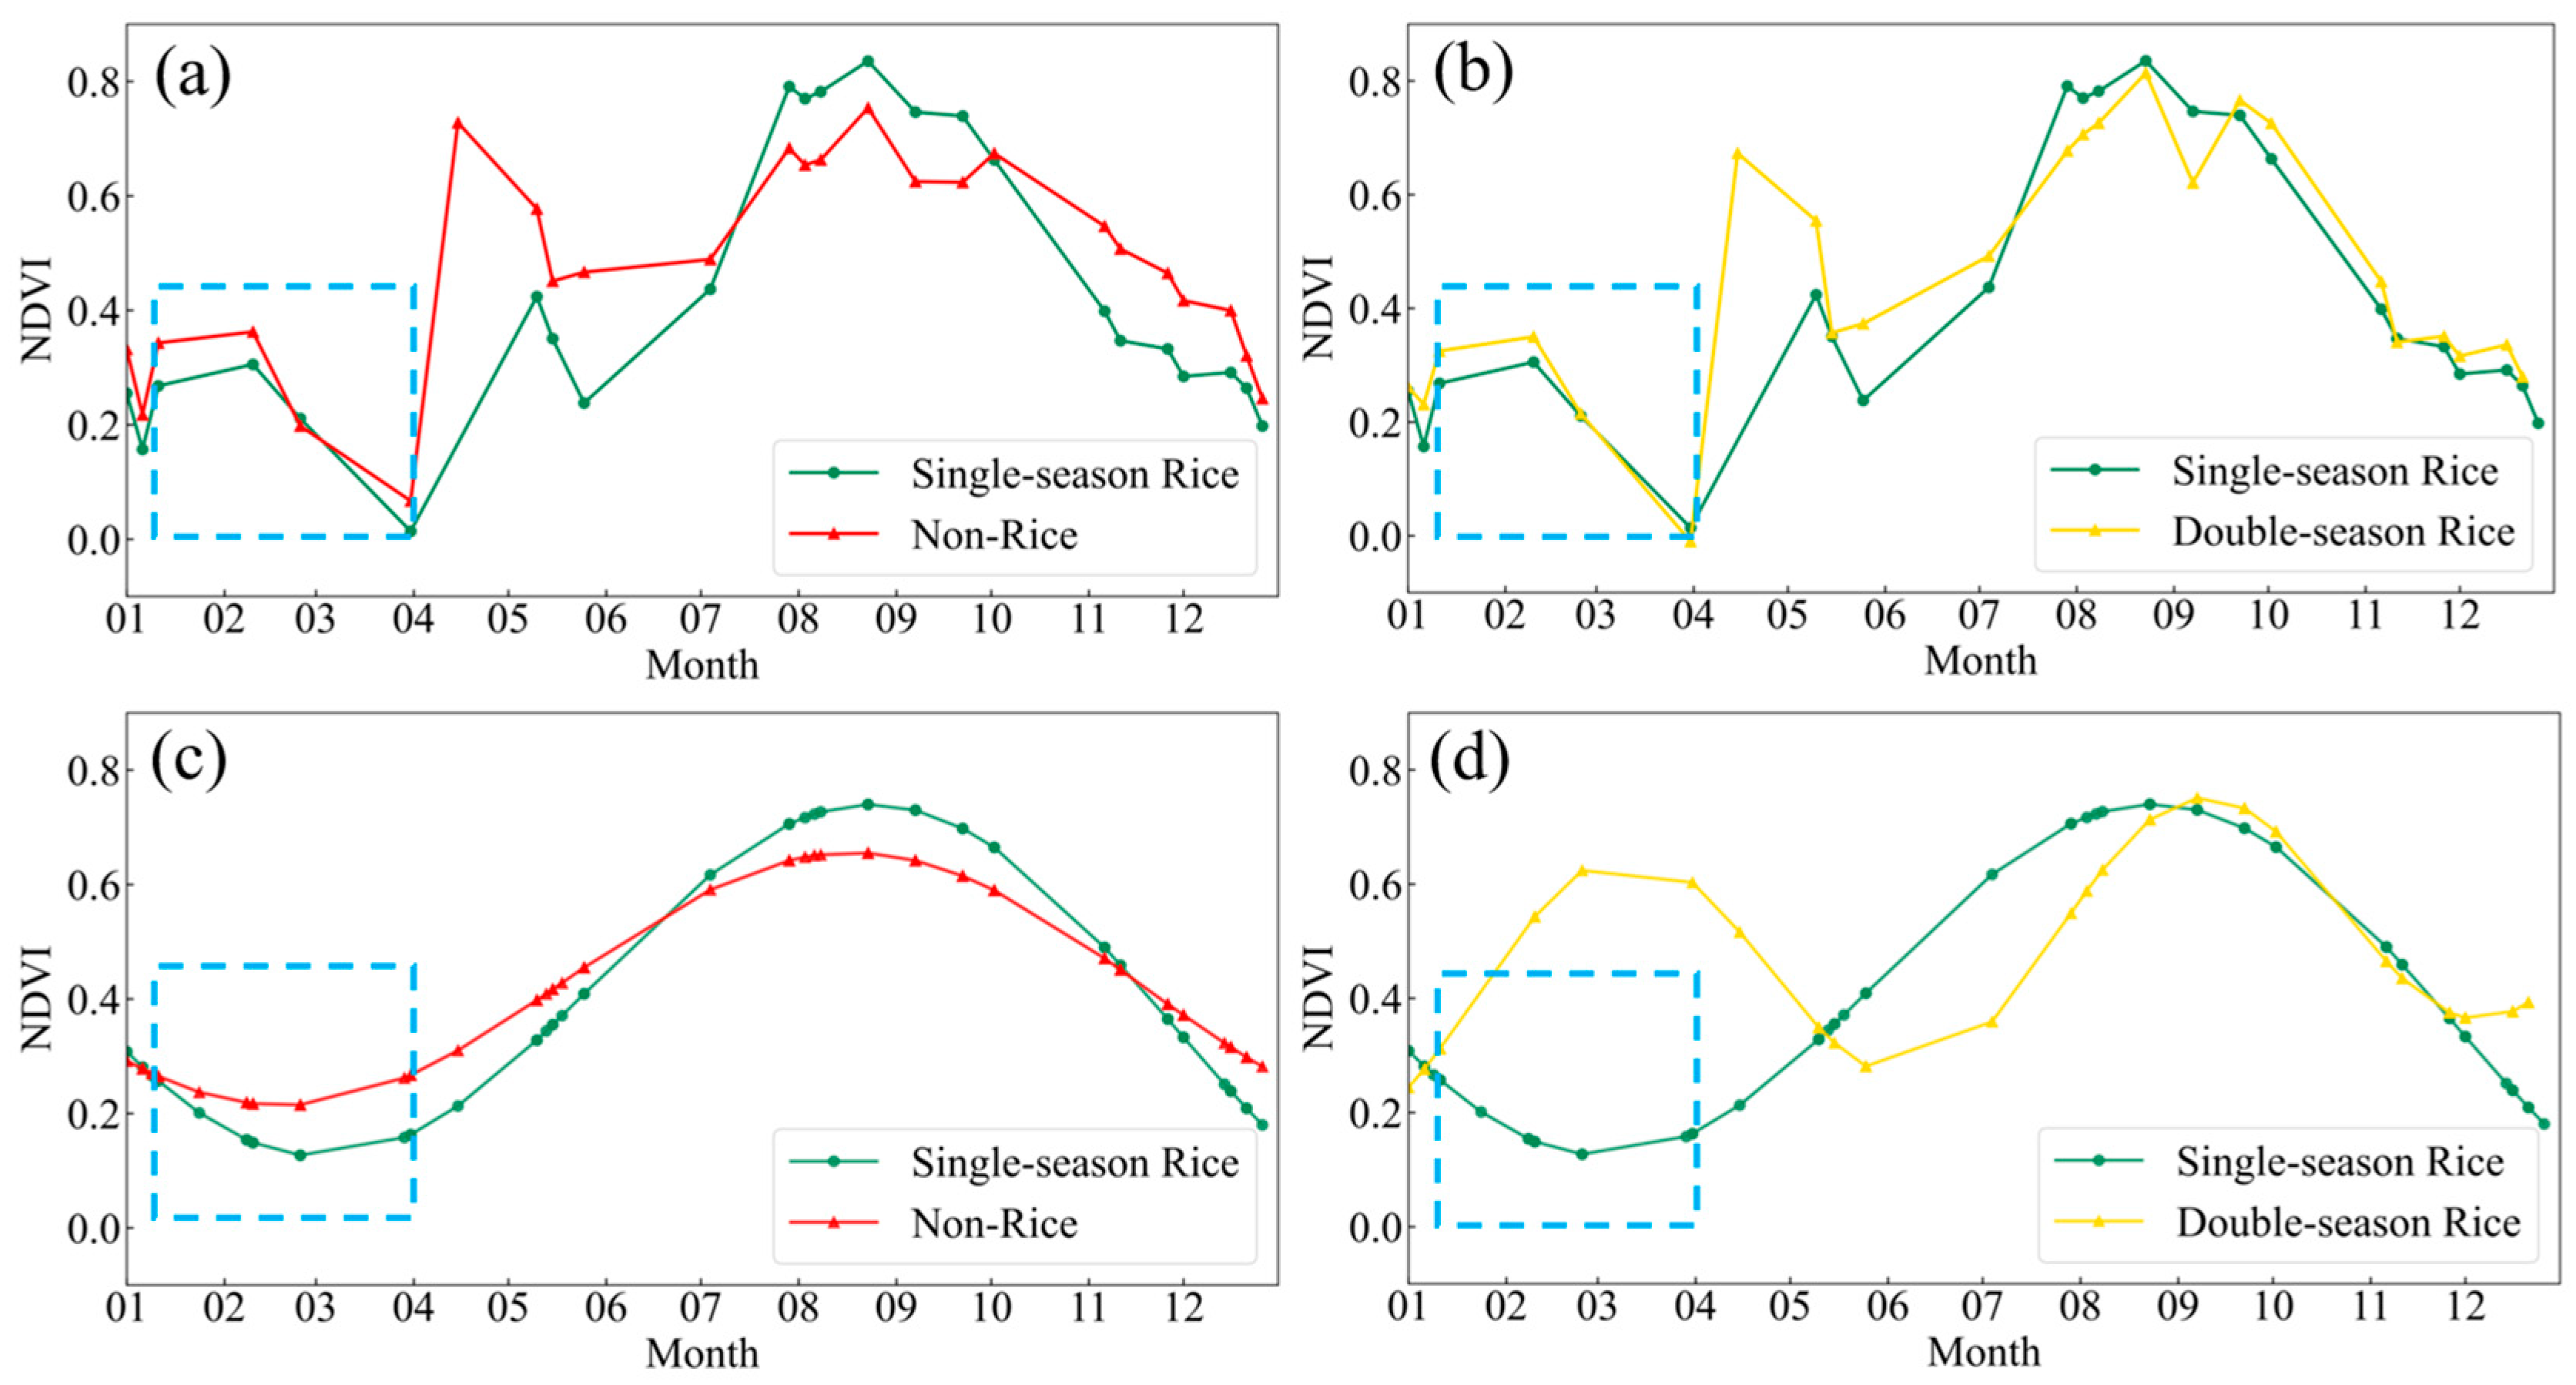
Simultaneously, an analysis was performed using the NDVI to examine the differences in characteristics before and after HANTS in 2024 in Huainan city (
Figure 4). This approach effectively mitigates cloud-induced noise while preserving critical growth stages (sowing, tillering, etc.), enabling accurate phenological tracking and reliable multi-crop classification. As shown in
Figure 4a,b, the original NDVI curves reached their lowest values in April and grew steadily as roots developed at the seedling stage, which led to a gradual rise in the VI. However, the tillering stage caused a marked increase in VIs, which reached their maximum around August in the jointing stage. By early August, panicles emerged and leaves started to senesce, and VIs declined after a brief period of stability.
Additionally, the study examined the phenological discrimination between different crop types using harmonic curve fitting, as illustrated in
Figure 4a,c. Analysis of the original NDVI curves without harmonic fitting reveals that the characteristics of non-rice and single-season rice are highly similar and difficult to distinguish between January and April (
Figure 4a). In contrast, the HANTS-fitted NDVI curves show improved discrimination, as indicated by the blue dashed box in
Figure 4c. Specifically, while single-season rice remains at the lowest point of its time series during March and April due to the pre-sowing fallow state, the NDVI values in non-rice areas are significantly higher.
Similarly, while the original vegetation index curves show largely consistent patterns for single- and double-season rice from January to August, resulting in poor separability, the application of HANTS fitting significantly enhances their distinguishability, as highlighted in the blue dashed box (
Figure 4d). In addition, the NDVI curve of double-season rice after HANTS shows a double peak on the time series, corresponding to the growth cycles of early and late rice respectively. Conversely, single-season rice only has a single peak. This distinction is driven by clear phenological differences: in March and April, single-season rice has not yet been sown, whereas early rice is in the sowing phase (highlighted by the blue dashed box), resulting in a clear divergence in NDVI. Furthermore, in July and August, single-season rice is in the jointing stage with high vegetative cover, while late rice is in the sowing and seedling stages, presenting a significant difference in NDVI values. These results indicate that HANTS can effectively capture these temporal variations to accurately distinguish between single- and double-season rice.
3.2. Paddy Rice Classification Results
3.2.1. Classifier Comparison and Paddy Rice Distribution Mapping
To evaluate classification performance, seven cities with both single-season and double-season rice areas were selected. Classification was performed using RF and GBDT models, and results were compared based on average classification accuracy (
Table 4).
According to
Table 4, the RF classifier achieved a higher OA of 94.18% with a Kappa coefficient of 0.88, both of which significantly outperform GBDT. These results indicated that RF is more suitable for paddy rice mapping in Anhui Province. For single-season rice areas, RF slightly outperformed GBDT in both PA and UA, by 0.4% and 0.1%, respectively. In the case of double-season rice, the superiority of RF was more pronounced, with PA and UA exceeding GBDT by 5.4% and 4.66%. Previous studies have shown that single-season and double-season rice share similar spectral and textural features in remote sensing imagery [
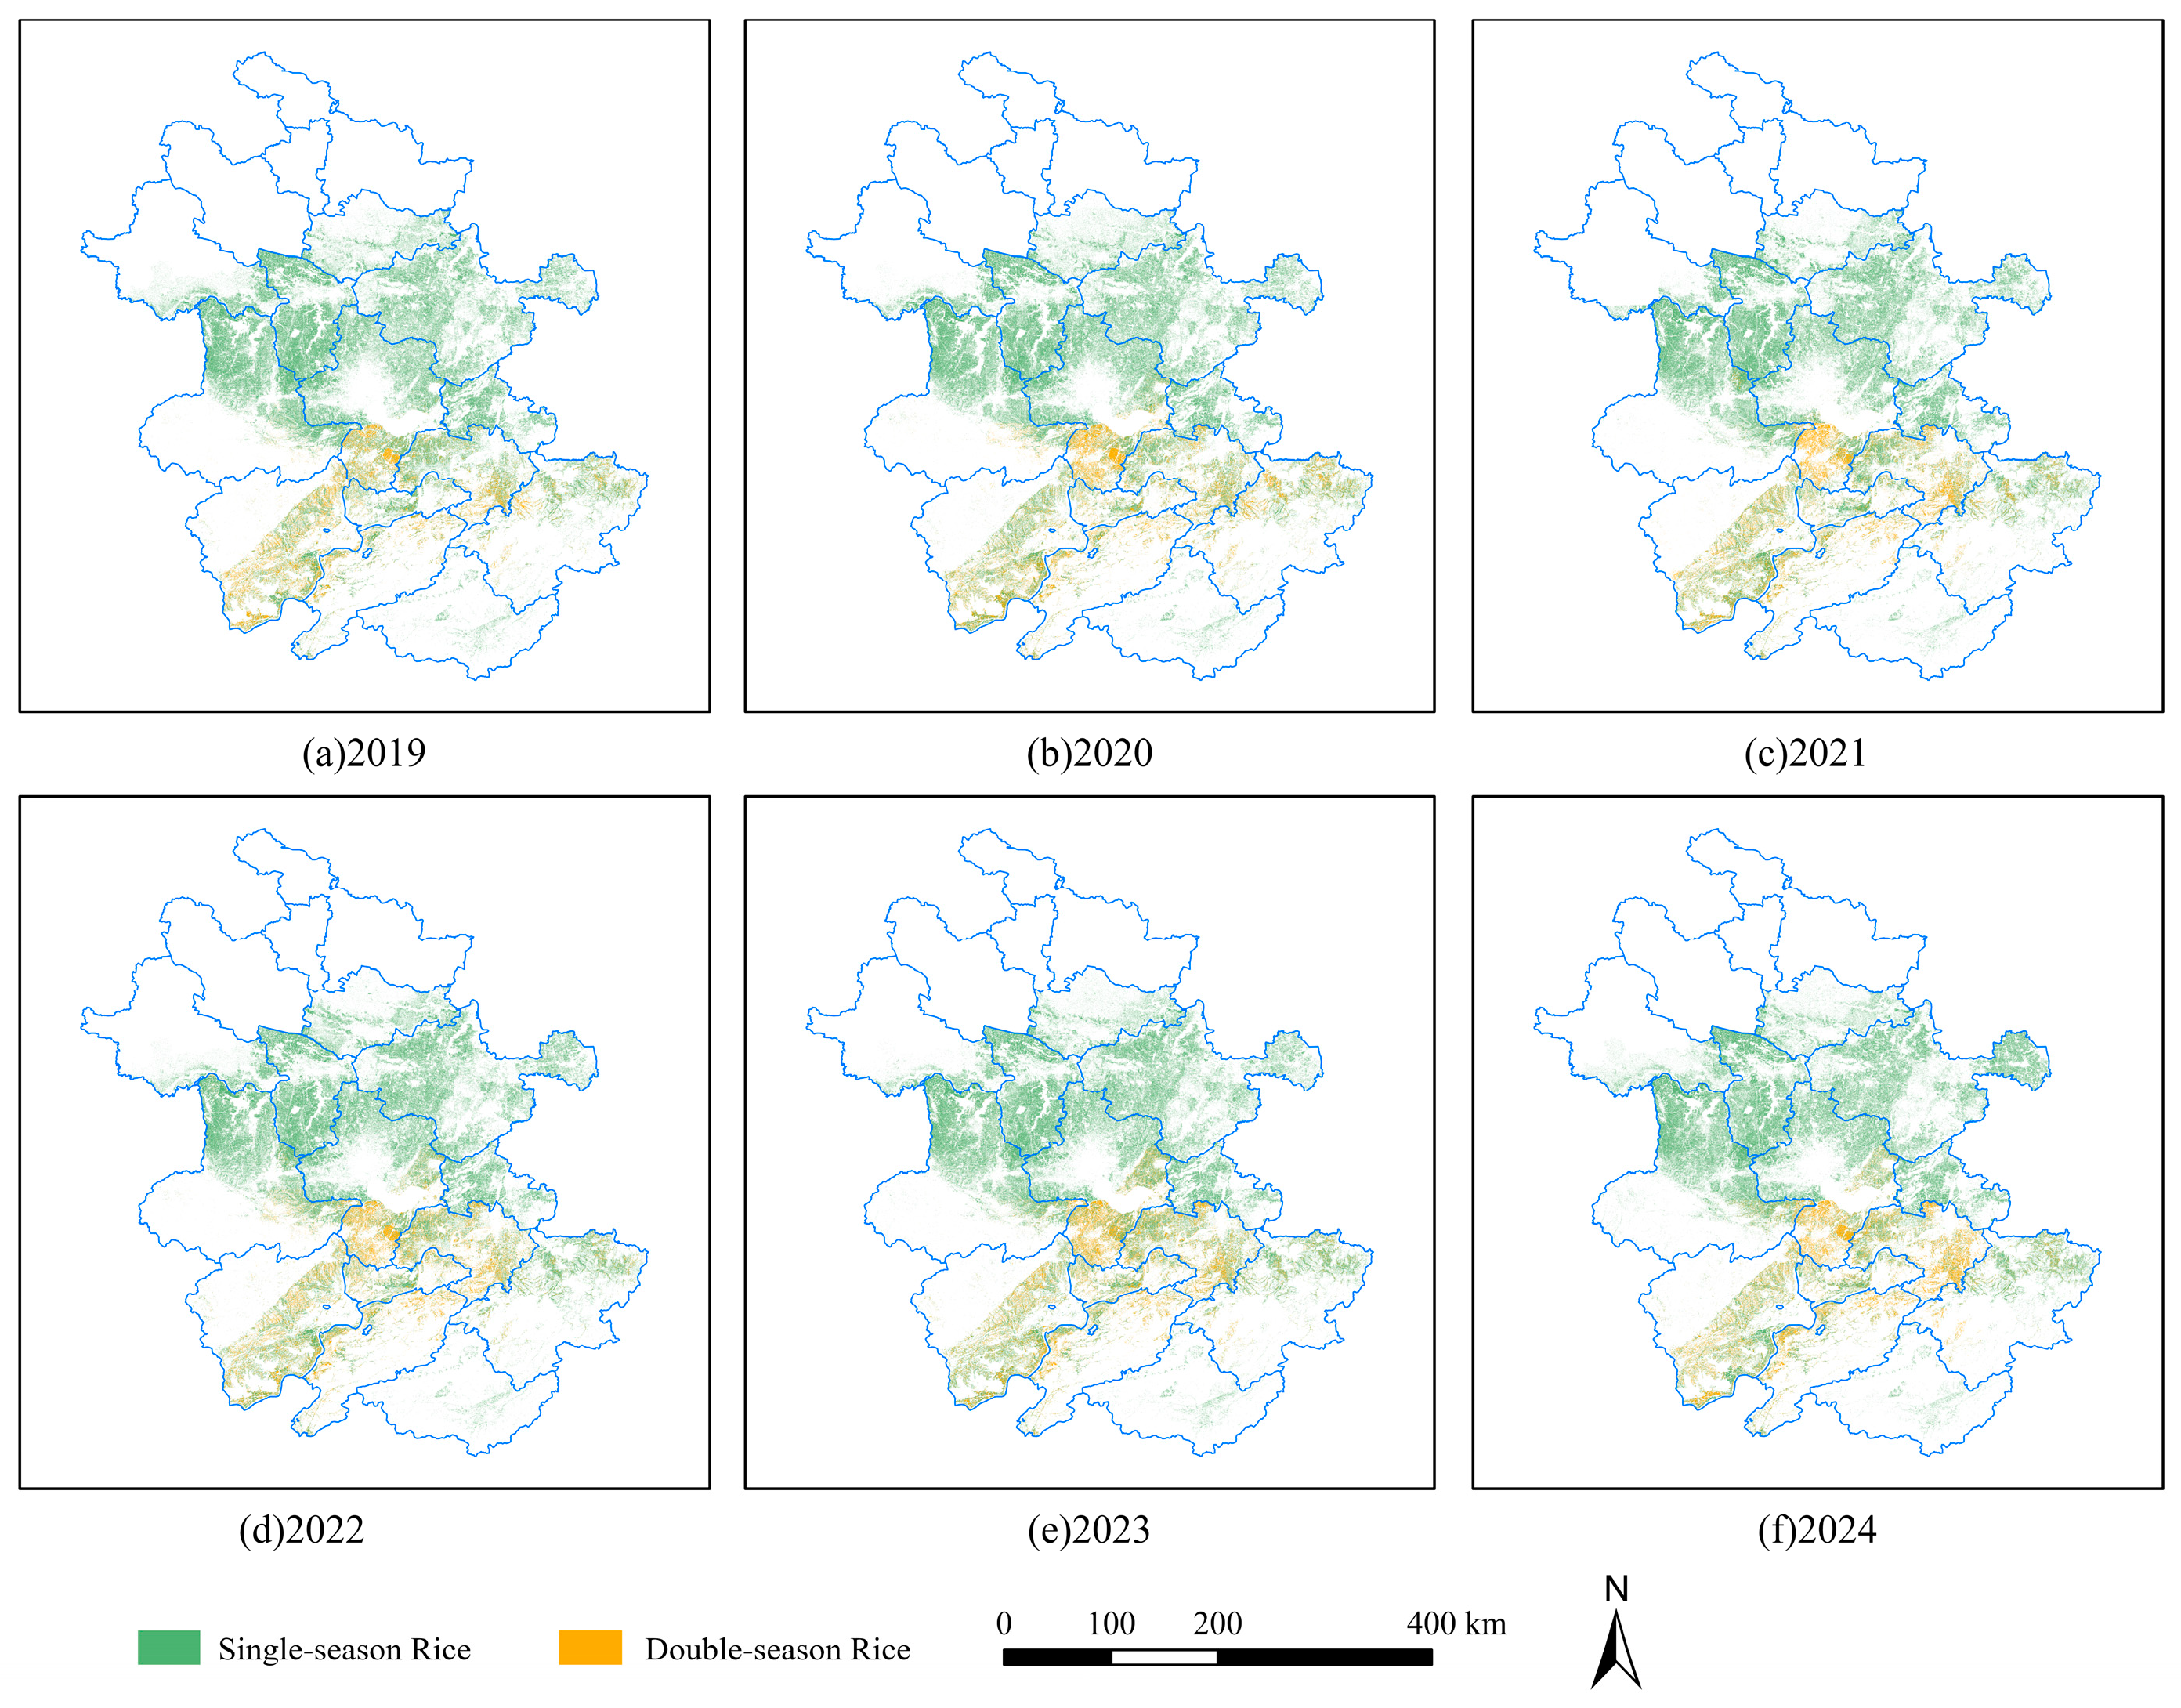
42]. For instance, during the vigorous growth period, both types exhibit high NDVI values and appear distinctly green in the imagery. In terms of texture, their fields are typically regular and well-defined. Compared with GBDT, RF is better able to integrate temporal, phenological, statistical, and polarization features, enabling more accurate differentiation between single-season and double-season rice, and thus producing more precise classification results. Based on this comparison, the study adopted the RF classification results to derive the spatial distribution of single- and double-season rice in Anhui Province from 2019 to 2024 (
Figure 5).
The study calculated the annual paddy rice cultivation area for each city based on the classification results. The planting proportions and areas refer to the average annual proportion of paddy rice cultivation and the mean annual cultivated area, respectively. As shown in
Figure 5, single-season rice is widely distributed, mainly near the Huai River Basin and predominantly located in the central and southern parts of Anhui Province. Northern Anhui shows limited distribution, with notable areas in Fuyang, Bengbu, and Huainan. The total single-season rice cultivation area reached 2.25 × 10
6 ha, accounting for 86.6% of the provincial total. In contrast, double-season rice is primarily distributed in the southern part of Hefei and southern Anhui, with a total planting area of 3.48 × 10
5 ha, which is significantly smaller than that of single-season rice and accounts for only 13.4% of the provincial total. The research results are consistent with the natural geographical and hydrothermal conditions of Anhui Province. The area north of the Huai River experiences a warm temperate humid climate, where hydrothermal conditions are generally unfavorable for paddy rice cultivation. As illustrated in
Figure 5, in this region, single-season rice is found only in Fuyang and Bengbu. Specifically, Ying Shang and Fu Nan counties (Fuyang city), both situated south of the Huai River, have emerged as the primary single-season rice production zones due to their favorable agroclimatic conditions. According to remote sensing analysis, Ying Shang and Fu Nan counties exhibit paddy rice cultivation areas of 4.36 × 10
4 ha and 2.04 × 10
4 ha respectively, collectively representing more than 90% of Fuyang’s total rice-growing area. Huaiyuan County is located north of the Huai River, within the climatic transition zone between the warm temperate humid and subtropical monsoon regions; it contributed over 40% of the single-season rice cultivation area in Bengbu, with a distribution area of up to 4.28 × 10
4 ha.
In contrast, the southern and central parts of Anhui Province are located in the subtropical monsoon climate zone, with favorable hydrothermal conditions suitable for double-season rice. In central Anhui, the Jianghuai hills and alluvial plains support a total double-season rice area of 1.77 × 10⁵ ha. Southern Anhui, though mountainous, contains numerous intermountain basins and river valley plains, along with many lakes, reservoirs, and tributaries of the Yangtze River. The region’s ideal growing conditions support concentrated double-season rice cultivation, with a documented planting area of 1.71 × 10⁵ ha. Overall, a pronounced north–south spatial divergence is observed in the distribution of paddy rice cultivation across Anhui Province. The classification results reveal that the spatiotemporal distribution of paddy rice cultivation areas in Anhui Province has remained relatively stable over the years. However, interannual variations are observed in certain years. For instance, in 2021 and 2024, the southeastern part of Wuhu had larger double-season rice areas compared to other years, while the northwestern area of Hefei exhibited a slight decline in single-season rice. Additionally, in 2021, eastern Chuzhou experienced a modest increase in single-season rice area relative to other years.
3.2.2. Accuracy Assessment of Single- and Double-Season Rice Classification
The data in
Table 5 show the accuracy evaluation of the classification results of single-season rice and double-season rice in Anhui Province from 2019 to 2024. The validation results indicated that the average OA exceeded 92%, with the Kappa coefficient consistently above 0.84. This indicates that the adopted algorithm can effectively distinguish between single-season and double-season rice with high accuracy, demonstrating strong applicability in Anhui Province. Further analysis of classification accuracy across different paddy rice types revealed that the PA and UA of single-season rice both exceeded 92%. The research results indicate that the classifier effectively learned and generalized the characteristics of single-season rice. In contrast, double-season rice showed slightly lower classification accuracy, with PA above 88% and UA above 89% for both. However, its classification accuracy remains relatively high, enabling effective distinction between single-season and double-season rice.
In terms of interannual variations, the UA of double-season rice exceeded 91% in 2019, 2020, 2021, and 2024, and the PA surpassed 90% in 2019, 2020, 2021, and 2022. PA and UA in different years may fluctuate due to factors such as the image acquisition time of remote sensing images and cloud contamination. However, the classification accuracy remained at a high level across the six years, indicating that the adopted classification method had strong stability and robustness.
To further verify the classification accuracy of the paddy rice, the research calculated the cultivated areas based on the classification results of single-season rice and double-season rice in Anhui Province. Subsequently, the paddy rice cultivation areas extracted from 2019 to 2023 were compared with the statistical data published in the Anhui Statistical Yearbook. The error rate was then calculated to assess the effectiveness and accuracy of the algorithm. Since the Anhui Statistical Yearbook for 2024 has not yet been published, the accuracy assessment for the extracted paddy rice area in 2024 was not conducted in this study.
As shown in
Table 6, the paddy rice cultivation area extracted using the RF classifier from 2019 to 2023 shows high consistency with the yearbook statistical results (note that the 2024 results were not compared due to the unavailability of the 2025 statistical yearbook). The results show that the total cultivated area of single- and double-season rice fluctuated around 2.60 million ha. For most years, the error rates ranged between 3% and 4%, with the lowest error as low as 0.03% in 2021 and the highest not exceeding 6.3% in 2023. In particular, the 2021 results were closest to the yearbook, while the 2023 discrepancy was larger but remained acceptable. These findings confirm that the results extracted by the RF classifier with temporal, statistical, phenological, and polarized features have considerable accuracy, providing strong support for paddy rice monitoring.
3.3. Driving Factors of Paddy Rice Cultivation Across Different Regions
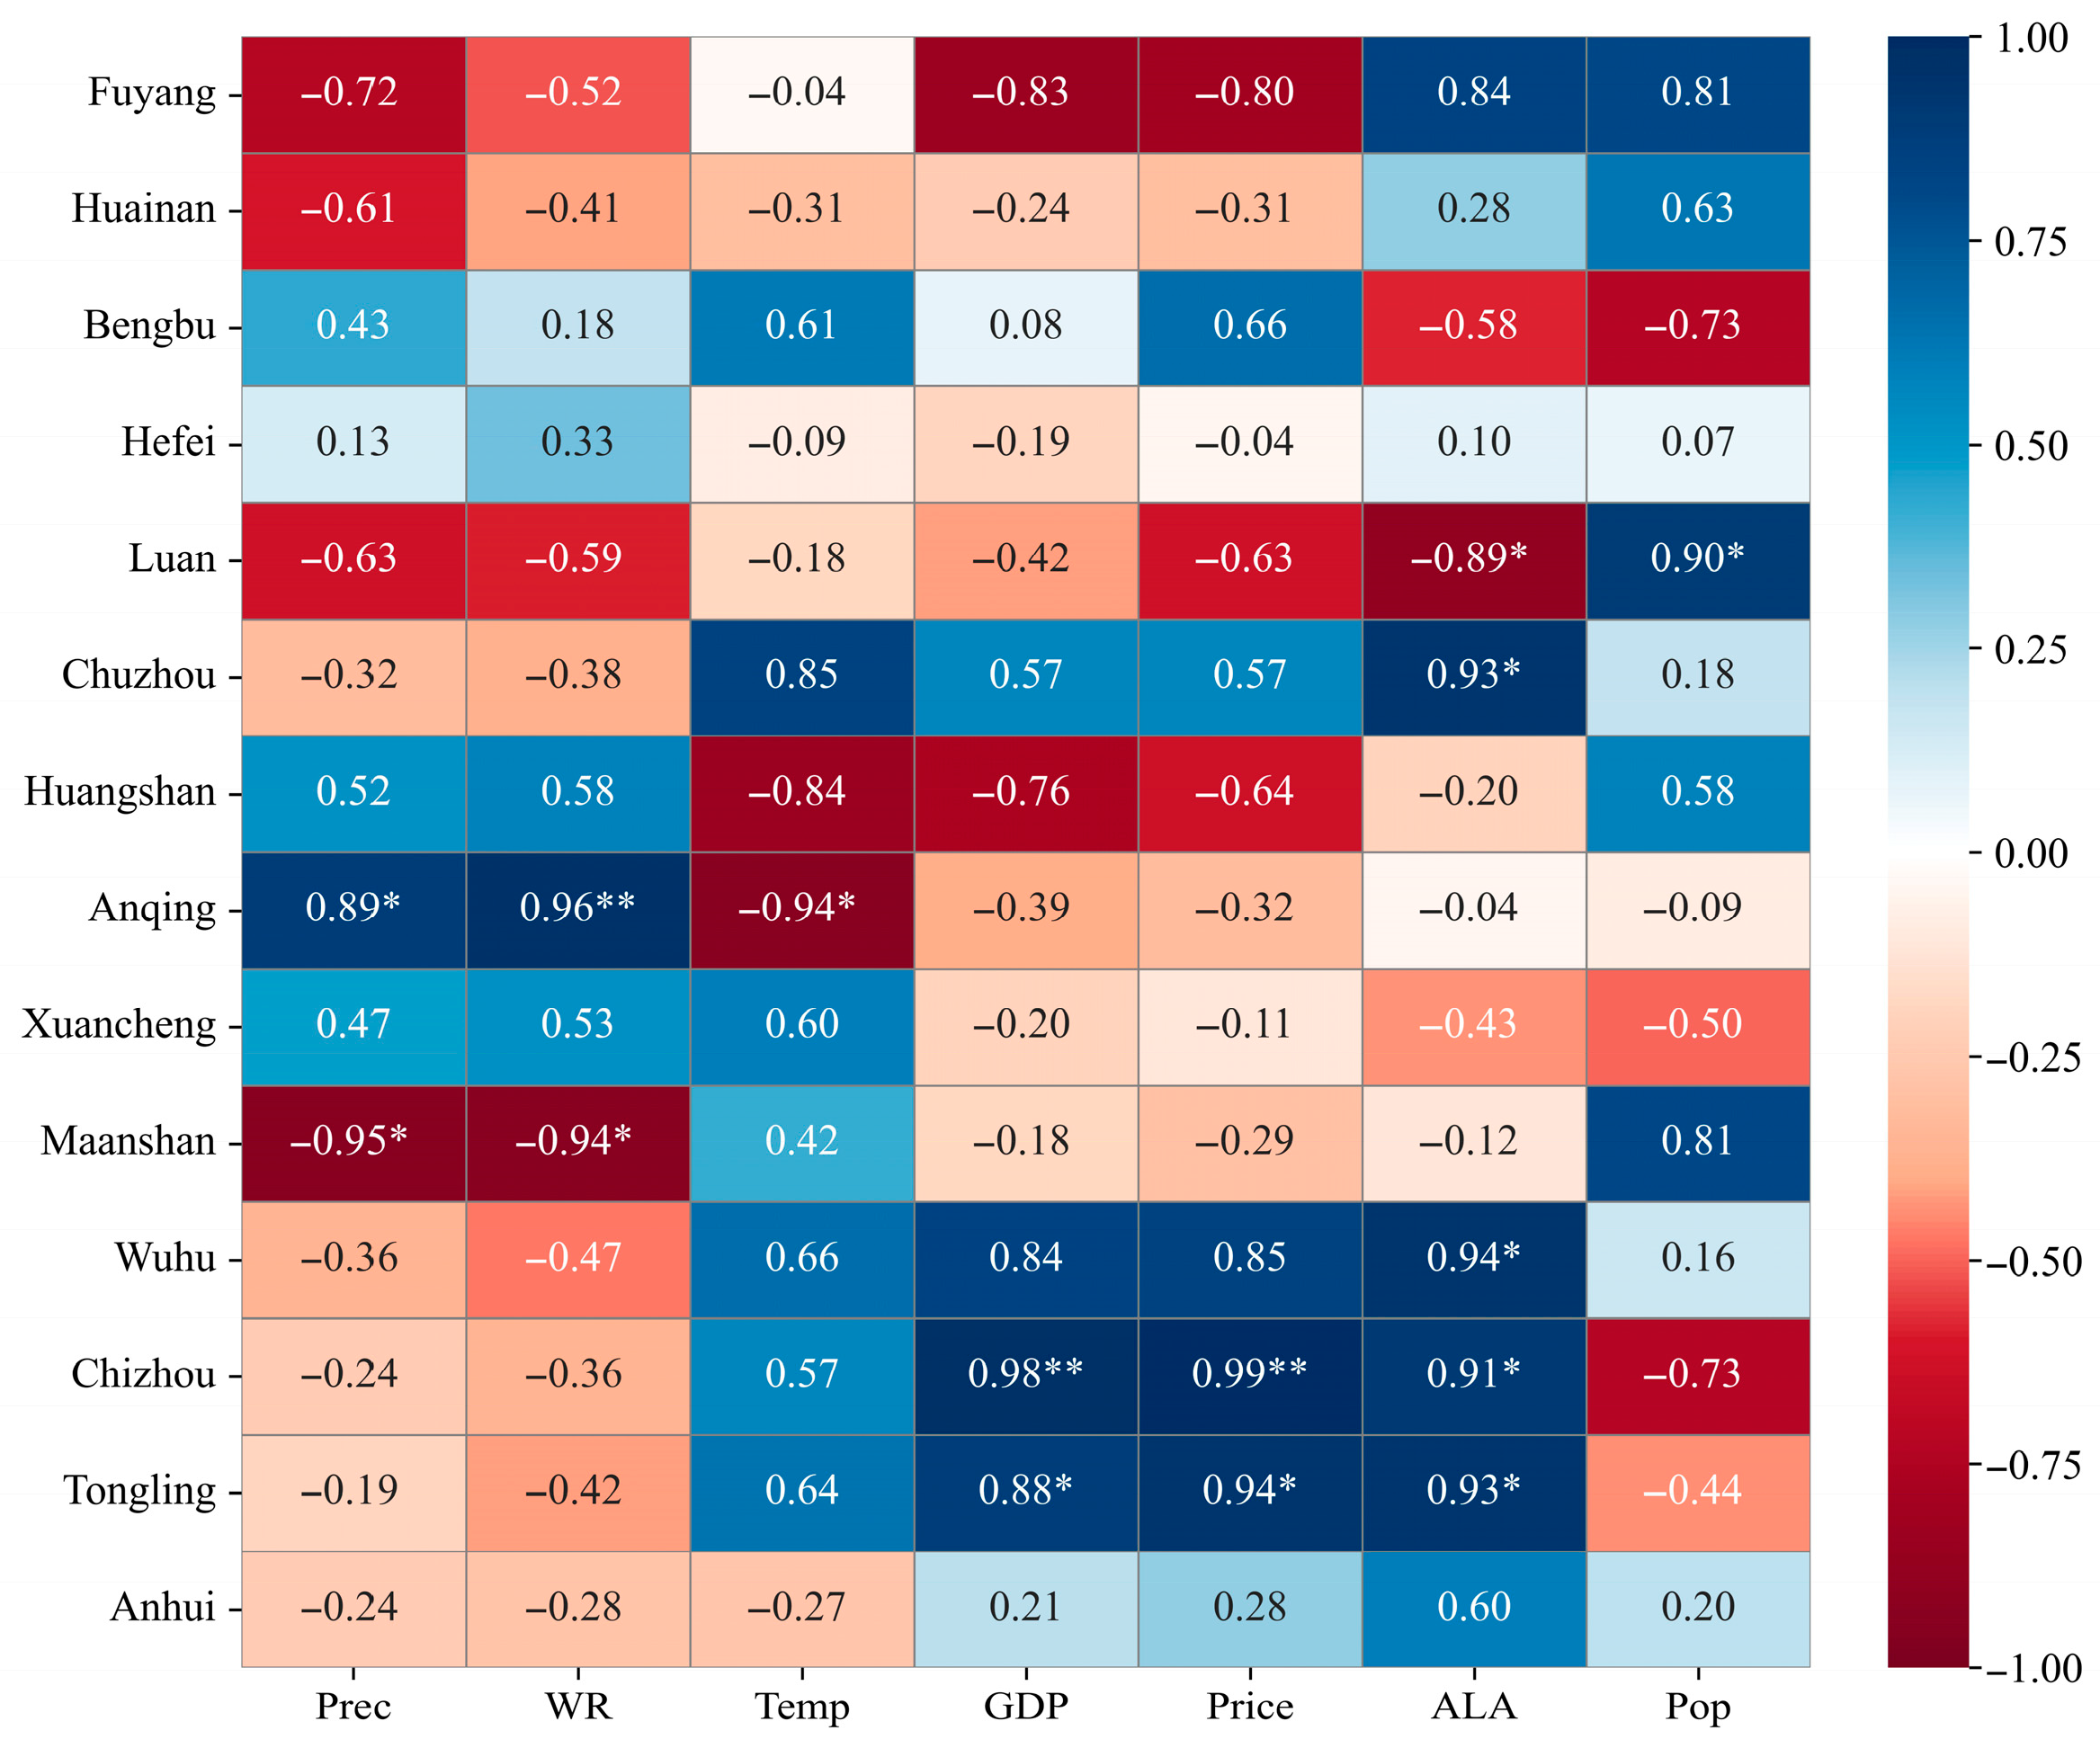
The research aims to quantitatively assess the impacts of both natural and anthropogenic drivers on paddy rice cultivation area dynamics in Anhui Province and its constituent cities during the 2019–2024 period. Specifically, natural factors include temperature (Temp), precipitation (Prec), and total water resources (WR), which characterize the regional environmental conditions. In parallel, anthropogenic factors comprise gross domestic product (GDP), rice price (Price), arable land area (ALA), and population (Pop), reflecting local economic and market dynamics. To facilitate a detailed analysis, the research area was divided into three sub-regions: Northern Anhui (including Fuyang, Huainan, and Bengbu), Central Anhui (Hefei, Lu’ an, and Chuzhou), and southern Anhui (Huangshan, Anqing, Xuancheng, Ma’anshan, Wuhu, Chizhou, and Tongling). Correlation analysis between paddy rice-planting areas and driving factors was performed at both provincial and municipal scales to identify similarities and differences in cultivation drivers across regions (
Figure 6). This multi-scale approach enables a systematic examination of spatial heterogeneity in factors influencing rice cultivation patterns across the study area.
According to the analysis of the matrix coefficients, it can be concluded that the total paddy rice cultivation area in the province exhibits weak correlations with most factors, with the absolute values of correlation coefficients R fluctuating between 0.2 and 0.3. Only the arable land area shows a relatively strong positive correlation with paddy rice cultivation, with a correlation coefficient of around 0.6. These results suggest that due to considerable spatial heterogeneity in climate, geographic environment, and socioeconomic conditions within Anhui, no clear overall correlation trend emerges. Meanwhile, this highlights that arable land area is a key factor influencing paddy rice cultivation in Anhui, a major agricultural province. Regional analysis shows that northern Anhui cities are mostly located on the Huai River Plain, featuring flat terrain suitable for dryland agriculture. However, limited water resources constrain the development of paddy rice cultivation. Paddy rice cultivation depends on stable artificial irrigation, but available water is prioritized for wheat, maize, and other dryland crops, limiting paddy rice development. In contrast, through the analysis of anthropogenic factors in northern Anhui, it can be found that paddy rice cultivation area correlates more strongly with several humanistic variables. For instance, the correlation coefficients R between population size and paddy rice cultivation area in Fuyang and Huainan reach 0.84 and 0.63, respectively. This indicates that larger populations increase grain demand, thereby promoting the expansion of paddy rice cultivation. Furthermore, the correlation coefficient R between paddy rice area and arable land in Fuyang reaches 0.84, suggesting that concentrated farmland enables more feasible large-scale and sustained paddy rice production.
The central region of Anhui includes three cities: Hefei, Lu’ an, and Chuzhou. As shown in
Figure 6, the rice cultivation area in Hefei exhibits weak correlations with all seven analyzed factors. In contrast, Lu’ an and Chuzhou are more significantly influenced by both natural and anthropogenic factors. Specifically, in Chuzhou, the paddy rice area shows positive correlations with GDP, rice price, and arable land area, with R values of 0.57, 0.57, and 0.93, respectively. This indicates that farmland protection plays a crucial role in maintaining stable paddy rice areas. Moreover, moderate increases in rice prices may encourage paddy rice cultivation, supporting food production stability and security. In Lu’an, the correlation (R = 0.90) between population size and paddy rice area suggests that demographic pressure is a key driver of paddy rice cultivation dynamics.
The southern region of Anhui is mainly composed of mountainous and hilly terrain, with dense river networks and abundant water resources, providing a favorable natural foundation for paddy rice cultivation. Specifically, the primary planting areas are concentrated in the riverine plains along the Yangtze River. As illustrated in
Figure 6, the significantly correlated natural and anthropogenic factors are mainly distributed in the southern Anhui region. In mountainous cities such as Huangshan, Anqing, and Xuancheng, the extent of paddy rice cultivation shows stronger correlations with natural factors. In particular, the area under paddy rice cultivation in Anqing City is strongly positively correlated with precipitation and water resources, with the correlation coefficients R reaching 0.89 and 0.96, respectively. This indicates that paddy rice cultivation in this region is highly sensitive to changes in water availability. The results show that the mountainous areas of southern Anhui, located within the subtropical monsoon climate zone, receive abundant rainfall. Natural precipitation serves as the primary source of irrigation water for the terraced agricultural areas in the mountainous and hilly regions.
By contrast, cities such as Wuhu and Ma’anshan are located in the riverine plains along the Yangtze River. These regions show stronger associations between paddy rice cultivation and anthropogenic factors such as GDP, rice price, and arable land area. Tongling and Chizhou are particularly representative, and in both cities, paddy rice cultivation shows a strong positive correlation with GDP, rice price, and arable land area. The correlation coefficients’ R exceed 0.9 for over 50% of the factors. These findings suggest that agricultural production in this region is more strongly influenced by market forces and the supply of arable land areas.
In summation, the correlation analysis between paddy rice cultivation area and both natural and anthropogenic driving factors across northern, central, and southern Anhui reveals significant spatial heterogeneity in paddy rice cultivation drivers across the province. Influenced by variations in topography, climate, economic development, and urbanization levels, the dominant factors driving paddy rice cultivation differ notably between the northern and southern regions of Anhui.
4. Discussion
4.1. The Contribution of Phenological Features to the Classification of Paddy Rice
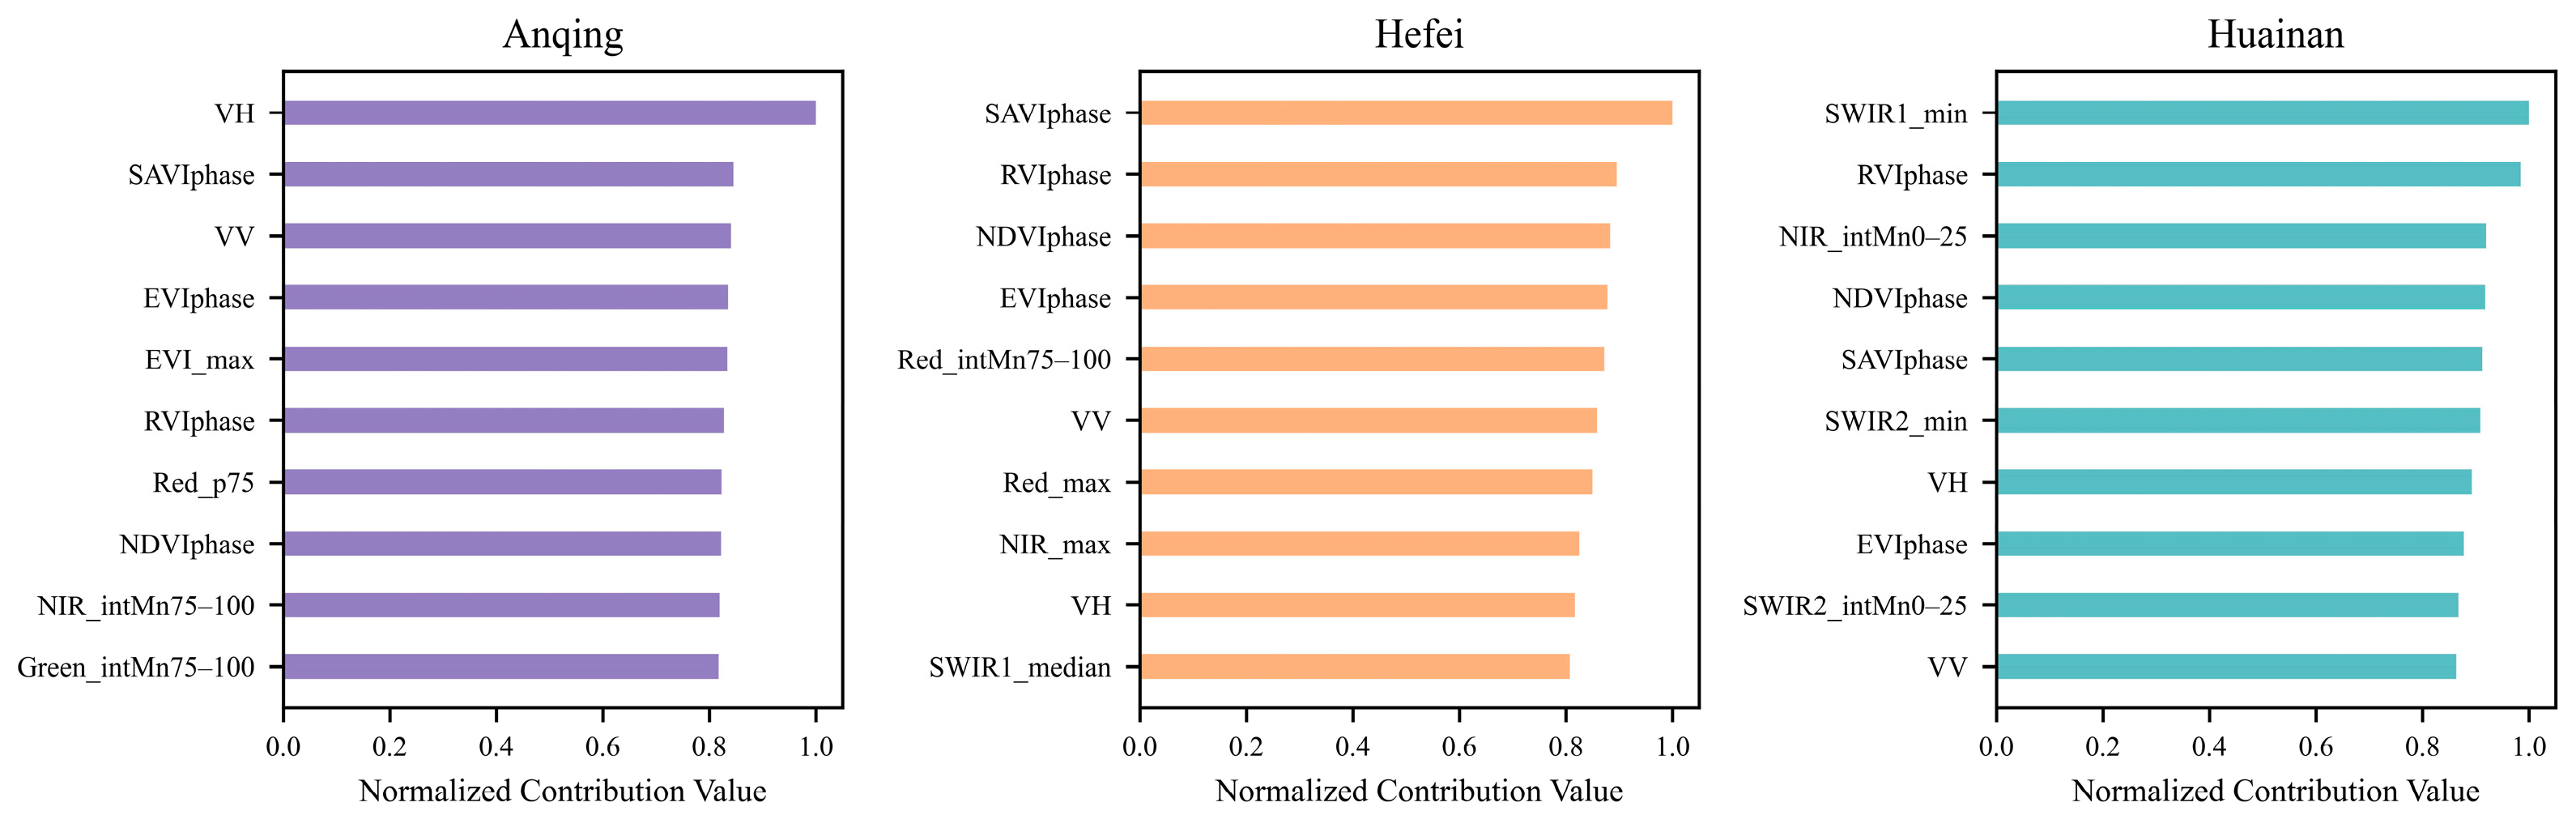
The proposed algorithm in this study combines amplitude and phase phenological features to establish a multi-dimensional feature set, while employing the random forest classifier’s feature importance method to quantitatively assess each variable’s contribution to rice field recognition. The results show that phenological and polarization characteristics are significantly important for rice classification. In order to further evaluate the contribution of feature classification in different rice-planting areas, three representative cities in terms of terrain and climate, Huainan (northern Anhui), Hefei (central Anhui), and Anqing (southern Anhui), were selected as the study areas. These three cities have significant differences in rice planting systems, with Huainan only planting single-season rice, while Hefei and Anqing have both single-season and double-season rice systems. Although the total number of features used is consistent (90 items in total), there are significant differences in the ranking of feature importance among different regions (
Figure 7).
Analysis of phenological characteristics revealed that the phase characteristics of NDVI, SAVI, RVI, and EVI vegetation indices, after fitting with harmonic models, ranked among the top ten in all three cities. Among them, the phase parameter represented the time when the peak of the vegetation index appears, which can reflect the differences in growth cycle between single-season rice, double-season rice, and non-rice, and plays a significant role in the classification process. At the same time, due to the influence of subtropical monsoon climate and cloudy and rainy weather, there may be missing data in the time series. The harmonic phenology model filled in the missing data, making the four vegetation indices after harmonic analysis show similar importance in classification. In terms of polarization characteristics, both VV and VH polarizations contributed significantly across all study areas. VV polarization effectively detected water surface reflections during early rice growth, aiding flood mapping in the seedling and transplanting stages. Conversely, VH polarization better captured canopy structural changes, with stronger backscatter as rice advanced to tillering and maturation, improving crop identification. The relative importance of these features exhibits notable regional variations, reflecting significant spatial heterogeneity in the dominant factors driving rice classification under different topographic conditions within Anhui Province.
Notably, the relative importance of these features exhibited significant regional variations, reflecting the spatial heterogeneity of dominant driving factors under different topographic and agronomic conditions. Specifically, in Anqing and Hefei, where single- and double-season rice coexist, the phase features derived from HANTS played a vital role in distinguishing complex phenological patterns. However, particularly in Anqing, characterized by mountainous and hilly terrain with frequent cloud cover, the VV and VH polarizations became indispensable. Their all-weather imaging capability allowed for the reliable capture of structural and moisture changes that optical sensors often miss due to atmospheric and topographic obstructions. In contrast, Huainan is dominated by single-season rice with a relatively uniform planting structure. Consequently, the SWIR band and RVI exhibited elevated importance due to their high sensitivities to soil moisture, water conditions, and canopy structure, respectively, serving as critical complements to phenological features for precise crop identification.
In summary, the phase parameters of four vegetation indices derived from HANTS, along with VV and VH dual-polarization features, served as critical variables for random forest classification. Moreover, SAR data effectively compensated for the limitations of HANTS-fitted optical data. The synergistic use of Sentinel-1 SAR and Sentinel-2 time-series spectral data significantly mitigated the adverse effects of frequent cloud cover and rainfall in subtropical monsoon climates on data acquisition and analysis. The observed regional variations in the importance of statistical and temporal features among the three cities further underscored the substantial impact of topographic heterogeneity on classification performance. The results indicate that the introduction of harmonic phenological features can effectively reduce rice classification errors caused by spatial heterogeneity.
4.2. Evaluation of Classification Accuracy Under Different Feature Combinations
4.2.1. The Contribution of Phenological Features in Rice and Non-Rice Extraction
To evaluate the performance of different feature combinations in rice classification and investigate the impact of phenological features, this study selected a representative rice cultivation area in Zhumiao Village, Huainan City, as the test site. As shown in
Table 7, the classification accuracy varied significantly across feature combinations. The single-season rice distribution maps were generated under four feature combinations for 2020 with the RF classifier (
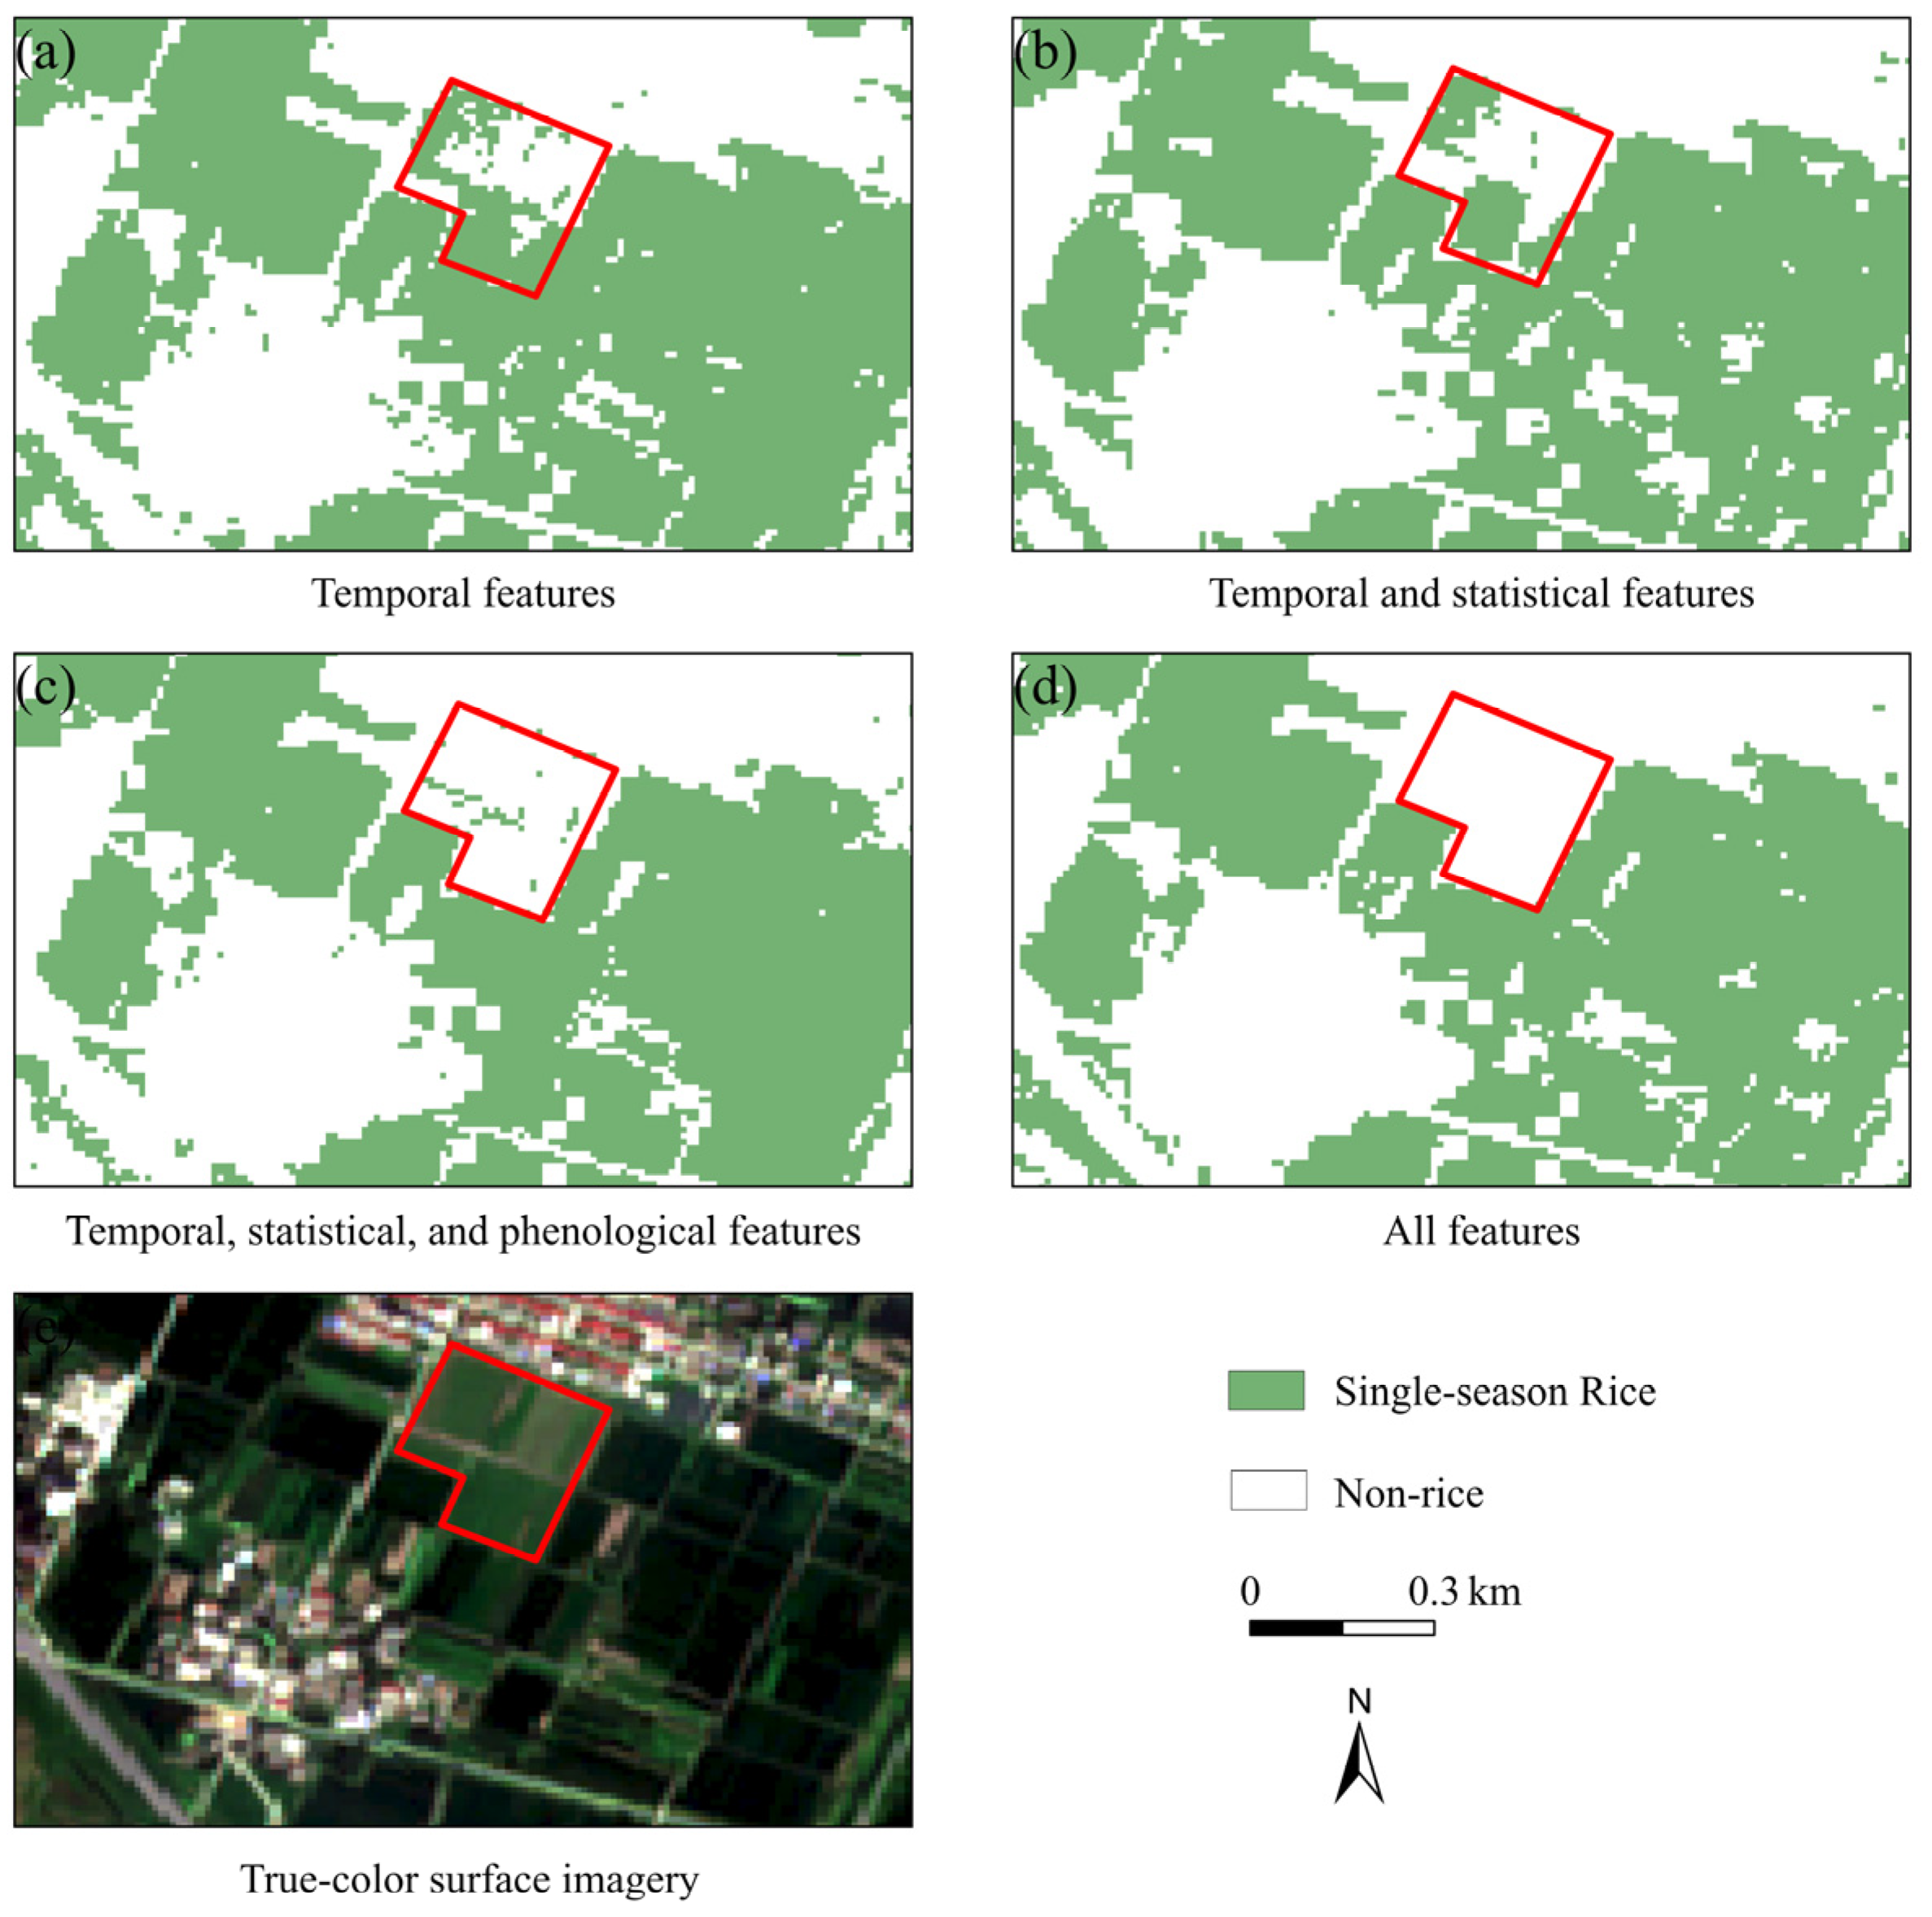
Figure 8).
Feature importance analysis revealed that using only temporal features yielded an OA of 78.31%, demonstrating suboptimal performance. The addition of statistical features merely increased OA by 0.73%, confirming the limited capability of spatiotemporal features alone for precise rice mapping. Notably, incorporating both amplitude and phase phenological features substantially boosted OA by 13.19%, as these features effectively identified critical growth stages and enhanced crop differentiation. The further inclusion of VV/VH polarization features improved OA by an additional 1.96%. Specifically, VV polarization exhibited strong sensitivity to water surface reflection for flood monitoring, while VH polarization captured canopy structural characteristics, collectively reducing non-vegetation interference and improving classification consistency.
Figure 8a illustrates significant misclassification in results obtained using spectral–temporal features alone. Visual interpretation of August 2020 Sentinel-2 imagery reveals distinct color differences between misclassified areas (light green) and surrounding single-cropping rice fields (dark green). Field verification confirmed that the areas marked with red boxes in
Figure 9a,b are actually pear orchards, with
Figure 8a showing more severe misclassification where some roads were also erroneously classified as rice, resulting in blurred field boundaries. The results indicated that relying solely on spectral–temporal features or combining them with statistical features proves inadequate for effectively distinguishing rice from economic fruit forests (such as pear orchards). After incorporating amplitude-phase dual phenological features (red box in
Figure 8c), the misclassification rate of pear orchards decreased significantly, with substantially improved field boundary clarity. The classification results outperformed the previous two methods, confirming that phenological features can effectively enhance rice identification accuracy by capturing phase/amplitude variations during critical growth stages. Finally, the study incorporated VV and VH polarization features from radar data into the classification feature set, with results shown in
Figure 8d. Notably, the misclassification of pear orchards was completely eliminated (red box in
Figure 8d). Rice field boundaries became clearly distinguishable, and roads were accurately extracted. As evidenced in
Table 8, the addition of VV and VH polarization features further enhanced the spatial extraction capability for single-cropping rice, achieving higher classification accuracy and consistency. The results indicated that incorporating both amplitude and phase phenological variables yielded the most substantial improvement in classification accuracy. Notably, the feature combination integrating temporal, statistical, phenological, and polarimetric characteristics achieved optimal performance, with OA, PA, UA, and the Kappa coefficient consistently outperforming other combinations. This integrated approach effectively captured critical growth stages of single-season rice and enhanced the discrimination between rice and other crop types, thereby delivering superior classification accuracy.
4.2.2. HANTS Phenological Contribution in Single- and Double-Season Rice Extraction
The research results in
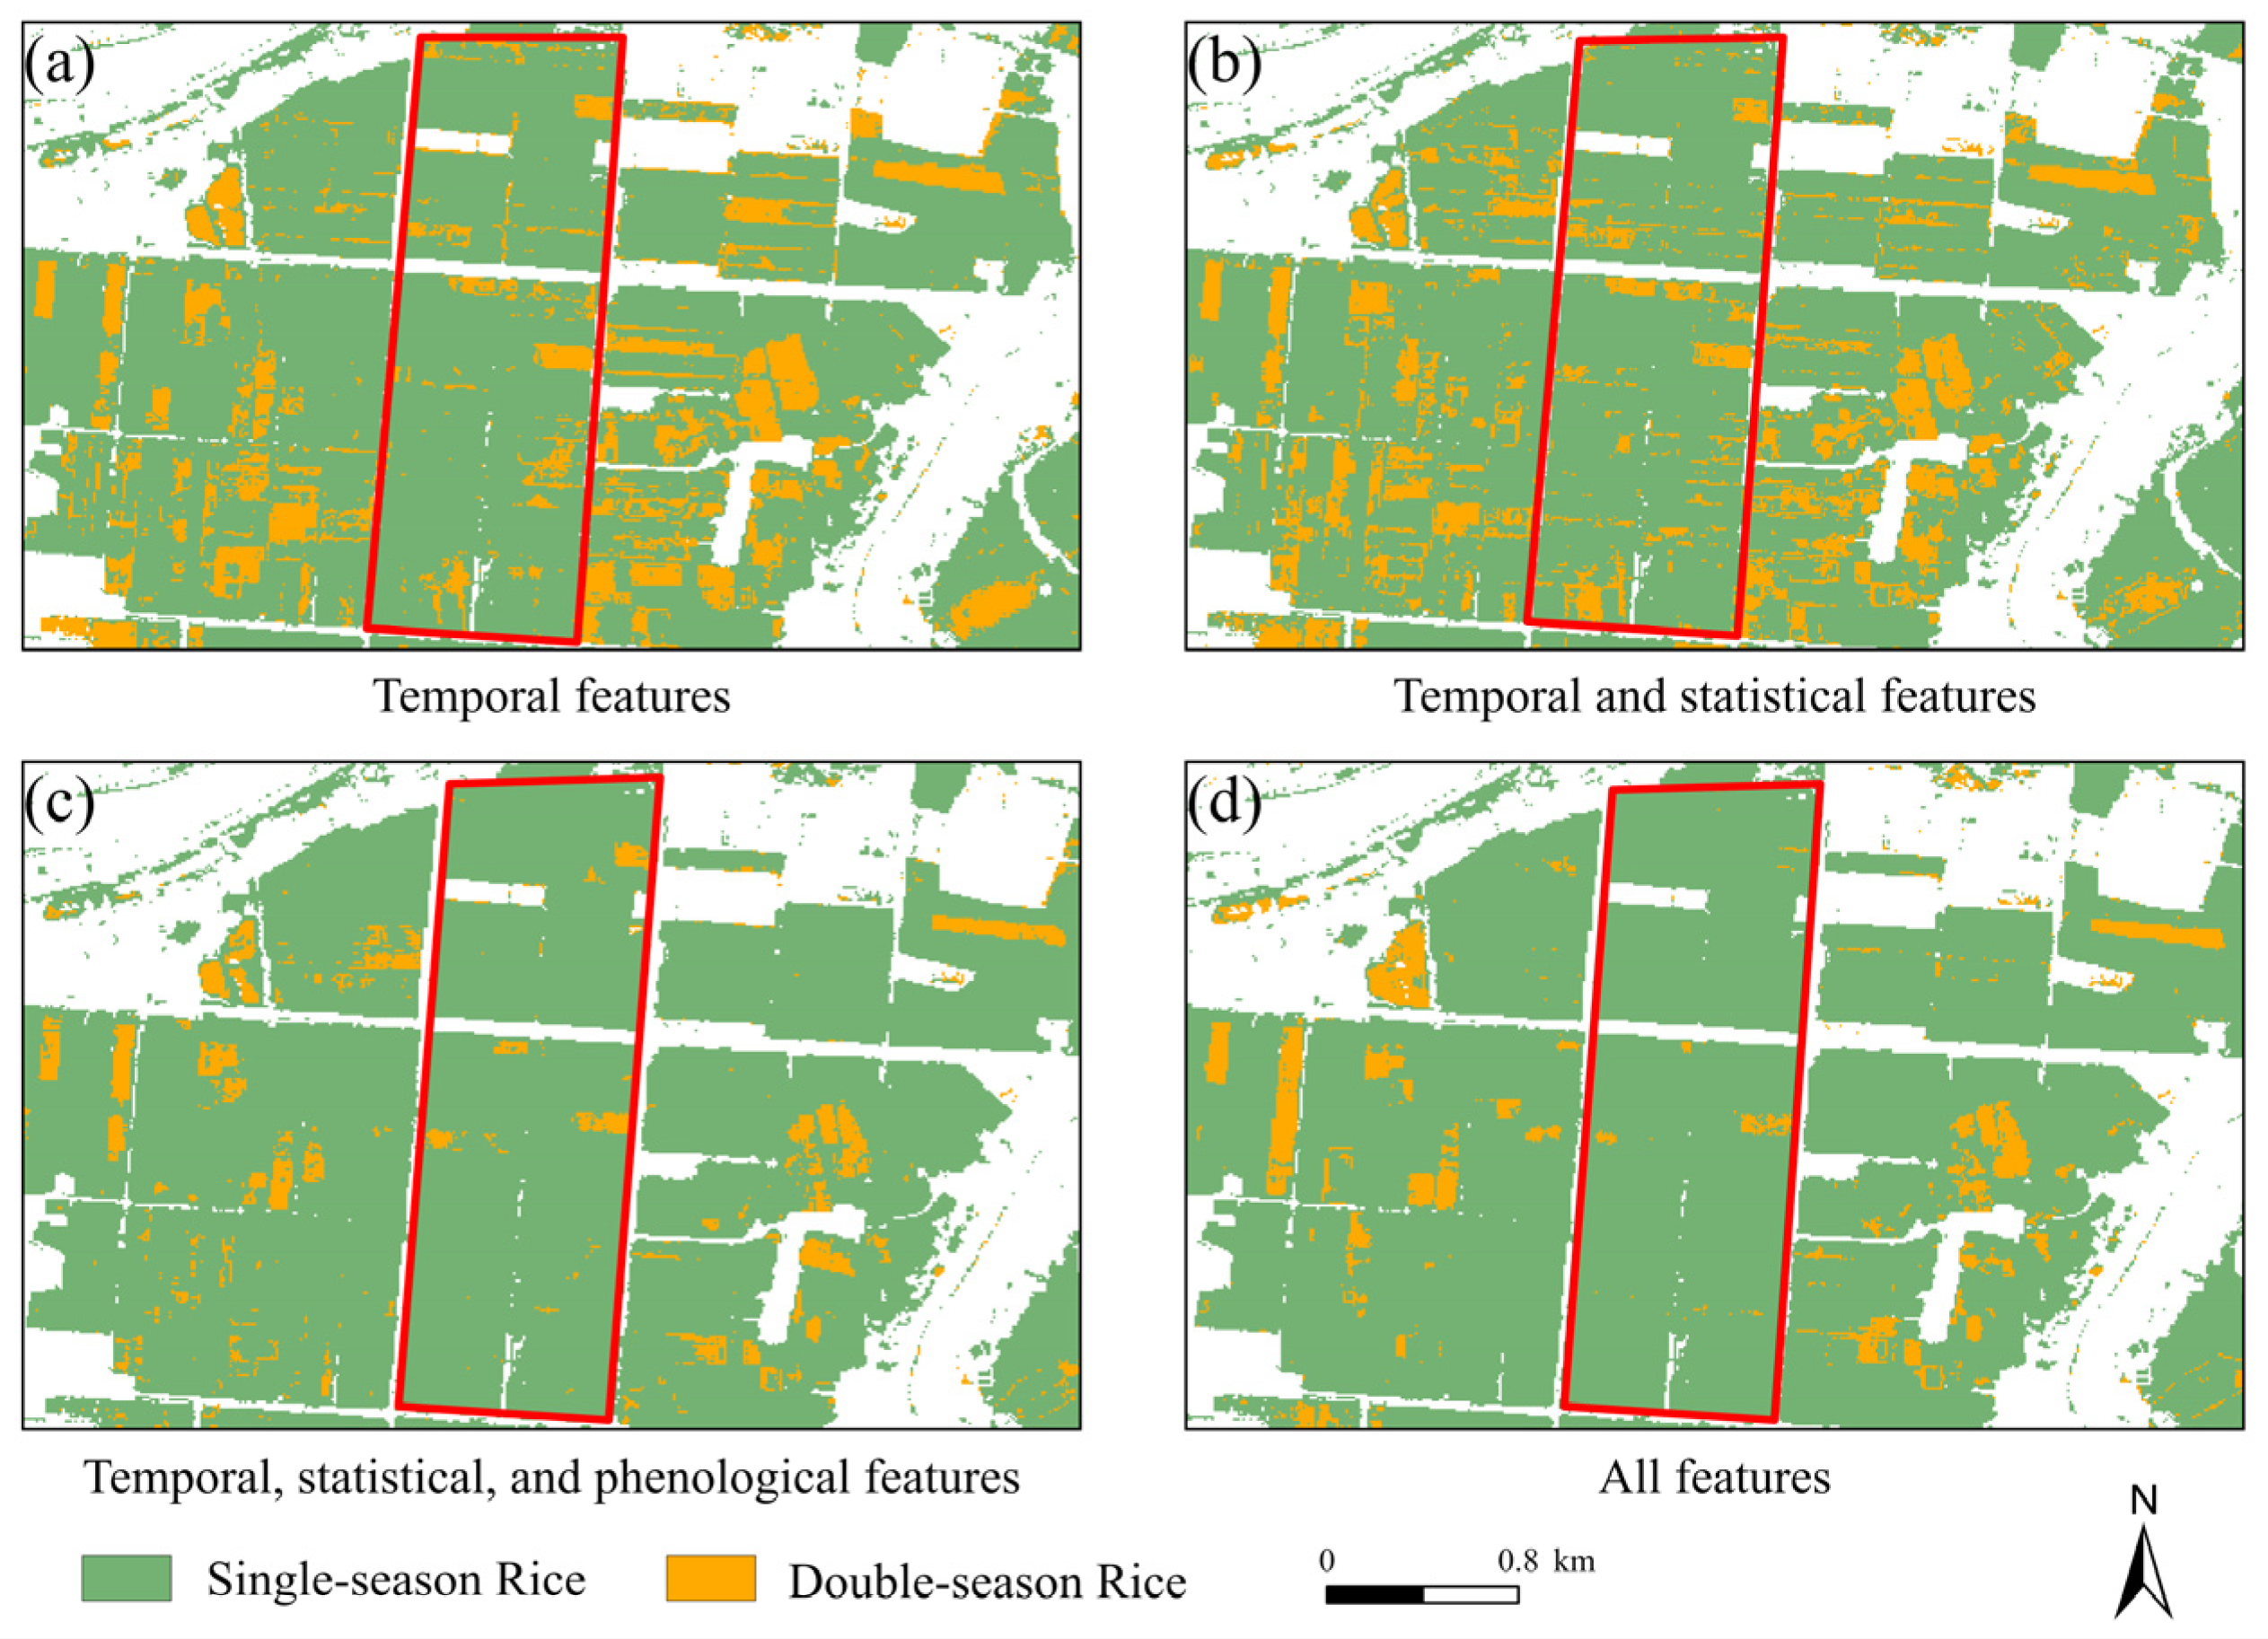
Section 4.2.1 indicate that harmonic phenological characteristics are very effective in identifying rice and non-rice. However, the contribution of phenological characteristics to the remote sensing recognition accuracy of single- and double-season rice is still unclear. To this end, this study examined a mixed planting area of single- and double-season rice in Anqing City. It evaluated the differences in recognition accuracy between the two rice types achieved by different classification combinations, with the results detailed in
Figure 10 and
Table 8. According to the data in
Table 8, the introduction of phenological features led to a notable improvement in classification accuracy. For single-season rice, the PA increased from 81.89% to 91.74% (an increase of approximately 12%), and the UA rose from 69.33% to 88.1% (an increase of approximately 27%). For double-season rice, the PA increased substantially from 55.77% to 83.33% (an increase of approximately 49%), while the UA increased from 71.6% to 88.1% (an increase of approximately 23%). Overall, the HANTS phenological features improved the OA by 25.70%, and the results suggested that the HANTS phenological features contributed the most to the rice identification, with a particularly robust effect on the extraction of double-season rice.
In addition, a comparative analysis of the red-boxed areas in
Figure 9 highlights the impact of feature selection. The results in (a) and (b), derived from models using only temporal and statistical features, exhibit noticeable misclassification and a scattered distribution of double-season rice. While the result in (c), which introduces harmonic phenological features, shows a clear visual improvement. This is further evidenced by the result in (d), where the inclusion of all features produces an outcome nearly identical to (c). Therefore, it can be concluded that harmonic phenological features have a significant effect on extracting double-season rice and boosting overall classification performance.
4.3. Comparison with Other Pre-Existing Rice Mapping Results
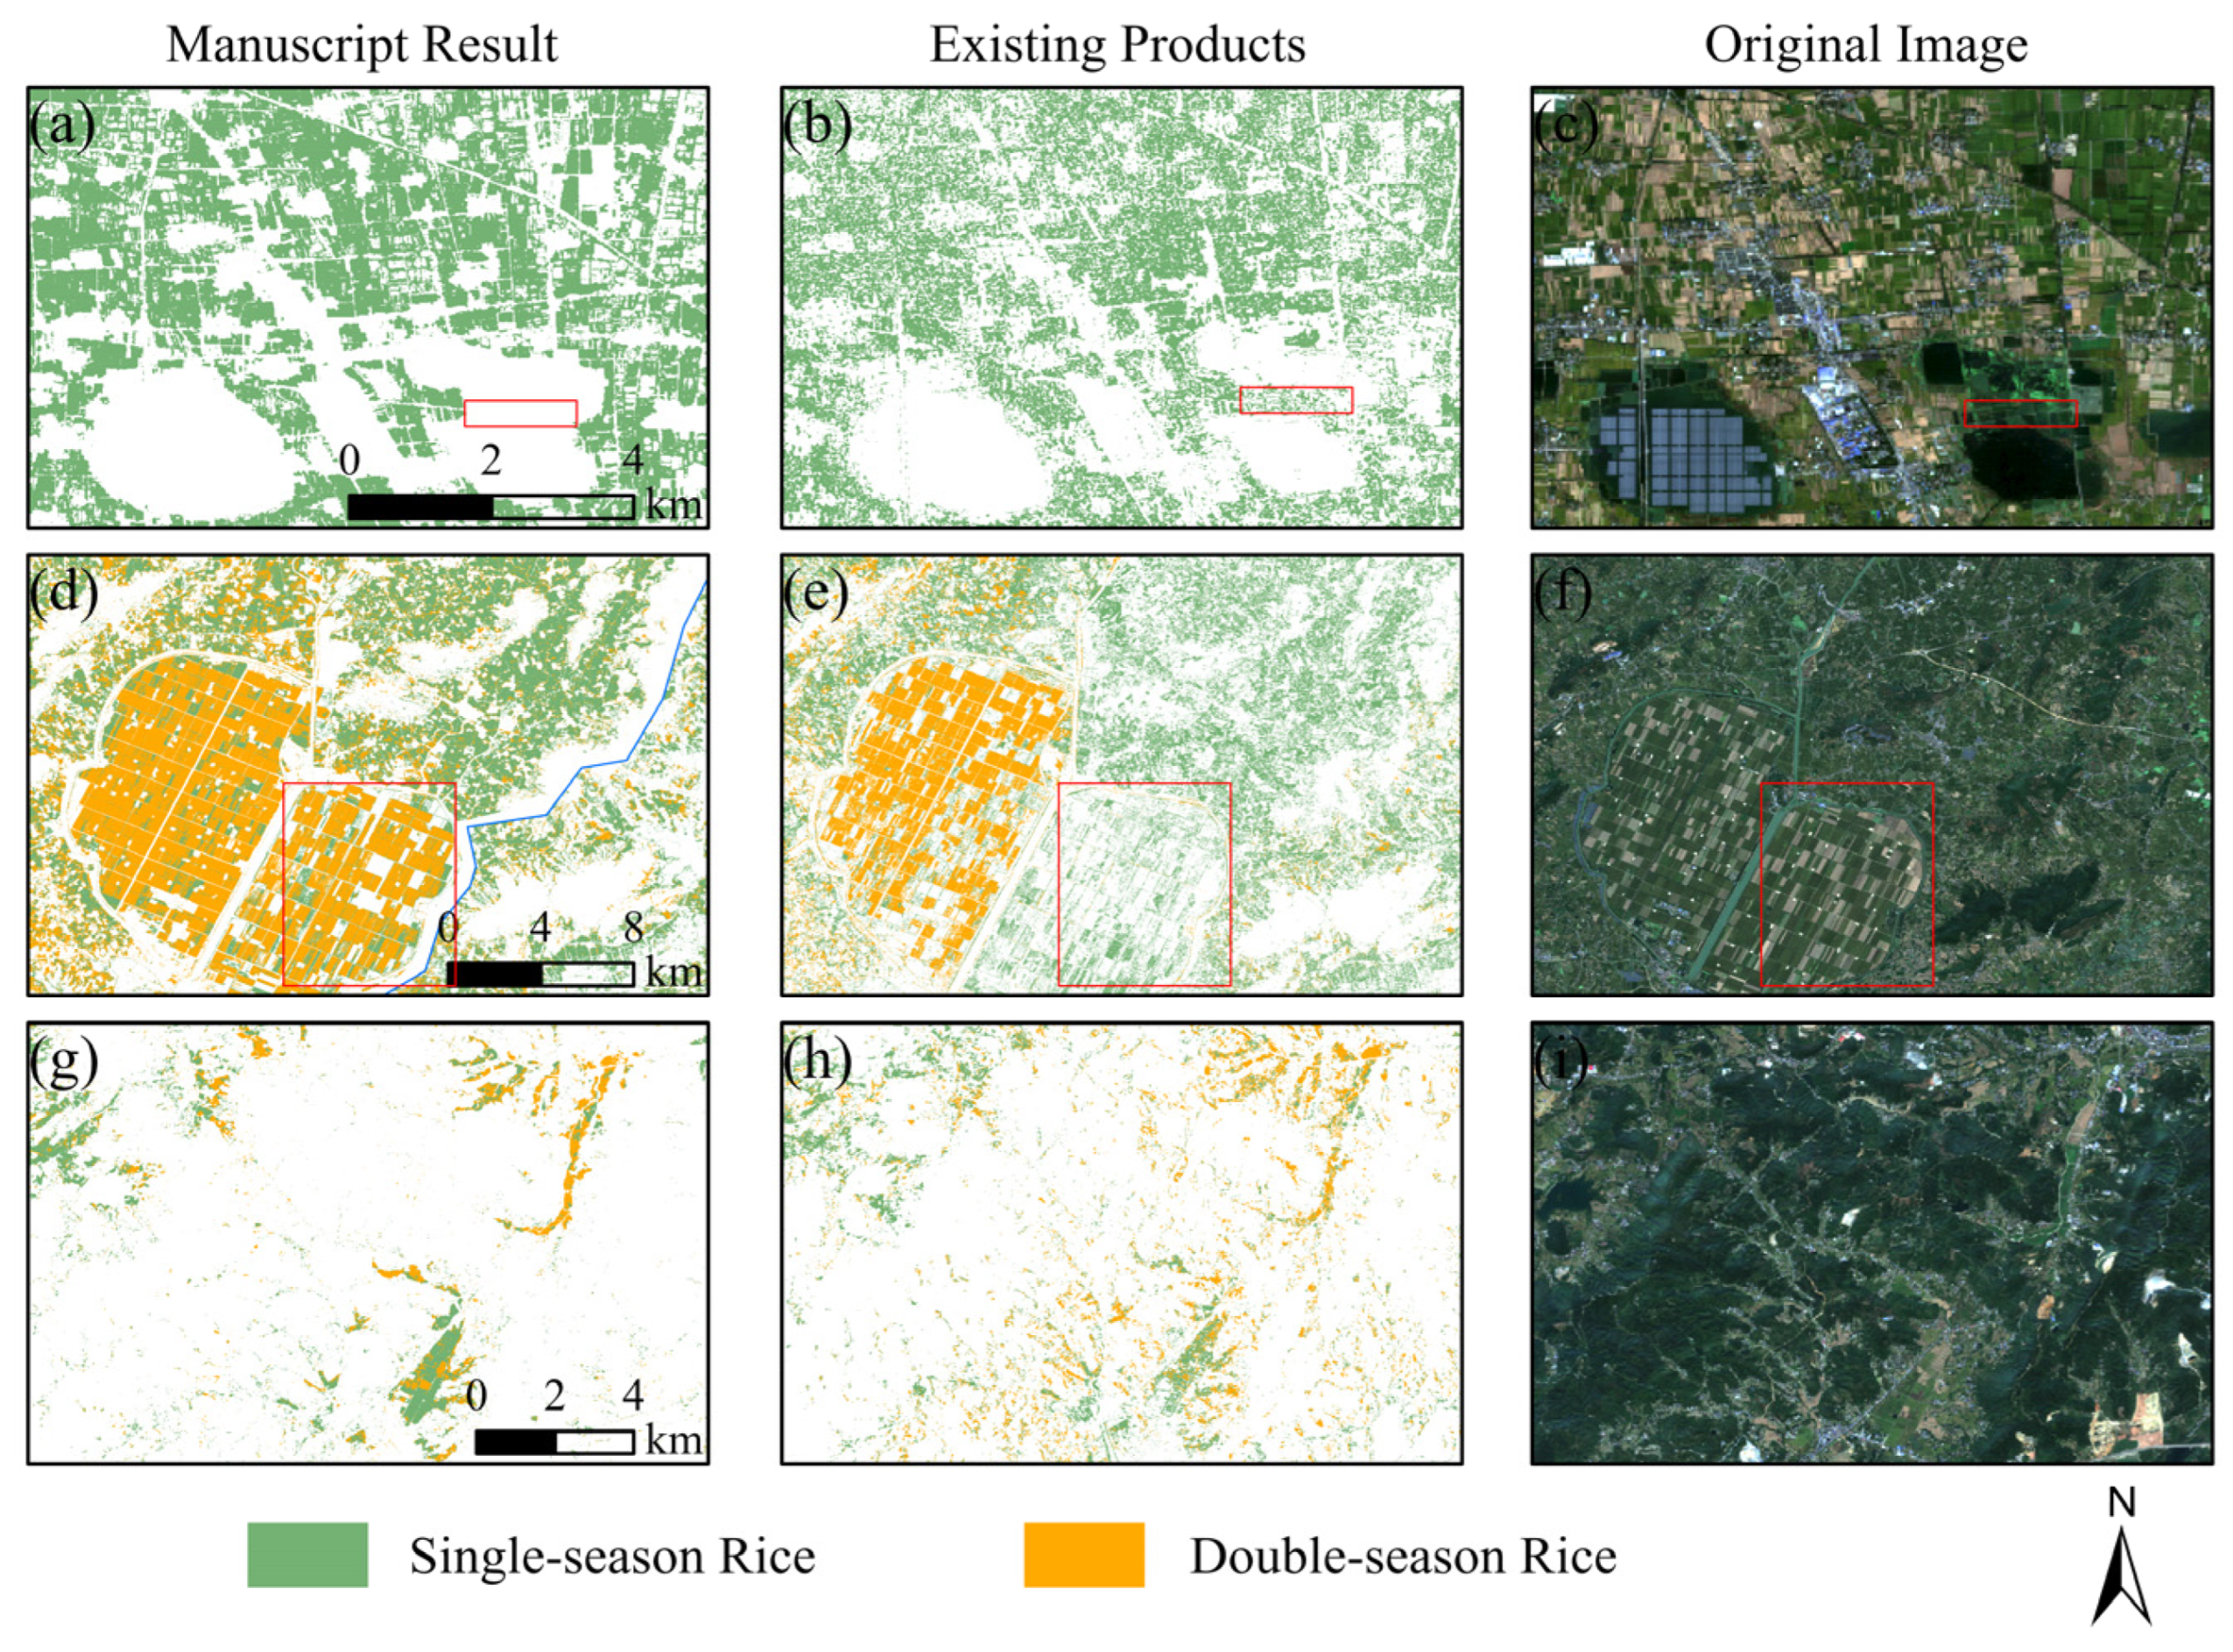
To rigorously assess the performance of the proposed rice classification algorithm in the study, a systematic comparative analysis between our classification results and existing rice distribution products was conducted. The validation set includes three representative regions of different terrains in Anhui Province, such as Huainan City in the north (
Figure 10a–c), Hefei City in the central region (
Figure 10d–f), and Anqing City in the south (
Figure 10g–i). In the Huainan region (
Figure 10a–c), the reference product (
Figure 10b) failed to effectively distinguish between single-season rice and non-rice.
In the soybean cultivation areas marked by red boxes, the reference product misclassified soybeans as single-cropping rice, whereas our results (
Figure 10a) correctly identified these areas as non-rice. In Hefei’s typical double-cropping rice region (
Figure 10d–f), the reference product (
Figure 10e) exhibited significant omission errors in the red-boxed areas, while our results (
Figure 10d) fully captured the actual spatial distribution of double-season rice. For the topographically complex Anqing region (
Figure 10g–i), the reference product (
Figure 10h) performed poorly in both omission errors for large fields and commission errors for small fields, with severe spatial fragmentation. In contrast, our results (
Figure 10g) substantially mitigated these issues, yielding more spatially continuous and structurally complete classifications for both double- and single-cropping rice. The proposed method, which integrates temporal, statistical, phenological, and polarimetric features with a random forest classifier, exhibits strong consistency with the national 10 m resolution reference dataset. Notably, it achieves superior local accuracy and spatial representation capability in mountainous and hilly areas, validating the robustness and adaptability of our approach.
In terms of classification accuracy, compared with existing products, the algorithm proposed in this study increased the classification accuracy of single- and double-season rice by 10.61% in 2019–2020 (
Table 9), highlighting its stronger robustness and improved classification performance.
In order to compare and analyze the accuracy with existing rice mapping classification results, the study selected cities in Anhui Province with rice-planting areas exceeding 1 × 10⁴ ha as the research area and compared the manuscript classification results in 2022 with the PFBPM algorithm [
42] and the rice data of the Anhui Statistical Yearbook 2022 (
Table 10 and
Table 11). As indicated in
Table 10, the proposed algorithm achieves slightly higher overall accuracy than the PFBPM algorithm. However, a combined analysis with
Table 11 reveals that the rice-planting area extracted by the manuscript’s method exhibits significantly lower error rates and higher consistency with the official statistical data. Specifically, the error rate range of this method is 2.62–7.01% (lowest 2.62%, highest 11.49%), which is significantly better than the PFBPM algorithm’s 6.60–11.27%. Especially in six major grain-producing cities such as Huainan and Chuzhou, the error rate of this method is reduced by an average of 3.923% compared to PFBPM, which verifies its superiority in calculating rice area at the provincial level. The comparison results suggest that the classification feature based on spectral time series, statistics, phenology, and polarization characteristics, combined with the random forest classification algorithm, has good transferability and robustness, and can be applied to remote sensing classification mapping tasks for various crop types and different spatial scales.
5. Conclusions
Existing large-scale rice mapping is mainly based on conventional VIS, and there is little in-depth exploration of the differences in phenological characteristics of single- and double-season rice classification. The study proposed an innovative multi-source data fusion framework integrating Sentinel-1 SAR and Sentinel-2 optical imagery. A multi-dimensional feature set incorporating temporal, statistical, phenological, and polarization characteristics was systematically constructed and optimized using recursive feature elimination (RFE). The manuscript evaluated random forest (RF) and gradient boosting decision tree (GBDT) classifiers for paddy rice mapping and utilized the optimal model to generate maps of single-season rice and double-season rice in Anhui Province from 2019 to 2024. The research results show that: (1) HANTS fitting effectively captured paddy rice phenology between single-season rice and double-season rice, improving classification accuracy. The classification framework proposed in this manuscript has relatively stable accuracy in rice mapping in different terrain areas, such as mountains, plains, and hills, with an OA exceeding 92% (Kappa > 0.84). (2) The results confirm superior accuracy over existing products in delineating paddy rice patterns across diverse terrains in Anhui Province. Additionally, a comparative analysis of the PFBPM algorithm was compared with a study in 2022, which revealed an average 3.92% reduction in mapped area for six out of eight major rice-growing cities, suggesting a closer alignment with actual distributions. (3) This study generated high-resolution (10 m) maps of single- and double-season rice from 2019 to 2024 and revealed the significant spatial heterogeneity in paddy rice cultivation drivers across Anhui Province, with distinct dominant factors in topography, climate, and socioeconomic development.
The research results serve as a basis for large-scale, high-precision mapping while facilitating precision agriculture applications, such as precise yield forecasting, production management, and cross-regional planning. Additionally, the generated data are instrumental in optimizing agricultural policies, safeguarding farmland, and ensuring food security. However, constrained by data availability and the scope of the study, the validation and application of the proposed algorithm were primarily confined to Anhui Province. Although the model exhibited robust performance across diverse regions within the province, its generalizability has not yet been fully verified across broader national climate zones (e.g., tropical monsoon or alpine regions) and complex cropping systems (e.g., multi-cropping paddy fields). Consequently, future research should focus on extending and validating the algorithm over wider geographic areas. This entails constructing a cross-regional sample library and incorporating a transfer learning framework to enhance the applicability and stability of the algorithm for large-scale agricultural remote sensing monitoring.



 ,
,