Article

Effects of the Rice–Red Claw Crayfish (Cherax quadricarinatus) Co-Culture System on the Soil Quality in Paddy Fields


1
Wuxi Fisheries College, Nanjing Agricultural University, Wuxi 214081, China
2
Key Laboratory of Integrated Rice-Fish Farming Ecology, Ministry of Agriculture and Rural Affairs, Freshwater Fisheries Research Center, Chinese Academy of Fishery Sciences, Wuxi 214081, China
*
Authors to whom correspondence should be addressed.
These authors contributed equally to this work.
Agriculture 2026, 16(4), 403; https://doi.org/10.3390/agriculture16040403
Submission received: 22 December 2025 / Revised: 4 February 2026 / Accepted: 4 February 2026 / Published: 9 February 2026

Abstract

Soil degradation is closely related to the core issue of food security, making the assessment and monitoring of paddy soil quality particularly important. To clarify the impact of a rice–red claw crayfish co-culture on paddy soil quality, this research established two experimental groups: a rice monoculture and a rice–red claw crayfish co-culture. Using 16S rRNA and 18S rRNA sequencing technologies, we systematically compared soil characteristics, microbial diversity, and community composition under the two modes. Principal component analysis based on a minimum data set was employed to integrate soil property parameters with bacterial and eukaryotic microbial community indicators for a comprehensive assessment of the paddy soil quality index. The results showed that the rice–red claw crayfish co-culture substantially increased soil total nitrogen, available nitrogen, total phosphorus, available potassium, and cation exchange capacity. Simultaneously, the rice–red claw crayfish co-culture significantly influenced the beta diversity and composition of bacterial and eukaryotic microbial communities, significantly increasing the relative abundances of Bacteroidota, Cyanobacteria, Verrucomicrobiota, Arthropoda, Cryptomycota, and Nematoda. The soil quality index under the rice–red claw crayfish co-culture was markedly higher than that under the rice monoculture. In summary, a rice–red claw crayfish co-culture can enhance soil fertility and improve overall soil quality. By incorporating microbial community parameters into the evaluation index system, this study confirms that the rice–red claw crayfish co-culture system is indeed a sustainable agricultural practice, providing a theoretical basis for refining the soil quality assessment framework for rice–aquatic animal-integrated farming systems.

1. Introduction

Against the backdrop of increasingly severe global food insecurity, maintaining the ecological health of agricultural soils, represented by paddy fields, has become a core issue in ensuring the sustainability of agricultural production. Soil quality has evolved from a broad concept to a well-defined indicator that comprehensively reflects the biological, chemical, and physical attributes of soil in maintaining ecosystem functions and services [1,2]. Different agricultural management practices exert significant impacts on soil physicochemical properties. Excessive cultivation often leads to soil erosion and nutrient depletion, triggering ecological degradation and rendering agricultural production systems unsustainable [3,4]. Conversely, conservation agricultural practices, such as rational cropping systems and farming methods, have been demonstrated to effectively improve soil structure, enhance fertility, and increase microbial diversity [5]. With the ongoing refinement and theoretical framing of soil quality indices, soil physical and chemical properties, along with microbial-related indicators, have been adopted to construct a soil quality index (SQI) [6,7,8].
As a vital practice for achieving sustainable agricultural development, integrated rice–aquaculture farming has gained widespread acceptance and has developed in Asia, particularly in China. This model, which combines rice cultivation with aquaculture, establishes a more resilient agroecosystem, enhances resource-use efficiency, and strengthens food production capacity [9,10,11,12]. In 2024, the total area dedicated to integrated rice–aquaculture systems in China reached approximately 3.07 million hectares. The rice–crayfish co-culture (primarily involving Procambarus clarkii) remained the predominant model, constituting 56.46% of the total integrated area. Meanwhile, the rice–red claw crayfish (Cherax quadricarinatus) integrated farming model has been developing rapidly and has emerged as an important production system [13,14]. This integrated system contributes significantly to greenhouse gas mitigation as well as disease risk reduction. Research has shown that converting from a rice monoculture to a rice–red swamp crayfish co-culture system significantly reduces methane and nitrous oxide emissions [15]. Additionally, the rice–red swamp crayfish co-culture system shows a lower carcinogenic risk compared to the rice monoculture group, with reduced heavy metal accumulation in rice grains [16]. Research indicates that this integrated system improves soil nutrient conditions, increases the depth of the permeable water layer in the soil, and alters soil microbial diversity [17,18,19,20]. However, current research on integrated rice–aquaculture systems primarily examines the effects of different farming practices on isolated parameters—such as soil nutrients, enzyme activities, or specific microbial taxa. A systematic assessment that integrates these indicators to evaluate the soil quality index is still lacking.
The red claw crayfish (Cherax quadricarinatus) is among the world’s most economically valuable freshwater crustaceans. Since its introduction to China in the 1990s, it has become an important aquaculture species, primarily reared in ponds. Given its similarities in biological and ecological traits—such as morphological characteristics, environmental adaptability, and physiological habits—to the widely cultivated red swamp crayfish, the red claw crayfish has emerged as a promising candidate for integrated rice–aquaculture systems. However, research on the impacts of rice–red claw crayfish co-culture on paddy soil environments remains relatively scarce. Therefore, this study examined the impact of integrated rice–crayfish farming on soil physicochemical parameters and microbial (bacterial and eukaryotic) communities, employing traditional rice monoculture as a control. The impact of this integrated farming model on soil quality was assessed using the SQI. This research seeks to establish a scientific foundation for optimizing the management strategies of integrated rice–crayfish systems and promoting the sustainable development of paddy field ecosystems.

2. Materials and Methods

2.1. Experimental Site and Design

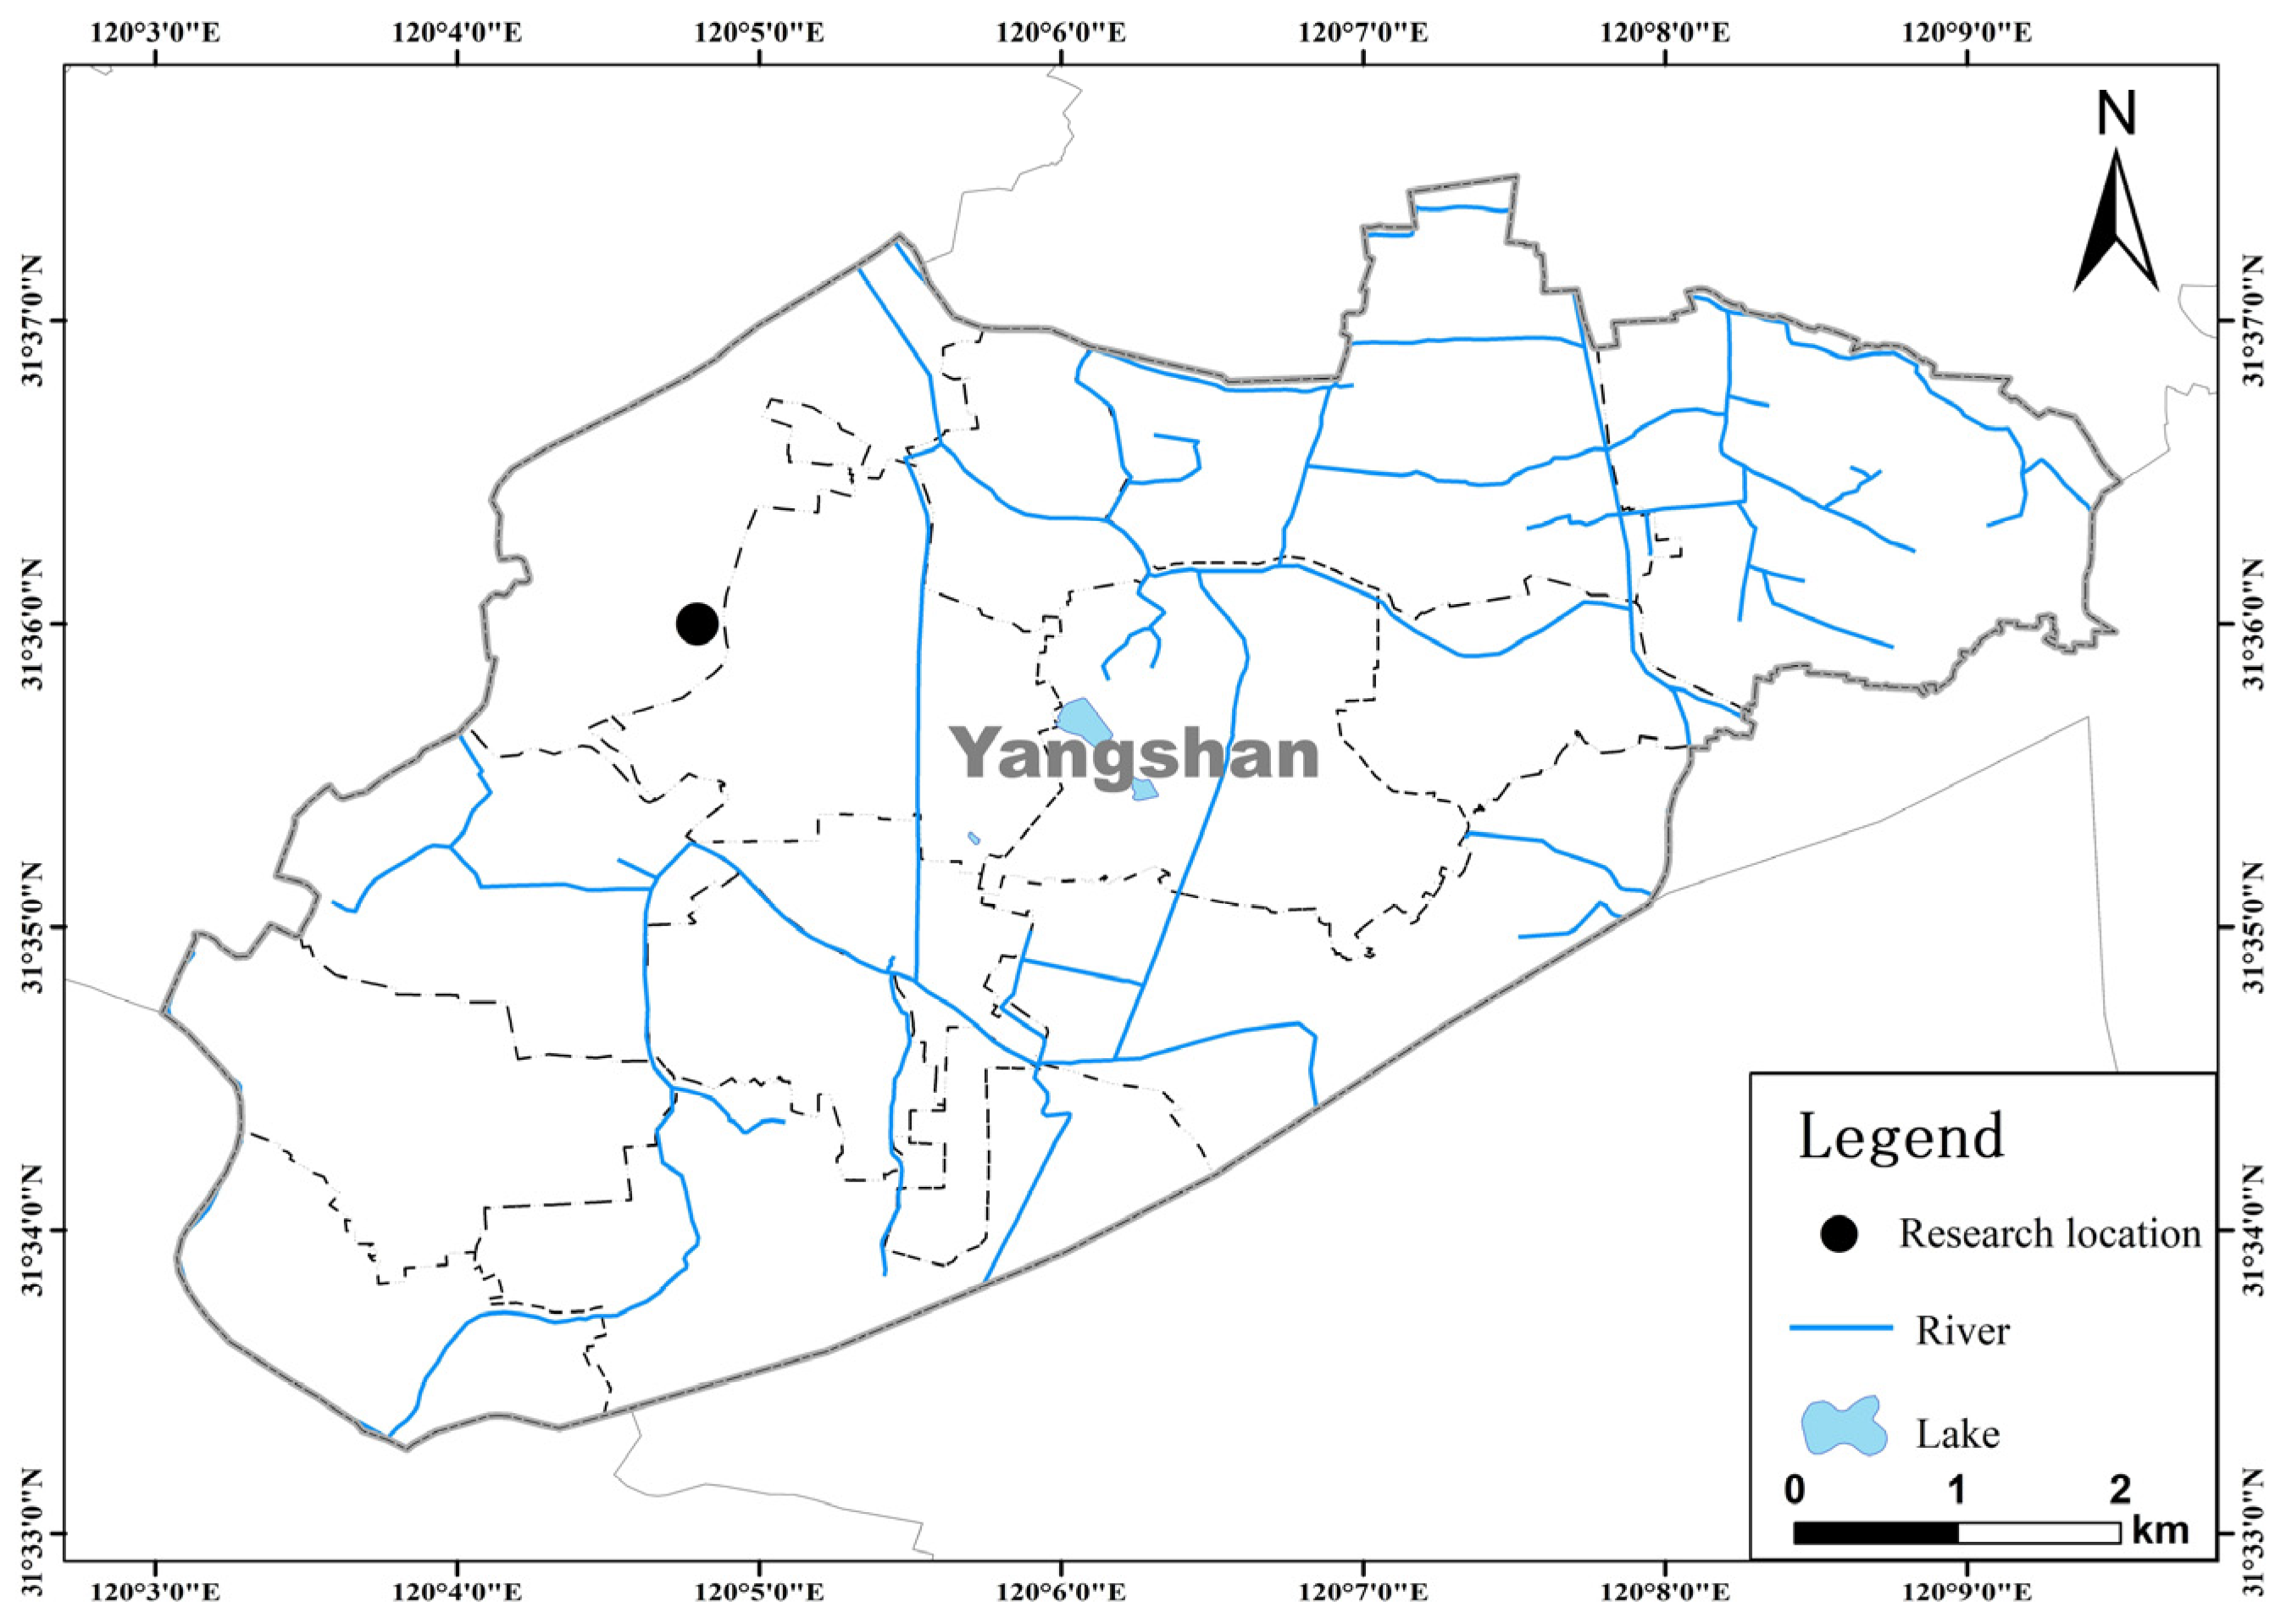
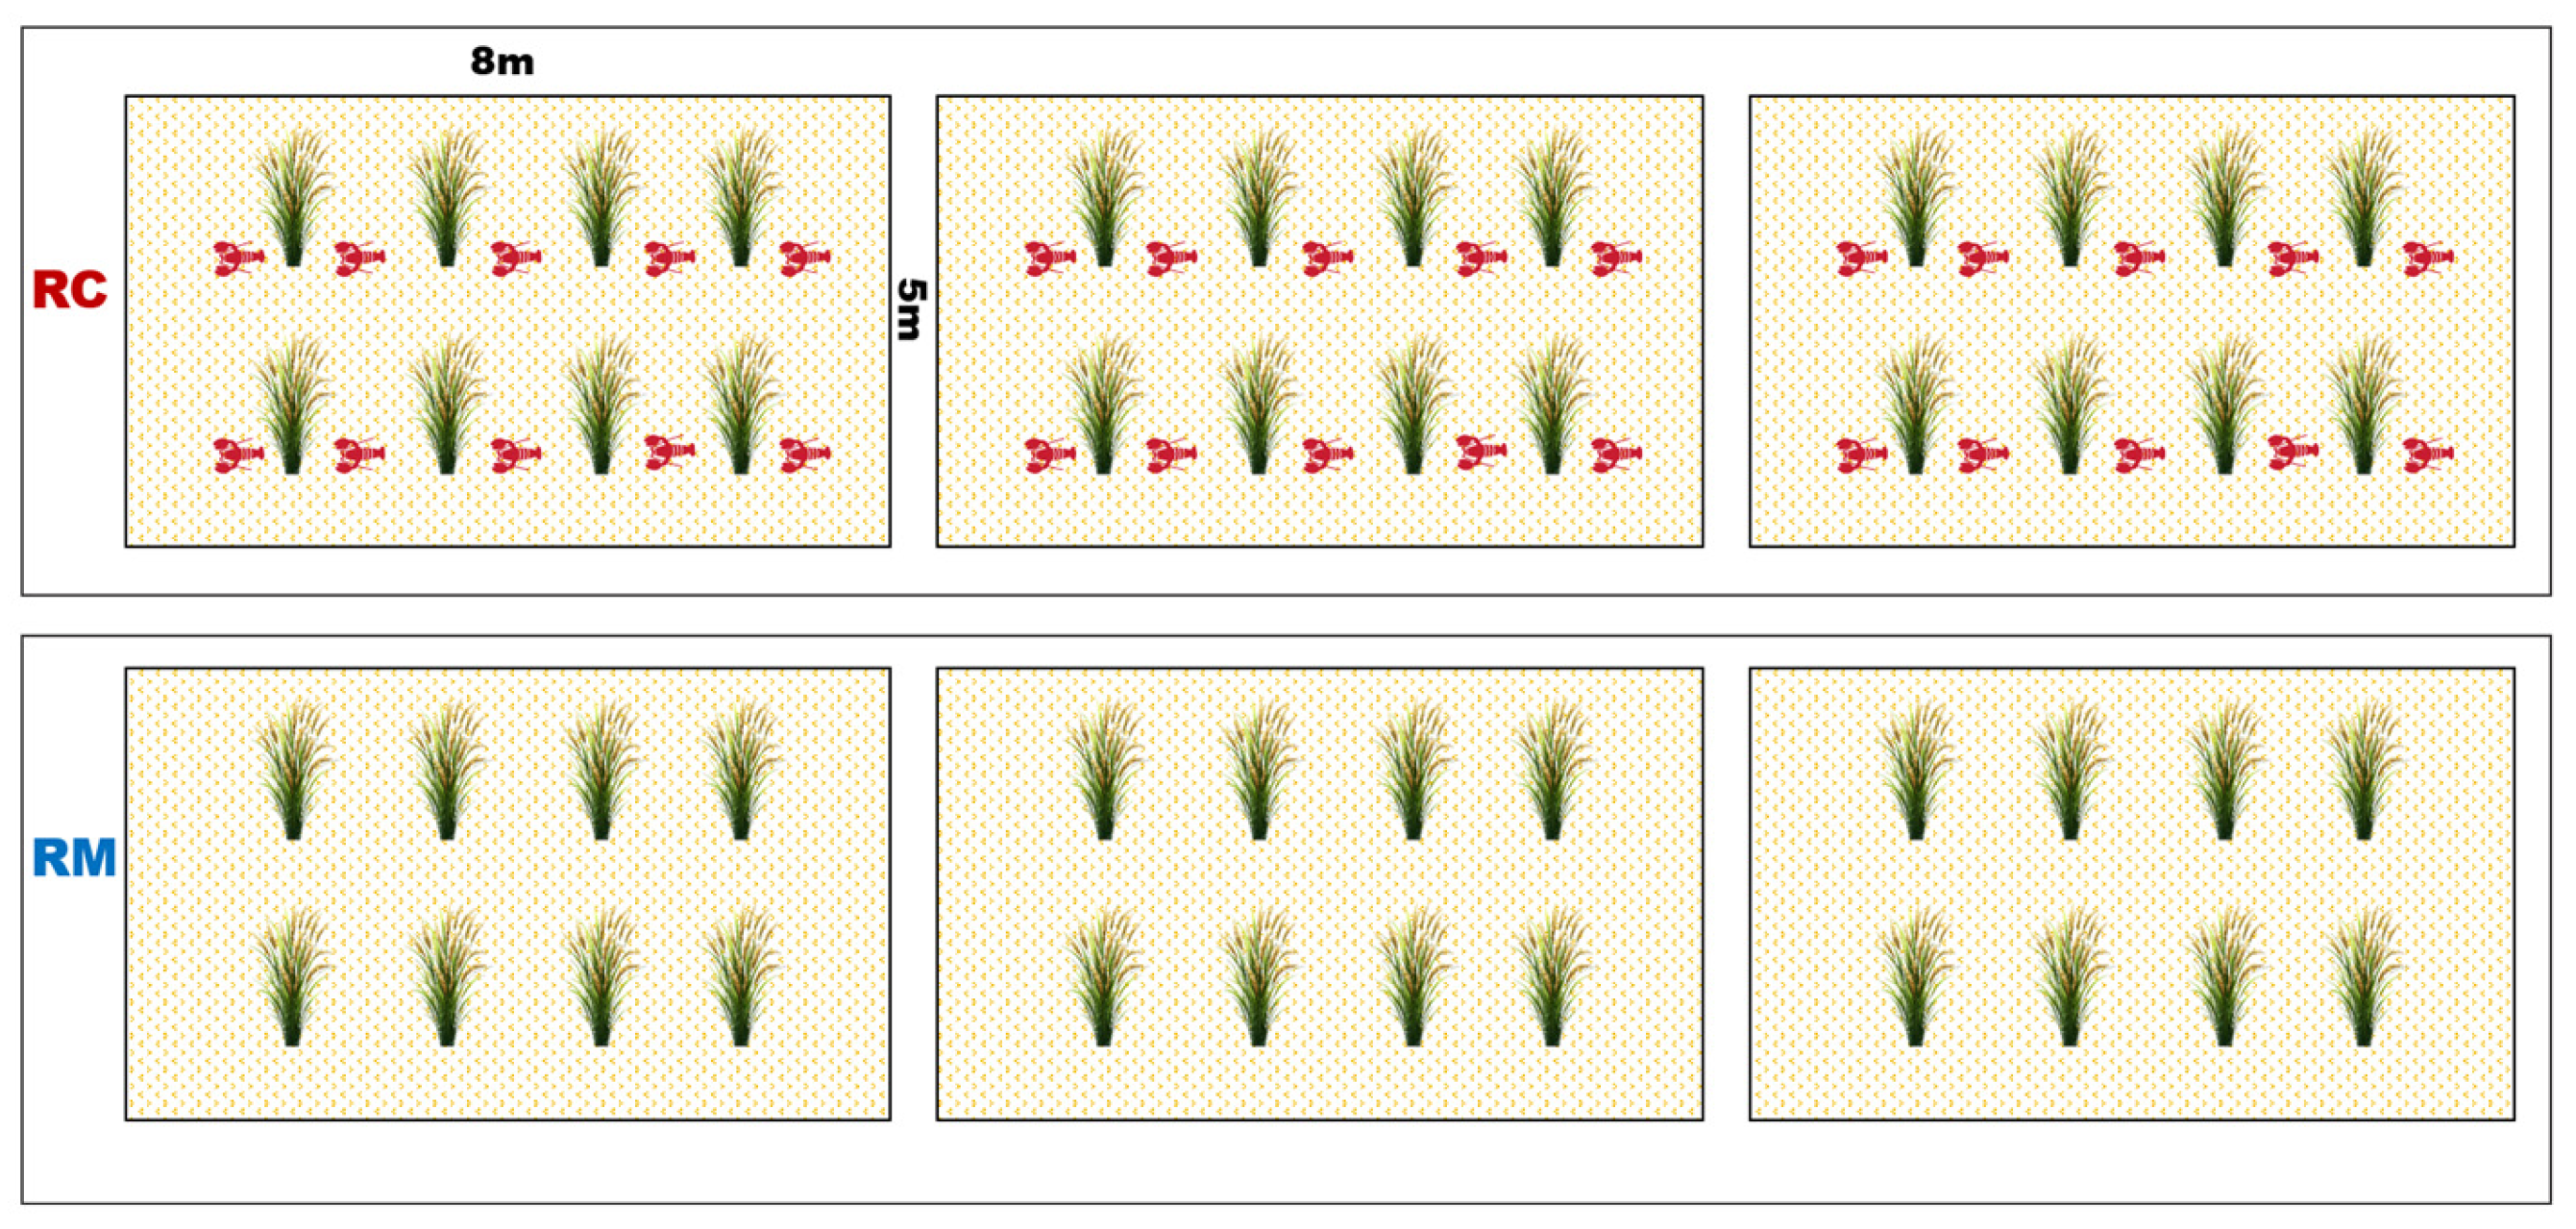
This experiment was conducted in 2024 at the Yangshan Research and Experimental Base (120.08° E, 31.60° N, Wuxi, China) of the Freshwater Fisheries Research Center, Chinese Academy of Fishery Sciences (Figure 1). The study involved six standardized paddy fields, each with an area of 40 m2 (5 m × 8 m). Three fields were designated for rice monoculture (RM), while the other three were used for an integrated rice–red claw crayfish co-culture (RC) system (Figure 2).
The rice variety used in the experiment was Nanjing 5055. This variety was bred by the Institute of Food Crops, Jiangsu Academy of Agricultural Sciences through a cross between ‘Wujing 13’ and ‘Kanto 194’, and was officially approved for release in 2011 (Variety Right Number: CNA20070694.2). It is well-adapted to the regions along the Yangtze River and in southern Jiangsu, China, and has been widely cultivated in these areas. Rice transplantation was carried out on 22 July. Fertilization was carried out with urea and compound fertilizer. Specifically, urea was applied at 150 g per paddy field (40 m2, 3.75 g/m2) on 26 July, followed by a compound fertilizer (N ≥ 15%, P ≥ 6.55%, K ≥ 12.46%; Fengmanlong Biotechnology Co., Ltd., Changsha, China) at 250 g per paddy field (6.25 g/m2) on 28 July. An additional urea application of 500 g per paddy field (12.5 g/m2) was administered on 3 August. The initial fertilizer application was conducted one week after rice transplantation to ensure stable seedling establishment. A second application was then carried out to meet the nutrient demands during the tillering stage.
The water depth was maintained at approximately 20 cm in each experimental paddy through weekly replenishment to compensate for water losses. The water quality parameters of the paddy fields were monitored regularly throughout the experimental period. All measured parameters remained within stable ranges: ammonia-nitrogen concentration, 0.109–0.243 mg/L; nitrite, 0.0056–0.010 mg/L; nitrate, 0.084–0.215 mg/L; total nitrogen (TN), 5.45–9.06 mg/L; and total phosphorus (TP), 0.140–0.422 mg/L.
On 16 August, juvenile red claw crayfish with an average body weight of 20 ± 5 g were introduced into the paddy fields within the RC group at a density of 37.5 g/m2 (2 individuals/m2). Daily feeding of the crayfish was conducted at 17:00. The ration, consisting of commercial feed, was set at 2% of the total body weight. During the experiment, crayfish were randomly sampled and weighed every 10 days, and the feeding rate was adjusted accordingly. The formulated feed for red claw crayfish, produced by Cargill Feed (Zhenjiang, China), contained the following nutritional composition: crude protein ≥ 32.0%, crude fat ≥ 4.0%, crude ash ≤ 20.0%, crude fiber ≤ 11.0%, total phosphorus ≥ 0.8%, moisture ≤ 12.0%, and lysine ≥ 1.50%. Both rice and red claw crayfish were harvested on October 30; the experimental period spanned 101 days, from 22 July to 30 October 2024.

2.2. Sample Collection

Soil samples were collected on 30 October 2024, after rice maturation. In each paddy field, surface soil (5 cm depth) was collected using the five-point sampling method. Three samples were collected from each paddy field, with a total of nine samples per group. One portion of the soil samples was immediately frozen for analysis of soil microbial communities, and the rest was freeze-dried, ground, and passed through a 100-mesh sieve for subsequent chemical property analysis. Additionally, three undisturbed soil cores were collected from each paddy field. After air-drying, these samples were used to determine soil physical properties.

2.3. Soil Physicochemical Property Measurements

Soil ammonium was extracted with potassium chloride and quantified colorimetrically. Ammonium reacts with phenol and hypochlorite under alkaline conditions to form indophenol blue, which is measured at 630 nm. Nitrite was extracted with potassium chloride. Nitrite was diazotized with sulfanilamide under acidic conditions and subsequently coupled with N-(1-naphthyl) ethylenediamine dihydrochloride to form a red azo dye, measured at 543 nm. Nitrate was extracted with potassium chloride. Nitrate in the extract was reduced to nitrite using a cadmium reduction column. The resulting nitrite (representing nitrate + original nitrite) was measured as described above. Nitrate concentration was calculated by subtracting the independently measured nitrite concentration. Total nitrogen (TN) was determined by the Kjeldahl method [21], and available nitrogen (AN) by the sodium hydroxide hydrolysis method [22]. Available phosphorus (AP) was measured using the sodium hydrogen carbonate solution-Mo-Sb anti-spectrophotometric method [23]. Available soil silicon was determined by extraction with citric acid, followed by reaction with molybdate reagent, reduction using ascorbic acid, and final colorimetric measurement. Soil pH was determined using the potentiometric method [24]. Soil organic matter (OM) was determined by oxidizing organic carbon with a quantitative potassium dichromate-sulfuric acid solution under heating on an electric sand bath. The excess dichromate was titrated with a standard ferrous sulfate solution, using a silicon dioxide-added sample as a reagent blank for calibration. The organic carbon content was calculated from the amount of dichromate consumed during oxidation and then multiplied by the conventional factor of 1.724 to obtain OM content. Available potassium (AK) was extracted with a neutral 1 mol/L ammonium acetate solution and determined by flame photometry. Total phosphorus (TP) was measured by the alkali fusion-molybdenum-antimony anti-spectrophotometry method. The aforementioned measurements were conducted in accordance with Chinese testing standards [25,26,27,28,29,30,31,32]. Available zinc was extracted using the diethylenetriaminepentaacetic acid (DTPA) method [33]. Cation exchange capacity (CEC) was determined according to the cobalt hexammine trichloride spectrophotometric method [34]. Available selenium was measured by hydride generation-atomic fluorescence spectrometry [35]. Microbial biomass carbon (MBC) and microbial biomass nitrogen (MBN) were determined according to the chloroform fumigation-extraction method [36]. Amino sugars were quantified using gas chromatography [37]. Based on mechanically determined soil composition data obtained through standard methods, the aggregate mean weight diameter (MWD) was calculated according to established protocols [38,39].

2.4. DNA Extraction, PCR Amplification, and Sequencing

Microbial DNA was extracted from soil samples using the E.Z.N.A.® Soil DNA Kit (Omega Bio-tek, Norcross, GA, USA). The V3–V4 hypervariable region of the bacterial 16S rRNA gene was amplified with the primers 341F (5′-CCTAYGGGRBGCASCAG-3′) and 806R (5′-GGACTACNNGGGTATCTAAT-3′). 18S rRNA of microeukaryotes was amplified using the primers TAReuk454FWD1 (5′-CCAGCASCYGCGGTAATTCC-3′) and TAReukREV3 (5′-ACTTTCGTTCTTGATYRA-3′). Purified PCR products were used to construct next-generation sequencing (NGS) libraries, which were sequenced on the DNBSEQ-G99 platform at BGI (MGI Tech Co., Ltd., Shenzhen, China), with sequencing services provided by Shanghai Biozeron Biotechnology Co., Ltd (Shanghai, China).
Raw sequencing reads were quality-controlled using FASTP version 0.20.0 and assembled with FLASH version 1.2.11, with a minimum overlap length of 10 bp and a maximum mismatch rate of 2% [40,41]. After removing duplicates, the DADA2 algorithm in QIIME 2 was employed to detect insertion-deletion and substitution errors and to define amplicon sequence variants (ASVs). Prior to this, paired-end reads were subjected to trimming and quality filtering, with a stringent maximum expected error (maxEE) threshold set at ≤2. Bacterial and eukaryotic microbial ASVs were assigned taxonomic classifications against the SILVA and NCBI nt databases, respectively.

2.5. Bioinformatic Analysis

The alpha diversity of soil microbial communities was evaluated by calculating the Chao1, Pielou_J, Simpson, and Shannon indices. Principal coordinate analysis (PCoA) was performed to visualize beta diversity based on Bray–Curtis distance matrices [42]. Furthermore, differences between the RM and RC groups were examined for the relative abundance of bacterial and microeukaryotic phyla and for microbial diversity indices, which were applied using independent sample t-tests (p < 0.05).

2.6. Construction of Soil Quality Index Assessment System

The evaluation of the SQI using the minimum data set (MDS) method primarily involves three steps: (1) construction of an MDS, (2) transformation and weighting of indicators, and (3) determination of the SQI [43]. Through PCA, multiple indicators are transformed into a smaller set of indicators to construct the MDS. First, principal components (PCs) having eigenvalues of at least 1 were retained [44]. Following this, variables with absolute loadings exceeding 0.5 on retained PCs were grouped. For indicators that cross-loaded (absolute loading ≥0.5 on multiple PCs), a secondary criterion was applied: only loadings within 10% of the indicator’s maximum were considered for retention. Subsequently, correlation analysis was performed among the indicators within each group. When indicators have a correlation coefficient of less than 0.5, they should be retained for inclusion in the MDS. If the correlation coefficient is ≥0.5, the comprehensive loading (norm value) of each indicator across all PCs is calculated, and the indicator with the highest absolute loading on each PC or those within 10% of the maximum norm value is selected [45]. Norm values were applied in the indicator screening process to minimize the omission of ecologically relevant data [7,46]. It was calculated using the following formula:
N i k = i = 1 k U i k 2 λ k
where Nik is the comprehensive loading value of the ith variable on the first k PCs with eigenvalues >1; Uik represents the loading of the ith variable on the kth PC; λk is the eigenvalue of the kth PC.
Finally, the indicators in the MDS undergo an additional correlation check. If the correlation between any two indicators exceeds 0.7, one of them is replaced with an alternative indicator from the same PC, resulting in the final MDS.
To standardize indicators with different units and scales, nonlinear scoring functions are applied to transform the indicator values into a unified 0–1 range, facilitating comparative evaluation [47]. These functions are designed to account for three types of responses: “more is better,” “less is better,” and “optimal range.” The function expressions are as follows:
f ( x ) = { 0.1                                           , x x 1 0.1 + 0.9 × x x 1 x 2 x 1 , x 1 < x < x 2 1                                               , x x 2
f ( x ) = { 1                                           , x x 1 1 0.9 × x x 1 x 2 x 1 , x 1 < x < x 2 0.1                                   , x x 2
where x1 denotes the minimum value of the indicator, x2 represents the maximum value of the indicator, and x corresponds to any given value of the indicator.
The weights for the MDS indicators were determined by their communality in the PCA. The communality-based weight for each indicator was calculated as its communality divided by the sum of the communalities of all indicators included in the MDS. Each PC explains a portion of the total variance in the data set. The percentage of total variance explained by all PCs with eigenvalues greater than 1 was used to derive the PCA-variance-based weights [7]. Finally, the SQI, as a composite construct, was quantified by applying the formula [48]:
S Q I = i = 1 n W i S i
where SQI represents the comprehensive soil quality evaluation index. n represents the number of evaluation parameters. Wi represents the weight value of the ith indicator. Si represents the transformed score for the ith evaluation indicator following the nonlinear normalization. The SQI is a numerical value ranging from 0 to 1, where a value closer to 1 indicates better soil quality.
To quantify the influence of the selected indicators, the contribution of the MDS to the SQI was evaluated. Contribution to the soil quality index refers to the proportion of an individual indicator’s score in the total SQI. According to its calculation formula, the SQI is defined as the sum of the scores of all indicators within the MDS.

2.7. Statistical Analysis

Experimental data from all trials were first organized and processed in Microsoft Excel 2019 for subsequent statistical examination. Subsequent statistical analyses were conducted with SPSS 27 (SPSS Inc., Chicago, IL, USA). Independent sample t-tests were employed to assess the statistically significant differences in soil physicochemical indicators and the final SQI between groups (p < 0.05). Furthermore, PCA was performed specifically on the set of soil physicochemical indicators to reduce dimensionality and identify key variables. Correlation analyses among these soil indicators were carried out using Pearson’s method. All figures were subsequently plotted using GraphPad Prism 9 (GraphPad Software, San Diego, CA, USA) and Origin (OriginLab, Northampton, MA, USA).

3. Results

3.1. Physical, Chemical, and Biological Indicators of Paddy Soil

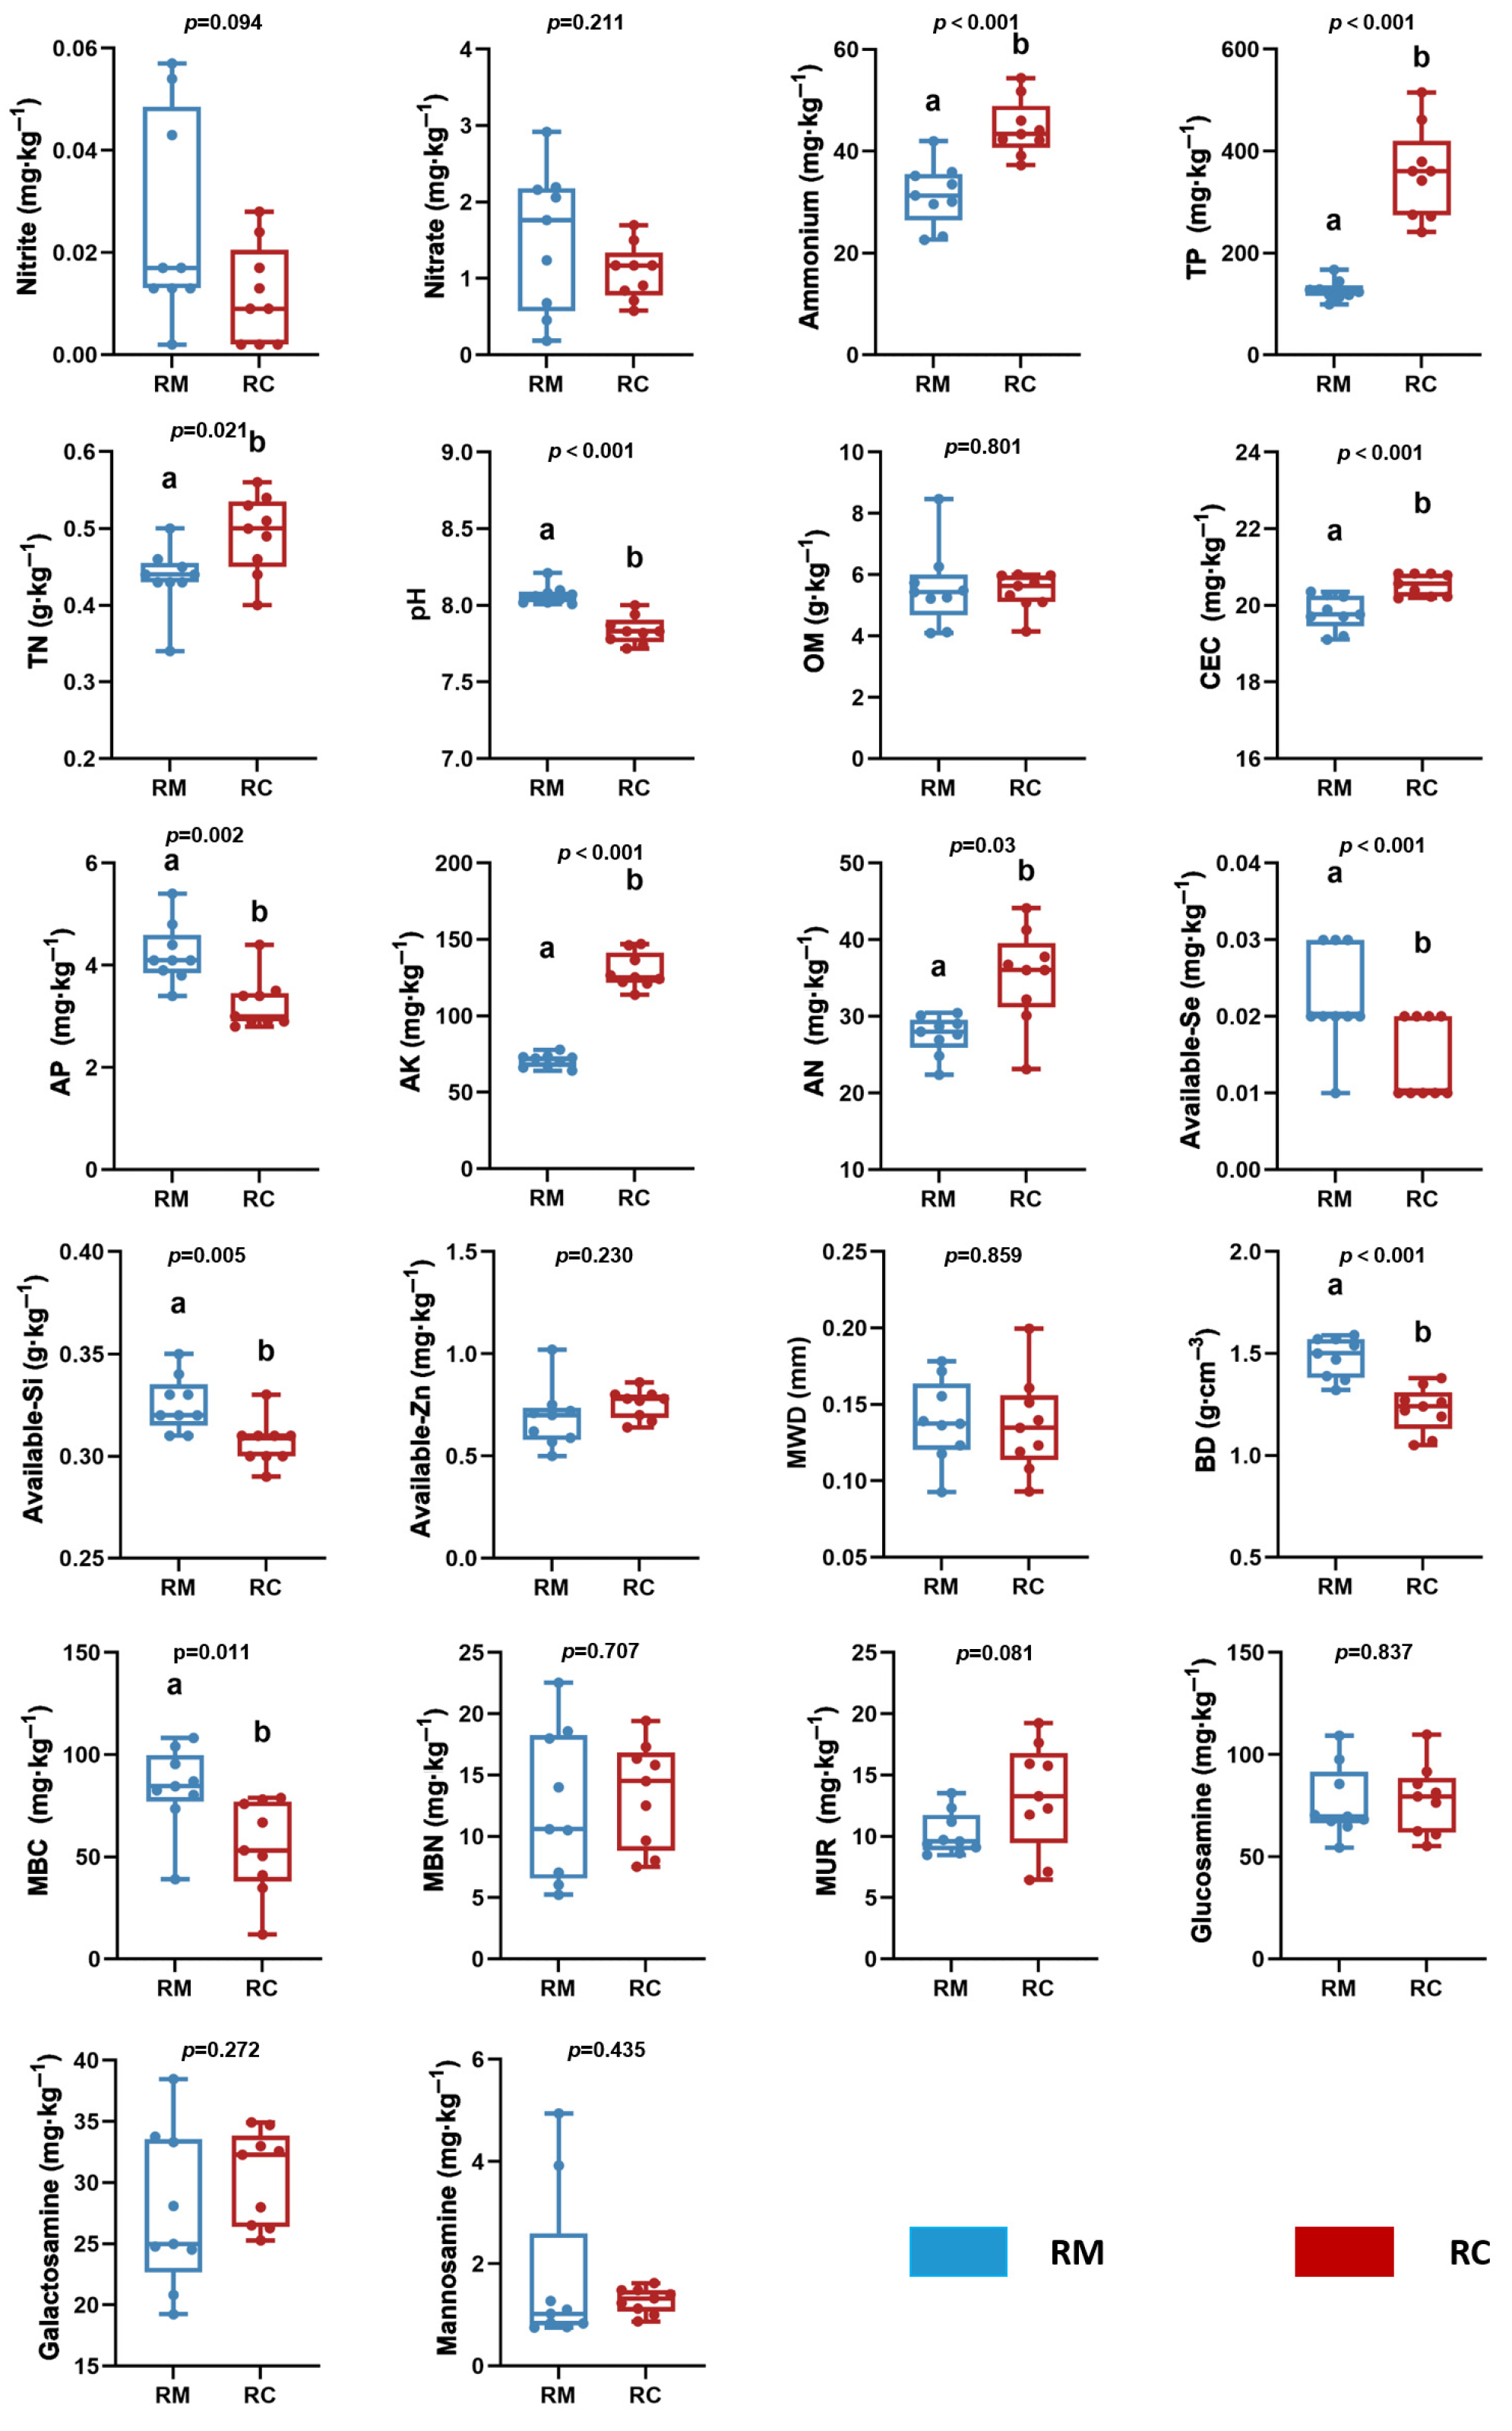
The RC and RM paddy soil groups exhibited significant differences in several physicochemical and biological parameters, including ammonium nitrogen (p < 0.001), TN (p = 0.021), AN (p = 0.03), TP (p < 0.001), AP (p = 0.002), AK (p < 0.001), available Se (p = 0.015), available Si (p = 0.005), CEC (p < 0.001), pH (p < 0.001), MBC (p = 0.011), and BD (p < 0.001) (Figure 3). Specifically, the concentrations of ammonium nitrogen, TN, AN, TP, AK, and CEC were considerably higher in the RC group than in the RM group. In contrast, the levels of AP, available Se, available Si, pH, and MBC, as well as the value of BD, were significantly higher in the RM group than in the RC group (Figure 3).

3.2. Bacterial Communities in Paddy Soils

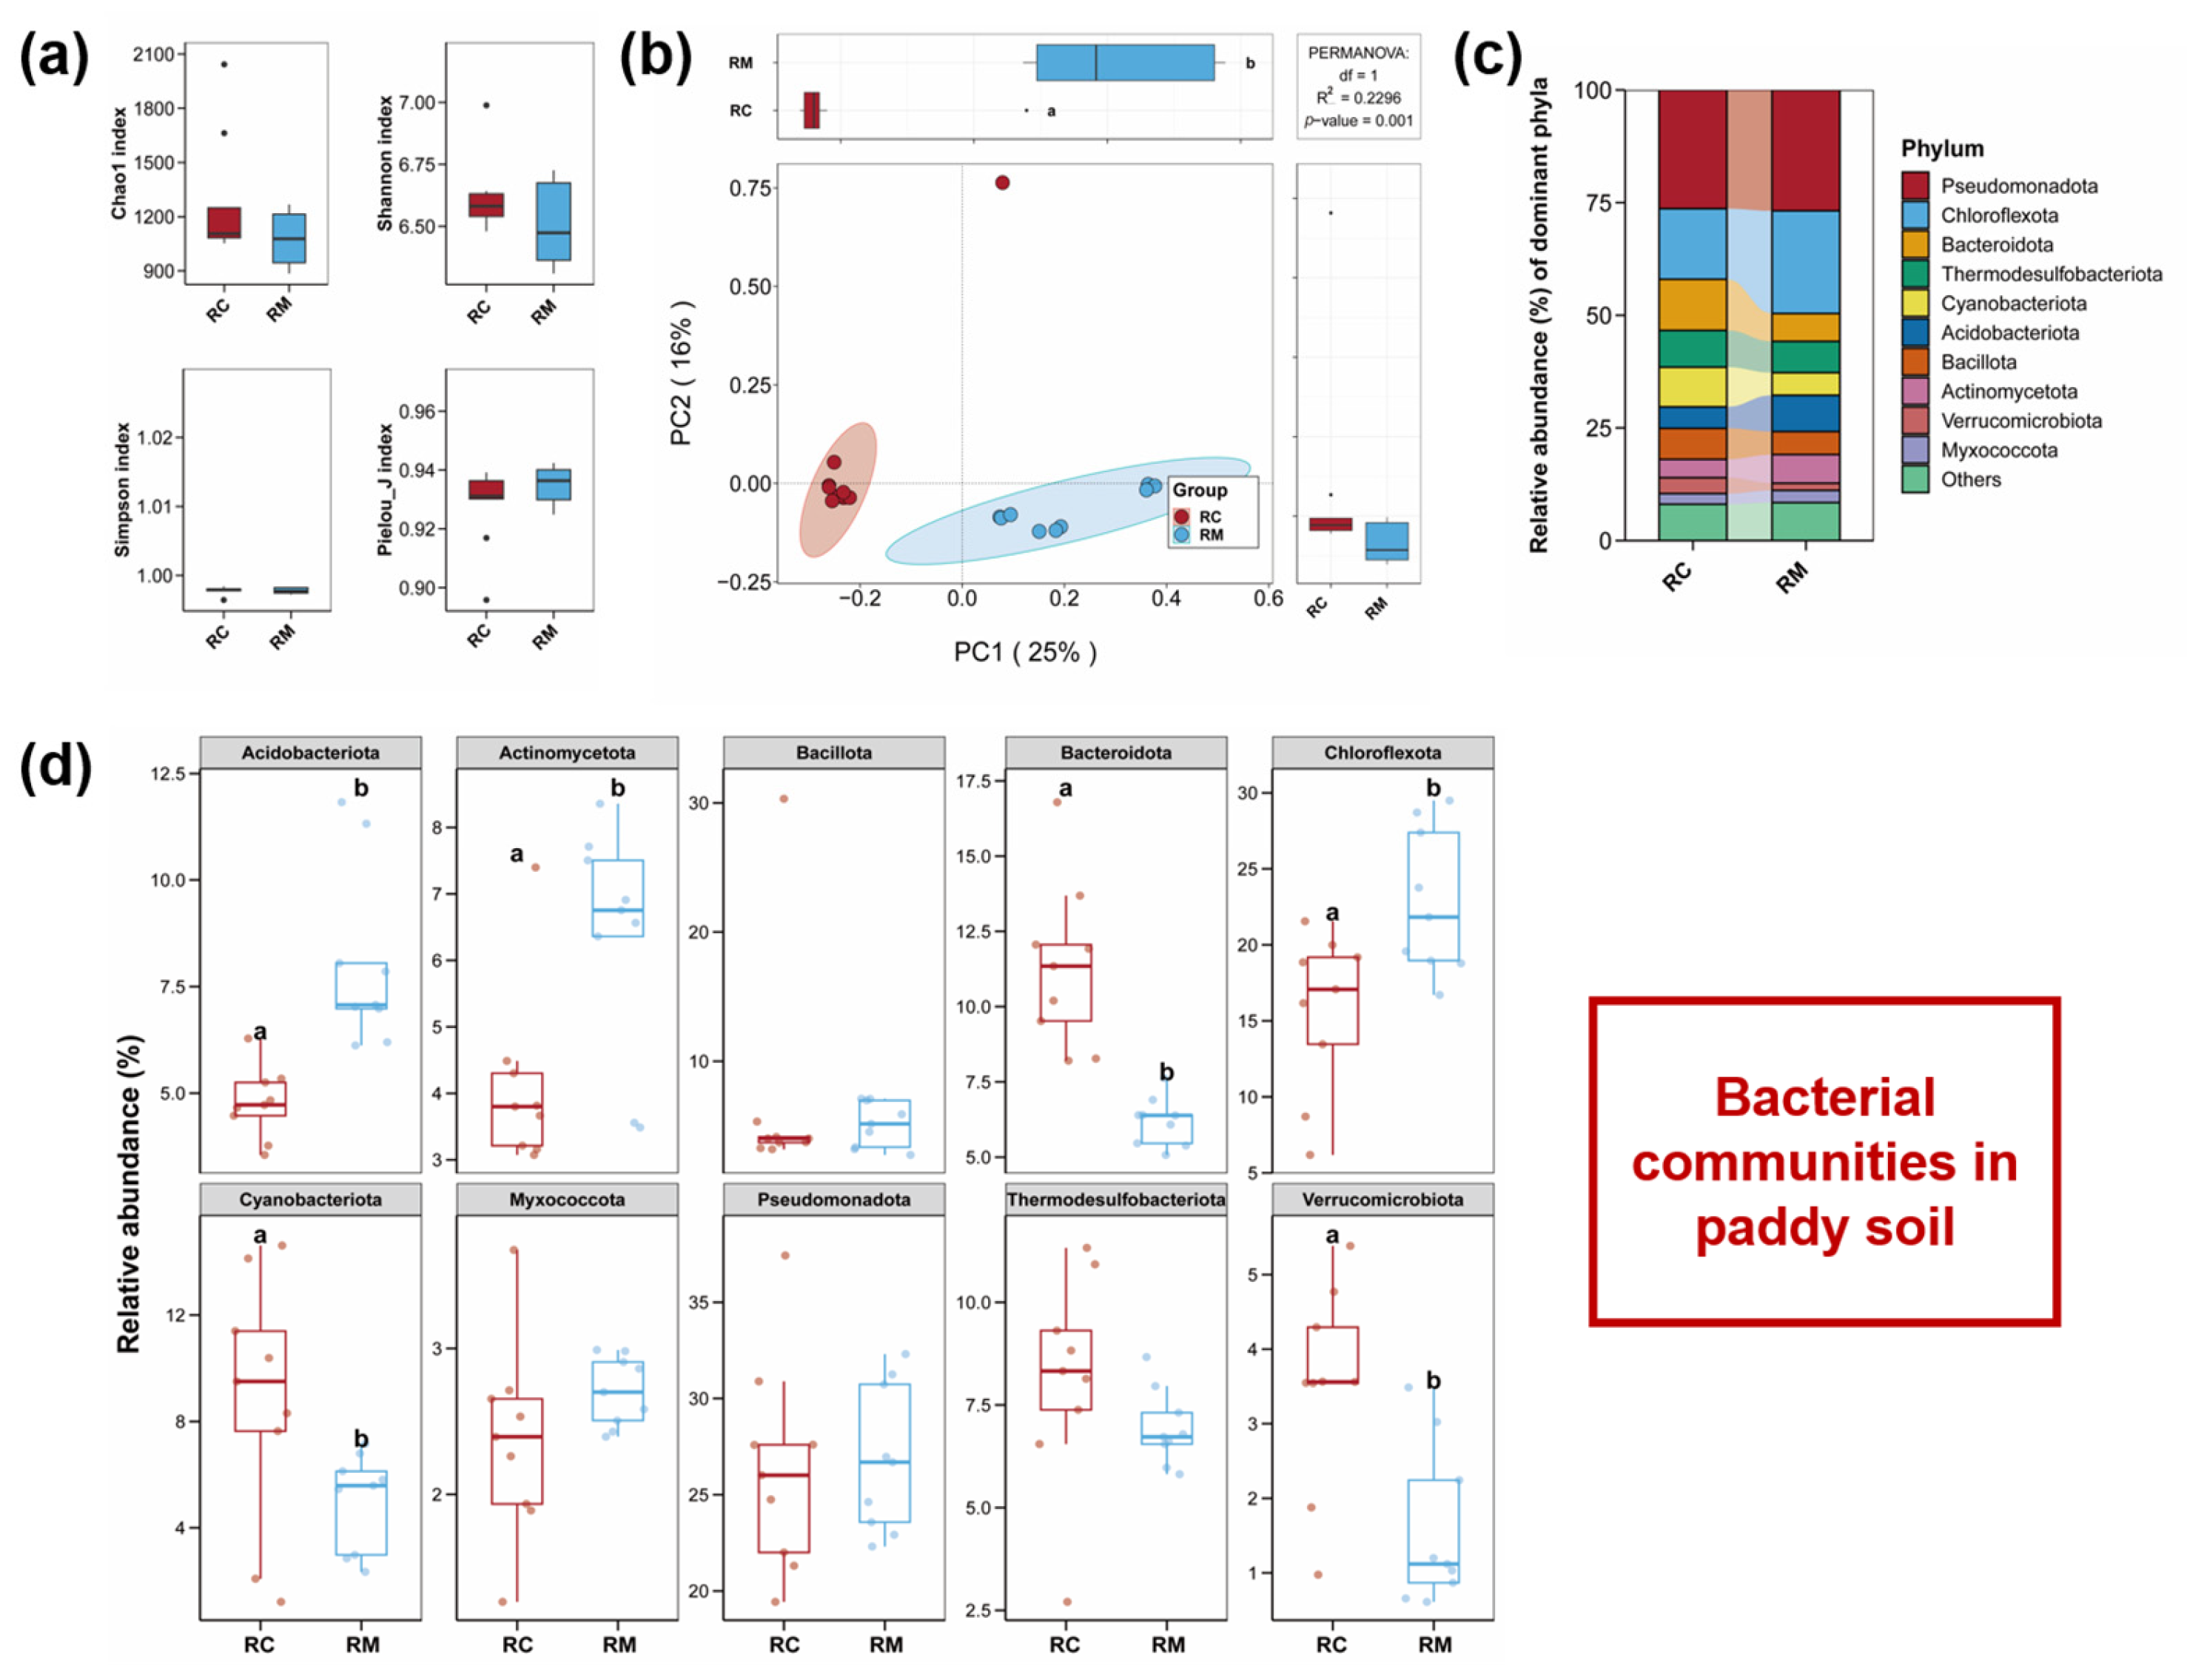
The alpha diversity indices of soil bacteria, including Chao1, Shannon, Simpson, and Pielou_J, did not show statistically significant differences between the RC and RM groups (Figure 4a, Table S4). No pronounced differences in alpha diversity indices were detected between the two groups (p > 0.05). In contrast, the PCoA ordination demonstrated a distinct separation of bacterial communities between groups along the PC1 axis. PC1 and PC2 explained 25.54% and 16.68% of the total variance in community structure, respectively. Permutational multivariate analysis of variance (PERMANOVA) further confirmed a marked difference in bacterial community composition between the RC and RM groups paddy soils (p = 0.001, p < 0.05) (Figure 4b).
The dominant bacterial community in the RC group paddy soil at the phylum level consisted of the following ten phyla: Pseudomonadota, Chloroflexota, Bacteroidota, Thermodesulfobacteriota, Cyanobacteriota, Acidobacteriota, Bacillota, Actinomycetota, Verrucomicrobiota, and Myxococcota (Figure 4c). Although an identical set of dominant phyla was identified in both paddy soils, dramatic differences were observed in their relative abundances between the two groups (Figure 4d). Statistical analysis revealed marked differences in the relative abundances of six phyla: Acidobacteriota, Actinomycetota, Bacteroidota, Chloroflexota, Cyanobacteriota, and Verrucomicrobiota. Among these, Acidobacteriota (p < 0.001), Actinomycetota (p = 0.007), and Chloroflexota (p = 0.008) were considerably more abundant in the RM group than in RC group (p < 0.05). Conversely, Bacteroidota (p < 0.001), Cyanobacteriota (p = 0.038), and Verrucomicrobiota (p = 0.004) were significantly enriched in the RC group compared to the RM group.

3.3. Microeukaryotic Communities in Paddy Soils

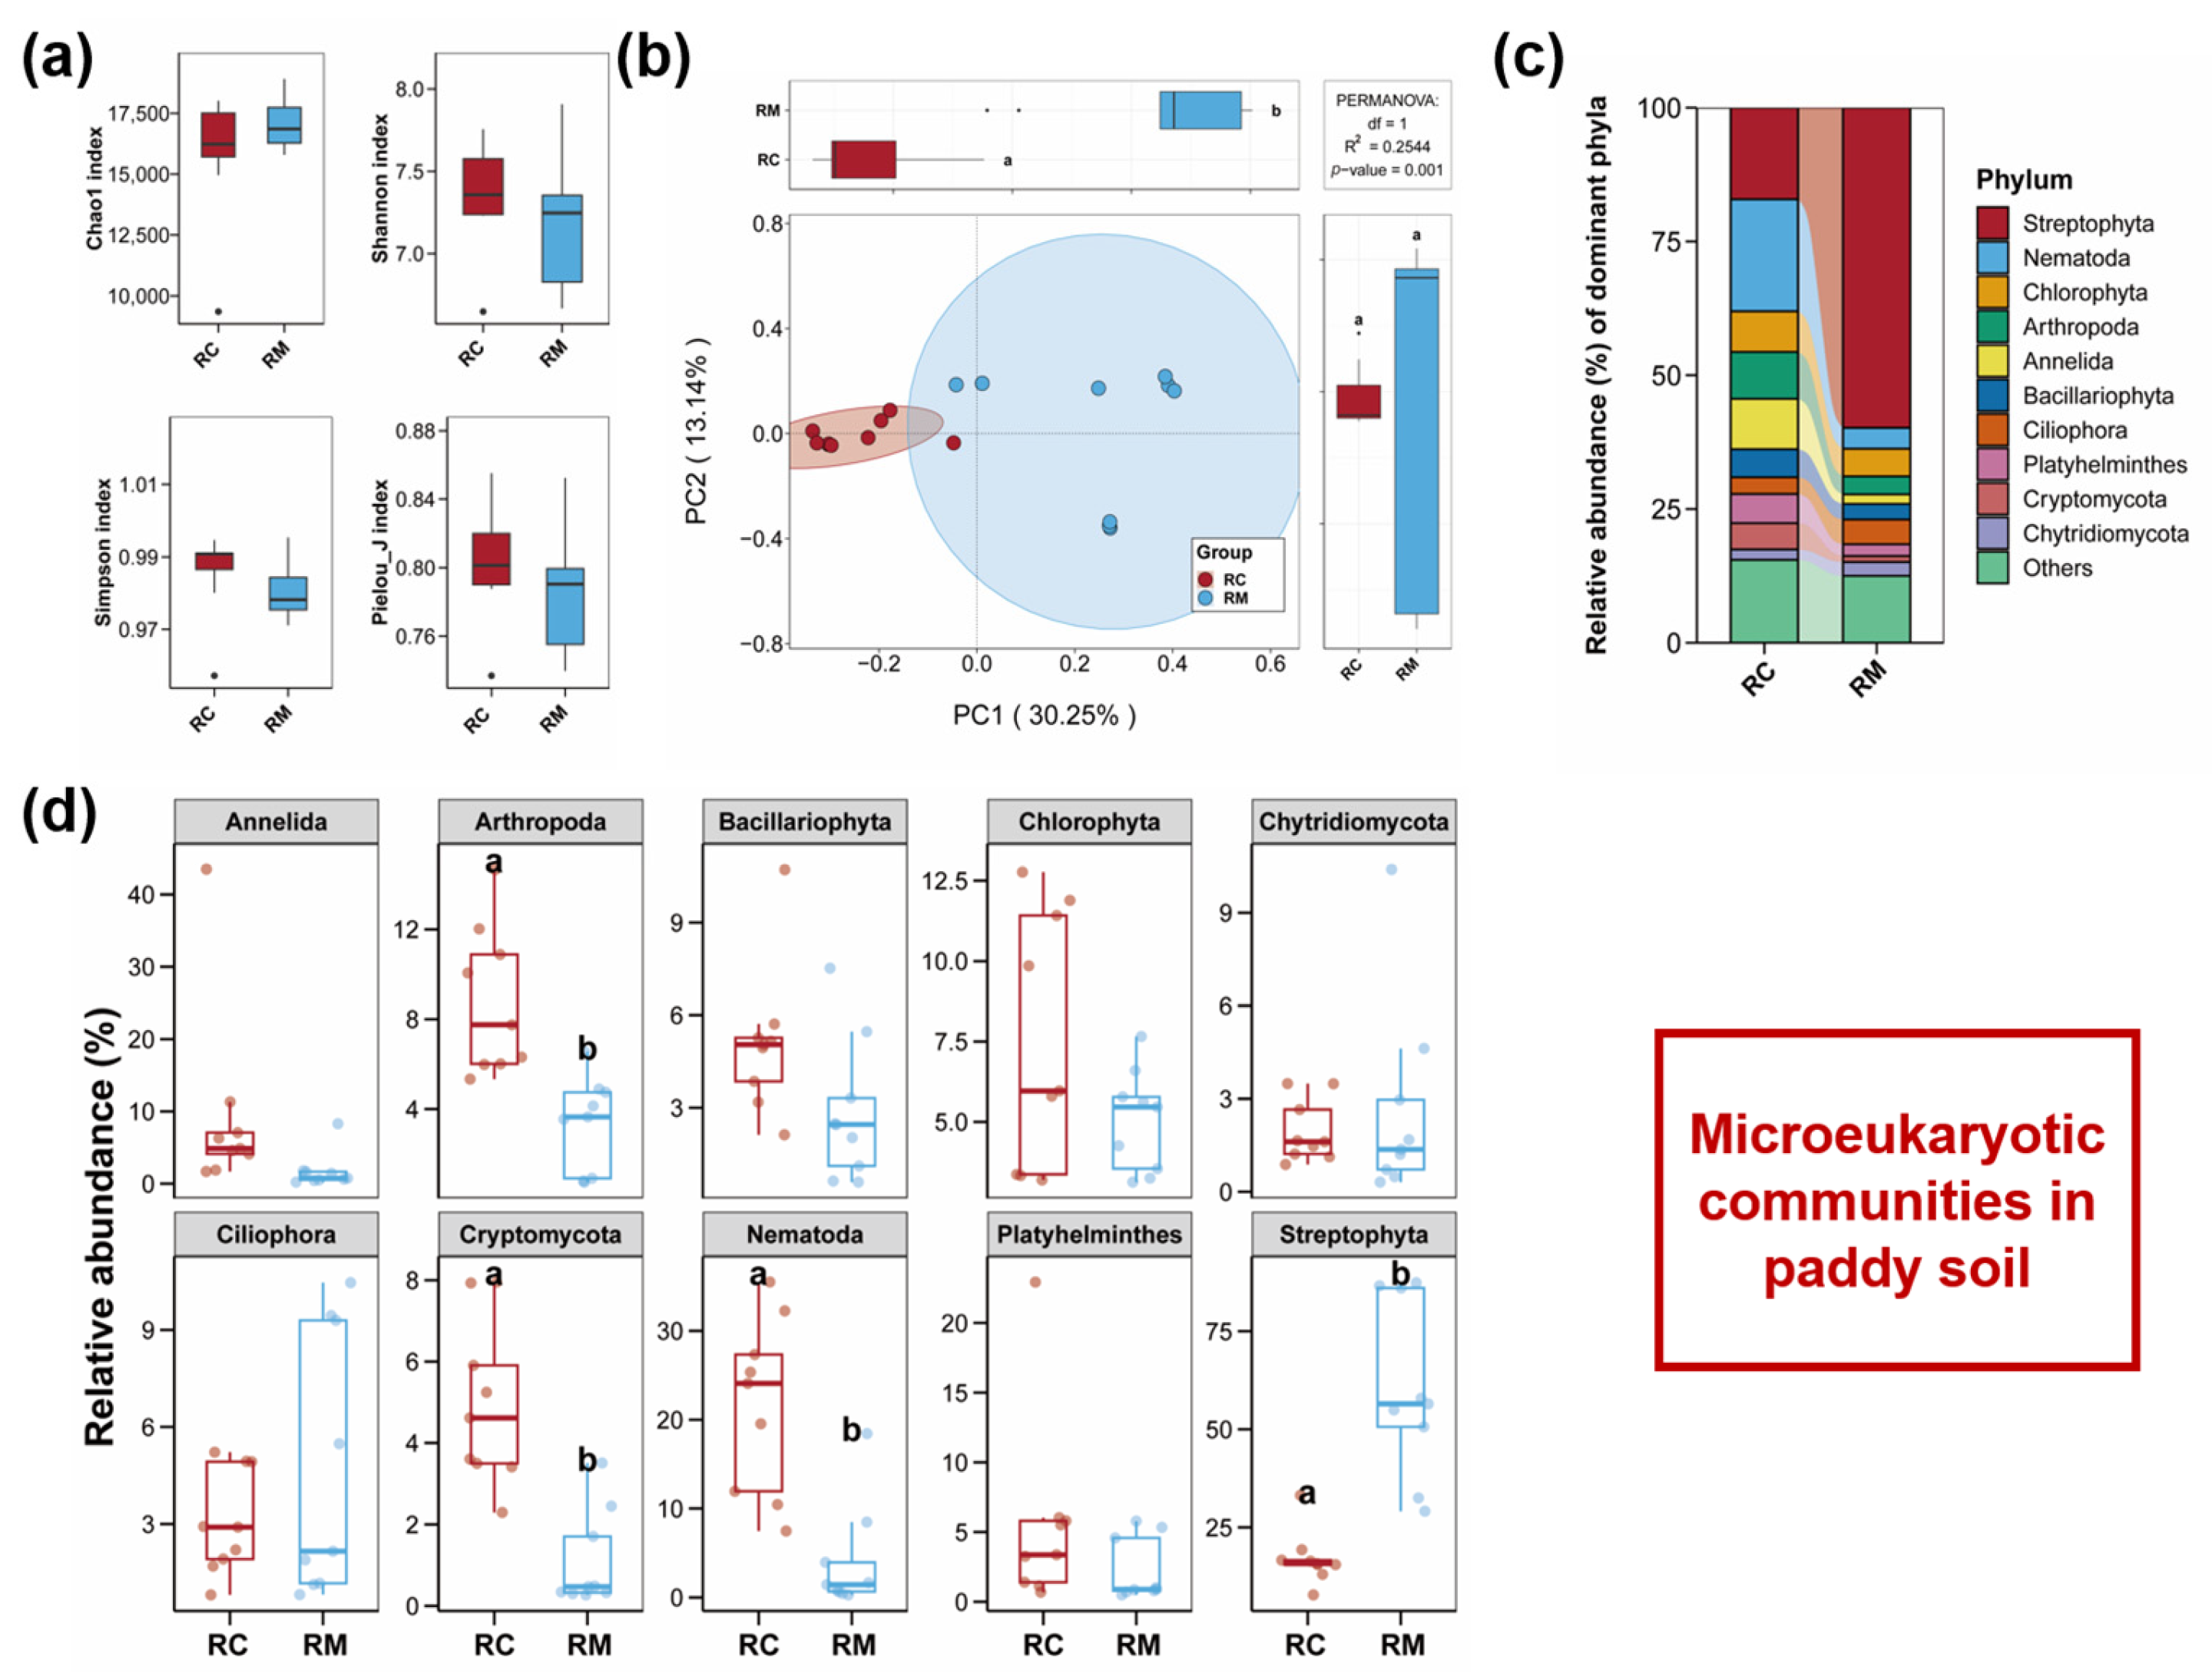
The alpha diversity indices of soil microeukaryotes, including Chao1, Shannon, Simpson, and Pielou_J, did not show statistically significant differences between the RC and RM groups (Figure 5a, Table S4) (p > 0.05). Despite the lack of pronounced differences in alpha diversity indices, a clear separation in the overall community composition was observed between the RC and RM groups, as revealed by PCoA (p = 0.001, p < 0.05) (Figure 5b).
At the phylum level, the composition of the RC group paddy soil microeukaryotic community was dominated by (in descending order of abundance) Streptophyta, Nematoda, Chlorophyta, Arthropoda, Annelida, Bacillariophyta, Ciliophora, Platyhelminthes, Cryptomycota, and Chytridiomycota (Figure 5c). An identical set of dominant phyla was identified in the RM group paddy soil community. However, significant differences in relative abundance were observed for four phyla: Arthropoda (p < 0.001), Cryptomycota (p < 0.001), Nematoda (p < 0.001), and Chlorophyta (p < 0.001). Among these, Arthropoda, Cryptomycota, and Nematoda were markedly more abundant in the RC paddy soils than in the RM soils (p < 0.05). In contrast, Streptophyta was predominantly enriched in the RM group (Figure 5d).

3.4. Soil Quality Index in Paddy Fields

3.4.1. Construction of the Minimum Data Set

Based on the criterion of eigenvalue > 1, nine principal components were retained from the PCA (Table S1). Initially, indicators with loadings greater than 0.5 and within the top 10% of the maximum loading value in each component were selected as candidates for the MDS. The following indicators were chosen: from PC1, TP, AK, Streptophyta abundance, and Nematoda abundance; from PC2, glucosamine and galactosamine; from PC3, bacterial Chao1; from PC4, bacterial Simpson; from PC5, MBN; from PC6, nitrate; from PC8, MWD; and from PC9, available silicon. No eligible indicator was identified in PC7.
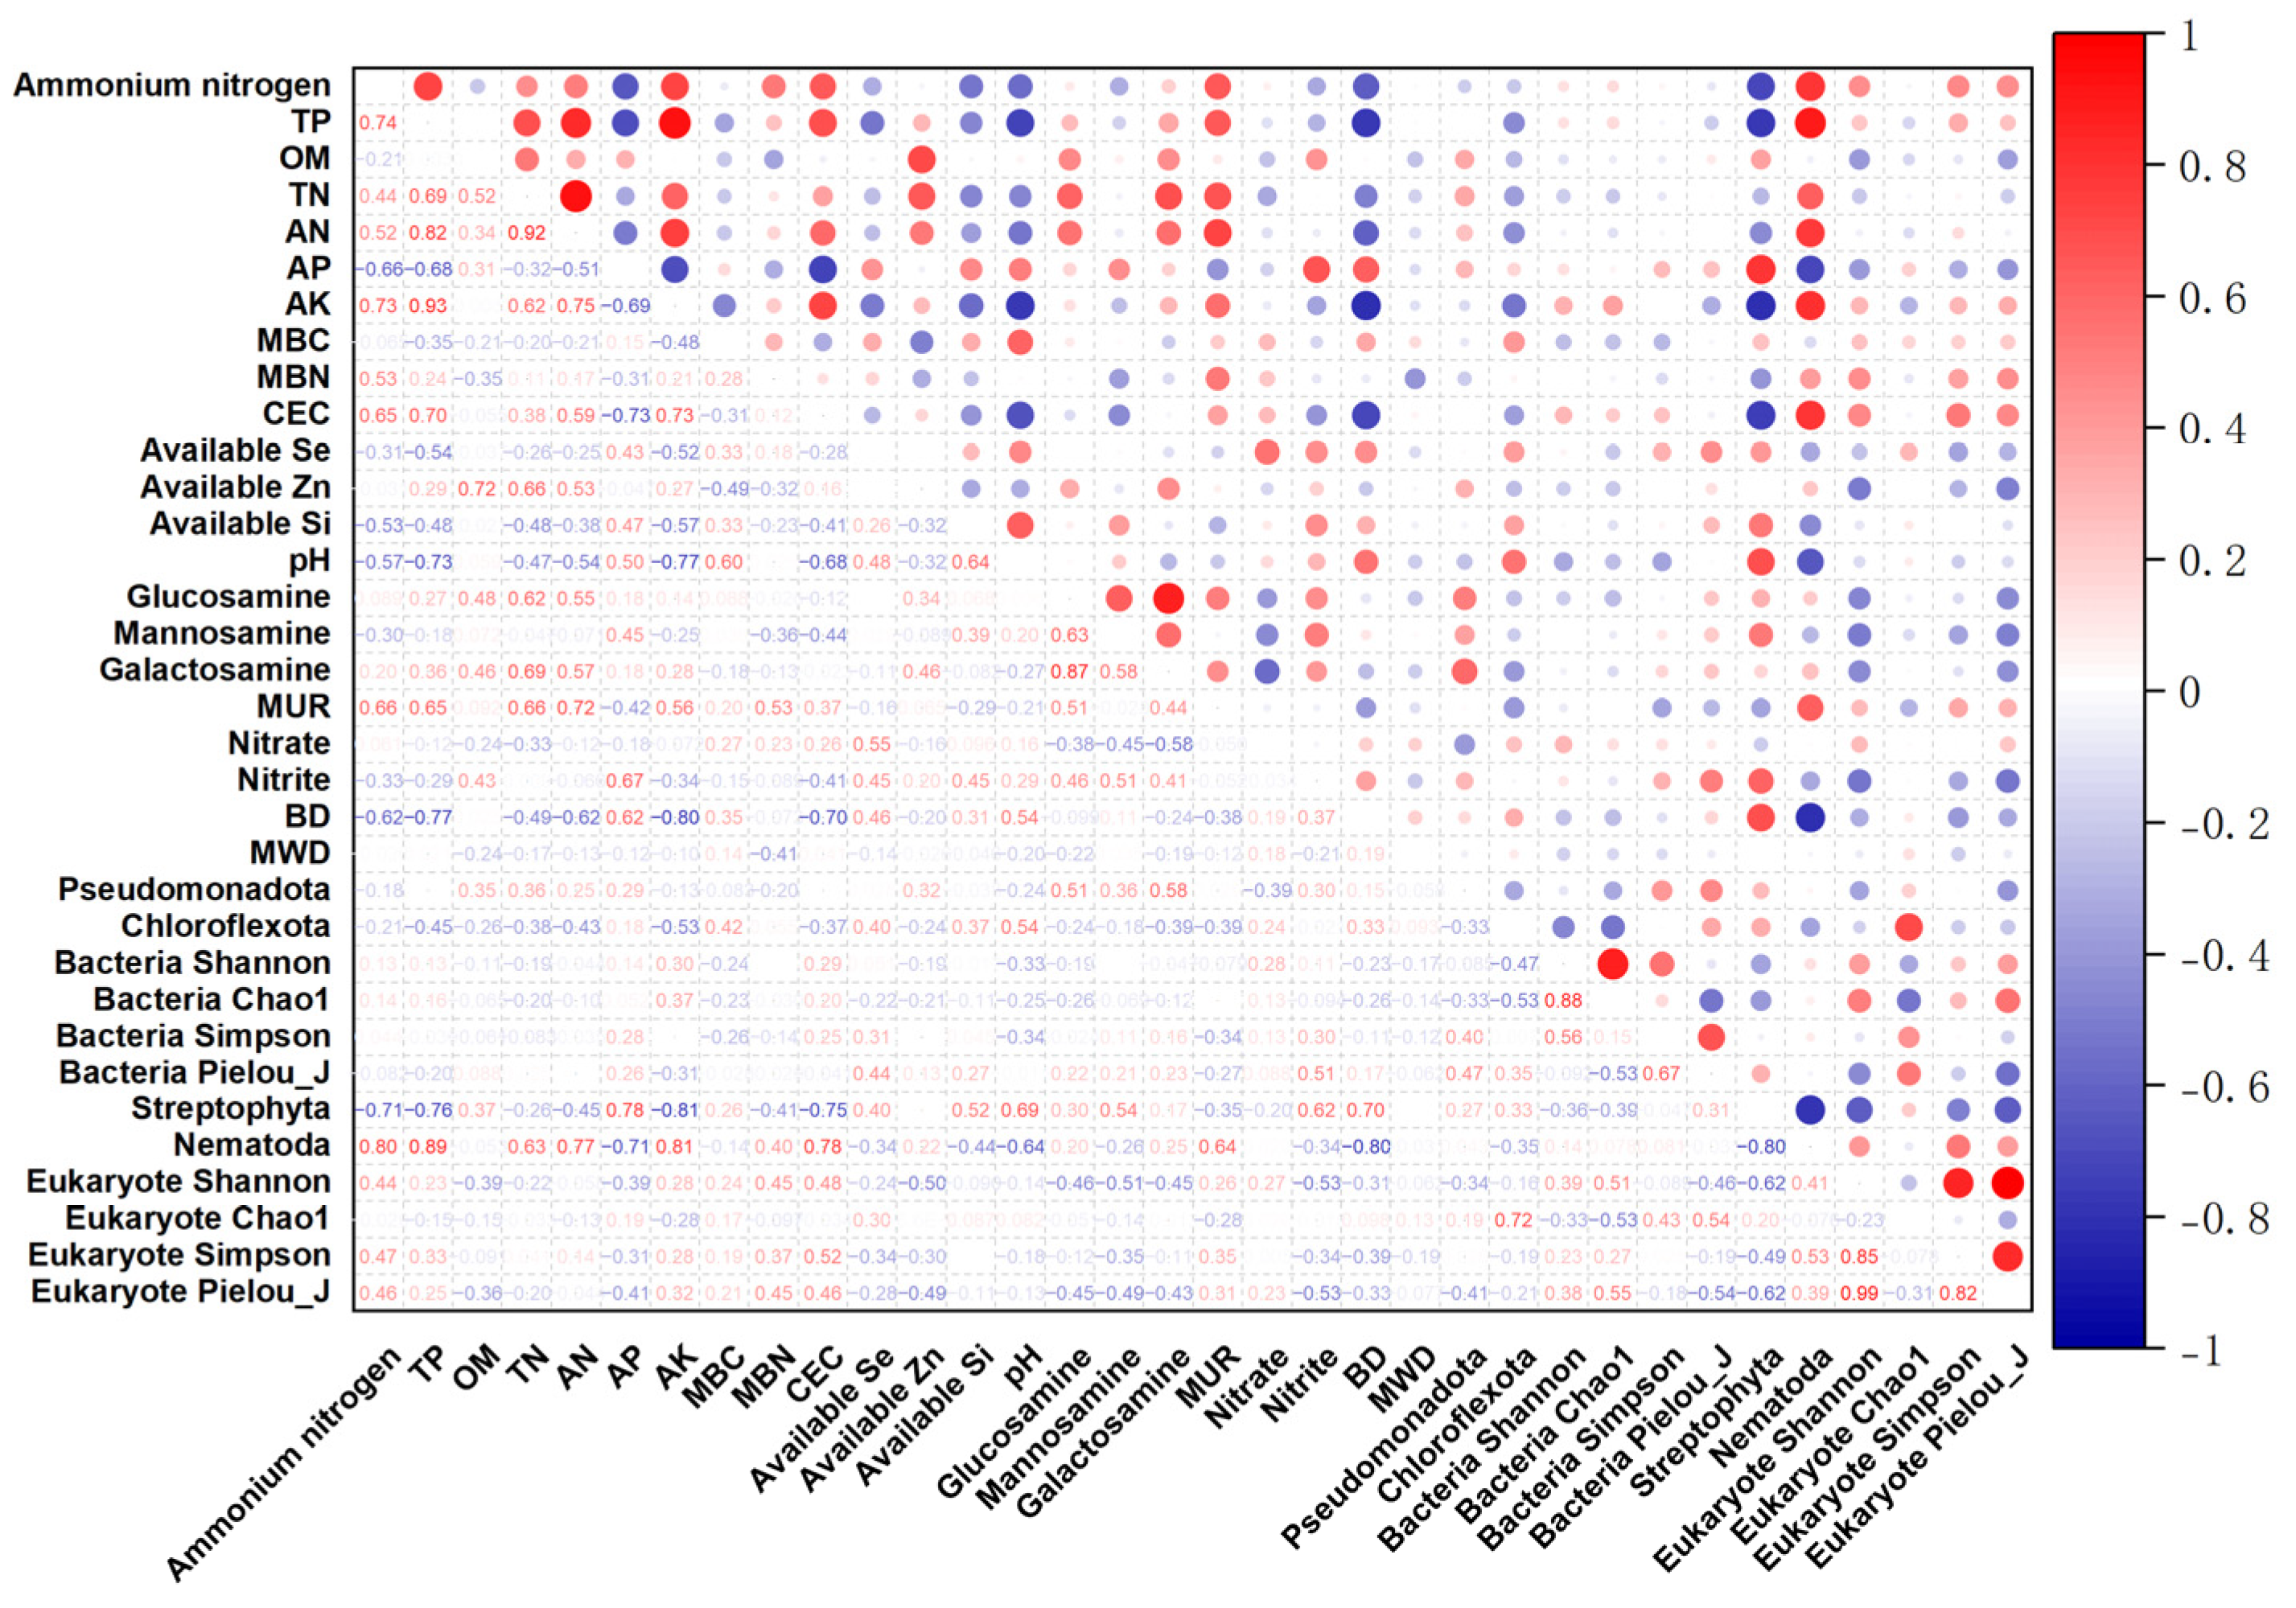
Subsequently, correlation analysis and comparison were performed on the indicators selected for each PC (Figure 6), followed by the calculation of norm values based on Equation (1). In PC1, although TP, AK, Streptophyta abundance, and Nematoda abundance showed significant correlations (>0.5), AK was retained in the MDS due to its highest norm value. In PC2, glucosamine and galactosamine were significantly correlated, and galactosamine was retained based on its greater norm value. Single indicators selected from PC3, PC4, PC5, PC6, PC8, and PC9 were retained, though available silicon and bacterial Simpson were later excluded from the MDS as their coefficients of variation were below 10%, falling short of the sensitivity threshold (Table S2).
Finally, the remaining indicators in the MDS were checked for correlations again, and no significant correlations were observed. The final MDS consisted of AK, galactosamine, bacterial Chao1, MBN, nitrate, and MWD.

3.4.2. Comparison of Soil Quality Indices

Based on the influence of the selected indicators on soil quality, the indicators were categorized into two types: AK, galactosamine, bacterial Chao1, MBN, and MWD were classified as “more-is-better,” while nitrate was classified as “less-is-better.” The transformed values of each indicator were calculated using Equations (2) and (3) (Table S3), respectively, and the soil quality index for each sample was subsequently computed using Equation (4) (Table 1). An independent-samples t-test indicated that the RC group had a considerably higher soil quality index compared to the RM group (p < 0.05) (Table 1). In the RC group, AK exhibited the highest contribution to soil SQI at 21.16%, followed by galactosamine (19.14%), nitrate (17.96%), MBN (16.94%), bacterial Chao1 index (12.57%), and MWD (7.23%). In the RM group, nitrate contributed the most to soil SQI at 23.26%, followed by MBN (23.08%), galactosamine (22.63%), bacterial Chao1 index (11.39%), MWD (11.31%), and AK (8.33%) (Table 2).

4. Discussion

4.1. Impacts of Integrated Rice–Red Claw Crayfish Farming on Physicochemical Parameters of Paddy Soil

Physicochemical properties in paddy soil serve as vital environmental indicators that are closely linked to crop growth. Our results showed that soil TN, AN, TP, and AK were considerably higher in the rice–red claw crayfish co-culture system than in the rice monoculture system. Prior research has demonstrated similar findings, observing that rice-crab and rice–fish systems significantly enhance soil TN and TP [49,50]. The availability of nitrogen, phosphorus, and potassium is a key limiting factor for plant development, directly influencing yield and quality [51,52]. Prolonged feed input under flooded conditions, along with crayfish bioturbation, modifies soil physicochemical processes and enhances soil fertility [53,54,55]. The higher accumulation of TN, AN, TP, and AK in the RC system may be attributed to the direct input of nutrients from feed residues and red claw crayfish excreta, which are rich in N, P, and K and are mineralized into inorganic forms by microorganisms. Furthermore, under the bioturbation activity of the red claw crayfish, the rate of material cycling within the system is accelerated, leading to the activation and release of AN and AK.
Our results confirm the previous observation from rice–fish systems, showing a depressed soil pH in the rice–crayfish co-culture system compared to the rice monoculture [56]. The high input of organic matter stimulates nitrogen cycling and microbial respiration, and this continuous process is likely the primary cause of soil pH reduction [57]. The lower bulk density observed in the rice–red claw crayfish co-culture soil may be attributed to the disruption of soil aggregates and increased porosity resulting from crayfish bioturbation, which contributes to a looser soil structure [53]. Overall, the rice–red claw crayfish integrated system exerts a positive influence on soil properties by improving soil structure and enhancing fertility.

4.2. Influence of Rice–Red Claw Crayfish Co-Culture on the Microbial Community in Paddy Soil

Regarding microbial community diversity, our research indicated no pronounced differences between the RC and RM groups in soil bacteria and microeukaryotes as assessed by the Shannon, Simpson, Pielou_J, and Chao1 indices. In contrast, research has indicated that rice–red swamp crayfish co-cultures significantly reduce soil Chao1 and Simpson indices [58], while Hou et al. (2024) [59] observed a notable decrease in diversity indices in rice–red swamp crayfish integrated systems; both of these observations differ from our findings. However, Si et al. (2018) [60] found that the Shannon index of soil microbes showed no significant difference between rice–crayfish co-culture and rice monoculture in the 0–20 cm soil layer, though differences became significant in deeper layers. Based on the integrated evidence, it is hypothesized that soil microbial alpha diversity is associated with soil depth. This alignment in beta-diversity patterns with Yang et al. (2022) [61] indicates a reproducible structural divergence in the soil microbial community between integrated and monoculture rice systems. This suggests that disturbances introduced by red claw crayfish likely alter the soil microbial community composition. We identified significant differences in the relative abundance of these taxa at the phylum level, specifically Acidobacteriota, Actinomycetota, Bacteroidota, Chloroflexota, Cyanobacteria, and Verrucomicrobiota, as well as the microeukaryotic phyla Arthropoda, Cryptomycota, Nematoda, and Chlorophyta. These taxa may have contributed to the distinct community structures observed between the two groups.
Analysis at the phylum level revealed no pronounced compositional differences in the dominant bacterial communities of paddy soil between the rice–crayfish co-culture system and the rice monoculture system. This finding corroborates earlier findings from research on rice–red claw crayfish co-cultures [56]. However, significant differences were detected in terms of community abundance. The abundances of Acidobacteria and Chloroflexi were considerably lower in the rice–red claw crayfish co-culture system compared to the rice monoculture system. This reduction may be attributed to the deposition of crayfish feces, which increases nutrient enrichment in the surface soil and subsequently inhibits the growth of Acidobacteria and Chloroflexi [62]. The enrichment of Bacteroidota, Cyanobacteria, and Verrucomicrobiota in the co-culture system is functionally linked to improved organic matter turnover and accelerated nutrient cycling. These phyla are known for their roles in decomposing complex organics and fixing nitrogen, which likely contributes to the observed soil fertility dynamics.
Regarding the microeukaryotic community composition at the phylum level, we found that the abundances of Arthropoda, Cryptomycota, and Nematoda were significantly higher in the rice–red claw crayfish co-culture system than in the rice monoculture system. Soil arthropods contribute to the improvement of soil quality and structural properties [63], are crucial for maintaining soil quality and delivering ecosystem services, and serve as important parameters for soil quality assessment [64]. Cryptomycota are involved in regulating food web dynamics within ecosystems [65]. Nematodes, as a major component of soil microfauna, represent a sensitive indicator of soil biological activity and a key metric for soil quality. The higher abundance of these organisms in the soil indicates that the rice–crayfish co-culture system promotes better soil quality. In contrast, Streptophyta, which dominated in the rice monoculture system, showed a markedly lower proportion in the co-culture system. Streptophyta primarily includes certain land plants and algal species. Its reduced proportion in the co-culture system may be explained by the disturbance and grazing activities of red claw crayfish, which likely suppressed the growth of these plants. Increased soil TN and TP in the co-culture system are associated with higher abundances of Arthropoda and Nematoda. This nutrient enhancement might promote the growth and reproduction of arthropods and metazoans. Collectively, our findings suggest that the enriched microeukaryotic community in the co-culture system likely exerts a positive influence on paddy soil quality.
From a trophic perspective, the introduction of the red claw crayfish as a higher trophic unit likely drives the observed shifts. We hypothesize that crayfish bioturbation under co-culture accelerates nutrient cycling and restructures trophic relationships. This is reflected in the microbial community: oligotrophic phyla (Acidobacteria, Chloroflexi) dominated in rice monoculture, whereas copiotrophic Bacteroidetes proliferated in the co-culture group. Consequently, the significant increase in Arthropoda, Cryptomycota, and Nematoda abundance indicates food web restructuring [66]. The surge in Bacteroidetes likely supported protozoan and nematode populations, in turn elevating higher-trophic arthropod abundance [67]. Concurrently, the decline in Streptophyta suggests a shift in primary production from macrophytic and terrestrial plant dominance to a microbiome and planktonic microalgae-driven regime.

4.3. Effects of Rice–Red Claw Crayfish Co-Culture on Soil Quality Index

Our results demonstrate that adopting the rice–red claw crayfish co-culture practice had a positive effect on paddy field quality, leading to a significant increase in the calculated SQI. The long-term cultivation of a single crop leads to a decrease in the soil quality index, while appropriate anthropogenic modifications can improve it [3,4,68]. Moreover, the rational application of organic fertilizers can significantly enhance soil quality [69]. Long-term rice–red swamp crayfish co-culture has also been demonstrated to enhance SQI, with potential variations across different soil depths [8]. This outcome is consistent with our results; however, a notable distinction lies in our selection of foundational indicators. We incorporated a greater number of microbial parameters, thereby emphasizing the contribution of microorganisms to soil quality. Microorganisms play crucial ecological roles in soil, and their diversity and the abundance of dominant taxa are vital for soil functioning, yet these aspects are frequently overlooked in soil quality assessments [1,70,71]. Furthermore, our results indicate that soil AK contributes most significantly to the soil quality index in the co-culture system, whereas nitrate is the dominant contributor in the rice monoculture system. Among the chemical indicators measured, soil AK showed a marked disparity between the two systems, which may explain the observed divergence in soil quality indices. The introduction of red claw crayfish appears to enhance the soil quality index. However, some studies have also suggested that long-term monoculture of the same species can lead to land degradation [72]. Therefore, soil quality in cultivated land cannot be maintained permanently without active management. Rather, timely rotation of cropping practices, rational fertilizer application, and scientifically informed land management may play more critical roles in sustaining soil quality over the long term.
Our study has several limitations that warrant consideration. (1) The initial soil conditions prior to the experiment were not characterized, which may affect the interpretation of the observed changes. (2) We did not perform a comprehensive nitrogen budget analysis for the system, nor did we conduct an a priori sample size estimation for alpha diversity metrics, potentially constraining the statistical robustness of our ecological inferences. (3) Our investigation did not include an in-depth analysis of the food web structure within the paddy ecosystem. (4) Our study was constrained by sampling at only a single time-point and location, which limited our ability to capture temporal and spatial dynamics. We acknowledge that these factors may have constrained the depth and generalizability of our findings. Future studies should address these aspects by incorporating pre-experimental soil profiling, systematic nutrient budgeting, sampling designs based on power analysis, and multi-temporal and multi-location sampling to enhance the mechanistic understanding and scientific rigor of research in this field.

5. Conclusions

This study investigated the impacts of different farming models on paddy soil quality by analyzing soil physicochemical properties and microbial community structures. Compared to rice monoculture, the rice–red claw crayfish co-culture system significantly altered soil physicochemical properties, enhanced fertility, and improved soil structure. This system also altered the beta diversity and composition of both bacterial and eukaryotic microbial communities, leading to a marked increase in the relative abundances of key taxa, including Bacteroidota, Cyanobacteria, Verrucomicrobiota, Arthropoda, Cryptomycota, and Nematoda. By integrating soil properties with microbial community indicators into a composite assessment, we found that the co-culture system elevated the paddy SQI. This study highlights the critical role of microbial communities in constructing a soil quality index. Collectively, our findings support the proposition that rice–red claw crayfish co-culture constitutes a sustainable agricultural practice, providing a valuable reference for establishing a soil quality assessment framework in integrated rice–aquaculture systems.

Supplementary Materials

The following supporting information can be downloaded at https://www.mdpi.com/article/10.3390/agriculture16040403/s1, Table S1: Results of principal component analysis for paddy soil indicators. Table S2: Descriptive statistics of soil property indicators. Table S3: Values of various indicators after transformation by a nonlinear function in MDS. Table S4: Post hoc power analysis for alpha diversity indices.

Author Contributions

Conceptualization, C.Z., B.L. and Y.H.; methodology, Y.H.; software, C.Z., B.L. and Y.H.; validation, Y.H., L.Z. and R.J.; formal analysis, C.Z., Y.H., B.L., L.Z. and R.J.; investigation, R.J.; resources, Y.H. and J.Z.; data curation, C.Z. and Y.H.; writing—original draft preparation, C.Z., B.L. and Y.H.; writing—review and editing, Y.H. and J.Z.; visualization, C.Z. and Y.H.; supervision, J.Z.; project administration, Y.H. and J.Z.; funding acquisition, Y.H. and J.Z. All authors have read and agreed to the published version of the manuscript.

Funding

This research was funded by the Jiangsu Provincial Natural Science Foundation of China (Grant No. BK20231140), the ear-marked fund for CARS (CARS-45), the National Key R&D Program of China (Grant No. 2019YFD0900305), and the Central Public-Interest Scientific Institution Basal Research Fund, CAFS (2023TD64).

Institutional Review Board Statement

Not applicable.

Data Availability Statement

The raw data supporting the conclusions of this study are available from the corresponding author upon reasonable request.

Conflicts of Interest

The authors declare no conflicts of interest.

Abbreviations

The following abbreviations are used in this manuscript:
RCRice–red claw crayfish co-culture
RMRice monoculture
AKAvailable potassium
TNTotal nitrogen
TPTotal phosphorus
ANAvailable nitrogen
APAvailable phosphorus
OMOrganic matter
CECCation exchange capacity
MBCMicrobial biomass carbon
MBNMicrobial biomass nitrogen
MURMuramic acid
MWDMean weight diameter
BDBulk density
MDSMinimum data set
SQISoil quality index
PCoAPrincipal co-ordinates analysis
PCAPrincipal component analysis
PCPrincipal component

References

  1. Bünemann, E.K.; Bongiorno, G.; Bai, Z.G.; Creamer, R.E.; De Deyn, G.; de Goede, R.; Fleskens, L.; Geissen, V.; Kuyper, T.W.; Mäder, P.; et al. Soil quality—A critical review. Soil Biol. Biochem. 2018, 120, 105–125. [Google Scholar] [CrossRef]
  2. Schulte, R.P.O.; Creamer, R.E.; Donnellan, T.; Farrelly, N.; Fealy, R.; O’Donoghue, C.; O’HUallachain, D. Functional land management: A framework for managing soil-based ecosystem services for the sustainable intensification of agriculture. Environ. Sci. Policy 2014, 38, 45–58. [Google Scholar] [CrossRef]
  3. Temjen, W.; Singh, M.R.; Ajungla, T. Effect of shifting cultivation and fallow on soil quality index in Mokokchung district, Nagaland, India. Ecol. Processes 2022, 11, 42. [Google Scholar] [CrossRef]
  4. Jokela, W.; Posner, J.; Hedtcke, J.; Balser, T.; Read, H. Midwest Cropping System Effects on Soil Properties and on a Soil Quality Index. Agron. J. 2011, 103, 1552–1562. [Google Scholar] [CrossRef]
  5. Guo, L.; Zhao, L.F.; Ye, J.L.; Ji, Z.J.; Tang, J.J.; Bai, K.Y.; Zheng, S.J.; Hu, L.L.; Chen, X. Using aquatic animals as partners to increase yield and maintain soil nitrogen in the paddy ecosystems. eLife 2022, 11, 73869. [Google Scholar] [CrossRef]
  6. van Bruggen, A.H.C.; Sharma, K.; Kaku, E.; Karfopoulos, S.; Zelenev, V.V.; Blok, W.J. Soil health indicators and Fusarium wilt suppression in organically and conventionally managed greenhouse soils. Appl. Soil Ecol. 2015, 86, 192–201. [Google Scholar] [CrossRef]
  7. Chen, Y.D.; Wang, H.Y.; Zhou, J.M.; Xing, L.; Zhu, B.S.; Zhao, Y.C.; Chen, X.Q. Minimum Data Set for Assessing Soil Quality in Farmland of Northeast China. Pedosphere 2013, 23, 564–576. [Google Scholar] [CrossRef]
  8. Yuan, P.L.; Wang, J.P.; Li, C.F.; Xiao, Q.Q.; Liu, Q.J.; Sun, Z.C.; Wang, J.H.; Cao, C.G. Soil quality indicators of integrated rice-crayfish farming in the Jianghan Plain, China using a minimum data set. Soil Tillage Res. 2020, 204, 104732. [Google Scholar] [CrossRef]
  9. Li, S.X.; Jiang, J.; Lv, W.G.; Siemann, E.; Woodcock, B.; Wang, Y.Q.; Cavalieri, A.; Bai, N.L.; Zhang, J.Q.; Zheng, X.Q.; et al. Rice-fish co-culture promotes multiple ecosystem services supporting increased yields. Agric. Ecosyst. Environ. 2025, 381, 109417. [Google Scholar] [CrossRef]
  10. Xu, Q.; Peng, X.; Guo, H.L.; Che, Y.; Dou, Z.; Xing, Z.P.; Hou, J.; Styles, D.; Gao, H.; Zhang, H.C. Rice-crayfish coculture delivers more nutrition at a lower environmental cost. Sustain. Prod. Consum. 2022, 29, 14–24. [Google Scholar] [CrossRef]
  11. Fu, H.; Li, N.; Cheng, Q.Y.; Liao, Q.; Nie, J.X.; Yin, H.L.; Shu, C.H.; Li, L.L.; Wang, Z.L.; Sun, Y.J.; et al. Energy, environmental, and economic benefits of integrated paddy field farming. Energy 2024, 297, 131251. [Google Scholar] [CrossRef]
  12. Hu, L.L.; Zhang, J.; Ren, W.Z.; Guo, L.; Cheng, Y.X.; Li, J.Y.; Li, K.X.; Zhu, Z.W.; Zhang, J.E.; Luo, S.M.; et al. Can the co-cultivation of rice and fish help sustain rice production? Sci. Rep. 2016, 6, 28728. [Google Scholar] [CrossRef] [PubMed]
  13. National Fisheries Technology Extension Center; China Society of Fisheries. Development Report on China’s Integrated Rice-Fish Farming Industry. China Fish. 2025, 11–17. [Google Scholar]
  14. Qiu, H.F. Further strengthened the foundation of national food security. People’s Daily Overseas Edition, 14 December 2024; p. 003. [Google Scholar]
  15. Fang, X.T.; Wang, C.; Xiao, S.Q.; Yu, K.; Zhao, J.T.; Liu, S.W.; Zou, J.W. Lower methane and nitrous oxide emissions from rice-aquaculture co-culture systems than from rice paddies in southeast China. Agric. For. Meteorol. 2023, 338, 109540. [Google Scholar] [CrossRef]
  16. Liu, M.; Shen, D.Q.; Zhang, W.H.; Jiang, Y.; Cao, C.G. Health risk assessment and bioaccumulation of heavy metal(loid)s in rice from the rice-crayfish coculture system. Environ. Pollut. 2025, 381, 126451. [Google Scholar] [CrossRef]
  17. Wu, Y.Y.; Li, Y.; Niu, L.H.; Zhang, W.L.; Wang, L.F.; Zhang, H.J. Nutrient status of integrated rice-crayfish system impacts the microbial nitrogen-transformation processes in paddy fields and rice yields. Sci. Total Environ. 2022, 836, 155706. [Google Scholar] [CrossRef]
  18. Guo-han, S.e.a. Mechanism of long-term integrated rice-crayfish farming increasing soil biological fertility of paddy fields. J. Plant Nutr. Fertil. 2020, 26, 2168–2176. [Google Scholar]
  19. Yuan, P.L.; Wang, J.P.; Li, C.F.; Cao, C.G. Long-term rice-crayfish farming aggravates soil gleying and induced changes of soil iron morphology. Soil Use Manag. 2022, 38, 757–770. [Google Scholar] [CrossRef]
  20. Feng, J.; Pan, R.; Hu, H.W.; Huang, Q.Y.; Zheng, J.L.; Tan, W.F.; Liu, Y.R.; Delgado-Baquerizo, M. Effects of integrated rice-crayfish farming on soil biodiversity and functions. Sci. Bull. 2023, 68, 2311–2315. [Google Scholar] [CrossRef]
  21. Goyal, K.; Singh, N.; Jindal, S.; Kaur, R.; Goyal, A.; Awasthi, R. Kjeldahl Method. Adv. Tech. Anal. Chem. 2022, 1, 105–112. [Google Scholar] [CrossRef]
  22. Dahnke, W.C.; Johnson, G.V. Testing Soils for Available Nitrogen. In Soil Testing and Plant Analysis; SSSA Book Series; Soil Science Society of America, Inc.: Madison, WI, USA, 2018; pp. 127–139. [Google Scholar] [CrossRef]
  23. Shen, Z.-Q.; Zhang, Q.; Liu, L.-J.; Qiu, Y. Determination of Available Phosphorus in Soil by Sodium Bicarbonate Extraction Mo-Sb Anti-spectrophotometry Method. Environ. Monit. Forewarning 2011, 3, 12–15. [Google Scholar] [CrossRef]
  24. Wang, R. Determination of soil pH by potentiometry. Shanxi Chem. Ind. 2018, 38, 64–65+76. [Google Scholar] [CrossRef]
  25. HJ 634-2012; Soil-Determination of Ammonium, Nitrite and Nitrate by Extraction with Potassium Chloride Solution—Spectrophotometric Methods. Ministry of Ecology and Environment of the People’s Republic of China: Beijing, China, 2012.
  26. LY/T 1228-2015; Determination of Nitrogen in Forest Soil. People’s Republic of China Forestry Industry Standard: Beijing, China, 2015.
  27. HJ 704-2014; Soil Quality—Determination of Available Phosphorus—Sodium Hydrogen Carbonate Solution-Mo-Sb Anti Spectrophotometric Method. Ministry of Ecology and Environment of the People’s Republic of China: Beijing, China, 2014.
  28. NY/T 1121.15-2006; Soil Testing Part 15: Method for Determination of Soil Available Silicon. Ministry of Agriculture and Rural Affairs of the People’s Republic of China: Beijing, China, 2006.
  29. NY/T 1377-2007; Determination of pH in Soil. Ministry of Agriculture and Rural Affairs of the People’s Republic of China: Beijing, China, 2007.
  30. NY/T 85-1988; Method for Determination of Soil Organic Matter. Ministry of Ecology and Environment of the People’s Republic of China: Beijing, China, 1988.
  31. HJ 632-2011; Soil-Determination of Total Phosphorus by Alkali Fusion–Mo-Sb Anti Spectrophotometric Method. Ministry of Ecology and Environment of the People’s Republic of China: Beijing, China, 2011.
  32. NY/T 889-2004; Determination of Exchangeable Potassium and Non-Exchangeable Potassium Content in Soil. Ministry of Agriculture and Rural Affairs of the People’s Republic of China: Beijing, China, 2005.
  33. NY/T 890-2004; Determination of Available Zinc, Manganese, Iron, and Copper in Soil Extraction with Buffered DTPA Solution. Ministry of Agriculture and Rural Affairs of the People’s Republic of China: Beijing, China, 2005.
  34. HJ 889-2017; Soil Quality—Determination of Cation Exchange Capacity (CEC)—Hexamminecobalt Trichloride Solution-Spectrophotometric Method. Ministry of Ecology and Environment of the People’s Republic of China: Beijing, China, 2018.
  35. NY/T 3420-2019; Determination of Available Selenium in Soil—Hydride Generation Atomic Fluorescence Spectrometry. Ministry of Agriculture and Rural Affairs of the People’s Republic of China: Beijing, China, 2019.
  36. GB/T 39228-2020; Determination of Soil Microbial Biomass- Fumigation-Extraction Method. Ministry of Agriculture and Rural Affairs of the People’s Republic of China: Beijing, China, 2020.
  37. 20232486-T-326; Determination of Amino Sugars in Soil by Gas Chromatography. Ministry of Agriculture and Rural Affairs of the People’s Republic of China: Beijing, China, 2023.
  38. NY/T 1121.3-2006; Soil Testing Part 3: Method for Determination of Soil Mechanical Composition. Ministry of Agriculture and Rural Affairs of the People’s Republic of China: Beijing, China, 2006.
  39. Xu, J.W.; Song, F.; Wang, Z.W.; Qi, Z.J.; Liu, M.; Guan, S.; Sun, J.L.; Li, S.R.; Zhao, J.B. Effects of Different Straw Return Methods on the Soil Structure, Organic Carbon Content and Maize Yield of Black Soil Farmland. Agronomy 2024, 14, 2011. [Google Scholar] [CrossRef]
  40. Caporaso, J.G.; Kuczynski, J.; Stombaugh, J.; Bittinger, K.; Bushman, F.D.; Costello, E.K.; Fierer, N.; Peña, A.G.; Goodrich, J.K.; Gordon, J.I.; et al. QIIME allows analysis of high-throughput community sequencing data. Nat. Methods 2010, 7, 335–336. [Google Scholar] [CrossRef]
  41. Quast, C.; Pruesse, E.; Yilmaz, P.; Gerken, J.; Schweer, T.; Yarza, P.; Peplies, J.; Glöckner, F.O. The SILVA ribosomal RNA gene database project: Improved data processing and web-based tools. Nucleic Acids Res. 2013, 41, D590–D596. [Google Scholar] [CrossRef]
  42. Xiong, W.; Song, Y.Q.; Yang, K.M.; Gu, Y.; Wei, Z.; Kowalchuk, G.A.; Xu, Y.C.; Jousset, A.; Shen, Q.R.; Geisen, S. Rhizosphere protists are key determinants of plant health. Microbiome 2020, 8, 27. [Google Scholar] [CrossRef]
  43. Andrews, S.S.; Karlen, D.L.; Mitchell, J.P. A comparison of soil quality indexing methods for vegetable production systems in Northern California. Agric. Ecosyst. Environ. 2002, 90, 25–45. [Google Scholar] [CrossRef]
  44. Andrews, S.S.; Carroll, C.R. Designing a soil quality assessment tool for sustainable agroecosystem management. Ecol. Appl. 2001, 11, 1573–1585. [Google Scholar] [CrossRef]
  45. Zhang, J.H.; Ding, Q.D.; Wang, Y.J.; He, M.Y.; Jia, K.L. Soil quality assessment and constraint diagnosis of salinized farmland in the Yellow River irrigation area in northwestern China. Geoderma Reg. 2023, 34, e00684. [Google Scholar] [CrossRef]
  46. Yemefack, M.; Jetten, V.G.; Rossiter, D.G. Developing a minimum data set for characterizing soil dynamics in shifting cultivation systems. Soil Tillage Res. 2006, 86, 84–98. [Google Scholar] [CrossRef]
  47. Huang, W.P.; Zong, M.M.; Fan, Z.X.; Feng, Y.; Li, S.Y.; Duan, C.Q.; Li, H.X. Determining the impacts of deforestation and corn cultivation on soil quality in tropical acidic red soils using a soil quality index. Ecol. Indic. 2021, 125, 52–61. [Google Scholar] [CrossRef]
  48. Raiesi, F. A minimum data set and soil quality index to quantify the effect of land use conversion on soil quality and degradation in native rangelands of upland arid and semiarid regions. Ecol. Indic. 2017, 75, 307–320. [Google Scholar] [CrossRef]
  49. Bashir, M.A.; Wang, H.Y.; Pan, J.T.; Khoshnevisan, B.; Sun, W.T.; Zhai, L.M.; Zhang, X.S.; Wang, N.; Rehim, A.; Liu, H.B. Variations in soil nutrient dynamics and their composition in rice under integrated rice-crab co-culture system. J. Clean. Prod. 2021, 281, 125222. [Google Scholar] [CrossRef]
  50. Ren, L.P.; Liu, P.P.; Xu, F.; Gong, Y.C.; Zhai, X.M.; Zhou, M.; Wang, J.J.; Wang, Z.M. Rice-fish coculture system enhances paddy soil fertility, bacterial network stability and keystone taxa diversity. Agric. Ecosyst. Environ. 2023, 348, 108399. [Google Scholar] [CrossRef]
  51. Borer, E.T.; Lind, E.M.; Ogdahl, E.J.; Seabloom, E.W.; Tilman, D.; Montgomery, R.A.; Kinkel, L.L. Food-web composition and plant diversity control foliar nutrient content and stoichiometry. J. Ecol. 2015, 103, 1432–1441. [Google Scholar] [CrossRef]
  52. Zhang, L.W.; Zhao, L.J.; Yi, H.P.; Lan, S.Q.; Chen, L.; Han, G.X. Nitrogen addition alters plant growth in China’s Yellow River Delta coastal wetland through direct and indirect effects. Front. Plant Sci. 2022, 13, 1016949. [Google Scholar] [CrossRef]
  53. Duan, D.Y.; He, D.X.; Zhao, L.J.; Tan, C.X.; Yang, D.H.; Yan, W.D.; Wang, G.J.; Chen, X.Y. Influence of Rice-Crayfish Co-Culture Systems on Soil Properties and Microbial Communities in Paddy Fields. Plants 2025, 14, 2320. [Google Scholar] [CrossRef]
  54. Du, F.L.; Yin, Y.H.; Zhai, L.M.; Zhang, F.L.; Wang, S.P.; Liu, Y.L.; Fan, X.P.; Liu, H.B. Increased anaerobic conditions promote the denitrifying nitrogen removal potential and limit anammox substrate acquisition within paddy irrigation and drainage units. Sci. Total Environ. 2024, 951, 175616. [Google Scholar] [CrossRef]
  55. Li, P.; Wu, G.G.; Li, Y.J.; Hu, C.; Ge, L.; Zheng, X.Q.; Zhang, J.Q.; Chen, J.; Zhang, H.L.; Bai, N.L.; et al. Long-term rice-crayfish-turtle co-culture maintains high crop yields by improving soil health and increasing soil microbial community stability. Geoderma 2022, 413, 115745. [Google Scholar] [CrossRef]
  56. Zhao, Z.; Chu, C.; Zhou, D.; Wang, Q.; Wu, S.; Zheng, X.; Song, K.; Lv, W. Soil Bacterial Community Composition in Rice–fish Integrated Farming Systems with Different Planting Years. Sci. Rep. 2021, 11, 10855. [Google Scholar] [CrossRef]
  57. Wang, N.-X.; Lu, X.-Y.; Tsang, Y.-F.; Mao, Y.; Tsang, C.-W.; Yueng, V.A. A Comprehensive Review of Anaerobic Digestion of Organic Solid Wastes in Relation to Microbial Community and Enhancement Process. J. Sci. Food Agric. 2019, 99, 507–516. [Google Scholar] [CrossRef] [PubMed]
  58. Zhu, X.; Peng, C.; Si, G.; Sha, A.; Yuan, J.; Zhao, S.; Xu, D. Effects of the Rice–Shrimp Co-Culture Model on Soil Bacterial Community Structure and Diversity in Rice Fields. Soil Bull. 2021, 52, 1121–1128. [Google Scholar] [CrossRef]
  59. Hou, Y.; Yu, Z.; Jia, R.; Li, B.; Zhu, J. Integrated rice-yellow catfish farming resulting in variations in the agricultural environment, rice growth performance, and soil bacterial communities. Environ. Sci. Pollut. Res. Int. 2024, 31, 28967–28981. [Google Scholar] [CrossRef] [PubMed]
  60. Si, G.; Yuan, J.; Xu, X.; Zhao, S.; Peng, C.; Wu, J.; Zhou, Z. Effects of an integrated rice-crayfish farming system on soil organic carbon, enzyme activity, and microbial diversity in waterlogged paddy soil. Acta Ecol. Sin. 2018, 38, 29–35. [Google Scholar] [CrossRef]
  61. Yang, Z.J.; Feng, Y.M.; Zhang, S.L.; Hu, Y.Q.; Tang, Y.Y.; Gu, H.L.; Gu, Z.Y.; Xv, Y.; Cai, Y.C.; Zhang, H. Effects of rice-prawn (Macrobrachium nipponense) co-culture on the microbial community of soil. Appl. Microbiol. Biotechnol. 2022, 106, 7361–7372. [Google Scholar] [CrossRef]
  62. Zhong, J.; Tang, H.; Li, Z.; Dong, W.; Wei, C.; Li, Q.; He, T. Effects of Green Manure Combined with Chemical Fertilizer on the Bacterial Community Structure in Paddy Soils of Karst Regions. J. Plant Nutr. Fertil. 2021, 27, 1746–1756. [Google Scholar]
  63. Gonçalves, F.; Nunes, C.; Carlos, C.; López, A.; Oliveira, I.; Crespí, A.; Teixeira, B.; Pinto, R.; Costa, C.A.; Torres, L. Do soil management practices affect the activity density, diversity, and stability of soil arthropods in vineyards? Agric. Ecosyst. Environ. 2020, 294, 106863. [Google Scholar] [CrossRef]
  64. Menta, C.; Remelli, S. Soil Health and Arthropods: From Complex System to Worthwhile Investigation. Insects 2020, 11, 54. [Google Scholar] [CrossRef]
  65. Gleason, F.H.; Carney, L.T.; Lilje, O.; Glockling, S.L. Ecological potentials of species of Rozella (Cryptomycota). Fungal Ecol. 2012, 5, 651–656. [Google Scholar] [CrossRef]
  66. Suter, E.A.; Pachiadaki, M.; Taylor, G.T.; Edgcomb, V.P. Eukaryotic Parasites Are Integral to a Productive Microbial Food Web in Oxygen-Depleted Waters. Front. Microbiol. 2022, 12, 764605. [Google Scholar] [CrossRef]
  67. Pan, X.; Raaijmakers, J.M.; Carrion, V.J. Importance of Bacteroidetes in Host-Microbe Interactions and Ecosystem Functioning. Microbiology 2023, 31, 959–971. [Google Scholar] [CrossRef]
  68. De, P.; Deb, S.; Deb, D.; Chakraborty, S.; Santra, P.; Dutta, P.; Hoque, A.; Choudhury, A. Soil quality under different land uses in eastern India: Evaluation by using soil indicators and quality index. PLoS ONE 2022, 17, e0275062. [Google Scholar] [CrossRef]
  69. Li, P.; Wu, M.C.; Kang, G.D.; Zhu, B.J.; Li, H.X.; Hu, F.; Jiao, J.G. Soil quality response to organic amendments on dryland red soil in subtropical China. Geoderma 2020, 373, 114416. [Google Scholar] [CrossRef]
  70. Saccá, M.L.; Caracciolo, A.B.; Di Lenola, M.; Grenni, P. Ecosystem Services Provided by Soil Microorganisms. In Proceedings of the 3rd Annual Meeting of the COST-Action-FP1305-Biolink on Linking Belowground Biodiversity and Ecosystem Function in European Forests, Rome, Italy, 17–19 November 2015; Springer: Cham, Switzerland, 2017; pp. 9–24. [Google Scholar]
  71. Schloter, M.; Nannipieri, P.; Sorensen, S.J.; van Elsas, J.D. Microbial indicators for soil quality. Biol. Fertil. Soils 2018, 54, 1–10. [Google Scholar] [CrossRef]
  72. Karaca, S.; Dengiz, O.; Turan, I.D.; Özkan, B.; Dedeoglu, M.; Gülser, F.; Sargin, B.; Demirkaya, S.; Ay, A. An assessment of pasture soils quality based on multi-indicator weighting approaches in semi-arid ecosystem. Ecol. Indic. 2021, 121, 107001. [Google Scholar] [CrossRef]
Figure 1. Map of the study site located in Yangshan Town, Jiangsu Province, China.
Agriculture 16 00403 g001
Figure 2. Schematic diagram of the experimental field layout. RC, rice–red claw crayfish co-culture. RM, rice monoculture.
Agriculture 16 00403 g002
Figure 3. Differences in soil properties, including: nitrite (mg∙kg−1), nitrate (mg∙kg−1), ammonium nitrogen (mg∙kg−1), total phosphorus (TP, mg∙kg−1), total nitrogen (TN, g∙kg−1), pH, organic matter (OM, g∙kg−1), cation exchange capacity (CEC, mg∙kg−1), available phosphorus (AP, mg∙kg−1), available potassium (AK, mg∙kg−1), available nitrogen (AN, mg∙kg−1), available selenium (mg∙kg−1), available silicon (g∙kg−1), available zinc (mg∙kg−1), mean weight diameter (MWD, mm), bulk density (BD, g∙cm3), microbial biomass carbon (MBC, mg∙kg−1), microbial biomass nitrogen (MBN, mg∙kg−1), muramic acid (MUR, mg∙kg−1), glucosamine (mg∙kg−1), galactosamine (mg∙kg−1), and mannosamine (mg∙kg−1) within paddy soil between the RC and RM groups. Significant differences between the RC and RM groups are indicated by different lowercase letters (e.g., a, b) (p < 0.05).
Agriculture 16 00403 g003
Figure 4. Diversity and composition of bacterial communities in paddy soil. (a) Differences in the alpha diversity indices of bacterial communities between the RC and RM groups. (b) Beta diversity of bacterial communities between the RC and RM groups, visualized by PCoA based on Bray–Curtis distances. (c) Species composition at the phylum level, showing the top 10 most abundant bacterial phyla in the RC and RM groups’ paddy soils. (d) Relative abundance differences in the top 10 bacterial phyla between the RC and RM groups. Different lowercase letters above bars indicate significant differences among indices (p < 0.05).
Agriculture 16 00403 g004
Figure 5. Diversity and composition of eukaryotic microbial communities in paddy soil. (a) Differences in the alpha diversity indices of microeukaryotic organisms between the RC and RM groups. (b) Beta diversity based on PCoA of Bray–Curtis distances, showing the compositional variation in microeukaryotic communities between the RC and RM groups. (c) Taxonomic composition at the phylum level, displaying the top 10 most abundant microeukaryotic phyla in the RC and RM groups’ paddy soils. (d) Differences in the relative abundance of the top 10 microeukaryotic phyla between the RC and RM groups. Letters marked above the bars denote statistically significant differences between groups as determined by post hoc testing (p < 0.05).
Agriculture 16 00403 g005
Figure 6. Correlation matrix of various soil indicators. Color coding denotes the direction of correlation: a gradient from blue (negative) to red (positive). The larger the circle, the higher the correlation. (TP, total phosphorus. OM, organic matter. TN, total nitrogen. AN, available nitrogen. AP, available phosphorus. AK, available potassium. MBC, microbial biomass carbon. MBN, microbial biomass nitrogen. CEC, cation exchange capacity. MUR, muramic acid. BD, bulk density. MWD, mean weight diameter.)
Agriculture 16 00403 g006
Table 1. The soil quality indices and t-test results of individual samples in RC and RM.
GroupSampleSQI 1
RM10.3264
20.2711
30.3477
40.3394
50.4594
60.2512
70.3506
80.3923
90.4485
RC10.5958
20.5597
30.5987
40.4100
50.5316
60.4759
70.5643
80.5479
90.5051
p-value <0.001
RM, rice monoculture. RC, rice–red claw crayfish co-culture. 1 The soil quality index for each sample.
Table 2. The commonality, weights, and contribution to SQI of indicators in MDS.
IndicatorsCommunalityWeightContribution of RC to SQIContribution of RM to SQI
AK0.980.1725 26.16%8.33%
MBN0.970.1708 16.94%23.08%
Nitrate0.960.1690 17.96%23.26%
MWD0.910.1602 7.23%11.31%
Galactosamine0.930.1637 19.14%22.63%
Bacteria Chao10.930.1637 12.57%11.39%
AK, available potassium. MBN, microbial biomass nitrogen. SQI, soil quality index. RC, rice–red claw crayfish co-culture. RM, rice monoculture.
Disclaimer/Publisher’s Note: The statements, opinions and data contained in all publications are solely those of the individual author(s) and contributor(s) and not of MDPI and/or the editor(s). MDPI and/or the editor(s) disclaim responsibility for any injury to people or property resulting from any ideas, methods, instructions or products referred to in the content.